Article

Corn Cropping Systems in Agricultural Soils from the Bajio Region of Guanajuato: Soil Quality Indexes (SQIs)

by
Alejandra Sánchez-Guzmán
1,†,
Héctor Iván Bedolla-Rivera
2,†,
Eloy Conde-Barajas
2,3,
María de la Luz Xochilt Negrete-Rodríguez
2,3,
Marcos Alfonso Lastiri-Hernández
4,
Francisco Paúl Gámez-Vázquez
5 and
Dioselina Álvarez-Bernal
1,*
1
Instituto Politécnico Nacional, CIIDIR Unidad Michoacán, Justo Sierra No. 28, Centro, Jiquilpan 59510, Michoacán, Mexico
2
Posgrado de Ingeniería Bioquímica, Tecnológico Nacional de México/IT de Celaya, Ave. Tecnológico y A. García Cubas No. 600, Celaya 38010, Guanajuato, Mexico
3
Departamento de Ingeniería Bioquímica y Ambiental y Posgrado de Ingeniería Bioquímica, Tecnológico Nacional de México/IT en Celaya, Ave. Tecnológico y A. García Cubas No. 600, Celaya 38010, Guanajuato, Mexico
4
Tecnológico Nacional de México/ITS Los Reyes, Los Reyes 60330, Michoacán, Mexico
5
Campo Experimental Bajio, INIFAP, Carretera Celaya San Miguel de Allende km 6.5, Celaya 38010, Guanajuato, Mexico
*
Author to whom correspondence should be addressed.
These authors contributed equally to this work.
Appl. Sci. 2024, 14(7), 2858; https://doi.org/10.3390/app14072858
Submission received: 17 January 2024 / Revised: 20 March 2024 / Accepted: 24 March 2024 / Published: 28 March 2024
(This article belongs to the Section Environmental Sciences)

Abstract

:
Agriculture is a sector of great importance for Mexico’s economy, generating employment and contributing significantly to the country’s gross domestic product. The Bajio stands out as one of the most productive agricultural regions in Mexico. However, intensive agricultural practices in this area have caused a progressive deterioration and loss of soil fertility. This study focused on evaluating the quality of soils used for agriculture in the Bajio region of the State of Guanajuato, Mexico. This evaluation, utilised soil quality indexes (SQIs) based on a total of 27 physicochemical, biological and enzymatic indicators. These indicators were selected by means of a principal component analysis (PCA), which allowed for the identification of a minimum set of data. The SQIs developed in this study categorised soils into different quality levels, ranging from low to high, mainly based on the values observed in the biological indicators (SMR and qCO2), which comprised the established SQIs. The inclusion of these biological indicators provides the developed SQIs with greater sensitivity to detect minor disturbances in agricultural soils due to human activity, compared with SQIs consisting only of physicochemical indicators. The developed SQIs can be used to ensure high-quality food production in soils used for corn cultivation under similar conditions, both nationally and internationally.

1. Introduction

Soil represents one of the fundamental and non-renewable ecosystems on our planet [1]. Its importance lies in its capacity to preserve water and air quality, in addition to influencing human health [2]. Mexico, a country recognized for being the cradle of diverse plants cultivated around the world, stands out for its agricultural versatility thanks to the richness of its soils. However, the agricultural industry—essential to the national economy—faces considerable challenges in providing quality food to the population and maintaining a balance between productive activity and care for nature through sustainable practices [3]. Rapid population expansion and increasing demand for food have led to unsustainable or inadequate practices, such as excessive use of chemical fertilizers and herbicides, constant and deep plowing, and monoculture practices. Every year, approximately 12 million hectares of soil are lost due to degradation caused by the aforementioned conventional practices [1].
To address this problem, Mexico has introduced the national program ENASAS (Estrategia Nacional de Suelo para la Agricultura Sostenible—National Soil Strategy for Sustainable Agriculture). The main objective of this program is the conservation and care of agricultural soils, preventing and reversing processes that damage the soil and promoting sustainable agricultural practices [4].
Corn is a crop native to Mexico and one of the most significant crops worldwide. In 2016, more than one billion tons of corn were produced on approximately 200 million hectares of cropland. Mexico is one of the top seven producers and is among the top ten consumers of this crucial grain [5]. The Bajio region of the State of Guanajuato, Mexico, covers an area of 1.2 million hectares devoted to agriculture [6], where a variety of grains are grown—including corn and sorghum. Despite its importance, this region has also suffered from soil deterioration and loss of soil fertility due to conventional and unsustainable agricultural practices [7].
In this context, the concept of “soil fertility” has evolved to encompass a wide range of aspects, including chemical, physical and biological attributes, as well as their decline in soils [8]. This loss of fertility or deterioration of the soil has prompted studies to characterize and evaluate soil quality, using tools known as Soil Quality Indexes (SQIs). These SQIs are based on biological and physicochemical indicators related to the problem to be analyzed, especially in agricultural soils that have experienced a decrease in fertility [9].
Currently, similar studies have been carried out nationally and internationally, focusing on agricultural soils with different crops. These studies have used various indicators (soil organic carbon (SOC), organic matter (OM), pH, electrical conductivity (EC), cation exchange capacity (CEC), nitrogen (N), phosphorous (P), potassium (K)) and have highlighted the importance of assessing soil quality as the first step towards accurate, sustainable agriculture and effective agricultural management [9,10,11].
Nowadays, SQIs are an essential application tool in the agricultural field, both in terms of crop yield and economics. The reason for this is that, in order to grow and market high-quality products, it is essential to determine the quality level of agricultural soil. This plays an integral role in ensuring food security and economic stability.
Considering the aforementioned, the main objective of this study was to establish an SQI for agricultural soils under corn cultivation in the Bajio region of the State of Guanajuato, analyzing both physicochemical and biological indicators. It was proposed that the established SQI would allow for the differentiation of soil quality according to the indicators selected in the minimum data set by means of a principal component analysis (PCA).

2. Materials and Methods
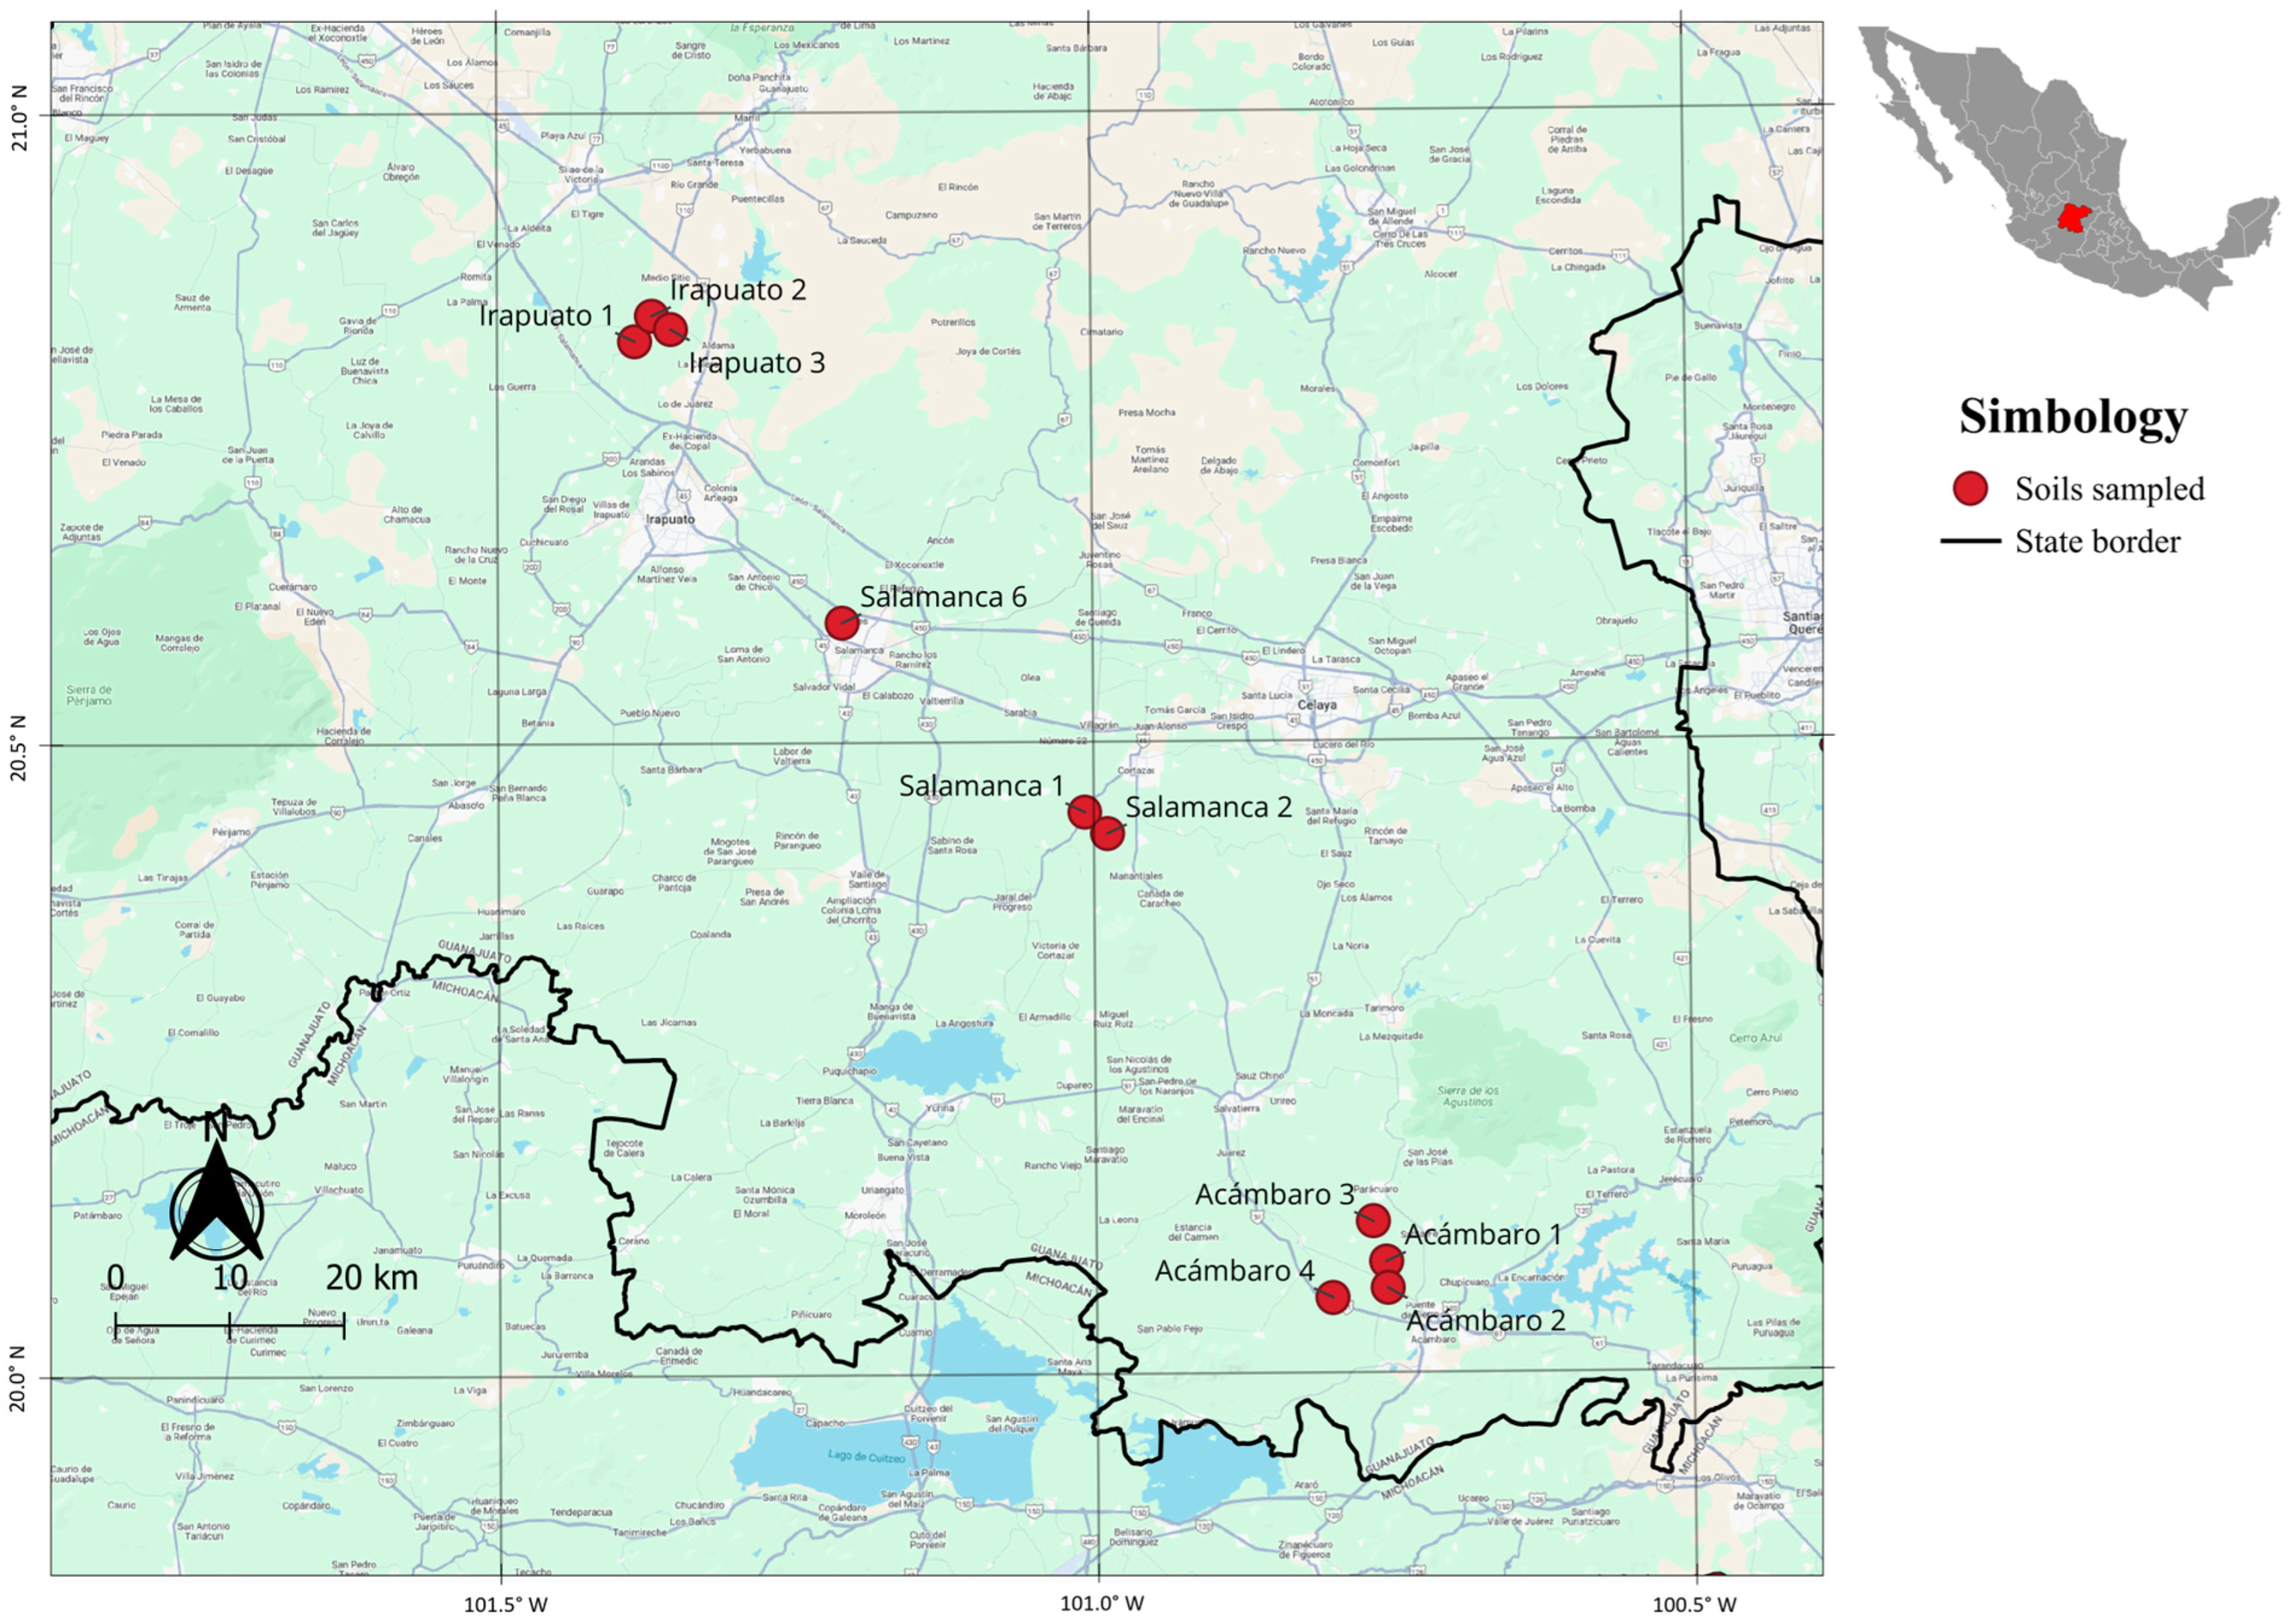
2.1. Study Area

This study was conducted in the Bajio region of the State of Guanajuato, Mexico, which covers an area of 1330.4 km2 (Figure 1). It is located at an altitude that varies between 1700 and 1800 m.a.s.l. The annual precipitation in this region is approximately 700 mm and the average annual temperature ranges between 8 and 22 °C [12]. Its climate is characterized as arid or semi-arid. Soils in this area are predominantly Vertisols [13]. They contain more than 30% clay and have a thick surface layer and deep cracks. In addition, they are rich in magnesium (Mg), K and carbonates (CO3) in the deeper layers of the subsoil [14].

2.2. Sampling

Soils were selected using the Land Use and Vegetation Chart Series V Guanajuato, as well as data from the Federal Proagro Program 2017 spring–summer cycle and the National Geostatistical Framework 2018. The selection criteria included the irrigation regime in different irrigation zones, uniformity in soil type, and the area of the agricultural soils (between 5 and 6 hectares). Initially, 969 agricultural soils distributed in the Bajio region of Guanajuato were identified. Subsequently, cluster sampling was carried out to select 10 sites of the most representative agricultural soils under corn cultivation, whose locations are detailed in Table 1. Once the soils to be analyzed in each municipality were determined, sampling was carried out. This consisted of dividing the soils into three subplots of 600 m2 each and taking samples systematically and randomly, starting from one end of the subplot and following a zigzag pattern [15].
An auger was used to extract the soil samples every 18 m. Pits 30 cm deep and 40 cm in diameter were excavated, from which 2.0 kg of soil was obtained per sample. Each of these samples was georeferenced using a Garmin® eTrex Legend® GPS receiver, resulting in a total of 450 samples for all sampled soils. The soils sampled are shown in Table 1.

2.3. Preparation and Maintenance of Samples

For the physicochemical characterization, soil samples were transported to the laboratory at room temperature. Then, they were air-dried and sieved using a mesh with an opening of 2 mm. After that, the samples were stored in plastic bags at 4 °C until the physicochemical analysis was performed [1,6,14].
For the biological characterization, soil samples were brought to the laboratory in plastic bags at a temperature of 4 °C. Then, a pre-incubation process was carried out. During pre-incubation, water was added to the soil samples to reach a water-holding capacity (WHC) of 40%. The soil samples were placed in containers with screw caps for 15 days, together with a bottle with sodium hydroxide (NaOH 1.0 M) to capture carbon dioxide (C-CO2) and another bottle with distilled water to prevent moisture loss [1,6,14].

2.4. Physicochemical Characterization

The physicochemical indicators related to soil fertility were determined in triplicate. Soil texture was determined by granulometric analysis, using the hydrometer method established by Bouyoucos [16], reported as a fraction in the percentage of sand (SND), clay (CLY) and silt (SIL). The texture diagram proposed by the USDA was used to establish the textural class [17]. The hydrogen potential (pH) was determined according to the methodology of Thomas [18]. The electrical conductivity (EC) was determined following the methodology of Hendrickx [19], reported in dS m−1 using a HANNA HI9811-5 digital conductivity meter (Woonsocket, RI, USA). The WHC was determined by weight difference following the methodology described by Nannipieri [20]. The WHC was calculated by the difference in the weight obtained and the weight of the filter without soil (control without soil), reported as a percentage of moisture. The total organic carbon (TOC) was established according to the methodology used by Walkley and Black [21], reported as a percentage. The percentage of organic matter (OM) was obtained with the TOC value multiplied by the Van Benmelen factor (1.724), reported as a percentage [2,22]. The total nitrogen (TN) was analyzed in two steps including digestion of the sample to convert N to ammonium (N-NH4+) and subsequent determination of N-NH4+ in the digestate [23] using a micro-Kjeldahl equipment model mdk-6 (San Pedro Tlaquepaque, Jal, Mexico), quantified colorimetrically at 660 nm in a JENWAY 6305 UV-Vis spectrophotometer (Sheung Wan, Hong Kong, China), reported as a percentage. The macronutrients K, calcium (Ca), Mg and sodium (Na) were quantified by the microwave acid digestion/ICP technique [24] using an ICP-MS X series 2 (Thermo, Dreieich, Germany), reported in meq 100 g−1 soil. The cation exchange capacity (CEC) was obtained following Cottenie’s methodology [25], reported in meq 100 g−1 of soil.

2.5. Biological Characterization

Indicators related to microbial biomass (MB) and enzyme activity were analyzed. The MB was determined using the fumigation–incubation method, which involves the fumigation of soil samples with chloroform [26]. This method was used for the indicators of microbial biomass C (MBC) and microbial biomass N (MBN). To measure the N mineralization capacity of microorganisms, the MBN indicator was analyzed using the methodology established by Joergensen and Brokes [27], reported in µg Nmic kg−1 soil. For the quantification of the evolution of the microbial community through C mineralization by microorganisms, the MBC indicator was analyzed using the extraction–fumigation methodology [28], reported in µg Cmic kg−1 soil. The soil microbial respiration (SMR) was determined using the soil incubation technique [26]. During the incubation of soil in a closed system, the amount of C-CO2 generated was estimated and trapped in a 1.0 M NaOH solution, then determined with 1.0 M HCI [26] and reported as mg C-CO2 kg−1 soil. To measure the general enzyme activity—which includes proteases, lipases and esterases—the fluorescein diacetate (FDA) method was used [29], reported in mg fluorescein kg−1 soil h−1. The metabolic coefficient (qCO2) was calculated from the quotient of the SMR and MBC indicators [30], reported in mg C-CO2 g Cmic−1 h−1. Enzyme activity tests were conducted using the API ZYM® enzyme system, which analyzes 19 specific enzymes related to the N, C and P cycles, generating color patterns with different intensities and hydrolyzed substrate values (level 0 to 5, in increasing order of intensity) after an incubation period of four hours at 37 °C; the results are reported in nmol [31,32].

2.6. Statistical Analysis

The statistical analysis was carried out using R statistical software version 3.6.3 [33]. It started with a Shapiro–Wilk normality test with a significance level of p 0.05 . To evaluate the differences between the indicators analyzed in the soils, a one-way analysis of variance (ANOVA) was applied, followed by a Tukey’s mean test with a significance level of p 0.05 [34]. Linear correlations between indicators were calculated using a Pearson product moment correlation matrix, showing only those correlations that were significant ( p 0.05 ) . Interactions with a high correlation coefficient ( r 2   ±   0.6 ) were considered significant interactions [1]. The development of the SQI was carried out by means of a principal component analysis (PCA), which began with a Kaiser–Meyer–Olkin adequacy analysis ( K M O ) [35], eliminating those indicators that reduced the adequacy of the database ( K M O < 0.5 ) . Subsequently, the PCA was established, where those indicators that had a high linear correlation ( r 2   ±   0.6 ) with their principal component (PC) were selected [1,36]. Then, a redundancy reduction process was carried out among the indicators related to their PC, under the following criteria and in order of importance: number of interactions > PC membership (PC1 > PC2 > … > PCn) > correlation with their PC [37]. The quality results obtained by the developed SQI were evaluated by means of a one-way ANOVA with subsequent Tukey’s mean test at a significance level of p 0.05 .

2.7. SQI Development

The SQI was developed following the methodology of Yu et al. [38], which is based on a unified additive weighting equation (Equation (1)) and a scoring equation for the indicators that will make up the SQI (Equation (2)) [38]. The additive weight equation was applied using the variability of the PCs obtained from the SQI development process. This allowed the soil quality to be established in an objective manner. This methodology has advantages over other techniques (fixed additive weight equation, expert opinion and linear additive indexes), which are subjective and depend on the interpretation of soil conditions.
S Q I = i n W i S i
where W i is the proportion of PC variability with which the indicator correlates, and S i is the indicator value resulting from the redundancy reduction process obtained from the analysis of the soil samples.
Equation (2) was used to score indicators whose function in the soil was considered as “more is better” or “less is better”.
S i = a 1 + X X m b
where a is equal to the maximum standardized indicator value, X m is the average indicator value obtained from the analyses, X is the indicator value, and b is the slope of the indicator scoring function ( 2.5 for indicators whose function is “more is better” and 2.5 for indicators whose function is “less is better”).
Equation (3) was used to score indicators whose function in the soil is considered “optimal” and whose maximum or optimal value is at the value of 0.5 [39].
S i = 1 1 + B L X L 2 L B + X 2 L
where B is the value of the indicator where the slope is equal to 0.5, L is the lower limit value of the indicator, and X is the value of the indicator. The objective of the SQI was to establish a value between 0 and 1, thus establishing the soil quality according to the classification shown in Table 2.

3. Results and Discussion

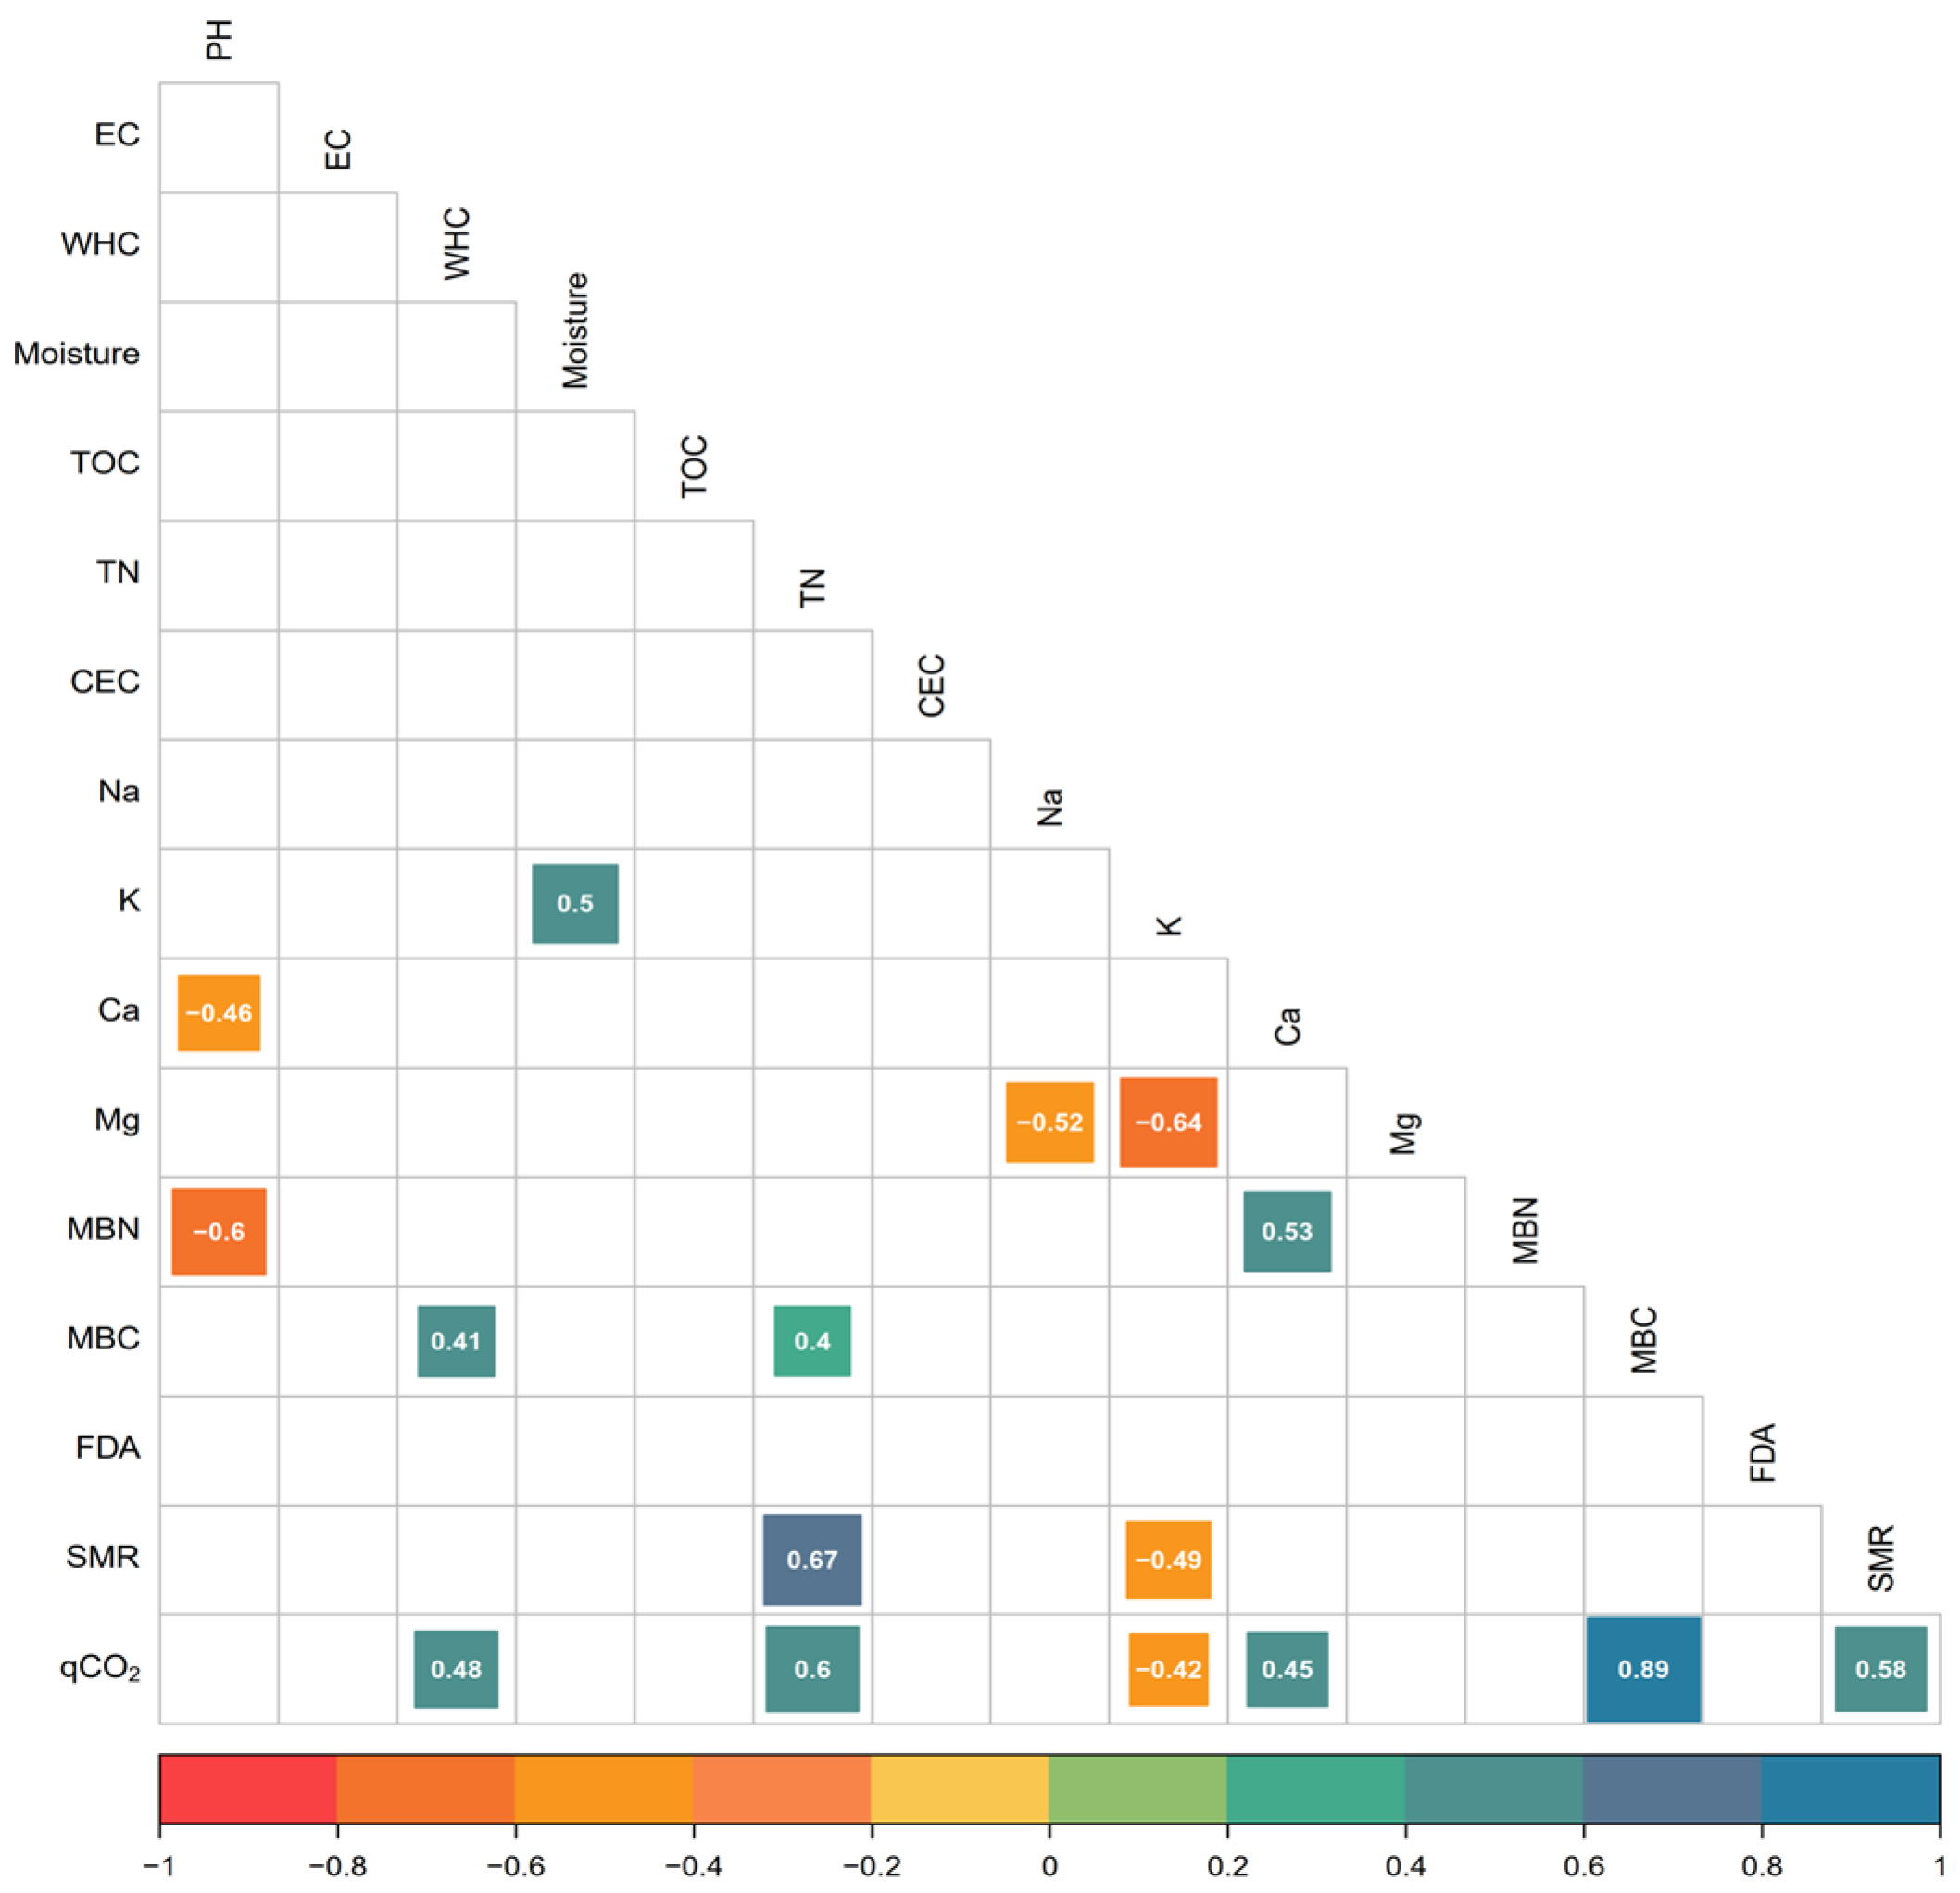
3.1. Physicochemical and Biological Characterisation of Soils

The physicochemical characterisation of a soil provides important information on its structure and ability to supply nutrients to the plants and microorganisms present in it. The results of the physicochemical characterization are shown in Table 3. It should be noted that, except for the EC, WHC and K indicators, all of the other indicators showed significant differences between the analysed soils. Regarding the pH indicator, the soils were considered to be moderately acidic (Ac4 < Ac3), slightly acidic (Sa6 < Ac2 < Ir2 < Sa1) or neutral (Sa2 < Ir3 < Ir1 < Ac1 < Ac1). The tendency towards acidification for most of the soils can affect the availability of nutrients to plants and microorganisms due to interaction with aluminium (Al) [41], which in turn affects nutrient cycling. This acidification may be linked to excessive use of chemical fertilisers containing urea, as these fertilisers can release organic acids during their metabolism by microorganisms present in the soil [42].
The EC indicator showed that high levels of salts were not detected in the solution of the evaluated soils. This could be due to the use of irrigation water with low salt concentrations, in contrast to the use of well water—characteristic of the region—that usually has a high concentrations of salts and thus leads to the accumulation of salts on the soil surface [43]. Similarly, the WHC indicator did not show significant differences between the analysed soils; where they were classified as low capacity (Ac2 < Ir3 < Ir2 < Ir4 < Ir1 < Ac1 < Ac1 < Sa1 < Sa2) or moderate capacity (Sa6 < Ac3). A low WHC causes a water deficit for crop development and microorganism communities, leading to a decline in yield and nutrient cycling [44]. These low values may be related to tillage practices used in conventional agriculture and a low OM concentration or high Na concentrations in the soil, which can break down macro- and micro-aggregates in clay soils, decrease the amount of micropores and damage their structure [45,46].
In the case of the OM-related indicators TOC and TN, the soils presented concentrations considered to be high and moderate, respectively. In general, this variability could be related to the possible application of organic amendments such as biosolids, biochar or manure, which could counteract the impact of conventional agricultural practices that lead to low C concentrations [46,47]. As for N, it is possible that the use of chemical fertilisers has contributed to its moderate concentration in the soil, which in turn could lower the soil’s pH [42].
The analysed soils presented significant differences in their capacity to provide nutrients, which is related to the indicators CEC, Na, K, Ca and Mg indicators. All of the soils had a low CEC, possibly due to the physical damage caused by conventional agricultural ploughing. Moreover, this could be attributed to the effect caused by their pH, causing a greater interaction between the negative charges of the clay with Al and increasing the susceptibility to the leaching of the other elements [41].
All of the soils showed high Na levels, which could result in the disintegration of aggregates and affect nutrient retention and water infiltration. The accumulation of Na could be due to irrigation with water containing a certain amount of salts, which accumulated over time. High Na levels could reduce the CEC capacity of the soil, a phenomenon that can be observed in the results obtained in the present sttudy. In addition, these high levels of Na could hinder the access of microorganisms to OM, which would explain the high OM concentration in the soils and its slow decomposition [48]. A high Na concentration can affect the important WHC indicator by decreasing the amount of available micropores, thus limiting the ability of the soil to supply water to crops, which is consistent with the results observed for this indicator [45].
There were high K levels in all of the soils, probably as a result of excessive use of chemical fertilisers and a lack of pre-sowing soil analysis. K is crucial for enzyme activation, protein synthesis and photosynthesis. However, in high concentrations, it can cause salt stress [49].
All of the soils showed very low Ca levels, possibly due to the exchange of this element for Al and Na in the clay matrix, influenced by the acidic pH of the soil [41]. Low Ca concentrations affect soil structure, causing a decrease in aggregates and macro- and micropores, and preventing adequate water and air flow in the soil, which could affect OM mineralisation and general microbial activity. Furthermore, Ca plays a structural role in plants, as it is part of the plant cell wall [48]. A low Ca concentration causes poor structural development in crops, together with a significant effect on the plant’s ability to carry out photosynthesis, as it is an important factor in the functioning of chlorophyll. On the other hand, all of the soils presented adequate concentrations of Mg. A deficiency of this element causes a loss of pigmentation in leaves, interfering with plant development by reducing photosynthesis [49].
Concerning the biological phase of the soil, the analysed indicators did not present well-defined limits that would allow for their classification, unlike the physicochemical indicators. In the case of the indicators MBN and MBC, high values indicate the enzymatic capacities of the microbial population in relation to the N and C cycling present in the OM [50]. The MBN indicator showed that the Ac4 soil had the highest microbial capacity for N utilisation, while the Ir1 soil had the lowest capacity (Table 4). This difference can be attributed to the N concentrations (TN indicator) in these soils, as the Ac4 soil had a lower concentration compared with the Ir1 soil. Therefore, by having a lower N concentration, the microorganisms in the Ac4 soil tended to retain more N in their structures [51].
Regarding the MBC indicator, the Sa6 soil had the highest value, while the Ac2 soil had the lowest value (Table 4). The behaviour observed for this indicator was opposite to that of the MBN indicator, as the Sa6 soil maintained a higher TOC and OM concentrations. The inverse behaviour between these two indicators could be related to the nature of the OM present in the soils and its C/N ratio, as well as fertilisation processes. In soils with higher C/N values, the OM composition tends to be more resistant to the metabolism of microorganisms [52], coupled with the effect of stimulating the growth of microbial communities from the chemical fertiliser used [53].
The overall enzyme activity—related to the FDA indicator—provides an overview of the metabolic activity of the microbial population. High values of FDA reflect high microbial activity or adequate soil conditions to maintain this activity [54]. In the FDA indicator, higher activity was observed in Ac1 soil and lower activity in Ir1 soil. The former soil is likely to have more favorable structural and chemical conditions (CEC and pH) compared to the latter (Table 3). However, the differences found in the analyses are small. This suggests that the microorganisms present in Ir1 soil may be experiencing a decrease in their ability to fix N in their structures and proteins, consistent with the results shown for that soil for the MBN indicator. This situation possibly stems from the continuous addition of chemical fertilisers that could be introducing heavy metals (Cd, Ni, Pb and Hg) to the soil, which can affect the microorganisms’ ability to mineralise N [55].
As for the SRM and qCO2 indicators, they are an indirect measure of microbial activity and soil maturity. Low values in these indicators are related to soil quality since they reflect an adapted and mature microbial community capable of carrying out nutrient cycling [55]. In relation to these indicators, the most favorable conditions were found in Ac2 soil, while the soil that showed the most unfavorable conditions for microorganisms was Ac3 soil (Table 3). The latter showed acidic conditions that could lead to higher availability of Al ions, generating toxic conditions for microorganisms, which would be reflected in higher stress, in contrast to what was observed in Ac2 soil [41].

3.2. Soil Enzyme Profile
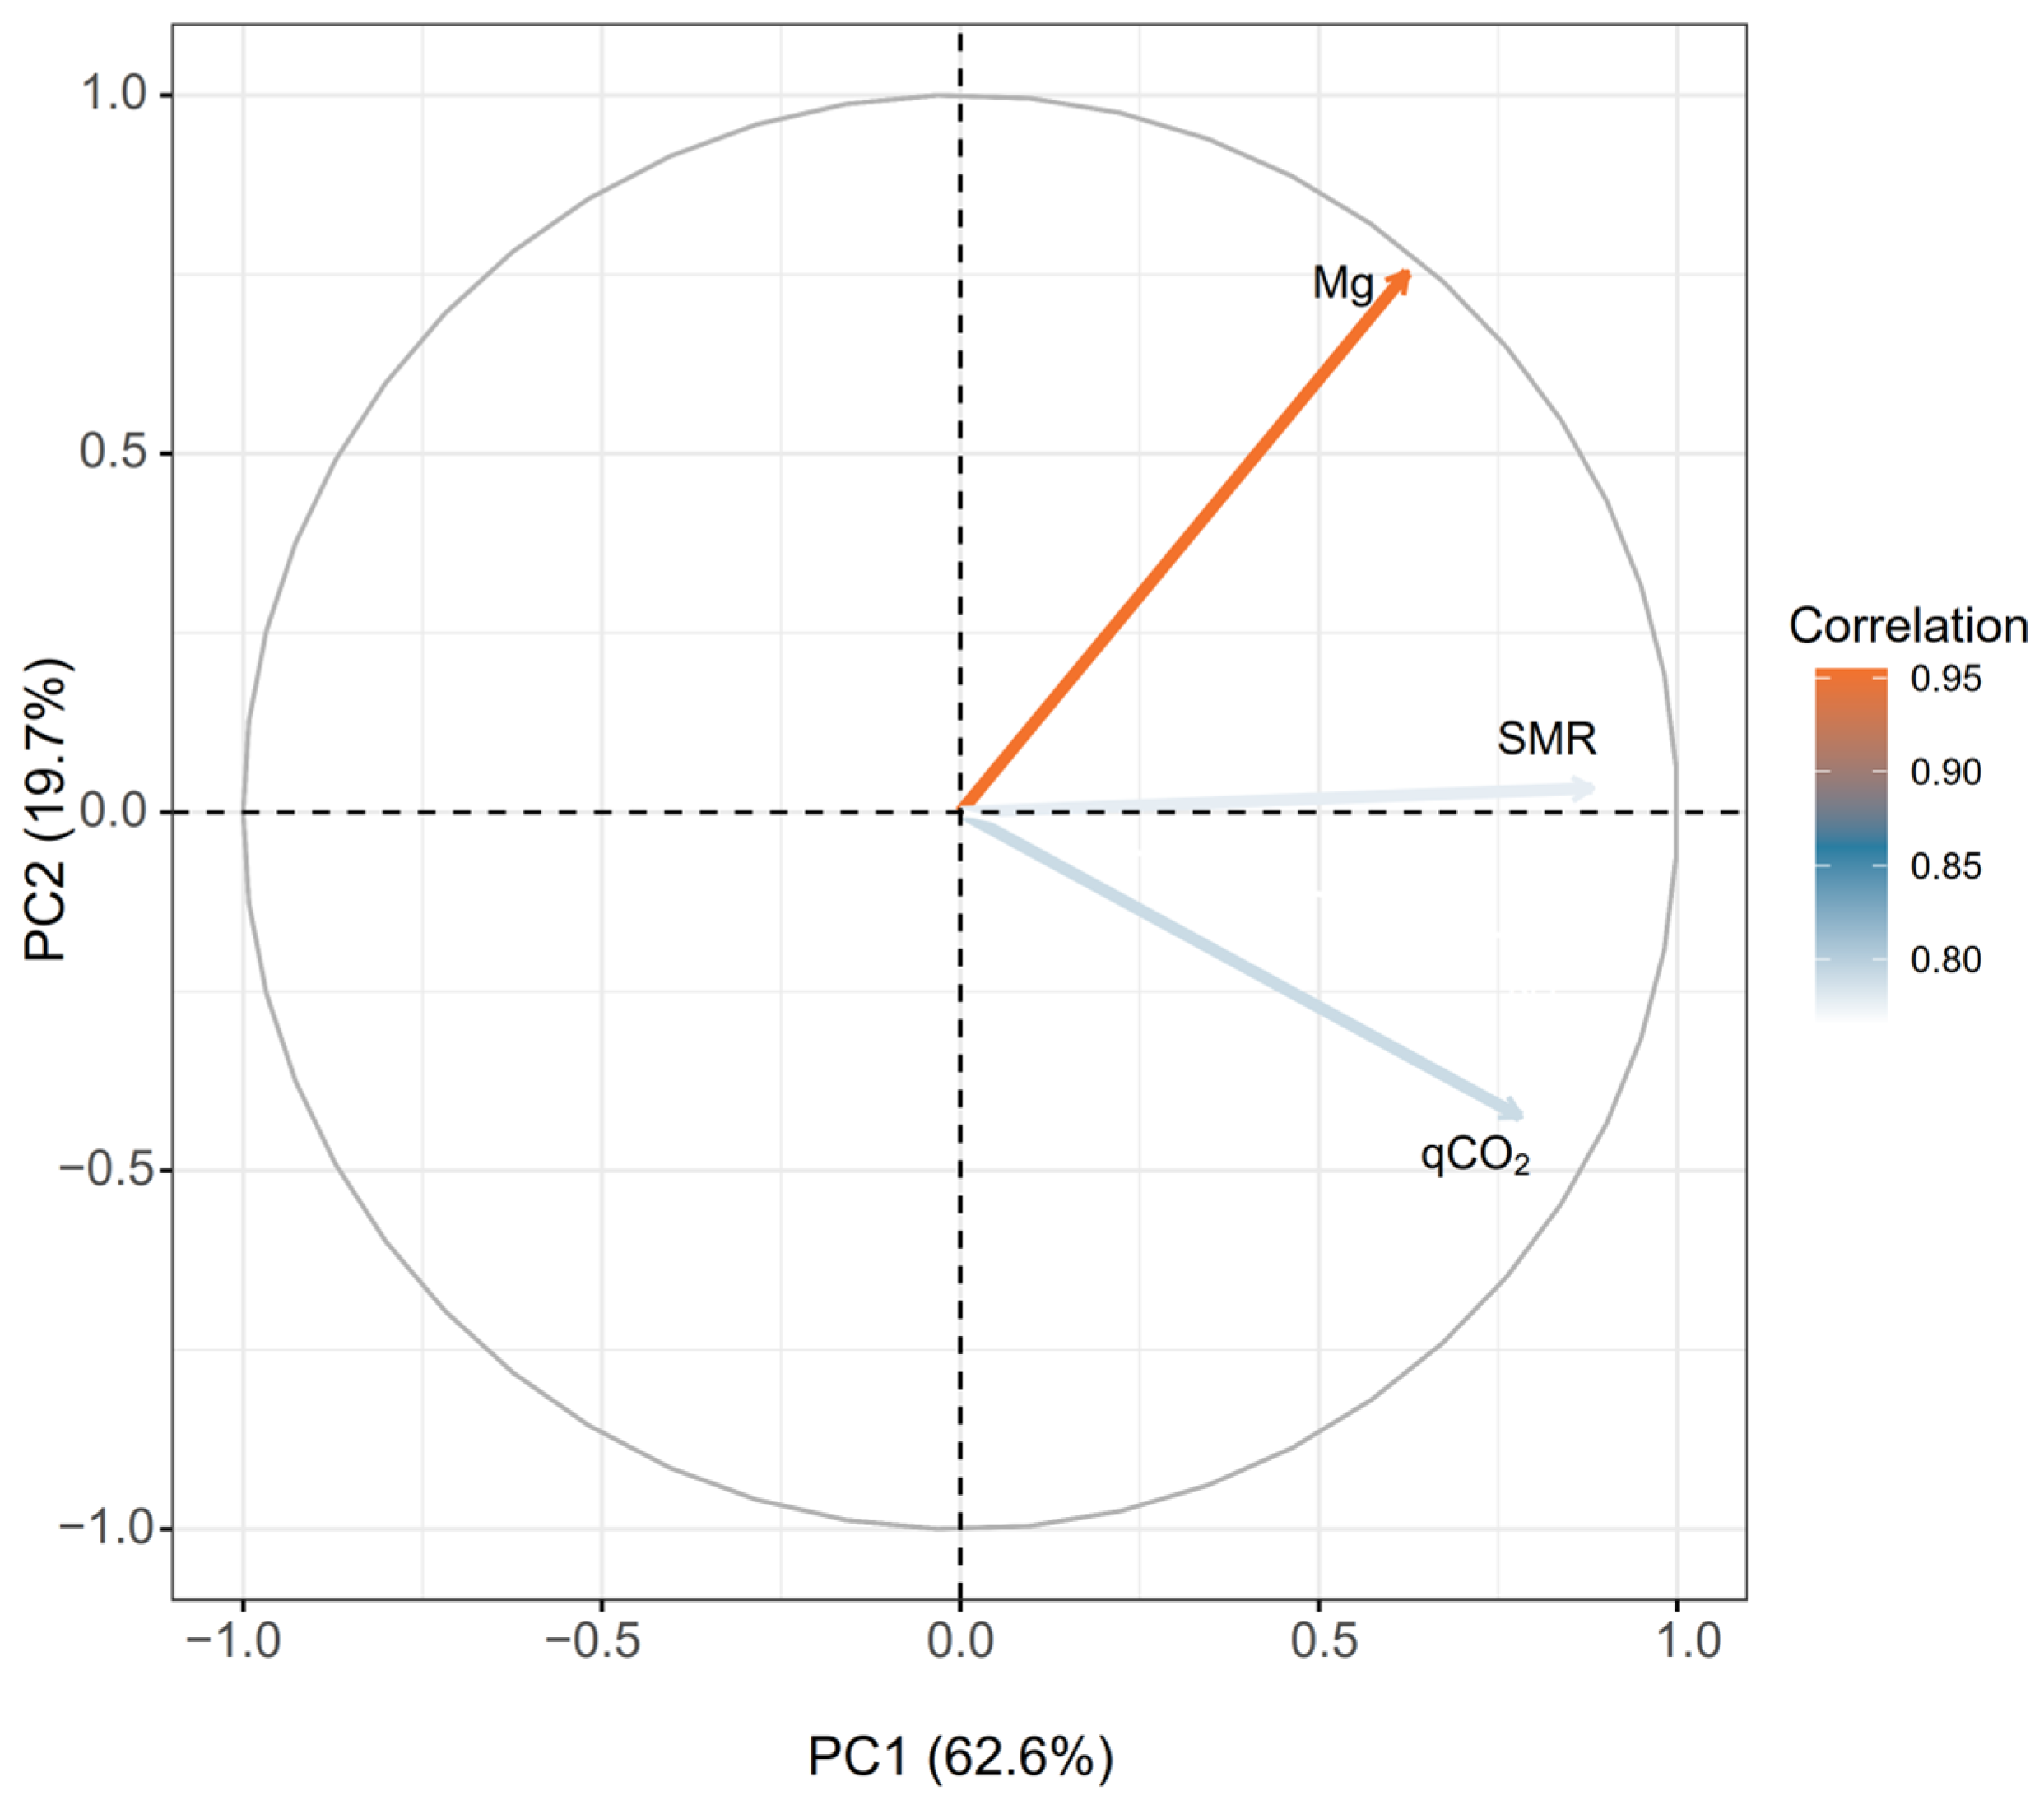
Microorganisms play a crucial role in the nutrient cycling of the soil, which in turn is related to the nutrition of the crops growing in it. Enzyme activities provide an overview of the conditions in which the different microorganisms present in the soil are immersed. The enzyme profile analysed through the API ZYM® system of the sampled soils is shown in Figure 2.
With regard to the activity of the various enzyme families analysed here, the following order could be observed: phosphatases > aminopeptidases > esterases–lipases > glycosyl hydrolases. The enzymes trypsin and α-chymotrypsin from the peptidase family were not detected, nor was the enzyme lipase (Figure 2).
A higher activity of the enzyme’s acid phosphomonoesterase and phosphohydrolase reflects the acidic soil conditions. However, it is important to clarify that the enzyme alkaline phosphomonoesterase was present according to the detection. The concentrations detected by the API ZYM® system in relation to the family of phosphatase enzymes are mainly due to the low solubility of P in the soil, as well as the biological need of microorganisms to acquire this element to incorporate it into their membranes and use it as an energy compound for their metabolism. Consequently, they release extracellular enzymes [55,56].
The activity of aminopeptidases is related to the breakdown of simple N compounds, which is linked to the chemical fertilisation processes used. Fertilisation compounds are easily broken down so that they can be taken up by plants. Increased availability of these compounds triggers the response of microorganisms to the release of extracellular enzymes [55]. This could explain why enzymes related to the peptidase family were not detected, since, with a high availability of nitrogenous compounds, the microorganisms would not need to metabolize complex proteins.
The esterase–lipase enzyme family is linked to the breakdown of water-soluble C compounds (ester bonds and organic acids). However, it is important to note that a higher concentration was observed in Ac2 and Sa6 soils, which showed higher values for the indicators qCO2 and MBC, suggesting the existence of better nutritional conditions for the microorganisms, compared to the other soils.
In the same context, the glycosyl hydrolase enzyme family is related to the decomposition of C compounds, and high activity of these enzymes is associated with high OM concentrations [53]. The lack of detection of these enzymes in most of the sampled soils could be attributed to the presence of long-chain C compounds or difficult access to the OM present in the soil, possibly influenced by high Na concentrations and conventional agricultural practices [41]. The enzyme profiles of all soils were observed to focus on the mineralization of N and P in the soil, which are essential elements for the development and growth of microorganisms and plants.

3.3. PCA

The PCA started with the development of a Pearson product moment correlation matrix, shown in Figure 3. It was observed that the indicators pH, TN, K, Mg, MBN, MBC, SMR and qCO2 were the only ones that presented significant interactions between them ( r 2 ± 0.6 ) , thus forming the minimum data set for the SQI. A negative correlation between the indicators pH and MBN is remarkable and can be explained by the impact of pH on microbial metabolism, as acidic and alkaline pH can affect the availability of nutrients for microbial communities. The TN indicator showed significant positive correlations with the indicators SMR and qCO2, both related to the activity and maturity of microbial communities. This suggests that chemical fertilisation processes have a stimulating effect on the metabolism of microorganisms and possibly on soil nutrient cycling. Consequently, the MBC indicator also showed a significant positive correlation with the qCO2 indicator.
A KMO adequacy test was conducted to assess the suitability of using the minimum database in PCA, and the following results were obtained: overall KMO = 0.74 (for each indicator, TN = 0.75, Mg = 0.76, SMR = 0.72, and qCO2 = 0.77).
After performing the PCA, two PCs were identified that met the criterion of eigenvalue > 1, comprising 82.3% of the variability of the indicators analysed in the sampled soils (Figure 4). PC1 is composed of the indicators TN, SMR and qCO2, while PC2 exclusively includes the indicator Mg (Table 5).
The relationship between the resulting indicators and the PCs is shown in Figure 4.
The incorporation of the aforementioned indicators in the respective PCs provided a representation of the relevance of microorganisms in agricultural development processes, especially under conditions of conventional agriculture using chemical fertilizers.

3.4. Establishment of the SQI

At the conclusion of the PCA and after a redundancy elimination process, the SMR and qCO2 indicators were identified as the most related to the quality of the analysed soils. During this process, the “more is better” function was applied for the SMR indicator and the “less is better” function for the qCO2 indicator. Then, the SQI was established and Equation (4) was obtained.
S Q I = 0.626 × S i S M R + 0.626 × S i q C O 2
The SQI values obtained for the analysed soils revealed significant differences ( p     0.05 ) . The results indicated that some soils presented low quality (Sa6), while the majority presented moderate quality (Ac1, Ac2, Ac3, Ac4, Ir1, Ir2, Ir3 and Sa2) and high quality (Sa1) (Table 6). Consequently, the SQI made it possible to identify differences in soil quality as a function of conventional farming practices in corn cultivation.
Considering the above-mentioned soil quality conditions, the Sa6 soil presents unfavourable conditions for the development of microbial communities due to its low TN concentration, acidic pH and high Na concentration (Table 3). These factors influence microbial activities and may affect nutrient cycling and availability to crops. This is confirmed by the low MBN index in the Sa6 soil. In addition, the high qCO2 value suggests stress on the microbial community, possibly due to acidic pH, nutritional limitations due to a low N concentration, and osmotic stress. This stress could affect the ability of the microbial communities to develop structures and carry out metabolic processes. The Sa1 soil (high quality) offers more favourable conditions for microorganisms compared with the Sa6 soil. It presents better TN and Na concentrations and a more suitable pH (Table 3). These more favourable conditions allow the microorganisms to carry out their metabolic functions more efficiently, reducing stress and allowing them to maintain their cellular structures with less energy expenditure.
The developed SQI, based on biological indicators (SMR and qCO2), offers greater sensitivity to detect small disturbances in the soil due to agricultural activity. These disturbances could be identified in a short period of time, as changes in environmental conditions rapidly affect the metabolisms of microbial communities, even before some physicochemical indicators show alterations.
Other researchers have created several SQIs for corn cultivation in different regions of the world by considering a variety of environmental conditions and soil types. Hu et al. [57] developed a PCA-based SQI by using a minimum data set of reclaimed marsh soils using coal mining residues and evaluated its performance under corn-growing conditions. This SQI was based on texture, pH, EC and TOC indicators. The SQI values ranged from 0.18 (low quality) to 0.66 (high quality) for the analysed soils. However, the application of linear functions to score the indicators could generate incorrect evaluations due to the inclusion of indicators with non-linear behavior in the soil, such as texture and pH, also reducing the sensitivity of the SQI by focusing only on physicochemical indicators. In contrast, the present study considered non-linear scoring functions, incorporating non-linear behavior of the indicators, and improving the sensitivity of the SQI by incorporating biological indicators.
Assunção et al. [58] developed an SQI based on a total data set composed of 24 physicochemical and biological indicators. They conducted their study on Ultisol soil in long-term plots (17 years) with different corn management systems in the Coastal Plateaus of Sergipe State, Northeast Brazil. The authors analysed the influence of the type of ploughing and cover crops on soil quality and concluded that conventional ploughing significantly reduced soil quality, while non-ploughing led to the best soil quality. Regarding the cover crop, peas and millet showed good and excellent quality conditions, respectively, for the minimum- and no-ploughing systems. Although the use of many indicators improves the accuracy of an SQI, its applicability in other areas with similar conditions may be limited due to its complexity and cost of its implementation. Compared with the present study, the use of PCA allows for a reduction in the number of indicators in an SQI, reducing its cost and complexity and thus facilitating its application in other areas with similar characteristics. In addition, the analysis of 10 soils with different characteristics considers environmental variability, which is the opposite of the study conducted by Assunção et al. [58].
Amorim et al. [59] evaluated soil quality in a long-term experiment (15 years) of crop rotation (cotton and corn) and bio-cover crops under a no-tillage regime using the Soil Management Assessment Framework (SMAF). Their model includes indicators such as pH, TOC, bulk density (BD), soil extractable phosphorus (P) and K, EC and the sodium adsorption coefficient (SAR). The SMAF model could differentiate soil quality with respect to depth, showing moderate conditions. However, it was not able to satisfactorily differentiate quality in relation to crop rotation and bio-cover crops, showing moderate values in both cases. Although the SMAF model has been used successfully in various agricultural areas around the world, it did not perform well in this study, possibly due to its preset nature and lack of consideration of the specific conditions of the study area. In comparison, the PCA model used in the present study, which considered local conditions, improved the accuracy of the results by considering all sources of variation in soil quality. The inclusion of biological indicators in the SQI also improves its sensitivity and ability to differentiate soil quality.
The abovementioned studies offer valuable insights into the assessment of soil quality in different agricultural contexts. While the SMAF model used by Amorim et al. [59] showed limitations in its sensitivity to differentiate soil quality in their long-term study, the PCA-based approach used by Hu et al. [57] and the present study addresses this limitation by considering the specific conditions of the study area. Furthermore, the study by Assunção et al. [58] highlights the importance of using a combination of physicochemical and biological indicators to improve the sensitivity of soil quality assessment. Compared with these studies, the present study adopted an integrated approach by using PCA and considering biological indicators. This approach improved the ability to distinguish soil quality in different agricultural contexts and environmental conditions.

3.5. Considerations and Perspectives

In the present study, an SQI has been developed that considers the diversity of natural soil conditions and climatic variations, especially in relation to corn cultivation. However, it is important to evaluate its performance over time to better understand its long-term applicability. In addition, the particularities of specific farming environments, such as the type of tillage, fertilszation practices and the use of cover crops, should be considered, as these factors can significantly influence soil quality.

4. Conclusions

The SQI developed in this study demonstrated its ability to differentiate the quality of soils used in corn cultivation. The PCA greatly simplified the number of indicators assessed, reducing them from 27 to only two. This reduction not only increases the applicability of the SQI in other agricultural areas but also reduces the cost of implementation and facilitates the interpretation of results. The SMR and qCO2 indicators that comprise the SQI focus on key biological aspects that are fundamental to understanding nutrient cycling, microbial activity, and stress, as well as overall soil health, all of which are related to soil quality. The inclusion of these biological indicators provides the developed SQI with greater sensitivity to detect minor disturbances in agricultural soils due to human activity, compared with SQIs consisting only of physicochemical indicators. The usefulness of the developed SQI lies in its ability to provide farmers and decision-makers with a practical tool to take concrete measures to maintain and improve the quality of their soils. The developed SQI can be used to ensure high-quality food production in soils under corn cultivation and similar conditions, both nationally and internationally.

Author Contributions

Conceptualization, E.C.-B.; Data curation, A.S.-G. and H.I.B.-R.; Formal analysis, H.I.B.-R., M.A.L.-H. and F.P.G.-V.; Funding acquisition, D.Á.-B.; Investigation, H.I.B.-R. and F.P.G.-V.; Methodology, A.S.-G., H.I.B.-R., M.A.L.-H. and F.P.G.-V.; Project administration, D.Á.-B.; Resources, E.C.-B.; Software, A.S.-G. and H.I.B.-R.; Supervision, E.C.-B., M.d.l.L.X.N.-R. and D.Á.-B.; Validation, H.I.B.-R.; Writing—original draft, A.S.-G., M.A.L.-H. and D.Á.-B.; Writing—review and editing, H.I.B.-R., E.C.-B., M.d.l.L.X.N.-R. and D.Á.-B. All authors have read and agreed to the published version of the manuscript.

Funding

This research was funded by Secretaría de Investigación y Posgrado del IPN (20220196/20231673).

Institutional Review Board Statement

Not applicable.

Informed Consent Statement

Not applicable.

Data Availability Statement

The raw data supporting the conclusions of this article will be made available by the authors on request.

Conflicts of Interest

The authors declare no conflicts of interest.

References

  1. Muñoz-Rojas, M.; Erickson, T.E.; Dixon, K.W.; Merritt, D.J. Soil Quality Indicators to Assess Functionality of Restored Soils in Degraded Semiarid Ecosystems. Restor. Ecol. 2016, 24, S43–S52. [Google Scholar] [CrossRef]
  2. Secretaría de Medio Ambiente y Recursos Naturales [SEMARNAT]. NOM-021-RECNAT-2002; Diario Oficial de la Federación; Secretaría de Medio Ambiente y Recursos Naturales: Mexico City, Mexico, 2002. Available online: https://biblioteca.semarnat.gob.mx/janium/Documentos/Ciga/libros2009/DO2280n.pdf (accessed on 19 March 2024).
  3. Secretaría de Medio Ambiente y Recursos Naturales [SEMARNAT]. Estrategia Nacional de Manejo Sustentable de Tierras; Secretaría de Medio Ambiente y Recursos Naturales: Mexico City, Mexico, 2011.
  4. Etchevers, J.; Hidalgo, C.; Paz Pellat, F. Soil Degradation and the Need for Public Policies. Elem. Para Políticas Públicas 2022, 3, 267–273. [Google Scholar]
  5. García-Lara, S.; Serna-Saldivar, S.O. Corn History and Culture. In Corn; Elsevier: Amsterdam, The Netherlands, 2019; pp. 1–18. ISBN 978-0-12-811971-6. [Google Scholar]
  6. Rangel-Peraza, J.G.; Padilla-Gasca, E.; López-Corrales, R.; Medina, J.R.; Bustos-Terrones, Y.; Amabilis-Sosa, L.E.; Rodríguez-Mata, A.E.; Osuna-Enciso, T. Robust Soil Quality Index for Tropical Soils Influenced by Agricultural Activities. J. Agric. Chem. Environ. 2017, 06, 199–221. [Google Scholar] [CrossRef]
  7. Hernández, A.; Ascanio, M.; Morales, M.; Borjórquez, I.; García, N.; García, D. El Suelo: Fundamentos Sobre su Formación, los Cambios Globales y su Manejo; Universidad Autónoma de Nayarit: Tepic, Mexico, 2008. [Google Scholar]
  8. Juhos, K.; Czigány, S.; Madarász, B.; Ladányi, M. Interpretation of Soil Quality Indicators for Land Suitability Assessment—A Multivariate Approach for Central European Arable Soils. Ecol. Indic. 2019, 99, 261–272. [Google Scholar] [CrossRef]
  9. Nuñez-Peñaloza, J.L.; Pérez-Nieto, J.; Prado-Hernández, J.V. Análisis de indicadores e índices de calidad de suelos en México. Rev. Mex. Cienc. Agríc. 2023, 14, e3148. [Google Scholar] [CrossRef]
  10. Abdel-Fattah, M.K.; Mohamed, E.S.; Wagdi, E.M.; Shahin, S.A.; Aldosari, A.A.; Lasaponara, R.; Alnaimy, M.A. Quantitative Evaluation of Soil Quality Using Principal Component Analysis: The Case Study of El-Fayoum Depression Egypt. Sustainability 2021, 13, 1824. [Google Scholar] [CrossRef]
  11. Das, S.; Bhattacharyya, R.; Das, T.K.; Sharma, A.R.; Dwivedi, B.S.; Meena, M.C.; Dey, A.; Biswas, S.; Aditya, K.; Aggarwal, P.; et al. Soil Quality Indices in a Conservation Agriculture Based Rice-Mustard Cropping System in North-Western Indo-Gangetic Plains. Soil Tillage Res. 2021, 208, 104914. [Google Scholar] [CrossRef]
  12. Instituto Nacional para el Federalismo y el Desarrollo Municipal [INAFED]. Sistema Nacional de Información Municipal 2022. Available online: http://www.snim.rami.gob.mx/ (accessed on 19 March 2024).
  13. Deckers, J.A.; Driessen, P.M.; Nachtergaele, F.O.; Spaargaren, O.C. World Reference Base for Soil Resources. In Encyclopedia of Soil Science; Marcel Dekker: New City, NY, USA, 2002; pp. 1446–1451. [Google Scholar]
  14. Vasu, D.; Singh, S.K.; Ray, S.K.; Duraisami, V.P.; Tiwary, P.; Chandran, P.; Nimkar, A.M.; Anantwar, S.G. Soil Quality Index (SQI) as a Tool to Evaluate Crop Productivity in Semi-Arid Deccan Plateau, India. Geoderma 2016, 282, 70–79. [Google Scholar] [CrossRef]
  15. Secretaría de Medio Ambiente y Recursos Naturales [SEMARNAT]. NOM-004-SEMARNAT-2002; Diario Oficial de la Federación; Secretaría de Medio Ambiente y Recursos Naturales: Mexico City, Mexico, 2003. Available online: https://www.dof.gob.mx/nota_detalle.php?codigo=691939&fecha=15/08/2003#gsc.tab=0 (accessed on 19 March 2024).
  16. Bouyoucos, G.J. Hydrometer Method Improved for Making Particle Size Analyses of Soils 1. Agron. J. 1962, 54, 464–465. [Google Scholar] [CrossRef]
  17. U.S. Department of Agriculture (USDA). Soil Survey Manual; United Department of Agriculture: Washington, DC, USA, 1951.
  18. Thomas, G.W. Soil pH and Soil Acidity. In Chemical Methods; Sparks, D.L., Page, A.L., Helmke, P.A., Loeppert, R.H., Soltanpour, P.N., Tabatabai, M.A., Johnston, C.T., Summer, M.E., Eds.; Soil Science Society of America: Madison, WI, USA, 2018; pp. 475–490. [Google Scholar]
  19. Hendrickx, J.M.H.; Das, B.; Corwin, D.L.; Wraith, J.M.; Kachanoski, R.G. Relationship Between Soil Water Solute Concentration and Apparent Soil Electrical Conductivity. In Methods of Soil Analysis: Part 4; Dane, J.H., Topp, G.C., Eds.; Soil Science Society of America: Madison, WI, USA, 2002; pp. 1275–1282. [Google Scholar]
  20. Nannipieri, P. Soil Is Still an Unknown Biological System. Appl. Sci. 2020, 10, 3717. [Google Scholar] [CrossRef]
  21. Walkley, A.; Black, I.A. An Examination of Different Methods for Determining Soil Organic Matter and a Proposed Modification of the Chromic Acid Titration Method. Soil Sci. 1934, 37, 29–38. [Google Scholar] [CrossRef]
  22. Yilmaz, E.; Sönmez, M. The Role of Organic/Bio–Fertilizer Amendment on Aggregate Stability and Organic Carbon Content in Different Aggregate Scales. Soil Tillage Res. 2017, 168, 118–124. [Google Scholar] [CrossRef]
  23. Bremner, J.M. Nitrogen-Total. In Methods of Soil Analysis: Chemical Methods; Sparks, D.L., Page, A.L., Helmke, P.A., Loeppert, R.H., Soltanpour, P.N., Tabatabai, M.A., Johnston, C.T., Summer, M.E., Eds.; John Wiley & Sons: Madison, WI, USA, 2018; pp. 1085–1121. [Google Scholar]
  24. Bettinelli, M.; Baroni, U. A Microwave Oven Digestion Method for the Determination of Metals in Sewage Sludges by ICP-AES and GFAAS. Int. J. Environ. Anal. Chem. 1991, 43, 33–40. [Google Scholar] [CrossRef]
  25. Cottenie, A. Soil and Plant Testing as a Basis of Fertilizer Recommendations. FAO Soils Bull. 1980, 382, 64–65. [Google Scholar]
  26. Alef, K.; Nannipieri, P. Methods in Applied Soil Microbiology and Biochemistry; Elsevier: London, UK, 1995; ISBN 978-0-12-513840-6. [Google Scholar]
  27. Joergensen, R.G.; Brookes, P.C. Ninhydrin-Reactive Nitrogen Measurements of Microbial Biomass in 0.5 m K2SO4 Soil Extracts. Soil Biol. Biochem. 1990, 22, 1023–1027. [Google Scholar] [CrossRef]
  28. Sparling, G.P. Ratio of Microbial Biomass Carbon to Soil Organic Carbon as a Sensitive Indicator of Changes in Soil Organic Matter. Aust. J. Soil Res. 1992, 30, 195–207. [Google Scholar] [CrossRef]
  29. Green, V.S.; Stott, D.E.; Diack, M. Assay for Fluorescein Diacetate Hydrolytic Activity: Optimization for Soil Samples. Soil Biol. Biochem. 2006, 38, 693–701. [Google Scholar] [CrossRef]
  30. Anderson, T.H.; Domsch, K.M. Ratios of Microbial Biomass Carbon to Total Organic-C in Arable Soils. Soil Biol. Biochem. 1989, 21, 471–479. [Google Scholar] [CrossRef]
  31. Martínez, D.; Molina, M.J.; Sánchez, J.; Moscatelli, M.C.; Marinari, S. API ZYM Assay to Evaluate Enzyme Fingerprinting and Microbial Functional Diversity in Relation to Soil Processes. Biol. Fertil. Soils 2016, 52, 77–89. [Google Scholar] [CrossRef]
  32. Patel, D.; Gismondi, R.; Alsaffar, A.; Tiquia-Arashiro, S.M. Applicability of API ZYM to Capture Seasonal and Spatial Variabilities in Lake and River Sediments. Environ. Technol. 2019, 40, 3227–3239. [Google Scholar] [CrossRef] [PubMed]
  33. R Core Team R: Language and Environment for Statistical Computing 2021. Available online: https://cran.r-project.org/mirrors.html (accessed on 19 March 2024).
  34. Johnson, R.; Wichern, D. Applied Multivariate Statistical Analysis, 6th ed.; Pearson Education Limited: Edinburgh, UK, 2014; ISBN 978-1-292-02494-3. [Google Scholar]
  35. Mahajan, G.; Das, B.; Morajkar, S.; Desai, A.; Murgaokar, D.; Kulkarni, R.; Sale, R.; Patel, K. Soil Quality Assessment of Coastal Salt-Affected Acid Soils of India. Environ. Sci. Pollut. Res. 2020, 27, 26221–26238. [Google Scholar] [CrossRef] [PubMed]
  36. Villazón Gómez, J.; Martín-Gutiérrez, G.; Cobo-Vidal, Y. Análisis Multivariado de Las Propiedades Químicas de los Suelos Pardos Erosionados. Cent. Agric. 2017, 44, 56–62. [Google Scholar]
  37. Bai, Z.; Caspari, T.; Gonzalez, M.R.; Batjes, N.H.; Mäder, P.; Bünemann, E.K.; de Goede, R.; Brussaard, L.; Xu, M.; Ferreira, C.S.S.; et al. Effects of Agricultural Management Practices on Soil Quality: A Review of Long-Term Experiments for Europe and China. Agric. Ecosyst. Environ. 2018, 265, 1–7. [Google Scholar] [CrossRef]
  38. Yu, P.; Liu, S.; Zhang, L.; Li, Q.; Zhou, D. Selecting the Minimum Data Set and Quantitative Soil Quality Indexing of Alkaline Soils Under Different Land Uses in Northeastern China. Sci. Total Environ. 2018, 616–617, 564–571. [Google Scholar] [CrossRef] [PubMed]
  39. Lima, A.C.R.; Brussaard, L.; Totola, M.R.; Hoogmoed, W.B.; de Goede, R.G.M. A Functional Evaluation of Three Indicator Sets for Assessing Soil Quality. Appl. Soil Ecol. 2013, 64, 194–200. [Google Scholar] [CrossRef]
  40. Prieto-Méndez, J.; Prieto-García, F.; Acevedo-Sandoval, O.A.; Méndez-Marzo, M.A. Indicadores e Indices de Calidad de Los Suelos (ICS) Cebaderos del Sur Del Estado de Hidalgo, México. Agron. Mesoam. 2013, 24, 83. [Google Scholar] [CrossRef]
  41. Rahman, M.A.; Lee, S.H.; Ji, H.C.; Kabir, A.H.; Jones, C.S.; Lee, K.W. Importance of Mineral Nutrition for Mitigating Aluminum Toxicity in Plants on Acidic Soils: Current Status and Opportunities. Int. J. Mol. Sci. 2018, 19, 3073. [Google Scholar] [CrossRef] [PubMed]
  42. Chen, H.; Li, D.; Zhao, J.; Zhang, W.; Xiao, K.; Wang, K. Nitrogen Addition Aggravates Microbial Carbon Limitation: Evidence from Ecoenzymatic Stoichiometry. Geoderma 2018, 329, 61–64. [Google Scholar] [CrossRef]
  43. Fatima, N.; Bahuguna, V.; Kumar, V. A Review on Microalgae Application in Bioenergy Generation & Integrated Wastewater Management. SSRN Electron. J. 2018. Available online: https://papers.ssrn.com/sol3/papers.cfm?abstract_id=3298651 (accessed on 19 March 2024).
  44. Costa, O.Y.A.; Raaijmakers, J.M.; Kuramae, E.E. Microbial Extracellular Polymeric Substances: Ecological Function and Impact on Soil Aggregation. Front. Microbiol. 2018, 9, 337094. [Google Scholar] [CrossRef]
  45. Leogrande, R.; Vitti, C. Use of Organic Amendments to Reclaim Saline and Sodic Soils: A Review. Arid Land Res. Manag. 2019, 33, 1–21. [Google Scholar] [CrossRef]
  46. Wu, L.; Zhang, S.; Ma, R.; Chen, M.; Wei, W.; Ding, X. Carbon Sequestration Under Different Organic Amendments in Saline-Alkaline Soils. CATENA 2021, 196, 104882. [Google Scholar] [CrossRef]
  47. Zanor, G.A.; López Pérez, M.E.; Martínez Yáñez, R.; Ramírez Santoyo, L.F.; Gutiérrez Vargas, S.; León Galván, M.F. Mejoramiento de Las Propiedades Físicas y Químicas de Un Suelo Agrícola Mezclado Con Lombricompostas de Dos Efluentes de Biodigestor. Ing. Investig. Tecnol. 2018, 19, 1–10. [Google Scholar] [CrossRef]
  48. Wong, V.N.L.; Greene, R.S.B.; Dalal, R.C.; Murphy, B.W. Soil Carbon Dynamics in Saline and Sodic Soils: A Review. Soil Use Manag. 2010, 26, 2–11. [Google Scholar] [CrossRef]
  49. Zungu, N.S.; Egbewale, S.O.; Olaniran, A.O.; Pérez-fernández, M.; Magadlela, A. Soil Nutrition, Microbial Composition and Associated Soil Enzyme Activities in KwaZulu-Natal Grasslands and Savannah Ecosystems Soils. Appl. Soil Ecol. 2020, 155, 103663. [Google Scholar] [CrossRef]
  50. Wei, L.; Razavi, B.S.; Wang, W.; Zhu, Z.; Liu, S.; Wu, J.; Kuzyakov, Y.; Ge, T. Labile Carbon Matters More than Temperature for Enzyme Activity in Paddy Soil. Soil Biol. Biochem. 2019, 135, 134–143. [Google Scholar] [CrossRef]
  51. Kacprzak, M.; Kupich, I.; Jasinska, A.; Fijalkowski, K. Bio-Based Waste’ Substrates for Degraded Soil Improvement—Advantages and Challenges in European Context. Energies 2022, 15, 385. [Google Scholar] [CrossRef]
  52. Marzi, M.; Shahbazi, K.; Kharazi, N.; Rezaei, M. The Influence of Organic Amendment Source on Carbon and Nitrogen Mineralization in Different Soils. J. Soil Sci. Plant Nutr. 2020, 20, 177–191. [Google Scholar] [CrossRef]
  53. Luo, G.; Li, L.; Friman, V.-P.; Guo, J.; Guo, S.; Shen, Q.; Ling, N. Organic Amendments Increase Crop Yields by Improving Microbe-Mediated Soil Functioning of Agroecosystems: A Meta-Analysis. Soil Biol. Biochem. 2018, 124, 105–115. [Google Scholar] [CrossRef]
  54. Medina-Herrera, M.d.R.; Negrete-Rodríguez, M.d.l.L.X.; Álvarez-Trejo, J.L.; Samaniego-Hernández, M.; González-Cruz, L.; Bernardino-Nicanor, A.; Conde-Barajas, E. Evaluation of Non-Conventional Biological and Molecular Parameters as Potential Indicators of Quality and Functionality of Urban Biosolids Used as Organic Amendments of Agricultural Soils. Appl. Sci. 2020, 10, 517. [Google Scholar] [CrossRef]
  55. Bedolla-Rivera, H.I.; Xochilt Negrete-Rodríguez, M.d.l.L.; Medina-Herrera, M.d.R.; Gámez-Vázquez, F.P.; Álvarez-Bernal, D.; Samaniego-Hernández, M.; Gámez-Vázquez, A.J.; Conde-Barajas, E. Development of a Soil Quality Index for Soils under Different Agricultural Management Conditions in the Central Lowlands of Mexico: Physicochemical, Biological and Ecophysiological Indicators. Sustainability 2020, 12, 9754. [Google Scholar] [CrossRef]
  56. Naeem, M.; Ansari, A.A.; Gill, S.S. (Eds.) Contaminants in Agriculture: Sources, Impacts and Management; Springer International Publishing: Cham, Switzerland, 2020; ISBN 978-3-030-41551-8. [Google Scholar]
  57. Hu, Z.; Liu, S.; Gong, Y. Evaluation of Soil Quality and Maize Growth in Different Profiles of Reclaimed Land with Coal Gangue Filling. Land 2021, 10, 1307. [Google Scholar] [CrossRef]
  58. Assunção, S.J.R.; Pedrotti, A.; Gonzaga, M.I.S.; Nobrega, J.C.A.; Holanda, F.S.R. Soil Quality Index of an Ultisol under Long-Term Plots in the Coastal Tablelands in Northeastern Brazil. Rev. Caatinga 2023, 36, 432–444. [Google Scholar] [CrossRef]
  59. Amorim, H.C.; Ashworth, A.J.; Wienhold, B.J.; Savin, M.C.; Allen, F.L.; Saxton, A.M.; Curi, N. Soil Quality Indices Based on Long-Term Conservation Cropping Systems Management. Agrosyst. Geosci. Environ. 2020, 3, e20036. [Google Scholar] [CrossRef]
Figure 1. Study area. The gray map in the upper right is of Mexico; the red zone refers to the state of Guanajuato.
Applsci 14 02858 g001
Figure 2. Enzyme profile of the sampled soils from the Bajio region of Guanajuato. Acámbaro (Ac1, Ac2, Ac3, Ac4); Salamanca (Sa1, Sa2, Sa6); Irapuato (Ir1, Ir2, Ir3).
Applsci 14 02858 g002
Figure 3. Pearson product moment correlation matrix. pH, hydrogen potential; EC, electrical conductivity; WHC, water-holding capacity; TOC, total organic C; TN, total N; CEC, cation exchange capacity; K, potassium; Na, sodium; Ca, calcium; Mg, magnesium; MBC, microbial biomass C; MBN, microbial biomass N; FDA, fluorescein diacetate activity; SMR, soil microbial respiration; qCO2, metabolic coefficient. Only significant interactions ( p 0.05 ) are shown, with those with a high correlation coefficient ( r 2 ±   0.6 ) being considered significant correlations.
Applsci 14 02858 g003
Figure 4. Bi-plot of correlation between PC1 and PC2. Mg, magnesium; SMR, soil microbial respiration; qCO2, metabolic coefficient.
Applsci 14 02858 g004
Table 1. Location and agricultural management of sampled soils from the Bajio of Guanajuato.
MunicipalitySoilType of
Irrigation
Fertilization
(NPK)
TillageYieldLocalization
AcámbaroAc1Rolled240-40-00Conventional8.5–12.0 t ha−120°05′13.32″ N, 100°45′25.62″ W
Ac2Rolled240-40-00Conventional8.5–12.0 t ha−120°03′57.77″ N, 100°45′20.95″ W
Ac3Rolled240-40-00Conventional8.5–12.0 t ha−120°03′31.20″ N, 100°48′07.58″ W
Ac4Rolled240-40-00Conventional8.5–12.0 t ha−120°04′36.31″ N, 100°44′37.74″ W
Salamanca Sa1Rolled240-40-00Conventional8.5–12.0 t ha−120°26′38.56″ N, 101°00′26.72″ W
Sa2Rolled240-40-00Conventional8.5–12.0 t ha−120°25′37.58″ N, 100°59′18.57″ W
Sa6Rolled240-40-00Conventional8.5–12.0 t ha−120°35′42.42″ N, 101°12′37.97″ W
IrapuatoIr1Rolled240-40-00Conventional8.5–12.0 t ha−120°49′08.48″ N, 101°23′02.82″ W
Ir2Rolled240-40-00Conventional8.5–12.0 t ha−120°50′21.64″ N, 101°22′10.45″ W
Ir3Rolled240-40-00Conventional8.5–12.0 t ha−120°49′42.58″ N, 101°21′13.54″ W
Fertilization practices are based on established NPK units, using fertilizers based on urea and triple calcium superphosphate.
Table 2. Soil quality classification [40].
Soil QualityVery HighHighModerateLowVery Low
Scale0.80–1.000.60–0.790.40–0.590.20–0.390.00–0.19
Class12345
Table 3. One-way ANOVA with subsequent Tukey’s mean test on results of physicochemical indicators of sampled soils from Bajio region of Guanajuato.
IndicatorsSoilsp
Ac1Ac2Ac3Ac4Ir1Ir2Ir3Sa1Sa2Sa6
pH7.29a6.27cd6.07de5.89e6.97b6.29cd6.96b6.40c6.91b6.17cde<0.01
EC0.24a0.24a0.14a0.22a0.18a0.21a0.24a0.32a0.28a0.20ans
WHC89a72a120a81a82a77a75a92a96a101ans
Moisture20.1de29.5ab19.8e23.7cde27.6abc32.5a26.2bc25.6bcd28.9abc29.0abc<0.01
TOC2.50ab2.74ab2.50ab2.20b2.27b1.87b2.96ab2.49ab3.68a2.64ab<0.01
TN0.161g0.159h0.181a0.171f0.177b0.172e0.173d0.176c0.176c0.172e<0.01
CEC6.00a5.24cd5.80ab5.58abc5.36bc5.83ab4.76d5.18cd5.82ab5.40bc<0.01
Na2.32a1.74cd1.19e2.11ab2.21a1.66d0.93f1.21e1.95bc2.17ab<0.01
K1.88a1.92a1.37b1.99a2.02a2.07a1.98a1.84a2.03a1.84ans
Ca0.27cd0.24d0.42b0.48a0.28cd0.47ab0.49a0.30c0.29cd0.49a<0.01
Mg1.54d1.49d2.84a1.11f0.99g1.74c1.38e1.75c1.88b1.09f<0.01
Ac, Acámbaro (Ac1, Ac2, Ac3, Ac4); Ir, Irapuato (Ir1, Ir2, Ir3); Sa, Salamanca (Sa1, Sa2, Sa6); pH, potential of hydrogen; EC, electrical conductivity (dS m−1); WHC, water-holding capacity (%); moisture (%); TOC, total organic C (%); TN, total N (%); CEC, cation exchange capacity (meq 100 g−1 soil); K, potassium (meq 100 g−1 soil); Na, sodium (meq 100 g−1 soil); Ca, calcium (meq 100 g−1 soil); Mg, magnesium (meq 100 g−1 soil); p, probability value. Different letters in the row indicate significant differences, using one-way ANOVA test with subsequent Tukey’s mean test ( p 0.05 ) . Bold numbers indicate maximum and minimum values in the row (n = 3 replicates).
Table 4. One-way ANOVA with subsequent Tukey’s mean test for the results of biological indicators of the sampled soils from the Bajio region of Guanajuato.
IndicatorsSoilsp
Ac1Ac2Ac3Ac4Ir1Ir2Ir3Sa1Sa2Sa6
MBN163de190c220ab244a119f194c210bc187cd159e159e<0.01
MBC144abcd36d144ab96abcd132abc72bcd114abcd60cd114abcd168a<0.01
FDA103a40b68ab67ab38b59ab65ab40b56ab65ab<0.01
SMR144b108b216a162ab144ab144ab168ab168ab150ab138b<0.01
qco230bc11c84a39bc54ab29bc56ab26bc41bc67ab<0.01
Acámbaro (Ac1, Ac2, Ac3, Ac4); Ir, Irapuato (Ir1, Ir2, Ir3); Sa, Salamanca (Sa1, Sa2, Sa6); MBN, microbial biomass N (µg Nmic kg−1 soil); MBC, microbial biomass C (µg Cmic kg−1 soil); SMR, soil microbial respiration (mg C-CO2 kg−1 soil); FDA, fluorescein diacetate activity (mg fluorescein kg−1 soil h−1); qCO2, metabolic coefficient (mg C-CO2 g Cmic−1 h−1); p, probability value. Different letters in the row indicate significant differences, using a one-way ANOVA test with subsequent Tukey’s mean test ( p 0.05 ) . Bold numbers indicate maximum and minimum values in the row (n = 3 replicates).
Table 5. The weighting of indicators in the PCs of the sampled soils from the Bajio region of Guanajuato.
IndicatorPC1PC2
TN0.85---
Mg---0.75
SMR0.88---
qCO20.78---
PC, principal component; TN, total N; Mg, magnesium; SMR, soil microbial respiration; qCO2, metabolic coefficient. Non-significant correlations were omitted.
Table 6. One-way ANOVA with subsequent Tukey’s mean test on sampled soils from the Bajio region of Guanajuato.
SoilSQIQualityp
Ac10.43abModerate<0.001
Ac20.59abModerate<0.001
Ac30.48abModerate<0.001
Ac40.53abModerate<0.001
Ir10.45abModerate<0.001
Ir20.57abModerate<0.001
Ir30.52abModerate<0.001
Sa10.63aHigh<0.001
Sa20.54abModerate<0.001
Sa60.39bLow<0.001
Acámbaro (Ac1, Ac2, Ac3, Ac4); Salamanca (Sa1, Sa2, Sa6); Irapuato (Ir1, Ir2, Ir3). Different letters in the column indicate significant differences between the sampled soils, using one-way ANOVA test with subsequent Tukey’s mean test ( p 0.05 ) . Bold numbers indicate maximum and minimum values in the column (n = 3 replicates).
Disclaimer/Publisher’s Note: The statements, opinions and data contained in all publications are solely those of the individual author(s) and contributor(s) and not of MDPI and/or the editor(s). MDPI and/or the editor(s) disclaim responsibility for any injury to people or property resulting from any ideas, methods, instructions or products referred to in the content.

