Article

Long-Term Forecasting Using MAMTF: A Matrix Attention Model Based on the Time and Frequency Domains

School of Urban Rail Transportation and Logistics, Beijing Union University, Beijing 100101, China
*
Author to whom correspondence should be addressed.
Appl. Sci. 2024, 14(7), 2893; https://doi.org/10.3390/app14072893
Submission received: 29 February 2024 / Revised: 27 March 2024 / Accepted: 28 March 2024 / Published: 29 March 2024
(This article belongs to the Topic Advances in Artificial Neural Networks)

Abstract

:
There are many time series forecasting methods, but there are few research methods for long-term multivariate time series forecasting, which are mainly dominated by a series of forecasting models developed on the basis of a transformer. The aim of this study is to perform forecasting for multivariate time series data and to improve the forecasting accuracy of the model. In the recent past, it has appeared that the prediction effect of linear models surpasses that of the family of self-attention mechanism models, which encourages us to look for new methods to solve the problem of long-term multivariate time series forecasting. In order to overcome the problem that the temporal order of information is easily broken in the self-attention family and that it is difficult to capture information on long-distance data using recurrent neural network models, we propose a matrix attention mechanism, which is able to weight each previous data point equally without breaking the temporal order of the data, so that the overall data information can be fully utilized. We used the matrix attention mechanism as the basic module to construct the frequency domain block and time domain block. Since complex and variable seasonal component features are difficult to capture in the time domain, mapping them to the frequency domain reduces the complexity of the seasonal components themselves and facilitates data feature extraction. Therefore, we use the frequency domain block to extract the seasonal information with high randomness and poor regularity to help the model capture the local dynamics. The time domain block is used to extract the smooth floating trend component information to help the model capture long-term change patterns. This also improves the overall prediction performance of the model. It is experimentally demonstrated that our model achieves the best prediction results on three public datasets and one private dataset.

1. Introduction

Time series forecasting is used to predict the development of future time series data based on the original time series data. Time series forecasting has been used in transportation [1,2], stocks [3,4], electricity [5,6], weather [7], disease prevention [8], tidal changes [9], inventory management [10], etc., which reflects its impact in various fields, such as industry, commerce, and healthcare. Compared to short-term time series forecasting and univariate time series forecasting, long-term multivariate time series forecasting is the most comprehensive form.
Long-term multivariate time series forecasting has several difficulties. First, the longer the forecast length, the less the dependence of the forecast results on the characteristics of the input series. Second, in short-term forecasting, only the changes in the next few steps need to be predicted, while long-term forecasting requires the model to be able to control the cyclical change pattern of the time series. Third, the larger the prediction length, the more errors the model accumulates in its computation, and the more difficult the prediction becomes. Long and short-term memory networks [11], as classical models for time series forecasting, focus their forecasting goals on short-term forecasting. Due to the computational complexity of long and short-term memory networks and the need for information from the previous step for the next step, it is easy to have the problem of gradient disappearance or gradient explosion, which is not suitable for long-term prediction. The TCN model [12] consists of inflated causal convolution and a residual structure, and it is easy to lose a large amount of information with inflated convolution, which leads to a poorer prediction accuracy. However, with the proposal of a transformer [13], a series of models for long-term multivariate time series prediction began to emerge, and the problem of long-term time series prediction was gradually solved. On the basis of the self-attention mechanism, this evolution has produced a variety of different attention mechanisms, including ProbSparse self-attention [14], the Auto-Correlation Mechanism [15], and Frequency-Enhanced Attention with the Fourier Transform (FEA-f) [16]. The self-attention mechanism was originally proposed for natural language processing (NLP), which is effective for semantically rich NLP problems, but the temporal information contained in time series data is easily corrupted when using the self-attention mechanism. The good prediction results of the DLinear model [17] beat all models based on the self-attention family before FEDformer [16]. This confirms that in addition to using the self-attention mechanism to build the model, some other methods are also effective for long-term multivariate time series forecasting.
In order to overcome the drawbacks of a high computational complexity and the lack of global consistency associated with self-attentive mechanisms, we therefore try to seek a breakthrough with a new methodology. Consider that time series are used to predict future changes in time series data using past time series data. We consider the data at a future point in time as the result of weighting the past time series and thus propose a matrix attention mechanism. The superiority of the matrix attention mechanism is verified in ablation experiments by comparing it with other self-attention families. The main contributions of our work are as follows.
First, we propose a matrix attention mechanism. This attention mechanism will weight the previous data equally for prediction, which solves the problem that recurrent neural networks find it difficult to extract long distance information. This avoids the destruction of temporal information and simplifies the computational complexity compared to self-attentive families.
Second, we design a frequency domain block to extract data features with high randomness and volatility and a time domain block to extract the overall trend change in the time series. Together, the two constitute our forecasting model.
Third, we validate the accuracy of our model using three public datasets and one private dataset. It is demonstrated experimentally that our model achieves the best prediction results on all four datasets. The superiority of the matrix attention mechanism and the superiority of our model architecture are also demonstrated in the ablation experiments.
The rest of the paper is organized as follows. Section 2 describes the related work. Section 3 describes in detail the matrix attention mechanism model based on the time and frequency domains. Section 4 describes the experimental procedure and results. Section 5 summarizes the paper.

2. Related Work

The methods for time series forecasting include regression-based models [18,19,20,21], recurrent-neural-network-based models [11,22], convolution-based models [12,23], models based on a family of self-attention mechanisms [13,14,15,16], and others.
The recurrent neural networks used for prediction are mainly modeled as long and short-term memory networks [11] and gated recurrent units [22]. Recurrent neural networks are prone to the problem of gradient vanishing or gradient explosion because the next operation requires the result of the previous step. Long and short-term memory networks are structured with input gates, forgetting gates, and output gates, which have a higher prediction accuracy but a longer prediction time due to their computational complexity. The gated recurrent unit only exists the update gate and reset gate, which is simpler in structure, with fewer parameters and faster computation, but the gated recurrent unit reduces the prediction accuracy due to the reduced computation. In addition, time series prediction using convolution is also a major direction of current development. The TCN model [12] is designed with inflated causal convolution, which can parallelize the data to speed up the model computing speed, but this data processing is still for one-dimensional data, which can not extract the features that exist between the data. Due to the various shortcomings of the above models, short-term forecasting has mainly been performed in previous studies.
With the proposal of a transformer [13], the self-attention mechanism has received a lot of attention, and many time series prediction models have been generated around the self-attention mechanism, which are able to extract the long-term trend changes in and local dynamics of data features and show superior capabilities in long-term multivariate time series prediction. For example, Liu Shizhan et al. [24] proposed a pyramid attention module based on the self-attention mechanism, which enhances the model to capture the dependencies between long sequences and reduces the memory consumption and forecasting time cost. Zhou Haoyi et al. [14] designed ProbSparse self-attention and used convolution and pooling to dramatically reduce the computational effort of the model and improve the computational efficiency of the model while also capturing the long-term change patterns of the data. Wu Haixu et al. [15] designed the Auto-Correlation Mechanism on the basis of the self-attention mechanism, which involves the decomposition of the structure in the decoder to divide time series into seasonal components and trend components, which increases the data information, allows the model to extract the trend changes in the original data, and strengthens the stability of the model for long-term forecasting. Zhou Tian et al. [16] designed Frequency-Enhanced Attention with the Fourier Transform and Frequency-Enhanced Attention with the Wavelet Transform by mapping the time domain data to the frequency domain to explore the long-term change patterns in time series by extracting the frequency information. However, Zeng Ailing et al. [17] designed a DLinear model with a linear structure to outperform the prediction accuracy of a prediction model based on a family of self-attention mechanisms on several publicly available datasets. This confirms that simple linear models can also achieve excellent prediction results in long-term multivariate time series forecasting. The DLinear model divides the raw data into trend and seasonal components, then the forecast components are obtained using two simple linear layers, respectively, and the forecast components are fused to obtain the final forecast. This inspires us to explore the time series forecasting problem from a new perspective.
Currently, most of the models make predictions from the perspective of the time domain, but for complex and volatile data, mapping them to the frequency domain can reduce the complexity of the data, which is conducive to data feature extraction. Zheng Kaihong et al. [25] used the Fourier transform to design a frequency-domain-based encoder structure, which integrates multi-scale information to discover the frequency features and integrates the frequency domain features with the time domain features so that the extracted features are more comprehensive. Shao Xiaorui et al. [26] used a discrete wavelet transform to obtain the frequency domain data, extracted the features of the time domain and frequency domain data using a convolutional neural network, and finally used a long and short-term memory network to make predictions. Yang Zhangjing et al. [27] divided the time series into period components and trend components, extracted the period features in the frequency domain, extracted the trend features in the time domain, and finally fused the two features to obtain the final prediction results. Long Lifan et al. [28] mapped the data to the frequency domain using a wavelet transform and used the NSNP system to make a single-step prediction. Although the above researchers have achieved good results by performing feature extraction on the time–frequency dual domain for prediction, the work carried out was mainly for short-term prediction, with the help of existing models, and our model brings this time–frequency dual-domain feature extraction approach to long-term prediction.

3. A Matrix Attention Model Based on the Time and Frequency Domains

3.1. Problem Definition

We are given a set of multivariate time series data X n = x 1 1 , x 2 1 , , x n 1 x 1 2 , x 2 2 , , x n 2 , , , x 1 m , x 2 m , x n m of length n. In this, m represents the mth multivariate variable, n represents the length of the data, and · represents a set of data. A multivariate time series can be viewed as a combination of multiple univariate time series. Multivariate time series forecasting refers to the use of previously known multivariate time series data X c to predict unknown future multivariate time series data Y o . In this, c represents the input length, and o represents the predicted length. Long-term multivariate time series forecasting is encouraged to have a longer output length o than in previous work [14,22,29]. This can be expressed using Equation (1).
Y o = F X c ,
F ( · ) represents the mapping relationship between X c and Y o learned by the model.

3.2. The Overall Model Architecture

The overall architecture of our model is shown in Figure 1. First, we borrowed the decomposition structure from the Autoformer model [15]. We decompose the time series data into seasonal and trend components using Equation (2). Since it is difficult to capture complex and variable seasonal component features in the time domain, mapping them to the frequency domain reduces the complexity of the seasonal components themselves and facilitates the extraction of the data features. Therefore, we utilize frequency domain blocks to extract seasonal information with high stochasticity and poor regularity to help the model capture local dynamics. The time domain block is utilized to extract smooth floating trend component information to help the model capture the long-term change patterns.
X t = A v g P o o l p a d d i n g X , X s = X X t ,
X t represents the trend term, X s represents the seasonal term, X is the original data, and A v g P o o l · is the average pooling operation performed. We designed a frequency domain block to extract the seasonal component features and a time domain block to extract the trend component features and finally fused the output of the two extracted features as the final prediction result.

3.2.1. The Frequency Domain Block

The function of the frequency domain block is to extract the seasonal information for prediction from the perspective of the frequency domain, and the frequency domain block consists of a frequency domain encoder and a frequency domain decoder. The purpose of the frequency domain encoder is to take the time domain sequence information through linear layer mapping and the discrete Fourier transform and then save it in the frequency domain sequence. The role of linear mapping is to save a time series X c s of length c in a time series X n s of length n. The process of linear mapping is described using Equation (3).
X n s = l i n e a r ( X c s ) , 0 < n c ,
An alternative representation of X n s is X n s = x 1 , x 2 , , x n s .
The discrete Fourier transform maps the sequence from the time domain to the frequency domain. The frequency domain sequence information parses the time series from another perspective, thus extracting features of the data that cannot be extracted in the time domain sequence. The process is shown in Equation (4).
W n s = D F T X n s = t = 1 n x t H n t k ,
where H n = e j 2 π n , D F T · is the discrete Fourier transform, W n s is the frequency domain sequence of the seasonal terms, X n s is the time domain sequence of the seasonal terms, n is the length of the sequence, k is the harmonic number, and t represents the time.
W n s in the discrete Fourier transform is usually expressed as a complex number: W n s = R n s + j I n s . We divide the seasonal term frequency domain sequence W n s into two real sequences R n s and I n s , which, after going through the matrix attention layer and the activation function, are again turned into a new frequency domain sequence W n s . This process can be expressed using Equation (5):
R n s , I n s = σ M A A T T R n s , σ M A A T T R n s , W n s = C o m p l e x R n s , I n s ,
σ is the activation function, MAATT is the matrix attention mechanism, and C o m p l e x ( · ) represents the construction of new complex numbers.
The purpose of the frequency domain decoder is to transform the newly composed frequency domain sequence back into the time domain using discrete Fourier inversion to obtain a new time domain sequence X n s , which is then mapped through a layer of linear mapping to obtain the frequency domain block output. The computational procedure is shown in Equation (6).
X n s = I D F T W n s = 1 n k = 1 n w k H n t k , Y o s = l i n e a r ( X n s ) ,
I D F T · is the inverse discrete Fourier transform. Y o s is the frequency domain block output.

3.2.2. The Time Domain Block

The time domain block is for trend feature extraction. We utilize the matrix attention mechanism for the encoding operation, and the residual structure is added to ensure the integrity of the data. The whole computational process of the time domain encoder is shown in Equation (7):
X n t = l i n e a r M A A T T σ M A A T T X n t + X n t ,
X n t represents the trend component of the original time series, and X n t is the result obtained after the time domain encoder.
After passing it through the time domain encoder, the final result of the time domain block prediction is obtained using the time domain decoder in Equation (8):
Y o t = l i n e a r σ M A A T T X n t .

3.2.3. Fusion Block

When the sequence passes through the time domain block and the frequency domain block, respectively, it produces Y o t and Y o s . Y o t is the prediction result obtained by extracting the trend features from the time domain point of view, and Y o s is the prediction result obtained by extracting the seasonal term features from the frequency domain point of view. In order to make the final prediction result better, we weight the two prediction results separately to obtain the final prediction result. The calculation process in the fusion block is as it is in Equation (9).
Y o = v t Y o t + v s Y o s .

3.3. The Matrix Attention Mechanism

The matrix attention mechanism is an attention mechanism we propose for time series prediction, which determines the weight relationship that exists between the past data and the current data by weighting the past time series data. The matrix attention mechanism is calculated as shown in Equation (10). The matrix attention mechanism is divided into two versions: the independent matrix attention mechanism and the Merge Matrix Attention Mechanism.
E l = M A A T T X n = X n U n l ,
where U n l is a matrix that can be parameter-updated for behavior n, column l. E l is the output of the matrix attention mechanism.

3.3.1. Independent Matrix Attention Mechanism

We view a multivariate time series as consisting of multiple univariate time series. That is, the multivariate time series can be split into multiple univariate time series. Each component series in the multivariate is weighted using an independent matrix. For example, a variable a of length n in a multivariate can be represented as a row matrix X n , a = x 1 a , x 2 a , , x n a , which corresponds to a weight matrix U n l , a = u 11 a , u 12 a , , u 1 l a u 21 a , u 22 a , , u 2 l a , , , u n 1 a , u n 2 a , , u n l a . The output of the independent matrix attention mechanism is a row matrix E l , a = e 1 a , e 2 a , , e l a of length l. The specific calculations are shown in Equation (11):
E l , a = M A A T T X n , a   = X n , a U n l , a .
The other variables in the multivariate are calculated in a similar way. Figure 2 visualizes the whole calculation process, where m represents the number of multivariates.

3.3.2. Merge Matrix Attention Mechanism

On the basis of the independent matrix attention mechanism, we have another similar but different conceptualization. We can consider the multivariate time series data as a whole, and the linear and nonlinear variations that exist between the time series of each variable of that whole are interrelated. Therefore, the multivariate time series data can be computed by sharing the same weight matrix U n l , as shown in Figure 3. All the data in the variable a are computed in the merge matrix attention mechanism as shown in Equation (12):
E l , a = M A A T T ( X n , a ) = X n , a U n l
The attention of the other variables is obtained in the same way.

4. Experiments

4.1. Datasets

In the experimental part, we mainly validate our model using three public datasets and one private dataset. The three public datasets are called Electricity, Weather, and ETTh2, and the private dataset is named BCAT. The Electricity dataset collated the electricity consumption from 2012 to 2014 of 321 customers; the Weather dataset contains 21 weather metrics such as temperature and humidity; the ETTh2 dataset contains six load features and one oil temperature feature, recording two years of data from July 2016 to July 2018; BCAT is a taxi parking lot departure statistics dataset from Beijing Capital International Airport, where the statistics interface records the number of taxis leaving the parking lot every half hour. BCAT recorded the departure data of the terminal taxi parking lot from 25 August 2022 to 31 December 2022, totaling 6600 items. A portion of the BCAT dataset is shown in Figure 4. Detailed descriptions of the four datasets are shown in Table 1.

4.2. Baselines and Setup

Our selection of baseline models includes several of the best models developed based on transformers, such as FEDformer, Autoformer, Informer, Pyraformer, and a linear model called DLinear. Due to the high predictive performance of the DLinear model, we have made it the focus of our comparison. In the public dataset, all the models are compared with the results from the DLinear article. On the BCAT dataset, we conduct experiments with the model’s default parameters. We set the ratio of training, testing, and validation sets to 7:1:2. We use MSE and MAE as the training metrics.

4.3. Our Model and Implementation Details

The overall architecture of our model is shown in Figure 1. Due to the difference between the independent matrix attention mechanism and the merged matrix attention mechanism, the experimental model is divided into two versions: the merged matrix attention mechanism version M-MAMFT and the independent matrix attention mechanism version I-MAMFT. We set the number of layers of the encoder (including the frequency domain encoder and time domain encoder) and decoder (including the frequency domain decoder and time domain decoder) to 1. The look-back window c of our model is set to 720. The parameter n is set to 192, and the parameter l = n. We use the cosine-decaying learning rate and set the initial learning rate differently for different datasets, and the specific learning rate settings are shown in Table 2. The Dropout is set to 0.1. We use MSE and MAE as the loss functions and optimize using the Adam optimizer. The smaller the value of the MSE and MAE, the better.

4.4. Comparison of the Results with State-of-the-Art Models

M-MAMFT achieves the best prediction accuracy on all three publicly available datasets, and the specific experimental results are shown in Table 3. The most significant improvement in prediction accuracy is achieved on the ETTh2 dataset. Compared with the DLinear prediction results, the MSE and MAE metrics of the M-MAMFT model decreased by an average of 47.6% and 24.6% from a prediction length of 96 to a prediction length of 720, respectively. In addition, the decrease in the values of the MSE and MAE increases as the prediction length increases, and the most significant decrease ratios are when the prediction length is 720, where the MSE and MAE decrease by 56.1% and 31.2%.
Compared with the Dlinear model, the prediction accuracy of M-MAMFT on the Electricity dataset and the Weather dataset is greatly improved. In the prediction of the Electricity dataset, the prediction results of the M-MAMFT model, compared with those of the Dlinear model, show the most significant improvement in prediction per-formance when the prediction length is 96, with the MSE and MAE decreasing by 8.6% and 5.1%, respectively; and from a prediction length of 96 to a prediction length of 720, the MSE and MAE decrease on average by 4.9% and 2.7%, respectively. In the predic-tion of the Weather dataset, the predictions of the M-MAMFT model showed an aver-age reduction of 8.4% and 8.5% in MSE and MAE, respectively, when compared to the predictions of the Dlinear model; the maximum reduction in MSE and MAE was 14.2% and 11.8%, respectively, at a prediction length of 96.
Our model also achieved the best prediction results on the BCAT dataset. Because there is only one variable in the BCAT dataset, the predictions of the two model versions, M-MAMFT and I-MAMFT, are consistent. When the prediction length is 96–720, the MSE and MAE of our model are on average 0.8% and 1.7% lower than the optimal results of the other models. Although there is only a small advantage on the BCAT dataset, it still demonstrates the superiority of our model’s prediction performance.

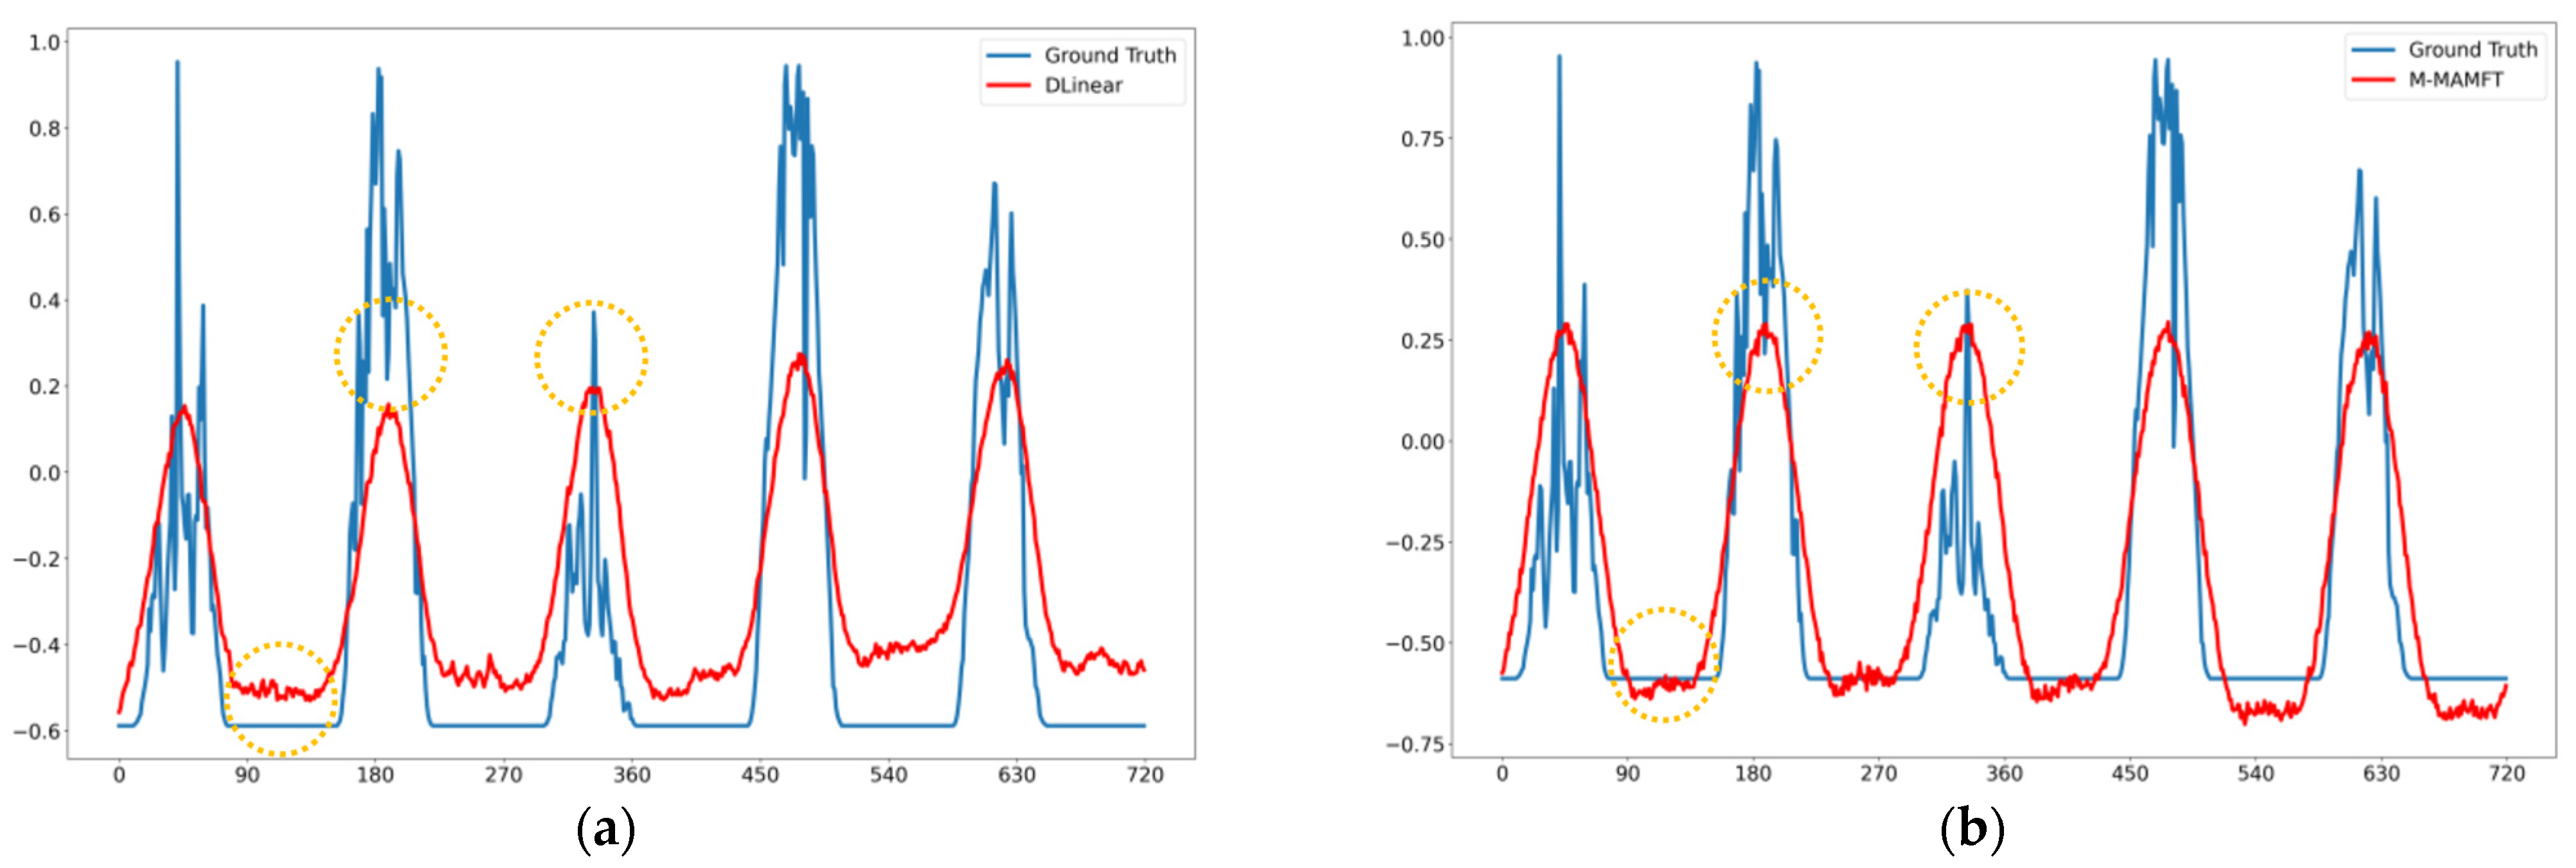
4.5. Visual Analysis

We compare and analyze the predicted data in graphical form. In both the Electricity dataset and the ETTh2 dataset, some of the data exhibit strong periodicity with frequent changes. In Figure 5, the green box represents the long-term change pattern, and the yellow circles represent the local change patterns. It can be seen that in the Electricity dataset, the prediction results of M-MAMFT compared to DLinear are similar for the long-term change pattern; however, for the local change pattern, the prediction results of M-MAMFT are closer to the true values. This also proves that the performance of the model we built is superior. As shown in Figure 6 in the prediction results of M-MAMFT on the ETTh2 dataset, compared with DLinear, M-MAMFT better captures the long-term change patterns in the data, the deviation in the local change patterns is smaller, the predicted data are closer to the overall trend in the real data, and the overall prediction performance is much better than that of DLinear. As shown in Figure 7, we use violin plots to observe the distribution of the overall prediction results and the location of the median for both the Electricity dataset and the ETTh2 dataset. The prediction results of M-MAMFT are closer to the distribution of the true values as compared to the prediction results of DLinear.
The cyclical variation in the Weather data is different from that in the previous two datasets in that the periodicity is high but the frequency of change is low. As shown in Figure 8, both the M-MAMFT model and the DLinear model can capture the changing patterns in the data. However, through the local variation pattern in the yellow box, we can conclude that the M-MAMFT model’s prediction is closer to the true value.
As shown in Figure 9, the BCAT data exhibit periodicity in their oscillatory changes. In the BCAT data, we can observe that both the DLinear model and the M-MAMFT model capture the periodicity of the data, and the pattern of ups and downs in the long-term change pattern is consistent. However, in the local change pattern, the DLinear model predicts stronger oscillatory ups and downs, while the M-MAMFT model predicts smoother values, which makes the overall prediction results of M-MAMFT closer to the real values. As shown in the violin plots in Figure 10, the prediction results of M-MAMFT on the Weather dataset and the BCAT dataset are closer to the true values than those of DLinear.

4.6. Ablation Studies

In the ablation study, we performed the model testing itself using two ablation studies. The first was to conduct an ablation study of the model architecture, as shown in Table 4. The second was to conduct an ablation study of the attention mechanism to test the superiority of the matrix attention mechanism by replacing different attention mechanisms into the model architecture, as shown in Table 5.
We verify the advantage of our model structure by removing some of the structures in M-MAMFT, and the specific model structure ablation study is shown in Table 4. When only the time domain block is retained, the prediction performance of the three datasets shows a small decrease. When only the frequency domain block is retained, the prediction performance of the three datasets is poor. The effect of the feature reconstruction on the overall prediction performance of the model is verified by removing the real feature reconstruction part and the imaginary feature reconstruction part from the frequency domain block. When removing the real feature reconstruction part and the imaginary feature recon-struction part separately, the prediction results become progressively worse as the pre-diction length increases in the ETTh2 dataset. In the Weather dataset, removing the re-al feature reconstruction part and the imaginary feature reconstruction part separately has a smaller effect on the prediction results. The overall prediction performance in the BCAT dataset is poorer when both the real and imaginary part operations are removed separately.
In Table 5, we compare the prediction accuracy of the three datasets under the same model architecture with different attention mechanisms. We replace the matrix attention mechanism in the M-MAMFT model with several different attention mechanisms, such as FEA-f, to verify the superiority of matrix attention. Compared with the other attention mechanisms, the model with the matrix attention mechanism achieves the best prediction results, proving the effectiveness of our proposed matrix attention mechanism. Meanwhile, different attention mechanisms applied in our model architecture also surpass the prediction results of most of the models in Table 3, which also proves the advantage of our model architecture.

5. Conclusions

We adopted the idea of seasonal trend decomposition for long-term multivariate time series forecasting to decompose the complex and variable time series data into seasonal terms and trend terms. We proposed a matrix attention mechanism, used it as a base module to build a frequency domain block and a time domain block for extracting the seasonal and trend term information, and constructed a time–frequency dual-domain model. After converting seasonal information with poor regularity into the frequency domain, it is beneficial to extract useful information to assist in prediction. Therefore, the seasonal information was feature-extracted using the frequency domain block, while the trend information was feature-extracted using the time domain block. We used three public datasets and one private dataset for the experimental demonstration, and in the comparison experiments, the M-MAMFT model achieved the best prediction results in comparison with other models, which proved the effectiveness of our model architecture. In the visual analysis, we graphically analyzed the difference between the prediction results of the M-MAMFT model and the prediction results of the other models, proving the ability of the M-MAMFT model to better capture the information from the data. In the ablation experiments, the superior performance of our model architecture was verified, as well as the superior performance of the matrix attention mechanism over other self-attention families. At the same time, they further proved that in addition to the models built from the family of self-attention mechanisms, which can achieve a high accuracy in long-term time series prediction, some other methods can also achieve the same or even better prediction results.

Author Contributions

Conceptualization: K.G.; methodology: K.G.; conducting experiments: K.G. and X.Y.; writing—original draft preparation: K.G.; writing—review and editing: K.G. and X.Y.; supervision: X.Y. All authors have read and agreed to the published version of the manuscript.

Funding

This research was supported by the Academic Research Projects of Beijing Union University (No. ZK80202103).

Institutional Review Board Statement

Not applicable.

Informed Consent Statement

Not applicable.

Data Availability Statement

The data presented in this study are available on request from the corresponding author due to privacy.

Conflicts of Interest

The authors declare no conflicts of interest.

References

  1. Qi, X.; Mei, G.; Tu, J.; Xi, N.; Francesco, P. A deep learning approach for long-term traffic flow prediction with multifactor fusion using spatiotemporal graph convolutional network. IEEE Trans. Intell. Transp. Syst. 2022, 24, 8687–8700. [Google Scholar] [CrossRef]
  2. Guo, K.; Yu, X.; Liu, G.; Tang, S. A Long-Term Traffic Flow Prediction Model Based on Variational Mode Decomposition and Auto-Correlation Mechanism. Appl. Sci. 2023, 13, 7139. [Google Scholar] [CrossRef]
  3. Sen, J.; Mehtab, S. Long-and-Short-Term Memory (LSTM) NetworksArchitectures and Applications in Stock Price Prediction. In Emerging Computing Paradigms: Principles, Advances and Applications; Wiley Online Library: Hoboken, NJ, USA, 2022; pp. 143–160. [Google Scholar]
  4. Patra, G.R.; Mohanty, M.N. An LSTM-GRU based hybrid framework for secured stock price prediction. J. Stat. Manag. Syst. 2022, 25, 1491–1499. [Google Scholar] [CrossRef]
  5. Torres, J.F.; Martínez-Álvarez, F.; Troncoso, A. A deep LSTM network for the Spanish electricity consumption forecasting. Neural Comput. Appl. 2022, 34, 10533–10545. [Google Scholar] [CrossRef] [PubMed]
  6. Moradzadeh, A.; Moayyed, H.; Zare, K.; Mohammadi-Ivatloo, B. Short-term electricity demand forecasting via variational autoencoders and batch training-based bidirectional long short-term memory. Sustain. Energy Technol. Assess. 2022, 52, 102209. [Google Scholar] [CrossRef]
  7. Hess, P.; Boers, N. Deep learning for improving numerical weather prediction of heavy rainfall. Geosci. Model Dev. 2022, 14, e2021MS002765. [Google Scholar] [CrossRef]
  8. Djerioui, M.; Brik, Y.; Ladjal, M.; Attallah, B. Heart Disease prediction using MLP and LSTM models. In Proceedings of the 2020 International Con-ference on Electrical Engineering (ICEE), Istanbul, Turkey, 25–27 September 2020; pp. 1–5. [Google Scholar]
  9. Di, N.; De, M.; Gargano, R.; Granata, F. Tide prediction in the Venice Lagoon using nonlinear autoregressive exogenous (NARX) neural network. Water 2021, 13, 1173. [Google Scholar] [CrossRef]
  10. Zhou, Q.; Han, R.; Li, T.; Xia, B. Joint prediction of time series data in inventory management. Knowl. Inf. Syst. 2019, 61, 905–929. [Google Scholar] [CrossRef]
  11. Hochreiter, S.; Schmidhuber, J. Long short-term memory. Neural Comput. 1997, 9, 1735–1780. [Google Scholar] [CrossRef]
  12. Bai, S.; Kolter, J.; Koltun, V. An empirical evaluation of generic convolutional and recurrent networks for sequence modeling. arXiv 2018, arXiv:1803.01271. [Google Scholar]
  13. Vaswani, A.; Shazeer, N.; Parmar, N.; Parmar, N.; Uszkoreit, J.; Jones, L.; Gomez, A.N.; Kaiser, L.; Polosukhin, I. Attention is all you need. In Proceedings of the Advances in Neural Information Processing Systems 30 (NIPS 2017), Long Beach, CA, USA, 4–9 December 2017; p. 30. [Google Scholar]
  14. Zhou, H.; Zhang, S.; Peng, J.; Zhang, S.; Li, J.; Xiong, H.; Zhang, W. Informer: Beyond effificient transformer for long sequence time-series forecasting. Proc. AAAI Conf. Artif. Intell. 2021, 35, 11106–11115. [Google Scholar] [CrossRef]
  15. Wu, H.; Xu, J.; Wang, J.; Long, M. Autoformer: Decomposition transformers with auto-correlation for long-term series forecasting. Adv. Neural Inf. Process. Syst. 2021, 34, 22419–22430. [Google Scholar]
  16. Zhou, T.; Ma, Z.; Wen, Q.; Wang, X.; Sun, L.; Jin, R. Fedformer: Frequency enhanced decomposed transformer for long-term series forecasting. In Proceedings of the 39th International Conference on Machine Learning, Baltimore, MD, USA, 17–23 July 2022; PMLR 162; pp. 27268–27286. [Google Scholar]
  17. Zeng, A.; Chen, M.; Zhang, L.; Xu, Q. Are transformers effective for time series forecasting? Proc. AAAI Conf. Artif. Intell. 2023, 37, 11121–11128. [Google Scholar] [CrossRef]
  18. Abonazel, M.R.; Abd-Elftah, A.I. Forecasting Egyptian GDP using ARIMA models. Rep. Econ. Financ. 2019, 5, 35–47. [Google Scholar] [CrossRef]
  19. Chen, Y.; Xu, P.; Chu, Y.; Li, W.; Wu, Y.; Ni, L.; Bao, Y.; Wang, K. Short-term electrical load forecasting using the Support Vector Regression (SVR) model to calculate the demand response baseline for office buildings. Appl. Energy 2017, 195, 659–670. [Google Scholar] [CrossRef]
  20. Martínez, F.; Frías, M.P.; Pérez, M.D.; Rivera, A.J. A methodology for applying k-nearest neighbor to time series forecasting. Artif. Intell. Rev. 2019, 52, 2019–2037. [Google Scholar] [CrossRef]
  21. Nguyen-Huynh, L.; Vo-Van, T. A new fuzzy time series forecasting model based on clustering technique and normal fuzzy function. Knowl. Inf. Syst. 2023, 65, 3489–3509. [Google Scholar] [CrossRef]
  22. Cho, K.; Van Merrienboer, B.; Bahdanau, D.; Bengio, Y. On the properties of neural machine translation: Encoder-decoder approaches. arXiv 2014, arXiv:1409.1259. [Google Scholar]
  23. Wu, H.; Hu, T.; Liu, Y.; Zhou, H.; Wang, J.; Long, M. Timesnet: Temporal 2d-variation modeling for general time series analysis. arXiv 2022, arXiv:2210.02186. [Google Scholar]
  24. Liu, S.; Yu, H.; Liao, C.; Li, J.; Lin, W.; Liu, A.; Dustdar, S. Pyraformer: Low-complexity pyramidal attention for long-range time series modeling and forecasting. In Proceedings of the International Conference on Learning Representations, Vienna, Austria, 4 May 2021. [Google Scholar]
  25. Zheng, K.; Li, P.; Zhou, S.; Zhang, W.; Li, S.; Zeng, L.; Zhang, Y. A multi-scale electricity consumption prediction algorithm based on time-frequency variational autoencoder. IEEE Access 2021, 9, 90937–90946. [Google Scholar] [CrossRef]
  26. Shao, X.; Pu, C.; Zhang, Y.; Kim, C.S. Domain fusion CNN-LSTM for short-term power consumption forecasting. IEEE Access 2020, 8, 188352–188362. [Google Scholar] [CrossRef]
  27. Yang, Z.; Yan, W.-W.; Huang, X.; Mei, L. Adaptive temporal-frequency network for time-series forecasting. IEEE Trans. Knowl. Data Eng. 2020, 34, 1576–1587. [Google Scholar] [CrossRef]
  28. Long, L.; Liu, Q.; Peng, H.; Yang, Q.; Luo, X.; Wang, J.; Song, X. A time series forecasting approach based on nonlinear spiking neural systems. Int. J. Neural Syst. 2022, 32, 2250020. [Google Scholar] [CrossRef] [PubMed]
  29. Sutskever, I.; Vinyals, O.; Le, Q. Sequence to sequence learning with neural networks. In Proceedings of the Advances in Neural Information Processing Systems 27 (NIPS 2014), Montreal, QC, Canada, 8–13 December 2014; p. 27. [Google Scholar]
Figure 1. MAMFT architecture.
Applsci 14 02893 g001
Figure 2. Calculation process of independent matrix attention mechanism.
Applsci 14 02893 g002
Figure 3. Calculation process of the merge matrix attention mechanism.
Applsci 14 02893 g003
Figure 4. Selected data from the BCAT dataset.
Applsci 14 02893 g004
Figure 5. (a) Comparison of DLinear prediction results with ground truth for a prediction length of 720 for the Electricity dataset; (b) comparison of M-MAMFT prediction results with ground truth for a prediction length of 720 for the Electricity dataset.
Applsci 14 02893 g005
Figure 6. (a) Comparison of DLinear prediction results with ground truth for a prediction length of 720 for the ETTh2 dataset; (b) comparison of M-MAMFT prediction results with ground truth for a prediction length of 720 for the ETTh2 dataset.
Applsci 14 02893 g006
Figure 7. (a) Violin plots with a forecast length of 720 of Electricity dataset; (b) violin plots with a forecast length of 720 of ETTh2 dataset.
Applsci 14 02893 g007
Figure 8. (a) Comparison of DLinear prediction results with ground truth for a prediction length of 720 for the Weather dataset; (b) comparison of M-MAMFT prediction results with ground truth for a prediction length of 720 for the Weather dataset.
Applsci 14 02893 g008
Figure 9. (a) Comparison of DLinear prediction results with ground truth for a prediction length of 336 for the BCAT dataset; (b) comparison of M-MAMFT prediction results with ground truth for a prediction length of 336 for the BCAT dataset.
Applsci 14 02893 g009
Figure 10. (a) Violin plots with a prediction length of 720 of the Weather dataset; (b) violin plots with a prediction length of 96 of the BCAT dataset.
Applsci 14 02893 g010
Table 1. Information description of the four datasets.
DatasetsElectricityWeatherETTh2BCAT
Variables3212171
Timesteps26,30452,69617,4206600
Frequency1 h10 min1 h30 min
Table 2. Initial learning rate settings for the four datasets.
DatasetElectricityWeatherETTh2BCAT
Initial learning rate0.0020.00010.00010.0005
Table 3. Comparison of experimental results with other advanced models.
ModelsM-MAMFTI-MAMFTDLinearFEDformerAutoformerInformerPyraformer
MetricMSEMAEMSEMAEMSEMAEMSEMAEMSEMAEMSEMAEMSEMAE
Electricity960.1280.2250.1560.2610.1400.2370.1930.3080.2010.3170.2740.3680.3860.449
1920.1470.2450.1800.2870.1530.2490.2010.3150.2220.3340.2960.3860.3860.443
3360.1620.2610.2060.3070.1690.2670.2140.3290.2310.3380.3000.3940.3780.443
7200.1970.2960.2220.3270.2030.3010.2460.3550.2540.3610.3730.4390.3760.445
Weather960.1510.2090.1470.2120.1760.2370.2170.2960.2660.3360.3000.3840.8960.556
1920.2020.2590.1940.2590.2200.2820.2760.3360.3070.3670.5980.5440.6220.624
3360.2470.2930.2440.3000.2650.3190.3390.3800.3590.3950.5780.5230.7390.753
7200.3100.3410.3210.3550.3230.3620.4030.4280.4190.4281.0590.7411.0040.934
ETTh2960.1760.2930.2160.3330.2890.3530.3460.3880.3580.3973.7551.5250.6450.597
1920.2080.3230.2580.3640.3830.4180.4290.4390.4560.4525.6021.9310.7880.683
3360.2260.3370.2900.3980.4480.4650.4960.4870.4820.4864.7211.8350.9070.747
7200.2660.3790.3930.4650.6050.5510.4630.4740.5150.5113.6471.6250.9630.783
BCAT960.2900.3620.2900.3620.2970.3730.2970.3940.2900.3770.3100.3660.3010.373
1920.3130.3790.3130.3790.3240.3890.3140.4020.3420.4200.3670.3840.3270.388
3360.3300.3890.3300.3890.3400.4020.3360.4220.4100.4690.4440.4380.3550.409
7200.3590.4120.3590.4120.3630.4160.4080.4660.3900.4670.5220.4530.3750.421
Table 4. Model structural ablation studies.
ModelsMetricETTh2WeatherBCAT
961923367209619233672096192336720
M-MAMFTMSE0.1760.2080.2270.2660.1510.2020.2470.3100.2900.3130.3300.378
MAE0.2930.3230.3370.3790.2090.2590.2960.3410.3620.3790.3890.417
only-TMSE0.2000.2130.2580.2860.1560.2080.2500.3190.3150.3260.3340.429
MAE0.3180.3260.3620.3910.2120.2610.2970.3540.3780.3890.3920.418
only-FMSE0.8050.9361.0101.1590.3940.4290.4410.4780.3230.3590.3720.413
MAE0.6900.7430.7700.8400.4420.4730.4810.5110.3790.3930.4000.420
NO-ImagMSE0.1790.2090.2490.3090.1510.2040.2520.3130.3020.3400.3600.401
MAE0.2960.3290.3590.4220.2100.2600.3040.3530.3740.4140.4240.423
NO-RealMSE0.1770.2140.2280.2910.1530.2070.2530.3110.3040.3440.3570.430
MAE0.2940.3320.3460.4090.2090.2660.3080.3440.3810.4060.4370.431
Table 5. Comparison of ablation studies with different attentional mechanisms under the same model structure.
ModelsMetricETTh2WeatherBCAT
961923367209619233672096192336720
M-MAMFTMSE0.1760.2080.2270.2660.1510.2020.2470.3100.2900.3130.3300.378
MAE0.2930.3230.3370.3790.2090.2590.2960.3410.3620.3790.3890.417
Auto-CorrelationMSE0.1930.2460.2680.3190.1530.2030.2510.3130.2980.3350.3750.400
MAE0.3140.3520.3780.4240.2090.2610.3000.3420.3640.3830.4260.420
Full-AttentionMSE0.2280.2840.2980.3630.1750.2220.2810.3380.3020.3410.3360.418
MAE0.3480.4030.4110.4420.2460.2870.3380.3850.3660.3900.3930.418
FEA-fMSE0.3300.3590.3830.4620.1600.2170.2600.3390.2990.3320.3390.406
MAE0.4380.4640.4490.5100.2450.3010.3300.4080.3710.3860.4040.429
Disclaimer/Publisher’s Note: The statements, opinions and data contained in all publications are solely those of the individual author(s) and contributor(s) and not of MDPI and/or the editor(s). MDPI and/or the editor(s) disclaim responsibility for any injury to people or property resulting from any ideas, methods, instructions or products referred to in the content.

