Article

Experimental and Theoretical Investigations of the Mechanical Behavior of Column-Free Quasi-Rectangular Segmental Tunnel Linings

1
College of Civil Engineering, Tongji University, Shanghai 200092, China
2
Technology and Application, State Grid Smart Grid Research Institute Co., Ltd., Beijing 102209, China
3
State Grid Hebei Electric Power Co., Ltd., Shijiazhuang 050081, China
*
Author to whom correspondence should be addressed.
Appl. Sci. 2024, 14(7), 2896; https://doi.org/10.3390/app14072896
Submission received: 29 February 2024 / Revised: 27 March 2024 / Accepted: 27 March 2024 / Published: 29 March 2024
(This article belongs to the Special Issue Recent Advances in Tunneling and Underground Space Technology)

Abstract

:

Featured Application

Engineering applications of non-circular segmental tunnels.

Abstract

To investigate the mechanical behavior and design methodology of column-free QRST (quasi-rectangular segmental tunnel) structures, a theoretical analysis based on prototype experiments and simulation models is conducted. Initially, a prototype experimental investigation is conducted to reveal the structural behavior at the service stage. Subsequently, the ESHR model (Equivalent Stiffness Homogeneous Ring), the BS model (Beam Spring), and the MBS model (Modified Beam Spring) are used to simulate structural behavior. For design purposes, the design methodology is explored based on the ESHR model, followed by a sensitivity analysis of several key load parameters. Based on the experimental results, weak parts of the column-free QRST structure are found to include several joints (Joint 1, Joint 5, Joint 3, and Joint 8), and corresponding optimization measures are proposed. By comparing the test results, the above-mentioned three models demonstrate their applicability in structural simulation, with the ESHR model having sufficient design accuracy. A model-based deformation mechanism analysis found that joints contribute approximately 2/3 of the structural deformation. For the structural design of the column-free QRST using the ESHR model, amplifying the calculated results of structures directly subjected to the service stage by 10% suffices to meet engineering requirements. Based on the test and study, special attention should be paid to the negative bending moment regions at the waists of the structure during both the design and service stages.

1. Introduction

As urbanization has progressed, the shield-driven method has become the preferred choice for constructing subsurface transportation networks in urban areas, including subways, highways, and pedestrian passages [1]. However, engineers and professionals in the tunneling industry currently face multifaceted challenges. These challenges encompass uncertainties in geological conditions and the complex interplay between construction parameters during the construction process [2,3], as well as unexpected situations such as fire and water leakage at the service stage [4,5]. Therefore, tunneling is increasingly becoming a research hotspot.
Conventional tunnel configurations always adopt circular cross-sections renowned for their advantageous mechanical properties and developed construction methodologies. However, circular tunnels have a low utilization rate for underground space. Another type of non-circular tunnel with a high space utilization rate, named Double-O-Tube (DOT) tunnel, has high difficulty controlling soil disturbances during the construction stage [6]. To utilize these advantages and avoid these weaknesses, tunnels with a new type of cross-section, named Quasi-rectangular tunnels, are proposed [7]. Compared to circular segmental tunnels, quasi-rectangular segmental tunnels (QRSTs) exhibit characteristics of high space utilization with strong applicability in high-density urban areas. The applicability of typical QRST structures (with columns) has been substantiated through a series of joint and structural experimental investigations [8,9], leading to successful applications of QRSTs in numerous metro projects [7].
Due to the need for transportation network planning, it is necessary to set up a crossover section in a large two-way tunnel. Consequently, during the final service stage, the original columns of QRSTs must be removed to facilitate lane changes for metro vehicles, as depicted in Figure 1. To meet these engineering requirements, engineers proposed a column-free QRST structure using steel segments as components. However, the removal of columns will significantly alter the mechanical behavior of QRST structures. Furthermore, the weak parts of these new types of structures remain unclear. To ensure the safety of the new column-free QRST structures, a comprehensive series of studies on the mechanical behavior of such structures is imperative.
In order to fully reveal the mechanical behavior of non-circular tunnels such as QRSTs, conducting experimental research is often the most direct and effective approach. Several prototype tests have been conducted for double-O-Tube tunnels (DOT tunnels) [10], rectangular tunnels [11], and quasi-rectangular tunnels [12,13], revealing the structural mechanics and enabling the determination of design parameters for these new types of non-circular tunnel structures. By conducting full-scale experiments on DOT tunnel structures, the mechanical behavior of single rings and stagger-jointed triple rings under different design states were explored, providing valuable insights for the structural design [10]. For the large-section rectangular shield tunnels utilized in the Kyoto Subway, two different types of lining structures—steel–concrete composite structures and cast–iron structures—were subjected to full-scale stagger-jointed loading tests. The distribution of internal forces and deformation of the lining structure obtained from the tests matched reasonably well with the design results, supporting the design and application of these novel types of non-circular shield tunnels [14]. Additionally, by conducting prototype structural tests, weak parts and robustness of the structure under diverse unexpected circumstances were revealed, facilitating subsequent structural optimizations. A full-scale experimental investigation of a rectangular tunnel assembled by composite segments was conducted using a “standing” prototype loading platform. The study delved into the structural mechanics of the rectangular tunnel structure under different loading conditions. A structural design optimization method was also proposed based on the elastoplastic behavior of the structure [11].
However, given the inherent limitation of physical tests to cover only specific working conditions, investigations into structural behavior under a broader range of loading scenarios necessitate the use of analytical or numerical modeling [15,16,17]. In order to determine the internal force distribution of the DOT tunnel structure, the unbalanced force transition method was combined with the force method to obtain the structural response. The applicability of the proposed method was verified through finite element (FE) numerical models and on-site experiments [18]. For DOT tunnels, the adverse effects on the structure caused by the correction process during the construction phase were investigated with the help of FE numerical models. The corresponding construction recommendations have been provided, as well [19,20]. For a special-shape shield tunnel lining, a shell-spring numerical model combined with prototype experiments was used to effectively reveal the structural behavior and stagger effect under self-weight conditions and design conditions, providing accurate design parameters [13,21]. Moreover, in practical engineering applications, designers seek assurance about the ability of simple models, such as the ESHR (equivalent stiffness homogeneous ring) model or the beam spring (BS) model, to yield simulation results with sufficient accuracy to meet design specifications. There is also a growing demand for a thorough evaluation of key design parameters [22]. On the other hand, it is worth noting that an increasing number of constructed tunnels are now exposed to environmental disturbances, such as ground surface surcharge [23,24], lateral unloading [25], top unloading [26], and adjacent construction activities [27,28]. Hence, an applicable numerical model can assist operators with evaluating structural performance when confronted with such emergencies.
Therefore, in this study, the mechanical behavior of column-free QRST structures is investigated using a combination of prototype experiments and numerical simulations. The subsequent sections of this paper are structured as follows: In Section 2, the test specimen and test setup are introduced; primary experimental results are presented and analyzed; and several optimization methods are also proposed. In Section 3, three numerical models, including the equivalent stiffness homogeneous ring model (ESHR model), beam spring model (BS model), and modified beam spring model (MBS model) are used to simulate structural behavior. A model-based hybrid analysis method is also proposed for analyzing the deformation mechanism of the column-free QRST structure. Finally, in Section 4, the design methodology is investigated using the ESHR model, taking the construction process using a temporary column into consideration. A sensitivity analysis of three load parameters of the structure is conducted, including lateral pressure coefficient, offset load, and buried depth. Some engineering recommendations are also proposed.

2. Prototype Experiment

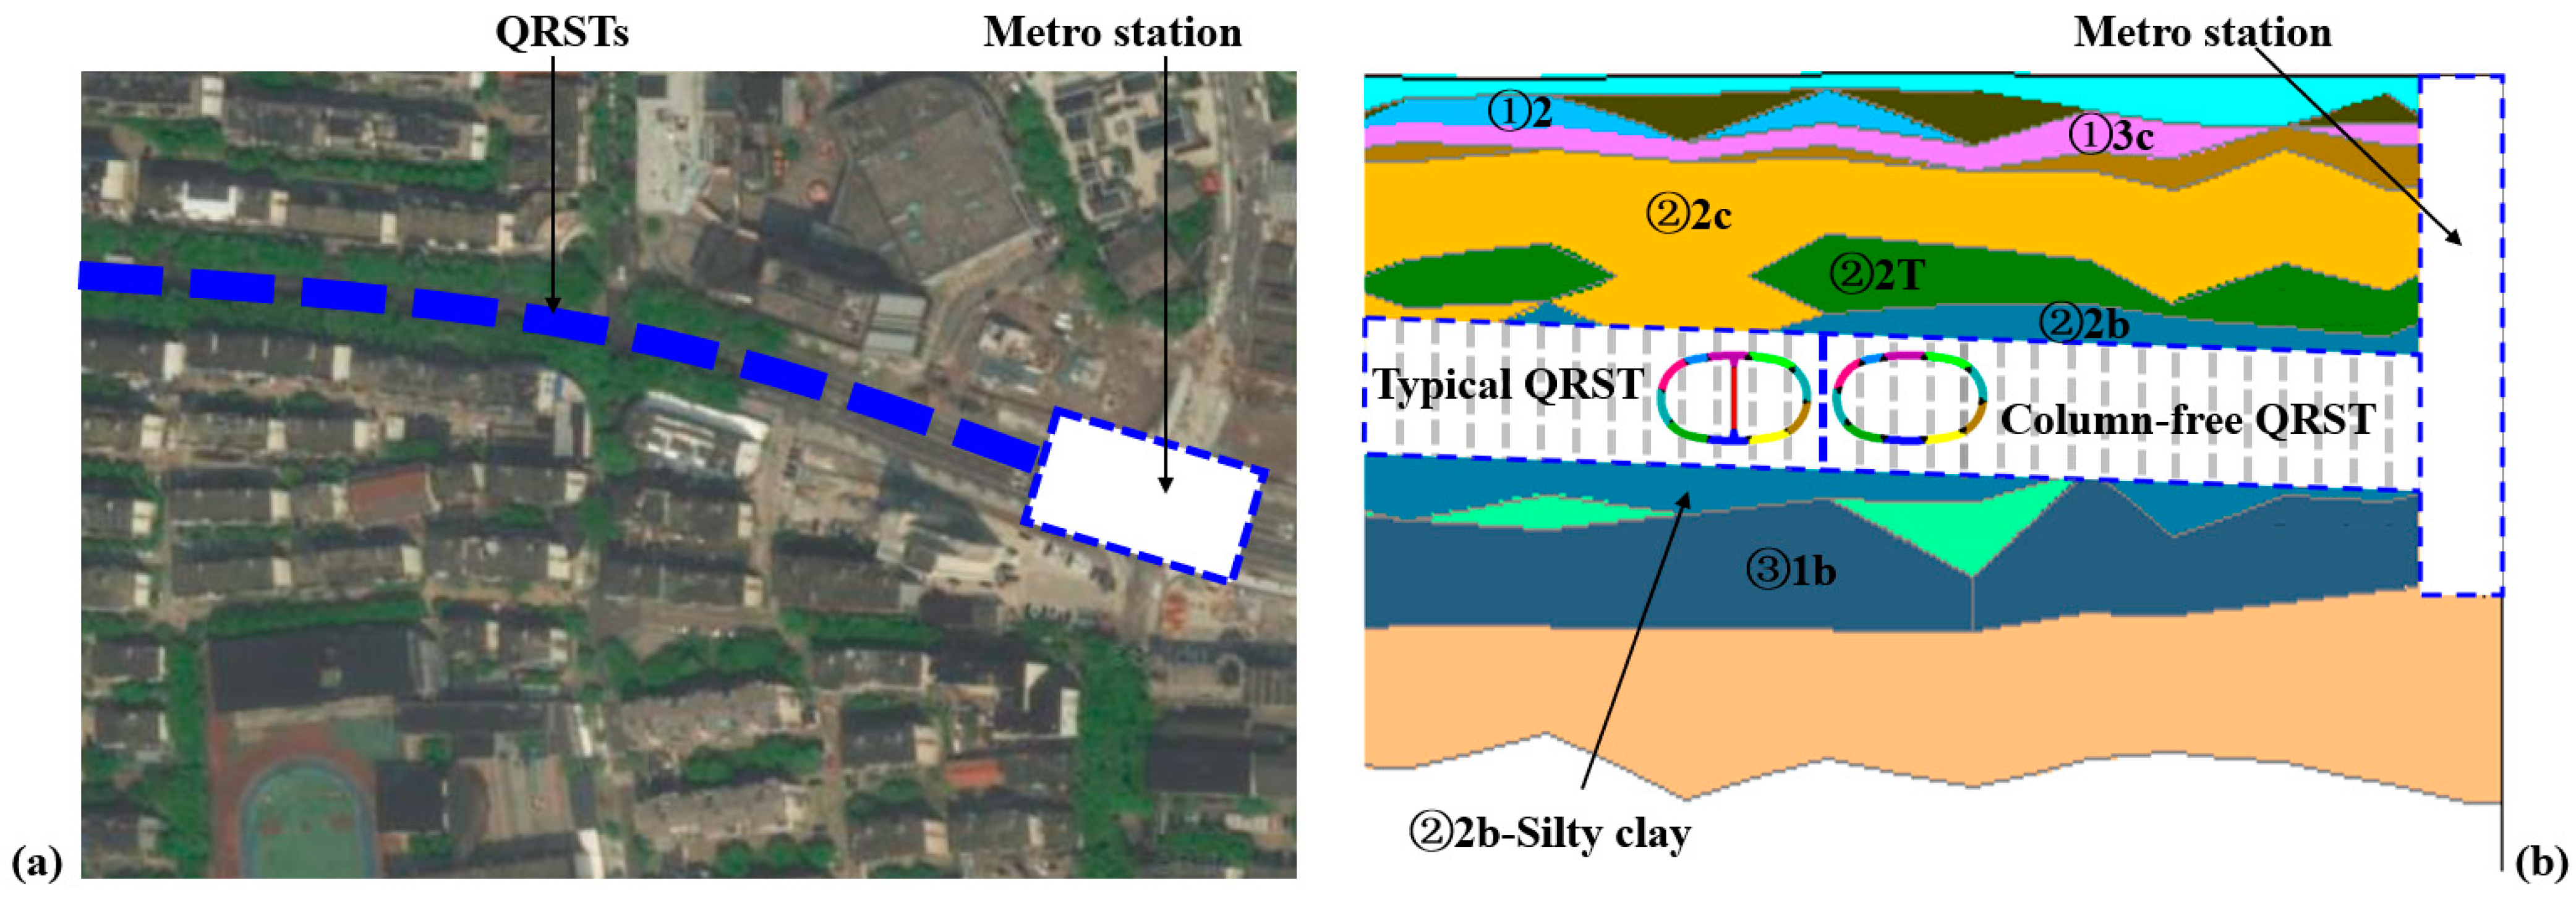
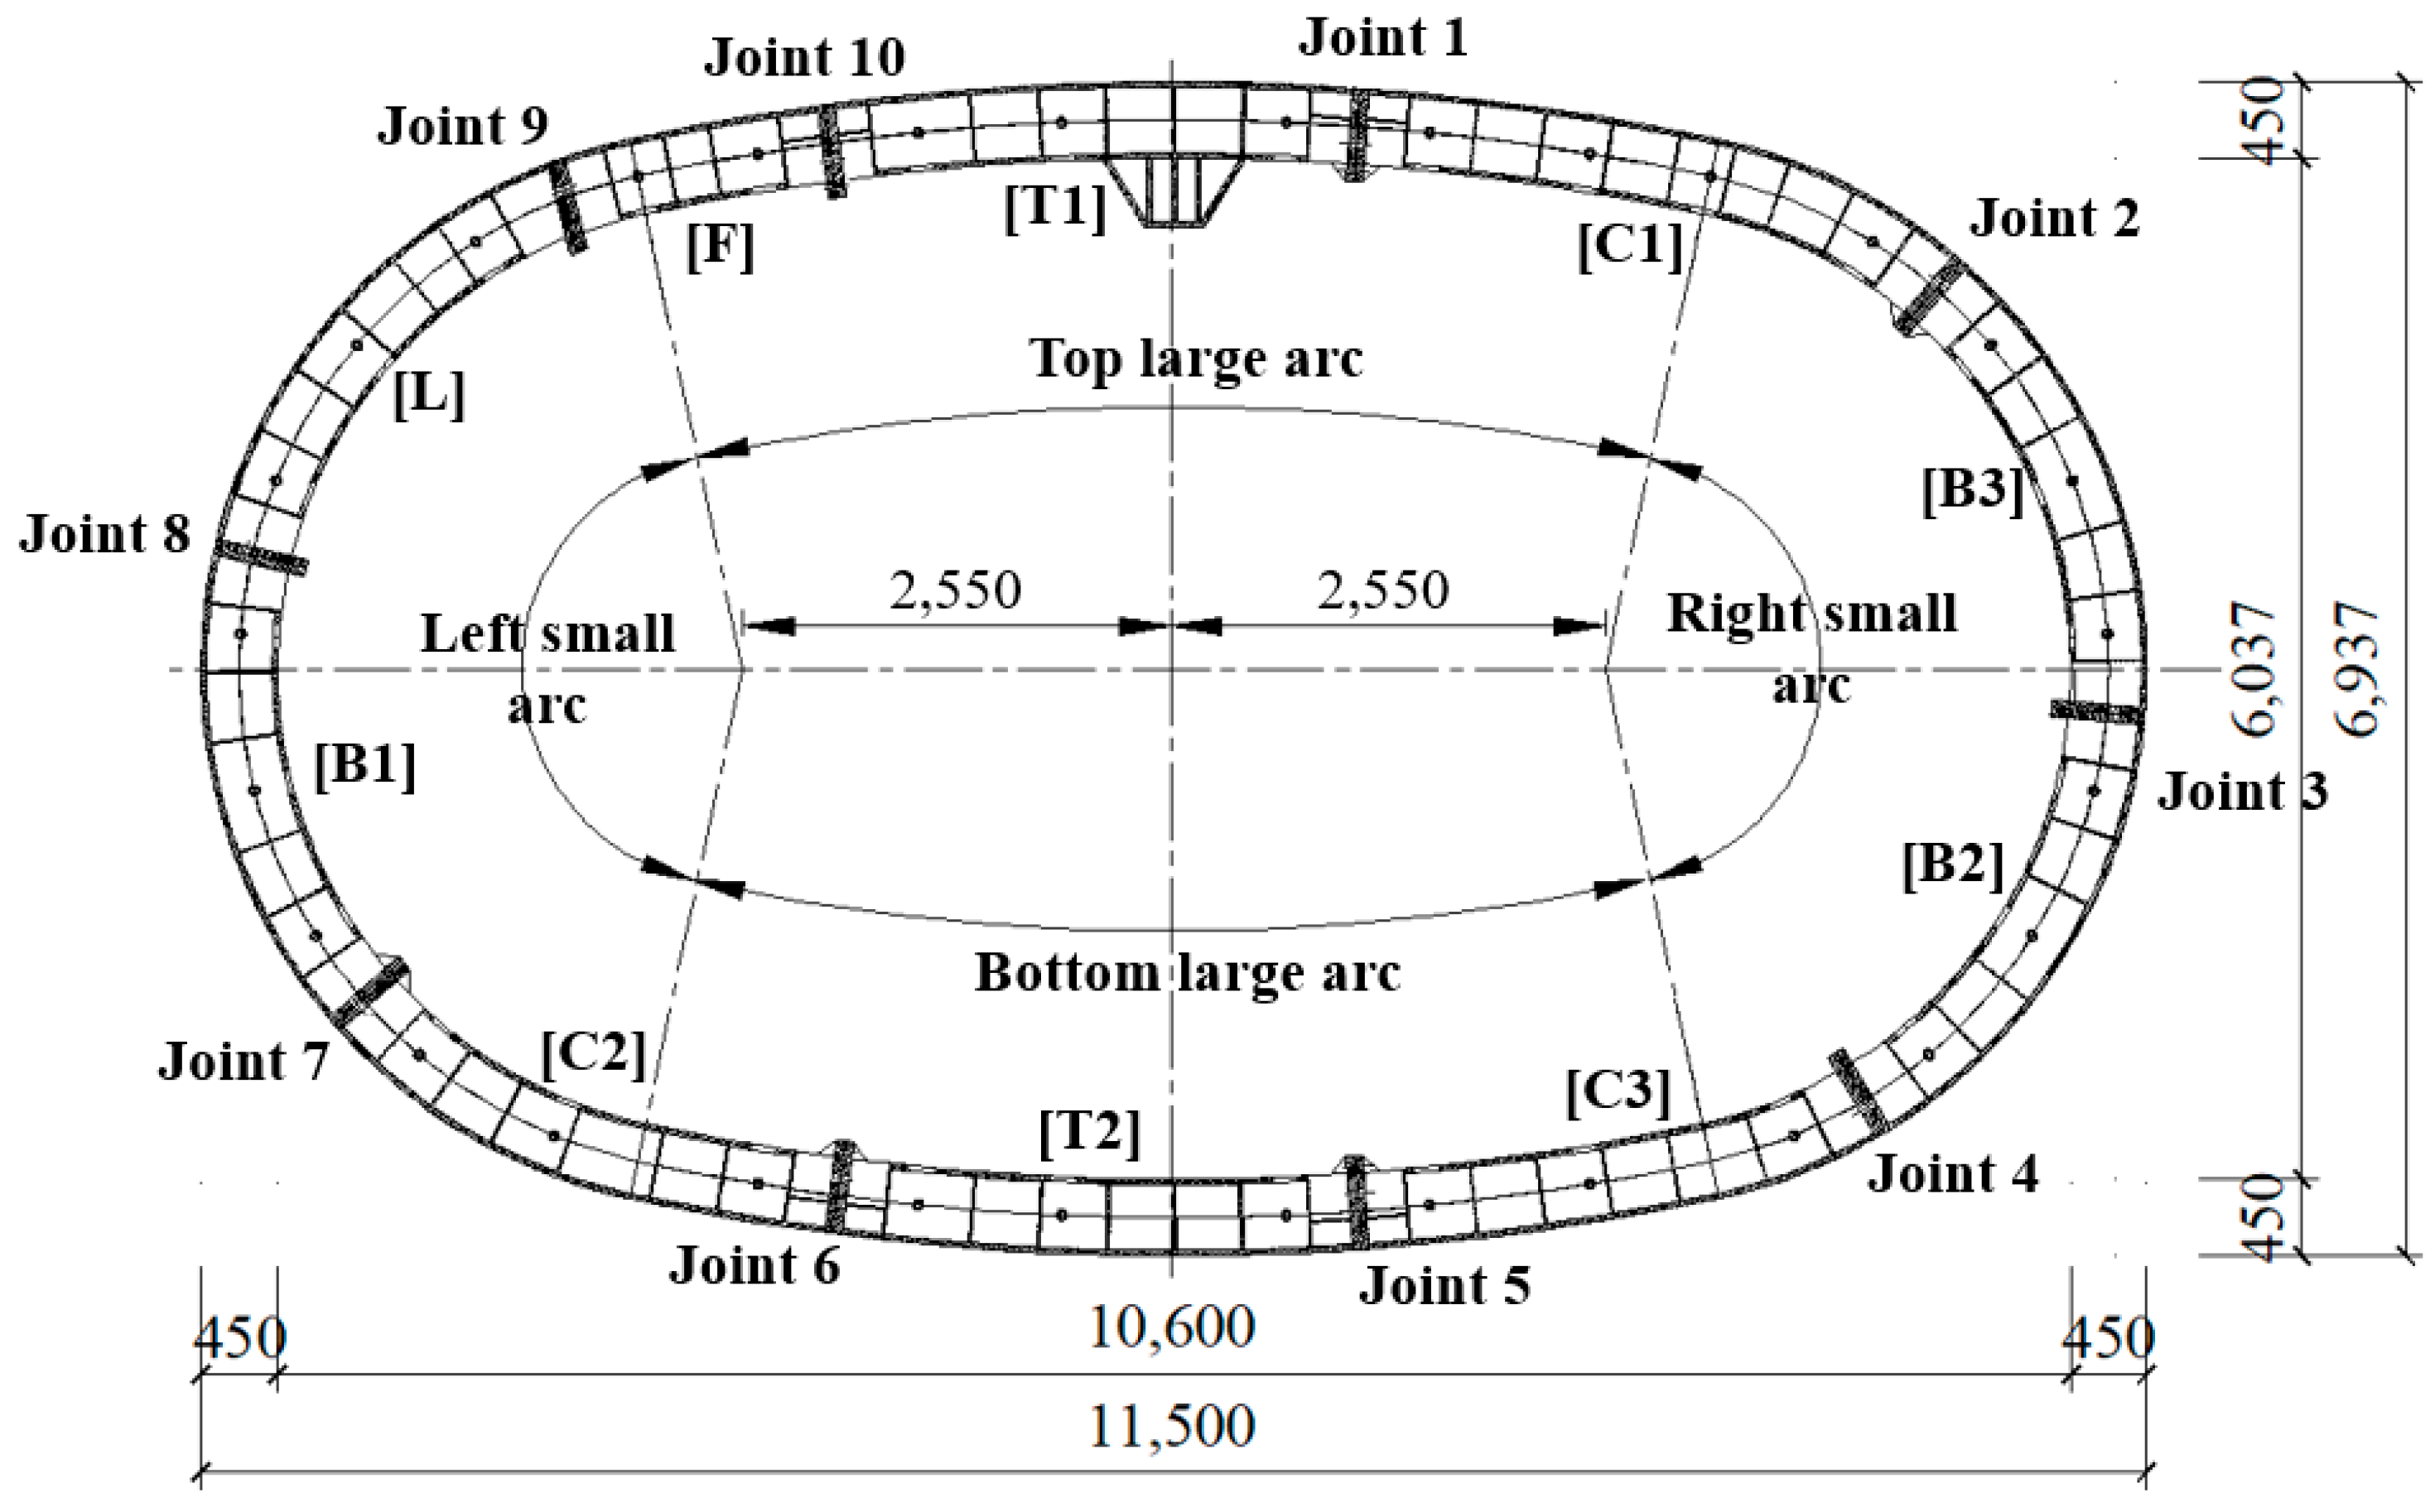
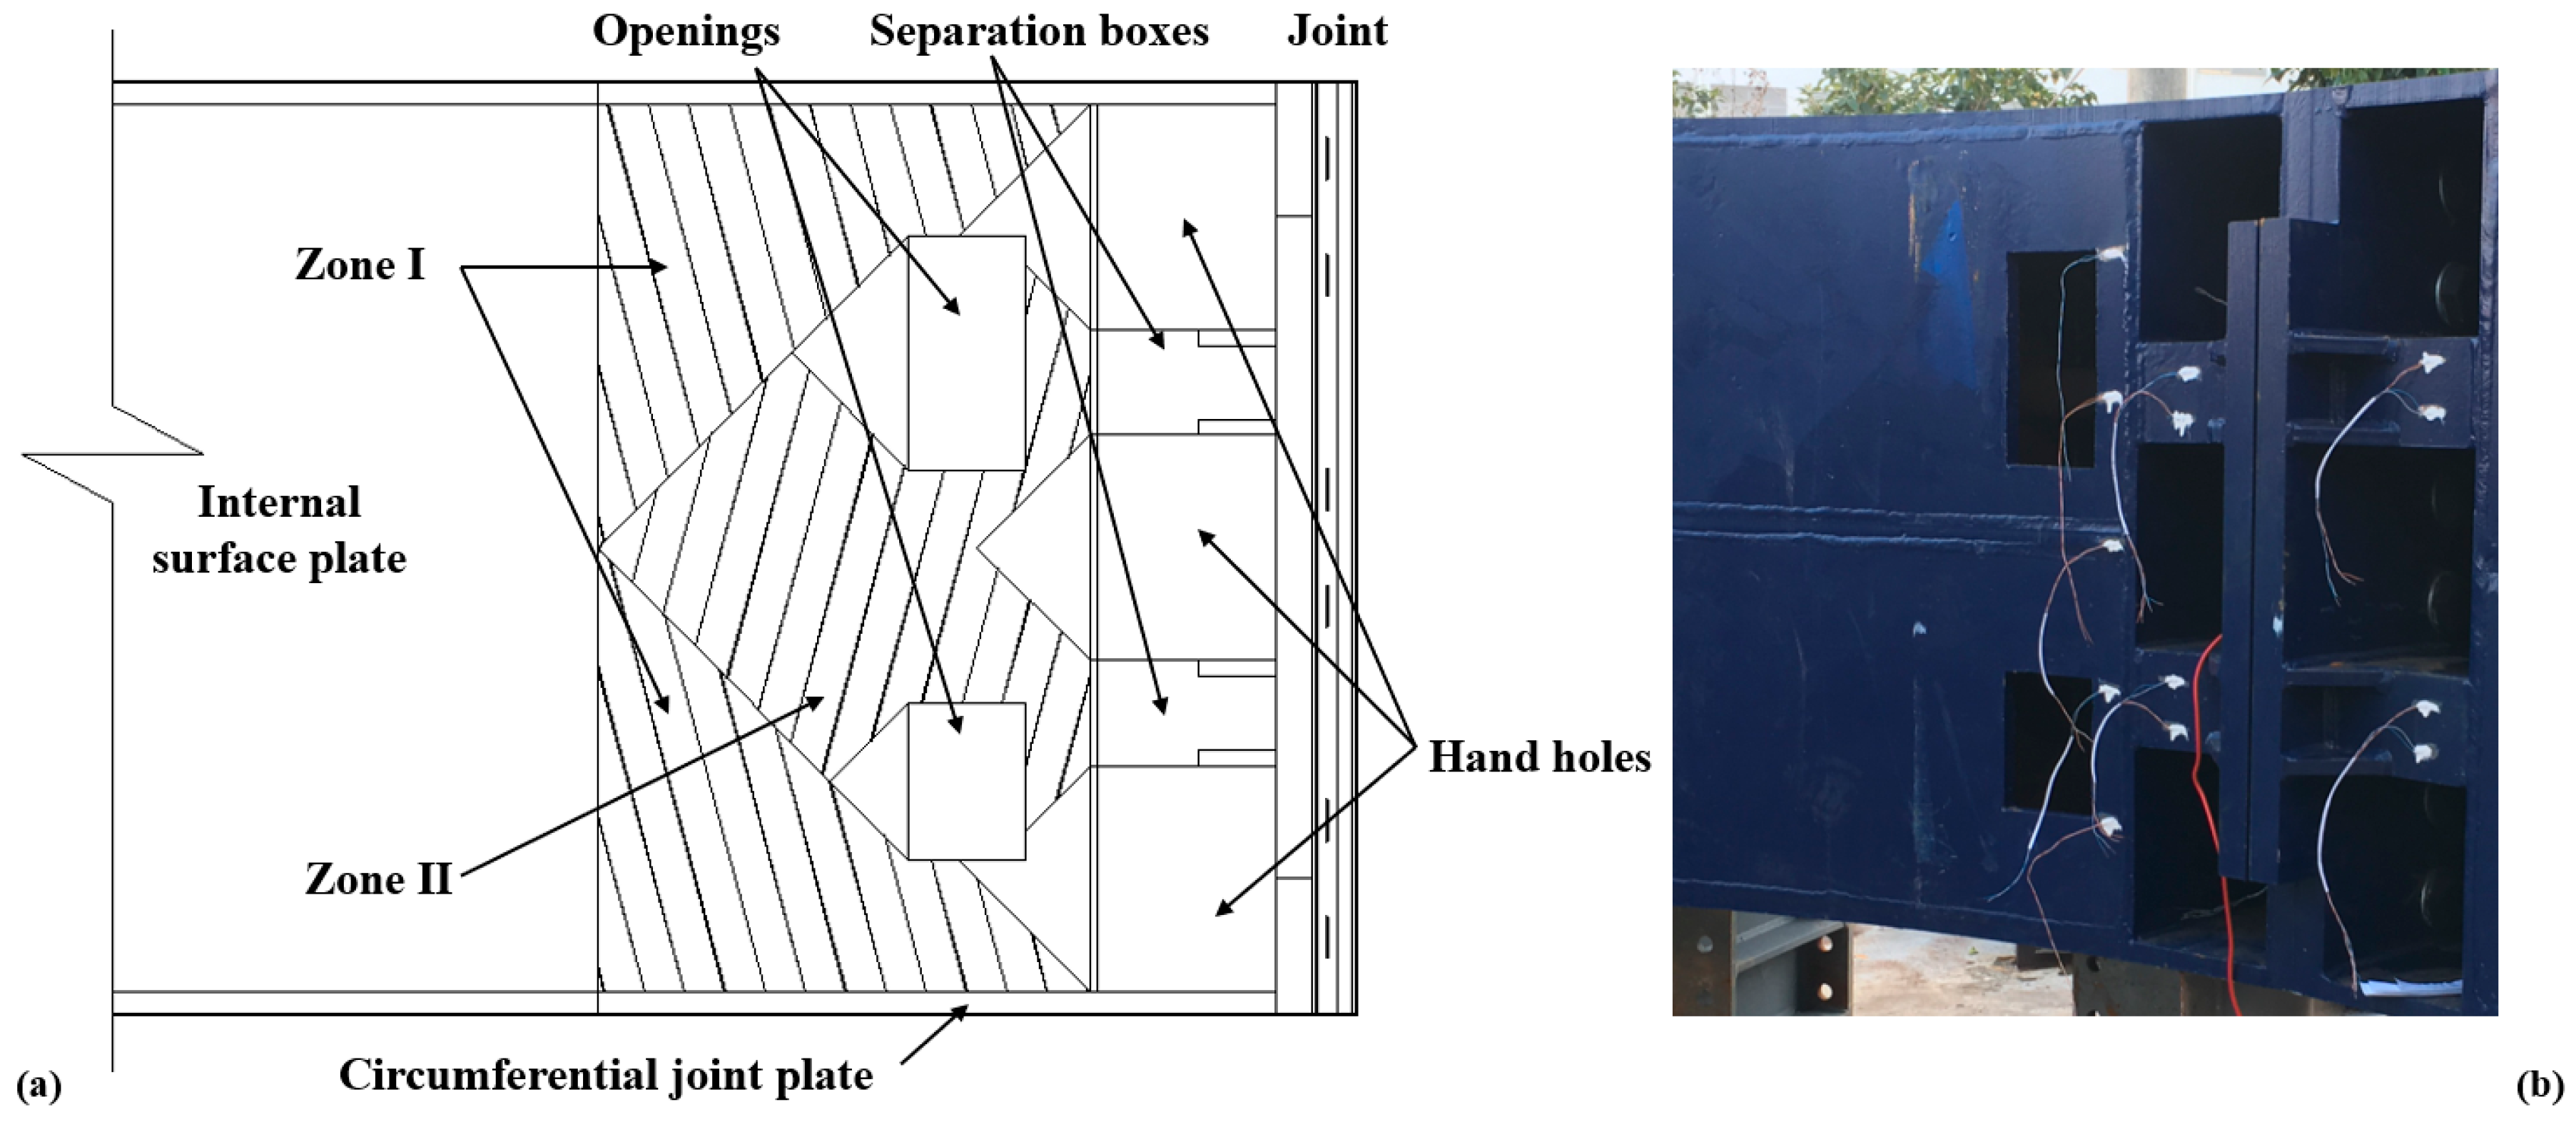
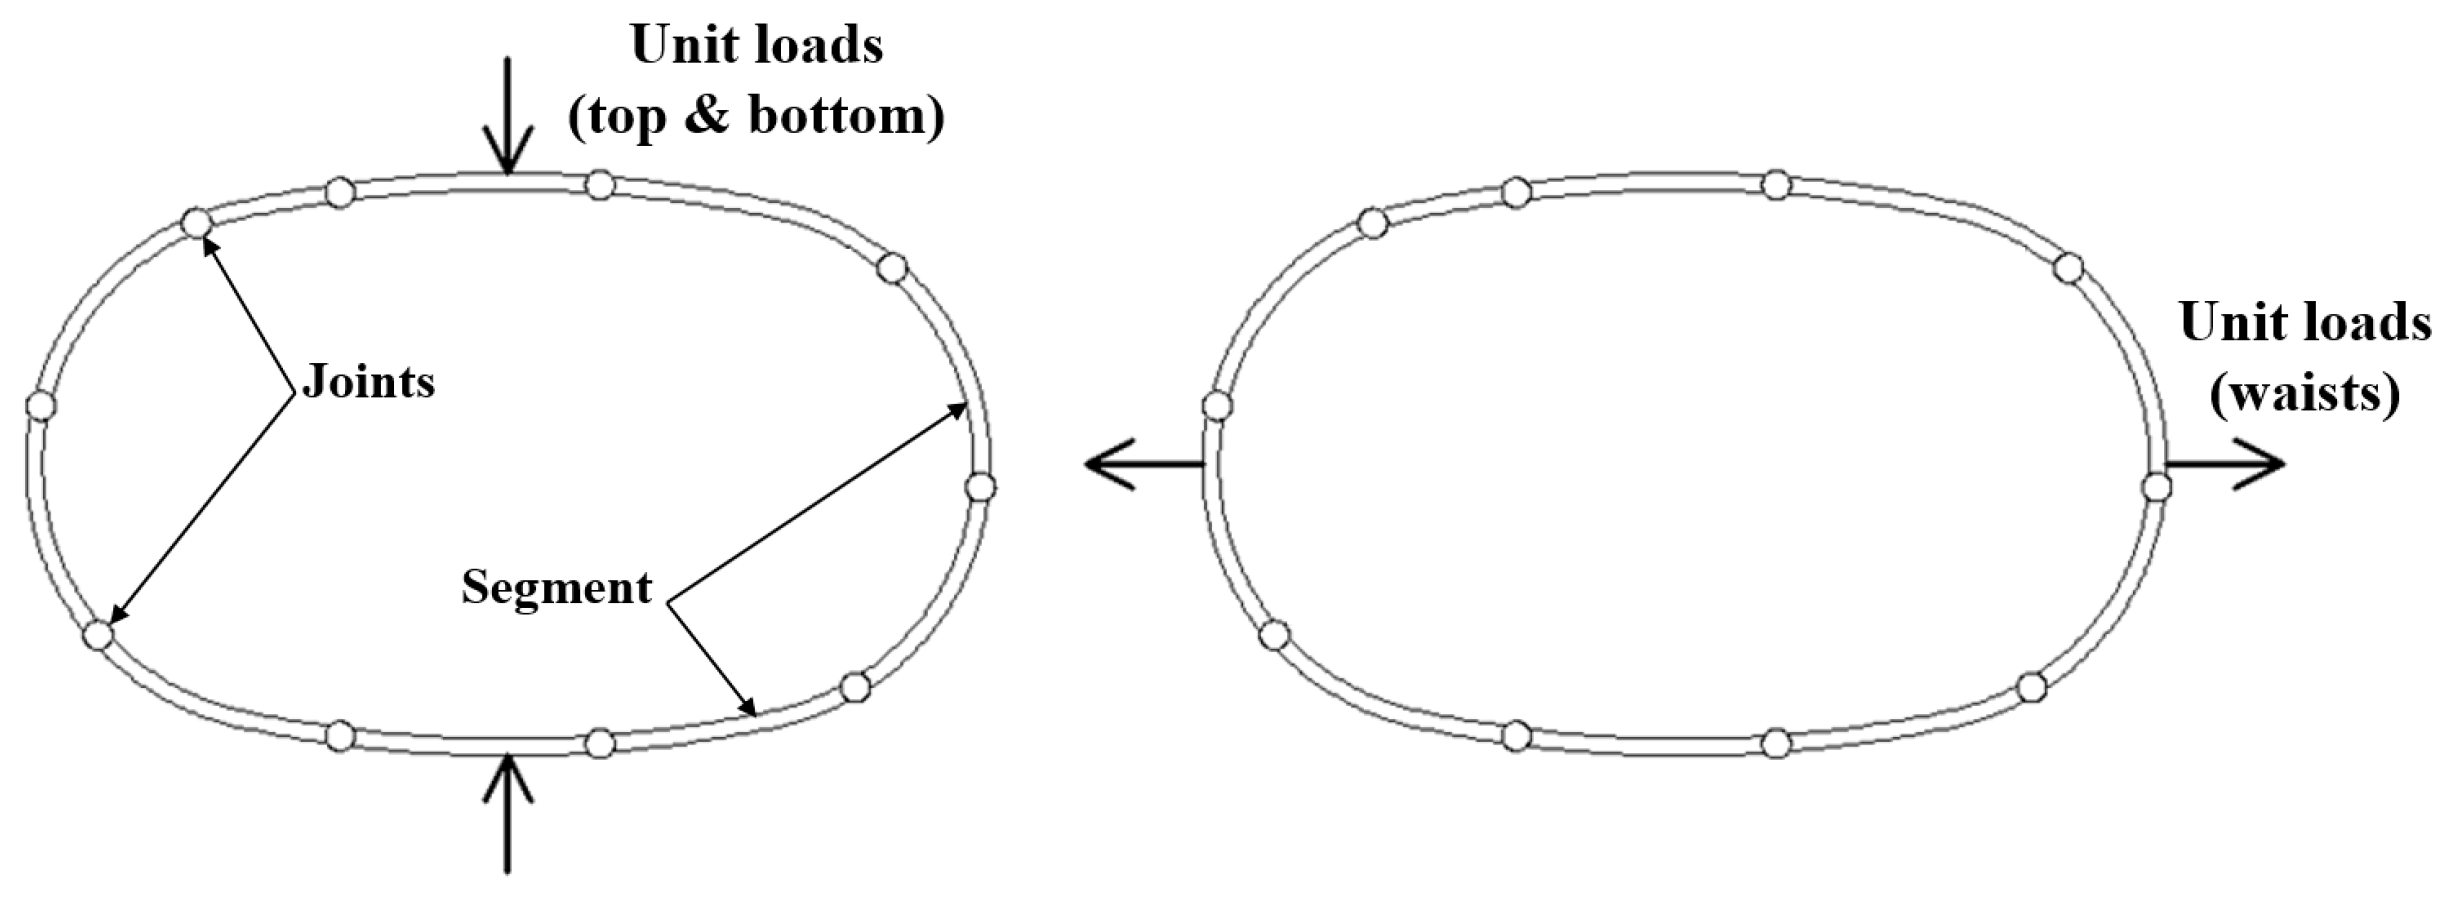
2.1. Project Background and Test Specimen
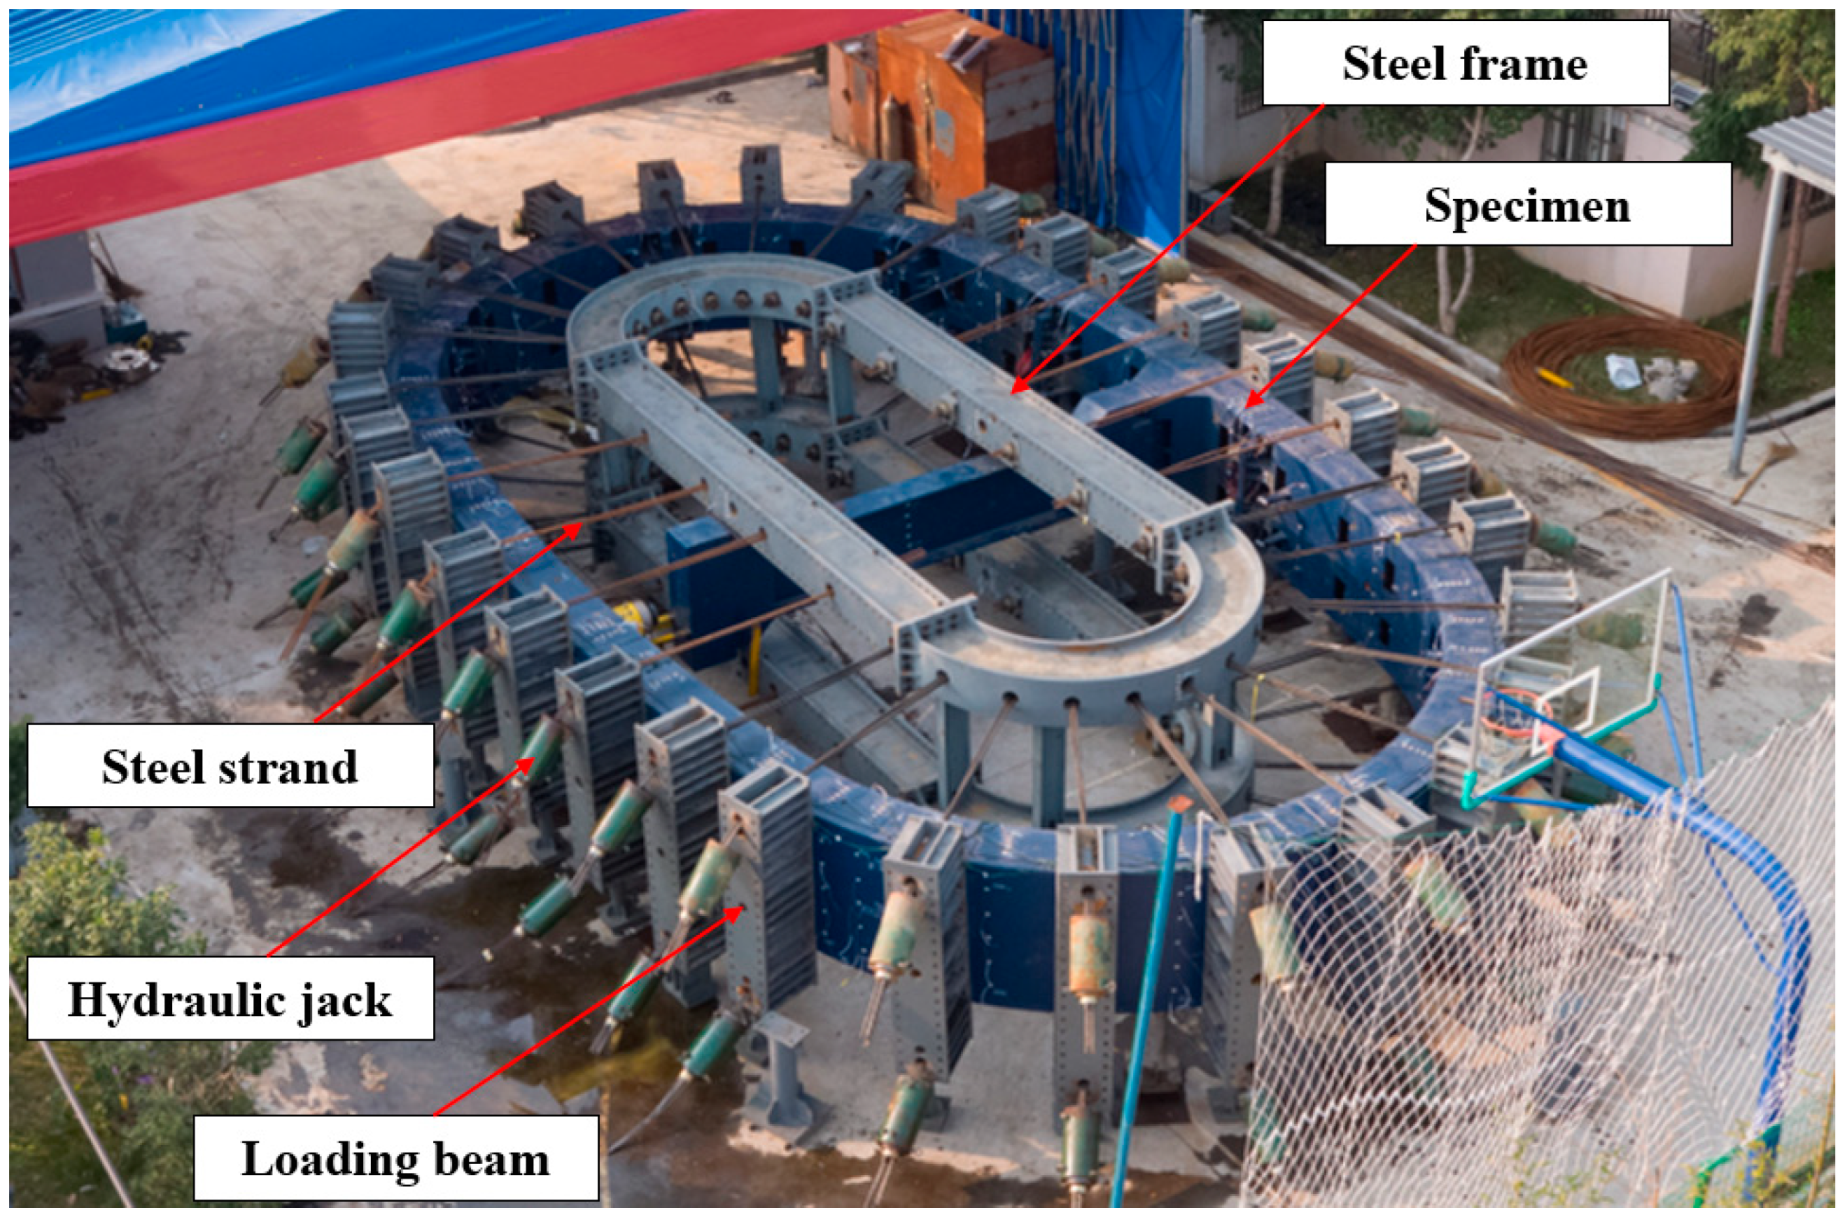
As intended, column-free QRSTs are located in the section used to connect two metro stations. Most of the tunnels in this section adopt typical QRST structures, while the part of the tunnels in this section near the metro station, as shown in Figure 2, adopt column-free QRST structures. The tunneling construction utilizes a newly developed 11.83 m × 7.27 m quasi-rectangular EPB shield machine, with the typical QRST linings constructed first, followed by the column-free QRSTs. The specific soil parameters are shown in Table 1. The column-free QRSTs are situated predominantly within the ②2b-silty clay layer. In the area close to the metro station, the column-free QRST structures reach a maximum buried depth of approximately 13 m.
The proposed column-free QRST has not been used before, let alone the relatively high buried depth. Considering its large span (11.5 m) and limited segment thickness, whether this new type of structure has sufficient suitability subject to the given engineering conditions is unclear. The deformation characteristics of the structure under the given joint distribution pattern are also not clear as the weak parts of the column-free QRST structure, the load-bearing capacity, and the deformation performance of joints have also not been fully explored. In addition, the mechanical behavior of this large-span column-free tunnel structure is relatively complex. The appropriate numerical models need to be determined to simulate the structural behavior. Since there is no central column support, the sensitivity of this new structure to changes in complex external geological conditions also needs to be studied. Therefore, a series of studies based on experiments and numerical simulations are very necessary.
The specimen utilized in this experimental investigation is a column-free QRST structure, the schematic diagram of which is shown in Figure 3. The outside dimension of the structure is 11,500 mm × 6937 mm. The structure comprises two large arcs at the top and bottom and two small arcs at the left and right waists. The centers of these two small arcs are located 2550 mm left and right of the center of the structure, respectively; the demarcation between the large and small arcs is also indicated in Figure 3. The structure comprises 10 steel blocks (segments), including two T blocks (T1 and T2), three C blocks (C1, C2, and C3), three B blocks (B1, B2, and B3), an L block, and an F block (key block). The thickness and width of the segments are 450 mm and 1200 mm, respectively. The thickness of the internal and external steel plates of the segments is 30 mm (Q345). There are ten longitudinal joints, designated as Joint 1–Joint 10, as illustrated in Figure 3.
Inspired by research findings indicating that bolt movement can effectively enhance the mechanical behavior of longitudinal joints and tunnel linings [8,9], corresponding measures are adopted in the design of the joints of the column-free QRST structure. Bolts of positive moment joints (intrados tension) have been inwardly repositioned, whereas bolts of negative moment joints have been outwardly repositioned, as shown in Figure 4. The distance between the M48 bolt position and the external arc surface is 325 mm at positive moment joints and 180 mm at negative moment joints. Furthermore, to enhance the bending stiffness and load-bearing capacity of joints, a row of four M30 bolts has been added at positive moment joints in addition to using a row of six M48 bolts. Joint contact plates have also been partially extended from 450 mm to 550 mm to increase the height of joint surfaces [17].

2.2. Test Setup

As shown in Figure 5, a counterforce steel frame and a steel strand tensioning system are utilized in the experiment to provide the test load [29,30]. The tension-only steel strands connect the counterforce steel frame and hydraulic jacks. The hydraulic jacks exert test loads on the test specimen by pushing loading beams. The counterforce steel frame provides a reaction to the jacks via tensioned steel strands. In order to facilitate loading, the counterforce steel frame is designed as a combination of curved components (corresponding to the small arcs on the left and right waists of the structure) and straight components (corresponding to the large arcs at the top and bottom of the structure). The curved components of the counterforce frame intersect with the steel strands perpendicularly, and the straight components of the counterforce frame intersect with the steel strands obliquely.
To accurately simulate the soil and water pressure exerted on column-free QRST structures, thirty loading points are positioned around the test specimen [31], with each loading point exerting a force perpendicular to the tangent direction of the structure at that corresponding point. Each loading point consists of two hydraulic jacks and a loading beam. The maximum load at a single point is 2000 kN and the maximum deformation of a single jack is 300 mm. These 30 loading points are divided into three groups: P1, P2, and P3. The distribution and grouping of these loading points are shown in Figure 6a.
In accordance with project backgrounds and design requirements, the test replicates the structural bearing states under the service stage with buried depths ranging from 9 m to 13 m, as illustrated in Figure 6b. The determination of test load from design load adheres to the following principles [32]:
  • All test loads must fulfill a self-balancing condition [33] to ensure the safety and stability of the prototype test platform during the test loading process. If the design of the test load is unbalanced, it will cause unexpected relative motion between the centers of the specimen and the counterforce frame, thereby affecting the stability of the platform;
  • It is necessary to ensure that the deviation of target structural responses (deformation or internal force) between the design loading state and the test loading state remains within an acceptable range. Considering that the design of segments and joints is mainly governed by bending moment, greater emphasis should be placed on bending moment rather than axial force and shear force when determining the test loads.
Based on the above principles, the equivalent stiffness homogeneous ring model (ESHR model) is used for the determination of test loads, with the obtained test loads outlined in Table 2. As intended, the test structure sequentially experiences design states with buried depths of 9 m, 10 m, and 13 m. When the loading step reaches step 17, the corresponding loading condition is the design condition during the service stage with a design buried depth of 13 m.
In the prototype test of the column-free QRST structure, the structural responses that need to be measured and observed include:
  • Structural deformation;
  • Joint deformation and bolt axial force.

2.3. Experimental Results

2.3.1. Structural Deformation

As shown in Figure 7a, 15 displacement measuring points (from ZWT1-2 to ZWT1-1) are positioned around the structure. It should be noted that, based on the pre-test simulation analysis, measuring points are arranged to cover the top, bottom, and waists where structural deformations are supposed to be significant. The distance between adjacent measuring points is also kept from being too large to cover as many positions as possible. Such arrangement of measuring points can effectively reflect the overall deformation characteristics of the structure; this has been verified by multiple experimental studies of tunnel structures [29,30,32]. The deformation pattern of the structure remains consistent under three different buried depth conditions, with structural deformation gradually escalating. According to the test results, the structure predominantly experiences inward deformation. The inward part includes the F, T1, and C1 blocks at the top of the structure and the C2, T2, and C3 blocks at the bottom of the structure. Conversely, the outward deformation part of the structure is relatively limited and primarily includes the B3, B2, B1, and L blocks situated at the waist of the lining structure. Deformation zero points are located at four corners of the structure. At a buried depth of 13 m, maximum inward deformation is observed at measuring point ZWT1-2, with a deformation value of 63.82 mm. The maximum inward deformation at the bottom of the structure is 51.03 mm at measuring point ZWT2-1. Meanwhile, the maximum outward deformations at points ZWB2-1 and ZWB1-2 are nearly identical, measuring 22.48 mm and 22.55 mm, respectively, as shown in Figure 7a.
By employing measuring points along the long and short axes, the development of convergence deformations of the short axis (top to bottom) and long axis (left waist to right waist) of the structure is obtained, as presented in Figure 7b. The three dotted lines of different colors in the figure represent the different design buried depths experienced by the structure, from 9 m to 13 m. At a buried depth of 13 m, the convergence deformation along the short axis is 108.64 mm, while that along the long axis is 49.03 mm, yielding a corresponding ratio of 2.22. Additionally, the convergence deformations along two axes develop linearly as the test load increases.

2.3.2. Joint Response

By employing displacement meters at the extrados and intrados of the joint, the opening and compression of the joint on each side can be obtained. Subsequently, the joint rotation angle θ can be computed [34] using Equation (1).
θ = u i i u e x b ,
uin and uex are the axial opening/closing deformations of the joint intrados and joint extrados, respectively, and b is the thickness of the segment.
The joints with intrados in tension and extrados in compression are defined as positive moment joints. Therefore, Joints 1, 5, 6, and 10 located at the top and bottom of the structure are categorized as positive moment joints, while Joints 2, 3, 4, 7, 8, and 9 located at the left and right waists of the structure are categorized as negative bending moment joints. The development of joint rotation angles for positive moment joints (Joints 1, 5, 6, and 10) and negative moment joints (Joints 3, 4, 7, and 9) is presented in Figure 8. For Joint 2 and Joint 8 negative moment joints, their deformations are not presented due to sensor damage. According to Figure 8a, among these positive moment joints, Joint 1 and Joint 5, situated closer to the short axis (top and bottom) of the structure exhibit faster development of joint rotation angles compared to Joint 6 and Joint 10, with augmentations of about 10%–43%. Moreover, the deformation of Joint 1 surpasses that of Joint 5. As for negative moment joints presented in Figure 8b, the joint rotation angle of Joint 3, positioned closer to the waist of the structure, experiences faster development compared to those of Joints 4, 7, and 9. Notably, the deformations of Joint 4 and Joint 9 develop rapidly in the initial stage of the load-bearing process but subsequently decelerate swiftly after P1 reaches 50 kN.
Bolt axial forces are monitored, with their development presented in Figure 9. According to Figure 9a, the axial force of the M30 bolt in Joint 1 is about 6.7% greater than that of the M30 bolt in Joint 5, aligning with the observed joint rotation angles in Figure 8a. Additionally, at Joint 5, it is noted that the bolt axial force of the M30 bolt, located closer to the internal surface, exceeds that of the M48 bolt by about 10.5%. This phenomenon underscores the necessity for further optimization of joint design to fully exploit the bearing capacity of bolts. As shown in Figure 9b, the bolt axial force developments of Joint 3 and Joint 8 are basically the same.
Based on the test results of joint deformations and bolt axial forces, it can be concluded that among the positive moment joints, Joint 1 exhibits a higher response compared to Joint 5 and surpasses Joints 6 and 10. Negative moment joints can be categorized into three groups. Joint 3 and Joint 8 constitute the group with the most significant response, followed by Joint 2 and Joint 7. Joint 4 and Joint 9 exhibit the smallest response. Additionally, compared with structural deformation, it is discerned that the positive bending moment region is smaller than the region corresponding to inward deformation.

2.4. Analysis of Structural Behavior

The overall deformation characteristics of the column-free QRST structure can be summarized and analyzed as follows:
(1)
The structural convergence deformation along the short axis at the top and bottom is relatively larger than that along the long axis at the waists. This phenomenon is attributed to the higher vertical load levels compared to the horizontal load levels. Moreover, the span of the structure primarily extends along the long axis, resulting in greater deformations in the vertical direction, corresponding to the structural convergence deformation along the short axis.
(2)
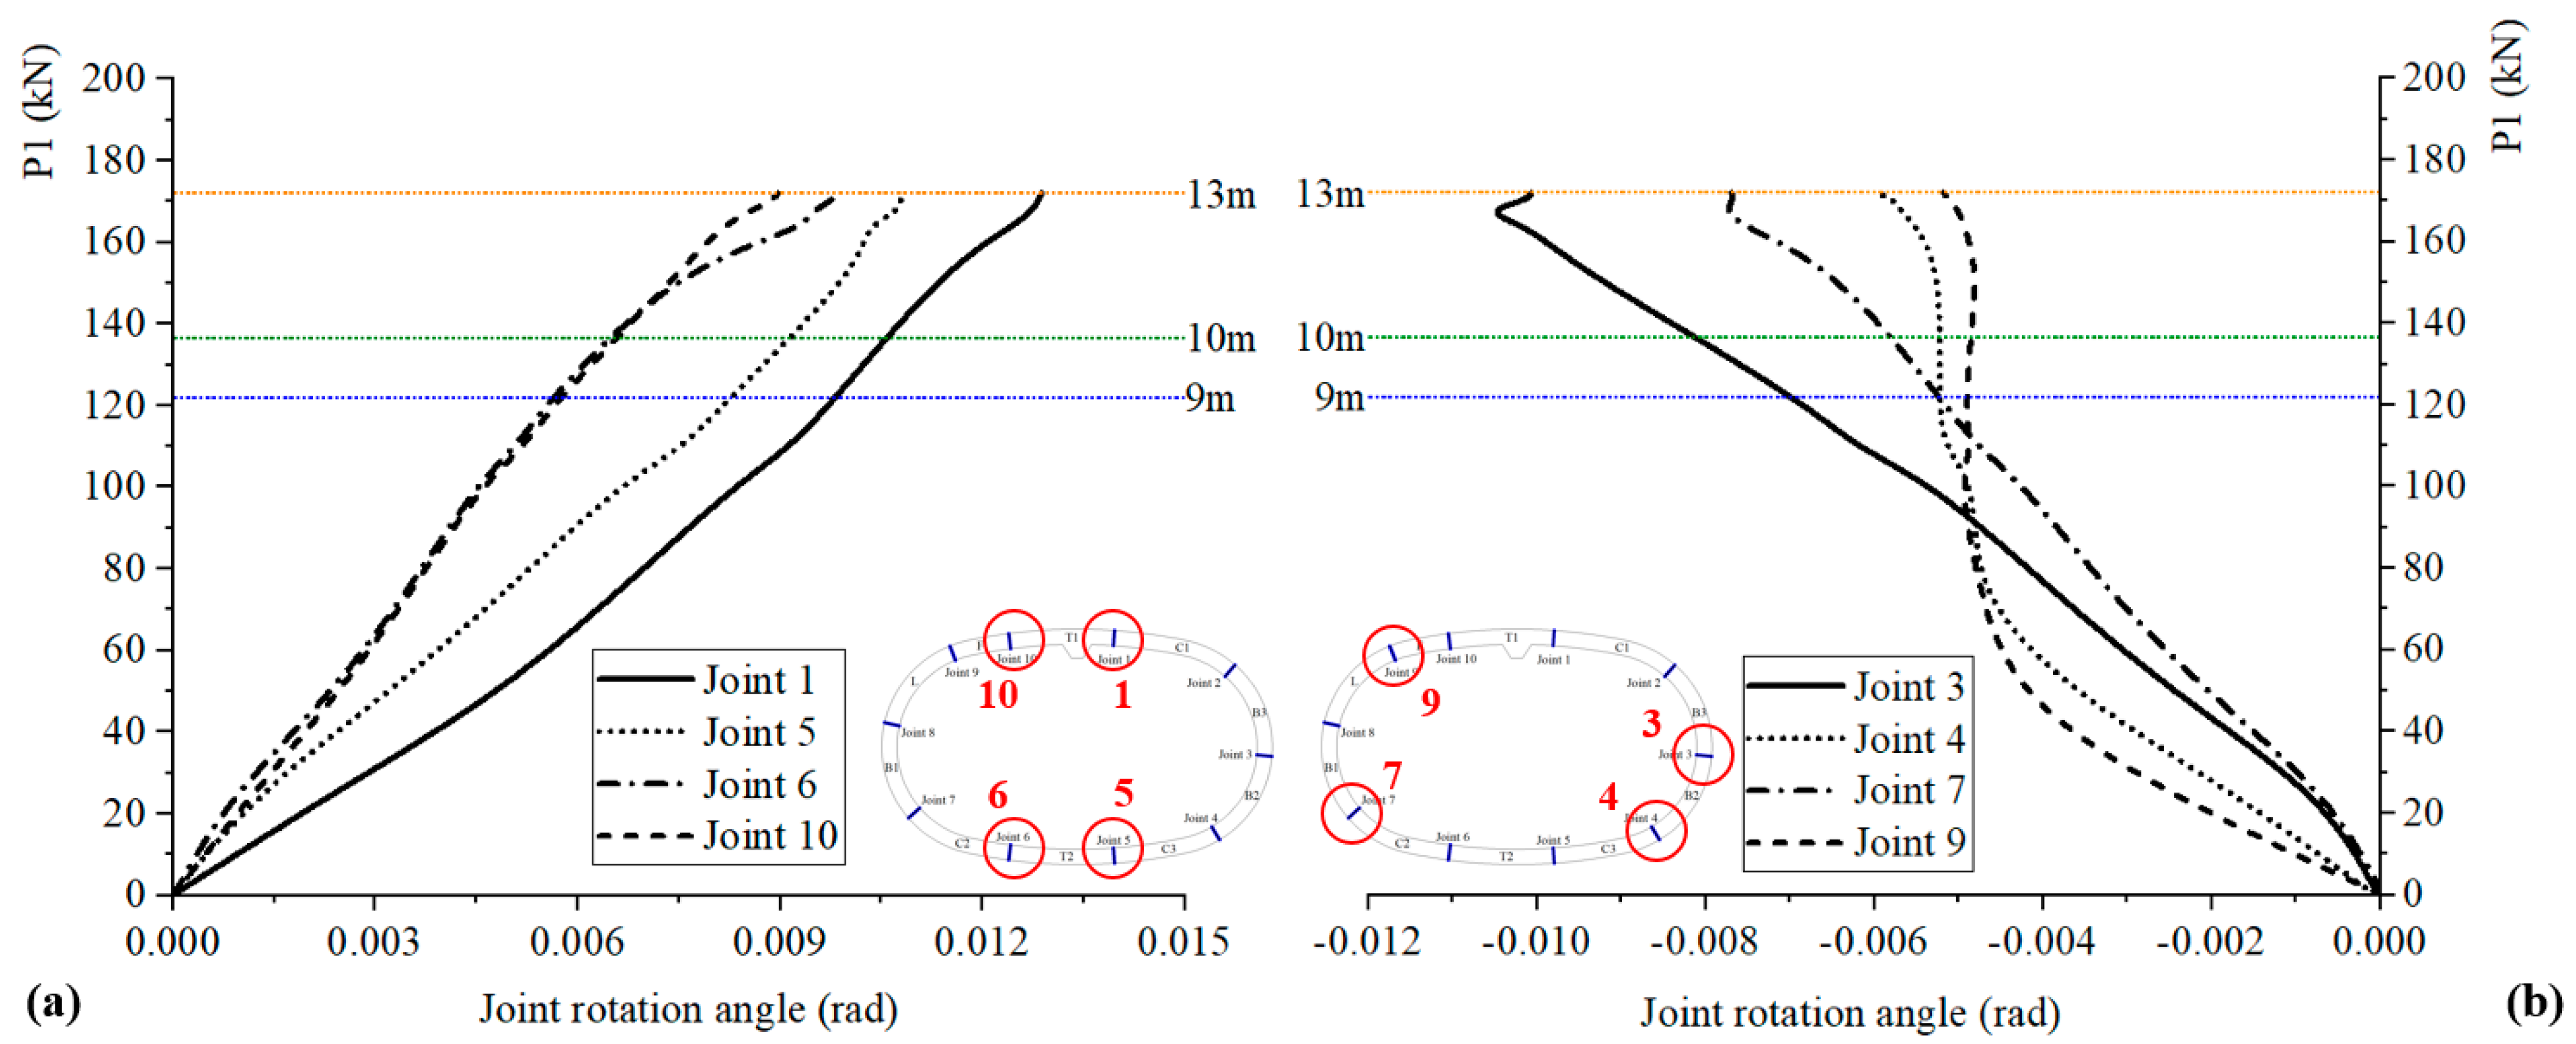
Asymmetry in structural deformation. Considering that longitudinal joints represent the most significant characteristic of segmental tunnel linings, the asymmetry in the structure mainly originated from the distribution of joints. Specifically, Joints 1 and 5 are closer to the short axis, while Joints 3 and 8 are closer to the long axis, causing local deformations at four positions (top, bottom, left waist, and right waist) shifting towards these joint positions. According to the given distribution of joints, the deformations at the top and bottom exhibit axial symmetry with respect to the long axis of the structure, while the deformations at the waists exhibit central symmetry with respect to the center of the structure. These deformation characteristics are also consistent with the experimental results of joint responses.
Regarding the longitudinal joints of the structure, the bolt axial forces of Joints 3 and 8 subjected to negative bending moment at the waists are significantly higher than those of Joints 1 and 5 subjected to positive bending moment at the top and bottom. Therefore, it is indicated that the negative moment joints of the structure have lower safety reserves, which need further optimization to enhance their load-bearing capacity. For the negative moment joints, increasing bolt dimensions and shifting bolt positions towards the external surface are feasible approaches. For the positive moment joints, given that bolt axial forces of M30 bolts are larger than those of M48 bolts, it is suggested to reposition the rows of M48 and M30 bolts to fully utilize their load-bearing capacity. Additionally, it is observed that deformations of steel joints are not uniformly distributed along the width direction (longitudinal direction of tunnels), exhibiting a “hogging” effect [35,36]. It is recommended to establish a refined finite element model for joint optimization.

3. Simulation and Analysis of Structural Behavior

In this Chapter, the applicability of different models to column-free QRST structures is explored. To achieve this aim, the equivalent stiffness homogeneous ring model (ESHR model), the beam spring model (BS model), and a proposed modified beam spring model (MBS model) are utilized to calculate and analyze the structural behavior.

3.1. Input Parameters for Models

In the ESHR model, segments are simulated by beams with uniform bending stiffness, and a stiffness reduction factor is introduced to account for the influence of longitudinal joints [37,38]. Meanwhile, in the BS model, joints are simulated by rotation and shear springs to consider the joint behavior when subjected to bending moment and shear force, thereby enhancing simulation accuracy [22,39]. Additionally, considering that there is a joint influence zone in the vicinity of the joint, the joint-induced deformation is not concentrated on the joint position. Therefore, in the proposed MBS model, the additional joint-induced deformation in the joint influence zone is considered by reducing the bending stiffness of segments in the joint influence zone. In this study, the numerical modeling is conducted using the ANSYS software 14.0 [40].

3.1.1. ESHR Model

Segments of the structure are simulated using beam elements (BEAM54). BEAM54 is a 2D elastic tapered unsymmetric beam that mainly bears tension, compression, and bending. Each node has three directional degrees of freedom. For this type of element, parameters such as area, moment of inertia, section height, elastic modulus, etc., need to be defined, as detailed in Table 3.

3.1.2. BS Model

The longitudinal joints of the structure are simulated using matrix elements (MATRIX27) with zero length. Matrix27 can be used to simulate elastic kinematic relationships between two different nodes, each with six degrees of freedom. The compressive stiffness along the tunnel’s tangential direction, shear stiffness along the tunnel’s radial direction, and bending stiffness along the tunnel’s longitudinal direction are defined in the local coordinate system of the joint. Among these parameters, compressive stiffness and shear stiffness are considered infinitively large values. The bending stiffness is determined based on the test results of the full-scale joint test, as depicted in Figure 10. Furthermore, since the stiffness matrix of this element is defined in the global coordinate system, after obtaining the parameters of the element in the local coordinate system, these local parameters need to be converted into parameters in the global coordinate system through matrix rotation.

3.1.3. MBS Model

Recognizing that the structural influence of the joint is not only concentrated at the joint position but also on the segment within the joint influence area, the MBS model is proposed to reduce the stiffness of the segment within a certain range near the joint.
As shown in Figure 11, for the segment in the vicinity of the joint, the inner surface plate is not fully utilized because of openings and hand holes. The internal surface plate near the joint is divided into two zones to consider stress transmission from the joint: Zone I refers to stress transmission from circumferential joint plates, while Zone II refers to stress transmission from separation boxes. As the distance from the joint increases, the engagement percentage of the internal surface plate increases.
l l M x E I x d x = M 0 E η I 0 2 l .
ρ = 2 l I 0 l l d x I x .
In Equations (2) and (3), I(x) represents the variation of the moment of inertia along the segment, and the bending moment M(x) is assumed to be constant (bending moment M0). Considering the deformation within a certain distance l from the joint, the stiffness reduction factor ρ can be obtained. Therefore, for segments near joints, with a length of the influence area set to 450 mm (the thickness of the segment [41,42]), the reduction factor is determined to be 0.82.
For other parameters used in the MBS model, the segment parameters are consistent with those used in the ESHR model, while the joint parameters are consistent with those used in the BS model.

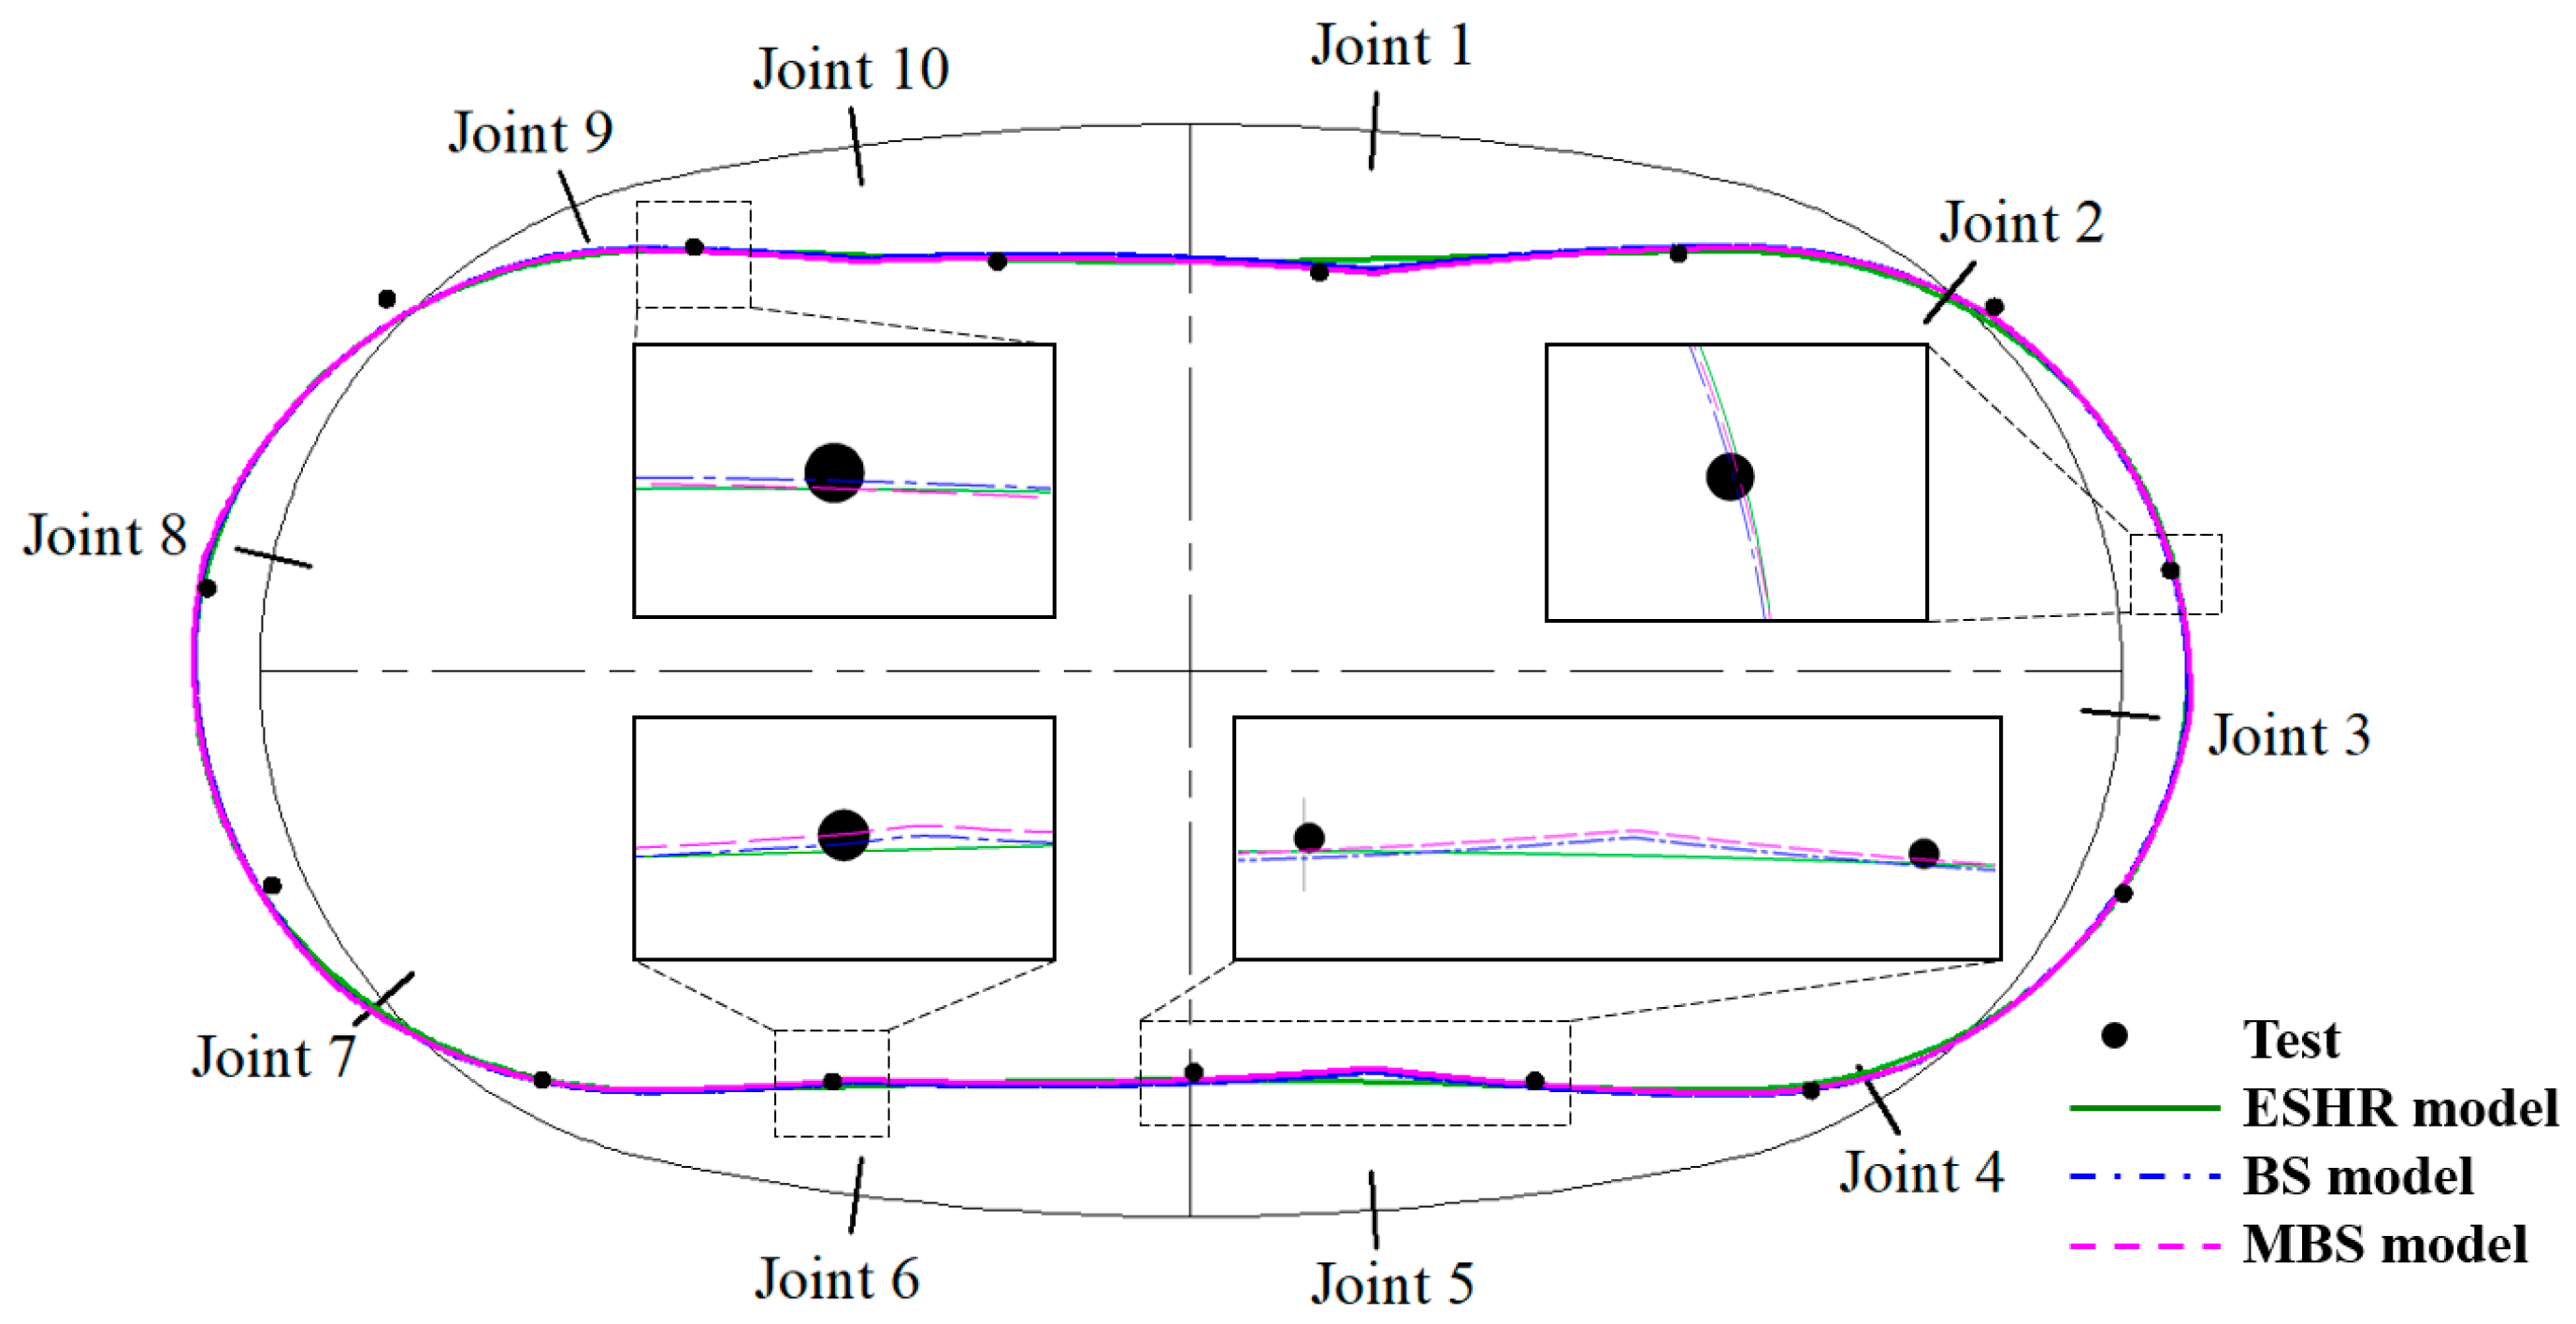
3.2. Simulation Process and Results

The three above-described models are used to simulate and calculate the response of the column-free QRST structure under test loads. Since these three models are all elastic models, the load pattern is completely consistent with Figure 6, using the direct calculation method. Taking the simulation results of the MBS model subjected to the 13 m service stage condition as an example, the distribution of internal forces, including bending moment, axial force, and shear force, is shown in Figure 12.
The calculated deformation results of the three models (ESHR model, BS model, and MBS model) under the same design condition (13 m service stage) are presented in Figure 13 and Table 4 for comparison. In Table 4, the positions of the long and short axes are indicated in Figure 7. The left short axis and the right short axis are both 2.55 m from the short axis.
As depicted in Figure 13 and Table 4, all three models demonstrate efficient simulation accuracy. For comparison purposes, the simulation results calculated by the three models are analyzed based on different parts of the structure. Regarding structural deformations at the top of the structure, both the MBS model and the BS model effectively reflect the local deformation characteristics of joints, presenting higher simulation accuracy compared to the ESHR model. Concerning deformations at the bottom of the structure, the MBS model also achieves the best-fitting effect among the three models. As for structural deformations at the waist of the structure, the simulation results of the three models are relatively close. In addition, as shown in Table 4, both the BS model and the MBS model reflect the asymmetric deformation of the left and right short axes of the structure, while the ESHR model does not. Additionally, the MBS model has very good prediction results for the deformation of the three short axes compared with the other two models.
In summary, due to the different simulation methods for joints, the ESHR model may not fully capture the local deformation characteristics near the joint, unlike the BS model or the MBS model. The MBS model, encompassing both joint deformation and joint-induced deformation in the vicinity of the joint, yields more precise simulation results compared to the ESHR model and the BS model. Therefore, it is recommended that the MBS model or BS model be used for the analysis of structural mechanics. Nonetheless, the ESHR model already provides adequate simulation accuracy for design purposes.

3.3. Deformation Mechanism

Based on the proposed MBS model, a hybrid analysis method is proposed to analyze the deformation contributions of different components. As shown in Figure 14, unit loads are applied on the top, bottom, and waists to get virtual states of the structure. According to the principle of virtual work, structural convergence deformations can be expressed as
Δ = M φ M φ E I x R φ d φ + i = 1 10 M φ i M φ i k i .
Δ = M φ M φ E I x R φ d φ + i = 1 10 θ i M φ i .
The convergence deformation of the short and long axes of the structure is calculated using Equation (4). The convergence deformation mainly comprises two parts: the deformation contribution induced by the segment (first term of Equation (4)) and the contribution induced by joints (second term of Equation (4)). In Equation (4), M(φ) and M(φi) represent the bending moments of the segment and the joints of the actual test structure, respectively. M’(φ) and M’(φi) represent those of the virtual structure subjected to unit loads. ki is the bending stiffness of Joint No. i (ranging from 1 to 10). Hence, the actual joint bending moment M(φi) divided by the joint bending stiffness ki yields the actual joint rotation angle θi obtained from the test. Therefore, Equation (4) can be transformed into Equation (5).
The analysis of deformation contributions is summarized in Table 5. The deformation of the short axis under three different conditions during the service stage is calculated and compared with test results, showing good agreement. According to the joint contributions shown in parentheses, the deformation contributed by joints was 65–70%. These results also suggest the optimization of joints to reduce structural deformation.

4. Structural Design

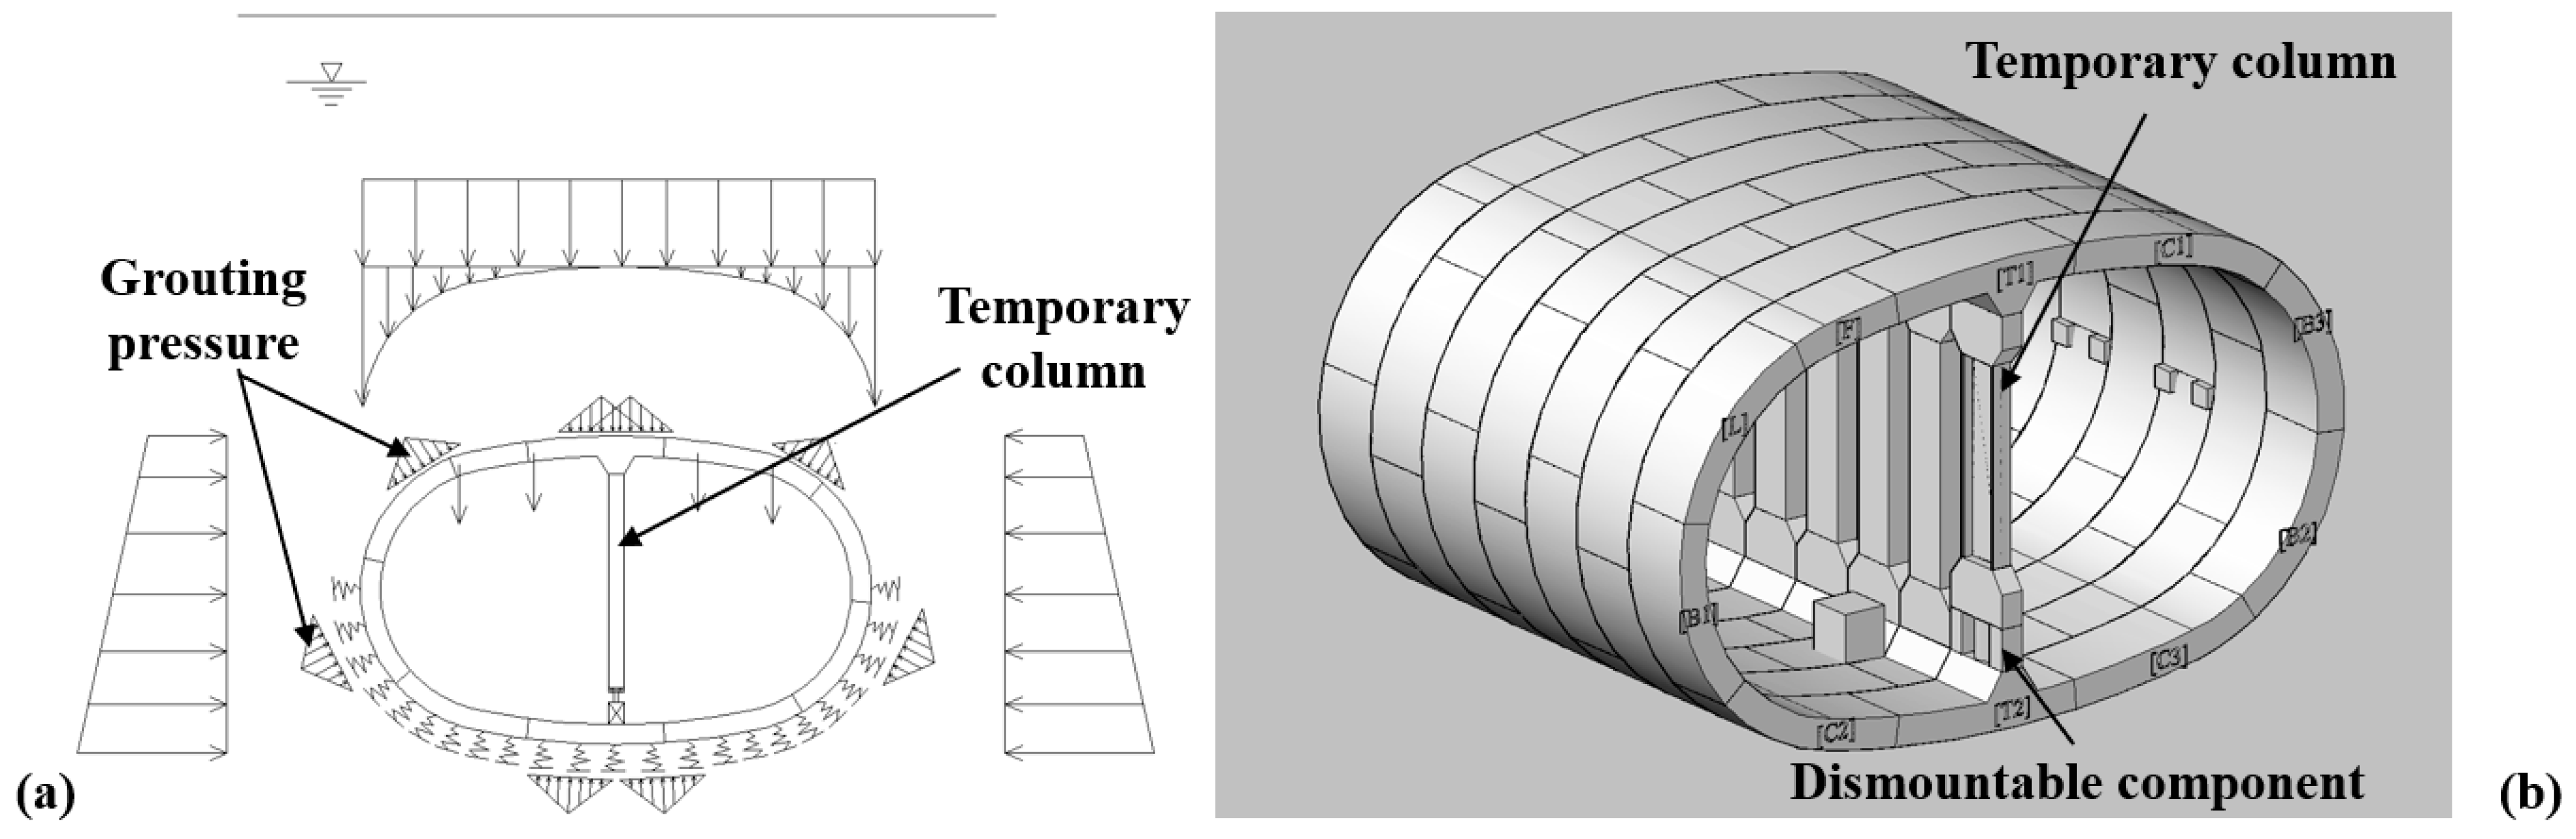
4.1. Structural Design during the Construction Process

In addition to considering the structural bearing state during the service stage, as highlighted in Section 2 and Section 3, special attention must be paid to ensuring the structural safety of column-free QRST structures during the construction stage [43,44], including the assembly condition and simultaneous grouting condition. Among these conditions, the simultaneous grouting condition is one of the governing conditions during the tunnel design, potentially inducing substantial structural responses [20]. To ensure structural safety, as shown in Figure 15, a temporary column is utilized to regulate the structural response starting from the assembly condition; this will then be removed when the structure enters the service stage.
Similar construction solutions are often applied. During the construction of large-section tunnels, non-circular tunnels, or tunnels with considerable openings, the structure is often subjected to high external temporary loads or the structural system itself has not yet been fully completed. Therefore, necessary temporary supports are needed [45]. For example, during the construction of connecting aisles using the mechanized drilling method, auxiliary facilities such as internal supports are needed to control the structural response during the cutting process, thereby ensuring the stability of the structure [46].
Given the applicability of the ESHR model for tunnel design, it serves as a tool for comprehensively assessing the structural behavior throughout the construction process, facilitating both understanding and engineering applications. The simulation of structural behavior during the entire construction process is divided into the following three stages:
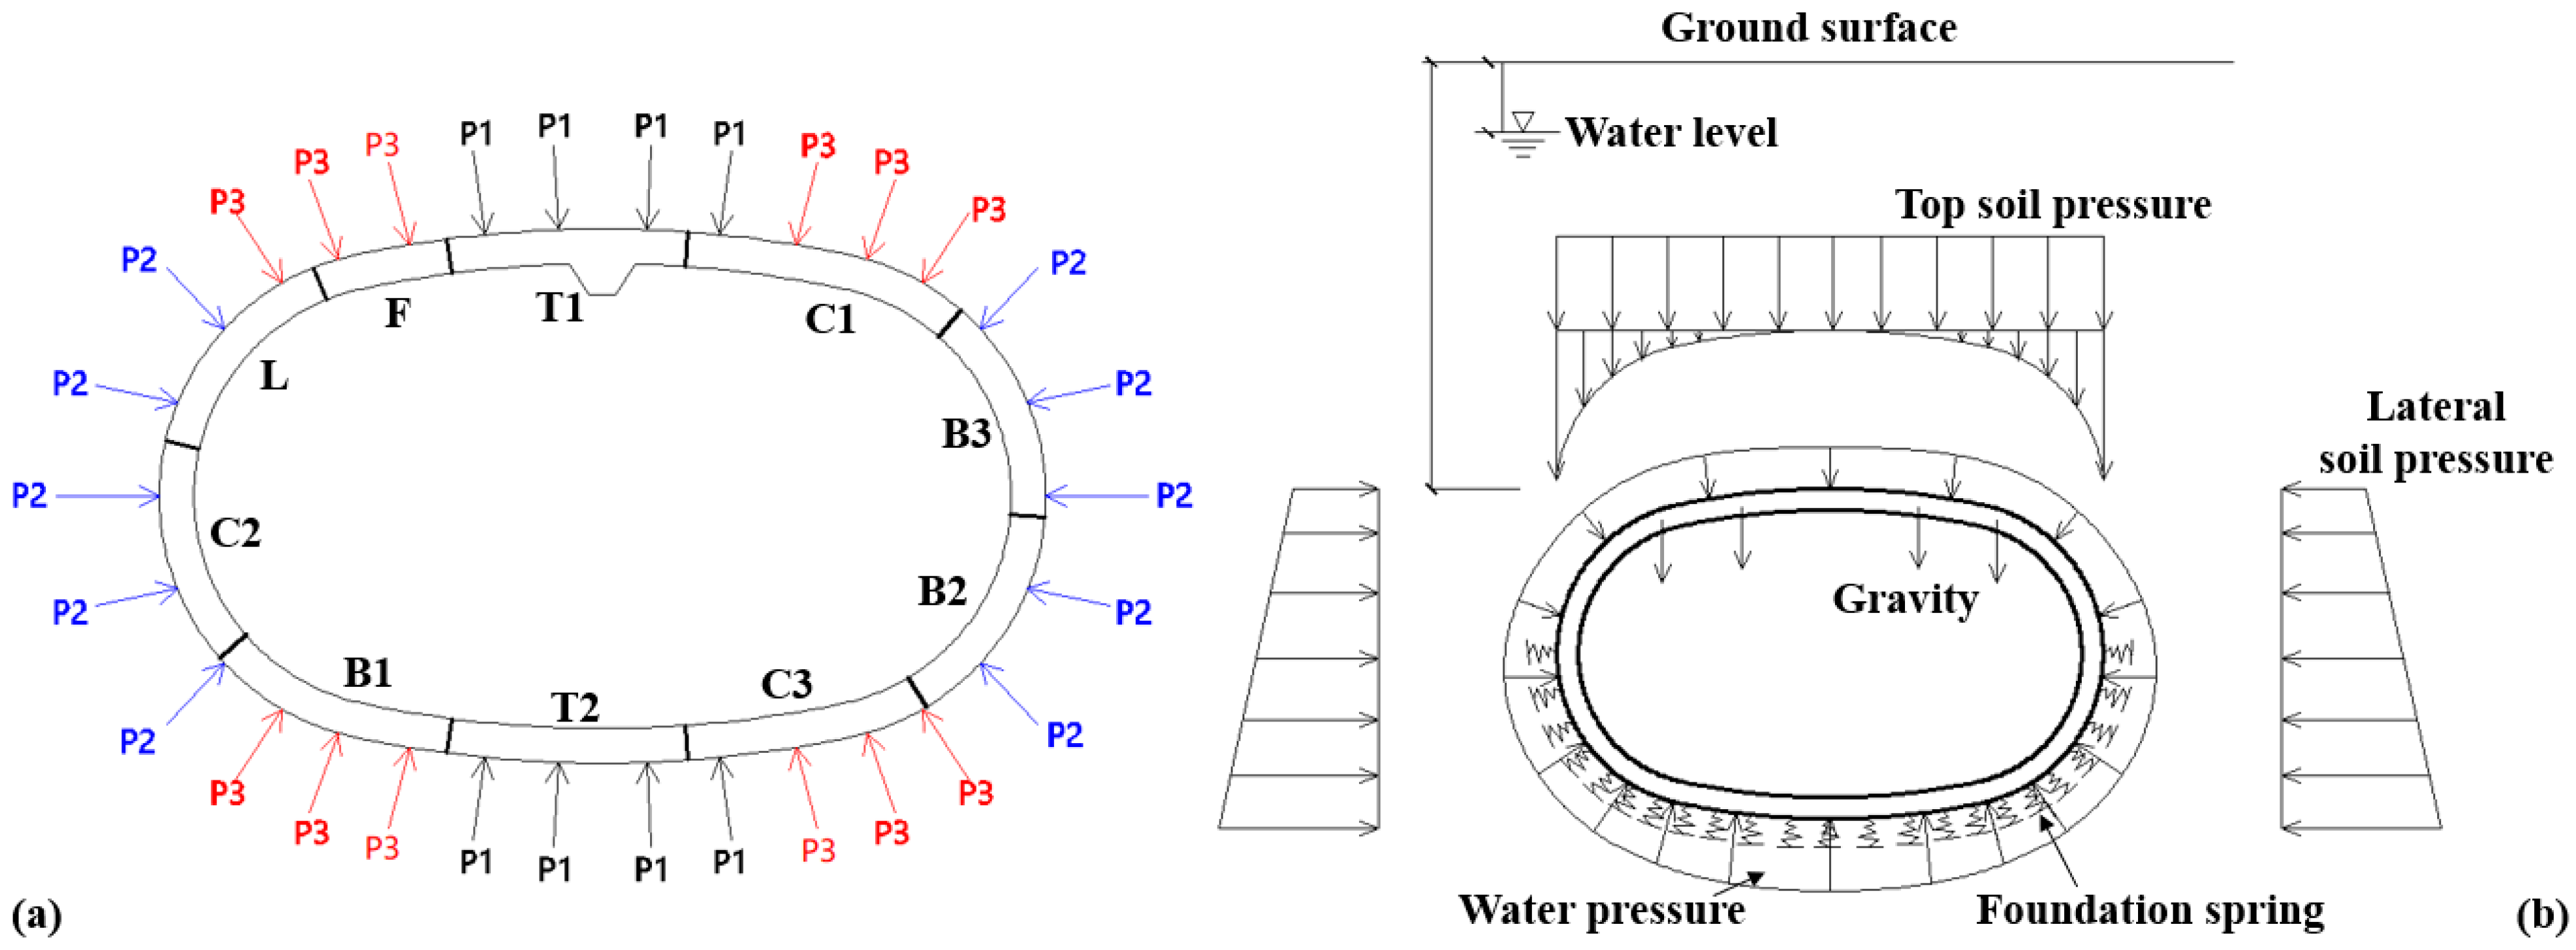
  • Synchronous grouting condition. After the tunnel structure comes out from the shield tail, the external soil–water pressure and grouting pressure are resisted by the column-free QRST structure and the temporary support, the load-bearing state of which is similar to that of the typical QRST structure, as shown in Figure 15.
  • Stable load condition. As the grouting pressure gradually dissipates and the external load stabilizes, the structure undergoes an unloading process while the structural form remains unchanged.
  • Column removal condition. Subsequently, the temporary column is removed slowly to ignore the dynamic structural response. During this process, soil–structure interaction is simulated by a set of foundation springs surrounding the tunnel structure. The final state of the structure is the same as that depicted in Figure 6b.
Based on the above-mentioned three-stage calculation method, total results of structural responses are obtained. The method outlined in Section 3, which involves directly applying the external load during the service stage, is called the direct calculation method. Subsequently, a comparative analysis of internal forces at critical positions is conducted between the direct calculation method and the three-stage calculation method, as outlined in Table 6. Compared with the results calculated by the direct calculation method, those calculated by the three-stage calculation method exhibit a slight elevation of up to 8%. Additionally, regarding the structural deformation, structural convergence deformations calculated using the three-stage calculation method are about 5%–6% higher than those calculated using the direct calculation method. Therefore, to facilitate engineering applications, it is recommended that the direct calculation method be used for the design of column-free QRST structures, with the calculated results augmented by 10% to ensure structural safety.

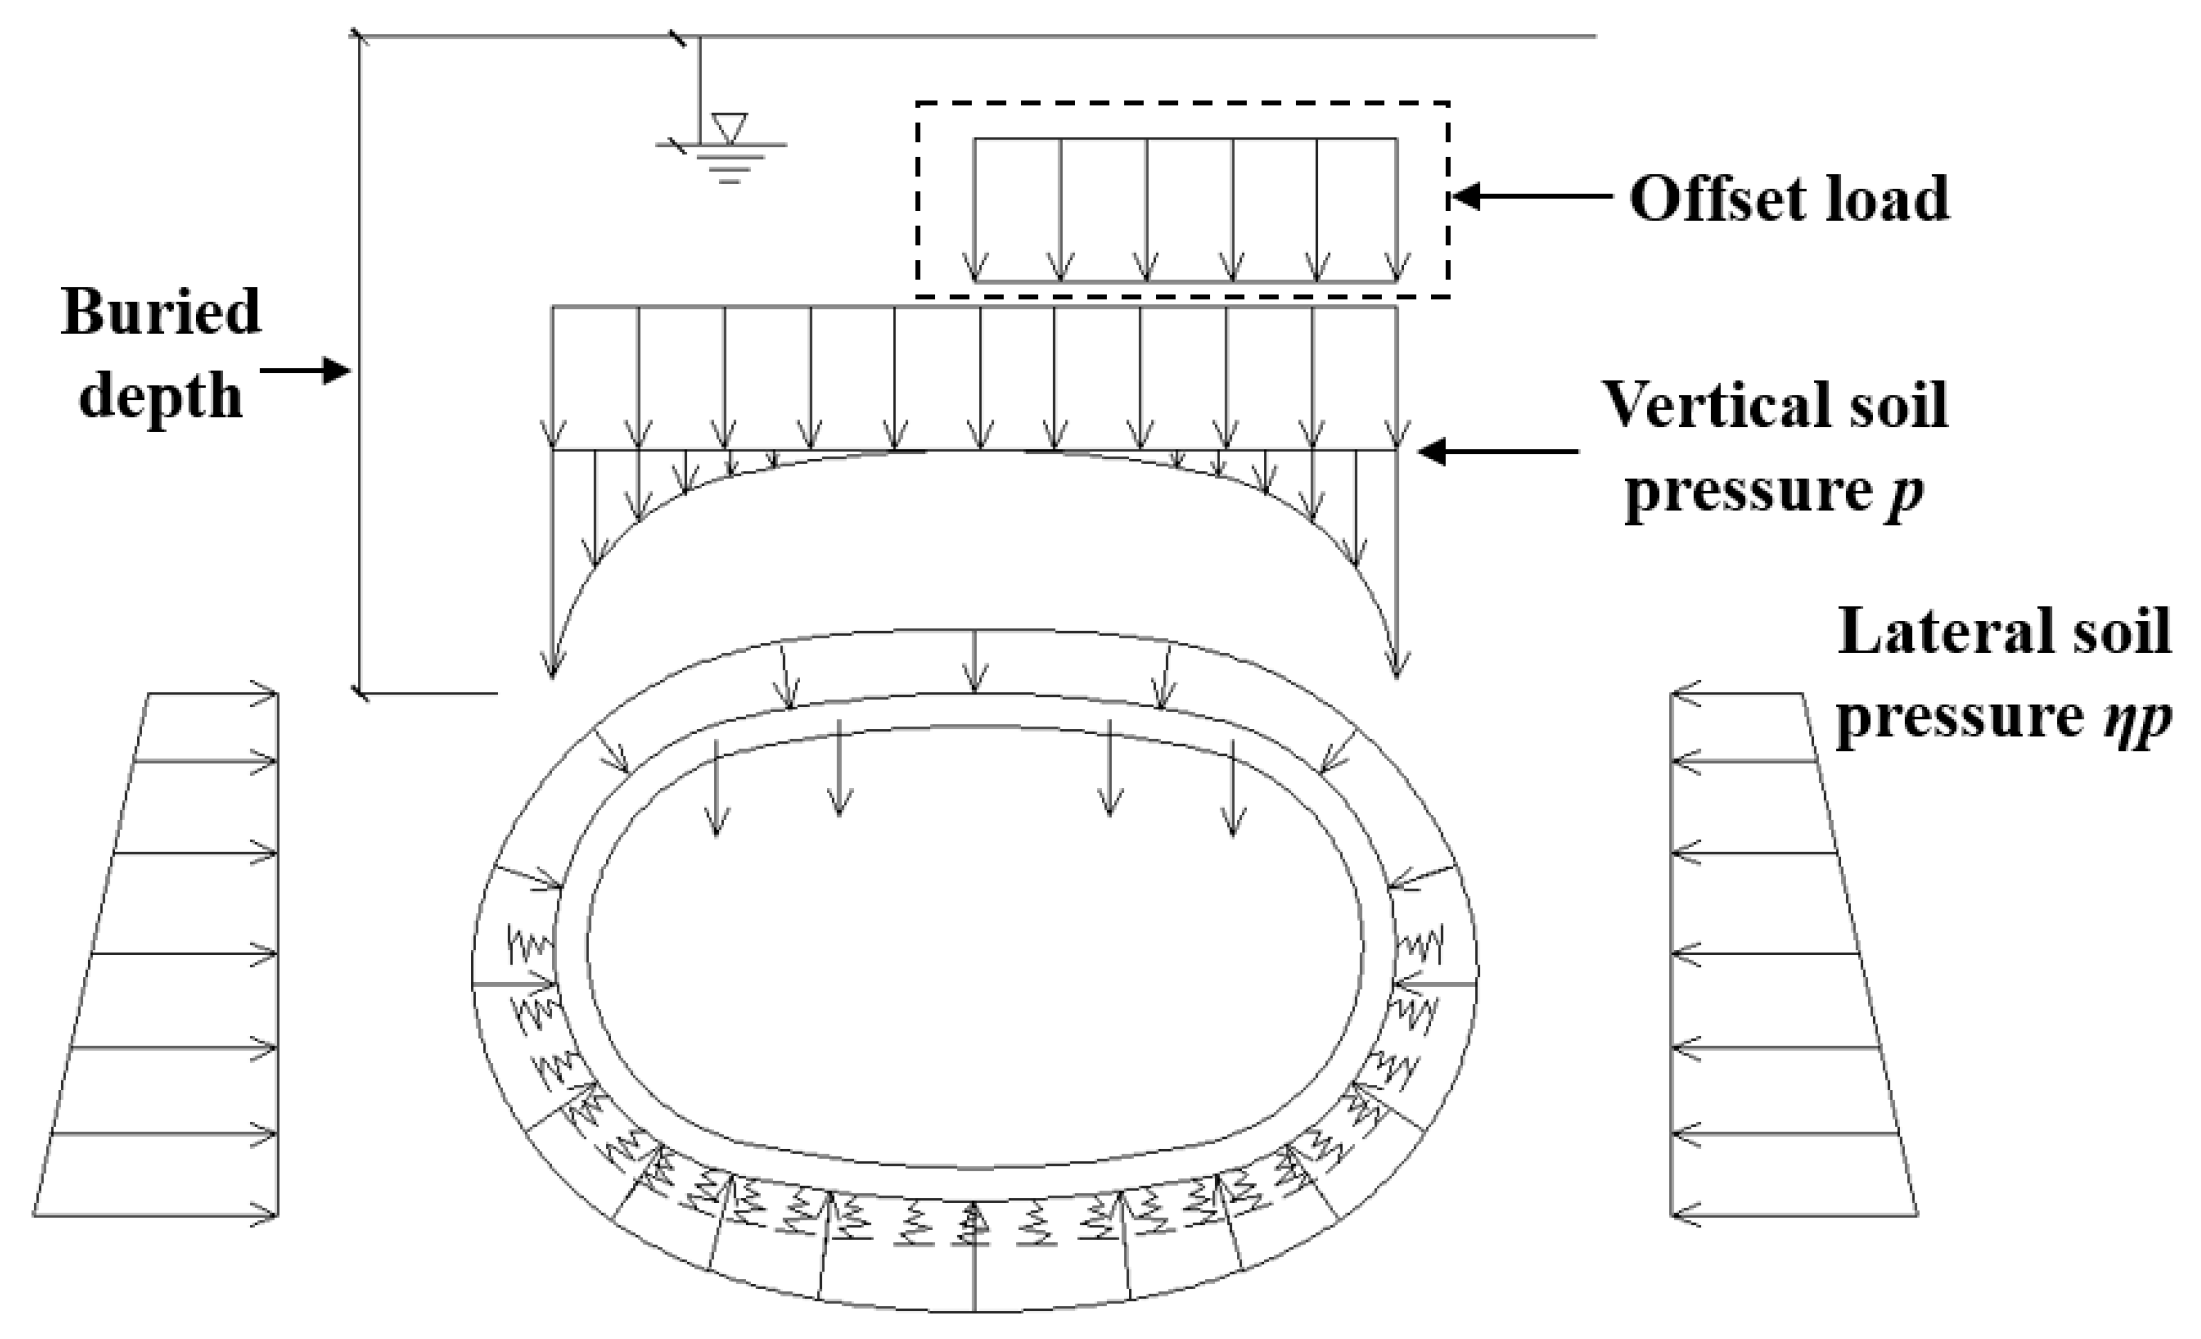
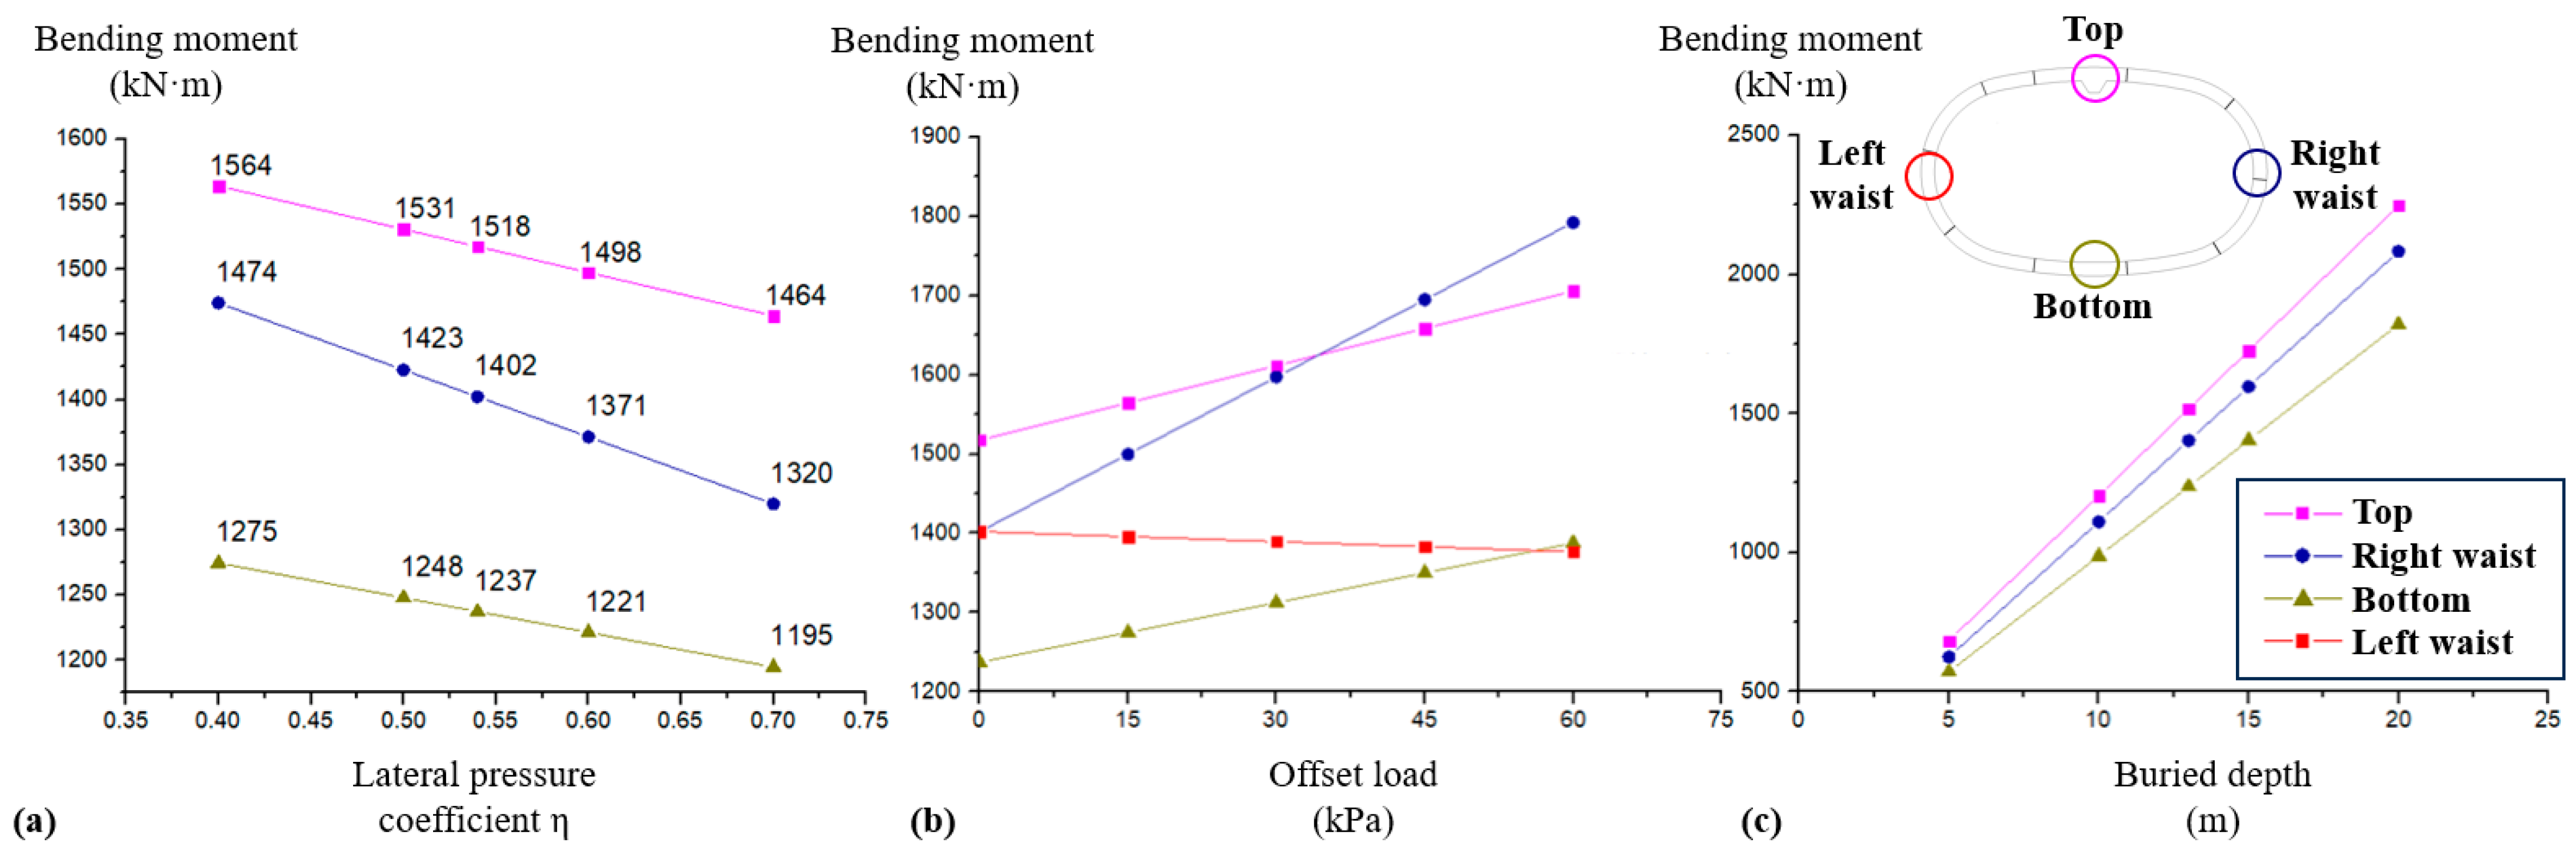
4.2. Sensitivity Analysis of Key Load Parameters

In the shield tunnel design, the deformation and internal forces of the structure stand as crucial design indicators. Moreover, the influence of surrounding environmental disturbances on structures is becoming increasingly important [47,48]. In this Section, the influence of different load parameters on structural response is investigated using the ESHR model and the direct calculation method. The investigated load parameters include the lateral pressure coefficient η, offset load, and buried depth, with their respective values summarized in Table 7. These three load parameters are visually depicted in Figure 16.
For ease of understanding, the influence of evolving load parameters on the bending moment (absolute value) at critical positions on the structure is presented in Figure 17. According to the calculation results, when the lateral pressure coefficient η decreases from 0.7 to 0.4, the positive bending moments at the top and bottom of the structure increase by 6.8–11.7%, while the negative bending moment at the waist increases by 21.8%. The results show that with the gradual decrease in the lateral pressure coefficient η, i.e., lateral unloading condition, the overall structural response shows an unfavorable trend and the most sensitive part is the negative moment regions at the waist of the structure.
When the offset load increases from 0 to 60 kPa (right side), the positive bending moments at the top and bottom of the structure increase by 12.2–12.4%, while the negative bending moment at the right waist of the structure increases by 27.8%. However, the negative bending moment on the left waist of the structure decreases by 1.8%. The results show that the offset load primarily affects the internal force of the structure on its offset side, especially for the negative moment region at the offset side waist of the structure.
When the buried depth of the structure increases from 13 m to 20 m, the bending moments generally exhibit a 47.1% to 48.5% increase. When the buried depth of the structure decreases from 13 m to 5 m, the bending moments generally exhibit a 53.8–55.4% decrease. As the buried depth changes, the changes in the overall response of the structure maintain a similar changing ratio, with similar sensitivity.
In summary, adverse alterations in the lateral pressure coefficient η and offset load particularly impact the negative bending moment regions at the waists of the structure. Conversely, changes in the buried depth correlate proportionally with structural responses. Given that negative bending moment joints at the waist open on the extrados sides, and bolts of negative bending moment joints endure relatively higher forces, meticulous attention should be paid to the mechanical behavior and water-proofing capacity of the negative bending moment regions at the waists of column-free QRST structures.

4.3. Engineering Recommendations

To ensure the structural integrity and safety of the tunnel lining, the following engineering recommendations are proposed based on the research findings:
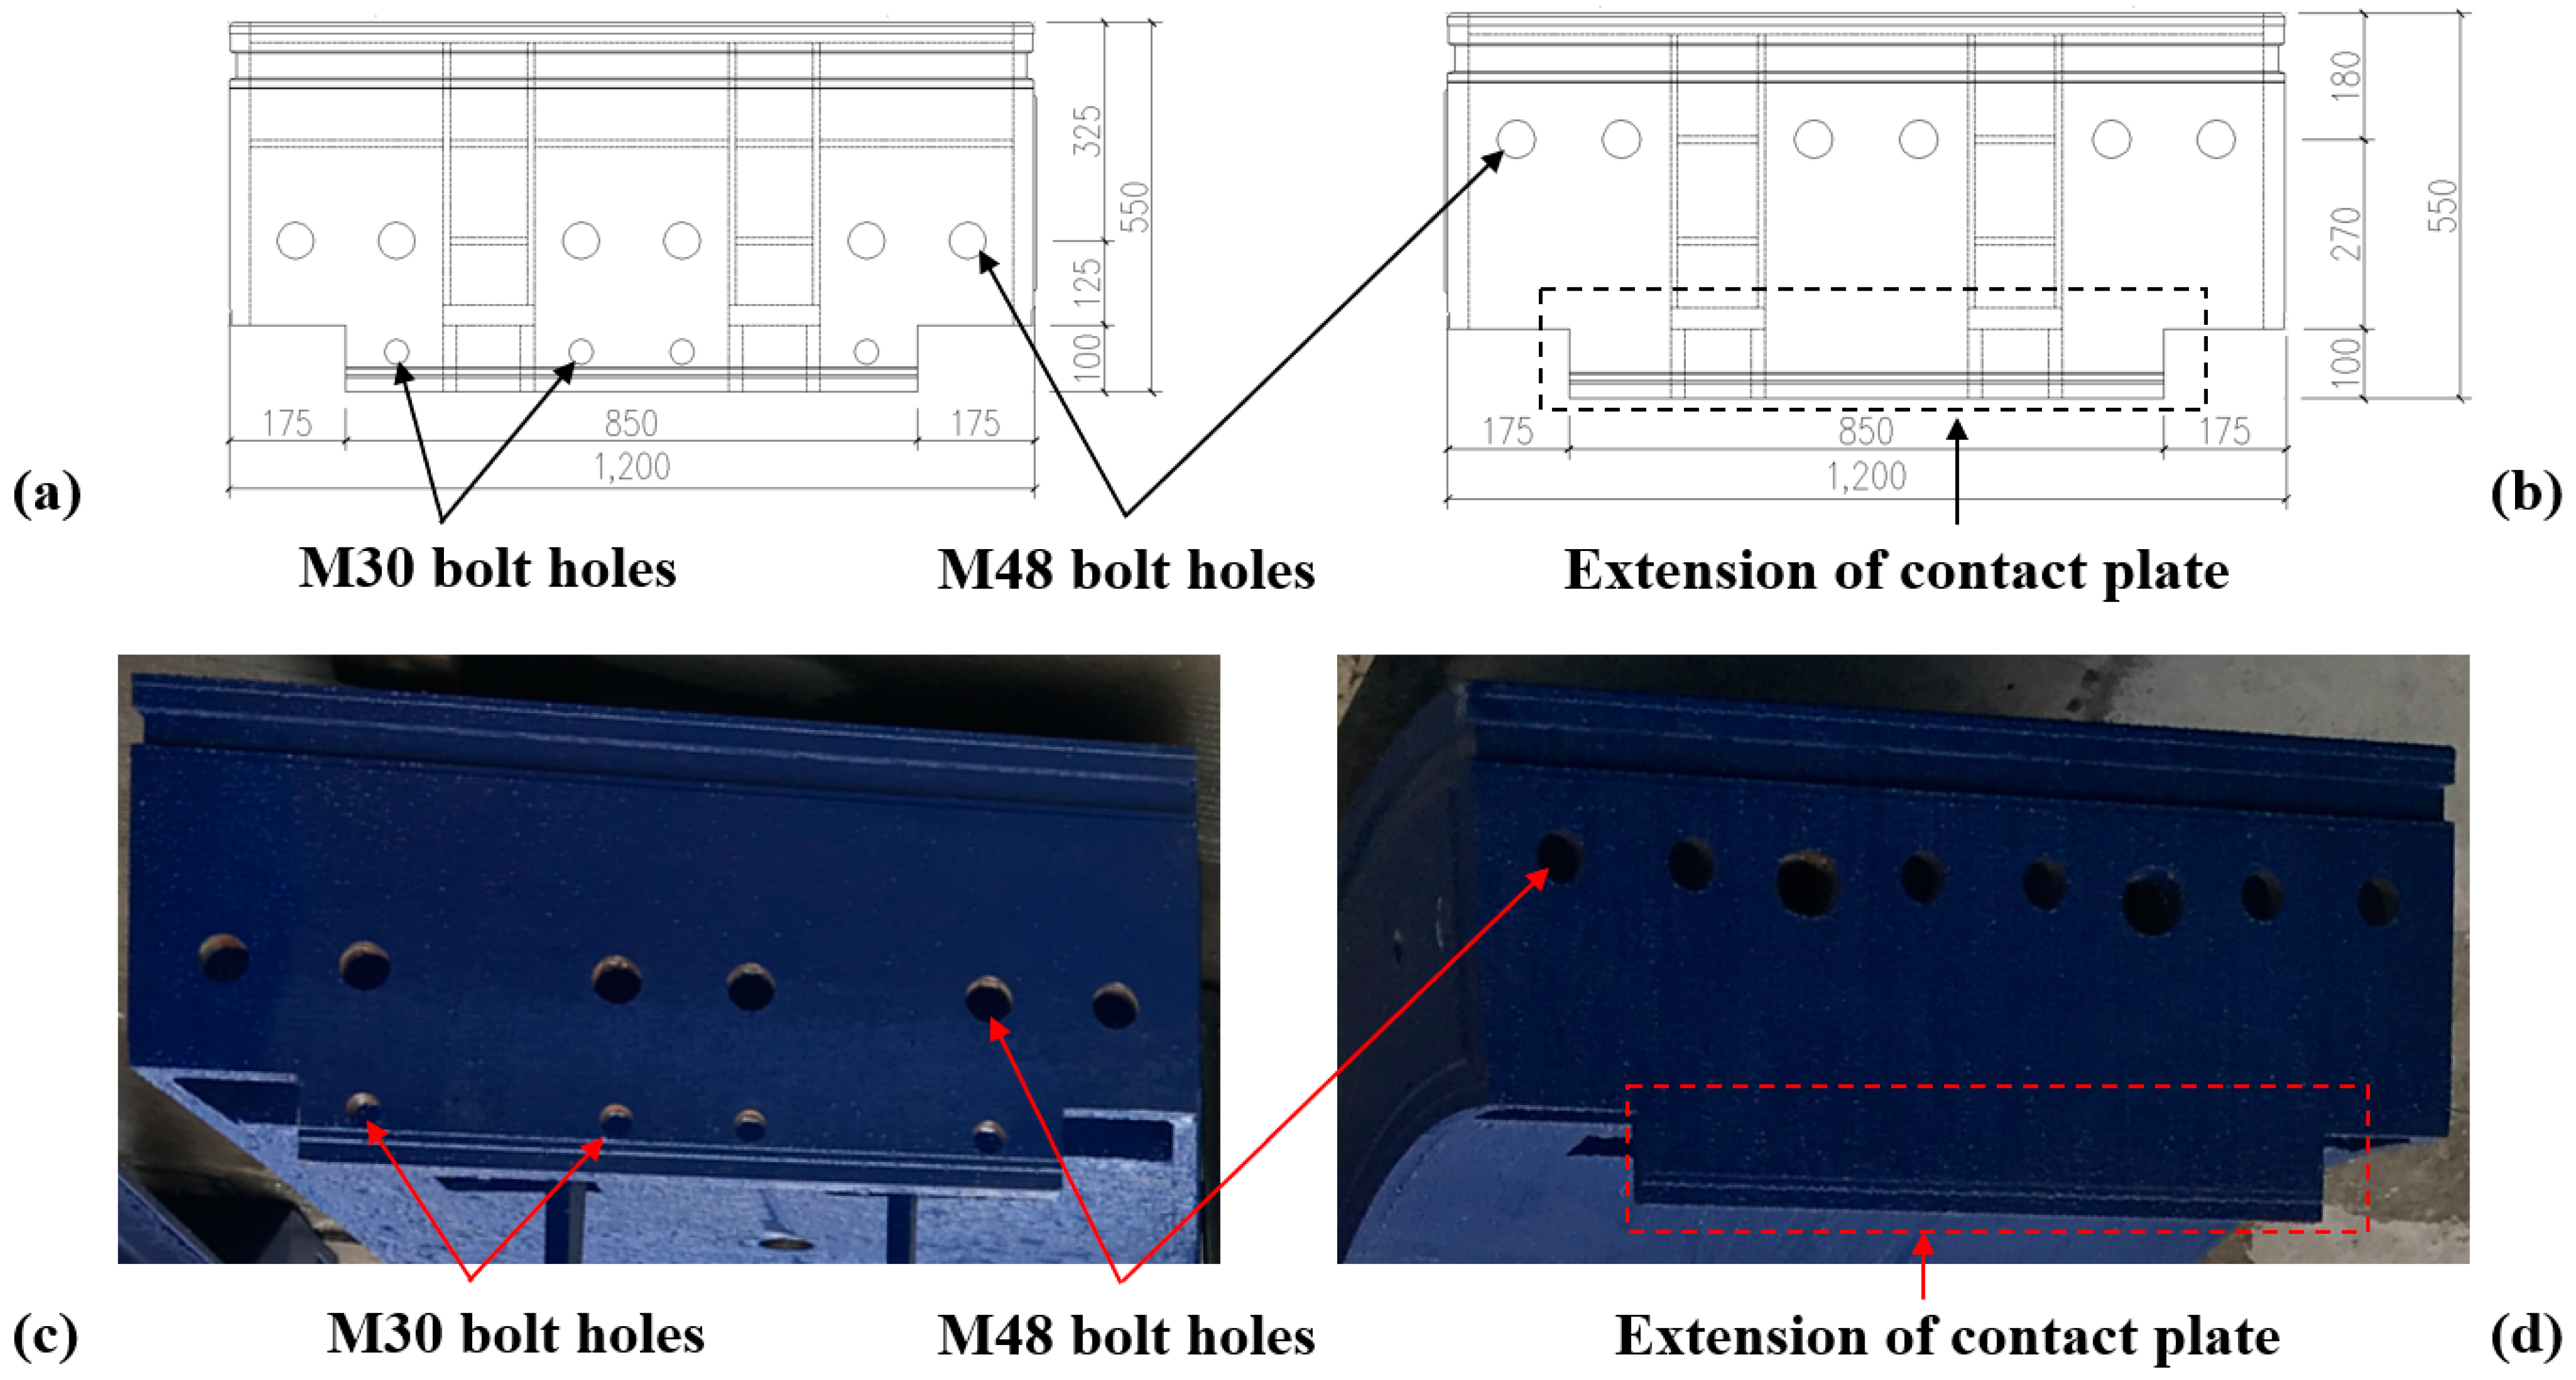
  • Joints: All joint contact plates can be fully extended with a width of 1200 mm. For positive moment joints, change the positions of M48 bolts and M30 bolts to fully exploit the load-bearing capacity of M48 bolts. For negative moment joints with waterproofing permitted, the position of bolts is suggested to be fully moved toward the external surface direction.
  • Temporary support: Considering the additional loads during the construction stage beyond the loads considered in the service stage, it is suggested that temporary support be employed to ensure structural safety.
  • Segmentation and joint positions: After canceling interior columns, the joints are now situated at relatively unfavorable positions compared to typical QRSTs with interior columns. It is recommended that larger segments be used at the top, bottom, and waists to mitigate the joints’ exposure to high bending moments, thereby further reducing overall structural deformation.
  • Ring-to-ring interaction: The experiments and simulations conducted are focused on single-ring structures and do not account for the interaction effects between rings in real tunnels. In practice, QRSTs are assembled in a staggered fashion. With the help of circumferential joints, structural deformation can be reduced. It is suggested that tongue-and-groove or shear keys be used to ensure the overall integrity of the tunnel system.

5. Conclusions

In this study, a theoretical investigation of the mechanical behavior of column-free QRST structures based on prototype experiments and numerical models is conducted. The structural performance, deformation characteristics, and joint behavior under service stage conditions are fully explored. The applicability of different simulation models is compared. Additionally, design studies that consider the construction process are conducted. Through the study, the deformation mechanism and weak parts of the structure are revealed, providing suggestions for the engineering application for this new type of structure. The following conclusions are drawn:
  • At the service stage with a designed buried depth of 13 m, the inward vertical convergence deformation along the short axis of the structure is 108.64 mm, while the outward horizontal convergence deformation along the long axis is 49.03 mm. The column-free QRST structure predominantly experiences inward deformation;
  • The development of joint deformations and bolt axial forces indicates that as the load level increases, among the positive moment joints, deformations and internal forces of Joints 1 and 5 develop faster than those of Joints 6 and 10. For negative moment joints, Joints 3 and 8 exhibit faster development compared to Joints 2 and 7, with Joints 4 and 9 exhibiting only rapid initial development. Based on the experimental results, it is recommended that the bolt dimension and bolt position for negative moment joints be optimized, and the rows of M48 and M30 bolts be repositioned for positive moment joints, with the help of sophisticated finite element models;
  • The experimental results indicate that the deformation and internal force distribution of the structure are mainly determined by the shape of the tunnel cross-section and joint distribution. The span of the structure in the horizontal direction results in significant convergence deformation along the short axis at the top and bottom. Based on the given distribution of the joints, the structural deformations at the top and bottom exhibit an axis symmetricity with respect to the long axis of the structure, while those at the waists exhibit a central symmetry with respect to the center of the structure;
  • The ESHR model, BS model, and MBS model are capable of reflecting the mechanical performance of column-free QRST structures. The BS and MBS models exhibit better simulation effects, particularly for local deformations near joints, while the ESHR model can serve as a design model for structures with appropriate calculation parameters;
  • The deformations contributed by joints in column-free QRST structures account for approximately 65–70%, indicating optimization potentials for joints;
  • When using the ESHR model to design column-free QRST structures subjected to the construction process, the results calculated by the three-stage calculation method are more reliable. For ease of engineering applications, structural responses calculated by the direct calculation method, with the response magnified by 10%, is sufficient to ensure structural safety;
  • The influence of structural buried depth on structural response is generally proportional. In cases of changes in offset load and lateral pressure coefficient, the negative bending moment regions at the waists of the structure are more sensitive. Considering unexpected conditions such as ground surface surcharge or adjacent construction activities during the service period, special attention should be paid to the structural safety reserves of the negative bending moment regions at the waists.
Currently, the research on the structural performance of column-free QRST structures in this paper is limited to laboratory experiments. Only the performance of a single-ring structure has been studied, and the influence of adjacent rings in actual tunnels has not been considered. In the future, the bearing performance of the structure will be further optimized by working with more support structures such as prestressing structures and active control structures. The mechanical behavior of structures in actual tunnels will also be further explored through in situ tests. By acknowledging these limitations and proposing future directions, we aim to foster ongoing advancements in the field of column-free QRST structures and similar non-circular tunnel structures.

Author Contributions

Conceptualization, X.L., Y.C. and Y.W.; methodology, Z.L. and X.L.; software, Z.L.; validation, Z.L. and X.L.; investigation, Z.L. and X.L.; resources, X.L., Y.C. and Y.W.; data curation, Z.L.; writing—original draft preparation, Z.L.; writing—review and editing, X.L., Y.C. and Y.W.; visualization, Z.L.; supervision, X.L., Y.C. and Y.W.; project administration, X.L., Y.C. and Y.W.; funding acquisition, X.L., Y.C. and Y.W. All authors have read and agreed to the published version of the manuscript.

Funding

This research was funded by the State Grid Corporation of China science and technology project “Research and Application of Key Technology for Online Monitoring of Transmission Pipeline Corridor Structural Health Status Based on Fiber Optic Micro- and Nanoscale Measurements” (grant number 5700-202313621A-3-2-ZN).

Institutional Review Board Statement

Not applicable.

Informed Consent Statement

Not applicable.

Data Availability Statement

The original contributions presented in the study are included in the article, further inquiries can be directed to the corresponding author.

Conflicts of Interest

Author Yizheng Chen was employed by the company Technology and Application, State Grid Smart Grid Research Institute Co., Ltd. Author Yuebin Wu was employed by the company State Grid Hebei Electric Power Co., Ltd. The remaining authors declare that the research was conducted in the absence of any commercial or financial relationships that could be construed as a potential conflict of interest.

References

  1. Broere, W. Urban underground space: Solving the problems of today’s cities. Tunn. Undergr. Sp. Technol. 2016, 55, 245–248. [Google Scholar] [CrossRef]
  2. Latif, K.; Sharafat, A.; Seo, J. Digital twin-driven framework for TBM performance prediction, visualization, and monitoring through machine learning. Appl. Sci. 2023, 13, 11435. [Google Scholar] [CrossRef]
  3. Sharafat, A.; Latif, K.; Seo, J. Risk analysis of TBM tunneling projects based on generic bow-tie risk analysis approach in difficult ground conditions. Tunn. Undergr. Sp. Technol. 2021, 111, 103860. [Google Scholar] [CrossRef]
  4. Wasantha, P.; Guerrieri, M.; Xu, T. Effects of tunnel fires on the mechanical behaviour of rocks in the vicinity–A review. Tunn. Undergr. Sp. Technol. 2021, 108, 103667. [Google Scholar] [CrossRef]
  5. Yu, C.; Zhou, A.; Chen, J.; Arulrajah, A.; Horpibulsuk, S. Analysis of a tunnel failure caused by leakage of the shield tail seal system. Undergr. Space 2020, 5, 105–114. [Google Scholar] [CrossRef]
  6. Ye, G.-L.; Hashimoto, T.; Shen, S.-L.; Zhu, H.-H.; Bai, T.-H. Lessons learnt from unusual ground settlement during Double-O-Tube tunnelling in soft ground. Tunn. Undergr. Sp. Technol. 2015, 49, 79–91. [Google Scholar] [CrossRef]
  7. Liu, X.; Liu, Z.; Yuan, Y.; Zhu, Y. Quasi-Rectangular Shield Tunneling Technology in the Ningbo Rail Transit Project. In High Tech Concrete: Where Technology and Engineering Meet, Proceedings of the 2017 Fib Symposium, Maastricht, The Netherlands, 12–14 June 2017; Springer International Publishing: Berlin/Heidelberg, Germany, 2018; pp. 2765–2773. [Google Scholar]
  8. Zhang, W.; De Corte, W.; Liu, X.; Taerwe, L. Optimization Study on Longitudinal Joints in Quasi-Rectangular Shield Tunnels. Appl. Sci. 2021, 11, 573. [Google Scholar] [CrossRef]
  9. Liu, X.; Liu, Z.; Ye, Y.; Bai, Y.; Zhu, Y. Mechanical behavior of quasi-rectangular segmental tunnel linings: Further insights from full-scale ring tests. Tunn. Undergr. Sp. Technol. 2018, 79, 304–318. [Google Scholar] [CrossRef]
  10. Chow, B. Double-O-tube shield tunneling technology in the Shanghai Rail Transit Project. Tunn. Undergr. Sp. Technol. 2006, 21, 594–601. [Google Scholar] [CrossRef]
  11. Liu, X.; Hu, X.; Guan, L.; Sun, W. The ultimate bearing capacity of rectangular tunnel lining assembled by composite segments: An experimental investigation. Steel Compos. Struct. 2017, 24, 481–497. [Google Scholar] [CrossRef]
  12. Zhu, Y.; Zhang, Z.; Huang, X.; Zhu, Y.; Wang, S. Exploring the progressive failure characteristics of a large special-shaped shield tunnel lining based on ‘standing’prototype loading tests. Tunn. Undergr. Sp. Technol. 2019, 93, 103107. [Google Scholar] [CrossRef]
  13. Zhang, Z.; Zhu, Y.; Huang, X.; Zhu, Y.; Liu, W. ‘Standing’full-scale loading tests on the mechanical behavior of a special-shape shield lining under shallowly-buried conditions. Tunn. Undergr. Sp. Technol. 2019, 86, 34–50. [Google Scholar] [CrossRef]
  14. Nakamura, H.; Kubota, T.; Furukawa, M.; Nakao, T. Unified construction of running track tunnel and crossover tunnel for subway by rectangular shape double track cross-section shield machine. Tunn. Undergr. Sp. Technol. 2003, 18, 253–262. [Google Scholar] [CrossRef]
  15. Du, D.; Dias, D.; Do, N. Lining performance optimization of sub-rectangular tunnels using the Hyperstatic Reaction Method. Comput. Geotech. 2020, 117, 103279. [Google Scholar] [CrossRef]
  16. Zhang, W.; De Corte, W.; Liu, X.; Taerwe, L. Influence of rotational stiffness modeling on the joint behavior of quasi-rectangular shield tunnel linings. Appl. Sci. 2020, 10, 8396. [Google Scholar] [CrossRef]
  17. Zhang, L.; Feng, K.; He, C.; Yang, W.; Zhang, J.; Xiao, M. Numerical investigation of the compression–bending stiffness of segmental joints with different types of joint surfaces. Tunn. Undergr. Sp. Technol. 2023, 132, 104898. [Google Scholar] [CrossRef]
  18. Hu, X.; Zhang, Z.; Teng, L. An analytical method for internal forces in DOT shield-driven tunnel. Tunn. Undergr. Sp. Technol. 2009, 24, 675–688. [Google Scholar] [CrossRef]
  19. Shen, S.-L.; Horpibulsuk, S.; Liao, S.-M.; Peng, F.-L. Analysis of the behavior of DOT tunnel lining caused by rolling correction operation. Tunn. Undergr. Sp. Technol. 2009, 24, 84–90. [Google Scholar] [CrossRef]
  20. Shen, S.-L.; Du, Y.-J.; Luo, C.-Y. Evaluation of the effect of rolling correction of double-o-tunnel shields via one-side loading. Can. Geotech. J. 2010, 47, 1060–1070. [Google Scholar] [CrossRef]
  21. Huang, X.; Zhu, Y.; Zhang, Z.; Zhu, Y.; Wang, S.; Zhuang, Q. Mechanical behaviour of segmental lining of a sub-rectangular shield tunnel under self-weight. Tunn. Undergr. Sp. Technol. 2018, 74, 131–144. [Google Scholar] [CrossRef]
  22. Hefny, A.M.; Chua, H.C. An investigation into the behaviour of jointed tunnel lining. Tunn. Undergr. Sp. Technol. 2006, 21, 428. [Google Scholar] [CrossRef]
  23. Ding, Z.; Zhang, X.; He, S.-H.; Qi, Y.-J.; Lin, C.-G. Experimental and theoretical study on longitudinal deformation and internal force of shield tunnel under surcharge. Tunn. Undergr. Sp. Technol. 2024, 144, 105506. [Google Scholar] [CrossRef]
  24. Zhang, J.-Z.; Huang, H.-W.; Zhang, D.-M.; Phoon, K.K. Experimental study of the coupling effect on segmental shield tunnel lining under surcharge loading and excavation unloading. Tunn. Undergr. Sp. Technol. 2023, 140, 105199. [Google Scholar] [CrossRef]
  25. Shi, C.; Cao, C.; Lei, M.; Peng, L.; Ai, H. Effects of lateral unloading on the mechanical and deformation performance of shield tunnel segment joints. Tunn. Undergr. Sp. Technol. 2016, 51, 175–188. [Google Scholar] [CrossRef]
  26. Wu, H.N.; Chen, S.; Chen, R.P.; Cheng, H.Z.; Feng, D.L. Deformation behaviors and failure mechanism of segmental RC lining under unloading condition. Tunn. Undergr. Sp. Technol. 2022, 130, 104687. [Google Scholar] [CrossRef]
  27. Liang, R.; Kang, C.; Xiang, L.; Li, Z.; Lin, C.; Gao, K.; Guo, Y. Responses of in-service shield tunnel to overcrossing tunnelling in soft ground. Environ. Earth Sci. 2021, 80, 183. [Google Scholar] [CrossRef]
  28. Liang, R.; Wu, W.; Yu, F.; Jiang, G.; Liu, J. Simplified method for evaluating shield tunnel deformation due to adjacent excavation. Tunn. Undergr. Sp. Technol. 2018, 71, 94–105. [Google Scholar] [CrossRef]
  29. Schreyer, J.; Winselmann, D. Suitability tests for the lining for the 4th Elbe tunnel tube–Results of large-scale tests. Tunnel 2000, 1, 34–44. [Google Scholar]
  30. Lu, L.; Lu, X.; Fan, P. Full-ring experimental study of the lining structure of Shanghai Changjiang tunnel. J. Civ. Eng. Archit. 2011, 5, 300–305. [Google Scholar]
  31. Zhu, Y.; Zhu, Y.; Wang, Q.; Zhang, Z.; Huang, X.; Liu, W. Prototype Loading Tests on the Mechanical behaviors of the Shield Lining Structure of a Water Storage and Sewage Tunnel. In Proceedings of the WTC 2020, Kuala Lumpur, Malaysia, 15–21 May 2020; pp. 2314–2516. [Google Scholar]
  32. Liu, X.; Ye, Y.; Liu, Z.; Huang, D. Mechanical behavior of Quasi-rectangular segmental tunnel linings: First results from full-scale ring tests. Tunn. Undergr. Sp. Technol. 2018, 71, 440–453. [Google Scholar] [CrossRef]
  33. Huang, X.; Liu, W.; Zhang, Z.; Wang, Q.; Wang, S.; Zhuang, Q.; Zhu, Y.; Zhang, C. Exploring the three-dimensional response of a water storage and sewage tunnel based on full-scale loading tests. Tunn. Undergr. Sp. Technol. 2019, 88, 156–168. [Google Scholar] [CrossRef]
  34. Li, X.J.; Yan, Z.G.; Wang, Z.; Zhu, H.H. Experimental and analytical study on longitudinal joint opening of concrete segmental lining. Tunn. Undergr. Sp. Technol. 2015, 46, 52–63. [Google Scholar] [CrossRef]
  35. Tsiampousi, A.; Yu, J.; Standing, J.; Vollum, R.; Potts, D. Behaviour of bolted cast iron joints. Tunn. Undergr. Sp. Technol. 2017, 68, 113–129. [Google Scholar] [CrossRef]
  36. Yu, J.; Standing, J.; Vollum, R.; Potts, D.; Burland, J. Experimental investigations of bolted segmental grey cast iron lining behaviour. Tunn. Undergr. Sp. Technol. 2017, 61, 161–178. [Google Scholar] [CrossRef]
  37. Fukuchi, G. The present and future of mechanized tunnel works in soft ground. Tunn. Undergr. Sp. Technol. 1991, 6, 175–183. [Google Scholar] [CrossRef]
  38. Uchida, K. Design and engineering of large bore slurry shield tunnel lining system for Trans-Tokyo Bay Highway. Civ. Eng. Jpn. 1992, 30, 54–67. [Google Scholar]
  39. Lee, K.; Hou, X.; Ge, X.; Tang, Y. An analytical solution for a jointed shield-driven tunnel lining. Int. J. Numer. Anal. Methods Geomech. 2001, 25, 365–390. [Google Scholar] [CrossRef]
  40. Madenci, E.; Guven, I. The Finite Element Method and Applications in Engineering Using ANSYS®; Springer: New York, NY, USA, 2015. [Google Scholar]
  41. Ding, W.; Peng, Y.; Yan, Z.; Shen, B.; Zhu, H.; Wei, X. Full-scale testing and modeling of the mechanical behavior of shield TBM tunnel joints. Struct. Eng. Mech. Int. J. 2013, 45, 337–354. [Google Scholar] [CrossRef]
  42. Tvede-Jensen, B.; Faurschou, M.; Kasper, T. A modelling approach for joint rotations of segmental concrete tunnel linings. Tunn. Undergr. Sp. Technol. 2017, 67, 61–67. [Google Scholar] [CrossRef]
  43. Blom, C.B.M. Design Philosophy of Concrete Linings for Tunnels in Soft Soils. Ph.D. Thesis, Technische Universiteit Delft, Delft, The Netherlands, 2004. [Google Scholar]
  44. Ding, W.; Duan, C.; Zhu, Y.; Zhao, T.; Huang, D.; Li, P. The behavior of synchronous grouting in a quasi-rectangular shield tunnel based on a large visualized model test. Tunn. Undergr. Sp. Technol. 2019, 83, 409–424. [Google Scholar] [CrossRef]
  45. Zhou, Z.; Zhao, J.; Tan, Z.; Zhou, X. Mechanical responses in the construction process of super-large cross-section tunnel: A case study of Gongbei tunnel. Tunn. Undergr. Sp. Technol. 2021, 115, 104044. [Google Scholar] [CrossRef]
  46. Liu, X.; Gao, Y.; Zhang, J.; Zhu, Y. Structural response of main tunnel linings during construction of connecting aisle by means of mechanized drilling. Chin. J. Geotech. Eng. 2020, 42, 951–960. [Google Scholar]
  47. Liang, R.; Xia, T.; Huang, M.; Lin, C. Simplified analytical method for evaluating the effects of adjacent excavation on shield tunnel considering the shearing effect. Comput. Geotech. 2017, 81, 167–187. [Google Scholar] [CrossRef]
  48. Zhang, Q.; Xia, T.; Ding, Z.; Huang, X.; Lin, C. Effect of nearby undercrossing tunneling on the deformation of existing metro tunnel and construction control. Rock Soil Mech. 2016, 37, 3561–3568. [Google Scholar]
Figure 1. Illustration of the difference between typical QRST and column-free QRST.
Applsci 14 02896 g001
Figure 2. Background project for column-free QRST: (a) Top view; (b) Side view.
Applsci 14 02896 g002
Figure 3. Schematic diagram of column-free QRST (mm).
Applsci 14 02896 g003
Figure 4. Diagram of joint surfaces (mm): (a) Schematic diagram of positive moment joint; (b) Schematic diagram of negative moment joint; (c) Photo of positive moment joint; (d) Photo of negative moment joint.
Applsci 14 02896 g004
Figure 5. Prototype test platform for column-free QRST structures.
Applsci 14 02896 g005
Figure 6. Loading states of QRST: (a) Test loading groups; (b) Design load at the service stage.
Applsci 14 02896 g006
Figure 7. Development of structural deformations: (a) Overall structural deformation; (b) Convergence deformations of short and long axes.
Applsci 14 02896 g007
Figure 8. Development of joint rotation angles: (a) Positive moment joints; (b) Negative moment joints.
Applsci 14 02896 g008
Figure 9. Development of bolt axial forces: (a) Positive moment joints; (b) Negative moment joints.
Applsci 14 02896 g009
Figure 10. Full-scale joint test.
Applsci 14 02896 g010
Figure 11. Illustration of the joint influence zone: (a) Configurations of segments and distribution of stress zones; (b) Photo of segment in the joint vicinity.
Applsci 14 02896 g011
Figure 12. Simulation results of the MBS model under the 13 m service stage condition: (a) Bending moment; (b) Axial force; (c) Shear force.
Applsci 14 02896 g012
Figure 13. Comparison of overall structural deformations between experimental results and simulation results based on the three models.
Applsci 14 02896 g013
Figure 14. Illustration of the structure under virtual unit loads used for the calculation of convergence deformations.
Applsci 14 02896 g014
Figure 15. Bearing state of the column-free QRST structure with the temporary column subjected to simultaneous grouting condition: (a) Loading state; (b) 3D illustration.
Applsci 14 02896 g015
Figure 16. Illustration of three load parameters for sensitivity analysis.
Applsci 14 02896 g016
Figure 17. Influence of different load parameters on bending moments at critical positions on the structure: (a) Lateral pressure coefficient η; (b) Offset load; (c) Buried depth.
Applsci 14 02896 g017
Table 1. Statistics of geotechnical parameters of the geology in the background project.
Soil LayerLayer Thickness
(m)
Water Content
(%)
Unit Weight
(kN/m3)
Internal Friction Angle (°)Cohesion
(kPa)
① 2-Clay0.6~3.427.919.318.928.7
① 3c-Silty clay0.5~4.438.018.019.57.2
② 2c-Silty clay1.0~6.639.717.721.85.5
② 2b-Silty clay15.1~20.047.916.913.412.5
② 2T-Silt sand0.6~4.52819.018.928.7
③ 1b-Silt sand4.0~8.722.419.619.57.2
Table 2. Test loading process.
Loading StepP1 (kN)P2 (kN)P3 (kN)
1252322
2494644
3747067
4868178
5989389
61059994
7111104100
8117110105
9 (9 m service stage)123116111
10130122137
11 (10 m service stage)137129164
12141114144
13146100125
1415085106
15157110119
16165134132
17 (13 m service stage)172159145
Table 3. Parameters of segments.
ParameterUnitValue
Segment
Thicknessmm450
Widthmm1200
Thickness of internal and external steel platesmm30
Total thickness of web platesmm90
Area of the segment A0m21.071 × 10−1
Moment of inertia of the segment I0m43.625 × 10−3
Material properties of steel
Young’s modulus EGPa206
Poisson ratio ν/0.31
Stiffness of segment
Axial compressive stiffness EA0N2.206 × 1010
Bending stiffness EI0N·m27.468 × 108
Table 4. Comparison of convergence deformations of different axes between experiment results and simulation results based on three models (mm).
LocationExperimental
Results
ESHR ModelBS ModelMBS Model
Short axis−108.64−108.69 (0.04%)−105.55 (−2.84%)−108.72 (0.07%)
Long axis49.0352.17 (6.4%)51.56 (5.15%)53.13 (8.36%)
Left short axis−104.67−106.99 (2.22%)−102.26 (−2.31%)−105.34 (0.64%)
Right short axis−110.82−106.99 (−3.45%)−108 (−2.54%)−111.25 (0.38%)
Table 5. Analysis of the deformation mechanism on the short axis of the structure (mm).
ConditionDeformation of Short Axis (mm)
Analysis
Total (Joint Contribution)
Test
9 m service stage79.73 (52.74)72.00
10 m service stage95.59 (66.35)94.88
13 m service stage111.31 (74.49)108.64
Table 6. Comparison of internal forces between the three-stage calculation method and the direct calculation method.
PositionDirect Calculation MethodThree-Stage Calculation Method
Bending Moment
(kN·m)
Axial Force
(kN)
Bending Moment (Kn·M)Axial Force
(kN)
Top1764−9821772 (+0.5%)−992
Right waist−1861−2066−1890 (+1.6%)−2089
Bottom1629−14801759 (+8.0%)−1492
Left waist−1660−1950−1688 (+1.7%)−1972
Table 7. Values of different load parameters for sensitivity analysis.
Load ParameterUnitDesign ValueValues for Sensitivity Analysis
Lateral pressure coefficient η/0.540.4, 0.5, 0.54, 0.6, 0.7
Offset loadkPa300, 15, 30, 45, 60
Buried depthm135, 10, 13, 15, 20
Disclaimer/Publisher’s Note: The statements, opinions and data contained in all publications are solely those of the individual author(s) and contributor(s) and not of MDPI and/or the editor(s). MDPI and/or the editor(s) disclaim responsibility for any injury to people or property resulting from any ideas, methods, instructions or products referred to in the content.

