Article

A Method for Evaluating the Spatial Layout of Fire Stations in Chemical Industrial Parks

1
Shenyang Fire Science and Technology Research Institute of MEM, Shenyang 110034, China
2
Liaoning Key Laboratory of Fire Prevention Technology, Shenyang 110034, China
3
National Engineering Research Center of Fire and Emergency Rescue, Shenyang 110034, China
*
Author to whom correspondence should be addressed.
Appl. Sci. 2024, 14(7), 2918; https://doi.org/10.3390/app14072918
Submission received: 19 January 2024 / Revised: 17 February 2024 / Accepted: 26 March 2024 / Published: 29 March 2024
(This article belongs to the Section Applied Industrial Technologies)

Abstract

:
The development of chemical industrial parks has resulted in the accumulation of a significant amount of hazardous substances, thereby increasing the demand for enhanced firefighting security, which directly relates to fire stations. This article presents a method for the layout evaluation of fire stations within chemical industrial parks. A practical technique for conducting fire risk assessments of each point to be rescued (PTBR) is proposed. The PTBRs are categorized according to their levels of fire risk. The required rescue time for each PTBR is determined based on the fire risk assessment. The estimated rescue times from each PTBR to each fire station are evaluated based on the actual road network and the speed of the fire engines. The adequacy of the fire stations is assessed through comparing the required and estimated rescue times. The working process of this method is illustrated using an engineering instance. The evaluation results of this engineering instance indicate its feasibility. This method takes into account the impact of irregular road paths and the influence of PTBR fire risks on the layouts of fire stations, which results in a more objective evaluation.

1. Introduction

Recent trends in the international chemical industry have shown an increasing emphasis on clustering, intensification, and integration [1]. Chemical enterprises are now more frequently clustering in chemical industrial parks. The clustering of enterprises in chemical industrial parks leads to a significant presence of hazardous substances being stored, produced, and used. Consequently, chemical industrial parks are always at a high risk of fire [2]. Once a fire occurs in a chemical industrial park, it may lead to casualties, economic losses, and public panic. On 12 August 2015, a severe fire and subsequent explosion occurred in Tianjin Binhai New District, China, leading to the deaths of 165 people and 798 others being injured. The direct economic loss amounted to USD 1.1 billion [3]. On 21 March 2019, a chemical explosion occurred in Jiangsu Province, China, resulting in massive fires and subsequent explosions. This accident led to 78 deaths and 716 injuries [4]. Therefore, a chemical industrial park is a significant area for fire department prevention efforts. The timely rescue of a fire directly impacts the severity of the accident’s consequences [5].
Fire stations and their firefighters are the primary responders for fire rescue operations, whether in urban communities or chemical industrial parks. The layout of fire stations is a crucial aspect of fire planning, which includes the locations of fire stations and their corresponding service areas. The reasonable placement of fire stations could greatly enhance the efficiency of emergency management and response. In China, the layout of urban fire stations mainly follows the standard requirements specified in reference [6]. The layout of fire stations should be determined based on the principle that fire engines could reach the edge of the service area within 5 min of the station receiving the dispatching order. This is essentially consistent with the practices in the United States, the United Kingdom, Japan, and other countries. In most Chinese cities, the service area of a fire station is typically evaluated using the “Circle-drawing method”. This method involves drawing a circle with an area of 7 km2 or 15 km2 centered on each fire station [7].
The critical factor to justify the emergency response capabilities is to evaluate the response time from the fire station to the potential objects in need of rescue. In this article, the potential object to be rescued is referred to as the point to be rescued (PTBR). The efficiency of firefighting response time is crucial in minimizing fire losses during fire rescue operations [8]. The response time is primarily influenced by the number and locations of fire stations, emphasizing the importance of a well-designed fire station layout [9,10,11].
Past studies have primarily focused on analyzing the spatial layout of urban fire stations. Researchers provided the maximal covering location problem (MCLP) as a solution to address the locational set coverage model (LSCP) and the maximal covering location model [12,13,14,15]. However, these studies often start by analyzing the coverage areas of fire stations, and often aim to maximize their coverage using various mathematical models. Nevertheless, this approach results in an averaging of firefighting demand across high-fire-risk and low-fire-risk areas, leading to increased variability in the division of fire station service areas and a decentralized distribution of fire stations. To address this issue, Wang and Sirbiladze et al. proposed a multi-objective fuzzy model for addressing the challenge of fire station placement in a fuzzy environment [16,17]. Murray conducted an optimization of the model based on economic perspectives [18], while Ming et al. introduced a distributed robust model that considers uncertainty regarding rescue time [19]. Rodriguez et al. presented an engineering model that addresses the facility siting and equipment placement problem, considering the necessary coverage [20,21]. In contrast, Han et al. integrated ArcGIS analysis techniques with the distribution of urban fire risks to effectively reduce the response time of firefighting forces at high-risk locations [22]. Yu et al. incorporated the variable of fire engine travel time into the fire station siting process, while Boschetti et al. developed a metaheuristic algorithm that addresses the ensemble coverage problem [23,24]. The actual response time of a fire station is determined by the traffic conditions and the distance covered by fire engines during rescue operations [25]. Based on real-time traffic data crawling and processing algorithms developed by Xu et al., an evaluation model for the spatial configuration of fire stations was also proposed [26].
In the field of urban fire planning, the layout of fire stations is usually determined via considering the distribution of fire risks and the coverage provided by these stations [27,28,29]. Some scholars have utilized GIS technology to evaluate and plan the layout of urban fire stations. Zhou integrated fire risk assessments with GIS technology, proposing a method for optimizing the layout of urban fire stations based on this approach [30]. The POI location data can be used to quantitatively identify the distribution of fire risk areas, which can help to address the issues related to inadequate targeting during the selection of fire station sites [7,31,32,33]. Currently, POI data are primarily used in urban planning, design, and other related fields, and are gradually being applied to urban security.
Several studies have been conducted on fire planning in chemical industrial parks. Liu introduced the basic contents of fire safety planning for chemical industrial parks and proposed methods and procedures for fire safety planning based on fire risk analysis [34]. Zheng conducted a comparable study for a petrochemical industrial park [35]. Wan and Yun have proposed construction standards for fire stations, equipment requirements, and enhanced facilities for fire stations in chemical industrial parks. These proposals were based on a comprehensive review of typical safety incidents [36]. Chen et al. introduced a method for emergency rescue and evacuation route planning in a chemical industrial park, which incorporates intelligent obstacle avoidance in order to mitigate potential road conflicts [1]. For risk control purposes, most risk assessments in chemical industrial parks focus on quantifying the major hazardous installations for hazardous chemicals or the domino effect [37,38,39,40,41].
However, there have been few studies focusing on the planning and evaluation of the spatial layout of fire stations in chemical industrial parks. In chemical industrial parks, different enterprises face varying levels of fire risk and may encounter various types of disasters and rescue requirements. Therefore, the layout planning of fire stations should be related to the specific fire risks associated with each enterprise area. Existing fire risk assessment models cannot characterize the risk differences among the PTBRs well, which could negatively impact fire rescue response activities. To address this issue, a performance-based evaluation method should be used for analysis and demonstration purposes. This article aims to introduce a new method for evaluating the spatial layout of fire stations in chemical industrial parks. The method considers the impact of varying fire risk levels and irregular road paths. It will establish a regional fire risk assessment technology to characterize the risk differences, and provide the required fire rescue times for different fire risk levels. The layout of the fire station in a chemical industrial park will be quantitatively evaluated based on the associated fire risks. This method has been applied to several practical engineering projects over the past two years. The specifics of these projects are presented in Table 1. To illustrate this proposed method, the case study of an engineering project in the chemical industrial park, referred to as Park X, will be provided. Park X covers an area of 11.33 km2 and comprises primarily petrochemical and fine chemical industries.

2. Methods

2.1. General Framework

In this article, the proposed evaluation method for the spatial layout of fire stations in chemical industrial parks is carried out in the following steps:
(1) Classify the fire risk of the PTBR and determine the corresponding required fire rescue time for each fire risk level.
Establish a set of PTBRs as R = {R1, R2, …, Rn}, where R1~Rn represent each PTBR, and n is the total number of PTBRs in the park.
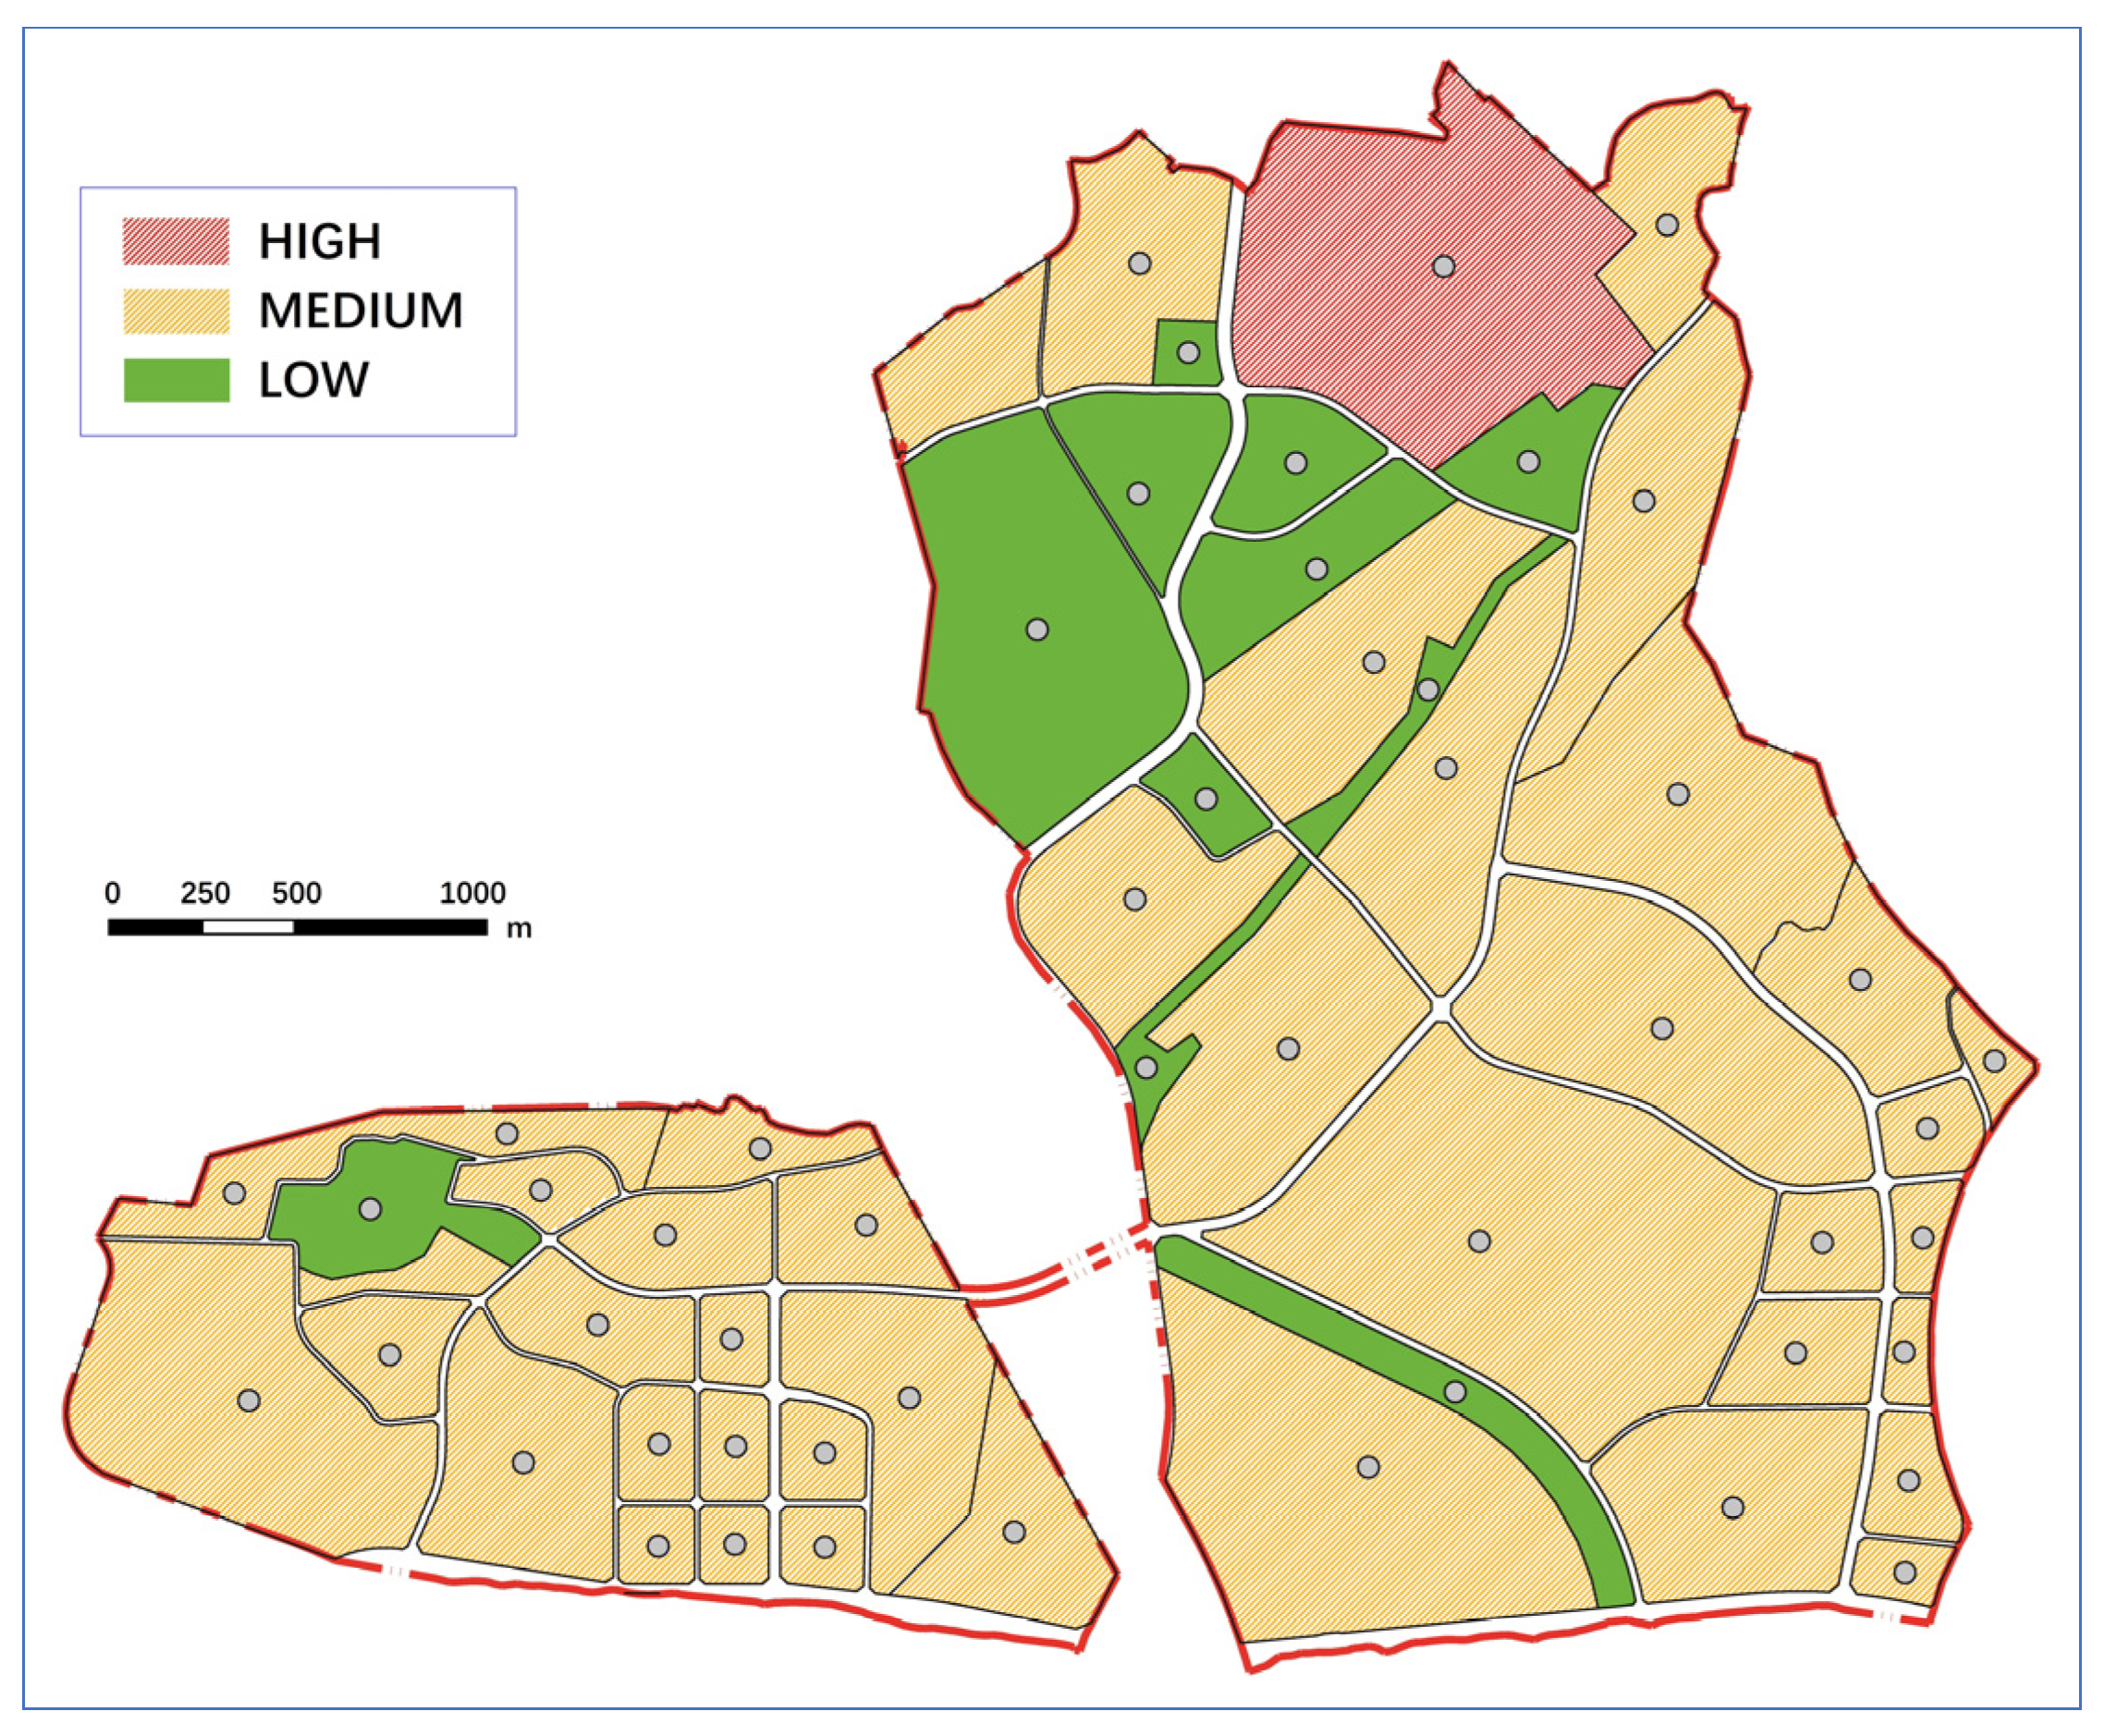
Establish a set of fire risk levels as W = {W1, W2, …, Wm}, where W1~Wm are the fire risk levels of PTBRs, and m represents the total number of risk levels.
Establish a set of required fire rescue time standards as T = {T1, T2, …, Tm}, where T1, T2, … Tm are the required fire rescue time standards for the fire risk levels W1, W2, … Wm.
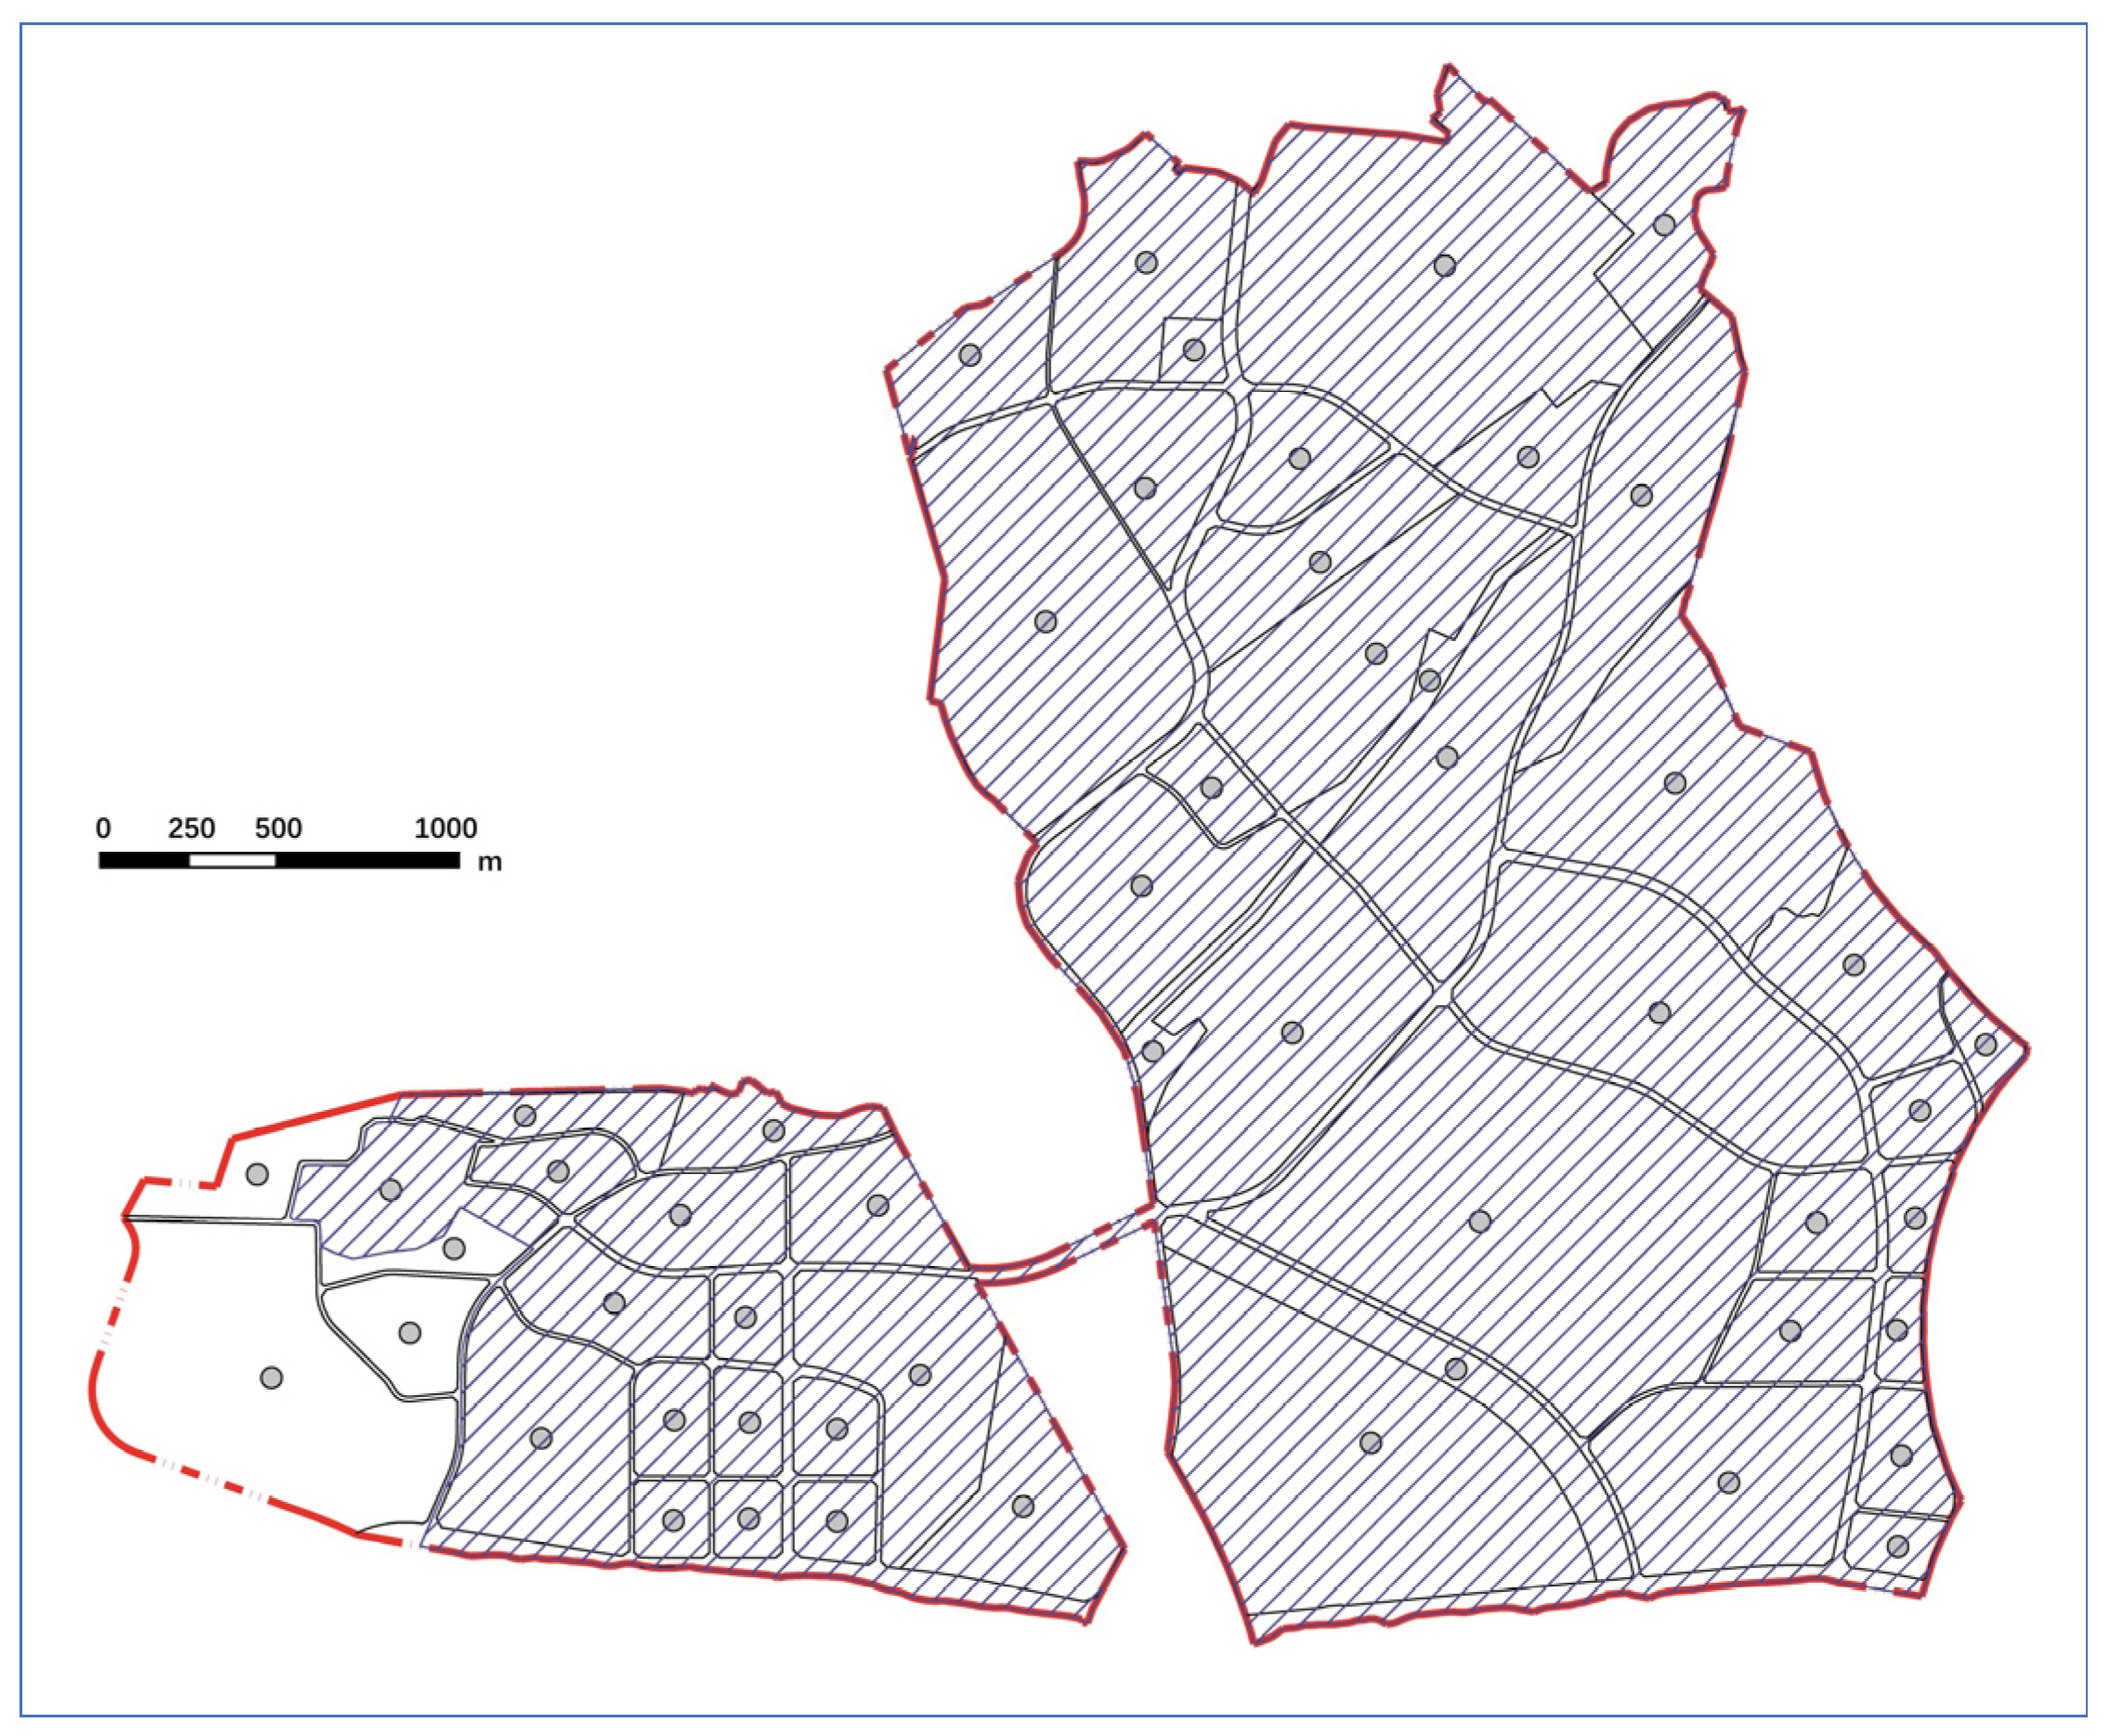
Traverse the set R to establish a set of required fire rescue times as X = {X1, X2, …, Xn}, where X1~Xn are the required fire rescue times for the corresponding PTBRs. The required fire rescue time for each PTBR should be determined based on its fire risk level. The fire risk assessment technology will be described in the following section.
(2) Analyze and build a rescue road network within the chemical industrial park, and estimate the running speed of fire engines in the park. These parameters are used to calculate the estimated fire rescue times from each PTBR to each fire station.
Establish a set of fire stations as F = {F1, F2, …, Fk}, where F1~Fk represent the fire stations in the chemical industrial park, and k is the total number of fire stations.
Establish the minimum distance path from each PTBR to each fire station as
P i j = P 11     P 12         P 1 k P 21     P 22         P 2 k P n 1     P n 2         P n k
where Pij represents the minimum distance path from Ri to Fj, and where i ranges from 1 to n and j ranges from 1 to k.
Estimate the fire rescue time from each PTBR to each fire station as
t i j = P i j / V = t 11     t 12         t 1 k t 21     t 22         t 2 k t n 1     t n 2         t n k
where V represents the estimated running speed of fire engines in the chemical industrial park, and tij represents the estimated fire rescue time from Ri to Fj.
(3) Compare the estimated fire rescue time with the required fire rescue time, and calculate the coverage rate and overlap-coverage rate of the fire stations.
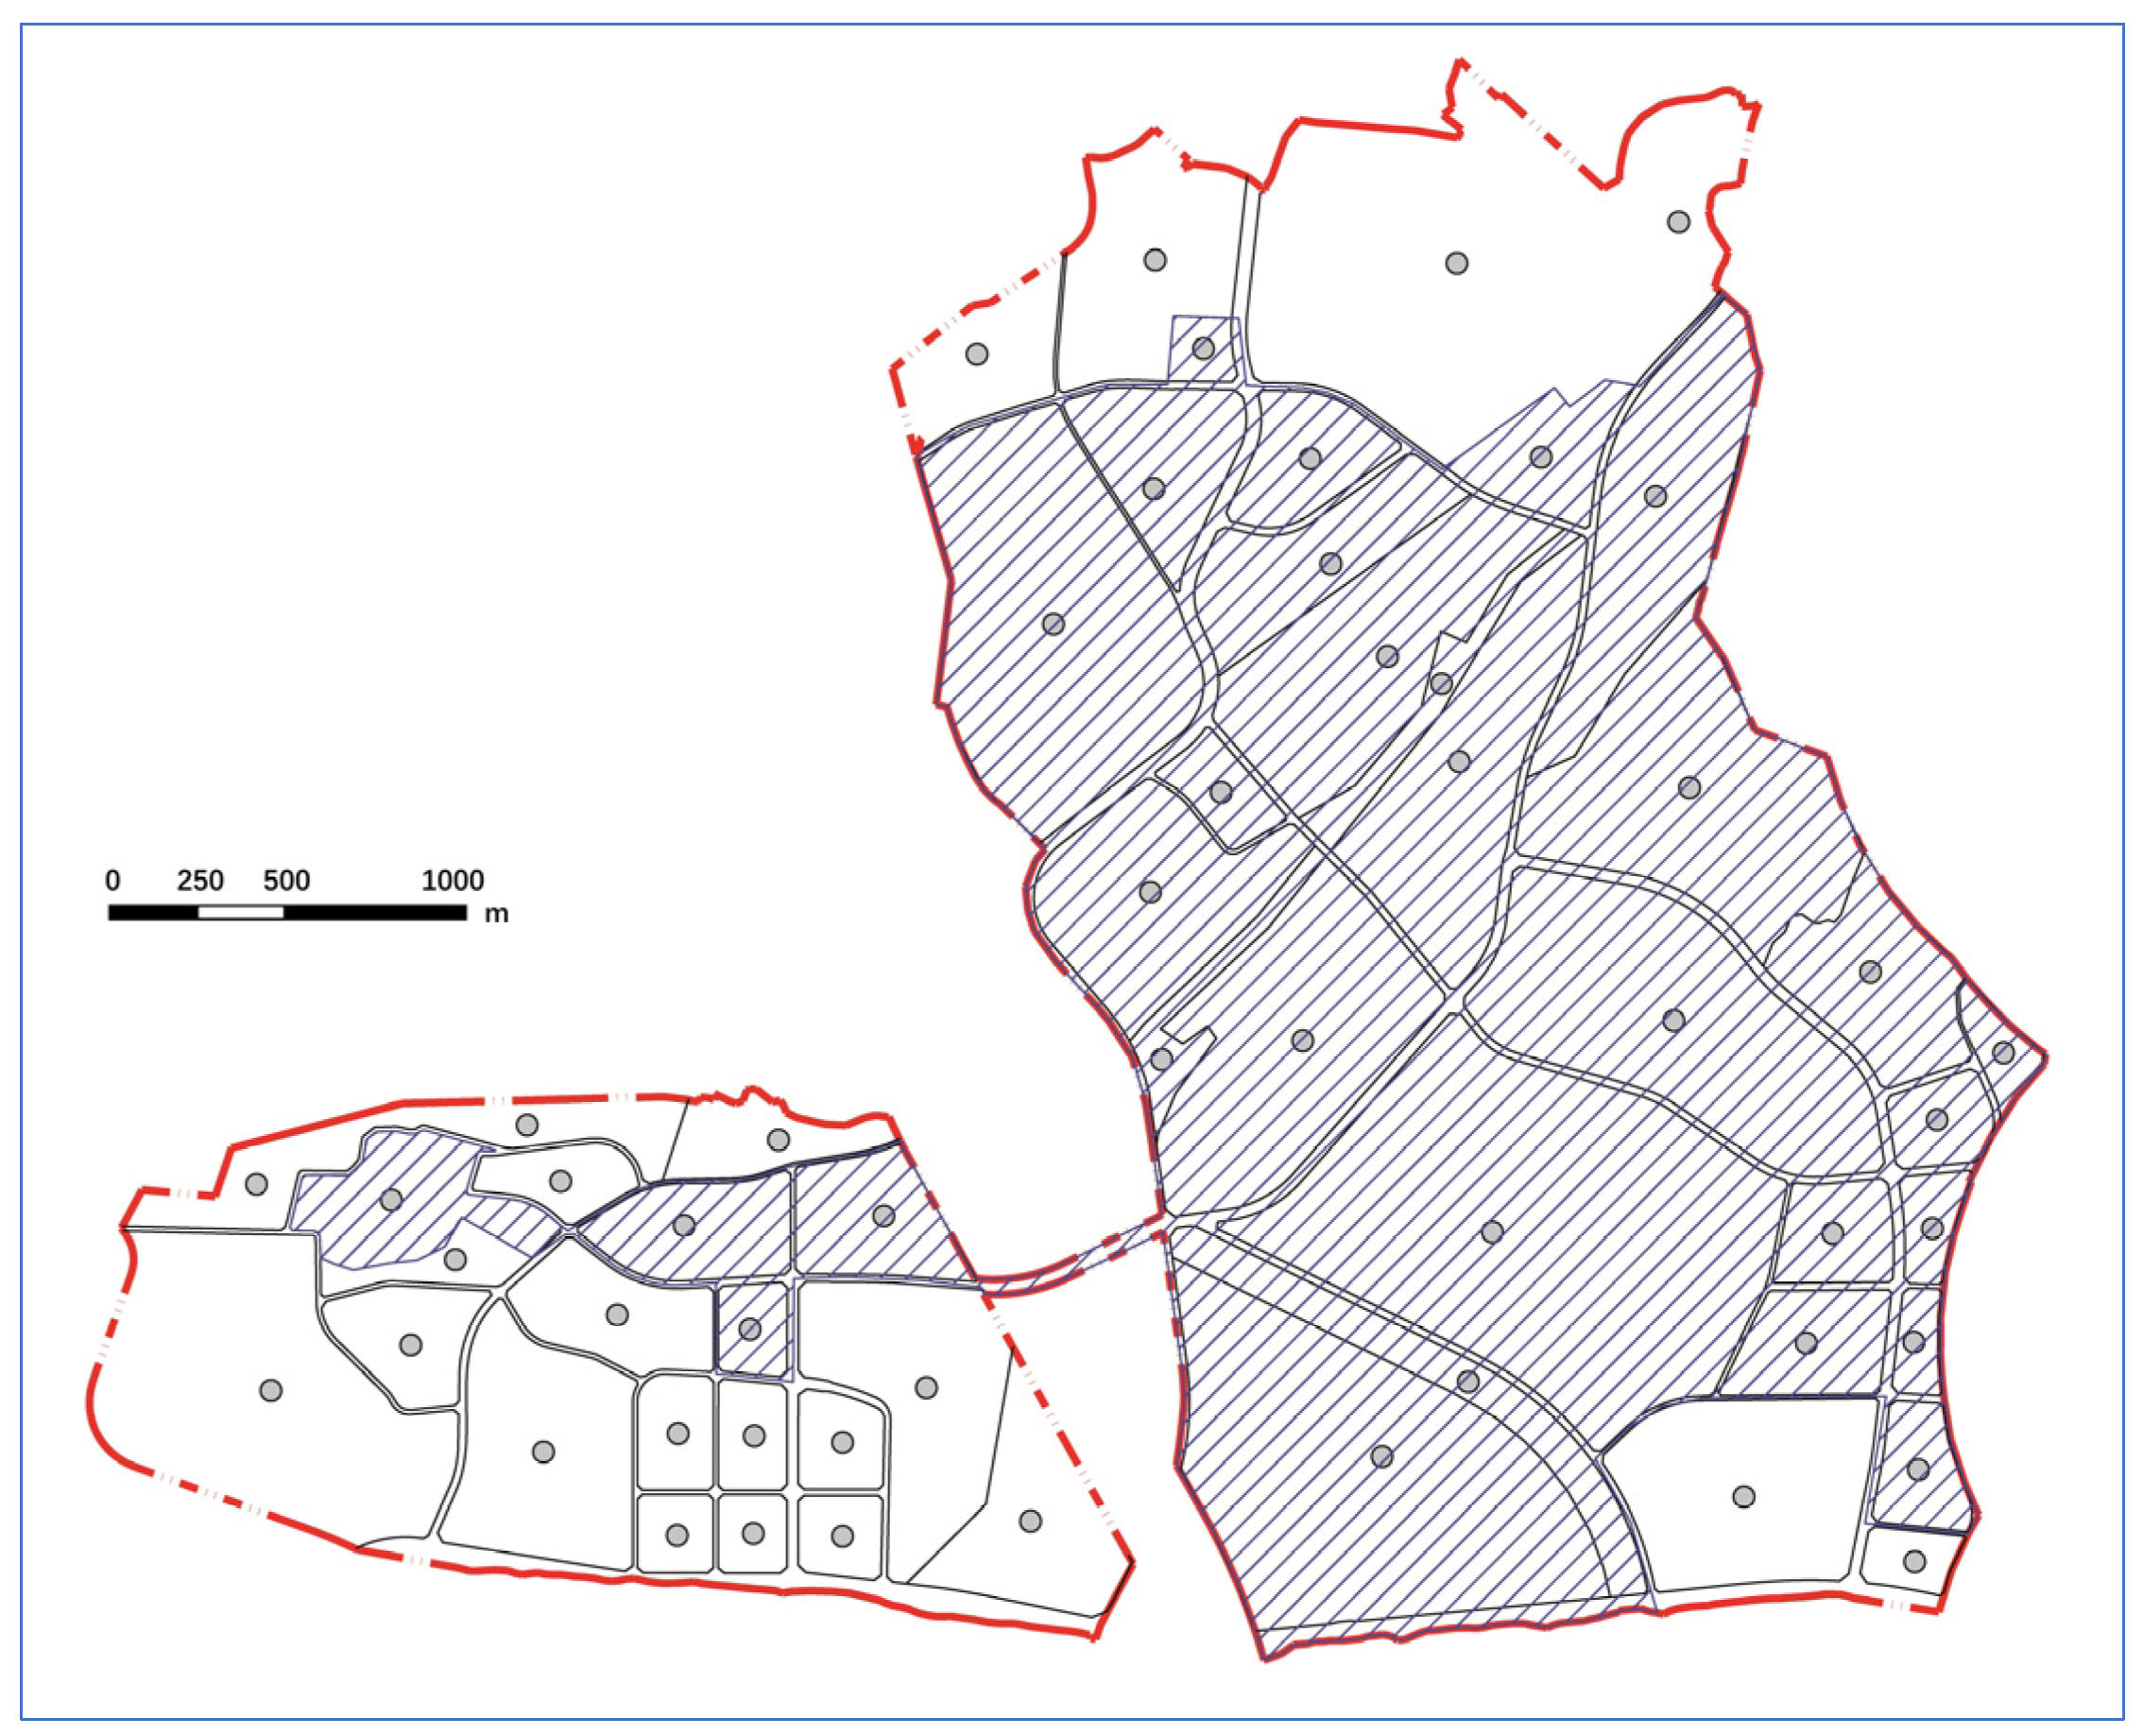
Calculate the difference between the estimated fire rescue time and the required fire rescue time, tijXi, j = 1, 2, … k, and make the following judgments: (a) If tijXi < 0, then Ci = 1, where Ci is the first state register of the point Ri, and Ci = 1 indicates that the point Ri is covered by fire station Fj; (b) If the situation tijXi < 0 occurs more than once, then Hi = 1, where Hi is the second status register of the point Ri, and Hi = 1 indicates that the point Ri is covered by two or more fire stations.
Traverse Ri, i = 1, 2, … n, calculate C = ΣCi, where C represents the number of PTBRs covered by fire stations. Then, calculate H = ΣHi, where H represents the number of PTBRs covered by two or more fire stations.
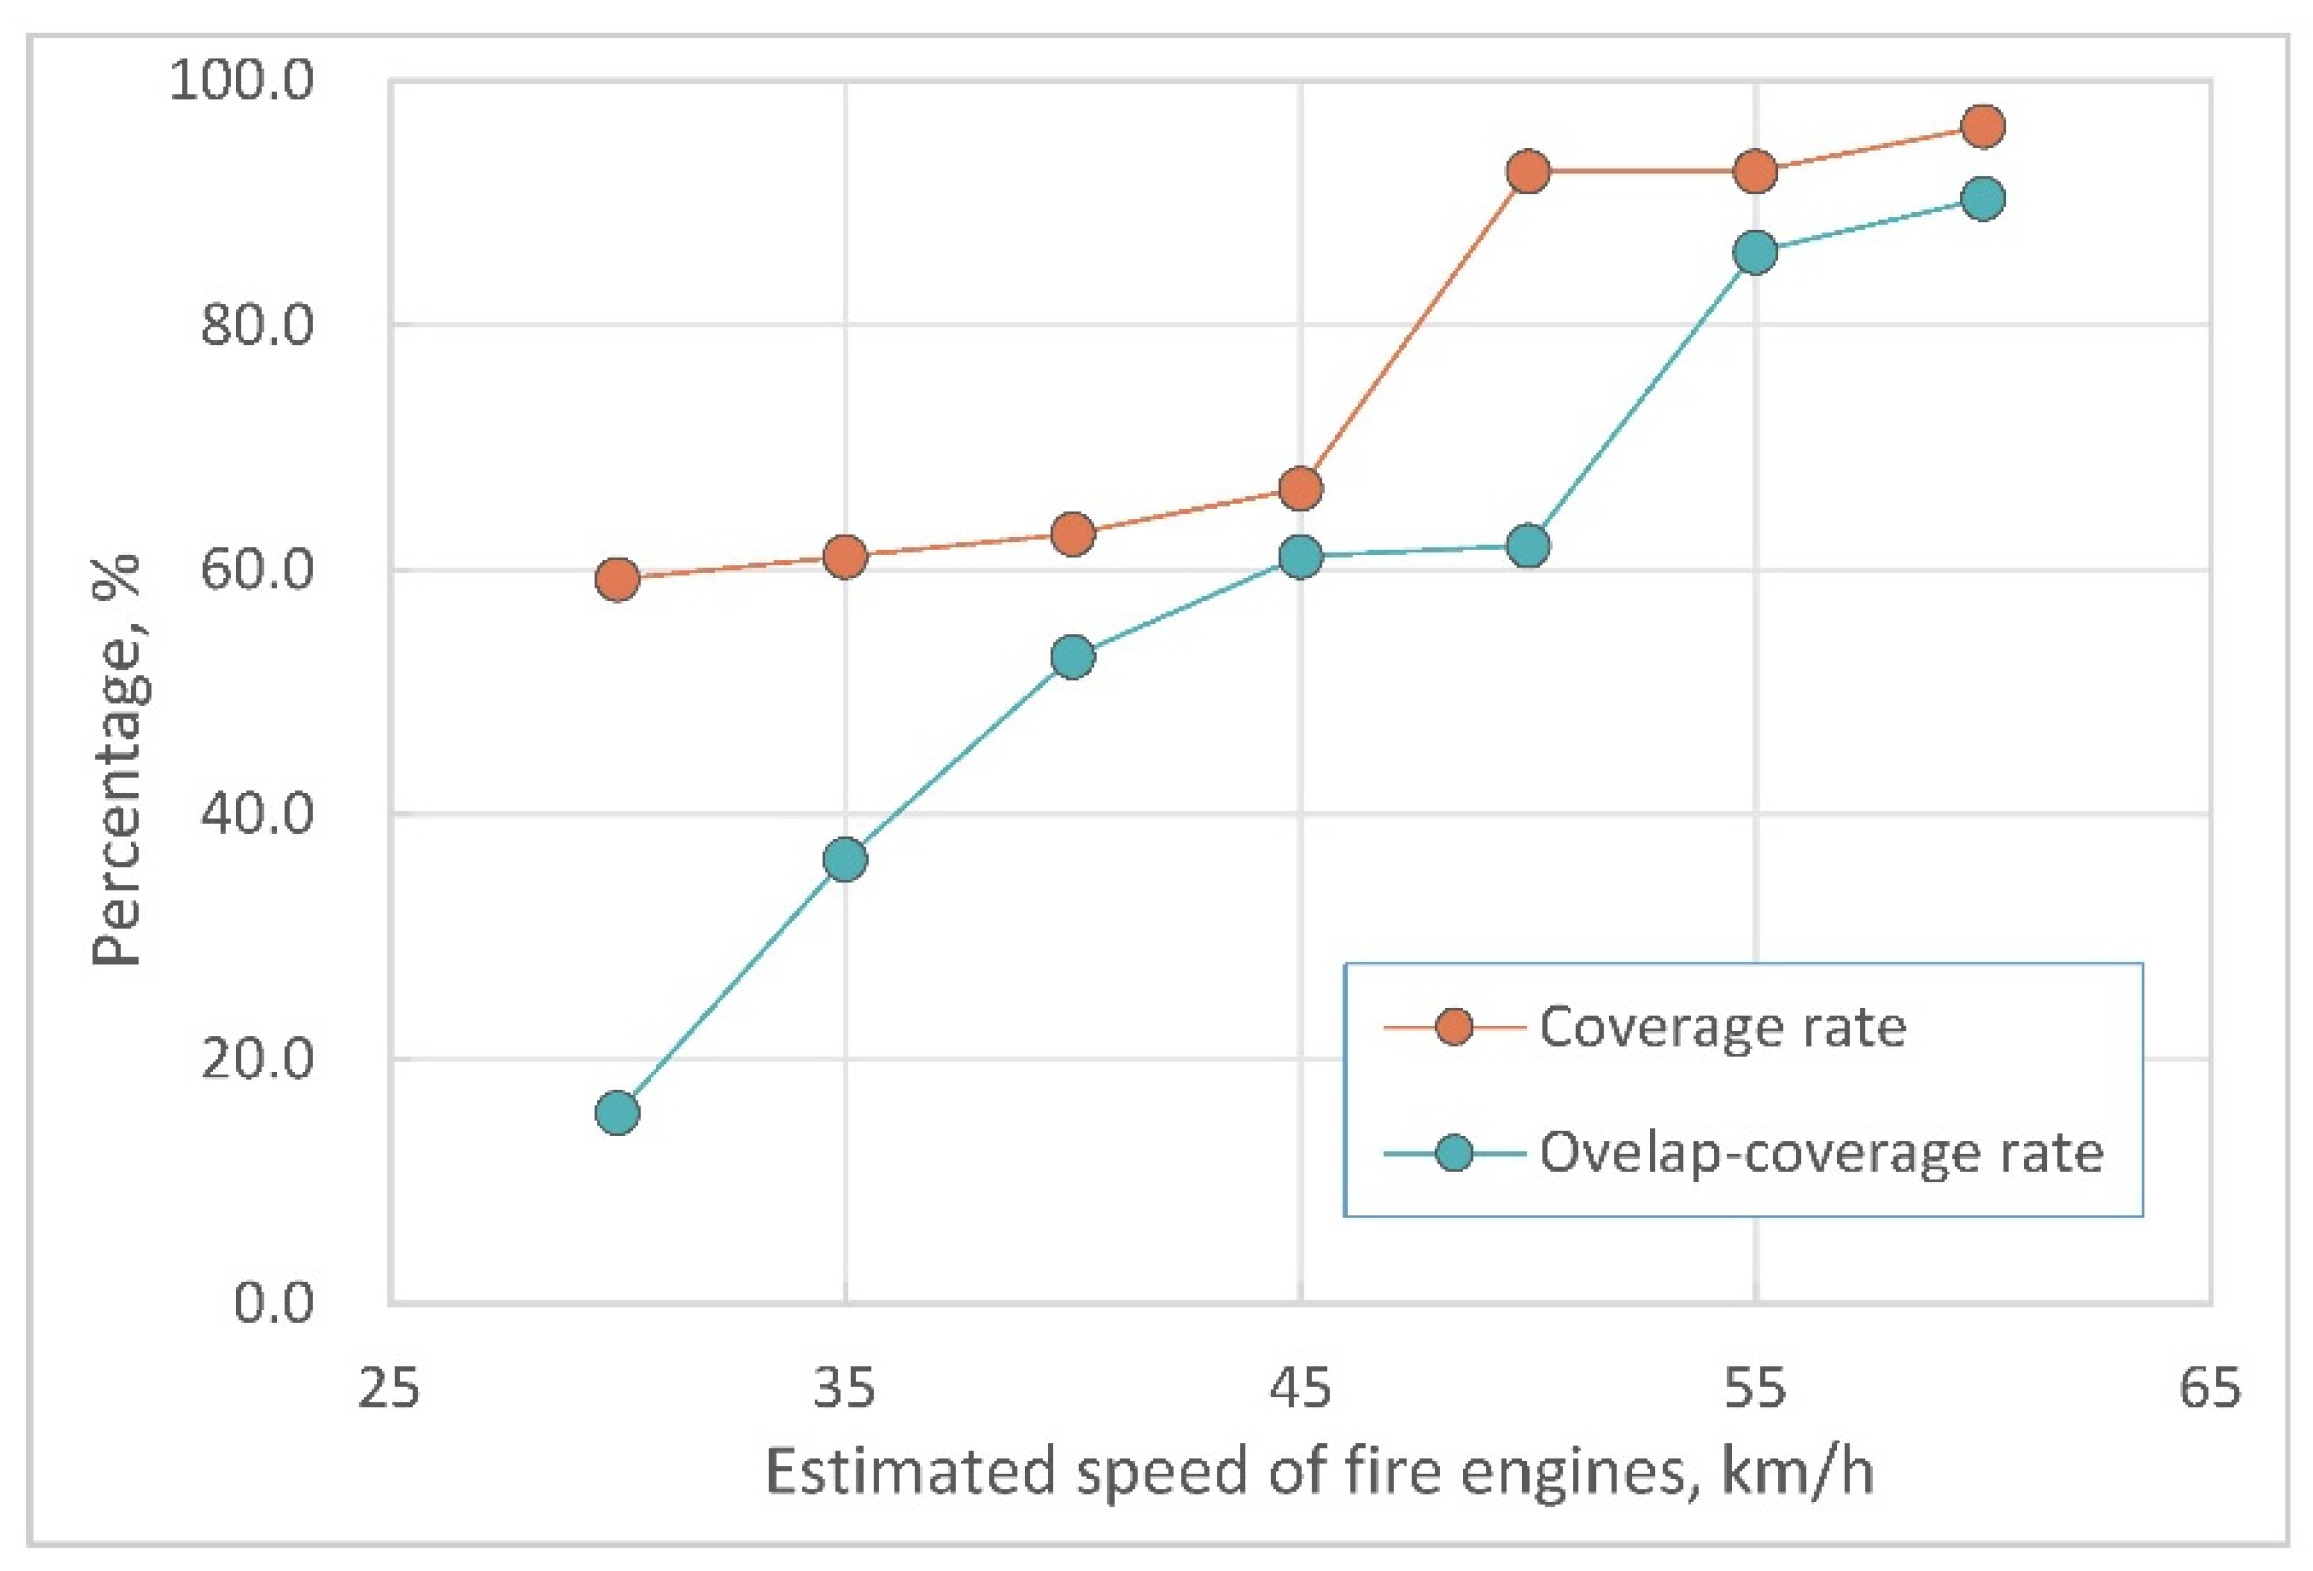
Calculate the coverage rate of fire stations as
α = N u m b e r   o f   c o v e r e d   P T B R T o t a l   n u m b e r   o f   P T B R = C R
Calculate the overlap-coverage rate of fire stations as
γ = N u m b e r   o f   c r o s s l y   c o v e r e d   P T B R N u m b e r   o f   c o v e r e d   P T B R = H C
Determine the standard αs for the coverage rate of fire stations. If ααs, the coverage rate of fire stations meets the standard.
Determine the standard γs for the overlap-coverage rate of fire stations. If γγs, the overlap-coverage rate of fire stations meets the standard.
This method can also analyze the average fire rescue time, i.e., taverage as
t a v e r a g e = i = 1 n j = 1 k t i j / n × k

2.2. Fire Risk Assessment

The first step in evaluating the spatial layout of the fire station in a chemical industrial park is to conduct a fire risk assessment of the PTBR. The fire risk levels of PTBRs in the chemical industrial park are influenced by various factors, including the basic characteristics of the park, production processes, hazardous substances, and meteorological factors. These factors collectively contribute to the fire risk. The fire risk assessment should utilize appropriate indicators. In this article, the purpose of the fire risk assessment is to evaluate the effectiveness of the fire station layout. This study aims to characterize the inherent fire risks of PTBRs at the regional level, thus providing a basis for evaluating the layout of fire stations. Therefore, it is essential to use the existing risk indicators in chemical industrial parks to assess fire risks. Distinct from previous studies that quantify major hazards and domino effects, this article uses three indicators for fire risk assessment, as shown in Table 2. These indicators are derived from the lists published by the China State Administration of Work Safety [42,43] and the national standard regulation [44]. The China State Administration of Work Safety conducted an analysis of chemical fire and explosion accidents that occurred in China around 2008. The study revealed that a majority of these accidents were associated with hazardous processes such as nitrification, oxidation, sulfonation, chlorination, fluorination, or diazotization reactions. Based on these findings, the Catalog of Key Supervised Hazardous Chemical Processes was proposed [42]. Additionally, a comprehensive screening of chemicals responsible for accidents in China between 2002 and 2010, as well as internationally significant accidents over the past 40 years, was conducted. This resulted in the development of the List of Key Supervised Hazardous Chemicals [43]. Li et al. [45] compiled data on approximately 600 hazardous chemical accidents that occurred in China from 1951 to 2020. Their analysis revealed that the production process was the primary cause of the most severe accidents and casualties. It is worth noting that a majority of these processes are included in the Catalogue of Key Supervised Hazardous Chemical Processes. Furthermore, the study found that the accidents were directly caused by chemicals, all of which are listed in the List of Key Supervised Hazardous Chemicals. These findings provide the basic reason for the utilization of the three indicators in this study. It should be noted that these three indicators were specifically selected for Park X in this study. Other types of chemical industrial parks should consider practical indicators based on their specific process hazard characteristics.
The indicators presented in Table 2 represent the factors that influence the fire risks of PTBRs. The weights of these indicators reflect their significance in ensuring fire safety. The determination of indicator weights can be carried out using empirical methods, the analytic hierarchy process, expert scoring methods, or other suitable approaches, depending on the specific requirements. Empirical methods and expert scoring methods are adopted and compared, resulting in the weights assigned to the indicators for Park X, as shown in Table 3. For each indicator, its scoring standard is also provided in Table 3. To illustrate the scoring process, let us consider the indicator “Major hazard installations of hazardous chemicals”. If a specific PTBR has a major hazard installation of hazardous chemicals with the highest hazardous level of III, this indicator will be assigned a score of 75.
The fire risk score for each PTBR is calculated using the weighted summation method as shown in Equation (6).
R = i = 1 n w i a i
where R is the calculated comprehensive fire risk score, ai is the score of the ith indicator, and wi represents the weight of the ith indicator. This article categorizes fire risk into three levels based on the distribution of the fire risk scores of PTBRs in the chemical industrial park. These levels and corresponding classification criteria are shown in Table 4, where R represents the calculated fire risk score, X ¯ represents the average value of R for all PTBRs in the park, and σ represents the standard deviation.

2.3. Required Fire Rescue Time

PTBRs with varying levels of fire risks require different fire rescue response times. Areas with a high fire risk specifically require a shorter fire rescue response time, and vice versa. The fire rescue response time (i.e., the required fire rescue time) refers to the time required for the fire engines to travel from a fire station to a PTBR. It is used to compare the following estimated fire rescue time in order to ensure the rationality of the fire station layout. The required fire rescue time currently adopted in Chinese cities is typically 5 min, according to the reference [6]. However, it is also possible to determine a more accurate standard for the required fire rescue time through evaluation methods based on fire risk assessment. The required fire rescue time for chemical parks could also be determined based on regional fire risks, taking into account the requirements of national standards, the local economic and social development, and the capabilities of local firefighting and rescue forces. The required fire rescue times for enterprises with different fire risk levels in Park X are presented in Table 5.

2.4. Estimated Fire Rescue Time

To estimate the fire rescue time, it is necessary to establish a rescue road network for the chemical industrial park and estimate the running speed of the fire engines within the park. The rescue road network mainly includes fire roads, fire stations, and PTBRs. An accurate PTBR in a chemical industrial park should be based on a specific object, such as a production facility, storage tank, or factory building. Relevant object information, such as contour lines and fire risk assessment results, should be obtained. The object should be transformed into a centroid point, and the relevant information should be provided as the attributes of this point. Obtaining the aforementioned data, however, involves significant difficulty and workload. Furthermore, the variety of these data sources may lead to significant differences in accuracy, which then hinders error control. In order to solve this problem, we adopt the concept of “clustering”. In this article, the chemical industrial park is divided into several areas based on the enterprise’s wall area or the public land parcels. The centroid of each area represents the total fire demand in that area, serving as a PTBR, and all the attributes of this area, such as the fire risk level, are assigned to this PTBR.
The speed at which fire engines travel directly affects the fire rescue time, which is closely related to the quality of local road construction and traffic conditions. The chemical industrial park is relatively isolated, with fewer unrelated vehicles passing through its interior. The roads and traffic conditions in the chemical industrial park are similar to those in the suburban areas of the city. According to the current national standard in China [46], the designated driving speed for expressways in suburban areas is generally no less than 60 km/h. A statistical analysis was conducted regarding the average driving speed of the highway network in Shanghai from August to October in recent years. Taking into account the traffic conditions, the average driving speed of fire engines in suburban areas was determined to be 55 km/h [6]. Park X is located in the suburban area of a small city in Southwest China that is not as developed as Shanghai. Based on an analysis of the current road construction situation and the daily traffic conditions in Park X, it is estimated that the driving speed of fire engines is 50 km/h.

2.5. Rationality Analysis

The coverage rate and overlap-coverage rate of fire stations are used to evaluate the rationality of their layout. According to the survey results on the current layout of urban fire stations nationwide in China, this article determines the standard for the coverage rate, denoted as αs, to be 80%. Specifically, if the PTBRs are covered by fire stations at a rate of 80% within the chemical industrial park, it is considered sufficient to meet the coverage needs. Otherwise, it is considered insufficient to meet the coverage needs. A higher coverage rate value indicates a more efficient fire rescue operation and a better fire safety performance. For the fire station overlap-coverage rate, a value of γs = 30% is adopted. If the overlap-coverage rate is less than 30%, it meets the requirements. A smaller overlap-coverage rate value indicates a more efficient economic layout of the fire stations. The criteria for these two parameters may vary in regions with different levels of local economic development. Regions with a more advanced economy may require a 100% coverage rate in order to achieve a higher level of fire rescue capability. However, they may be more lenient in accepting a high percentage of overlap-coverage rate.

3. Results and Discussion

According to the method proposed in this article, an analysis was conducted regarding the rescue paths of Park X, resulting in the construction of a rescue path network, as illustrated in Figure 1. The network was used to simulate common road conditions, while the actual road restrictions, such as the presence of one-way lanes and red lights, were not considered [47]. The figure also shows the locations of the fire stations situated within the park, along with the analysis results of the PTBRs. Through the analysis, it was found that Park X has a total of fifty-four PTBRs and two fire stations, which will be referred to as Fire Station A and Fire Station B, respectively. It can be observed from Figure 1 that the roads within Park X are highly irregular, and that the rescue routes are relatively complex. Furthermore, the distribution of PTBRs is uneven, with some areas having a high concentration of PTBRs and others having sparse PTBRs. In fact, most chemical industrial parks face similar situations.
Using the fire risk assessment method proposed in this article, the fire risk scores for the 54 PTBRs in Park X were calculated. The average fire risk score for all PTBRs in Park X is 24.5, with a standard deviation of 28.5. Referring to the classification criteria for the fire risk levels provided in Table 4, Park X has one PTBR with a high fire risk level, 42 PTBRs with a medium fire risk level, and 11 PTBRs with a low fire risk level. The distribution of fire risk levels for all PTBRs in Park X is shown in Figure 2. Based on the fire risk assessment results obtained for each PTBR, the required rescue time for each PTBR can be determined according to Table 5. For instance, the required rescue time for a high-risk PTBR is 3 min.
Based on the rescue path network shown in Figure 1, the minimum distance paths from each PTBR to each fire station were separately calculated. Through dividing these minimum distance paths by the estimated speed of fire engines (50 km/h in this article), the estimated rescue time from each PTBR to each fire station was obtained. For a specific PTBR, the estimated rescue time to reach Station A was compared with the estimated rescue time to reach Station B, and the smaller one was selected as the minimum estimated rescue time. The minimum estimated rescue time for each PTBR was then compared with its corresponding required rescue time, as illustrated in Figure 3. If the minimum estimated rescue time satisfies the required rescue time, the PTBR is considered effectively covered by the fire station. In other words, the PTBRs effectively covered by the fire station are located below the line y = x in Figure 3. It can be observed from Figure 3 that four PTBRs are not effectively covered by fire stations. The diagonal shadow area in Figure 4 represents all the effectively covered PTBRs and the corresponding regions they represent. Using Equation (3), the coverage rate of fire stations in Park X is calculated to be 92.6%. This exceeds the evaluation standard of 80% mentioned in this article, indicating that the fire station coverage rate of Park X meets the requirement.
The x-axis of Figure 5 represents the estimated rescue time from each PTBR to Station A, while the y-axis represents the estimated rescue time from each PTBR to Station B. The required rescue time standards for different fire risk levels are plotted on both axes. In the figure, when a PTBR falls within the green area (including the yellow and red areas within it), it indicates that the estimated rescue time for the PTBR to reach both fire stations is less than 8 min. For a PTBR with a low risk level, being within this area means it is covered by both fire stations. When a PTBR falls within the yellow area (including the red area within it), it means that the estimated rescue time to reach both fire stations is less than 5 min. For a PTBR with a medium risk level, being within this area means that it is covered by both fire stations. If a PTBR falls within the red area, it indicates that the estimated rescue time to reach both fire stations is less than 3 min. A PTBR with a high-risk level is considered to be covered by both fire stations only when it falls within the red area. Figure 5 shows all the PTBRs effectively covered by the fire stations. Based on the analysis method mentioned above, it can be observed that out of the 50 effectively covered PTBRs, 31 PTBRs are simultaneously covered by Station A and Station B. The diagonal shadow area in Figure 6 represents all the cross-covered PTBRs and the corresponding regions they represent. Using Equation (4), the overlap-coverage rate of fire stations in Park X is calculated to be 62%. This exceeds the evaluation standard of 30% mentioned earlier in this article, indicating that the overlap-coverage rate of fire stations in Park X does not meet the requirement.
Although this article estimates that the speed of fire engines in Park X is 50 km/h, it is important to note that the road and traffic conditions in different chemical industrial parks may vary. Apart from the previously mentioned PTBR fire risk levels and road irregularities, the speed at which fire engines travel within the chemical industrial park is a significant factor that can impact the rationality of the fire station layout. By using Park X as an example, we conducted an analysis comparing the fire station coverage rate and the overlap-coverage rate with the estimated speed of fire engines, as illustrated in Figure 7. It can be observed that under specific fire risk and road conditions, the coverage rate of fire stations gradually increases as the speed of fire engines increases, while the overlap-coverage rate also experiences an increase. Therefore, accurately estimating the speed of fire engines within the concerned chemical industrial park is crucial for the layout evaluation of fire stations.
Finally, a comparison between the method presented in this article and the “Circle-drawing method” is conducted. Taking Station B as an example, the 5 min coverage area is calculated using the method described in this article, based on the speeds of fire engines at 50 km/h and 30 km/h, respectively. The results are illustrated by the diagonal shadow area in Figure 8. The “Circle-drawing method” is utilized to draw a circle with a coverage area of 15 km2 centered on Station B. It can be observed that the “Circle-drawing method” produces a coverage area similar to that obtained by the method presented in this article using a driving speed of 30 km/h for fire engines. However, our site survey indicates that a speed of 30 km/h seriously underestimates the actual driving conditions of fire engines in Park X. Through the comparison, it is evident that, for Park X, the coverage range of fire stations estimated by the “Circle-drawing method” is significantly smaller than the coverage range estimated by the method described in this article. The “Circle-drawing method” primarily focuses on the linear distance traveled by the fire engines. Other important factors, such as fire risk level, road paths, and fire engine speed as discussed in this article, are not included. This significantly underestimates the coverage and rescue capabilities of fire stations, which may also result in excessive economic investment. The study conducted by Huang et al. yielded similar findings. They discovered that the service area boundary of the fire station was not a circle, but instead an irregular polygon, which highlights the limitations of employing the conventional circle-drawing method [47].

4. Conclusions

A method is presented for evaluating the rationality of fire station layouts in chemical industrial parks, and this is demonstrated using an engineering example. This method classifies the PTBRs in chemical industrial parks based on fire risk assessments. It determines the required fire rescue time for each PTBR based on their fire risk levels, and it conducts layout assessments which consider the variations between rescue objects. This leads to more accurate analysis results. The method evaluates the response time of fire rescues based on the actual road network in chemical industrial parks. It fully considers the impact of irregularities in the road path, leading to a more objective evaluation result. The fire station coverage rate in the engineering instance is estimated to be 92.6%, which meets the requirements. However, the overlap-coverage rate is estimated to be 62%, which exceeds the upper limit of the requirements. This method can be directly applied to the rational analysis and planning of fire station layouts in chemical industrial parks. It serves as the theoretical basis and foundation for fire protection.
This study reveals the significance of accurately estimating the speed of fire engines. Future research should prioritize the precise estimation of fire engine speed. It is feasible to estimate the speed of fire engines separately by considering various road sections encountered during the path, such as urban streets, expressways, highways, bridges, tunnels, etc. Additionally, another crucial factor that should be comprehensively investigated is the influence of fire station levels on the evaluation outcomes.

Author Contributions

Conceptualization, L.L. and N.L.; methodology, L.L. and X.W.; validation, B.L. and X.W.; investigation, L.L. and B.L.; data curation, X.W.; writing—original draft preparation, L.L.; writing—review and editing, N.L. All authors have read and agreed to the published version of the manuscript.

Funding

This work is supported by the China Special fund for basic scientific research business expenses of central public welfare scientific research institutes.

Institutional Review Board Statement

Not applicable.

Informed Consent Statement

Not applicable.

Data Availability Statement

The original contributions presented in the study are included in the article, further inquiries can be directed to the corresponding author.

Acknowledgments

The authors would like to acknowledge Yongyu Wang for providing valuable technical support in completing this study.

Conflicts of Interest

The authors declare no conflicts of interest.

References

  1. Chen, P.; Chen, G.; Wang, L.; Reniers, G. Optimizing emergency rescue and evacuation planning with intelligent obstacle avoidance in a chemical industrial park. J. Loss Prev. Process. Ind. 2018, 56, 119–127. [Google Scholar] [CrossRef]
  2. Chen, G.; Wang, S.; Tan, X. Evaluation model for safety capacity of chemical industrial park based on acceptable regional risk. Chin. J. Chem. Eng. 2015, 23, 121–127. [Google Scholar] [CrossRef]
  3. Huang, P.; Zhang, J. Facts related to August 12, 2015 explosion accident in Tianjin, China. Process. Saf. Prog. 2015, 34, 313–314. [Google Scholar] [CrossRef]
  4. Zhang, N.; Shen, S.; Zhou, A.; Chen, J. A brief report on the March 21, 2019 explosions at a chemical factory in Xiangshui, China. Process. Saf. Prog. 2019, 38, e12060. [Google Scholar] [CrossRef]
  5. Challands, N. The Relationships between Fire Service Response Time and Fire Outcomes. Fire Technol. 2010, 46, 665–676. [Google Scholar] [CrossRef]
  6. JB 152-2017; Construction Standards for Urban Fire Stations. National Development and Reform Commission and Ministry of Housing and Urban-Rural Development of P.R. China: Beijing, China, 2017.
  7. Yu, Z.; Xu, L.; Chen, S.; Jin, C. Research on Urban Fire Station Layout Planning Based on a Combined Model Method. ISPRS Int. J. Geo-Inf. 2023, 12, 135. [Google Scholar] [CrossRef]
  8. Chen, M.; Wang, K.; Dong, X.; Li, H. Emergency rescue capability evaluation on urban fire stations in China. Process. Saf. Environ. Prot. 2020, 135, 59–69. [Google Scholar] [CrossRef]
  9. Park, P.Y.; Jung, W.R.; Yeboah, G.; Rempel, G.; Paulsen, D.; Rumpel, D. First responders’ response area and response time analysis with/without grade crossing monitoring system. Fire Saf. J. 2016, 79, 100–110. [Google Scholar] [CrossRef]
  10. Wang, J.; Liu, H.; An, S.; Cui, N. A new partial coverage locating model for cooperative fire services. Inf. Sci. 2016, 373, 527–538. [Google Scholar] [CrossRef]
  11. Kc, K.; Corcoran, J. Modelling residential fire incident response times: A spatial analytic approach. Appl. Geogr. 2017, 84, 64–74. [Google Scholar] [CrossRef]
  12. Aktas, E.; Özaydin, Ö.; Bozkaya, B.; Ülengin, F.; Önsel, S. Optimizing Fire Station Locations for the Istanbul Metropolitan Municipality. Interfaces 2013, 43, 240–255. [Google Scholar] [CrossRef]
  13. Zhang, B.; Peng, J.; Li, S. Covering location problem of emergency service facilities in an uncertain environment. Appl. Math. Model. 2017, 51, 429–447. [Google Scholar] [CrossRef]
  14. Yu, W.; Guan, M.; Chen, Y. Fire stations siting with multiple objectives and geospatial big data. Earth Sci. Inform. 2021, 14, 141–160. [Google Scholar] [CrossRef]
  15. Yao, J.; Zhang, X.; Murray, A.T. Location optimization of urban fire stations: Access and service coverage. Comput. Environ. Urban Syst. 2019, 73, 184–190. [Google Scholar] [CrossRef]
  16. Wang, K.; Li, Z.; Zhou, J. Two decision-making approaches to fire station location in a fuzzy environment. J. Inf. Comput. Sci. 2014, 11, 4779–4793. [Google Scholar] [CrossRef]
  17. Sirbiladze, G.; Ghvaberidze, B.; Matsaberidze, B.; Midodashvili, B. New fuzzy approach to facility location problem for extreme environment. J. Intell. Fuzzy Syst. 2019, 37, 7883–7893. [Google Scholar] [CrossRef]
  18. Murray, A.T. Optimising the spatial location of urban fire stations. Fire Saf. J. 2013, 62, 64–71. [Google Scholar] [CrossRef]
  19. Ming, J.; Richard, J.-P.P.; Qin, R.; Zhu, J. Distributionally robust optimization for fire station location under uncertainties. Sci. Rep. 2022, 12, 5394. [Google Scholar] [CrossRef] [PubMed]
  20. Drakulic, D.; Takaci, A.; Marić, M. Fuzzy covering location problems with different aggregation operators. Filomat 2017, 31, 513–522. [Google Scholar] [CrossRef]
  21. Rodriguez, S.A.; De la Fuente, R.A.; Aguayo, M.M. A facility location and equipment emplacement technique model with expected coverage for the location of fire stations in the Concepción province, Chile. Comput. Ind. Eng. 2020, 147, 106522. [Google Scholar] [CrossRef]
  22. Han, B.; Hu, M.; Zheng, J.; Tang, T. Site Selection of Fire Stations in Large Cities Based on Actual Spatiotemporal Demands: A Case Study of Nanjing City. ISPRS Int. J. Geo-Inf. 2021, 10, 542. [Google Scholar] [CrossRef]
  23. Yu, Y. Optimization for Fire Station Location Planning Based on Travel Time of Fire Vehicles. In Proceedings of the 2012 Eighth International Conference on Computational Intelligence and Security, Guangzhou, China, 17–18 November 2012; pp. 328–331. [Google Scholar]
  24. Boschetti, M.; Maniezzo, V. A set covering based matheuristic for a real-world city logistics problem. Int. Trans. Oper. Res. 2015, 22, 169–195. [Google Scholar] [CrossRef]
  25. Chaudhary, P.; Chhetri, S.K.; Joshi, K.M.; Shrestha, B.M.; Kayastha, P. Application of an Analytic Hierarchy Process (AHP) in the GIS interface for suitable fire site selection: A case study from Kathmandu Metropolitan City, Nepal. Socio-Econ. Plan. Sci. 2016, 53, 60–71. [Google Scholar] [CrossRef]
  26. Xu, Z.; Liu, D.; Yan, L. Evaluating spatial configuration of fire stations based on real-Time traffic. Case Stud. Therm. Eng. 2021, 25, 100957. [Google Scholar] [CrossRef]
  27. Kc, K.; Corcoran, J.; Chhetri, P. Spatial optimisation of fire service coverage: A case study of Brisbane, Australia. Geogr. Res. 2018, 56, 270–284. [Google Scholar] [CrossRef]
  28. Chevalier, P.; Thomas, I.; Geraets, D.; Goetghebeur, E.; Janssens, O.; Peeters, D.; Plastria, F. Locating fire stations: An integrated approach for Belgium. Socio-Econ. Plan. Sci. 2012, 46, 173–182. [Google Scholar] [CrossRef]
  29. Dong, X.; Li, Y.; Pan, Y.; Huang, Y.; Cheng, X. Study on Urban Fire Station Planning based on Fire Risk Assessment and GIS Technology. Procedia Eng. 2018, 211, 124–130. [Google Scholar] [CrossRef]
  30. Zhou, J. Research on Layout Optimization Method of Urban Fire Station Based on Fire Risk Assessment. Adv. Mater. Res. 2013, 838–841, 2162–2169. [Google Scholar] [CrossRef]
  31. Chen, M.; Wang, K.; Yuan, Y.; Yang, C. A POIs Based Method for Location Optimization of Urban Fire Station: A Case Study in Zhengzhou City. Fire 2023, 6, 58. [Google Scholar] [CrossRef]
  32. Wang, W.; Xu, Z.; Sun, D.; Lan, T. Spatial Optimization of Mega-City Fire Stations Based on Multi-Source Geospatial Data: A Case Study in Beijing. ISPRS Int. J. Geo-Inf. 2021, 10, 282. [Google Scholar] [CrossRef]
  33. Wang, K.; Yuan, Y.; Chen, M.; Wang, D. A POIs based method for determining spatial distribution of urban fire risk. Process. Saf. Environ. Prot. 2021, 154, 447–457. [Google Scholar] [CrossRef]
  34. Liu, X. The Petrochemical Park Fire Safety Planning Study Based on Fire Risk Analysis. Adv. Mater. Res. 2012, 518–523, 1045–1051. [Google Scholar] [CrossRef]
  35. Zheng, W. Discussion on Fire Planning for Large-Scale Petrochemical Industrial Park. Adv. Mater. Res. 2013, 807–809, 272–275. [Google Scholar] [CrossRef]
  36. Wan, H.; Yun, Y. Study on Fire Safety Planning in Chinese Petrochemical Industry Parks. Adv. Mater. Res. 2012, 260–261, 279–283. [Google Scholar] [CrossRef]
  37. Jiang, J.; Zhang, X.; Wei, R.; Huang, S.; Zhang, X. Study on Location of Fire Stations in Chemical Industry Parks from a Public Safety Perspective: Considering the Domino Effect and the Identification of Major Hazard Installations for Hazardous Chemicals. Fire 2023, 6, 218. [Google Scholar] [CrossRef]
  38. Zhou, Y.; Liu, M. Risk Assessment of Major Hazards and Its Application in Urban Planning: A Case Study. Risk Anal. 2012, 32, 566–577. [Google Scholar] [CrossRef]
  39. He, Z.; Weng, W. A Dynamic and Simulation-Based Method for Quantitative Risk Assessment of the Domino Accident in Chemical Industry. Process. Saf. Environ. Prot. 2020, 144, 79–92. [Google Scholar] [CrossRef]
  40. Pak, S.; Kang, C. Increased Risk to People around Major Hazardous Installations and the Necessity of Land Use Planning in South Korea. Process. Saf. Environ. Prot. 2021, 149, 325–333. [Google Scholar] [CrossRef]
  41. Xu, X.; Zhu, H. Fire Station Planning Method Based on Identification of Major Hazards in Chemical Parks. In Proceedings of the Annual Scientific and Technical Conference of the China Fire Protection Association, Beijing, China, 23 September 2020. (In Chinese). [Google Scholar]
  42. Safety Supervision General Administration Ⅲ [2009] No. 116, Notice of the State Administration of Work Safety on Publishing the Catalogue of the First Batch of Key Supervised Hazardous Chemical Processes, China State Administration of Work Safety; China State Administration of Work Safety: Beijing, China, 2009.
  43. Safety Supervision General Administration Ⅲ [2011] No. 95, Notice of the State Administration of Work Safety on Publishing the List of the First Batch of Key Supervised Hazardous Chemicals, China State Administration of Work Safety; China State Administration of Work Safety: Beijing, China, 2011.
  44. GB 18218-2018; Identification of Major Hazard Installations for Hazardous Chemicals. China National Standardization Administration and State Administration for Market Regulation: Beijing, China, 2018.
  45. Li, G.; Sun, Z.; Zhu, J.; Zhang, G. Database construction and application of hazardous chemical explosion and fire accidents. Fire Sci. Technol. 2023, 42, 575–579. (In Chinese) [Google Scholar]
  46. GB/T 51328-2018; Standard for Urban Comprehensive Transport System Planning. State Administration for Market Regulation and Ministry of Housing and Urban-Rural Development of P.R. China: Beijing, China, 2018.
  47. Huang, A.-C.; Huang, C.-F.; Shu, C.-M. A Case Study for an Assessment of Fire Station Selection in the Central Urban Area. Safety 2023, 9, 84. [Google Scholar] [CrossRef]
Figure 1. Rescue road network; PTBR and fire station locations in Park X.
Applsci 14 02918 g001
Figure 2. Fire risk assessment results for Park X.
Applsci 14 02918 g002
Figure 3. Comparison between the required and estimated rescue time.
Applsci 14 02918 g003
Figure 4. The area effectively covered by fire stations in Park X.
Applsci 14 02918 g004
Figure 5. Analysis diagram for the overlap-coverage rate of fire stations.
Applsci 14 02918 g005
Figure 6. The overlap-covered area by the fire stations in Park X.
Applsci 14 02918 g006
Figure 7. The relationship between the coverage rate and overlap-coverage rate with the estimated speed of fire engines.
Applsci 14 02918 g007
Figure 8. Comparison between the “Circle-drawing method” and this study.
Applsci 14 02918 g008
Table 1. Information on the chemical industrial parks where this method has been implemented. FS stands for fire station.
IdentificationGeneral LocationArea, km2FS NumberFS Coverage RateFS Overlap-Coverage Rate
Park ANorth China15394%76%
Park BNortheast China13.02297%24%
Park CSoutheast China6.60496%82%
Park DSouthwest China4.50198%-
Park ESouthwest China18.57362%0%
Park FSouthwest China4.741100%-
Park XSouthwest China11.33292.6%62%
Table 2. Fire risk assessment indicators for chemical industrial park.
Indicator NameInterpretation
Key supervised hazardous chemical processesChemical processes that are listed in the catalogue of key supervised hazardous chemical processes published by the China State Administration of Work Safety [42]
Key supervised hazardous chemicalsChemicals that are listed in the list of key supervised hazardous chemicals published by the China State Administration of Work Safety [43]
Major hazard installations of hazardous chemicalsInstallations that produce, store, use, and trade hazardous chemicals on a long-term or temporary basis, and where the quantity of hazardous chemicals equals or exceeds the threshold quantity according to the national standard [44]. (These installations are categorized into four levels from level I to level IV, with level I being the most hazardous.)
Table 3. Scoring and weights for fire risk assessment indicators.
CriteriaScoringWeight
05075100
Number of key supervised hazardous chemical processes0--10.3
Number of key supervised hazardous chemicals012–3≥40.2
Level of major hazard installations of hazardous chemicalsNoneIVIIII, II0.5
Table 4. Classification of fire risk levels.
Fire Risk ScoreFire Risk Level
R     X ¯ + σHigh
X ¯   +   σ   >   R     X ¯ Medium
R   <   X ¯ Low
Table 5. Required fire rescue time for corresponding fire risk level.
Fire Risk LevelRequired Fire Rescue Time
High3 min
Medium5 min
Low8 min
Disclaimer/Publisher’s Note: The statements, opinions and data contained in all publications are solely those of the individual author(s) and contributor(s) and not of MDPI and/or the editor(s). MDPI and/or the editor(s) disclaim responsibility for any injury to people or property resulting from any ideas, methods, instructions or products referred to in the content.

