
Optimization of Cabin Virus Transmission Suppression Technology Based on Hanging Curtain Physical Isolation


Abstract
1. Introduction
2. Materials and Methods
2.1. Numerical Methods
2.1.1. Turbulence Model
2.1.2. Modeling the Droplets
2.2. The Room Model
2.2.1. The Geometry and Mesh
2.2.2. Boundary Conditions and Case Description
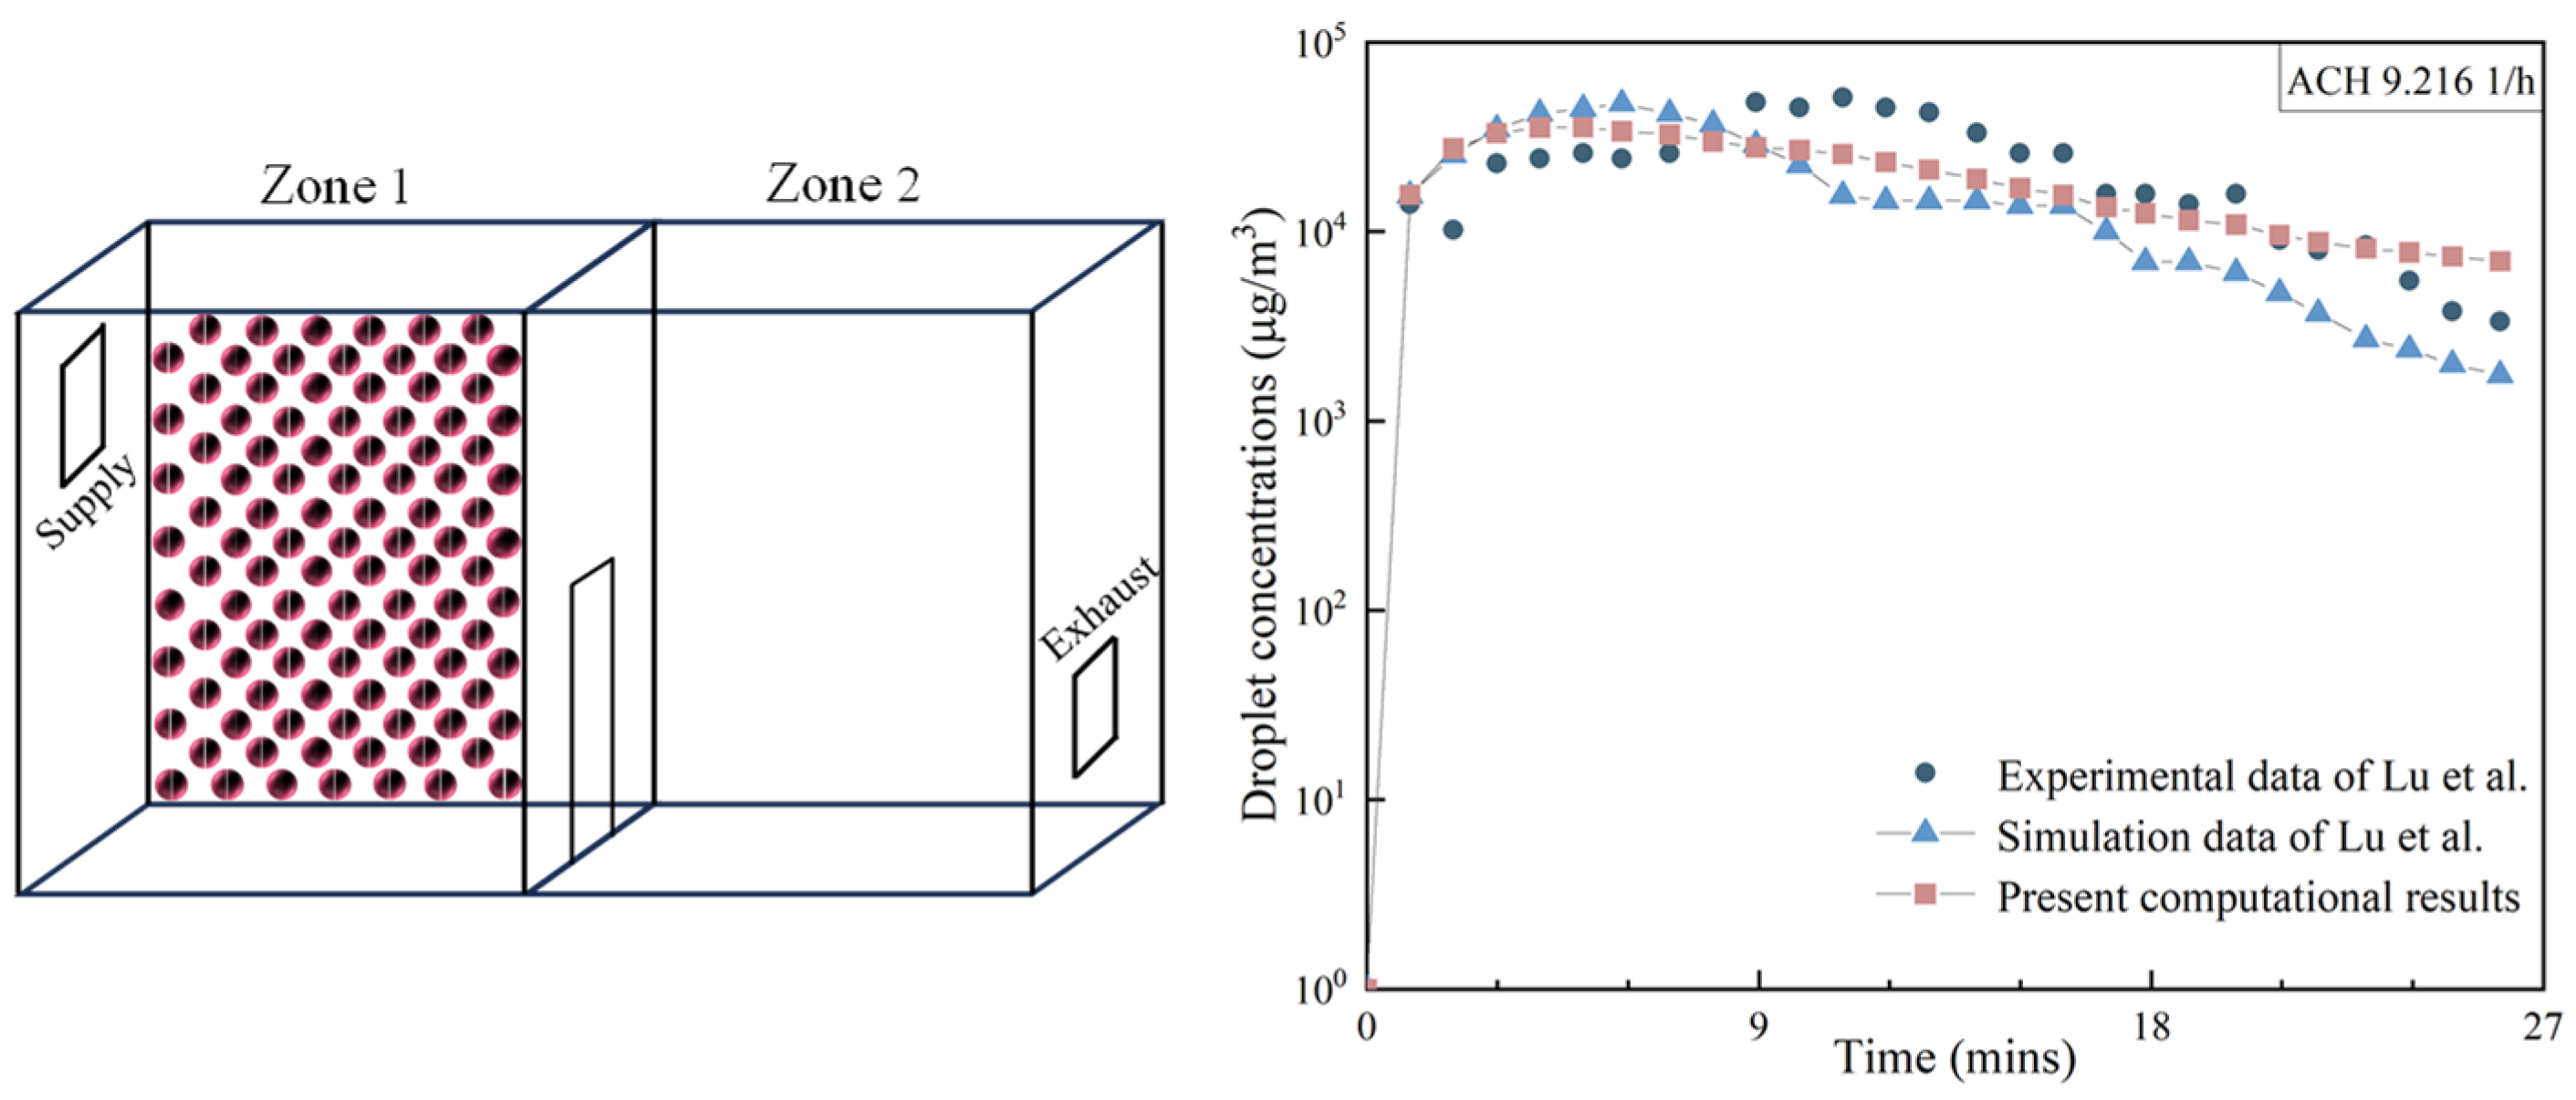
2.3. Model Validation and Mesh Independence Test
2.4. Analysis Methods
3. Results and Discussion
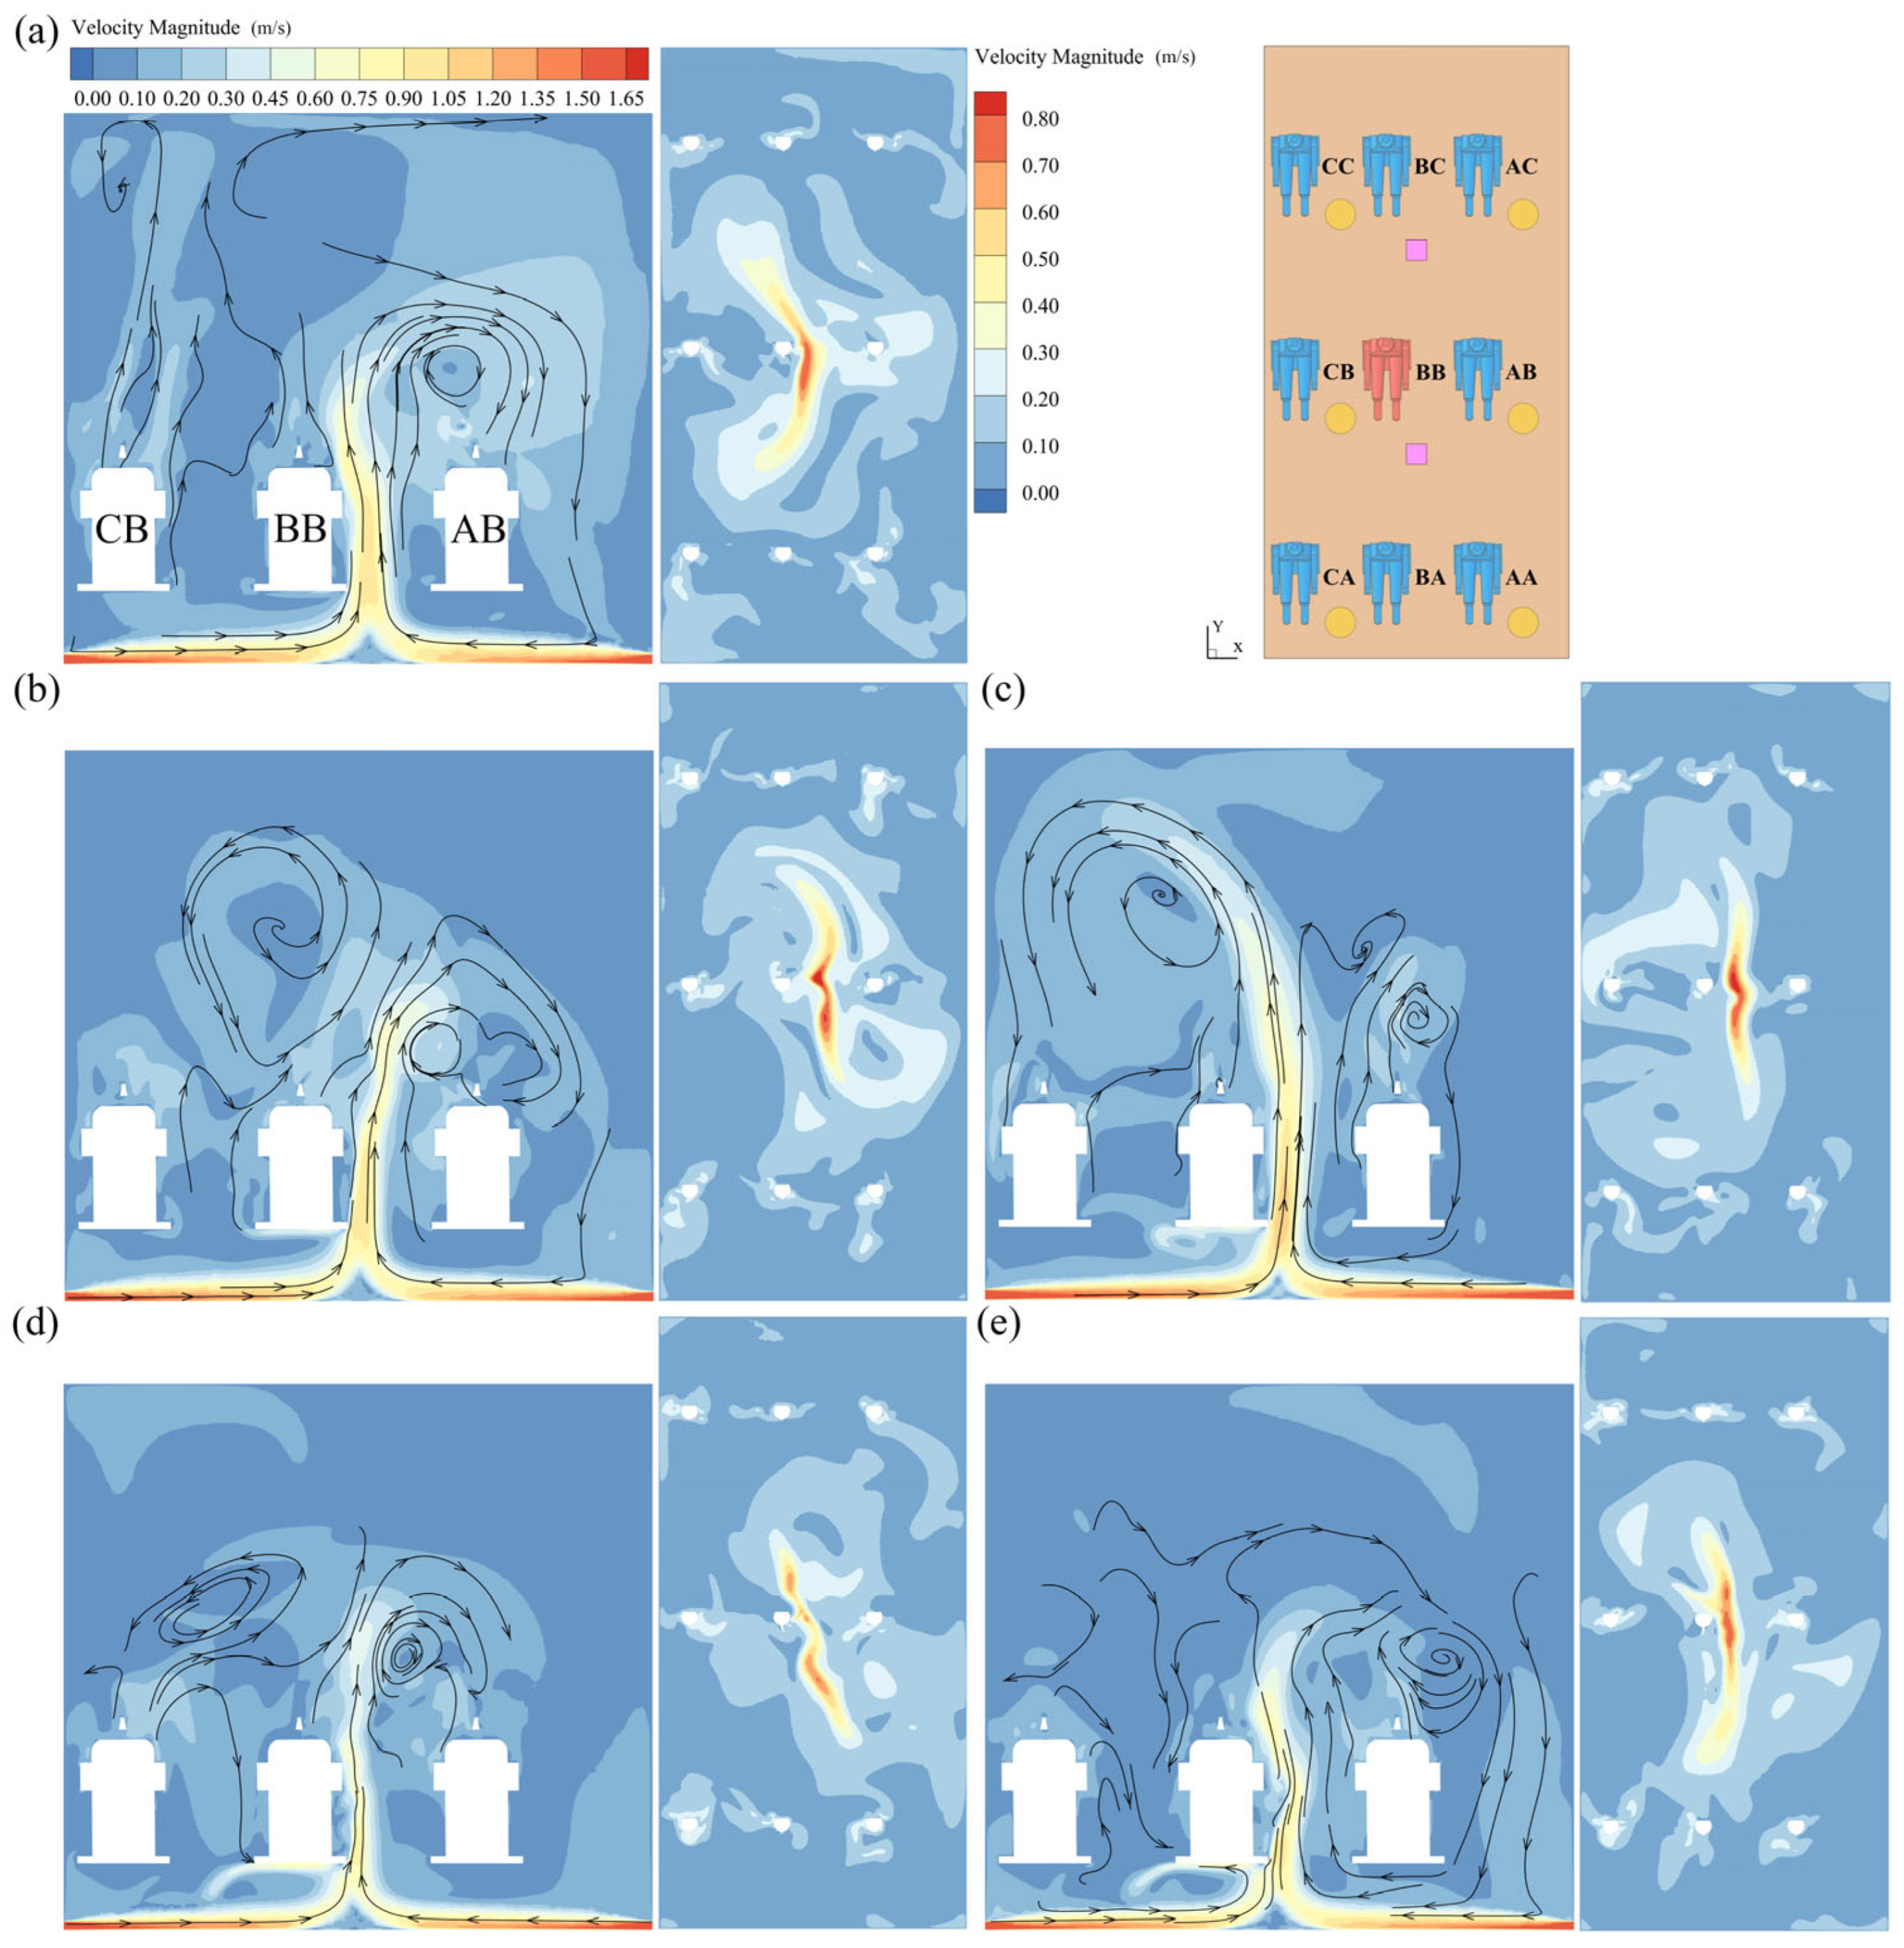
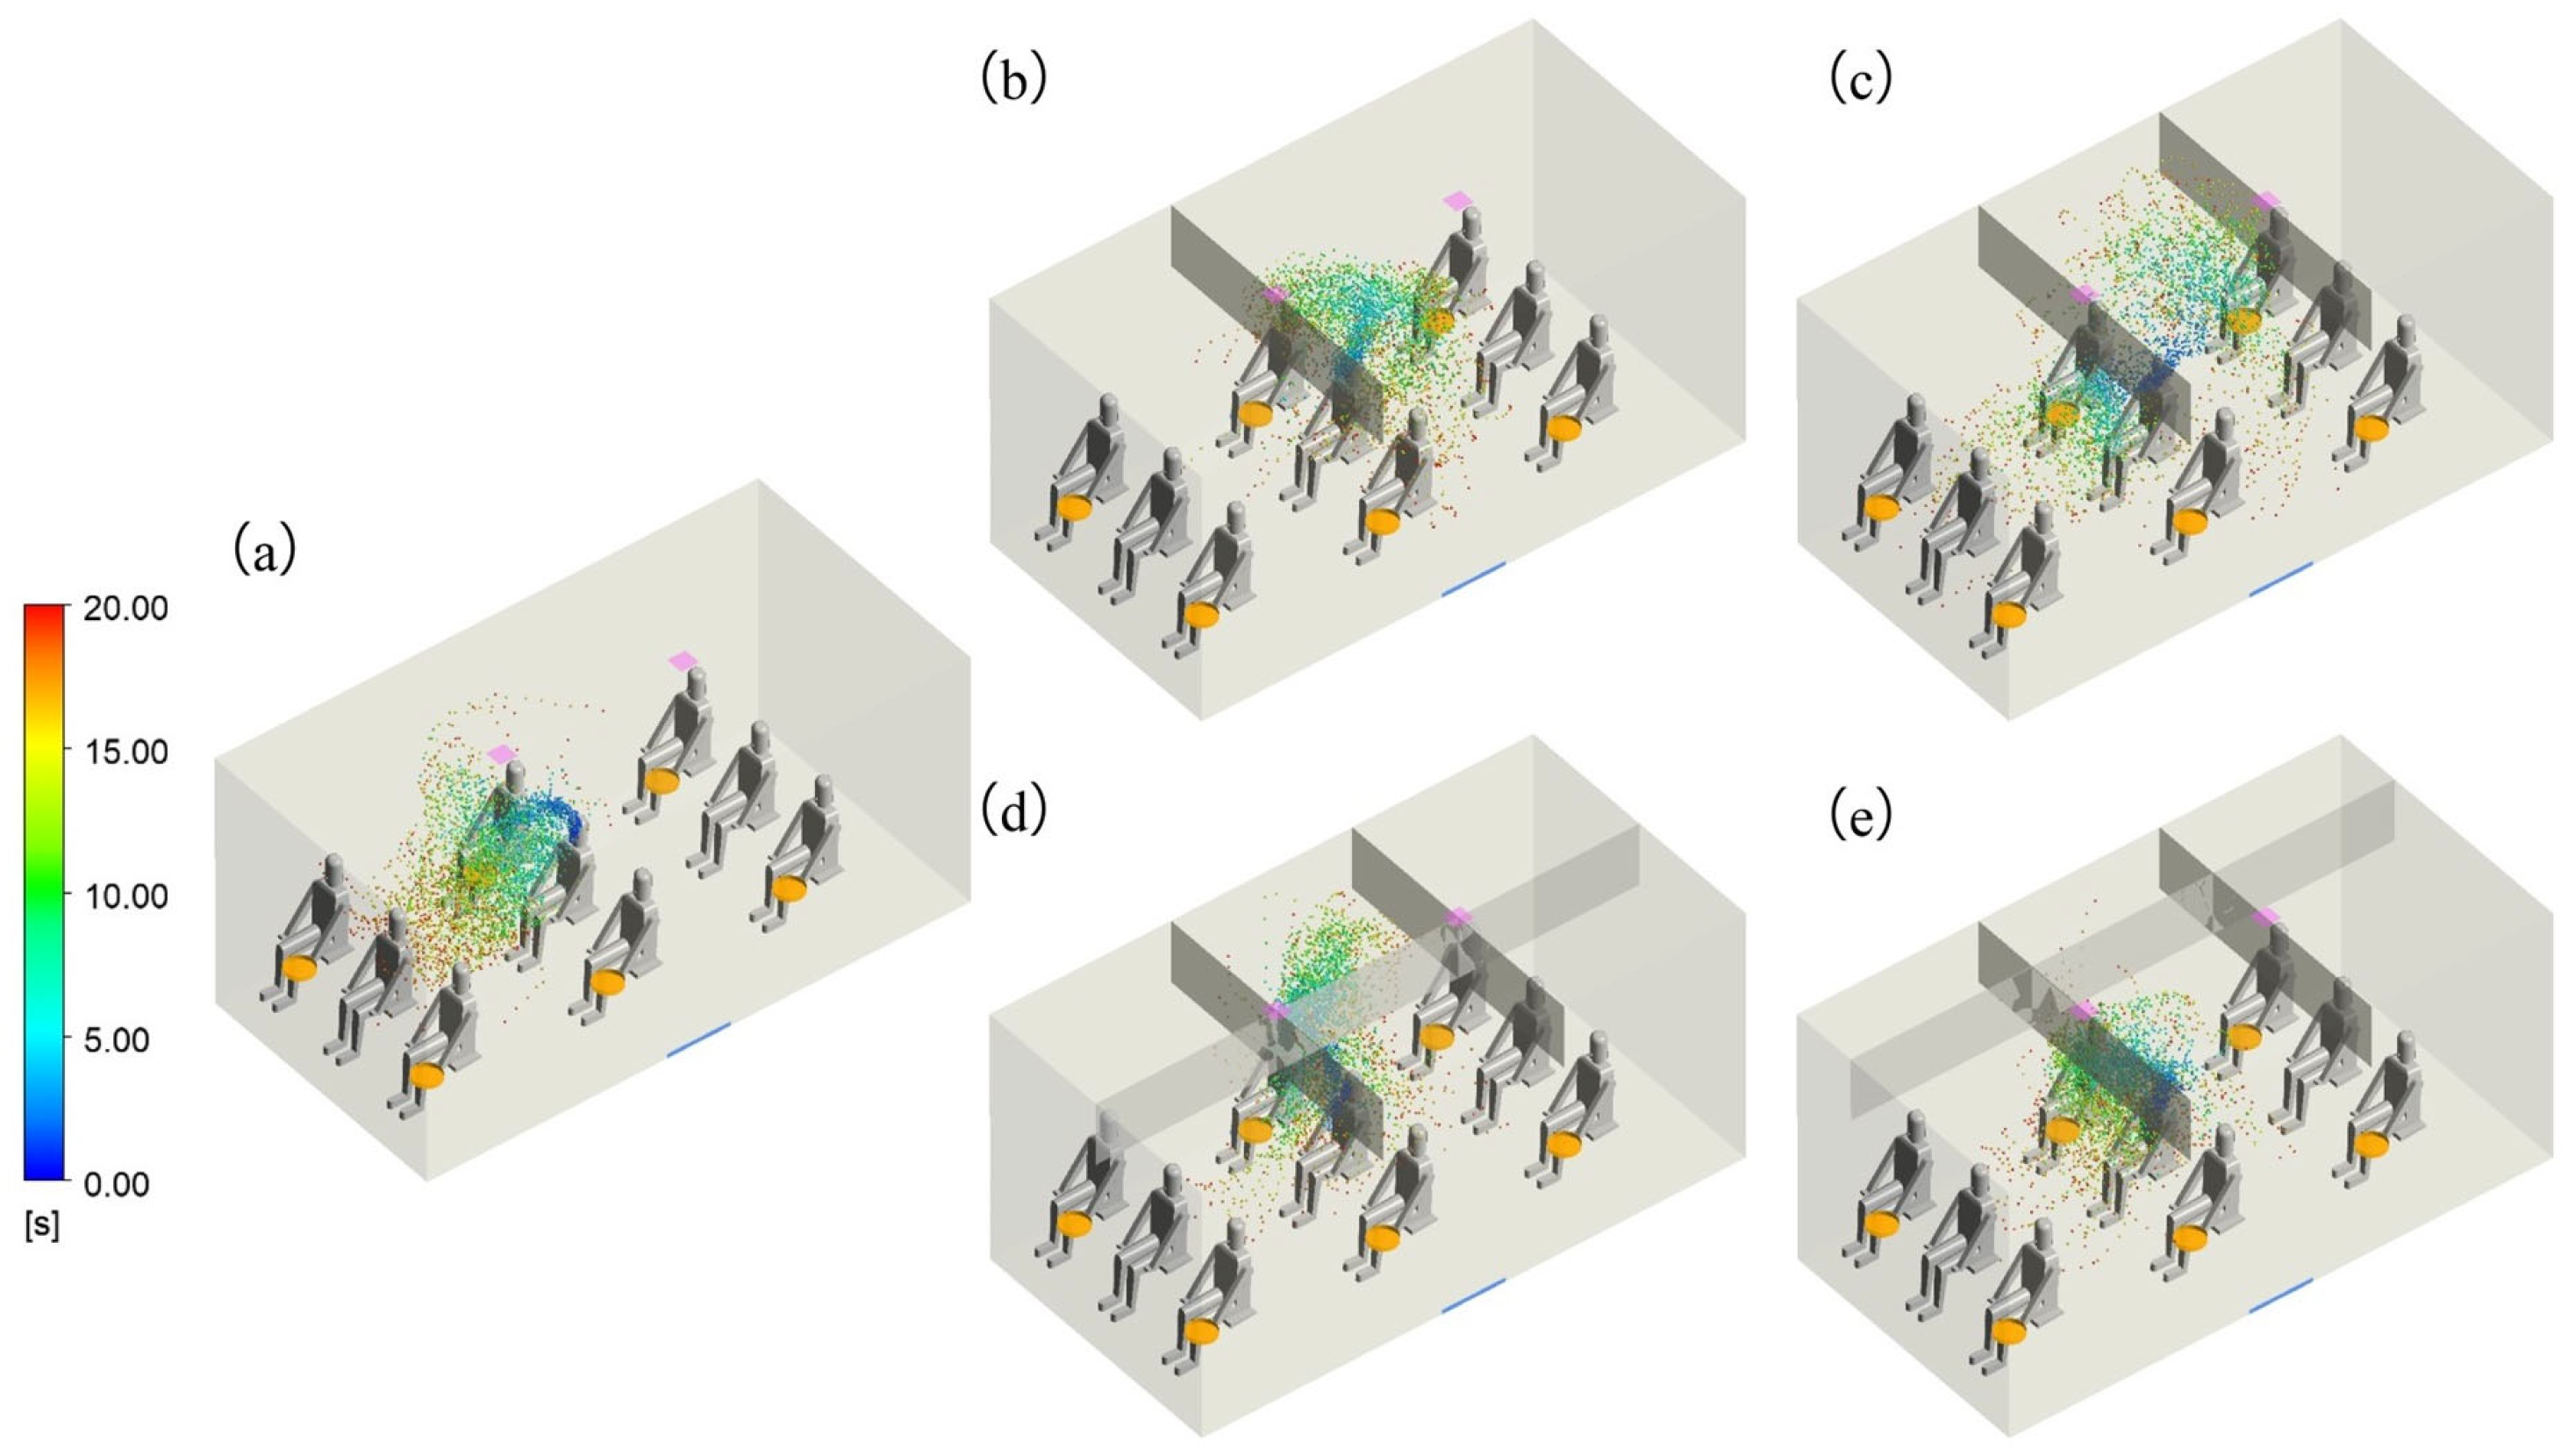
3.1. Flow Fields and Droplet Dispersion
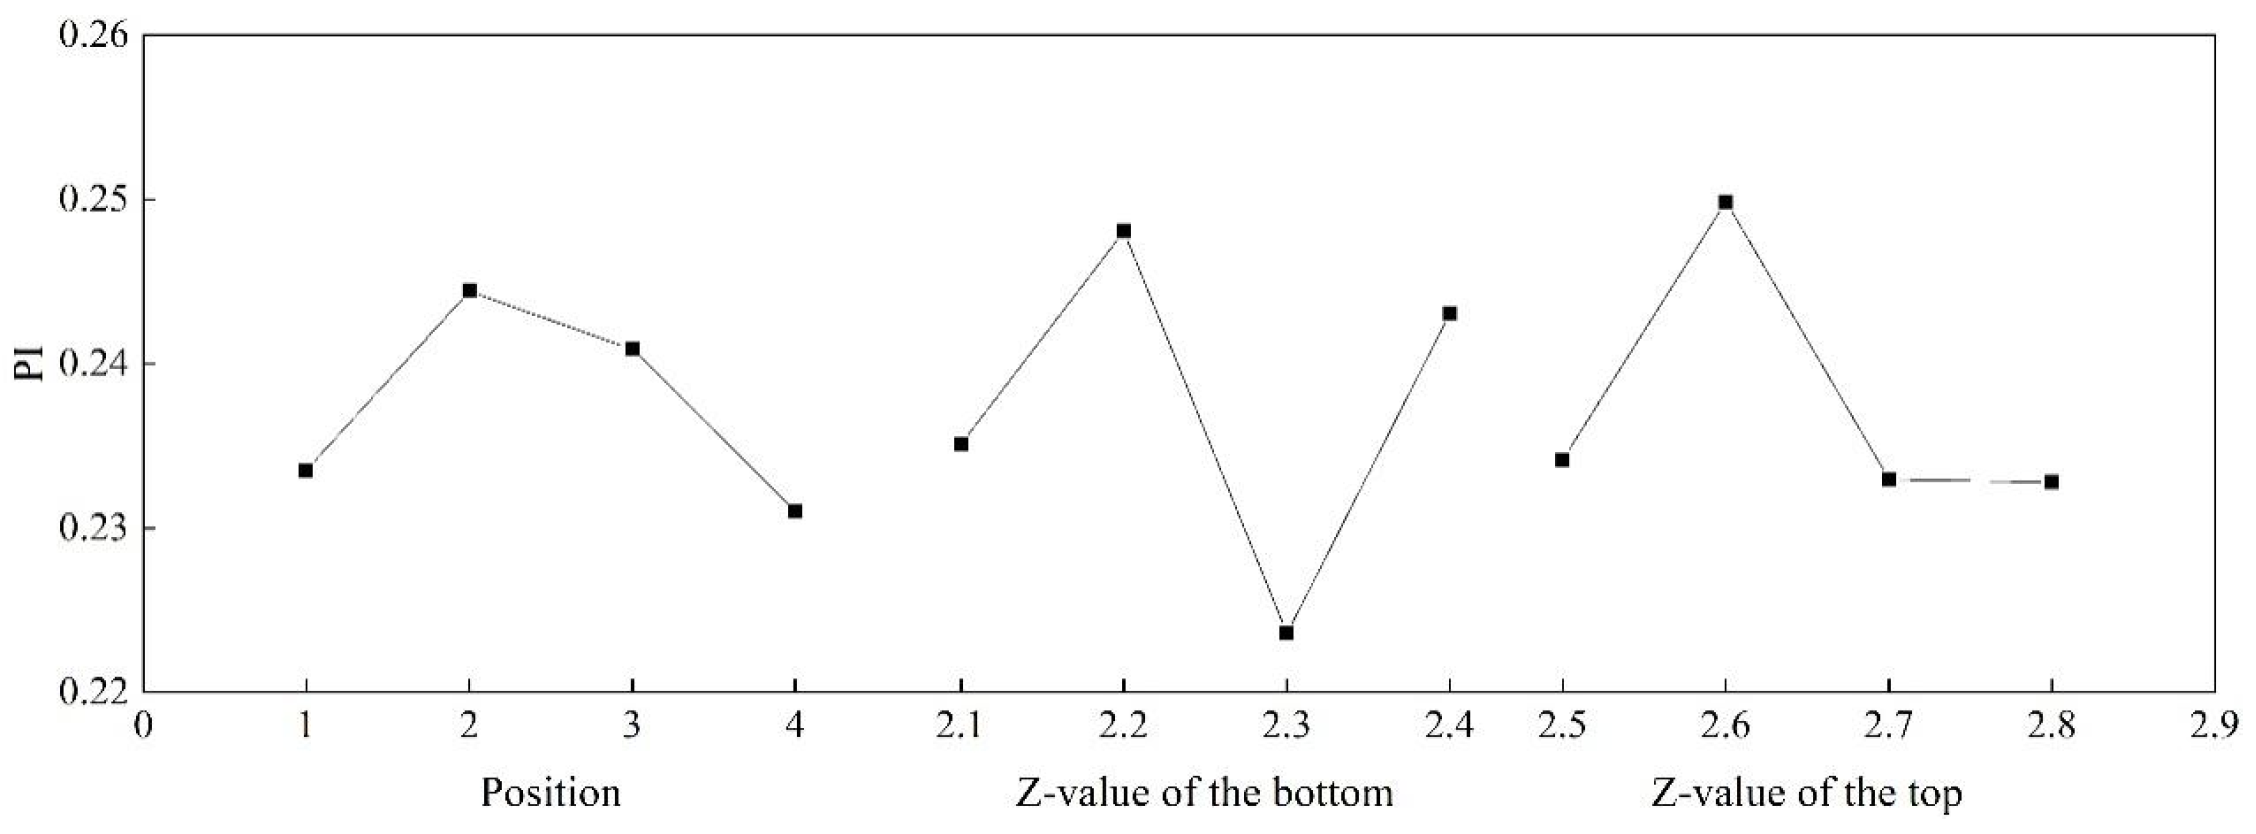
3.2. Orthogonal Optimization
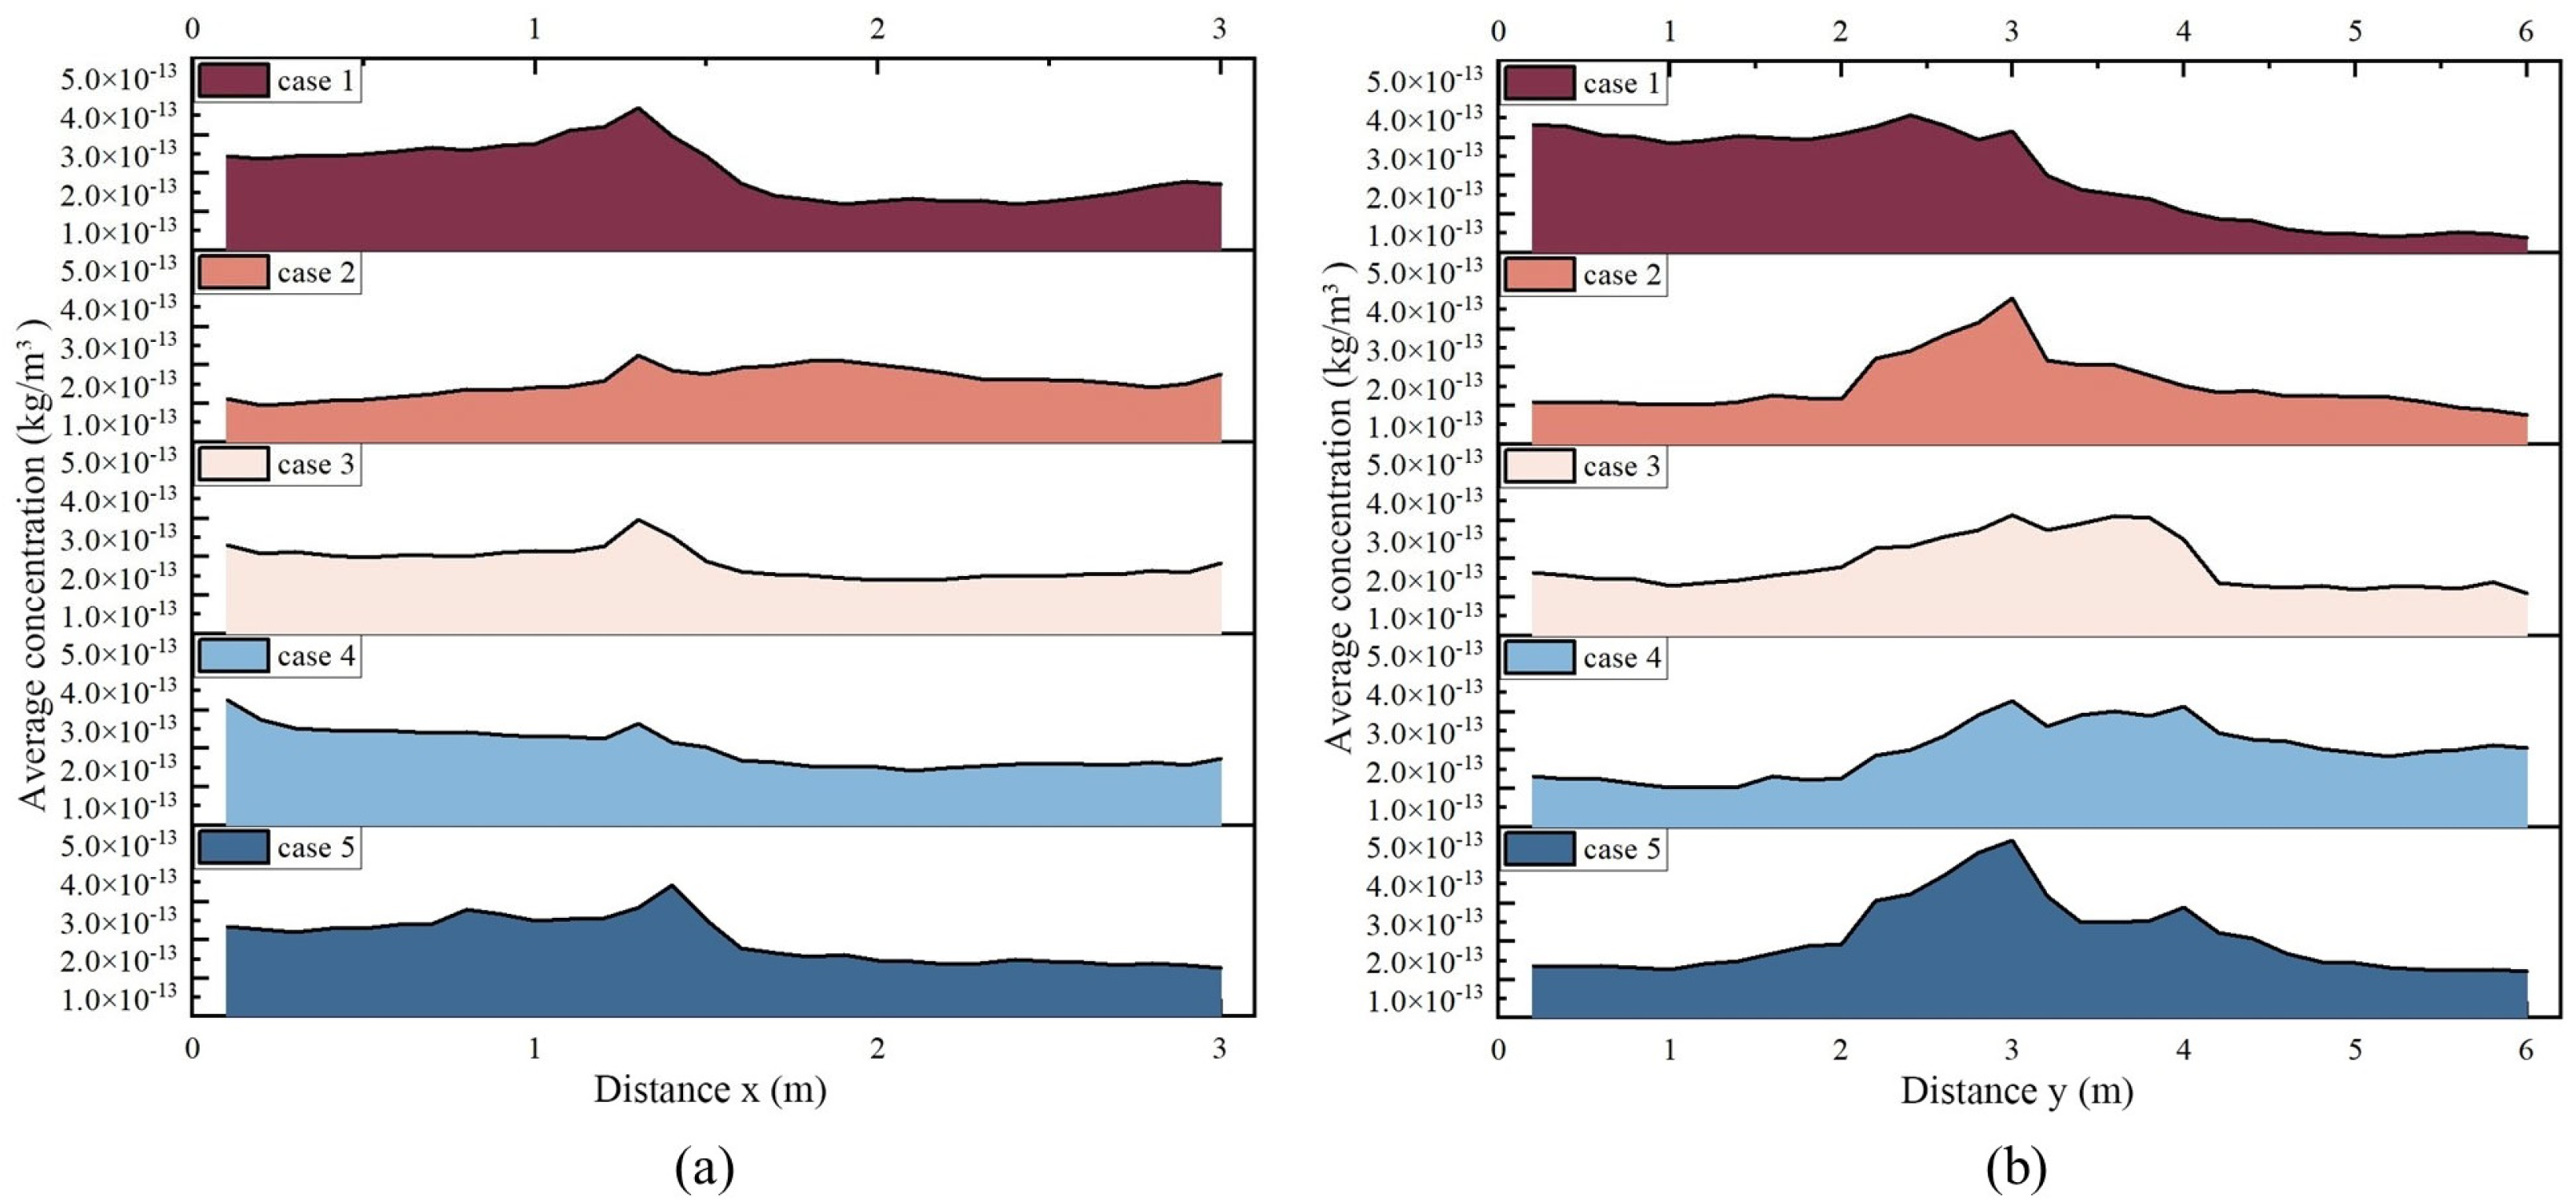
3.3. Scheme Effectiveness Evaluation
4. Conclusions
Author Contributions
Funding
Institutional Review Board Statement
Informed Consent Statement
Data Availability Statement
Conflicts of Interest
References
- Li, Y.; Qian, H.; Hang, J.; Chen, X.; Cheng, P.; Ling, H.; Wang, S.; Liang, P.; Li, J.; Xiao, S.; et al. Probable airborne transmission of SARS-CoV-2 in a poorly ventilated restaurant. Build. Environ. 2021, 196, 107788. [Google Scholar] [CrossRef] [PubMed]
- Yip, T.L.; Huang, Y.; Liang, C. Built environment and the metropolitan pandemic: Analysis of the COVID-19 spread in Hong Kong. Build. Environ. 2020, 188, 107471. [Google Scholar] [CrossRef] [PubMed]
- Blocken, B.; van Druenen, T.; Ricci, A.; Kang, L.; van Hooff, T.; Qin, P.; Xia, L.; Ruiz, C.A.; Arts, J.; Diepens, J.; et al. Ventilation and air cleaning to limit aerosol particle concentrations in a gym during the COVID-19 pandemic. Build. Environ. 2021, 193, 107659. [Google Scholar] [CrossRef] [PubMed]
- Zhao, X.; Liu, S.; Yin, Y.; Zhang, T.; Chen, Q. Airborne transmission of COVID-19 virus in enclosed spaces: An overview of research methods. Indoor Air 2022, 32, e13056. [Google Scholar] [CrossRef] [PubMed]
- Shen, J.; Kong, M.; Dong, B.; Birnkrant, M.J.; Zhang, J. A systematic approach to estimating the effectiveness of multi-scale IAQ strategies for reducing the risk of airborne infection of SARS-CoV-2. Build. Environ. 2021, 200, 107926. [Google Scholar] [CrossRef] [PubMed]
- Ou, C.; Hu, S.; Luo, K.; Yang, H.; Hang, J.; Cheng, P.; Hai, Z.; Xiao, S.; Qian, H.; Xiao, S.; et al. Insufficient ventilation led to a probable long-range airborne transmission of SARS-CoV-2 on two buses. Build. Environ. 2021, 207, 108414. [Google Scholar] [CrossRef] [PubMed]
- Li, L.X.; Nissly, R.H.; Swaminathan, A.; Bird, I.M.; Boyle, N.R.; Nair, M.S.; Greenawalt, D.I.; Gontu, A.; Cavener, V.S.; Sornberger, T.; et al. Inactivation of HCoV-NL63 and SARS-CoV-2 in aqueous solution by 254 nm UV-C. J. Photochem. Photobiol. B Biol. 2023, 245, 112755. [Google Scholar] [CrossRef] [PubMed]
- Mousavi, E.S.; Pollitt, K.J.G.; Sherman, J.; Martinello, R.A. Performance analysis of portable HEPA filters and temporary plastic anterooms on the spread of surrogate coronavirus. Build. Environ. 2020, 183, 107186. [Google Scholar] [CrossRef] [PubMed]
- Qiao, Y.; Yang, M.; Marabella, I.A.; McGee, D.A.; Olson, B.A.; Torremorell, M.; Hogan, C.J. Wind tunnel-based testing of a photoelectrochemical oxidative filter-based air purification unit in coronavirus and influenza aerosol removal and inactivation. Indoor Air 2021, 31, 2058–2069. [Google Scholar] [CrossRef] [PubMed]
- Kong, B.; Li, Y.; Cheng, M.; Song, C.; Zou, Y.; Shi, H.; Jiang, Y. Droplet dispersion characteristics during human walking in a queue. Phys. Fluids 2023, 35, 103322. [Google Scholar] [CrossRef]
- de Mesquita, P.J.B.; Delp, W.W.; Chan, W.R.; Bahnfleth, W.P.; Singer, B.C. Control of airborne infectious disease in buildings: Evidence and research priorities. Indoor Air 2021, 32, e12965. [Google Scholar] [CrossRef] [PubMed]
- Deng, Z.; Chen, Q. What is suitable social distancing for people wearing face masks during the COVID-19 pandemic? Indoor Air 2021, 32, e12935. [Google Scholar] [CrossRef] [PubMed]
- Pan, Y.; Zhang, H.; Niu, Z.; An, Y.; Chen, C. Boundary conditions for exhaled airflow from a cough with a surgical orN95mask. Indoor Air 2022, 32, e13088. [Google Scholar] [CrossRef] [PubMed]
- Daniel, D.; Lin, M.; Luhung, I.; Lui, T.; Sadovoy, A.; Koh, X.; Sng, A.; Tran, T.; Schuster, S.C.; Loh, X.J.; et al. Effective design of barrier enclosure to contain aerosol emissions from COVID-19 patients. Indoor Air 2021, 31, 1639–1644. [Google Scholar] [CrossRef] [PubMed]
- Bin Jeong, S.; Heo, K.J.; Ko, H.S.; Ahn, J.P.; Lee, S.; Jung, J.H. Evaluation of survival rates of airborne microorganisms on the filter layers of commercial face masks. Indoor Air 2021, 31, 1134–1143. [Google Scholar] [CrossRef] [PubMed]
- Li, W.; Chong, A.; Lasternas, B.; Peck, T.G.; Tham, K.W. Quantifying the effectiveness of desk dividers in reducing droplet and airborne virus transmission. Indoor Air 2021, 32, e12950. [Google Scholar] [CrossRef] [PubMed]
- Mirzaie, M.; Lakzian, E.; Khan, A.; Warkiani, M.E.; Mahian, O.; Ahmadi, G. COVID-19 spread in a classroom equipped with partition—A CFD approach. J. Hazard. Mater. 2021, 420, 126587. [Google Scholar] [CrossRef] [PubMed]
- Ren, C.; Xi, C.; Wang, J.; Feng, Z.; Nasiri, F.; Cao, S.-J.; Haghighat, F. Mitigating COVID-19 infection disease transmission in indoor environment using physical barriers. Sustain. Cities Soc. 2021, 74, 103175. [Google Scholar] [CrossRef] [PubMed]
- Ahmadzadeh, M.; Shams, M. Multi-objective performance assessment of HVAC systems and physical barriers on COVID-19 infection transmission in a high-speed train. J. Build. Eng. 2022, 53, 104544. [Google Scholar] [CrossRef]
- Cheong, C.H.; Lee, S. Case Study of Airborne Pathogen Dispersion Patterns in Emergency Departments with Different Ventilation and Partition Conditions. Int. J. Environ. Res. Public Health 2018, 15, 510. [Google Scholar] [CrossRef] [PubMed]
- Oksanen, L.; Auvinen, M.; Kuula, J.; Malmgren, R.; Romantschuk, M.; Hyvärinen, A.; Laitinen, S.; Maunula, L.; Sanmark, E.; Geneid, A.; et al. Combining Phi6 as a surrogate virus and computational large-eddy simulations to study airborne transmission of SARS-CoV-2 in a restaurant. Indoor Air 2022, 32, e13165. [Google Scholar] [CrossRef] [PubMed]
- Liu, Z.; Li, R.; Wu, Y.; Ju, R.; Gao, N. Numerical study on the effect of diner divider on the airborne transmission of diseases in canteens. Energy Build. 2021, 248, 111171. [Google Scholar] [CrossRef]
- Redrow, J.; Mao, S.; Celik, I.; Posada, J.A.; Feng, Z.-G. Modeling the evaporation and dispersion of airborne sputum droplets expelled from a human cough. Build. Environ. 2011, 46, 2042–2051. [Google Scholar] [CrossRef]
- Zhou, Y.; Ji, S. Experimental and numerical study on the transport of droplet aerosols generated by occupants in a fever clinic. J. Affect. Disord. 2020, 187, 107402. [Google Scholar] [CrossRef]
- Yan, Y.; Li, X.; Yang, L.; Yan, P.; Tu, J. Evaluation of cough-jet effects on the transport characteristics of respiratory-induced contaminants in airline passengers’ local environments. J. Affect. Disord. 2020, 183, 107206. [Google Scholar] [CrossRef]
- Kong, B.; Zou, Y.; Cheng, M.; Shi, H.; Jiang, Y. Droplets Transmission Mechanism in a Commercial Wide-Body Aircraft Cabin. Appl. Sci. 2022, 12, 4889. [Google Scholar] [CrossRef]
- Armstrong, T.W.; Haas, C.N. A Quantitative Microbial Risk Assessment Model for Legionnaires’ Disease: Animal Model Selection and Dose-Response Modeling. Risk Anal. 2007, 27, 1581–1596. [Google Scholar] [CrossRef]
- Vuorinen, V.; Aarnio, M.; Alava, M.; Alopaeus, V.; Atanasova, N.; Auvinen, M.; Balasubramanian, N.; Bordbar, H.; Erästö, P.; Grande, R.; et al. Modelling aerosol transport and virus exposure with numerical simulations in relation to SARS-CoV-2 transmission by inhalation indoors. Saf. Sci. 2020, 130, 104866. [Google Scholar] [CrossRef] [PubMed]
- Zhang, Z.; Zhang, W.; Zhai, Z.J.; Chen, Q.Y. Evaluation of Various Turbulence Models in Predicting Airflow and Turbulence in Enclosed Environments by CFD: Part 2—Comparison with Experimental Data from Literature. HVAC&R Res. 2007, 13, 871–886. [Google Scholar] [CrossRef]
- Yakhot, V.; Orszag, S.A. Renormalization-group analysis of turbulence. Phys. Rev. Lett. 1986, 57, 1722–1724. [Google Scholar] [CrossRef]
- Chen, L.; Jin, X.; Yang, L.; Du, X.; Yang, Y. Particle transport characteristics in indoor environment with an air cleaner: The effect of nonuniform particle distributions. Build. Simul. 2017, 10, 123–133. [Google Scholar] [CrossRef] [PubMed]
- Zhao, B.; Zhang, Y.; Li, X.; Yang, X.; Huang, D. Comparison of indoor aerosol particle concentration and deposition in different ventilated rooms by numerical method. Build. Environ. 2004, 39, 1–8. [Google Scholar] [CrossRef]
- Ansys. ANSYS Fluent Theory Guide; ANSYS Inc.: Canonsburg, PA, USA, 2022; Available online: https://ansyshelp.an-sys.com/account/secured?returnurl=/Views/Secured/corp/v211/en/flu_th/flu_th_sec_disp_law2.html (accessed on 27 March 2024).
- Gupta, J.K.; Lin, C.-H.; Chen, Q. Inhalation of expiratory droplets in aircraft cabins. Indoor Air 2011, 21, 341–350. [Google Scholar] [CrossRef] [PubMed]
- Yang, X.; Yang, H.; Ou, C.; Luo, Z.; Hang, J. Airborne transmission of pathogen-laden expiratory droplets in open outdoor space. Sci. Total. Environ. 2021, 773, 145537. [Google Scholar] [CrossRef] [PubMed]
- Zhang, Z.; Han, T.; Yoo, K.H.; Capecelatro, J.; Boehman, A.L.; Maki, K. Disease transmission through expiratory aerosols on an urban bus. Phys. Fluids 2021, 33, 015116. [Google Scholar] [CrossRef] [PubMed]
- Almstrand, A.-C.; Bake, B.; Ljungström, E.; Larsson, P.; Bredberg, A.; Mirgorodskaya, E.; Olin, A.-C. Effect of airway opening on production of exhaled particles. J. Appl. Physiol. 2010, 108, 584–588. [Google Scholar] [CrossRef] [PubMed]
- Luo, Q.; Ou, C.; Hang, J.; Luo, Z.; Yang, H.; Yang, X.; Zhang, X.; Li, Y.; Fan, X. Role of pathogen-laden expiratory droplet dispersion and natural ventilation explaining a COVID-19 outbreak in a coach bus. Build. Environ. 2022, 220, 109160. [Google Scholar] [CrossRef] [PubMed]
- Gupta, J.K.; Lin, C.-H.; Chen, Q. Transport of expiratory droplets in an aircraft cabin. Indoor Air 2011, 21, 3–11. [Google Scholar] [CrossRef] [PubMed]
- Lu, W.; Howarth, A.T.; Adam, N.; Riffat, S.B. Modelling and measurement of airflow and aerosol particle distribution in a ventilated two-zone chamber. Build. Environ. 1996, 31, 417–423. [Google Scholar] [CrossRef]
- Zhai, Z.; Li, H. Distributed probability of infection risk of airborne respiratory diseases. Indoor Built Environ. 2021, 31, 1262–1270. [Google Scholar] [CrossRef]
- Nielsen, P.V. Control of airborne infectious diseases in ventilated spaces. J. R. Soc. Interface 2009, 6, S747–S755. [Google Scholar] [CrossRef] [PubMed]


| Equation | Continuity | Momentum | Energy | Turbulence k | Turbulence ε |
|---|---|---|---|---|---|
| 1 | |||||
| 0 | |||||
| 0 |
| Force | Expression | Meaning of the Symbols |
|---|---|---|
| μ is the air viscosity; dp is the droplet diameter; CD is the drag coefficient; Re is the relative Reynolds number of particles | ||
| Saffman’s force | K = 2.594; dij is the deformation tensor | |
| Thermophoretic force | DT,P is the thermophoretic coefficient; T is the local air temperature |
| Boundary | Momentum | Thermal | DPM |
|---|---|---|---|
| Door | No-slip | 26 °C | Reflect [38] |
| Walls | No-slip | 26 °C | Reflect |
| Table | No-slip | Adiabatic | Reflect |
| Bodies | No-slip | 31 °C [39] | Trap |
| Curtain | No-slip | Adiabatic | Reflect |
| Outlet | Pressure outlet | / | Escape |
| Inlet | 1.63 m/s | 20 °C | Escape |
| Mouth (susceptible person) | −0.37 m/s | 26 °C | Escape |
| Mouth (infected person) | 0.37 m/s | 33 °C [39] | Escape |
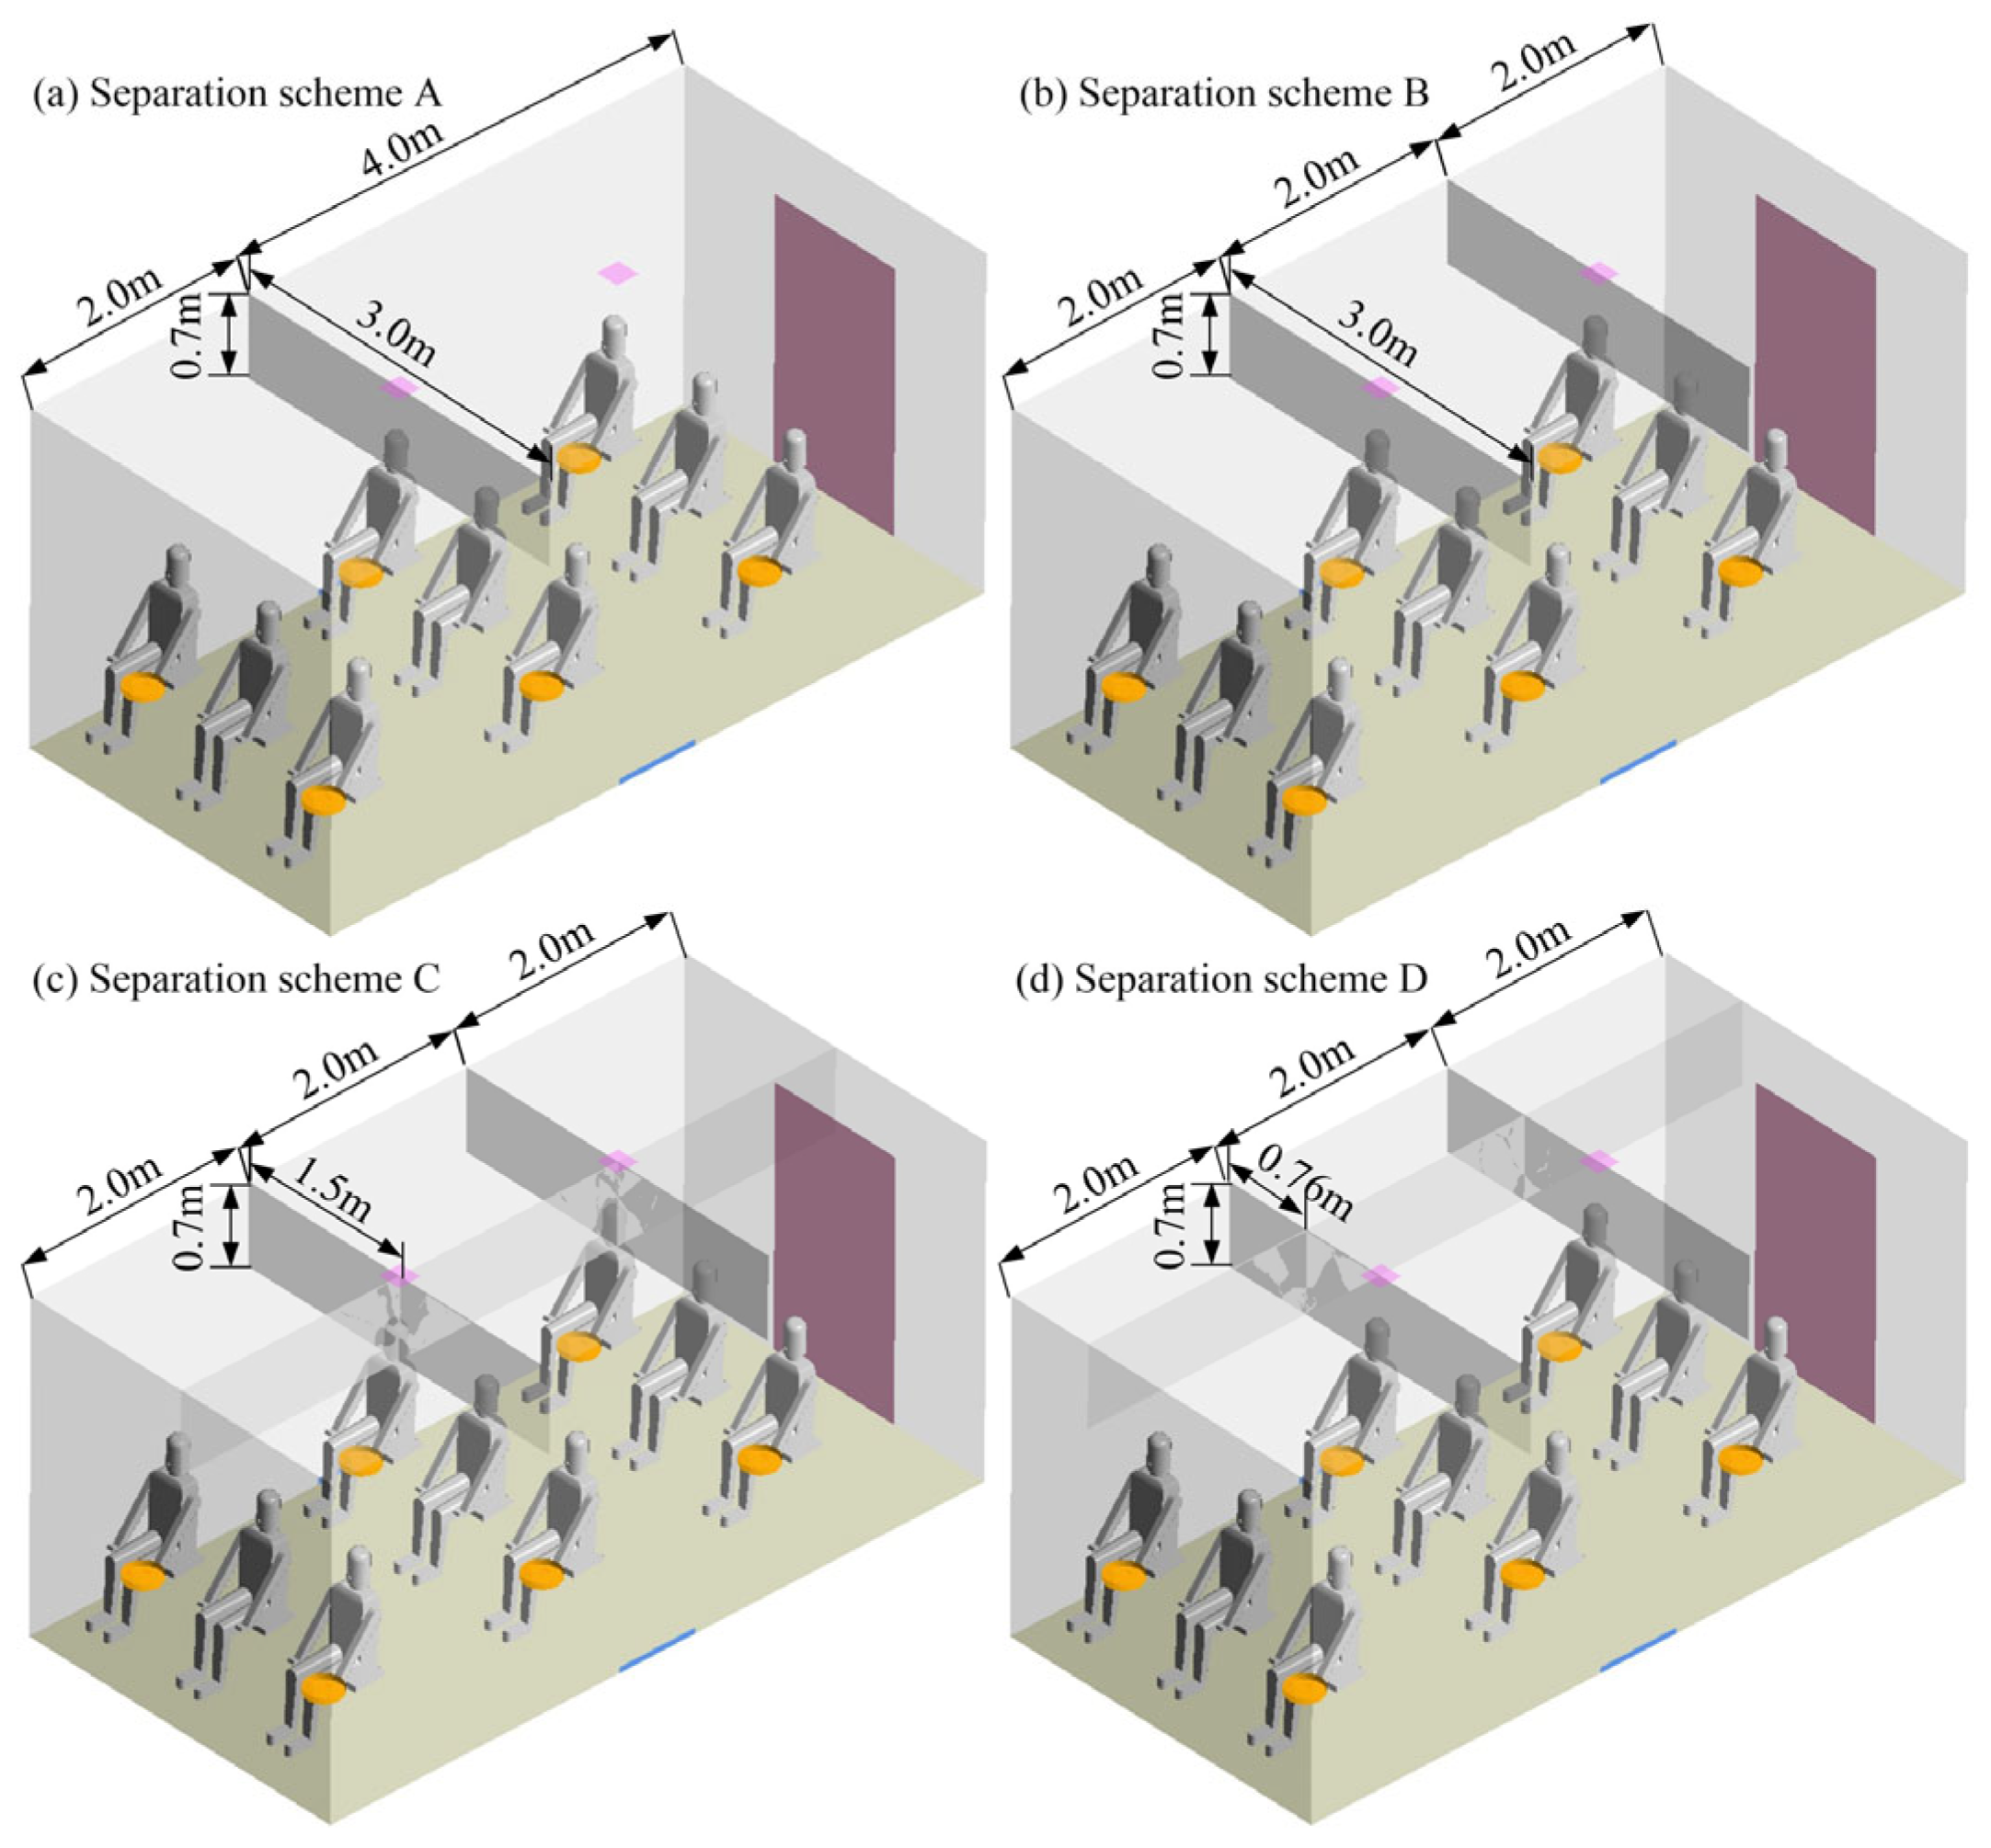
| Test Number | Scheme | Z1 (m) | Z2 (m) | API |
|---|---|---|---|---|
| 1 | A | 2.1 | 2.8 | 0.1958 |
| 2 | A | 2.2 | 2.7 | 0.2558 |
| 3 | A | 2.3 | 2.6 | 0.2595 |
| 4 | A | 2.4 | 2.5 | 0.2230 |
| 5 | B | 2.1 | 2.7 | 0.2435 |
| 6 | B | 2.2 | 2.8 | 0.2590 |
| 7 | B | 2.3 | 2.5 | 0.2220 |
| 8 | B | 2.4 | 2.6 | 0.2530 |
| 9 | C | 2.1 | 2.6 | 0.2635 |
| 10 | C | 2.2 | 2.5 | 0.2540 |
| 11 | C | 2.3 | 2.8 | 0.2131 |
| 12 | C | 2.4 | 2.7 | 0.2330 |
| 13 | D | 2.1 | 2.5 | 0.2377 |
| 14 | D | 2.2 | 2.6 | 0.2234 |
| 15 | D | 2.3 | 2.7 | 0.1996 |
| 16 | D | 2.4 | 2.8 | 0.2633 |
Disclaimer/Publisher’s Note: The statements, opinions and data contained in all publications are solely those of the individual author(s) and contributor(s) and not of MDPI and/or the editor(s). MDPI and/or the editor(s) disclaim responsibility for any injury to people or property resulting from any ideas, methods, instructions or products referred to in the content. |
© 2024 by the authors. Licensee MDPI, Basel, Switzerland. This article is an open access article distributed under the terms and conditions of the Creative Commons Attribution (CC BY) license (https://creativecommons.org/licenses/by/4.0/).
Share and Cite
Cheng, M.; Kong, B.; Song, C.; Li, Y.; Shi, H. Optimization of Cabin Virus Transmission Suppression Technology Based on Hanging Curtain Physical Isolation. Appl. Sci. 2024, 14, 2948. https://doi.org/10.3390/app14072948
Cheng M, Kong B, Song C, Li Y, Shi H. Optimization of Cabin Virus Transmission Suppression Technology Based on Hanging Curtain Physical Isolation. Applied Sciences. 2024; 14(7):2948. https://doi.org/10.3390/app14072948
Chicago/Turabian StyleCheng, Mengmeng, Benben Kong, Caiyue Song, Yu Li, and Hong Shi. 2024. "Optimization of Cabin Virus Transmission Suppression Technology Based on Hanging Curtain Physical Isolation" Applied Sciences 14, no. 7: 2948. https://doi.org/10.3390/app14072948
APA StyleCheng, M., Kong, B., Song, C., Li, Y., & Shi, H. (2024). Optimization of Cabin Virus Transmission Suppression Technology Based on Hanging Curtain Physical Isolation. Applied Sciences, 14(7), 2948. https://doi.org/10.3390/app14072948