
Investigating the Effects of Environmentally Friendly Additives on the Exhaust Gas Composition and Fuel Consumption of an Internal Combustion Engine


Abstract
1. Introduction
2. Materials and Methods
2.1. Materials Used in the Research
- −
- Agriculture for soil fertilization, animal husbandry and in the processing of organic waste;
- −
- Environmental protection, including water treatment processes and treatment of domestic, municipal and industrial wastewater, as well as for treatment of contaminated water reservoirs;
- −
- Other industries.

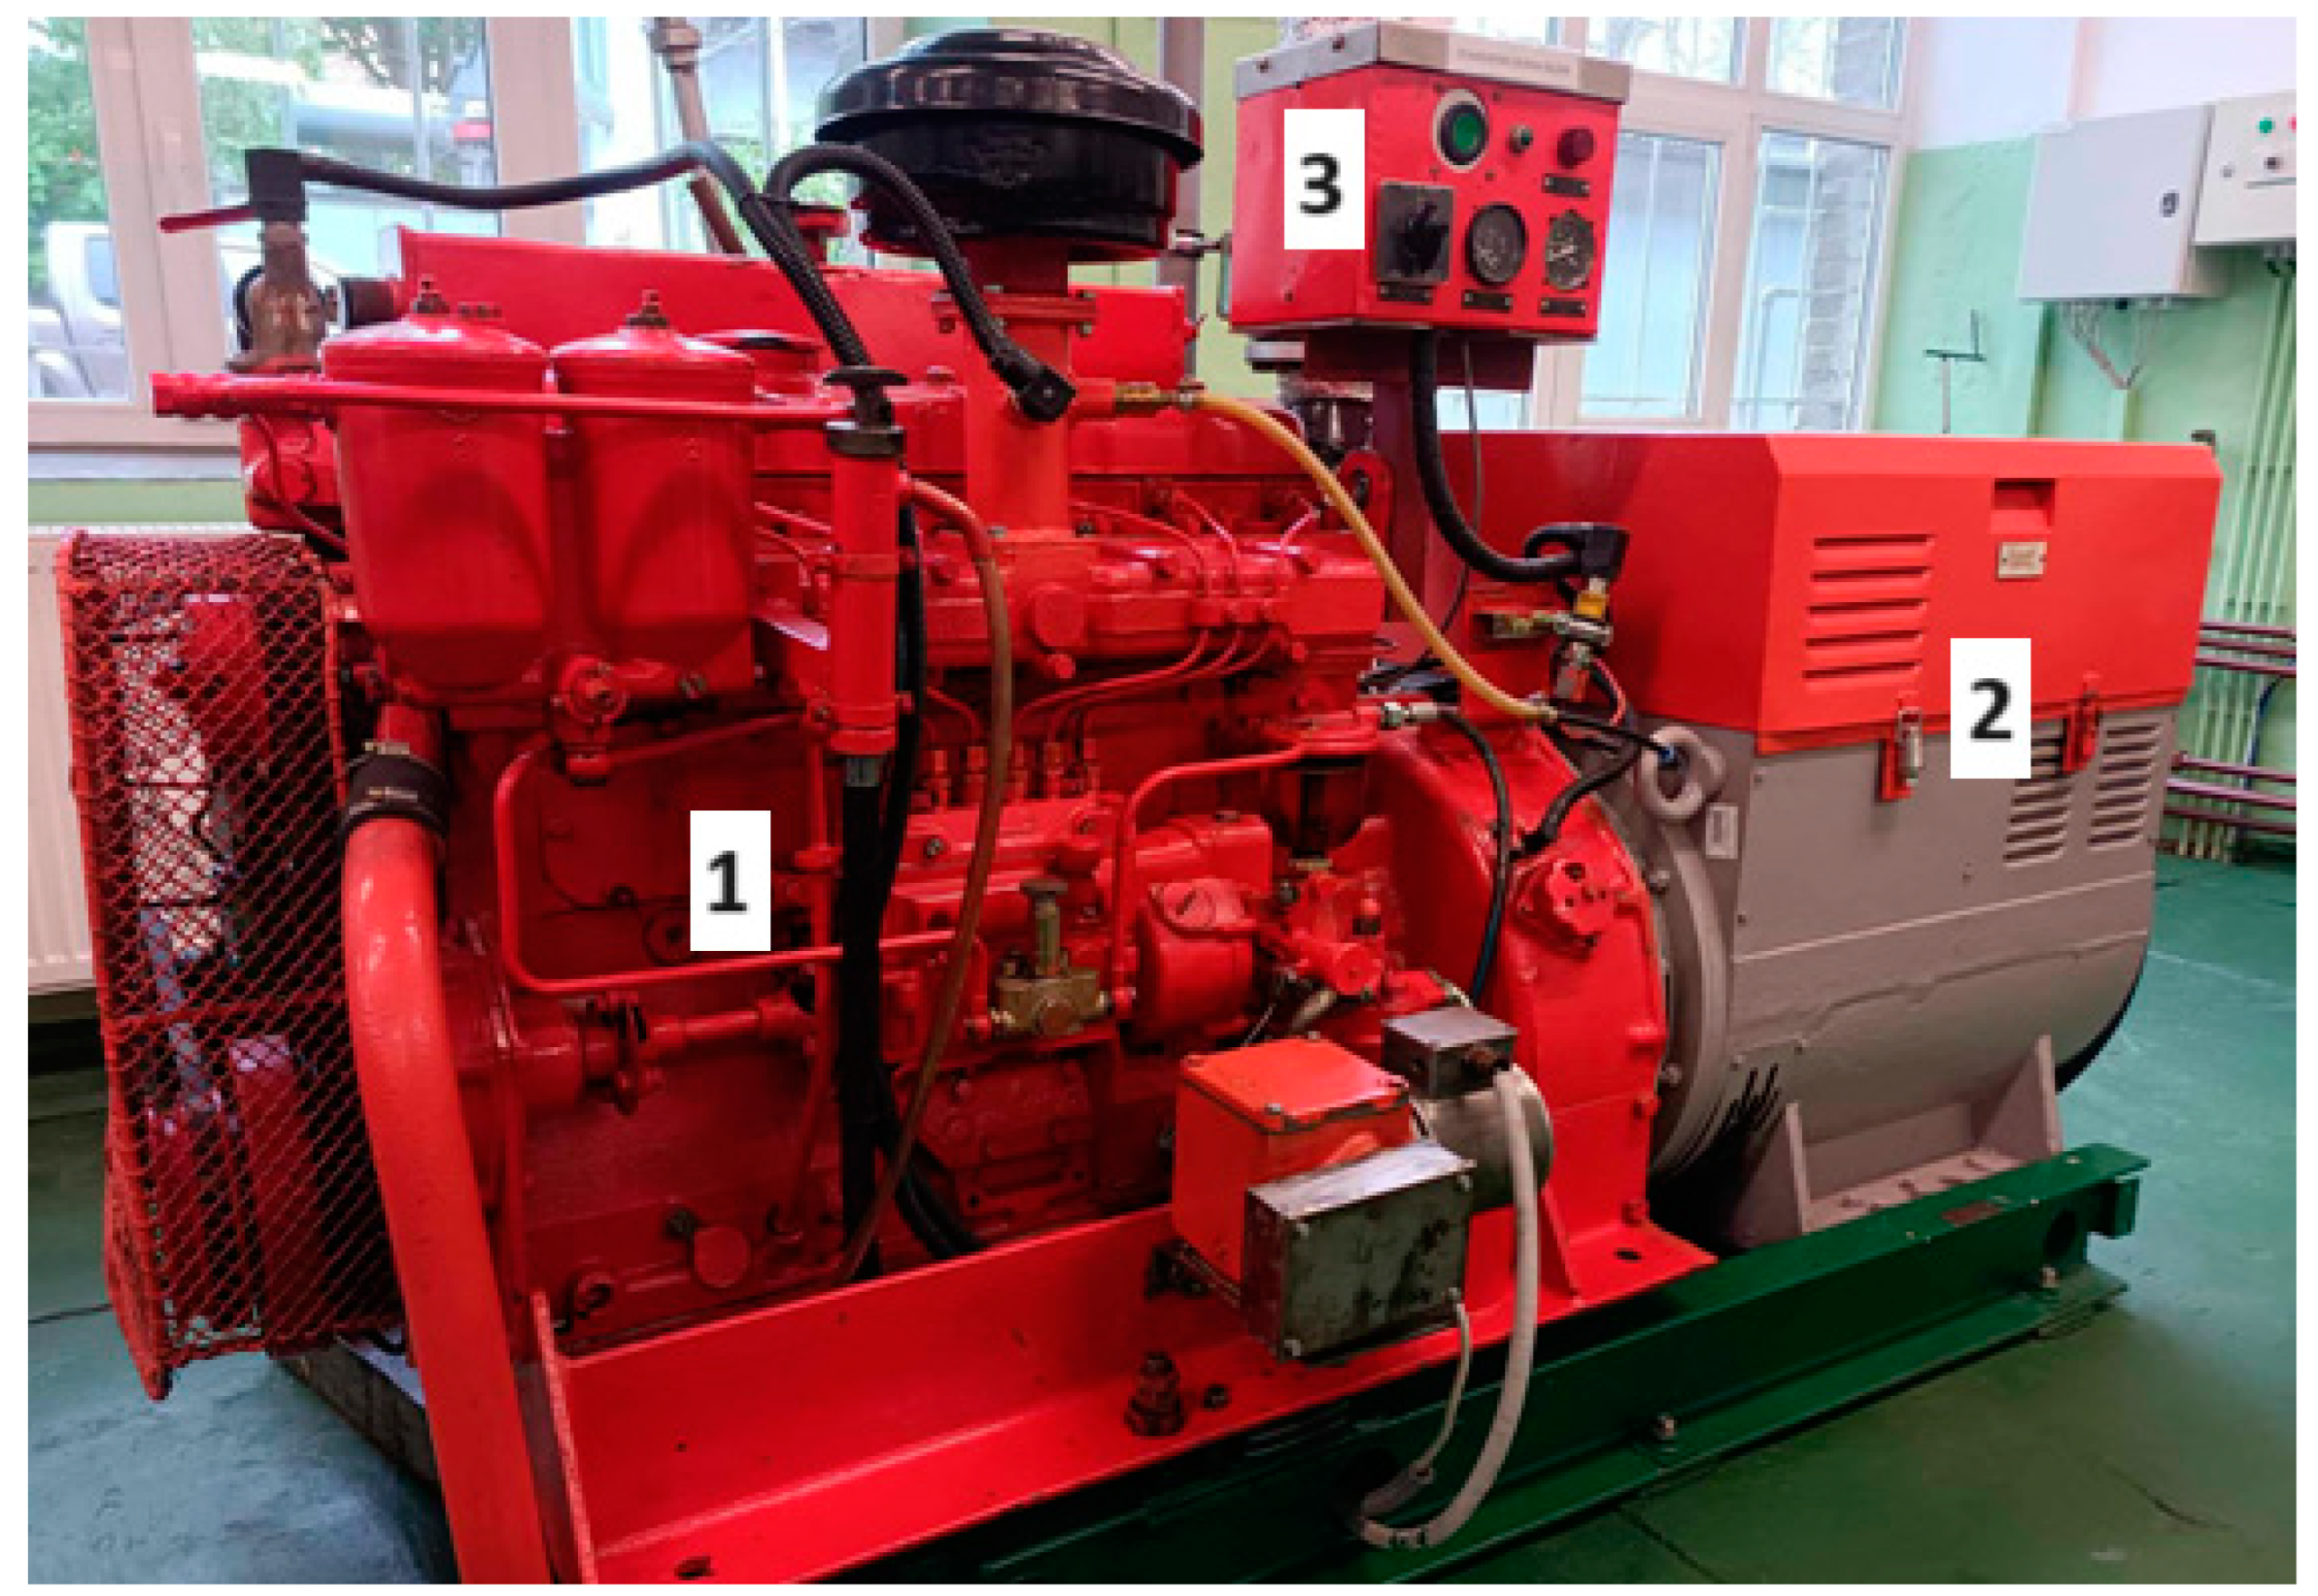
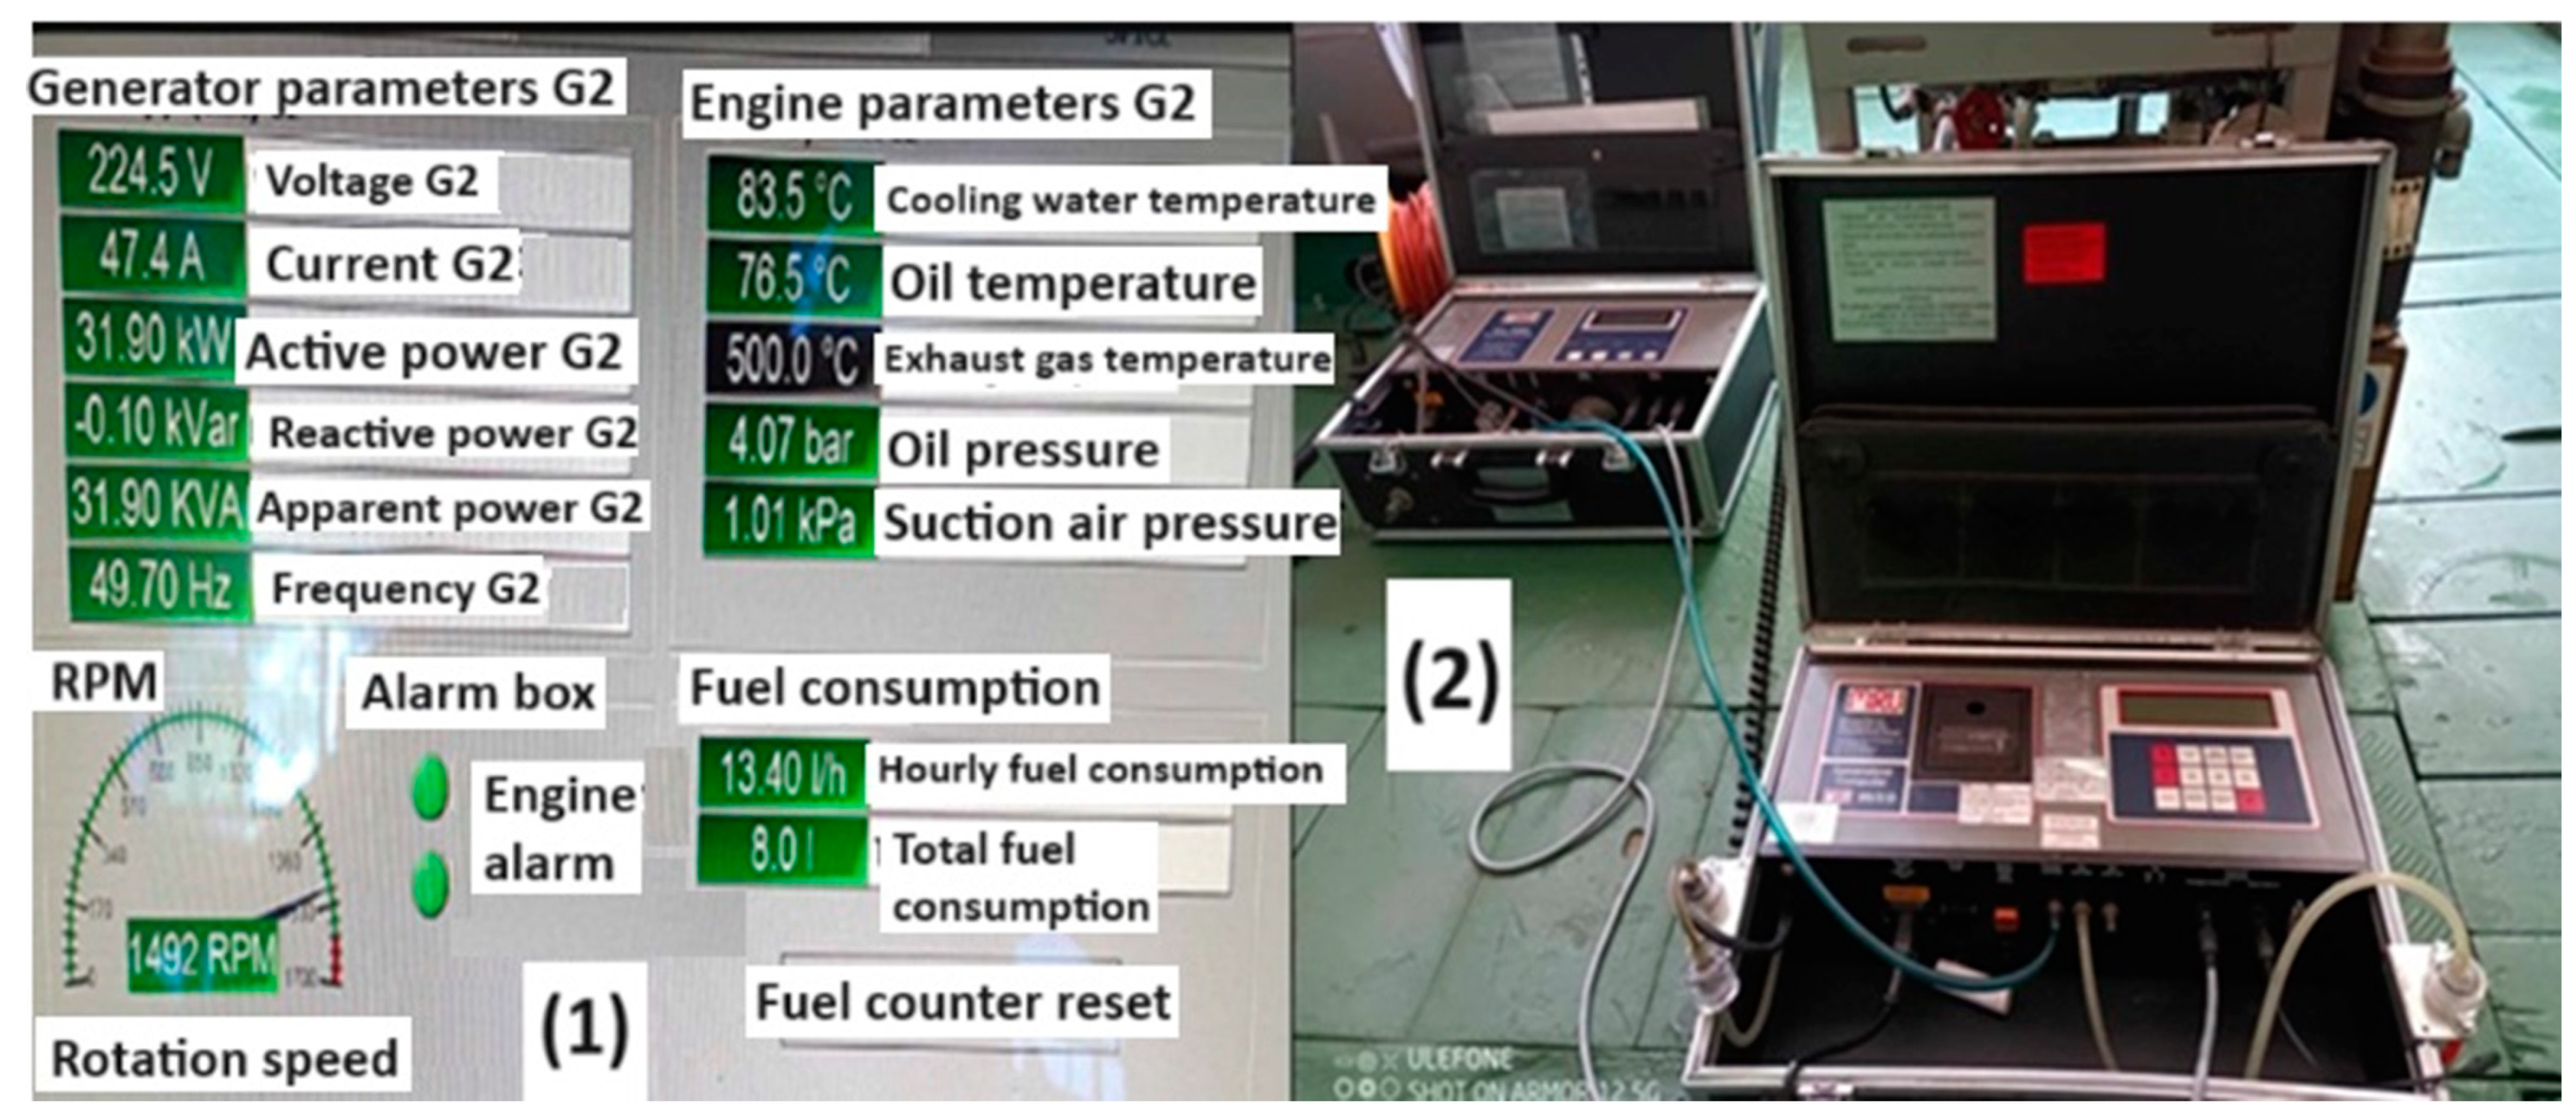
2.2. The Research Stand
3. Results
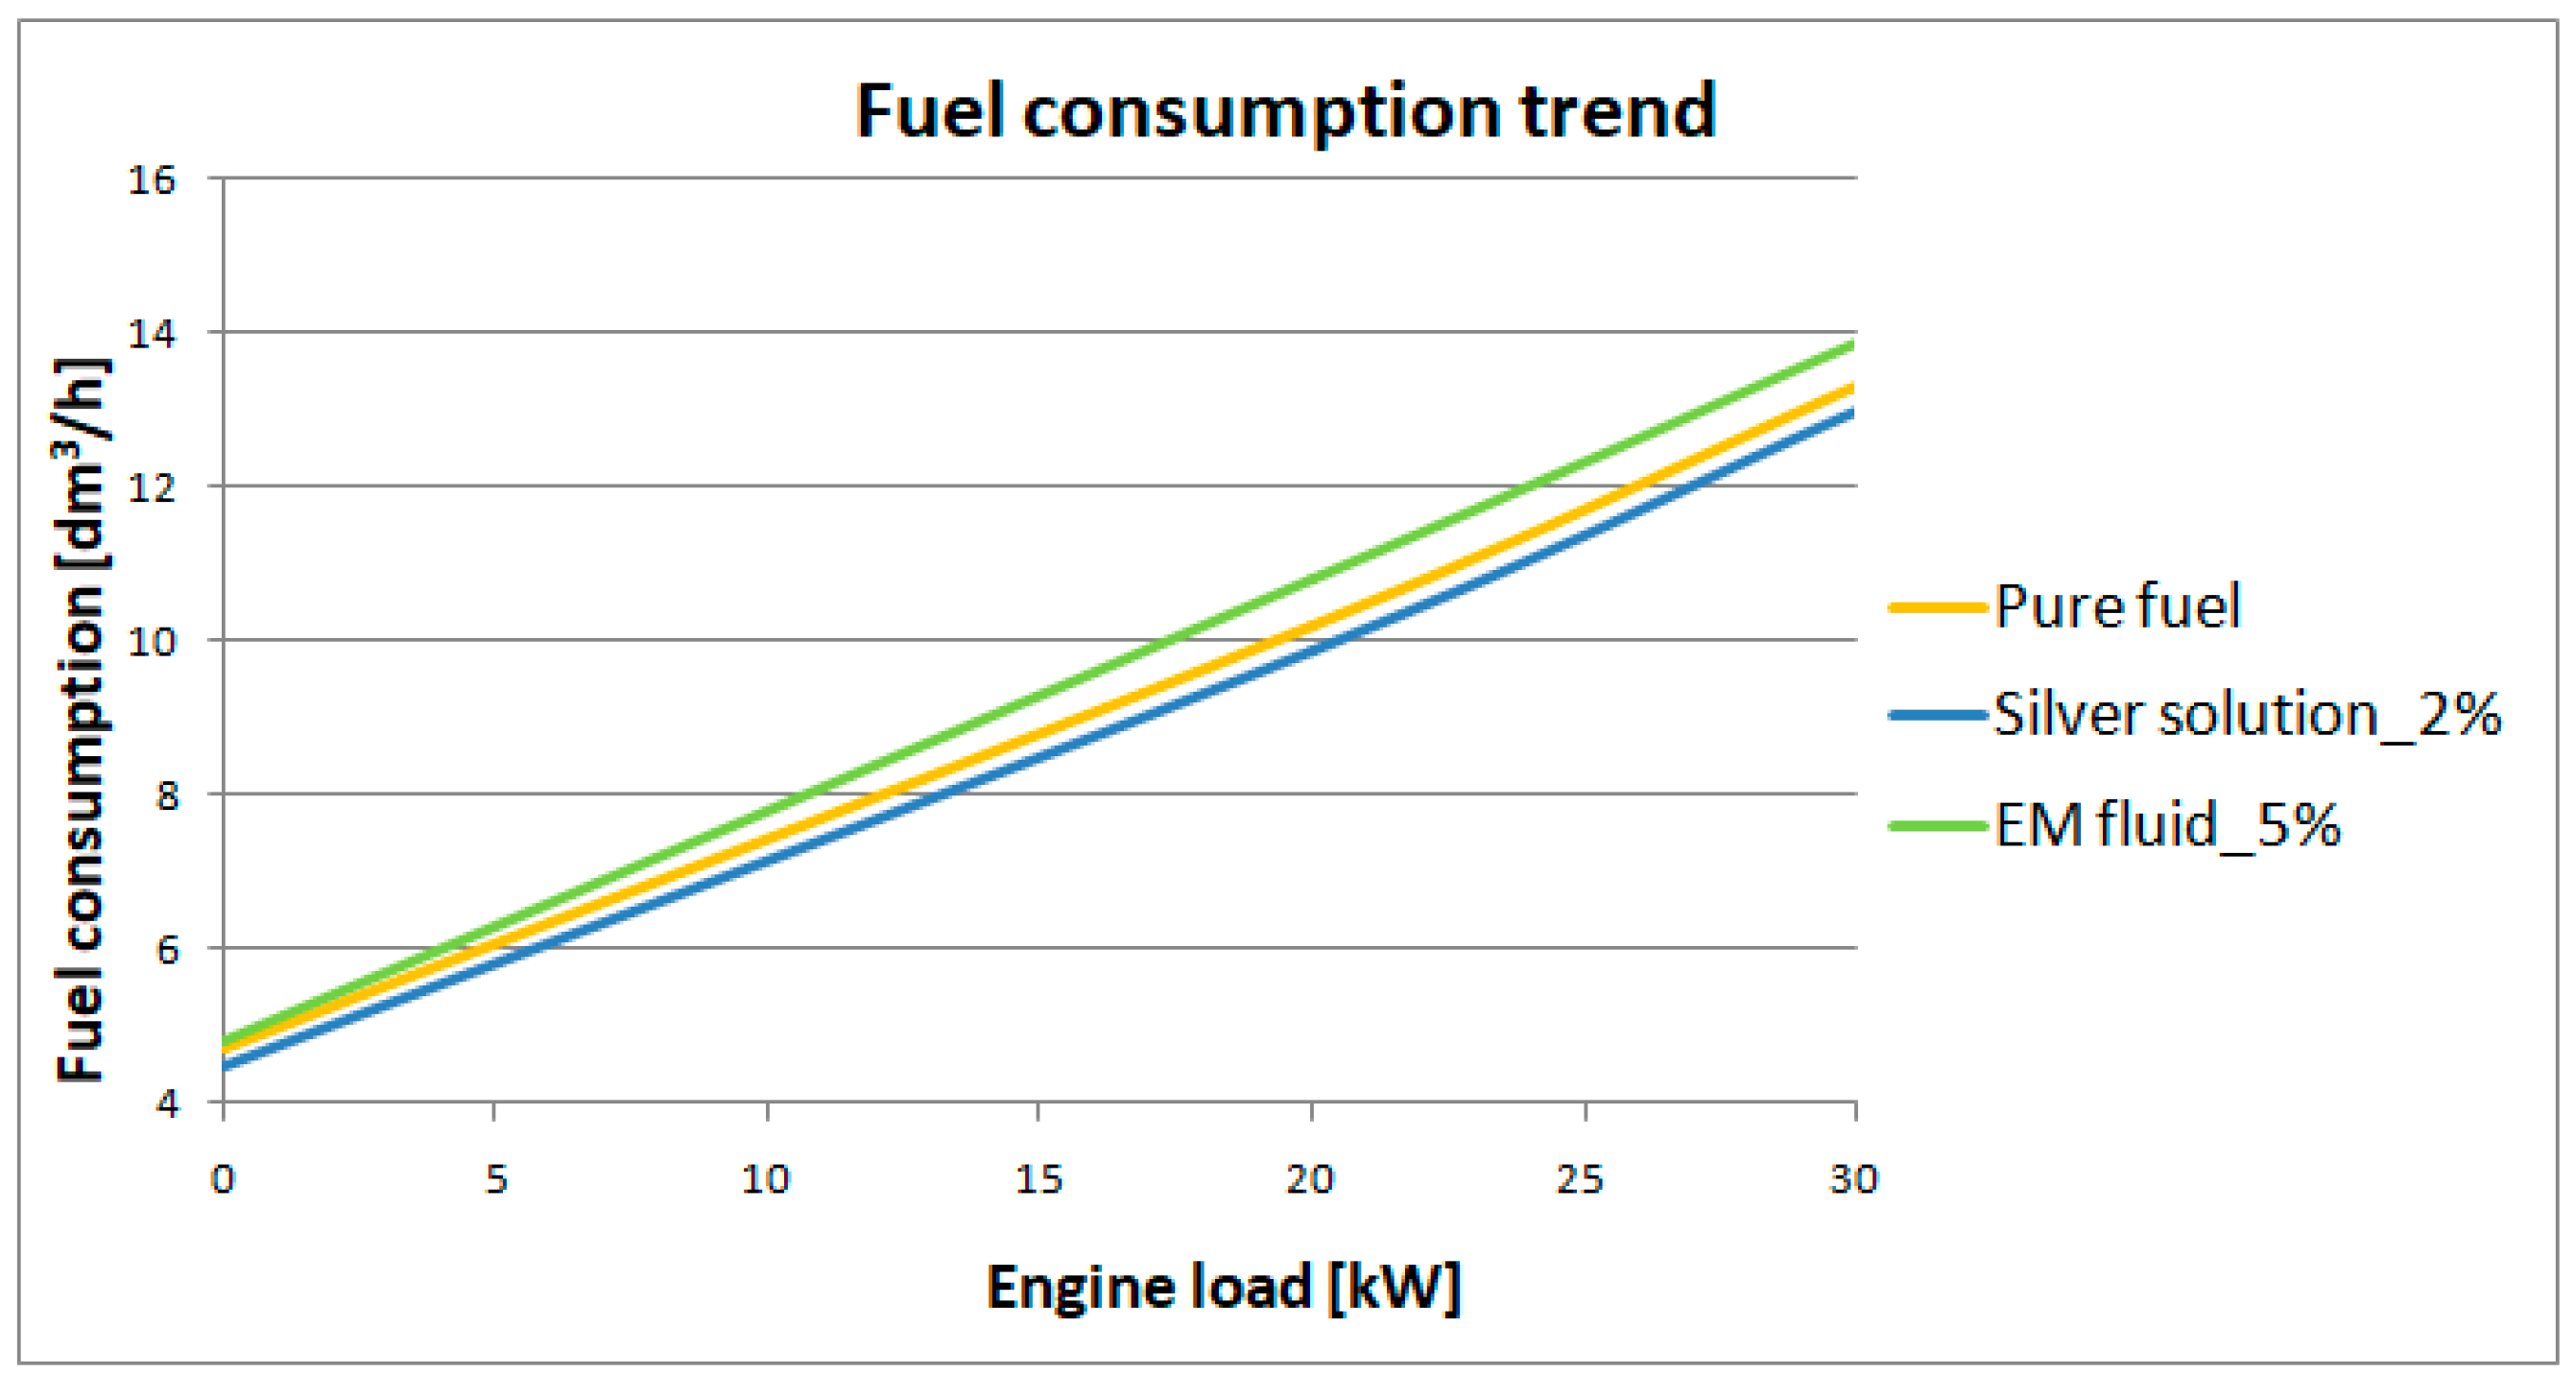
3.1. Testing of Hourly Fuel Consumption
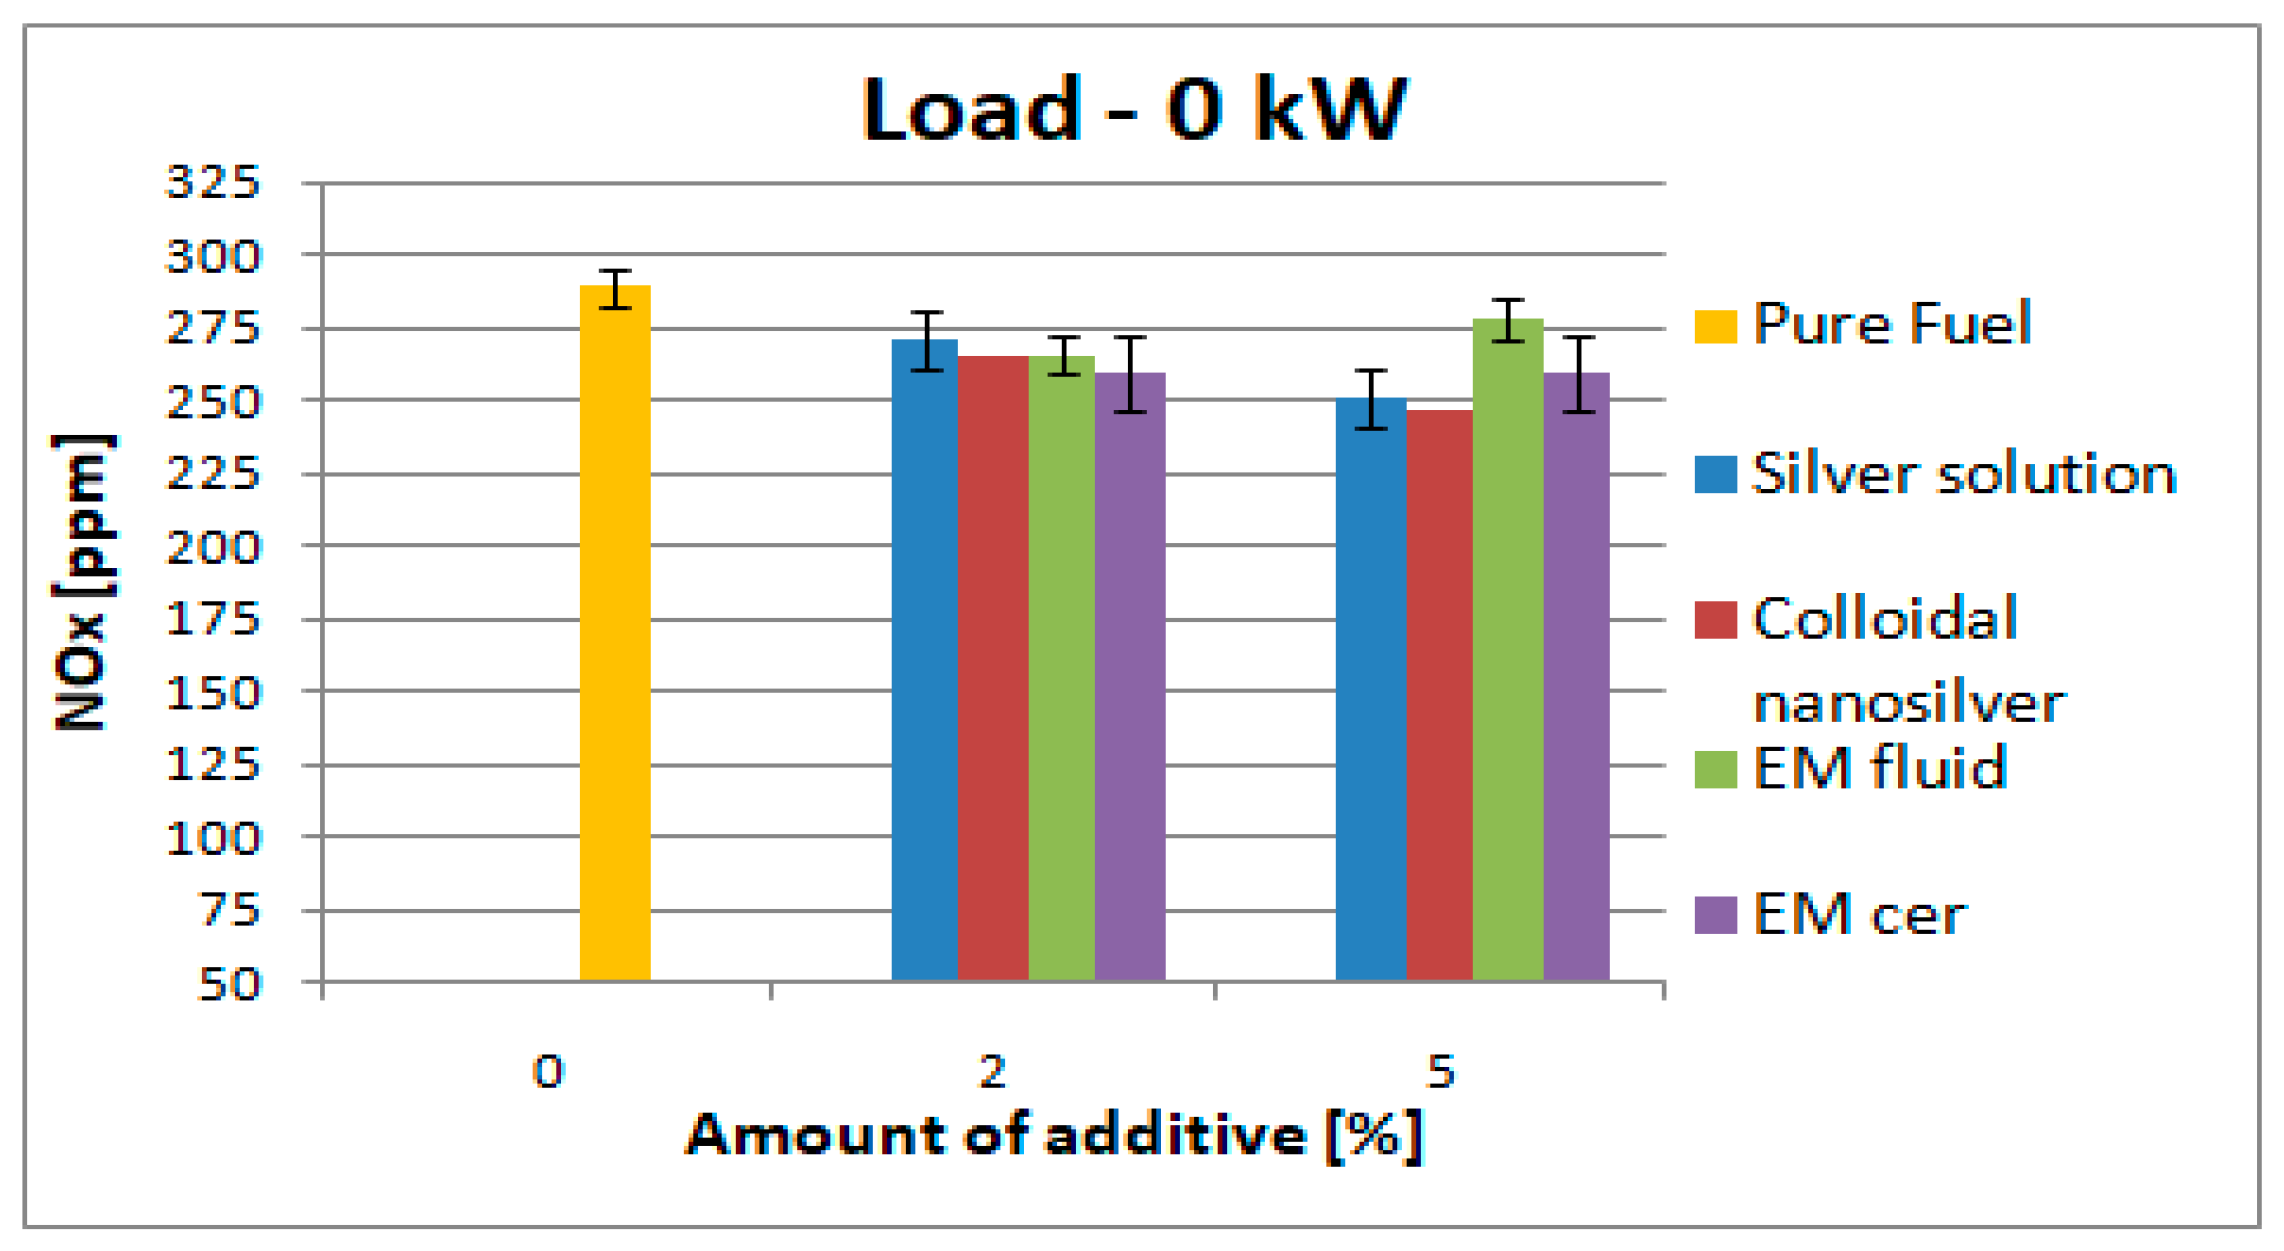
3.2. Testing the Composition of the Exhaust Gas
3.3. A Summary of the Result Analysis
4. Conclusions
Author Contributions
Funding
Data Availability Statement
Conflicts of Interest
Nomenclature
| ACE | Automatic Error Compensation |
| ACF | Activated Carbon Fiber |
| DNA | Deoxyribonucleic Acid |
| EM | Effective Microorganisms |
| HTHS | High Temperature High Shear Rate |
| HFO | Heavy Fuel Oil |
| MDO | Marine Diesel Oil |
| SAE | Society of Automotive Engineers |
| SS | Silver solution |
| CN | Colloidal nanosilver |
References
- Franchini, M.; Mannucci, P.M. Impact on human health of climate changes. Eur. J. Intern. Med. 2015, 26, 1–5. [Google Scholar] [CrossRef] [PubMed]
- Serrano, J.R.; Novella, R.; Piqueras, P. Why the Development of Internal Combustion Engines Is Still Necessary to Fight against Global Climate Change from the Perspective of Transportation. Appl. Sci. 2019, 9, 4597. [Google Scholar] [CrossRef]
- Messagie, M. Life Cycle Analysis of the Climate Impact of Electric Vehicles. Transport & Environment. 2017. Available online: https://www.transportenvironment.org/wp-content/uploads/2021/07/TE%20-%20draft%20report%20v04.pdf (accessed on 31 October 2023).
- Wan, Z.; Makhloufi, A.; Chen, Y.; Tang, J. Decarbonizing the international shipping industry: Solutions and policy recommendations. Mar. Pollut. Bull. 2018, 126, 428–435. [Google Scholar] [CrossRef] [PubMed]
- Grigoriadis, A.; Mamarikas, S.; Ioannidis, I.; Majamäki, E.; Jalkanen, J.-P.; Ntziachristos, L. Development of exhaust emission factors for vessels: A review and meta-analysis of available data. Atmos. Environ. X 2021, 12, 100142. [Google Scholar] [CrossRef]
- Agrawal, H.; Welch, W.A.; Henningsen, S.; Miller, J.W.; Cocker, D.R., III. Emissions from main propulsion engine on container ship at sea. J. Geophys. Res. Atmos. 2010, 115, D23205. [Google Scholar] [CrossRef]
- Hoang, A.T.; Pandey, A.; De Osés, F.J.M.; Chen, W.-H.; Said, Z.; Ng, K.H.; Ağbulut, Ü.; Tarełko, W.; Ölçer, A.I.; Nguyen, X.P. Technological solutions for boosting hydrogen role in decarbonization strategies and net-zero goals of world shipping: Challenges and perspectives. Renew. Sustain. Energy Rev. 2023, 188, 13790. [Google Scholar] [CrossRef]
- Cooper, D.A. Exhaust emissions from ships at berth. Atmos. Environ. 2003, 37, 3817–3830. [Google Scholar] [CrossRef]
- Shi, W.; Grimmelius, H.; Stapersma, D. Analysis of ship propulsion system behaviour and the impact on fuel consumption. Int. Shipbuild. Prog. 2010, 57, 35–64. [Google Scholar] [CrossRef]
- Linzenich, A.; Arning, K.; Bongartz, D.; Mitsos, A.; Ziefle, M. What fuels the adoption of alternative fuels? Examining preferences of German car drivers for fuel innovations. Appl. Energy 2019, 249, 222–236. [Google Scholar] [CrossRef]
- Rudolph, C. How may incentives for electric cars affect purchase decisions? Transp. Policy 2016, 52, 113–120. [Google Scholar] [CrossRef]
- Krmek, I.; Mrzljak, V.; Poljak, I. Analysis and Comparison of Ship Propulsion Systems. J. Marit. Transp. Sci. 2022, 62, 75–95. [Google Scholar] [CrossRef]
- Meng, L.; Liu, K.; He, J.; Han, C.; Liu, P. Carbon emission reduction behavior strategies in the shipping industry under government regulation: A tripartite evolutionary game analysis. J. Clean. Prod. 2022, 378, 134556. [Google Scholar] [CrossRef]
- Jalkanen, J.P.; Brink, A.; Kalli, J.; Pettersson, H.; Kukkonen, J.; Stipa, T. A modelling system for the exhaust emissions of marine traffic and its application in the Baltic Sea area. Atmos. Chem. Phys. 2009, 9, 9209–9223. [Google Scholar] [CrossRef]
- Khan, M.Y.; Giordano, M.; Gutierrez, J.; Welch, W.A.; Asa-Awuku, A.; Miller, J.W.; Cocker, D.R., III. Benefits of two mitigation strategies for container vessels: Cleaner engines and cleaner fuels. Environ. Sci. Technol. 2012, 46, 5049–5056. Available online: https://escholarship.org/content/qt6840g3pk/qt6840g3pk_noSplash_a7e945e3aeb8c250a93e5370d28bb4f6.pdf (accessed on 31 October 2023). [CrossRef]
- Khurmy, A.M.; Harbi, A.A.; Jameel, A.G.A.; Ahmad, N.; Ahmed, U. Conversion of Vacuum Residue from Refinery Waste to Cleaner Fuel: Technical and Economic Assessment. Sustainability 2023, 15, 15362. [Google Scholar] [CrossRef]
- Moldanová, J.; Fridell, E.; Popovicheva, O.; Demirdjian, B.; Tishkova, V.; Faccinetto, A.; Focsa, C. Characterisation of particulate matter and gaseous emissions from a large ship diesel engine. Atmos. Environ. 2009, 43, 2632–2641. [Google Scholar] [CrossRef]
- Teixeira, A.C.R.; Machado, P.G.; Borges, R.R.; Brito, T.L.F.; dos Santos, E.M.; Mouette, D. The use of liquefied natural gas as an alternative fuel in freight transport—Evidence from a driver’s point of view. Energy Policy 2021, 149, 112106. [Google Scholar] [CrossRef]
- Hao, H.; Liu, Z.; Zhao, F.; Li, W. Natural gas as vehicle fuel in China: A review. Renew. Sustain. Energy Rev. 2016, 62, 521–533. [Google Scholar] [CrossRef]
- Liu, Y.; Zhang, R.; Wang, J.; Wang, Y.; Lv, G.; Yang, H.; Chen, H.; Li, T.; Hao, B.; Guo, J. Soot particles formed by n-heptane and n-heptane/oxymethylene ether-3 in an inverse diffusion flame: A comparative analysis of chemical features. Fuel 2024, 366, 131422. [Google Scholar] [CrossRef]
- Ferraro, F.; Carmela Russo, C.; Schmitz, R.; Hasse, C.; Sirignano, M. Experimental and numerical study on the effect of oxymethylene ether-3 (OME3) on soot particle formation. Fuel 2021, 286, 119353. [Google Scholar] [CrossRef]
- Ruth, J.C.; Stephanopoulos, G. Synthetic fuels: What are they and where do they come from? Curr. Opin. Biotechnol. 2023, 81, 102919. [Google Scholar] [CrossRef] [PubMed]
- Ram, V.; Salkuti, S.R. An Overview of Major Synthetic Fuels. Energies 2023, 16, 2834. [Google Scholar] [CrossRef]
- Wilson, I.A.G.; Peter, S. Why Synthetic Fuels Are Necessary in Future Energy Systems. Front. Energy Res. 2017, 5, 19. [Google Scholar] [CrossRef]
- Tollefson, J. Hydrogen vehicles: Fuel of the future? Nature 2010, 464, 1262–1264. [Google Scholar] [CrossRef] [PubMed]
- Aminudin, M.A.; Kamarudin, S.K.; Lim, B.H.; Majilan, E.H.; Masdar, M.S.; Shaari, N. An overview: Current progress on hydrogen fuel cell vehicles. Int. J. Hydrogen Energy 2023, 48, 4371–4388. [Google Scholar] [CrossRef]
- Balcombe, P.; Brierley, J.; Lewis, C.; Skatvedt, L.; Speirs, J.; Hawkes, A.; Staffell, I. How to decarbonise international shipping: Options for fuels, technologies and policies. Energy Convers. Manag. 2019, 182, 72–88. [Google Scholar] [CrossRef]
- Eremeeva, A.M.; Ilyushin, Y.V. Automation of the control system for drying grain crops of the technological process for obtaining biodiesel fuels. Sci. Rep. 2023, 13, 14956. [Google Scholar] [CrossRef]
- Barciela, P.; Perez-Vazquez, A.; Fraga-Corral, M.; Prieto, M.A. Utility Aspects of Sugarcane Bagasse as a Feedstock for Bioethanol Production: Leading Role of Steam Explosion as a Pretreatment Technique. Processes 2023, 11, 3116. [Google Scholar] [CrossRef]
- Yusuf, A.A.; Inambao, F.L.; Ampah, J.D. Evaluation of biodiesel on speciated PM2.5, organic compound, ultrafine particle and gaseous emissions from a low-speed EPA Tier II marine diesel engine coupled with DPF, DEP and SCR filter at various loads. Energy 2022, 239 Pt A, 121837. [Google Scholar] [CrossRef]
- Yusuf, A.A.; Yusuf, D.A.; Jie, Z.; Bello, T.Y.; Tambaya, M.; Abdullahi, B.; Muhammed-Dabo, I.A.; Yahuza, I.; Dandakouta, H. Influence of waste oil-biodiesel on toxic pollutants from marine engine coupled with emission reduction measures at various loads. Atmos. Pollut. Res. 2022, 13, 101258. [Google Scholar] [CrossRef]
- Qasim, M.; Ansari, T.M.; Hussain, M. Emissions and performance characteristics of a diesel engine operated with fuel blends obtained from a mixture of pretreated waste engine oil and waste vegetable oil methyl esters. Environ. Prog. Sustain. Energy 2018, 37, 2148–2155. [Google Scholar] [CrossRef]
- Behcet, R.; Aydın, H.; İlkılıç, C.; İşcan, B.; Aydın, S. Diesel engine applications for evaluation of performance and emission behavior of biodiesel from different oil stocks. Environ. Prog. Sustain. Energy 2015, 34, 890–896. [Google Scholar] [CrossRef]
- Uyaroğlu, A.; Uyumaz, A.; Çelikten, I. Comparison of the combustion, performance, and emission characteristics of inedible Crambeabyssinica biodiesel and edible hazelnut, corn, soybean, sunflower, and canola biodiesels. Environ. Prog. Sustain. Energy 2018, 37, 1438–1447. [Google Scholar] [CrossRef]
- Wang, Z.; Sanusi, I.A.; Wang, J.; Ye, X.; Kana, E.B.G.; Olaniran, A.O.; Shao, H. Developments and Prospects of Farmland Application of Biogas Slurry in China—A Review. Microorganisms 2023, 11, 2675. [Google Scholar] [CrossRef] [PubMed]
- Bembenek, M.; Karwat, B.; Melnyk, V.; Mosora, Y. Research on the Impact of Supplying the Air-Cooled D21A1 Engine with RME B100 Biodiesel on Its Operating Parameters. Energies 2023, 16, 6430. [Google Scholar] [CrossRef]
- Temizer, I. The combustion analysıs and wear effect of biodiesel fuel used in a diesel engine. Fuel 2020, 270, 117571. [Google Scholar] [CrossRef]
- Agarwal, A.K. Biofuels (alcohols and biodiesel) applications as fuels for internal combustion engines. Prog. Energy Combust. Sci. 2007, 33, 233–271. [Google Scholar] [CrossRef]
- Kolasa-Więcek, A. Will effective microorganisms revolutionize the world? Adv. Food Process. Technol. 2010, 1, 66–69. (In Polish) [Google Scholar]
- Kim, J.S.; Kuk, E.; Yu, K.N.; Kim, J.H.; Park, S.J.; Lee, H.J.; Kim, S.H.; Park, Y.K.; Park, Y.H.; Hwang, C.Y.; et al. Antimicrobial effects of silver nanoparticles. Nanomed. Nanotechnol. Biol. Med. 2007, 3, 95–101. Available online: https://www.sciencedirect.com/science/article/pii/S1549963406003467?casa_token=J6KTF9cUdVIAAAAA:xFmuaoDImoQCz6K3_fJyRoRWNKrLKwo8paA-s2seeKTkHO1I33Ah2nXcHHK_TCot3a3SzW526iCO (accessed on 31 October 2023). [CrossRef]
- Ammar, A.; Asad, N.S.; Ali, A.; Ghulam, M.U.; Muhammad, S.A.; Sohaib, H.; Haseeb, A.; Touqeer, A. Environment-friendly novel fuel additives: Investigation of the effects of graphite nanoparticles on performance and regulated gaseous emissions of CI engine. Energy Convers. Manag. 2020, 211, 112748. [Google Scholar] [CrossRef]
- Shukla, K.; Srivastava, V.C. Diethyl carbonate: Critical review of synthesis routes, catalysts used and engineering aspects. R. Soc. Chem. 2016, 6, 32624–32645. [Google Scholar] [CrossRef]
- Bor-Yih, Y.; Pei-Jhen, W.; Chang-Che, T.; Shiang-Tai, L. Evaluating the direct CO2 to diethyl carbonate (DEC) process: Rigorous simulation, techno-economical and environmental evaluation. J. CO2 Util. 2020, 41, 101254. [Google Scholar] [CrossRef]
- Fuel Lotos. Available online: https://www.lotos.pl/321/p,187,c,92/dla_biznesu/paliwa_i_dodatki/oleje_napedowe/eurodiesel#tab-2 (accessed on 31 October 2023).
- Effective Microorganisms Technology. Available online: https://www.aptekarzpolski.pl/2015/01/01-2015-technologia-efektywnych-mikroorganizmow/ (accessed on 31 October 2023). (In Polish).
- Schicht, M.L. To understand EM. Emecho 2008, 8, 3. (In Polish) [Google Scholar]
- Effective Microorganisms Ceramics. Available online: https://www.agriton.co.uk/shop/p/35mm-ceramic-pipes-with-effective-microorganisms-em (accessed on 31 October 2023).
- Antimicrobial-Silver. Available online: https://cen.acs.org/articles/93/web/2015/07/Antimicrobial-Silver-Nanoparticles-Strengthen-Bacterial.html (accessed on 31 October 2023).
- Mirzajani, F.; Ghassempour, A.; Aliahmadi, A.; Esmaeili, M.A. Antibacterial effect of silver nanoparticles on Staphylococcus aureus. Res. Microbiol. 2011, 162, 542–549. [Google Scholar] [CrossRef] [PubMed]
- Colloidal Nanosilver. Available online: https://auraherbals.pl/blog/srebro-koloidalne-jak-wybrac-prawdziwe-i-nie-dac-sie-oszukac/ (accessed on 31 October 2023).
- Engine Leyland SW 680/1. Available online: https://www.railcar.co.uk/technology/engines/leyland-680 (accessed on 31 October 2023).
- Hountalas, D.T.; Mavropoulos, G.; Zannis, T.; Mamalis, S. Use of Water Emulsion and Intake Water Injection as NOx Reduction Trchniques for Heavy Duty Diesel Engines; Society of Automotive Engineers (SAE Technical Paper); SAE: Detroit, MI, USA, 2006. [Google Scholar]
- Pariotis, E.G.; Zannis, T.C.; Hountalas, D.T.; Rakopoulos, C.D. Comparative Evaluation of Water-Fuel Emulsion and Engine Performance and Pollutant Emissions. In Proceedings of the 3rd International Conference on Automotive Technology–ICAT, Istanbul, Turkiye, 17–18 November 2006. [Google Scholar]
- Piaseczny, L.; Zadrąg, R. Study of the effect of water supply to the cylinder on the combustion and toxicity indicators of a compression-ignition engine. Combust. Engines 2005, 3, 61–67. [Google Scholar] [CrossRef]
- Klofutar, B.; Golob, J. Microorganisms in diesel and in biodiesel fuels. Acta Chim. Slov. 2007, 54, 744–748. [Google Scholar]
- Hill, T. Microbial growth in aviation fuels. Opinion paper. Aircr. Eng. Aerosp. Technol. 2003, 75, 5. [Google Scholar] [CrossRef]
- Heywood, J.B. Internal Combustion Engine Fundamentals; Series in Mechanical Engineering USA; McGraw-Hill Book Company: New York, NY, USA, 1988. [Google Scholar]
- Vollenweider, J. Exhaust Emission Control of Sulzer Marine Diesel Engines; New Sulzer Ltd.: Winthertur, Switzerland, 1996. [Google Scholar]
- Vieira, J. Emission from ships, time to decide. In Workshop on Ship Emissions; Europen Parliament: Strasburg, France, 2007. [Google Scholar]
- Holtbecker, R.; Geist, M. Emission Technology; Sulzer RTA Series; Wartsilia NSD: Helsinki, Finland, 1998. [Google Scholar]


| No. | Parameters | Value | Unit |
|---|---|---|---|
| 1 | Flash point | 62 | °C |
| 2 | Water content met. Karl Fisher | 51 | mg/kg |
| 3 | Solids content | 6 | mg/kg |
| 4 | Sulphur content | 9.4 | mg/kg |
| 5 | Cold filter blocking temperature | −15 | °C |
| 6 | Density at 15 °C | 0.8248 | g/cm3 |
| 7 | Kinematic viscosity at 40 °C | 2.588 | mm2/s |
| 8 | Cetane number | 55.4 | − |
| 9 | Lubricity (WSD) | 215 | μm |
| 10 | Fatty acid ester content | 6.8 | % [v/v] |
| Parameters | |
|---|---|
| Manufacturer | WSK Mielec/British Leyland |
| Type | SW 680/1 Delfin |
| Rated power (kW) | 147 |
| Cylinder number | 6 |
| Cylinder formation | Horizontal inline |
| Cylinder swept capacity (cm3) | 1850 |
| Rotational speed (rpm) | 1500 |
| Compression ratio | 15.8 |
| Fuel pump | Multi-element CAV |
| Injectors | CAV |
| Pump timing | 30 degrees BTDC |
| Injector pressure | 14.2/14.72 MPa |
| Operating oil pressure | 0.38/0.41 MPa |
| Additive Concentration [0%] | Operating Parameters | ||
|---|---|---|---|
| Load | 0 kW | Pure MDO | |
| 20 kW | |||
| 30 kW | |||
| Additive Concentration [2%] | |||
| Load | 0 kW | MDO + SS | |
| 20 kW | |||
| 30 kW | Cooling water temperature [°C] | ||
| 0 kW | MDO + CN | ||
| 20 kW | Oil temperature [°C] | ||
| 30 kW | |||
| 0 kW | MDO + EM fluid | Exhaust gas temperature [°C] | |
| 20 kW | |||
| 30 kW | Oil pressure [bar] | ||
| 0 kW | MDO + EM cer | ||
| 20 kW | Suction air pressure [kPa] | ||
| 30 kW | |||
| Additive Concentration [5%] | Instantaneous fuel consumption [dm3/h] | ||
| Load | 0 kW | MDO + SS | |
| 20 kW | NOx [ppm] | ||
| 30 kW | |||
| 0 kW | MDO + CN | CO [ppm] | |
| 20 kW | |||
| 30 kW | CO2 [%] | ||
| 0 kW | MDO + EM fluid | ||
| 20 kW | |||
| 30 kW | |||
| 0 kW | MDO + EM cer | ||
| 20 kW | |||
| 30 kW | |||
| Flash Point [°C] | Fuel Density [g/cm3] | Water Content [%] | Bacterial Content [cfu/1 dm3] | Fungal Content [cfu/1 dm3] | |
|---|---|---|---|---|---|
| Pure fuel | 60.3 | 0.8239 | 0.0066 | 1.1 × 10⁶ | 7.3 × 10³ |
| Fuel with silver solution | 62.2 | 0.8242 | 0.0145 | <1 × 10² | <1 × 10² |
| Fuel with colloidal nanosilver | 61.6 | 0.8241 | 0.0078 | <1 × 10² | 1.5 × 10² |
| Fuel with EM fluid | 60 | 0.8234 | 0.0109 | <1 × 10² | 1.0 × 10² |
| Fuel with EM cer | 61.3 | 0.8240 | 0.0113 | <1 × 10² | 1.0 × 10² |
| NOx [ppm] | CO [ppm] | |||||||||||
|---|---|---|---|---|---|---|---|---|---|---|---|---|
| Engine Load | Pure Oil | Additives | Concentration 2% | Concentration 5% | Pure Oil | Additives | Concentration 2% | Concentration 5% | ||||
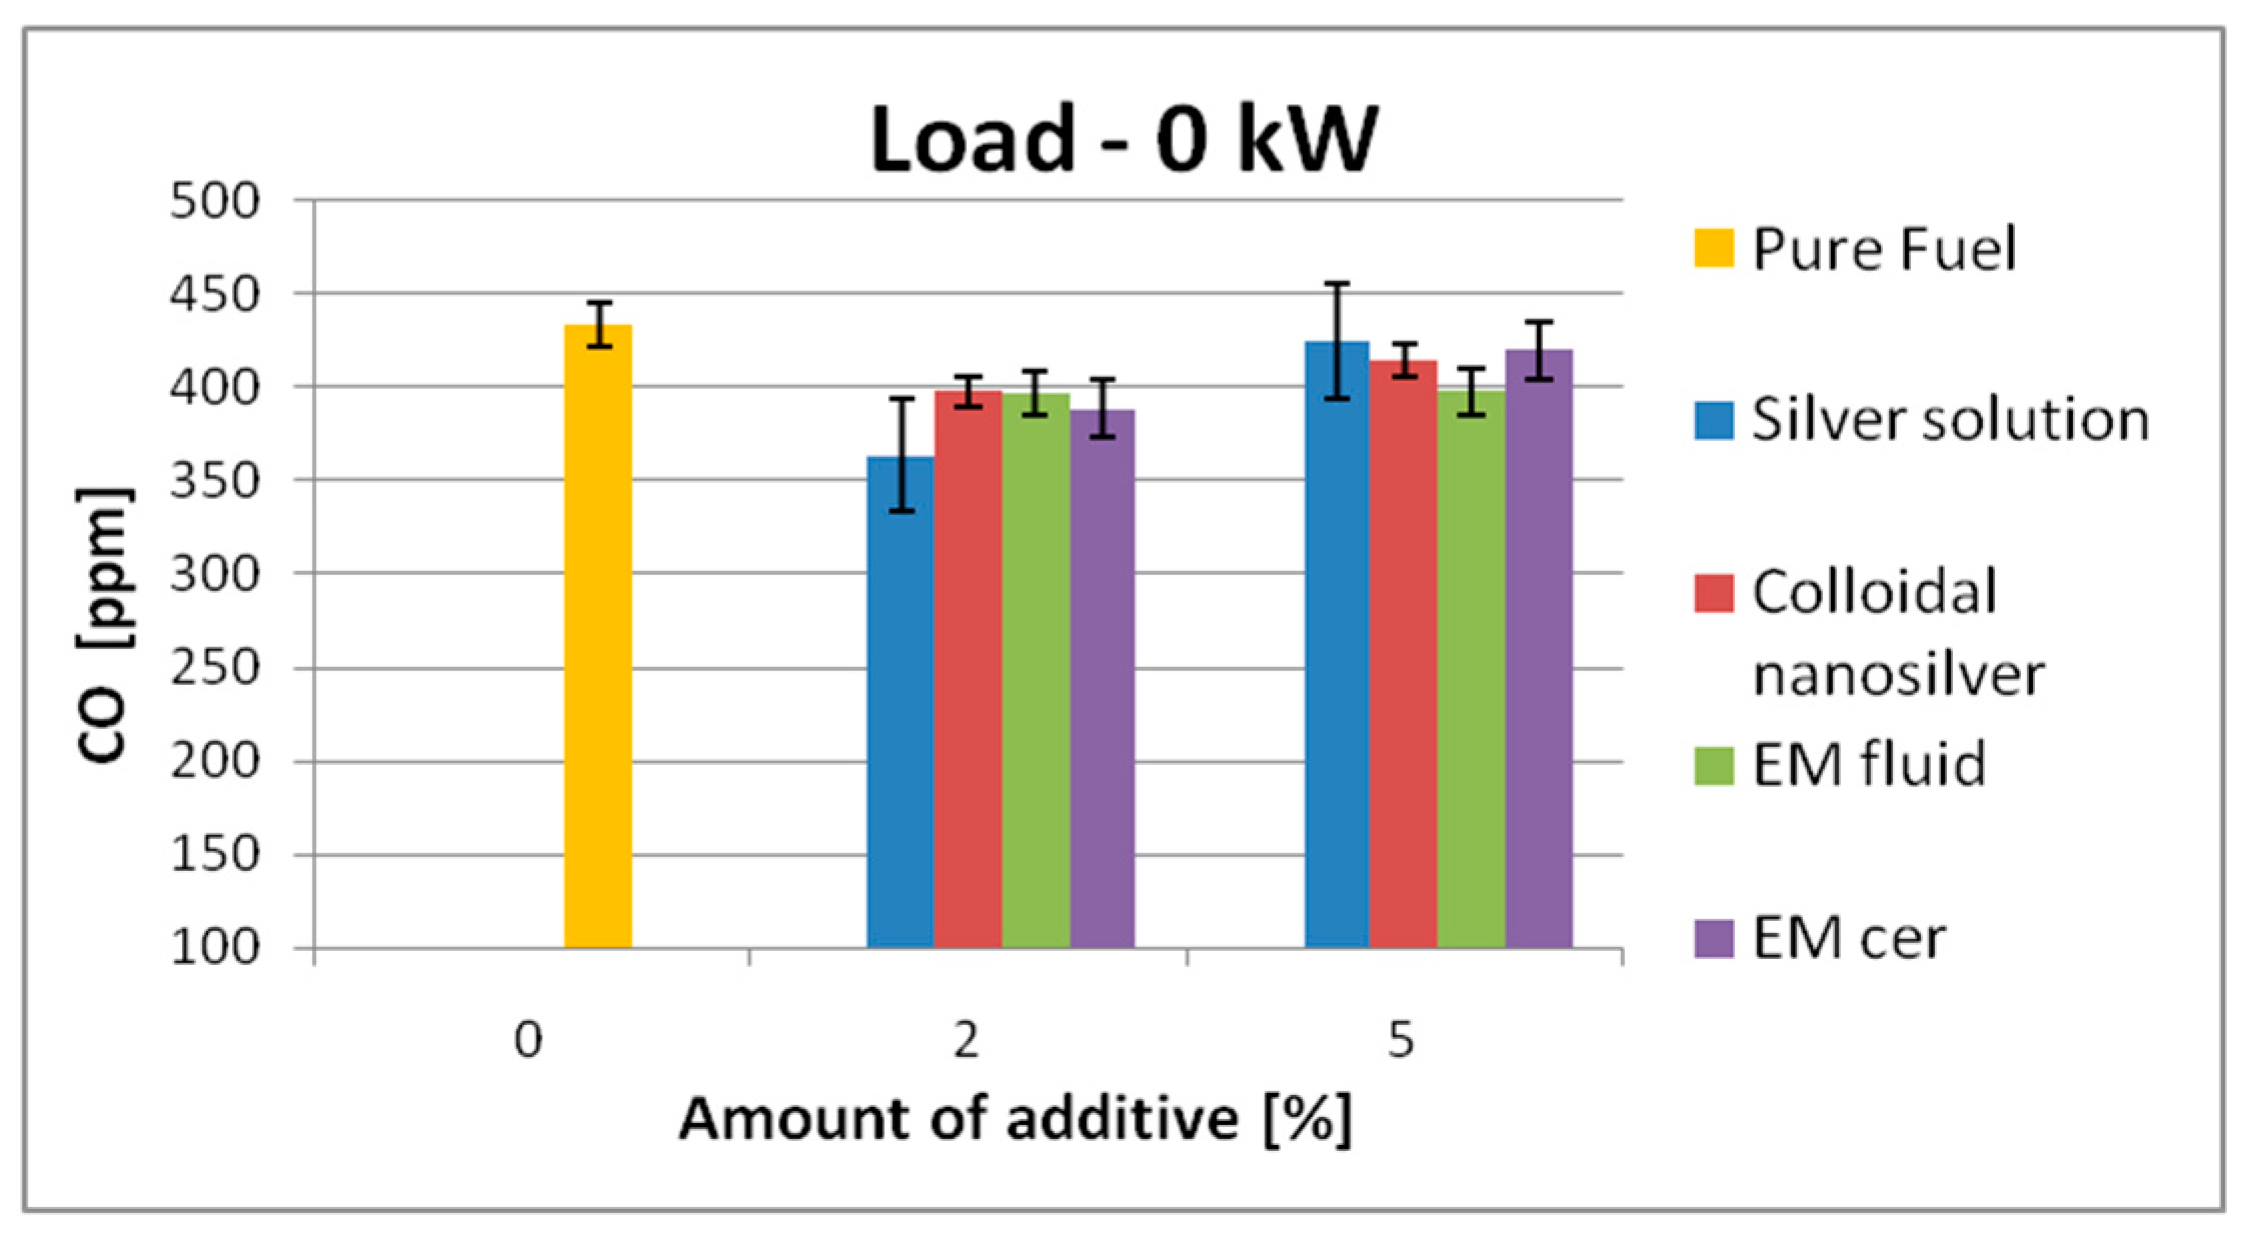
| 0 kW | 289 | SS | 271 | ↓6.2% | 251 | 13.2% | 434 | SS | 364 | ↓16.2% | 425 | ↓2.1% |
| CS | 266 | ↓8% | 247 | ↓14.6% | CS | 398 | ↓8.3% | 415 | ↓4.4% | |||
| EM_fl | 266 | ↓8% | 278 | ↓3.9% | EM_fl | 397 | ↓8.5% | 398 | ↓8.3% | |||
| EM_cer | 259 | ↓10.4% | 259 | ↓10.4% | EM_cer | 389 | ↓10.4% | 420 | ↓3.3% | |||
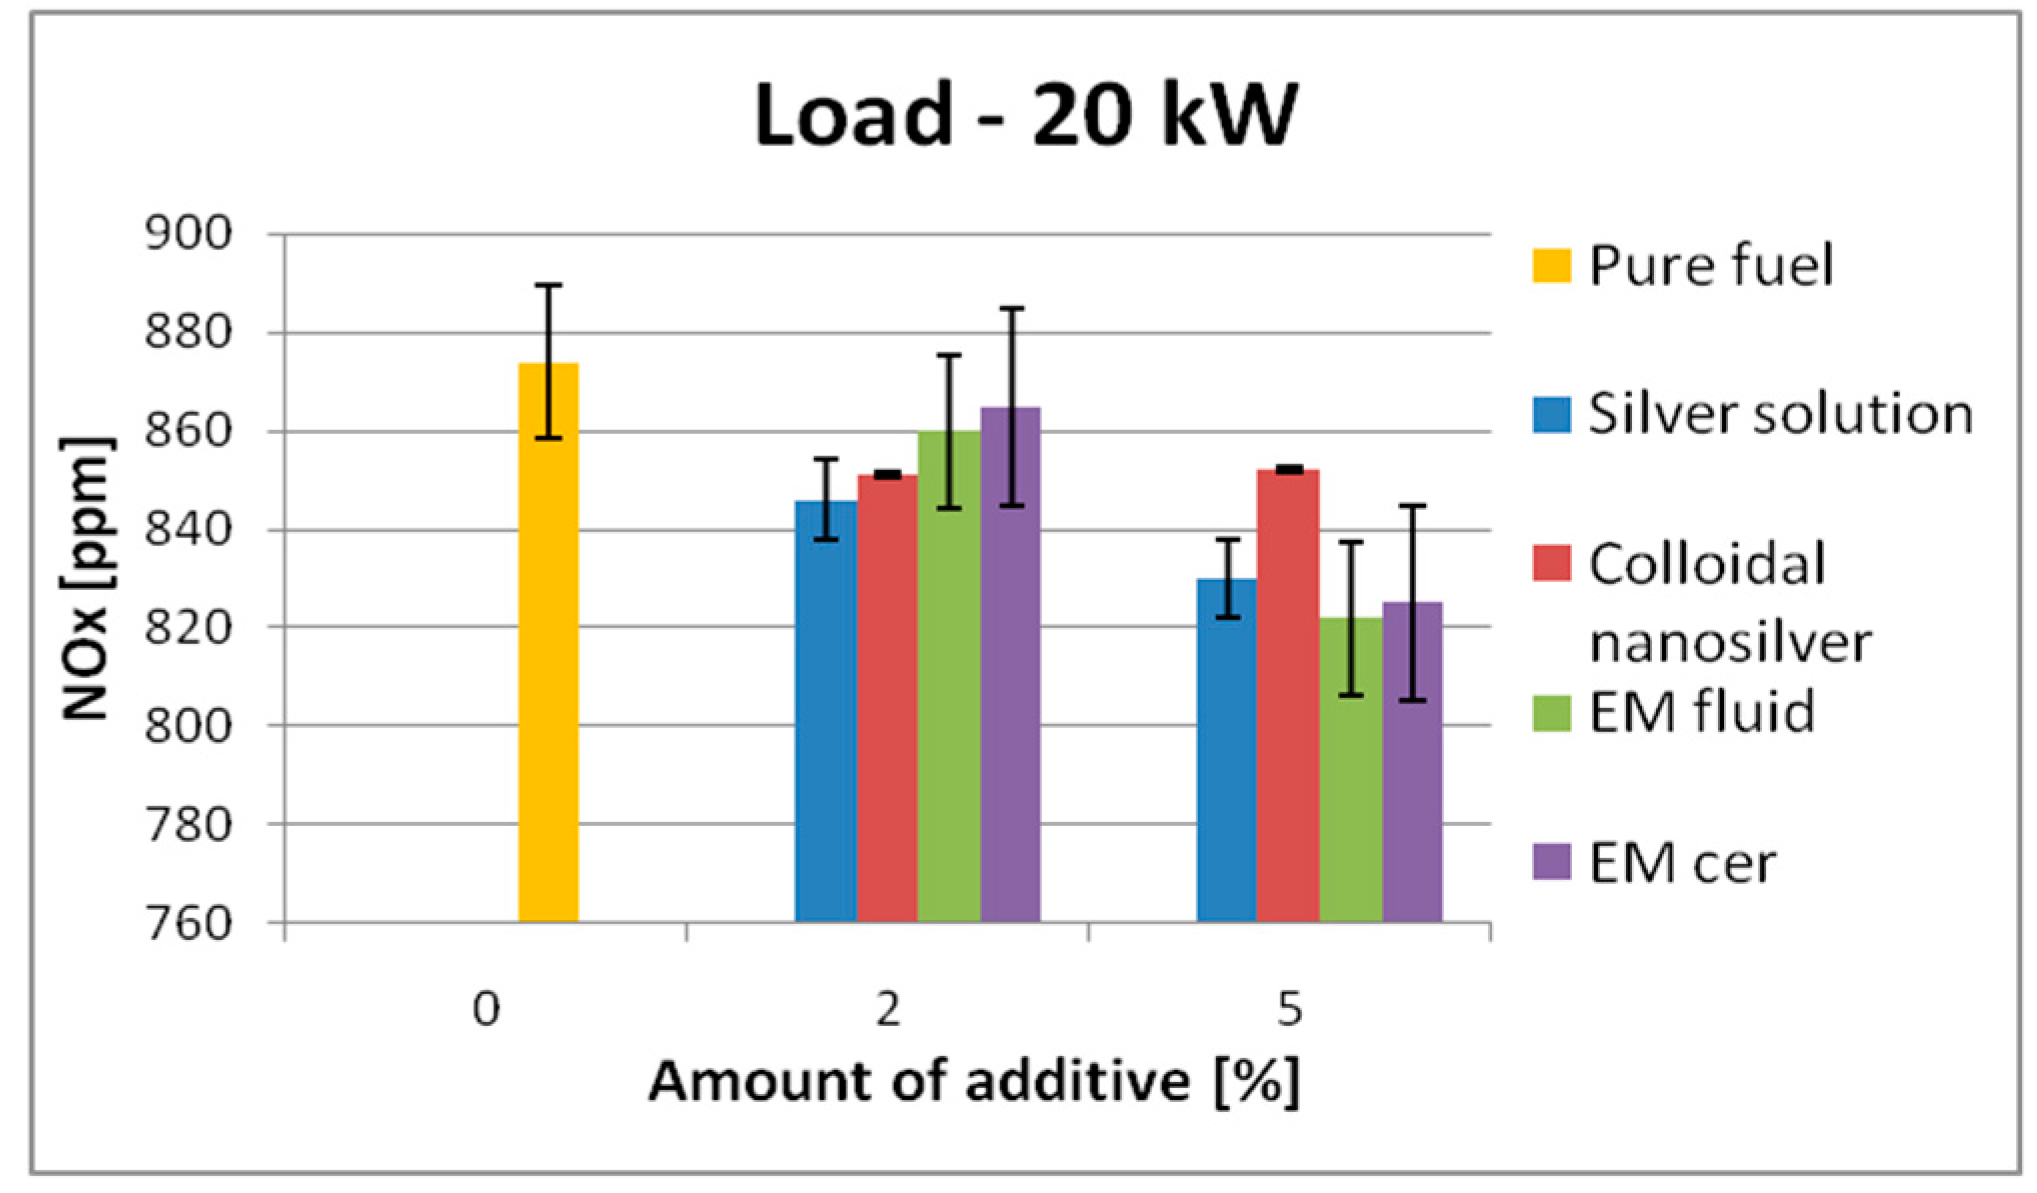
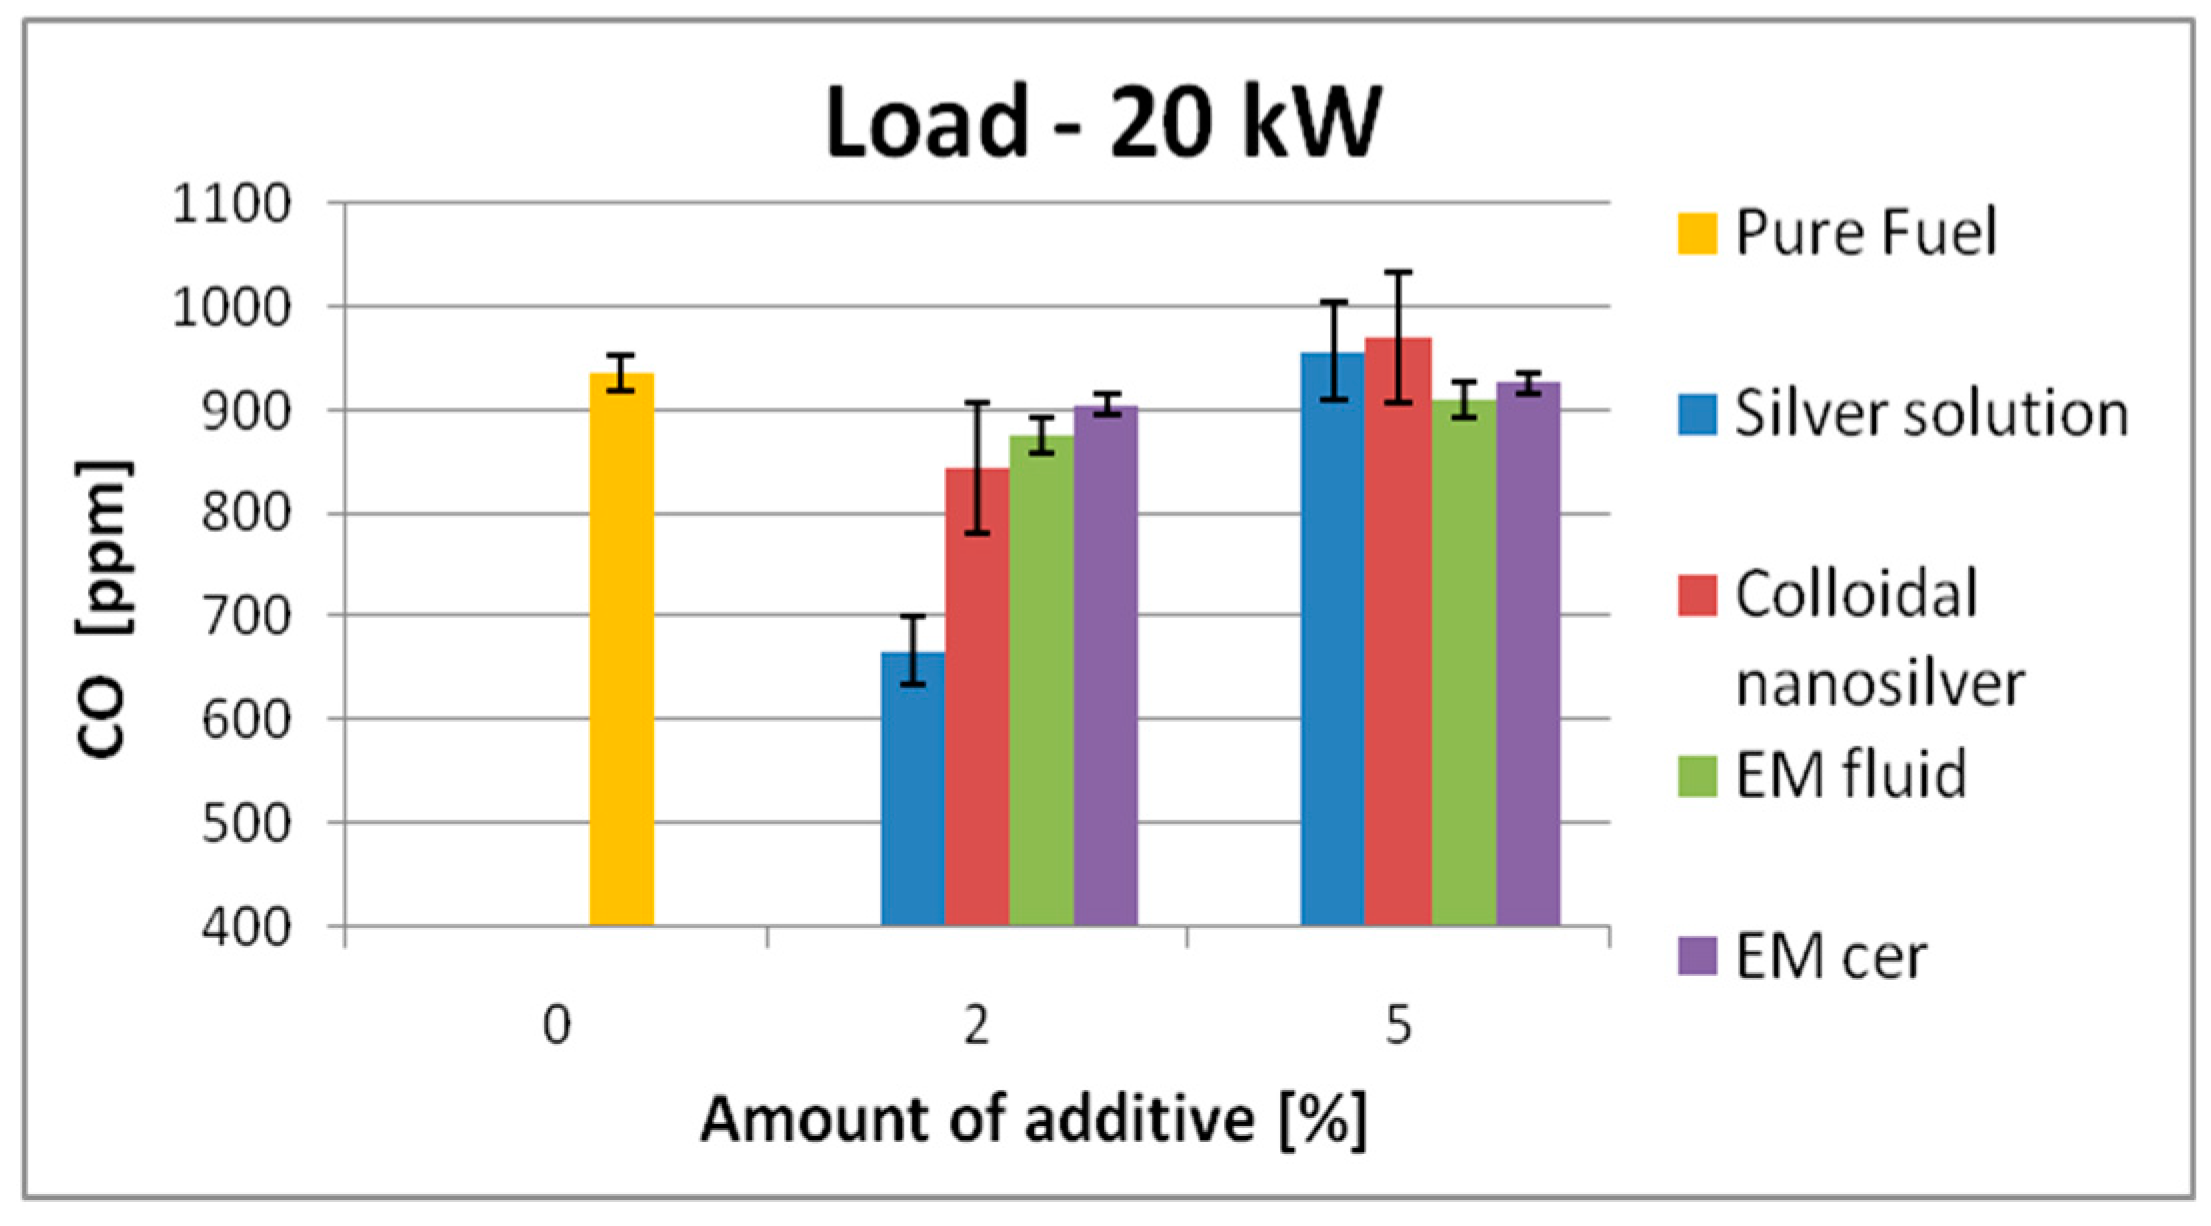
| 20 kW | 874 | SS | 846 | ↓3.2% | 830 | ↓5.1% | 935 | SS | 667 | ↓28.7% | 957 | ↑2.4% |
| CS | 851 | ↓2.6% | 852 | ↓2.5% | CS | 844 | ↓9.8% | 971 | ↑3.9% | |||
| EM_fl | 860 | ↓1.6% | 822 | ↓6% | EM_fl | 876 | ↓6.3% | 910 | ↓2.7% | |||
| EM_cer | 865 | ↓1.05% | 825 | ↓5.6% | EM_cer | 905 | ↓3.2% | 926 | ↓1.0% | |||
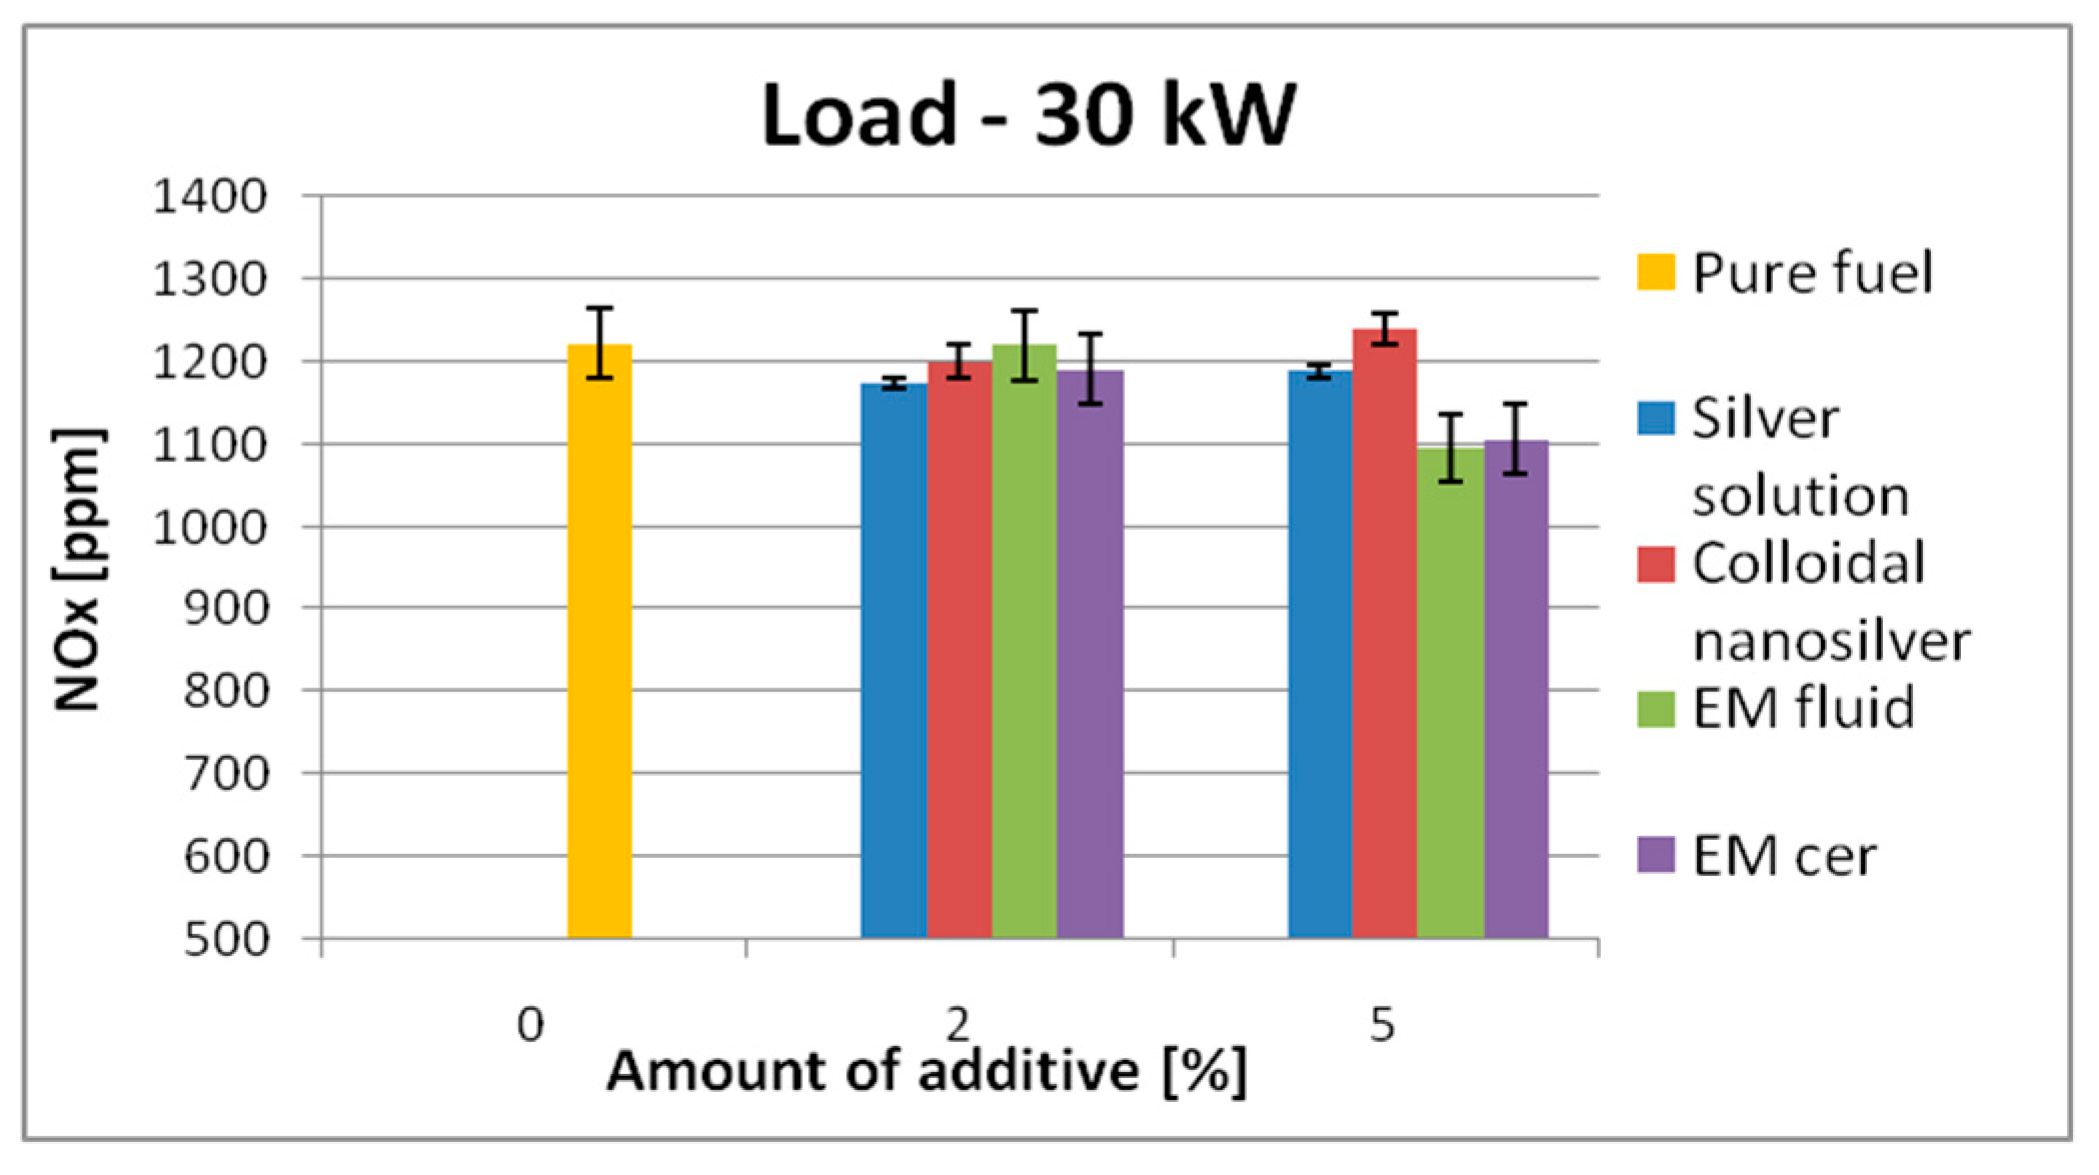
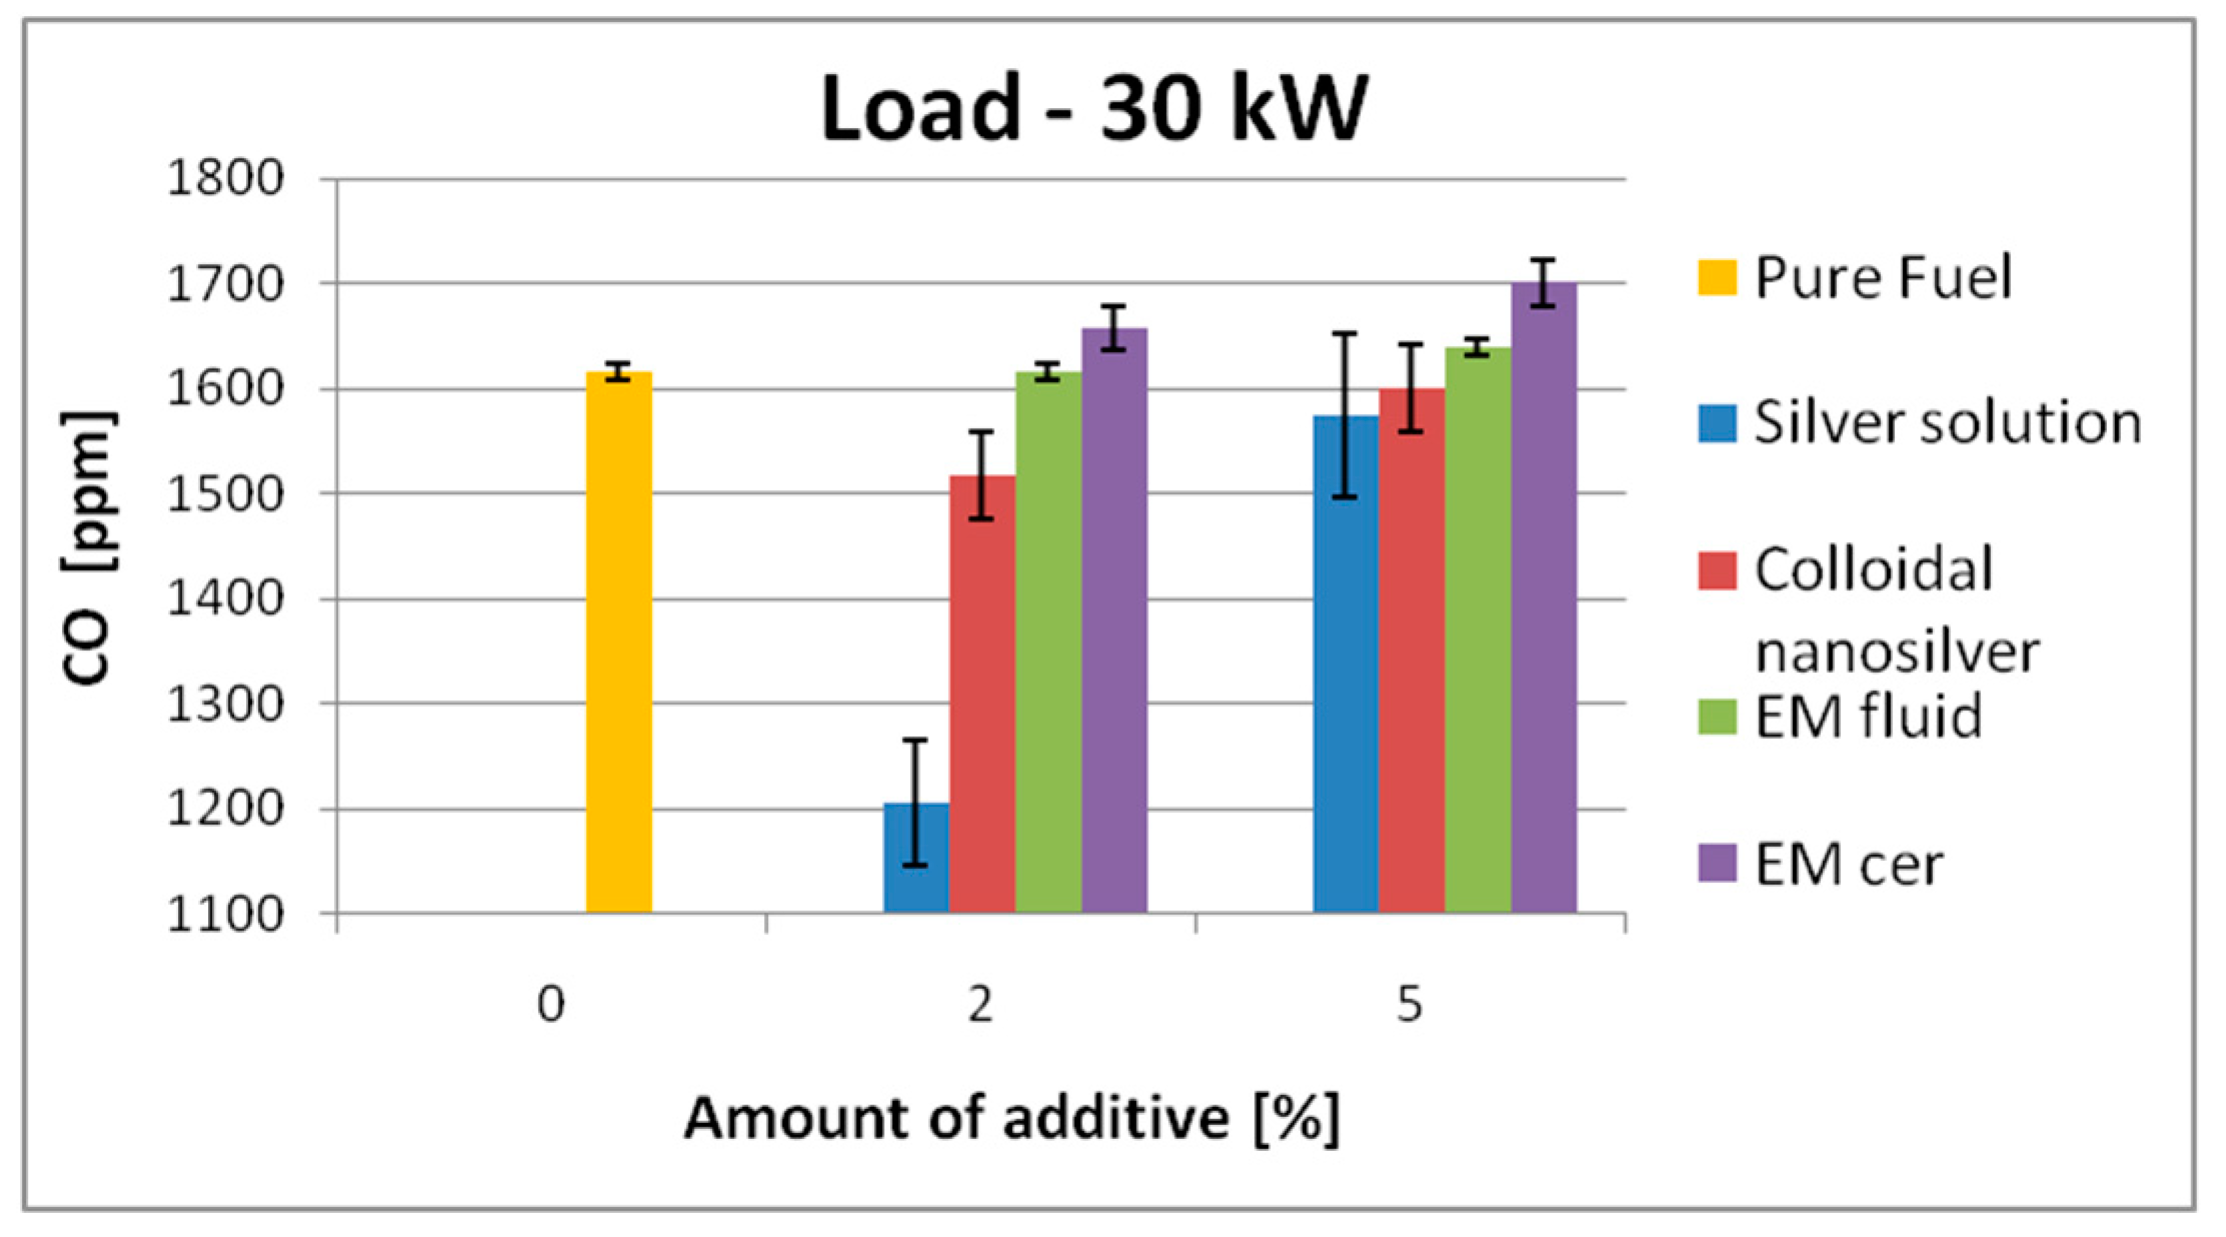
| 30 kW | 1222 | SS | 1174 | ↓4% | 1189 | ↓2.7% | 1615 | SS | 1206 | ↓25.3% | 1575 | ↓2.5% |
| CS | 1200 | ↓1.8% | 1240 | ↑1.5% | CS | 1518 | ↓6.0% | 1601 | ↓0.9% | |||
| EM_fl | 1220 | ↓0.17% | 1095 | ↓10.4% | EM_fl | 1616 | ↑0.06% | 1639 | ↑1.5% | |||
| EM_cer | 1190 | ↓2.62% | 1105 | ↓9.6% | EM_cer | 1658 | ↑2.7% | 1701 | ↑5.3% | |||
| CO2 [%] | Fuel Consumption [dm3/h] | |||||||||||
| Engine Load | Pure Oil | Additives | Concentration 2% | Concentration 5% | Pure Oil | Additives | Concentration 2% | Concentration 5% | ||||
| 0 kW | 2 | SS | 1.8 | ↓10.4% | 1.7 | ↓15% | 4.7 | SS | 4.5 | ↓4.5% | 4.6 | ↓2.5% |
| CS | 1.9 | 5.0% | 2 | 0% | CS | 4.6 | ↓2.5% | 4.8 | ↑4.6% | |||
| EM_fl | 2 | 0% | 1.9 | ↓5.0% | EM_fl | 4.6 | ↓2.5% | 4.8 | ↑4.6% | |||
| EM_cer | 2.1 | ↑5.0% | 1.8 | ↓10% | EM_cer | 4.6 | ↓2.5% | 4.7 | 0% | |||
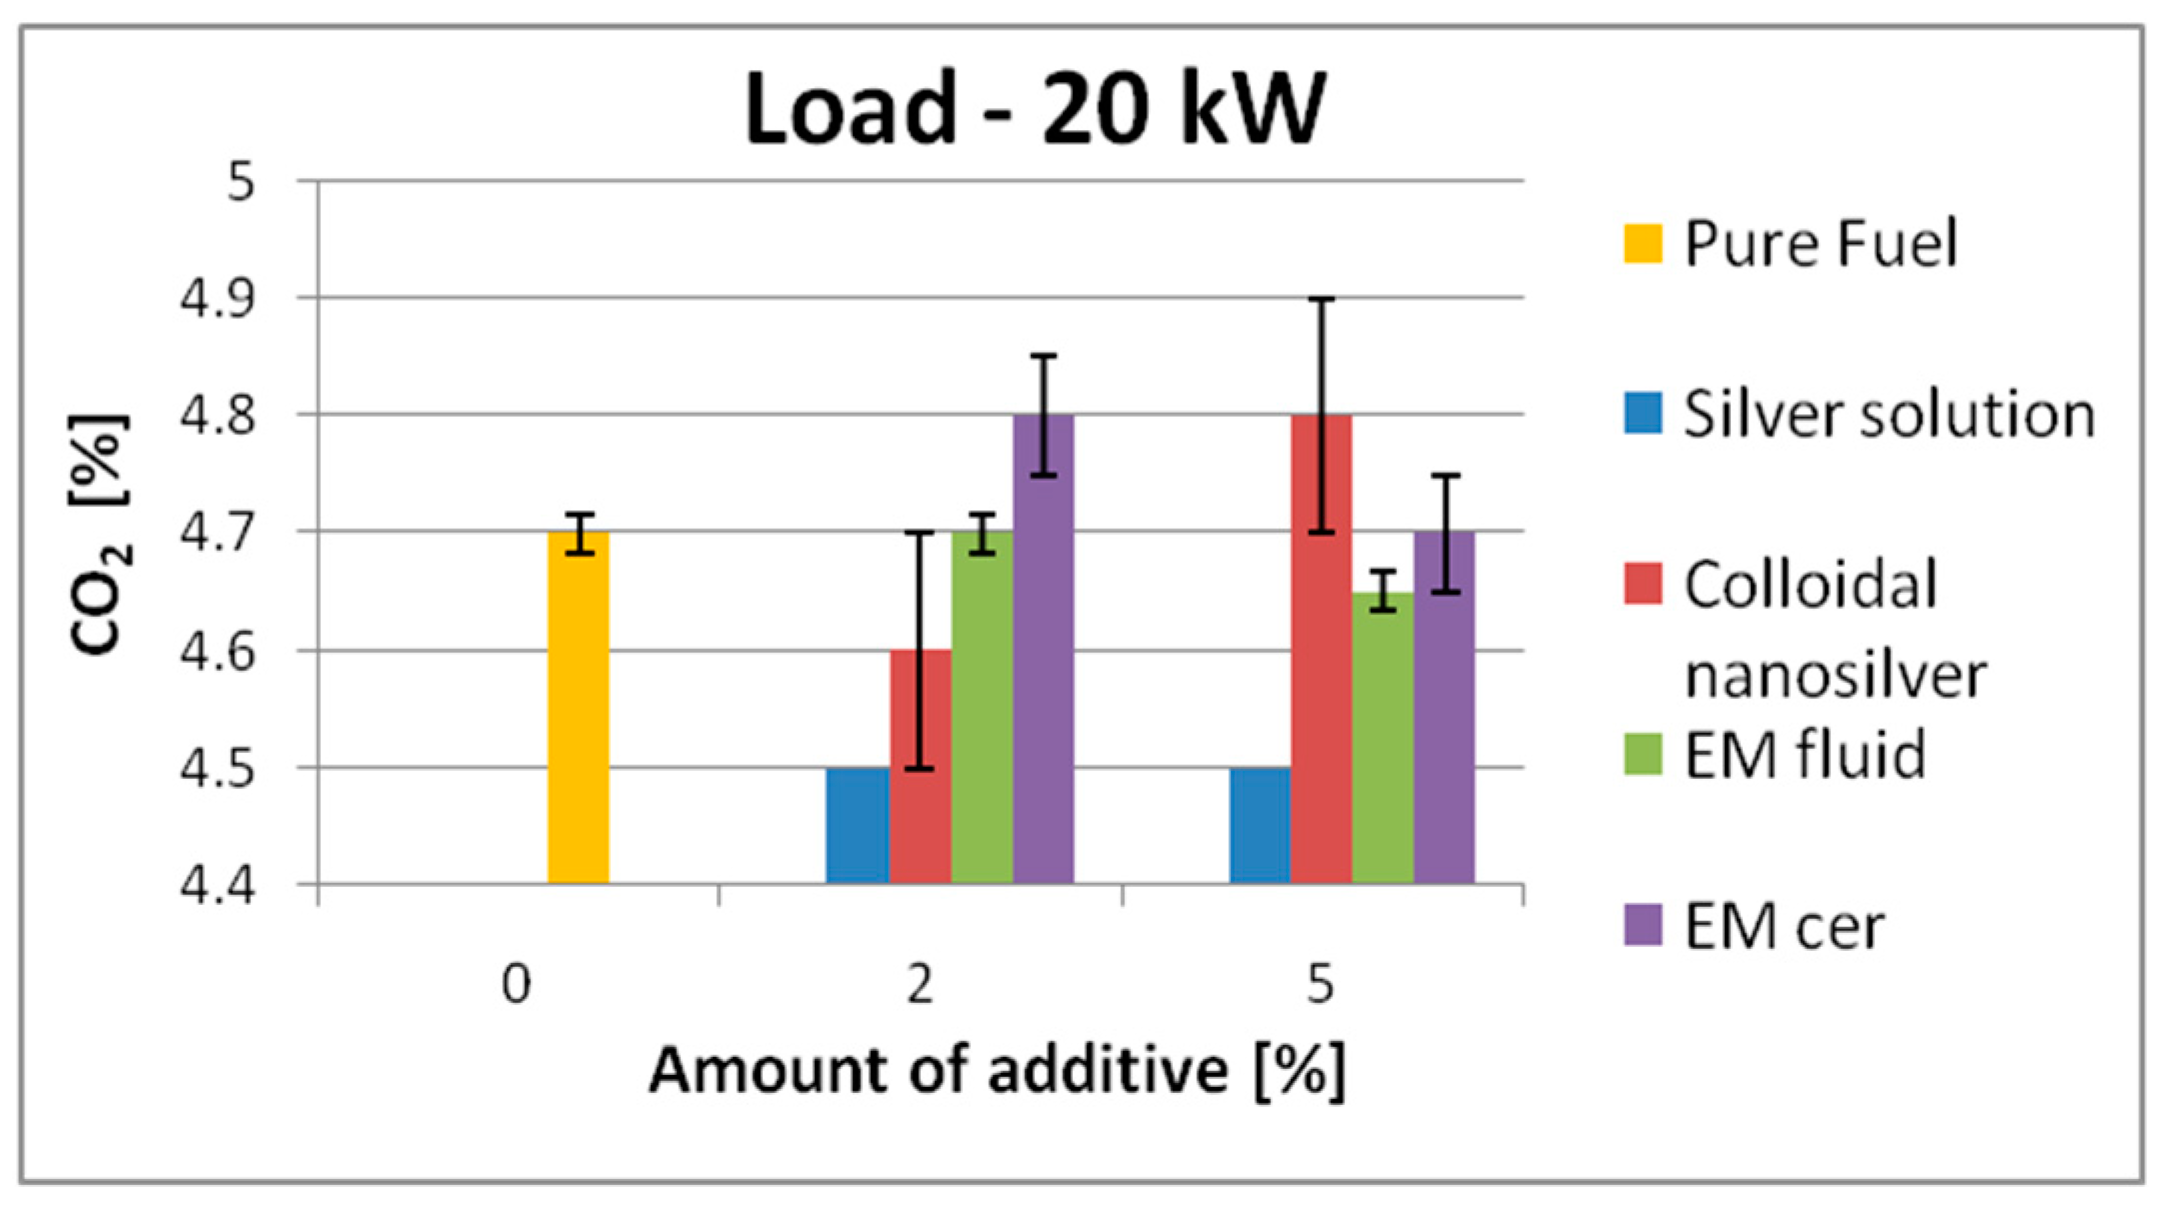
| 20 kW | 4.7 | SS | 4.5 | ↓5.0% | 4.5 | ↓4.5% | 10.2 | SS | 9.9 | ↓3.0% | 10 | ↓2.0% |
| CS | 4.6 | ↓3.0% | 4.8 | ↑2.2% | CS | 10 | ↓2.0% | 10.5 | ↑3.0% | |||
| EM_fl | 4.7 | 0% | 4.65 | ↓1.2% | EM_fl | 10.3 | ↑1.0% | 10.8 | ↑6.0% | |||
| EM_cer | 4.8 | ↑3.0% | 4.7 | 0% | EM_fl | 10.1 | ↓1.0% | 10.4 | ↑2.0% | |||
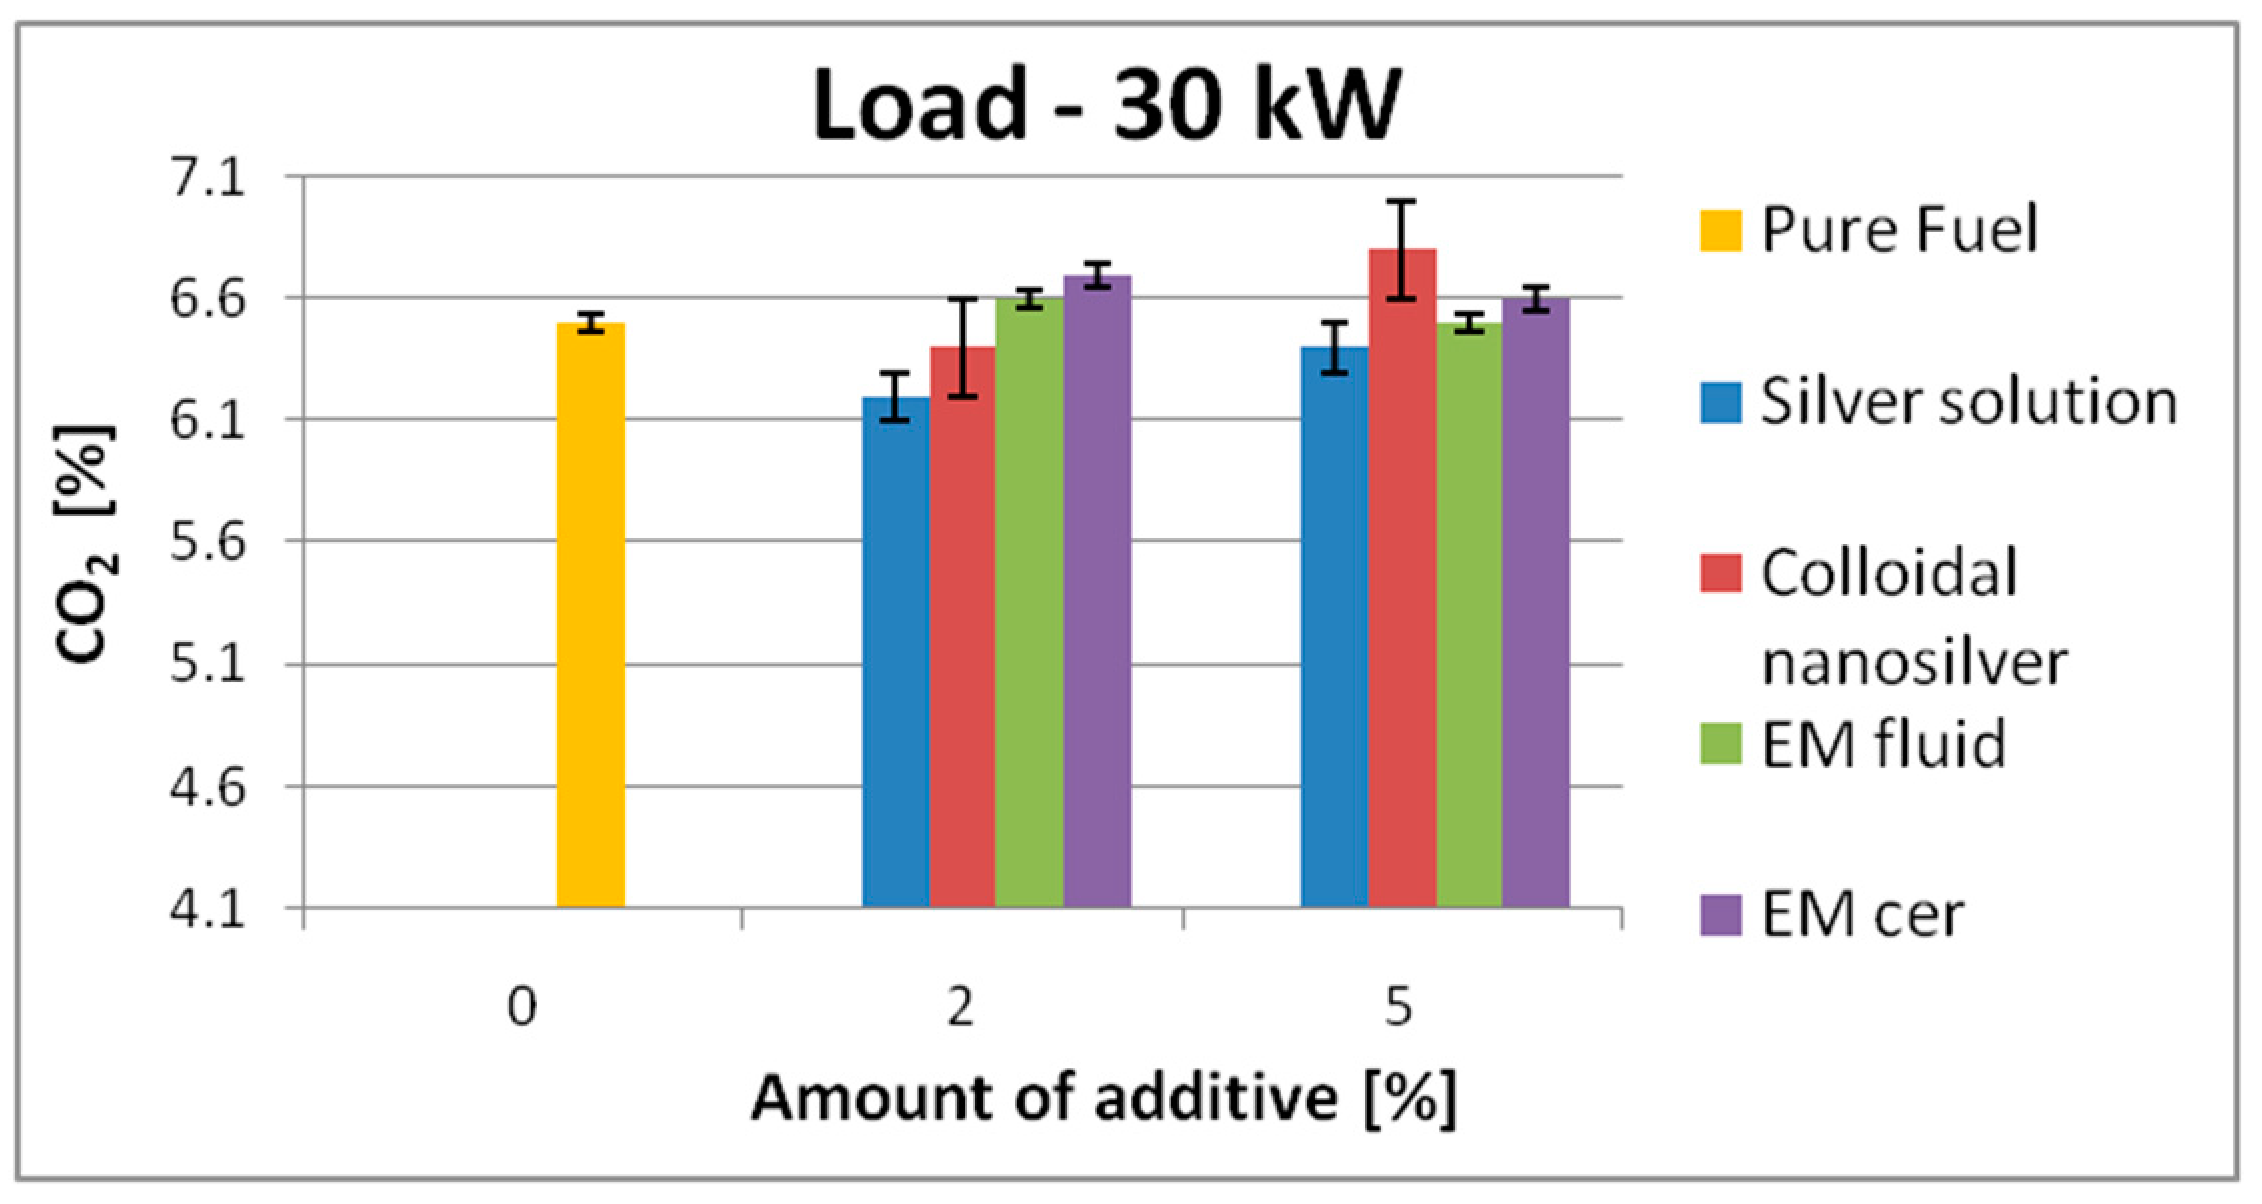
| 30 kW | 6.5 | SS | 6.2 | ↓4.6% | 6.4 | ↓1.6% | 13.3 | SS | 13 | ↓2.3% | 13.4 | ↑1.0% |
| CS | 6.4 | ↓1.8% | 6.8 | ↑4.6% | CS | 13.3 | 0% | 13.8 | ↑3.8% | |||
| EM_fl | 6.6 | ↑1.8% | 6.5 | 0% | EM_fl | 13.5 | ↑1.6% | 13.9 | ↑4.5% | |||
| EM_cer | 6.7 | ↑3.1% | 6.6 | ↑1.6% | EM_cer | 13.2 | ↓0.8% | 13.5 | ↑1.6% | |||
Disclaimer/Publisher’s Note: The statements, opinions and data contained in all publications are solely those of the individual author(s) and contributor(s) and not of MDPI and/or the editor(s). MDPI and/or the editor(s) disclaim responsibility for any injury to people or property resulting from any ideas, methods, instructions or products referred to in the content. |
© 2024 by the authors. Licensee MDPI, Basel, Switzerland. This article is an open access article distributed under the terms and conditions of the Creative Commons Attribution (CC BY) license (https://creativecommons.org/licenses/by/4.0/).
Share and Cite
Krakowski, R.; Witkowski, K. Investigating the Effects of Environmentally Friendly Additives on the Exhaust Gas Composition and Fuel Consumption of an Internal Combustion Engine. Appl. Sci. 2024, 14, 2956. https://doi.org/10.3390/app14072956
Krakowski R, Witkowski K. Investigating the Effects of Environmentally Friendly Additives on the Exhaust Gas Composition and Fuel Consumption of an Internal Combustion Engine. Applied Sciences. 2024; 14(7):2956. https://doi.org/10.3390/app14072956
Chicago/Turabian StyleKrakowski, Rafał, and Kazimierz Witkowski. 2024. "Investigating the Effects of Environmentally Friendly Additives on the Exhaust Gas Composition and Fuel Consumption of an Internal Combustion Engine" Applied Sciences 14, no. 7: 2956. https://doi.org/10.3390/app14072956
APA StyleKrakowski, R., & Witkowski, K. (2024). Investigating the Effects of Environmentally Friendly Additives on the Exhaust Gas Composition and Fuel Consumption of an Internal Combustion Engine. Applied Sciences, 14(7), 2956. https://doi.org/10.3390/app14072956