Abstract
To enhance the accuracy of multispectral detection using unmanned aerial vehicles (UAVs), multispectral data of jujube fruit with different soluble solids content (SSC) and moisture content (MC) were obtained under different relative azimuth angles. Prediction models for SSC and MC of jujube fruit were established using partial least squares regression (PLSR) and support vector machines (SVM), respectively. The findings revealed that the MC of jujube fruit had the best prediction effect when the relative azimuth angle was 90°, while the SSC of the jujube fruit had the best prediction effect at an azimuth angle of 180°. Then, the spectral reflectance data corresponding to the eight relative azimuth angles were used as input variables to establish a jujube fruit quality detection model. The results showed that the prediction model for MC and SSC, established using the angle fusion method, had higher detection accuracy compared to the prediction model established at a single angle. This research provides a technical reference for improving the accuracy of outdoor jujube fruit quality detection using spectral technology.
1. Introduction
Jujube (Ziziphus jujuba Mill.) is a notable agricultural commodity, experiencing a rise in both cultivation area and yield annually. It is a medicinal and edible fruit that originates from China [1]. The sweet and delicious jujube fruit is rich in vitamin C, amino acids, cyclic adenosine monophosphate, carbohydrates, and minerals like iron and potassium [2]. Regular consumption of this fruit is beneficial for human health and is popular among consumers. Along with the improvement in our living standards, consumers have higher requirements for the quality of rice. Consequently, quality assessment has gained importance.
During the processing of jujube fruits, quality testing is crucial. Two key parameters that indicate quality are moisture content (MC) and soluble solids content (SSC). Soluble solids are a comprehensive term for all water-soluble compounds in food, such as sugar, acid, and vitamins. Their content significantly impacts the taste and ripeness of jujube fruit, serving as a key quality indicator [3]. Moisture content directly affects the taste and storage period of jujube fruit and is also one of the main indicators of jujube fruit quality [4]. Therefore, it is essential to accurately and efficiently measure these parameters. Traditional methods for testing MC and SSC in jujube fruit involve using specialized equipment for destructive testing. While these methods yield high accuracy, the testing process is intricate and time-consuming [5]. The progress in spectral technology and associated hardware capabilities has sparked interest in utilizing spectral technology for agricultural product detection. This technology can identify ingredients and determine their content based on the spectral data of a substance [5]. Unmanned aerial vehicle (UAV) multispectral imaging detection technology enables rapid acquisition of orchard spectral data across a broad area [6,7]. These data can be used to infer the fruit tree growth status and soil quality in orchards [8,9,10,11]. In recent years, this technology has gained attention from numerous scholars, who have conducted extensive research in areas such as processing [12,13], feature extraction [11,14], and recognition model construction [15,16,17]. Sun et al. [18] employed UAV remote sensing technology to quantify the nitrogen nutrient content of leaves using multispectral images. The findings revealed that this method exhibited a slight advantage in detecting nitrogen nutrient content during the early fruit expansion stage compared to the subsequent stages. Peng et al. [19] conducted a correlation analysis on UAV multispectral image data and field-measured leaf nitrogen content (LNC), leaf potassium content (LKC), and leaf phosphorus content (LPC) values. They determined the vegetation index (VI) that is sensitive to LNC, LKC, and LPC. Prediction models were established using partial least squares (PLS), random forest (RF), support vector machine (SVM), and extreme learning machine (ELM) machine learning algorithms. The optimal combination of spectral variables and machine learning models for predicting LNC, LPC, and LKC for each grape growth period was ultimately determined. To predict soil volumetric water content (VWC) and electrical conductivity (EC), Guan et al. [20] utilized VI and original multispectral data acquired from UAV to develop a prediction model using the random forest method. The study revealed that the prediction outcomes were influenced by varying soil moisture conditions.
The detection accuracy of multispectral cameras is generally low due to their limited number of filters. Typically, these cameras can only provide qualitative analysis of samples [21,22]. In spectral detection technology research, researchers often use either single-directional measurement or integrating sphere measurement to obtain reflection spectrum information [23,24,25]. However, we found in previous experiments, it affected the reflection information of the detected object when the observation information from a remote sensing platform came from different directions. This resulted in a significant deviation in the input of the prediction model, ultimately impacting the prediction results.
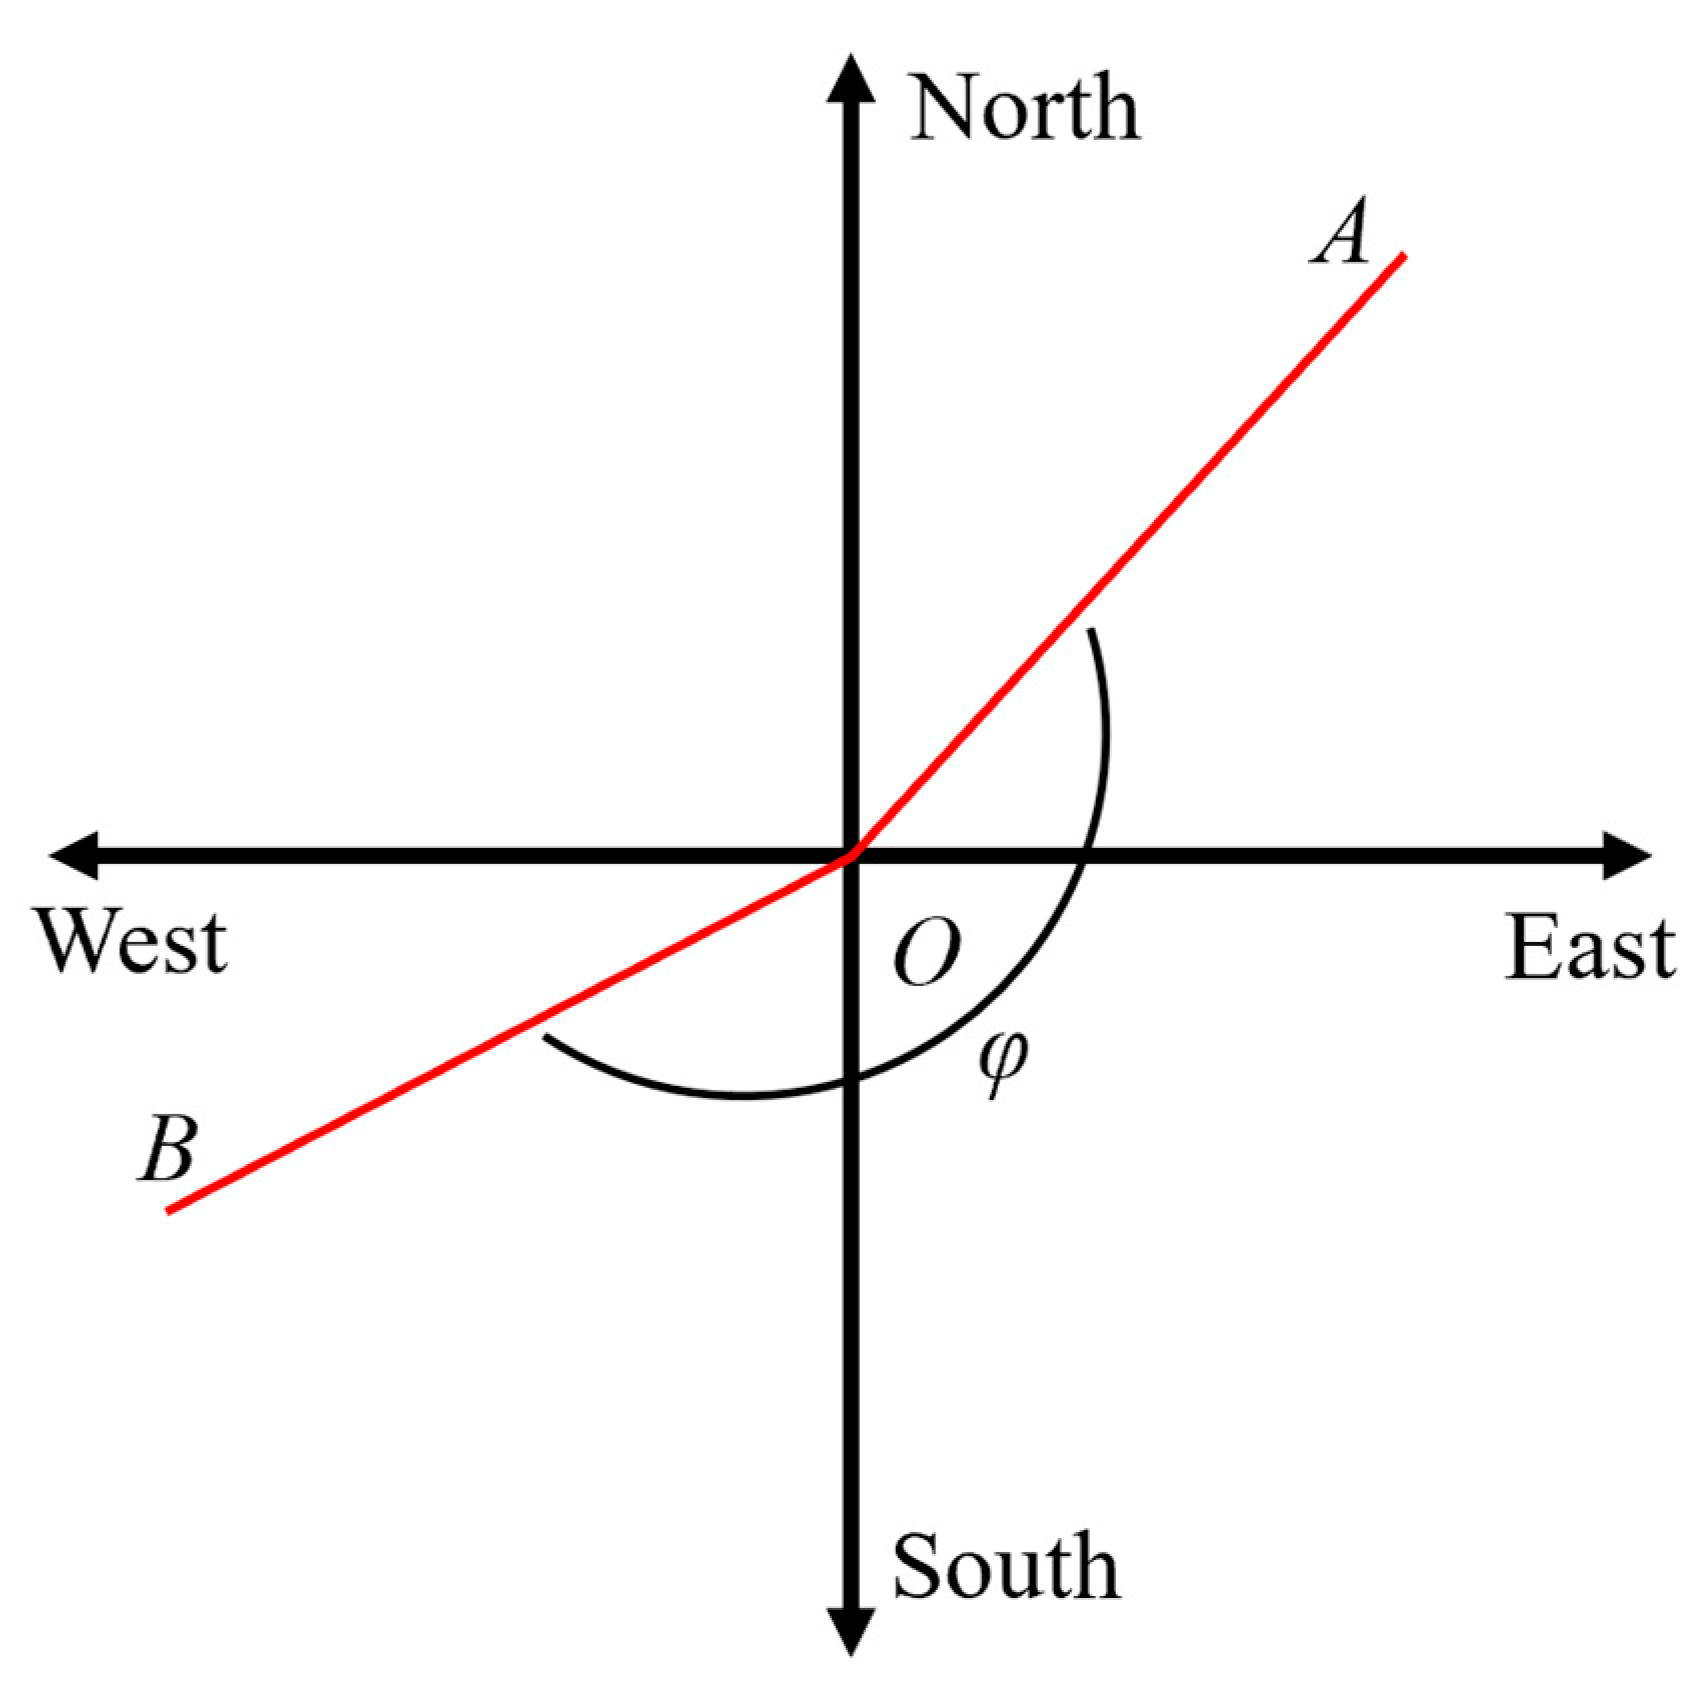
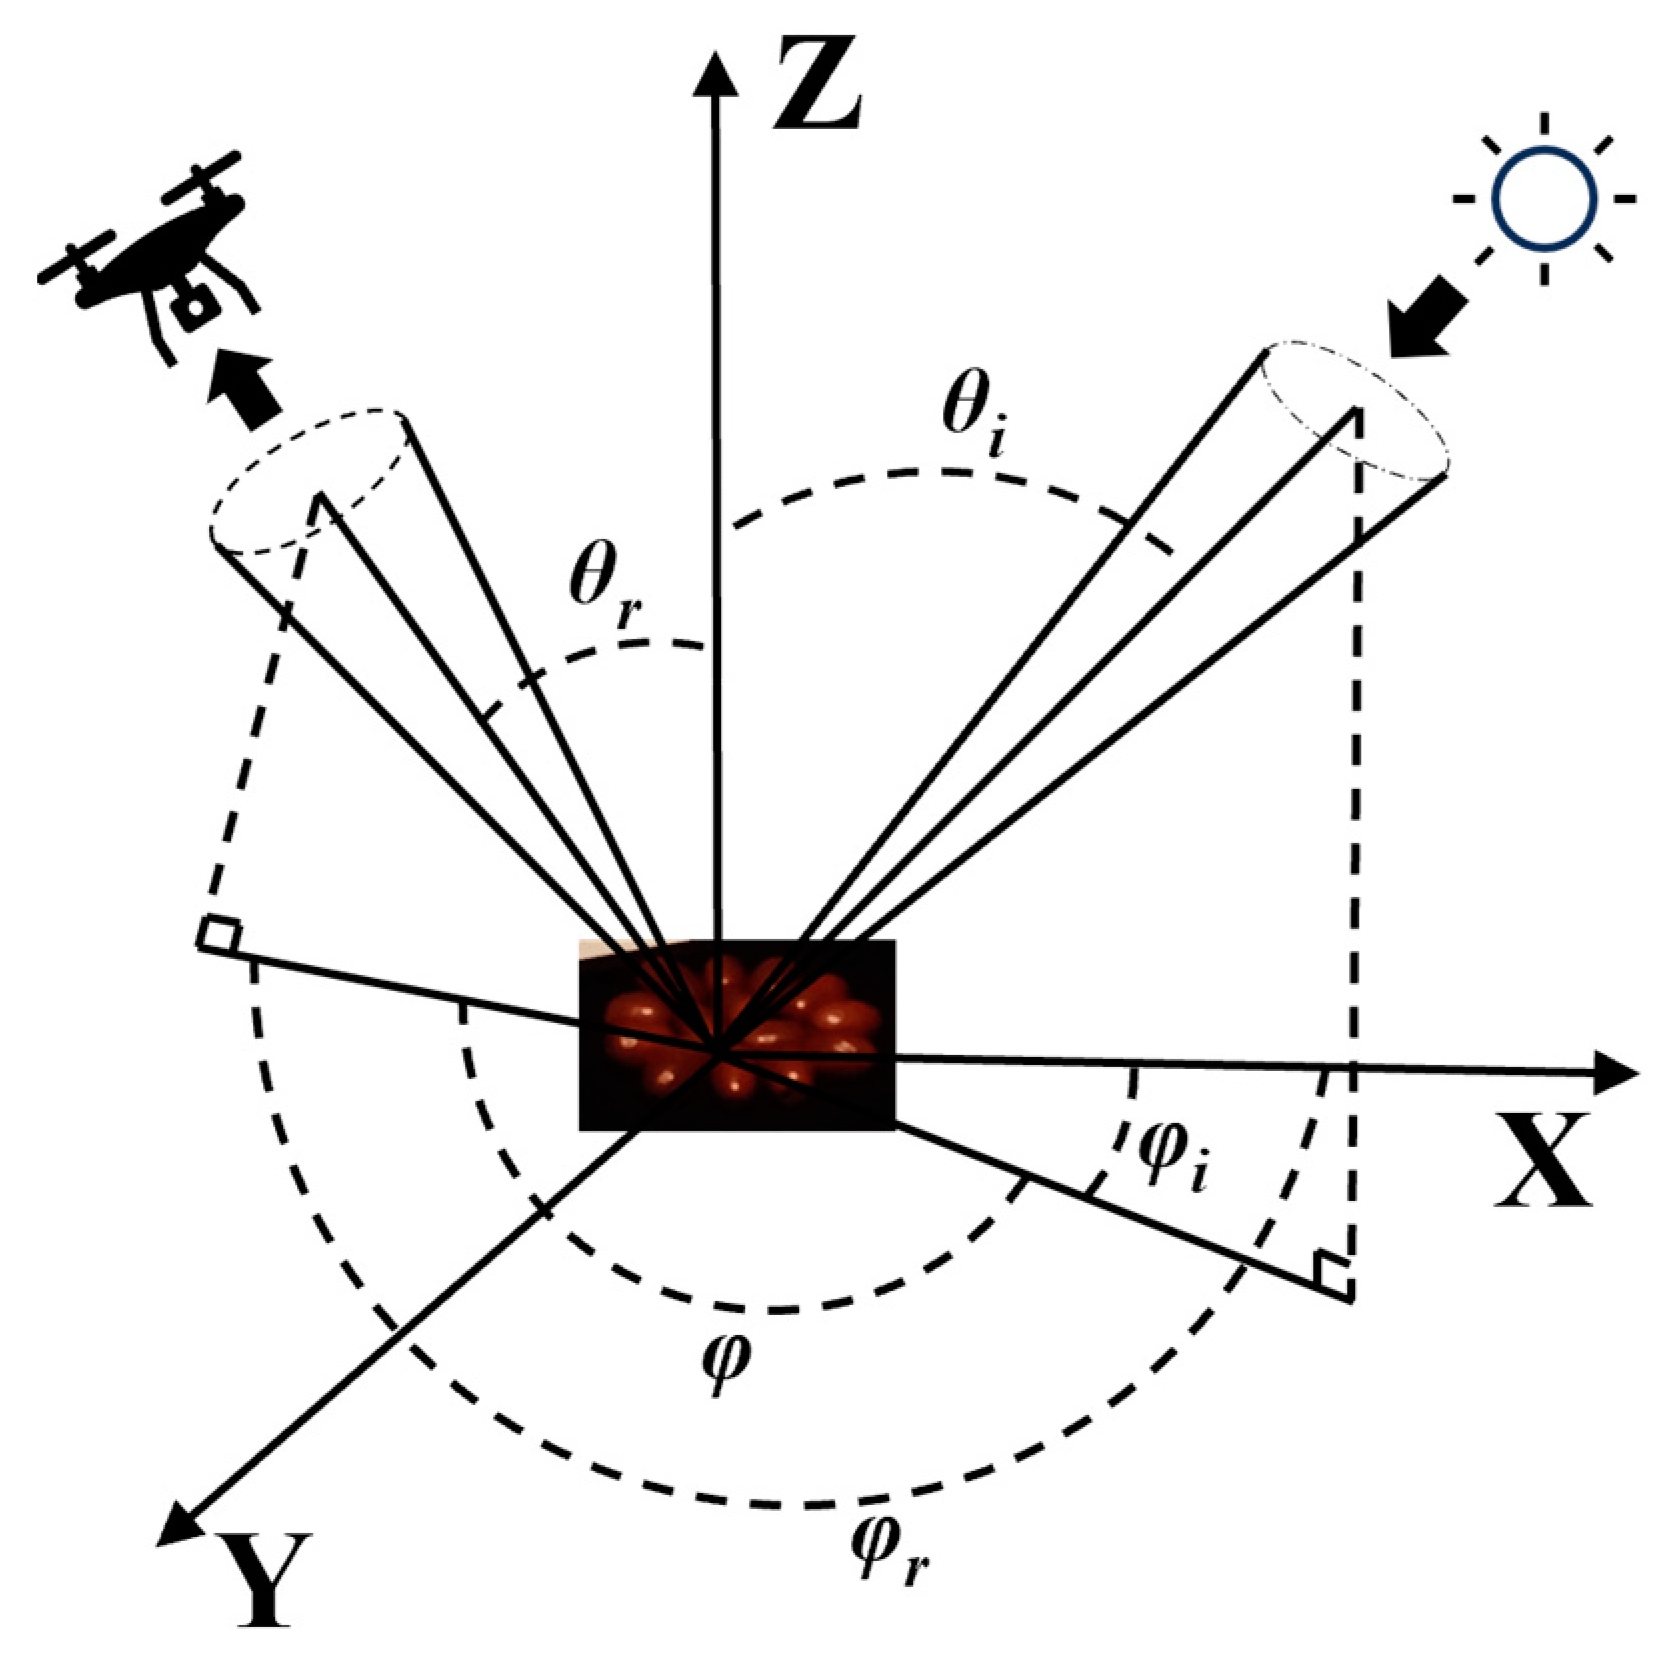
At what relative azimuth angle (the angle between the projection line of the reflected light from jujube fruit received by the UAV multispectral camera to the ground and the projection line of the incident light emitted by the light source to the ground is called the relative azimuth angle; the schematic diagram of the relative azimuth angle is shown in Figure 1) does the spectral data acquired by the UAV provide the most beneficial prediction results? Does a model based on multispectral data at multiple relative azimuth angles have better prediction accuracy than a model based on multispectral data at a single relative azimuth angle? With these two questions, this study focused on jujube fruit as the research object to answer these questions. By adjusting the angle of the UAV platform outdoors, multispectral data at various relative azimuth angles were collected. These data were then used as input for prediction models of SSC and MC. The results were analyzed to determine the best relative azimuth angle (characteristic azimuth angle). Subsequently, multispectral data obtained from multiple relative azimuth angles and data obtained from the characteristic azimuth angle were used as inputs to compare the prediction results. This study can provide a reference for fruit quality detection based on multispectral data at multiple relative azimuth angles.

Figure 1.
Relative azimuth angle diagram. Note: O is the position of the jujube fruit. OA is the projection of the incident light from the light source towards the ground. OB is the projection of the reflected light received by the multispectral UAV towards the ground. θ is the relative azimuth angle.
2. Materials and Methods
2.1. Collection of Samples
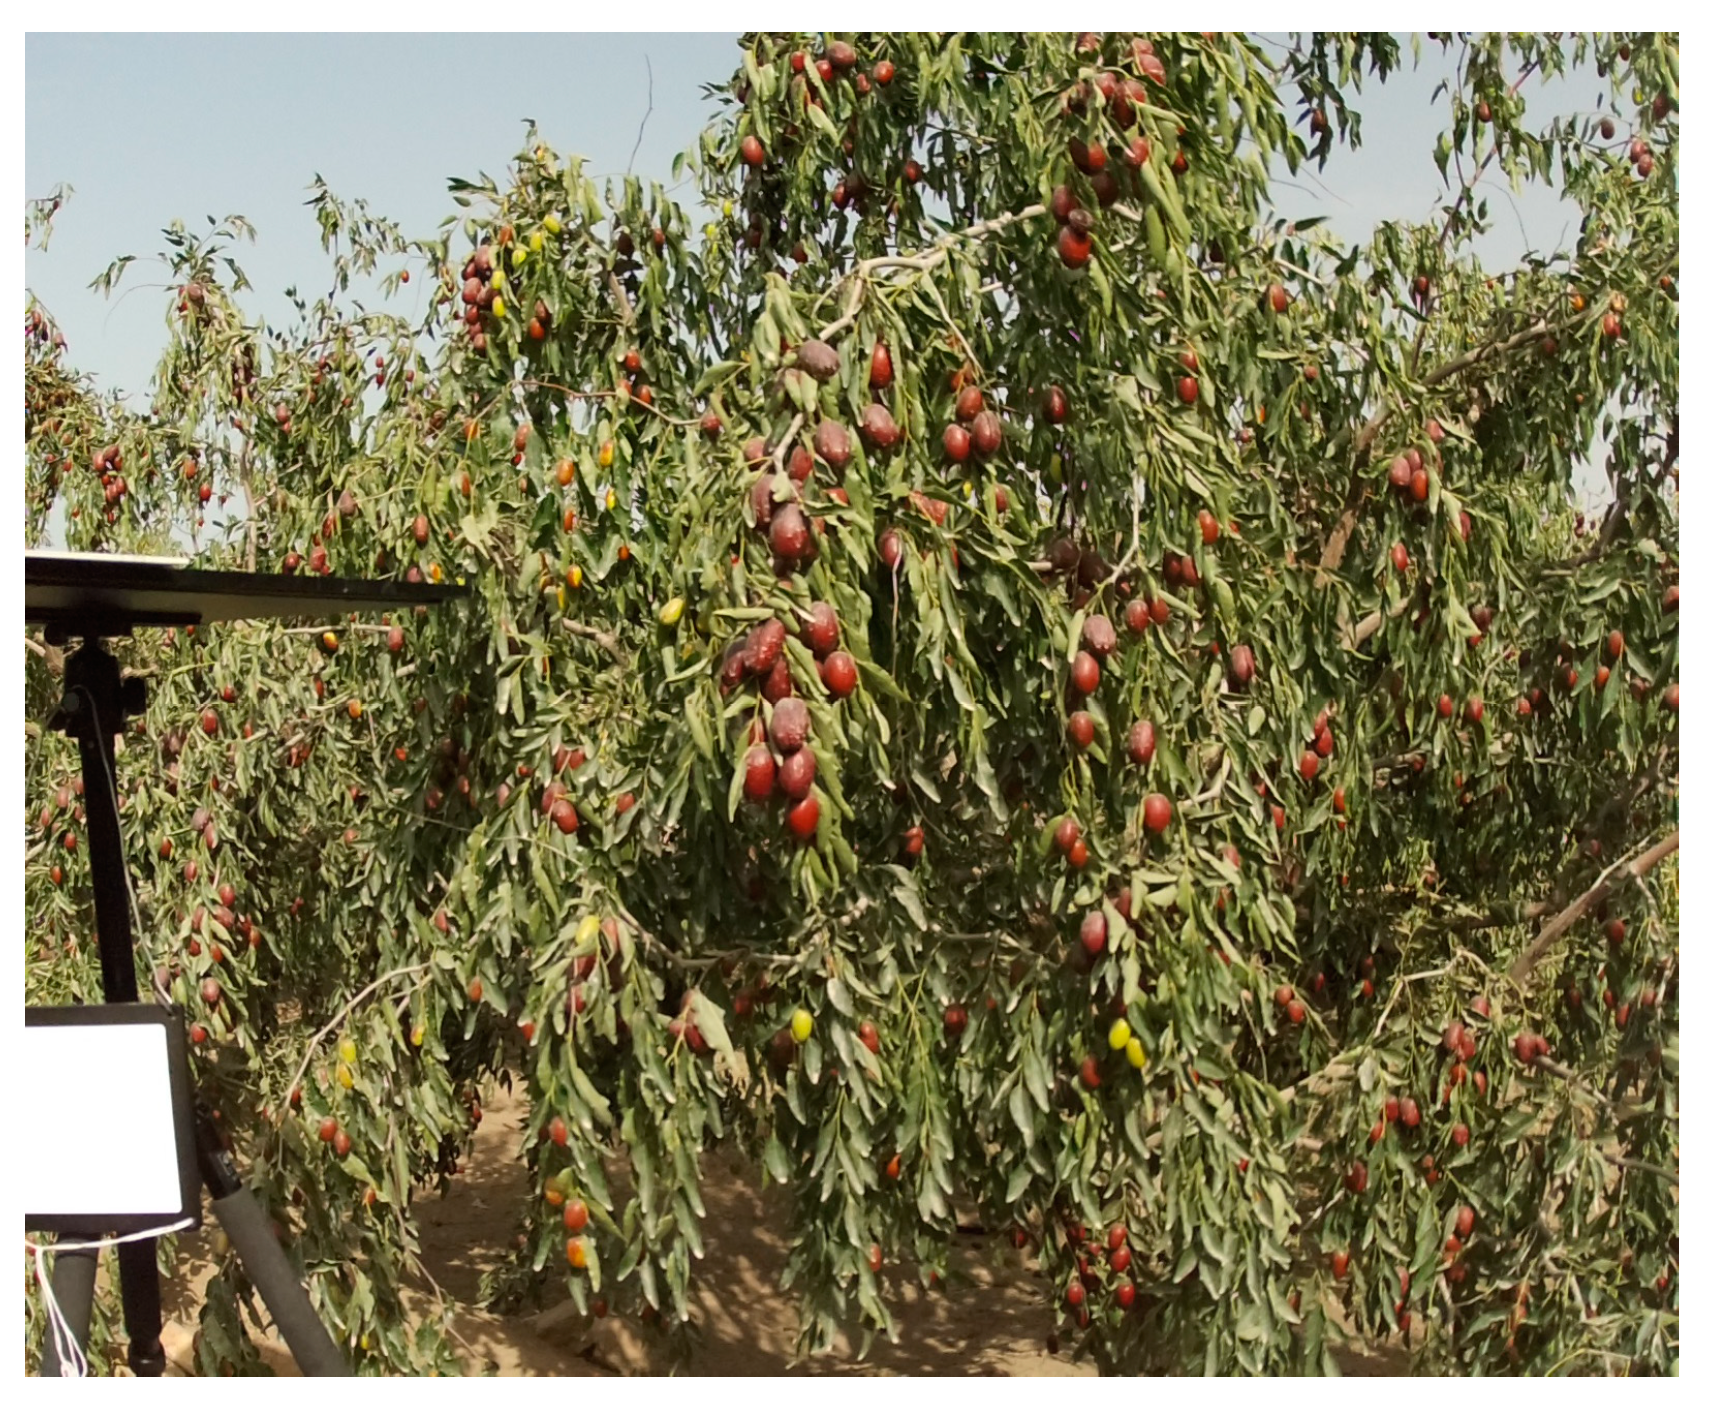
The mature jujube (Ziziphus jujuba Mill.) fruit used in the experiment were collected from the 13th Regiment Jujube Garden in Alar City, First Division, between 21 and 23 September 2022 (Figure 2). This variety of fruit originated in China and has been cultivated for over 8000 years. Known as the Vitamin King due to its high vitamin C content, the fruit is oblong, measuring 2–3.5 cm in length and 1.5–2 cm in diameter. As it ripens, it changes from red to reddish-purple, with a fleshy, thick, and sweet mesocarp.
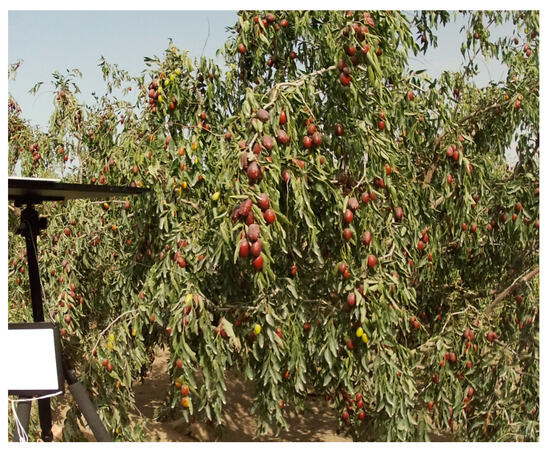
Figure 2.
Jujube fruit sample collection.
The jujube fruit collection location is close to the laboratory. After collection, the jujube fruits were transported for about 1 h and transferred to the refrigerator for storage. The refrigeration temperature was set to 0 °C. When detecting their multispectral data and physical and chemical data, they were randomly divided into a training set and a prediction set in a ratio of 3:1.
2.2. Experimental Equipment
The experimental equipment used in this study included the DJI Phantom 4 RTK UAV (DJI, Shenzhen, China). The maximum flight time of the UAV is about 27 min. The control range of the gimbal is −90° to +30°. The central wavelength parameters of the camera’s filter are shown in Table 1. The ground sampling distance (GSD) is shown in Formula (1). The maximum operating area for a single flight is approximately 0.63 km2. The camera’s color sensor has an ISO range of 200–800, and the allowed working environment temperature of the camera is 0 °C to 40 °C. Other equipment used included a PTFE (HSIA-CT-150 × 150) resin diffuse reflection whiteboard, an A-2003 electronic balance, a GZX-9140MBE electric blast dryer, and a GMK-710R handheld sugar meter.
where GSD is the ground sampling distance (cm/pixel), and H is the flight height (m).
GSD = (H/18.9)

Table 1.
DJI Phantom 4 UAV multispectral camera parameters.
2.3. Collection of Multispectral Images
The jujube fruit multispectral image collection took place from 13:18 to 13:28 on 6 October 2022. For the experiment, 100 jujube fruits were selected as test samples. The jujube fruits were chosen based on their similar sizes and absence of surface damage. Before the experiment, all jujube fruit samples were numbered and placed on the outdoor ground, with a diffuse reflection whiteboard positioned on one side for flat field correction. The jujube fruit is oval as a whole, and the long axis of the jujube fruit was placed in the north–south direction. The experiment commenced once the sample temperature was consistent with the ambient temperature. During the experiment, the UAV gimbal angle (θr) was set to 45°, with the UAV positioned approximately 150 cm above the ground. The UAV rotated counterclockwise around the center of the sample circle, which had a radius of 150 cm. The azimuth angle φ ranged from 0° to 360°. Multispectral images were collected at intervals of 45°, resulting in a total of 8 azimuth angles (0°, 45°, 90°, 135°, 180°, 225°, 270°, 315°). Through the above method, the spectral data of 100 jujube fruits were finally obtained (Figure 3).

Figure 3.
Collection of multispectral images.
2.4. Multispectral Image Preprocessing
2.4.1. Image Registration and Synthesis
The processing of UAV multispectral data was conducted in ENVI5.3 software (ITT-Visual information Solutions, Boudler, CO, USA). Since the images captured by the multispectral camera we utilized are single-band images and there are positional deviations between the images in each band, it is necessary to register and synthesize the images before extracting data. Taking the relative azimuth angle of 0° as an example, the image taken with the 450 nm band was used as the reference. The Image to Image tool was employed to sequentially register the spectral images of the other four bands without polarization. Once the registration process was completed, Layer Stacking was used to synthesize the single-band spectral image into a multiband spectral image in the specified band order [26,27,28].
2.4.2. Image Flat Field Correction
In theory, when a camera images a uniform target, the grayscale values of all pixels in the image should be the same. However, in practice, due to uneven illumination and inconsistent response of each pixel in the imaging device, there are often large differences in the values of each pixel in the image. Therefore, it is necessary to perform flat field correction to reduce these effects [29].
To correct the entire multispectral image, first, the region of interest (ROI) tool was used to select the range of the whiteboard and create an ROI. Then, the Flat Field Correction tool was utilized to correct the entire multispectral image based on the ROI of the whiteboard and convert the radiance of the image into reflectance. Afterward, the ROI tool was used again to obtain jujube fruit information. The sampling window was set to 3 × 3 pixels and the unpolarized and polarized reflectances of 100 jujube fruits were calculated [30,31].
After the above processing was completed, removing envelope processing was performed on the multispectral data.
2.5. Determination of Physical and Chemical Values of Jujube Fruit
The MC of jujube fruit was determined using an oven-drying method. Approximately 3 g of pulp was cut from the jujube fruit with a knife and labeled with a unique serial number. The mass of each pulp sample was recorded. The GZX-9140MBE electric blast drying oven was utilized to dry the fruit pulp at a temperature of 102 °C. The quality of the dried fruit pulp was evaluated and recorded. The MC was calculated using Formula (2).
where M is the MC (%), A is the sample mass before drying (g), and B is the sample mass after drying (g).
M = (A − B)/A
The GMK-710R handheld sugar meter was utilized to measure the SSC of jujube fruit. The juice obtained from the cut jujube fruit meat was extracted and placed into a sugar meter for measurement, and the resulting value was recorded.
Through the above method, the SSC and MC of 100 jujube fruits were finally obtained. The MC and SSC of jujube fruit are shown in Table 2.
Table 2.
Physical and chemical values of jujube fruit.
2.6. Abnormal Sample Elimination
Samples with outliers were eliminated using the concentration residual method [32]. The absolute error of the chemical value of the i-th sample is defined as the difference between the instrument-measured value (y) and the model-predicted value (yi). The concentration residual method is determined by using the F test, which is the ratio of the variance of the absolute error of the physical and chemical values of the sample being tested to the average of the absolute error variance of each sample in the entire standard sample set. The calculation method is shown in Formula (3).
where Res2(i) is the variance of the absolute error of the sample being tested, and Res2(j) is the average of the variance of the absolute error of the entire sample group. For the calculation methods of Res2(i) and Res2(j), see Formulas (4) and (5).
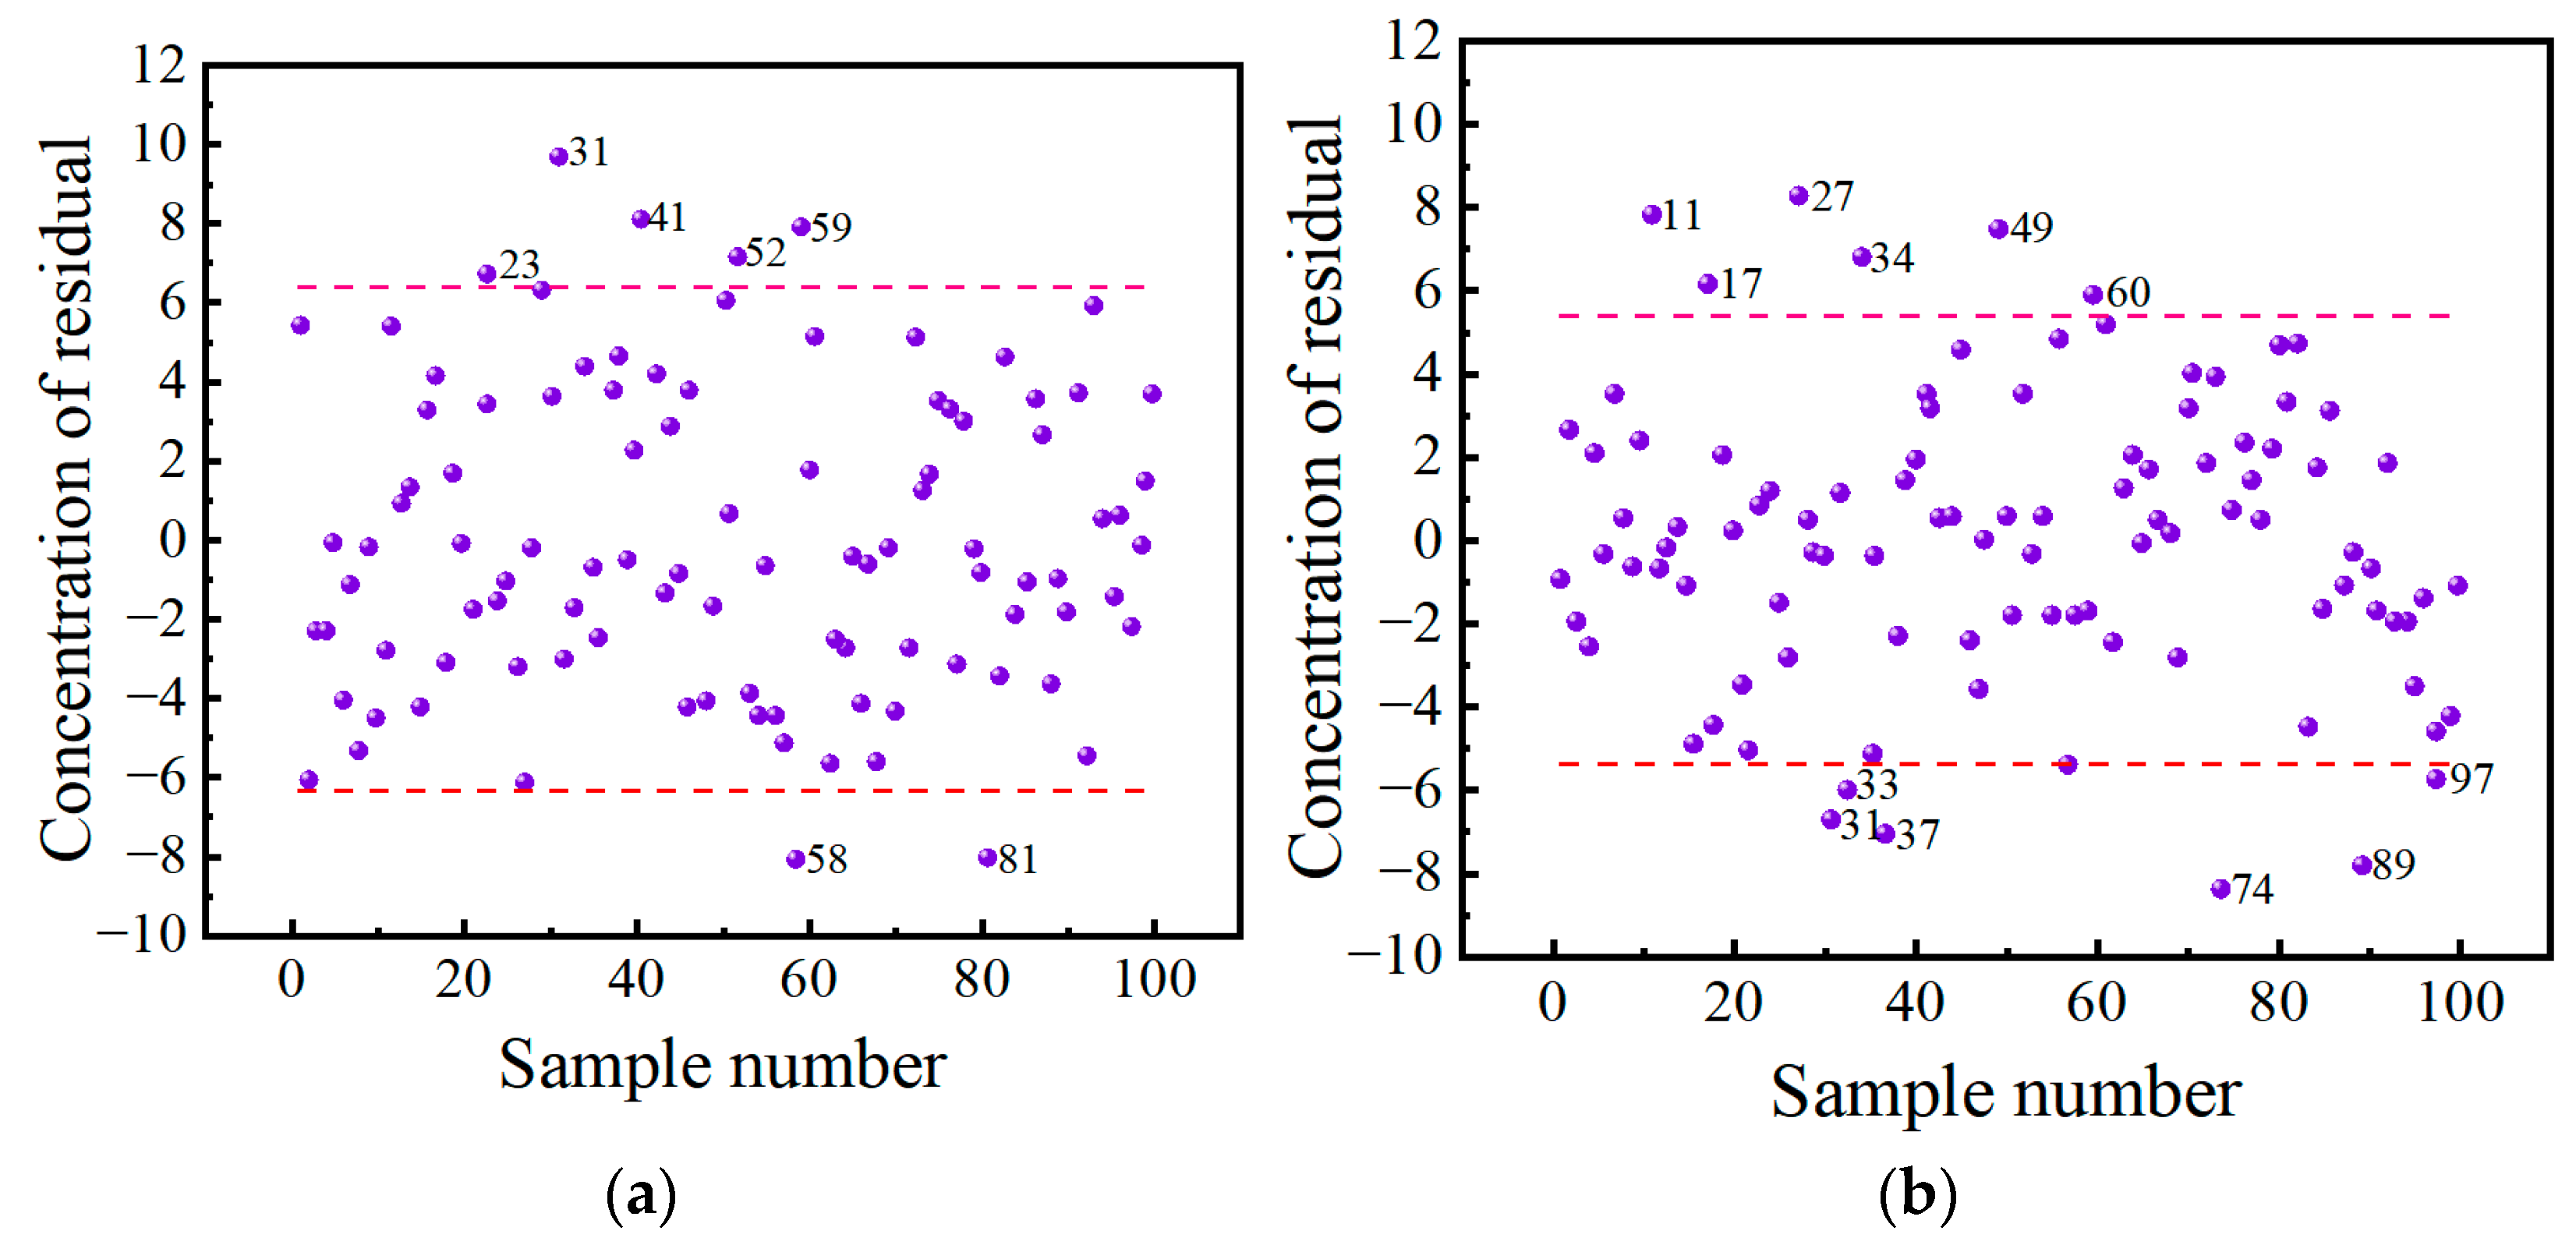
We set a hard threshold of 2. Samples larger than this hard threshold can be considered abnormal physical and chemical value samples. For example, for the azimuth angle of 0°, 7 abnormal samples were eliminated for the MC, and 12 abnormal samples were eliminated for the soluble solid samples. Figure 4 shows the concentration residual distribution diagram when the hard threshold is 2.
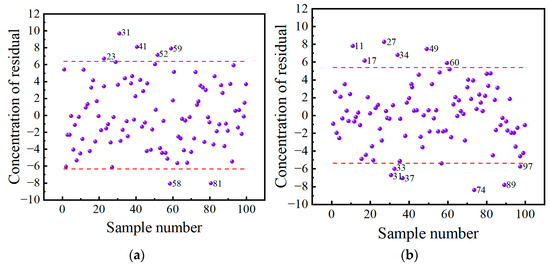
Figure 4.
Elimination of abnormal samples. (a) The situation of sample elimination in the experiment of predicting MC. (b) The situation of sample elimination in the experiment of predicting SSC. Note: The red dashed lines in the figure are the upper and lower limits when the selected threshold is 2.
2.7. Multispectral Continuum Removal Processing
When the spectral curves are similar, it is inconvenient to directly extract spectral data features from them, so the spectral curves need to be further processed to highlight the spectral features. The continuum removal method can effectively highlight the absorption, reflection, and emission characteristics of spectral curves and normalize them to a consistent spectral background, which is beneficial to the comparison of characteristic values with other spectral curves. This study increased the difference in reflectance by the continuum removal method.
2.8. Model Construction Method
In this study, partial least squares (PLS) and support vector machines (SVM) were utilized to develop prediction models for jujube fruit SSC and MC [33,34,35,36]. The influence of various detection azimuth angles on the models’ prediction results was examined. In addition, we compared the prediction results based on reflectance acquisition at multiple azimuth angles with the results based on reflectance acquisition at a single angle.
3. Results
3.1. Multi-Angle Reflectance Analysis of Jujube Fruit
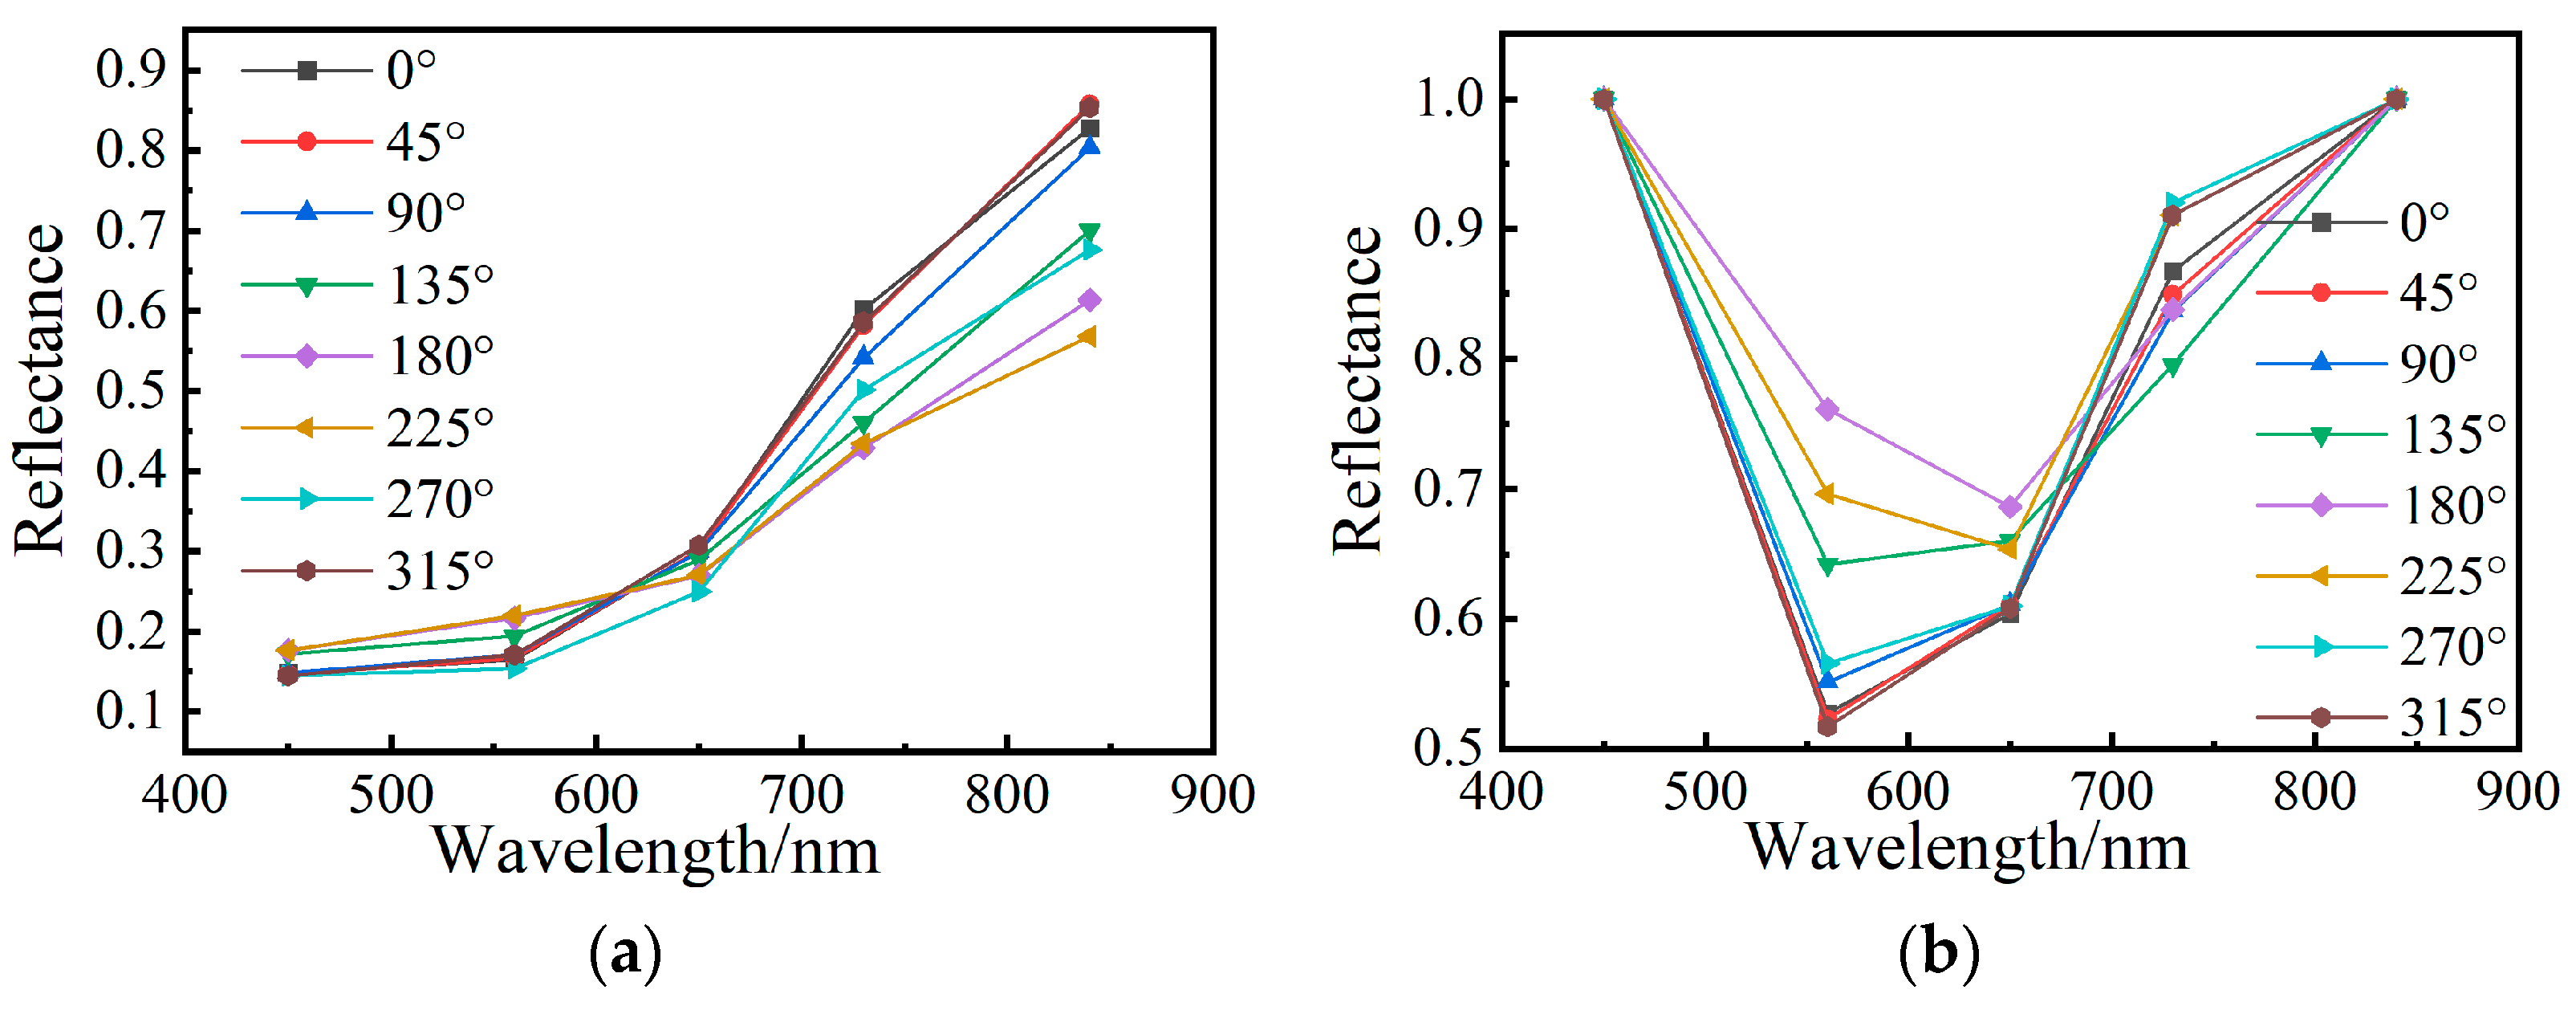
The original average spectral reflectance curve of jujube fruit and the average spectral reflectance curve after continuum removal at various relative azimuth angles are illustrated in Figure 5. The waveform trends of the multispectral curve were generally similar for different relative azimuth angles, with the spectral reflectances of the 550 nm, 730 nm, and 840 nm bands being the most significantly influenced by the angle. After continuum removal, the difference in spectral data at each relative azimuth angle was large, especially the reflectance corresponding to the middle three wavelengths.
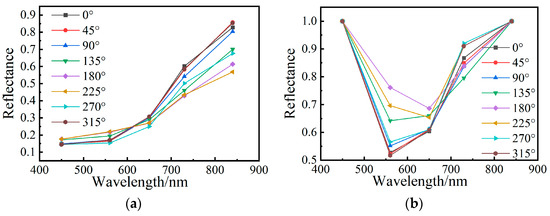
Figure 5.
Spectral curves of jujube fruit under different azimuth angles. (a) Jujube fruit original reflectance; (b) Reflectance after continuum removal.
3.2. The Influence of Relative Azimuth Angle on the Prediction Results
The acquired multispectral reflectance is influenced by the relative azimuth angle. To investigate the impact of spectral reflectance obtained at different relative azimuth angles on prediction results, multispectral data were collected at 0°, 45°, 90°, 135°, 180°, 225°, 270°, and 315°. Using these data, prediction models were constructed using PLS and SVM. The models were then compared and analyzed.
3.2.1. The Influence of Relative Azimuth Angle on MC Prediction Results
Table 3 presents the results of the MC prediction model using multispectral data at different relative azimuth angles. The best modeling effect was observed at an azimuth angle of 90° in both the PLSR and SVM models. For the PLSR model, the correlation coefficient (Rc) of the training set was 0.5798, the root mean square error (RMSEC) of the training set was 2.7122, the correlation coefficient (Rp) of the prediction set was 0.3733, and the root mean square error (RMSEP) of the prediction set was 3.1731. Similarly, for the SVM model, the Rc of the training set was 0.5409, the RMSEC of the training set was 3.2294, the Rp of the prediction set was 0.5036, and the RMSEP of the prediction set was 3.2907.
Table 3.
Prediction results of MC under different relative azimuth angle conditions.
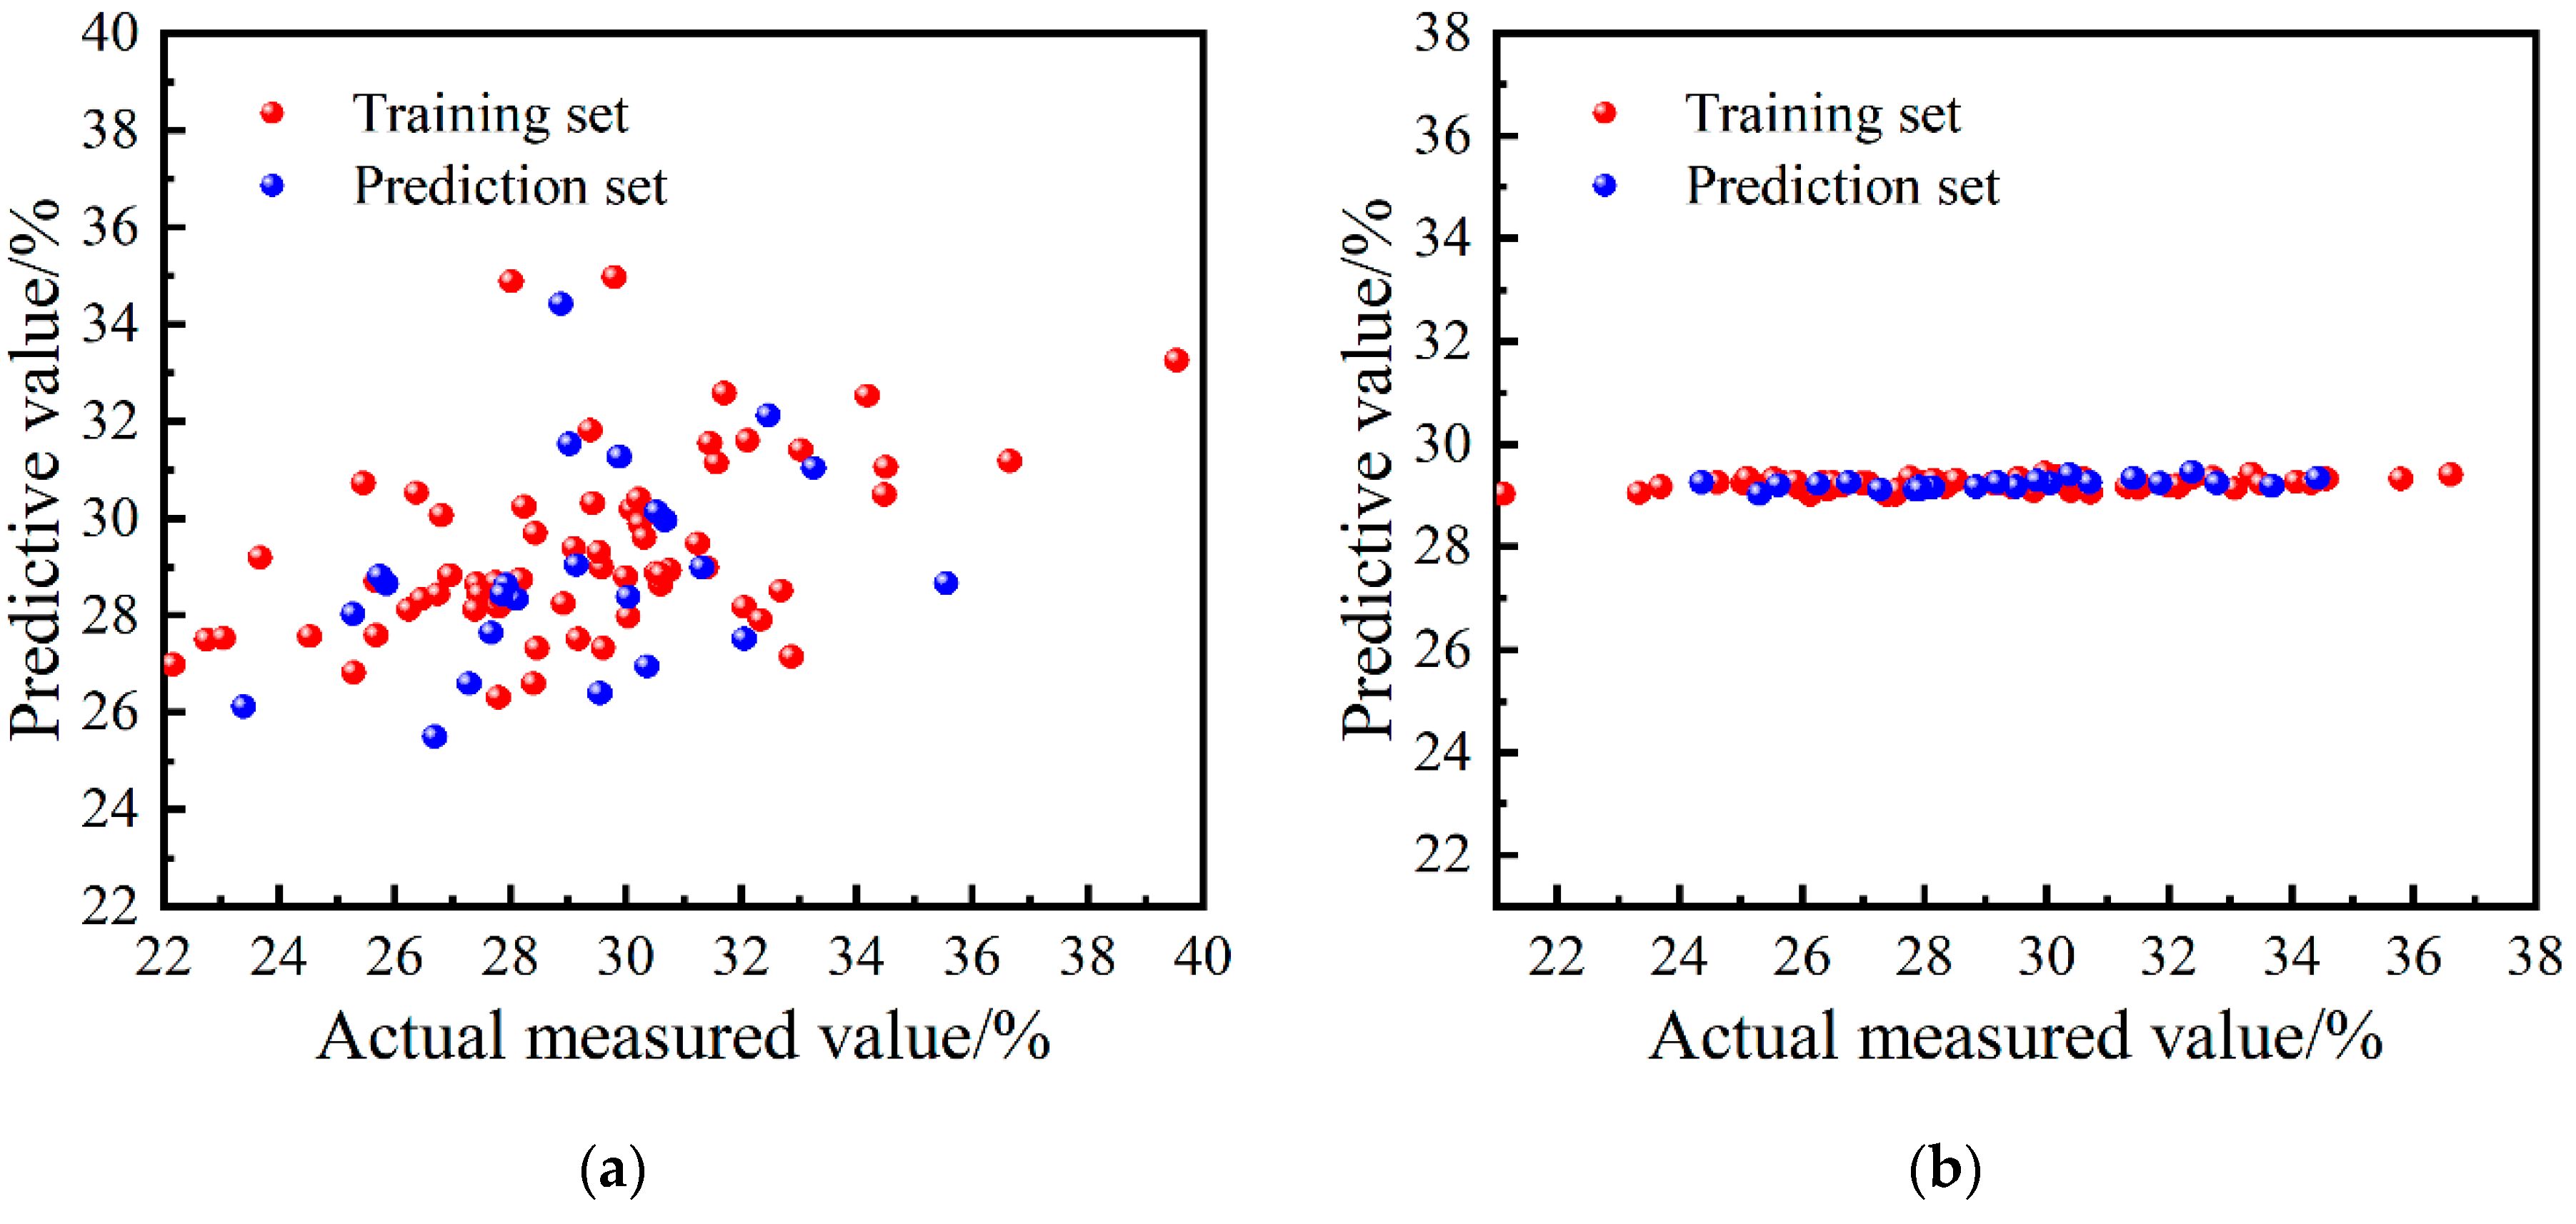
Figure 6 presents the prediction results of the MC of jujube fruit at a relative azimuth angle of 90°. Despite being the optimal angle, the model constructed using PLSR and SVM exhibited low correlation and accuracy. Hence, relying solely on the multispectral data at this specific azimuth angle is insufficient for the quantitative detection of the MC in jujube fruit.
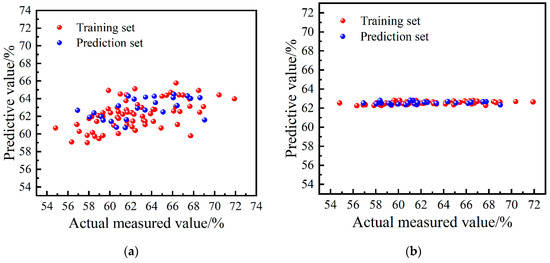
Figure 6.
Prediction results of the MC of jujube fruit when the relative azimuth angle was 90°. (a) PLSR (b) SVM.
3.2.2. The Influence of Relative Azimuth Angle on the Prediction Model of SSC
Table 4 presents the results of the SSC content prediction model using multispectral data at different relative azimuth angles. The best modeling effect was observed at an azimuth angle of 180° in both the PLSR and SVM models. For the PLSR model, the Rc of the training set was 0.4562, the RMSEC of the training set was 2.8416, the Rp of the prediction set was 0.4184, and the RMSEP of the prediction set was 2.5181. Similarly, for the SVM model, the Rc of the training set was 0.4141, the RMSEC of the training set was 3.1531, the Rp of the prediction set was 0.5176, and the RMSEP of the prediction set was 2.6538.
Table 4.
Prediction results of SSC content under different relative azimuth angle conditions.
Figure 7 presents the prediction results of the SSC of jujube fruit at a relative azimuth angle of 180°. Despite being the optimal angle, the model constructed using PLSR and SVM exhibited low correlation and accuracy. Hence, relying solely on the multispectral data at this specific azimuth angle is insufficient for the quantitative detection of the SSC in jujube fruit.

Figure 7.
Prediction results of the SSC of jujube fruit when the relative azimuth angle was 180°. (a) PLSR (b) SVM.
3.3. Establishment and Results of Jujube Fruit Quality Prediction Model Based on Multi-Angle Fusion
Since the UAV multispectral camera only has 5 bands, full-band modeling is used as the input of the model. The spectral reflectance data (5 characteristic variables) obtained based on a single relative azimuth angle and the spectral reflectance data (40 characteristic variables) obtained based on 8 relative azimuth angles were used as the input of the prediction model to compare the prediction results.
As shown in Table 5, when using spectral reflectance data obtained at 8 relative azimuth angles as model input, both the PLS and SVM models showed a significant improvement compared to using data from a single relative azimuth angle. Among the MC prediction models, the model built using PLS demonstrated superior prediction results. The Rc of the training set was 0.9067, the RMSEC of the training set was 1.5510, the Rp of the prediction set was 0.8072, and the RMSEP of the prediction set was 1.9935. Among the SSC content prediction models, the model built using SVM demonstrated superior prediction results. The Rc of the training set was 0.8624, the RMSEC of the training set was 1.6586, the Rp of the prediction set was 0.7663, and the RMSEP of the prediction set was 1.8501.
Table 5.
Prediction model results based on single feature angle and multi-angle fusion.
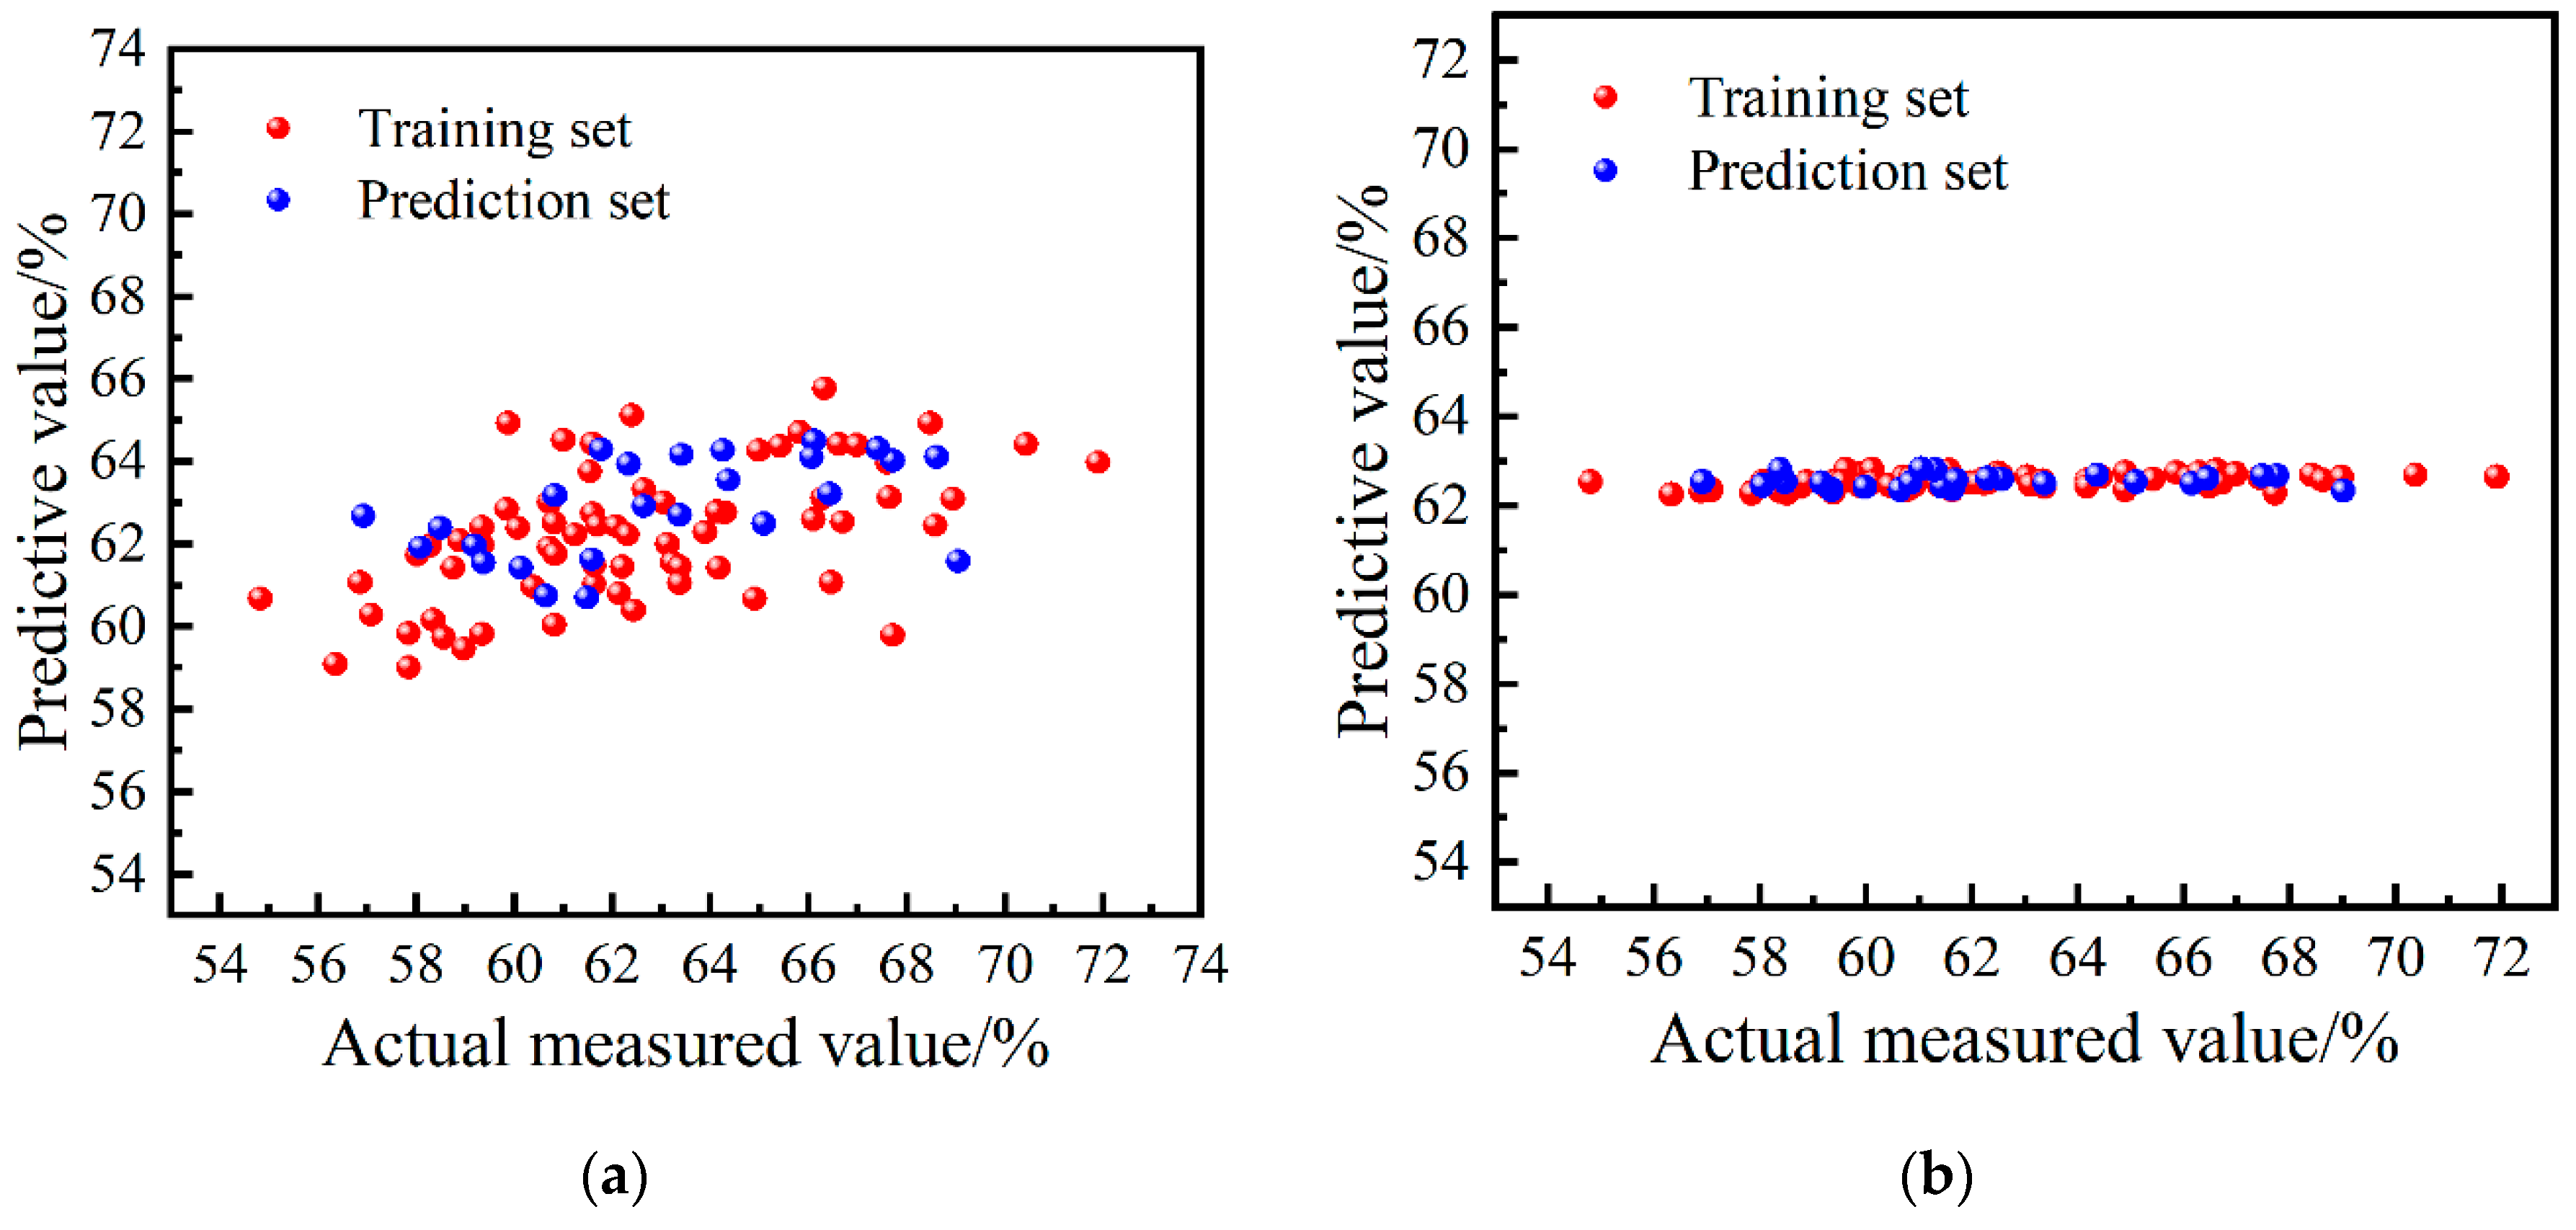
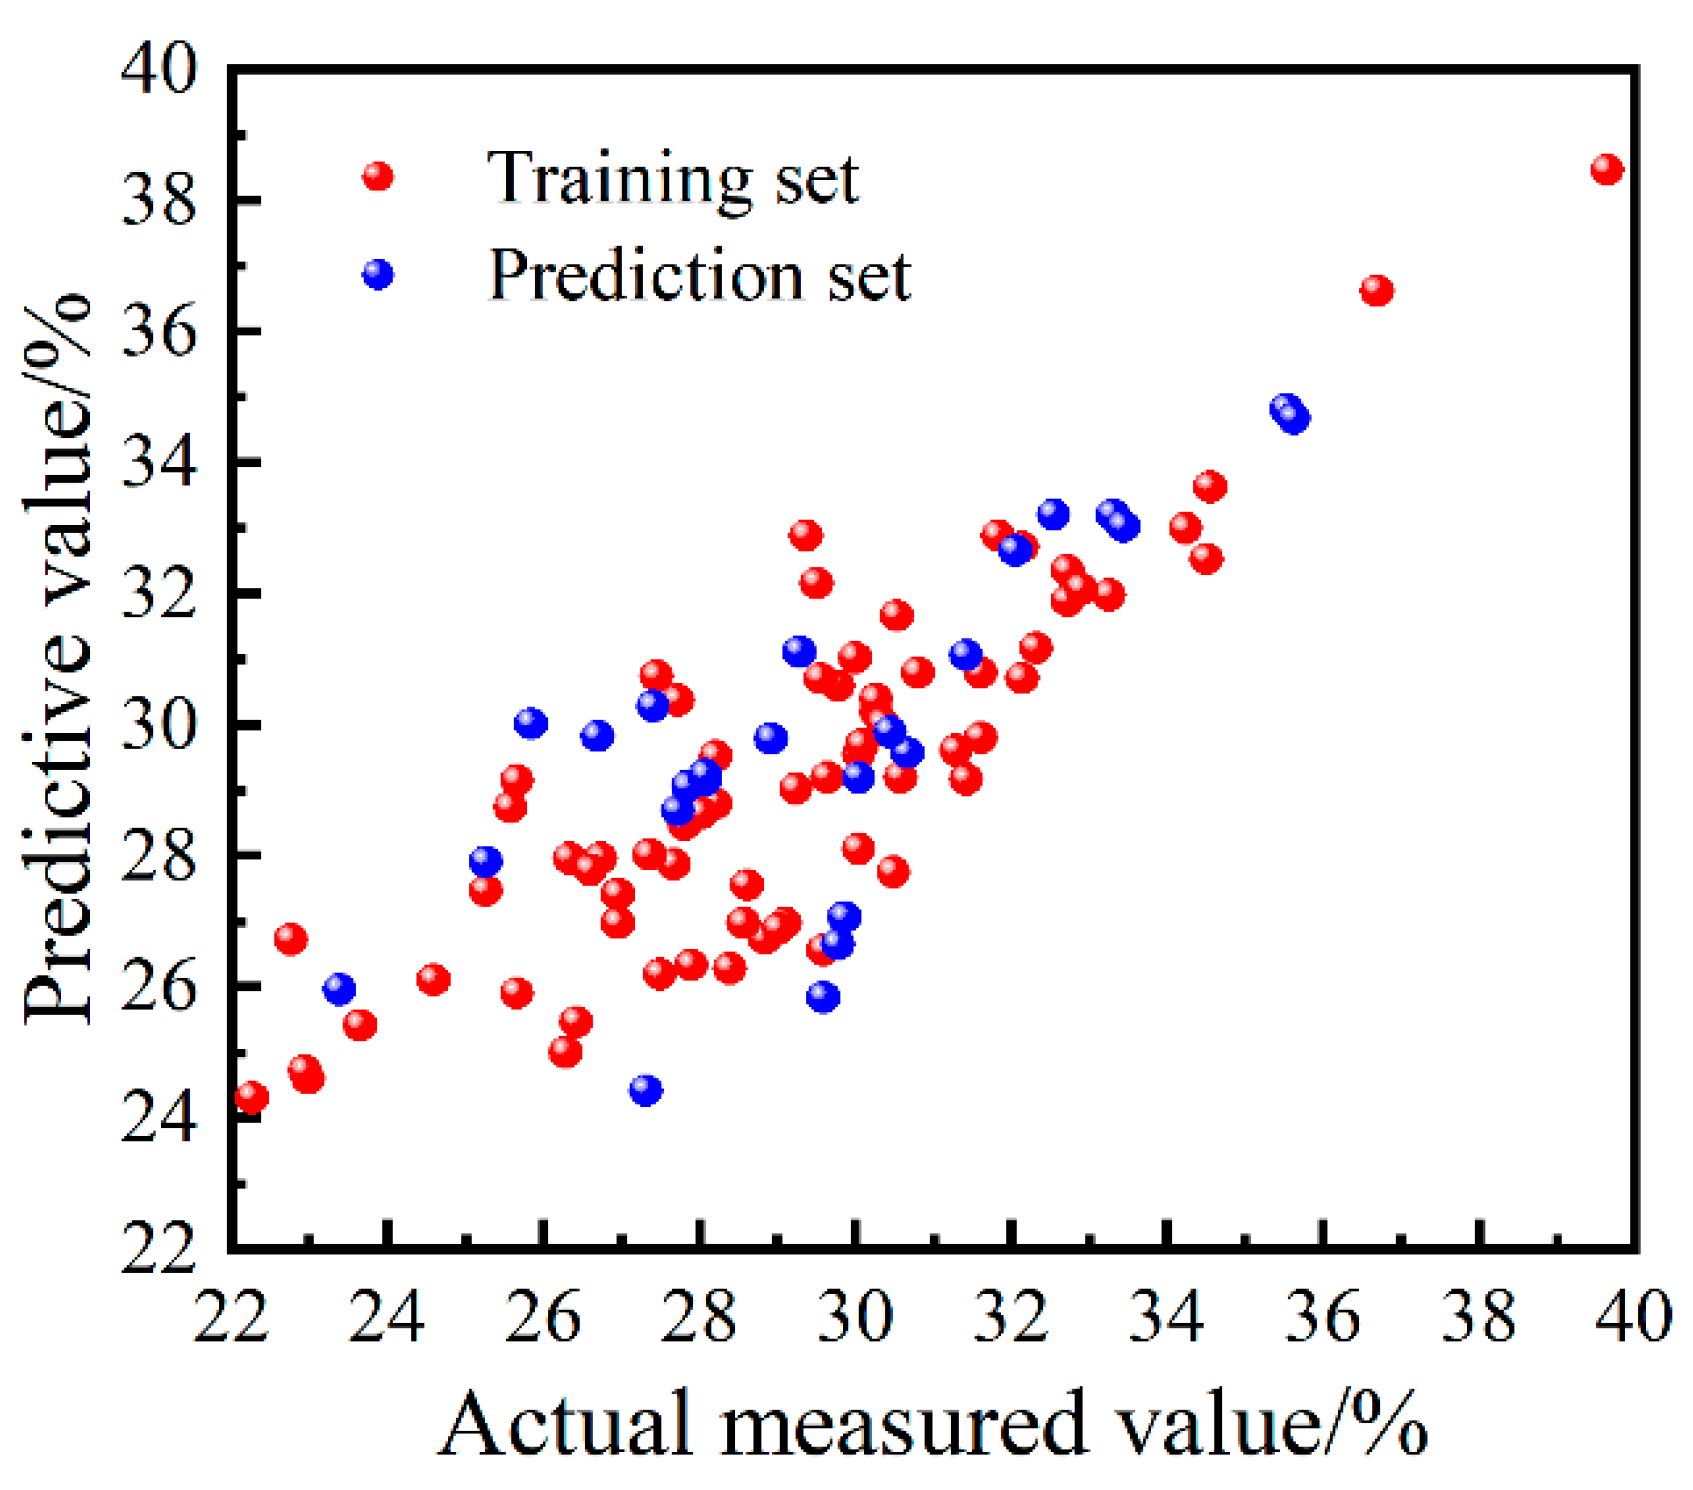
Figure 8 and Figure 9 present the prediction results of models constructed using PLSR and SVM, respectively. These models utilized multispectral data at 8 relative azimuth angles as input. In comparison to Figure 7, the accuracy of these two models exhibited significant improvement. The distribution of sample points showed a close-to-linear relationship, indicating a good quantitative detection effect for the MC and SSC of jujube fruit.
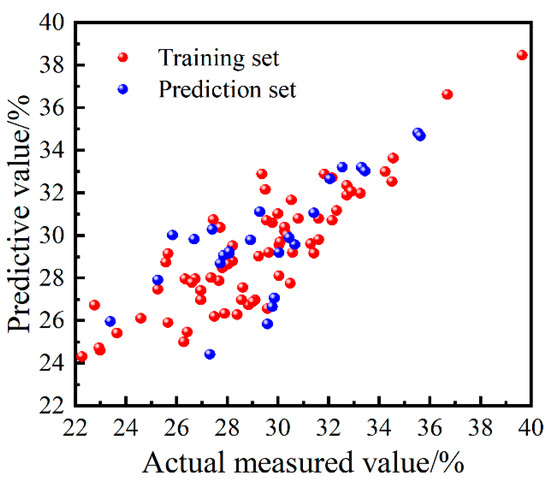
Figure 8.
MC prediction results of the optimal prediction model.
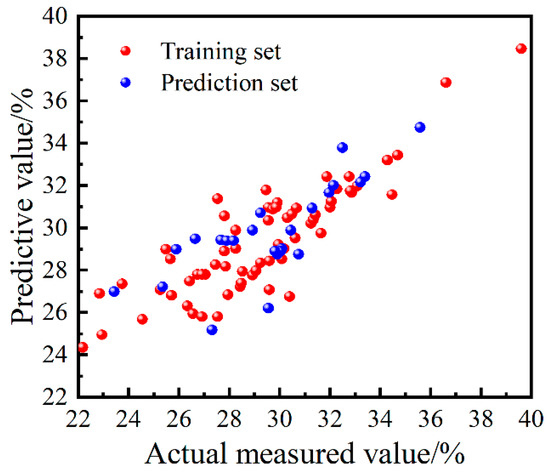
Figure 9.
SSC prediction results of the optimal prediction model.
4. Discussion
UAV multispectral technology plays a crucial role in efficiently gathering extensive data on jujube fruit. Multispectral data of jujube fruit show a strong correlation with quality parameters like moisture content and soluble solids content. Previous research on fruit quality often utilized a single relative azimuth angle to collect multispectral data, resulting in low-dimensional input variables for prediction models [24]. For instance, Marin et al. [37] studied the ripeness of Moriche palm fruit using UAV-based multispectral images, tracking changes in reflectance at various wavelengths across the phenological cycle. Similarly, Arapostathi et al. [38] estimated the yield of a single apple tree using UAV multispectral technology, all while focusing on spectral data acquired at a single relative azimuth angle. In contrast, this study collected multispectral data from multiple relative azimuth angles, increasing the dimensionality of input variables and ultimately enhancing the accuracy of the prediction models’ results.
This study employed a UAV multispectral camera to capture multispectral data of jujube fruit at different relative azimuth angles. The purpose was to predict the MC and SSC. The results indicated that the characteristic azimuth angles for predicting MC and SSC were distinct, with 90° being optimal for the former and 180° for the latter. Subsequently, the multispectral data based on the characteristic azimuth angle and the multispectral data based on 8 relative azimuth angles were separately used as inputs to detect the MC and SSC of the jujube fruit. A comparison of the two methods showed that the latter method yielded significantly better results. The latter method consistently achieved an Rc greater than 0.85 and an Rp greater than 0.70. In comparison to previous studies that relied on a single relative orientation angle for the quantitative detection of agricultural products or crops, this method demonstrated a substantial improvement in detection effectiveness. Therefore, it is expected that this method will find valuable applications in the field of quantitative detection of crops or agricultural products in orchard scenes. The optimal relative azimuth angles obtained may vary due to factors such as the placement of jujube fruits and the solar elevation angle. This study demonstrates that data collected under different relative azimuth angles can have varying impacts on the models’ accuracy contribution.
This study also demonstrated that while multispectral data at a single relative azimuth angle did not significantly enhance the accuracy of predicting MC and SSC, utilizing multispectral data at multiple relative azimuth angles simultaneously improved the models. The combined contributions of these angles led to better results. Consequently, in future research, it may be possible to substitute costly hyperspectral cameras with more affordable multispectral cameras for more accurate quantitative detection of crop or agricultural product quality in orchard scenes.
5. Conclusions
The purpose of this study was to determine whether data based on multiple relative azimuth angles can improve the accuracy of prediction models for soluble solids content and moisture content of jujube fruit. The results of this study indicate that data at different relative azimuth angles have different effects on model recognition accuracy and that using multispectral data at multiple relative azimuth angles as input yielded better predictions for the MC and SSC of jujube fruit compared to using multispectral data at a single relative azimuth angle as input. This study provides us with a way to improve model accuracy in UAV multispectral detection technology. The assessment of jujube fruit quality should not solely rely on MC and SSC. Future research should investigate the predictive capabilities of this method on additional indicators like hardness and vitamin C.
Author Contributions
Conceptualization, X.M. and H.L.; methodology, C.W.; software, C.W. and X.M.; validation, G.G. and H.L.; formal analysis, G.G.; investigation, X.M.; resources, H.L.; data curation, C.W.; writing—original draft preparation, C.W. and X.M.; writing—review and editing, X.M. and G.G.; visualization, X.M.; supervision, H.L. and C.W.; project administration, H.L. and X.M.; funding acquisition, X.M. and G.G. All authors have read and agreed to the published version of the manuscript.
Funding
This work was supported by the Open Project of Xinjiang Production & Construction Corps Key Laboratory of Protection and Utilization of Biological Resources in Tarim Basin (BRYB2303), the National Natural Science Foundation of China (11964030), Tarim University President’s Fund Project (TDZKSS202306), and the Open Project of Key Laboratory of Modern Agricultural Engineering in Colleges and Universities of the Department of Education of the Autonomous Region (TDNG2021201).
Institutional Review Board Statement
Not applicable.
Informed Consent Statement
Not applicable.
Data Availability Statement
The data presented in this study are available on request from the corresponding author.
Acknowledgments
The authors sincerely thank the anonymous reviewers for their critical comments and suggestions for improving the manuscript.
Conflicts of Interest
The authors declare no conflicts of interest.
References
- Ma, B.; Yan, J.; Wang, L.; Jiang, H. Method for Detection and Skeleton of Pruning Branch of Jujube Tree Based on Semantic Segmentation for Dormant Pruning. Trans. Chin. Soc. Agr. Mach. 2022, 53, 313–319. [Google Scholar]
- Wu, Z.; Zhang, S.; Liu, L.; Wang, L.; Ban, Z. The Grade of Dried Jujube (Ziziphus jujuba Mill. cv. Junzao) Affects Its Quality Attributes, Antioxidant Activity, and Volatile Aroma Components. Foods 2023, 12, 989. [Google Scholar] [CrossRef] [PubMed]
- Yao, Y.-N.; Ma, K.; Zhu, J.F.; Huang, F.; Kuang, L.; Wang, X.J.; Li, S. Non-destructive determination of soluble solids content in intact apples using a self-made portable NIR diffuse reflectance instrument. Infrared Phys. Technol. 2023, 132, 104714. [Google Scholar] [CrossRef]
- Cao, Y.X.; Yao, X.D.; Zang, Y.Z.; Niu, Y.B.; Xiao, H.W.; Liu, H.; Zhu, R.G.; Zheng, X.; Wang, Q.; Zhang, X.; et al. Real-time monitoring system for quality monitoring of jujube slice during drying process. Int. J. Agric. Biol. Eng. 2022, 15, 234–241. [Google Scholar] [CrossRef]
- Hao, Y.; Du, J.; Zhang, S.; Wang, Q. Research on Construction of Visible-Near Infrared Spectroscopy Analysis Model for Sol-uble Solid Content in Different Colors of Jujube. Spectrosc. Spect. Anal. 2021, 41, 3385–3391. [Google Scholar]
- Gallardo-Salazar, J.L.; Carrillo-Aguilar, D.M.; Pompa-García, M.; Aguirre-Salado, C.A. Multispectral indices and individual-tree level attributes explain forest productivity in a pine clonal orchard of Northern Mexico. Geocarto Int. 2022, 37, 4441–4453. [Google Scholar] [CrossRef]
- Martinez-Casasnovas, J.A.; Sandonis-Pozo, L.; Escola, A.; Arno, J.; Llorens, J. Delineation of Management Zones in Hedge-row Almond Orchards Based on Vegetation Indices from UAV Images Validated by LiDAR-Derived Canopy Parameters. Agronomy 2022, 12, 102. [Google Scholar] [CrossRef]
- Lima, F.; Blanco-Sepúlveda, R.; Gómez-Moreno, M.L.; Dorado, J.; Peña, J.M. Mapping tillage direction and contour farming by object-based analysis of UAV images. Comput. Electron. Agric. 2021, 187, 106281. [Google Scholar] [CrossRef]
- Vandermaesen, J.; Delalieux, S.; Bylemans, D.; Remy, S. Variable rate irrigation based on UAV imagery and real-time sensor data in pear orchards. In Proceedings of the 13th European Conference on Precision Agriculture (ECPA), Budapest, Hungary, 19–22 July 2021. [Google Scholar]
- Chen, R.Q.; Zhang, C.J.; Xu, B.; Zhu, Y.H.; Zhao, F.; Han, S.Y.; Yang, G.J.; Yang, H. Predicting individual apple tree yield using UAV multi-source remote sensing data and ensemble learning. Comput. Electron. Agric. 2022, 201, 107275. [Google Scholar] [CrossRef]
- Sun, G.X.; Wang, X.C.; Yang, H.H.; Zhang, X.J. A Canopy Information Measurement Method for Modern Standardized Ap-ple Orchards Based on UAV Multimodal Information. Sensors 2020, 20, 2985. [Google Scholar] [CrossRef]
- Bulanon, D.M.; Lonai, J.; Skovgard, H.; Fallahi, E. Evaluation of Different Irrigation Methods for an Apple Orchard Using an Aerial Imaging System. ISPRS Int. J. Geo-Inf. 2016, 5, 79. [Google Scholar] [CrossRef]
- Sandonís-Pozo, L.; Llorens, J.; Escolà, A.; Arnó, J.; Pascual, M.; Martínez-Casasnovas, J.A. Satellite multispectral indices to estimate canopy parameters and within-field management zones in super-intensive almond orchards. Precis. Agric. 2022, 23, 2040–2062. [Google Scholar] [CrossRef]
- Park, S.; Ryu, D.; Fuentes, S.; Chung, H.; O’connell, M.; Kim, J. Mapping Very-High-Resolution Evapotranspiration from Unmanned Aerial Vehicle (UAV) Imagery. ISPRS Int. J. Geo-Inf. 2021, 10, 211. [Google Scholar] [CrossRef]
- Santos-Rufo, A.; Mesas-Carrascosa, F.J.; Garcia-Ferrer, A.; Merono-Larriva, J.E. Wavelength Selection Method Based on Par-tial Least Square from Hyperspectral Unmanned Aerial Vehicle Orthomosaic of Irrigated Olive Orchards. Remote Sens. 2020, 12, 3426. [Google Scholar] [CrossRef]
- DadrasJavan, F.; Samadzadegan, F.; Pourazar, S.H.S.; Fazeli, H. UAV-based multispectral imagery for fast Citrus Greening detection. J. Plant Dis. Prot. 2019, 126, 307–318. [Google Scholar] [CrossRef]
- Lan, Y.B.; Huang, Z.X.; Deng, X.L.; Zhu, Z.H.; Huang, H.S.; Zheng, Z.; Lian, B.; Zeng, G.; Tong, Z.J. Comparison of machine learning methods for citrus greening detection on UAV multispectral images. Comput. Electron. Agric. 2020, 171, 105234. [Google Scholar] [CrossRef]
- Sun, G.Z.; Hu, T.T.; Chen, S.H.; Sun, J.X.; Zhang, J.; Ye, R.; Zhang, S.; Liu, J. Using UAV-based multispectral remote sensing imagery combined with DRIS method to diagnose leaf nitrogen nutrition status in a fertigated apple orchard. Precis. Agric. 2023, 24, 2522–2548. [Google Scholar] [CrossRef]
- Peng, X.L.; Chen, D.Y.; Zhou, Z.J.; Zhang, Z.T.; Xu, C.; Zha, Q.; Hu, X.T. Prediction of the Nitrogen, Phosphorus and Potas-sium Contents in Grape Leaves at Different Growth Stages Based on UAV Multispectral Remote Sensing. Remote Sens. 2022, 14, 2659. [Google Scholar] [CrossRef]
- Guan, Y.Y.; Grote, K.; Schott, J.; Leverett, K. Prediction of Soil Water Content and Electrical Conductivity Using Random Forest Methods with UAV Multispectral and Ground-Coupled Geophysical Data. Remote Sens. 2022, 14, 1023. [Google Scholar] [CrossRef]
- Pineda, D.; Perez, J.; Gaviria, D.; Ospino-Villalba, K.; Camargo, O. MEDUSA: An open-source and webcam based multispec-tral imaging system. Hardwarex 2022, 11, e00282. [Google Scholar] [CrossRef]
- Zahiri, Z.; Laefer, D.F.; Kurz, T.; Buckley, S.; Gowen, A. A comparison of ground-based hyperspectral imaging and red-edge multispectral imaging for façade material classification. Autom. Constr. 2022, 136, 104164. [Google Scholar] [CrossRef]
- Bleasdale, A.J.; Blackburn, G.A.; Whyatt, J.D. Feasibility of detecting apple scab infections using low-cost sensors and inter-preting radiation interactions with scab lesions. Int. J. Remote Sens. 2022, 43, 4984–5005. [Google Scholar] [CrossRef]
- Zhao, X.L.; Peng, Y.K.; Li, Y.Y.; Wang, Y.L.; Li, Y.; Chen, Y.H. Intelligent micro flight sensing system for detecting the internal and external quality of apples on the tree. Comput. Electron. Agric. 2023, 204, 107571. [Google Scholar] [CrossRef]
- Liu, J.K.; Zhu, Y.J.; Tao, X.Y.; Chen, X.F.; Li, X.W. Rapid prediction of winter wheat yield and nitrogen use efficiency using consumer-grade unmanned aerial vehicles multispectral imagery. Front. Plant Sci. 2022, 13, 1032170. [Google Scholar] [CrossRef] [PubMed]
- Huang, F.; Chen, Y.T.; Wang, X.S.; Wang, S.; Wu, X.Y. Spectral Clustering Super-Resolution Imaging Based on Multispectral Camera Array. IEEE Trans. Image Process. 2023, 32, 1257–1271. [Google Scholar] [CrossRef] [PubMed]
- Jhan, J.P.; Rau, J.Y. A Generalized Tool for Accurate and Efficient Image Registration of UAV Multi-lens Multispectral Cam-eras by N-SURF Matching. IEEE J.-Stars 2021, 14, 6353–6362. [Google Scholar]
- Meng, L.X.; Zhou, J.; Liu, S.M.; Ding, L.R.; Zhang, J.R.; Wang, S.F.; Lei, T.J. Investigation and evaluation of algorithms for unmanned aerial vehicle multispectral image registration. Int. J. Appl. Earth Obs. Geoinf. 2021, 102, 102403. [Google Scholar] [CrossRef]
- Nawara, T.J.; Williams, Y.D.; Rao, T.C.; Hu, Y.S.; Sztul, E.; Salaita, K.; Mattheyses, A.L. Imaging vesicle formation dynamics supports the flexible model of clathrin-mediated endocytosis. Nat. Commun. 2022, 13, 1732. [Google Scholar] [CrossRef] [PubMed]
- Bal, A.; Palus, H. A Smooth Non-Iterative Local Polynomial (SNILP) Model of Image Vignetting. Sensors 2021, 21, 7086. [Google Scholar] [CrossRef]
- Wang, Y.K.; Gu, Y.F.; Li, X.M. A Novel Low Rank Smooth Flat-Field Correction Algorithm for Hyperspectral Microscopy Imaging. IEEE Trans. Med. Imaging 2022, 41, 3862–3872. [Google Scholar] [CrossRef]
- Zhang, Y.B.; Zhu, D.D.; Chen, Y.; Liu, Z.; Duan, W.B.; Li, S.H. Wavelength Selection Method of Algal Fluorescence Spectrum Based on Convex Point Extraction From Feature Region. Spectrosc. Spectr. Anal. 2022, 42, 3031–3038. [Google Scholar]
- Basile, T.; Marsico, A.D.; Perniola, R. Use of Artificial Neural Networks and NIR Spectroscopy for Non-Destructive Grape Texture Prediction. Foods 2022, 11, 281. [Google Scholar] [CrossRef] [PubMed]
- Benelli, A.; Cevoli, C.; Ragni, L.; Fabbri, A. In-field and non-destructive monitoring of grapes maturity by hyperspectral imag-ing. Biosyst. Eng. 2021, 207, 59–67. [Google Scholar] [CrossRef]
- Li, Y. Rapid Quality Discrimination of Grape Seed Oil Using an Extreme Machine Learning Approach with Near-Infrared (NIR) Spectroscopy. Spectroscopy 2021, 36, 14–20. [Google Scholar]
- Ye, W.X.; Yan, T.Y.; Zhang, C.; Duan, L.; Chen, W.; Song, H. Detection of Pesticide Residue Level in Grape Using Hyperspec-tral Imaging with Machine Learning. Foods 2022, 11, 1609. [Google Scholar] [CrossRef] [PubMed]
- Marin, W.; Mondragon, I.F.; Colorado, J.D. Aerial Identification of Fruit Maturity in Amazonian Palms via Plant-Canopy Modeling. Remote. Sens. 2023, 15, 3752. [Google Scholar] [CrossRef]
- Arapostathi, E.; Panopoulou, C.; Antonopoulos, A.; Katsileros, A.; Karellas, K.; Dimopoulos, C.; Tsagkarakis, A. Early Detec-tion of Potential Infestation by Capnodis tenebrionis (L.) (Coleoptera: Buprestidae), in Stone and Pome Fruit Orchards, Using Multispectral Data from a UAV. Agronomy 2024, 14, 20. [Google Scholar] [CrossRef]

Disclaimer/Publisher’s Note: The statements, opinions and data contained in all publications are solely those of the individual author(s) and contributor(s) and not of MDPI and/or the editor(s). MDPI and/or the editor(s) disclaim responsibility for any injury to people or property resulting from any ideas, methods, instructions or products referred to in the content. |
© 2024 by the authors. Licensee MDPI, Basel, Switzerland. This article is an open access article distributed under the terms and conditions of the Creative Commons Attribution (CC BY) license (https://creativecommons.org/licenses/by/4.0/).