Article

Dynamic Stability Finite Difference Time Domain Analysis of Landfill Based on Hypergravity Test

1
Moe Key Laboratory of Soft Soils and Geoenvironmental Engineering, Department of Civil Engineering, Zhejiang University, Hangzhou 310058, China
2
Center for Hypergravity Experiment and Interdisciplinary Research, Zhejiang University, Hangzhou 310058, China
*
Author to whom correspondence should be addressed.
Appl. Sci. 2024, 14(7), 3006; https://doi.org/10.3390/app14073006
Submission received: 13 December 2023 / Revised: 8 March 2024 / Accepted: 26 March 2024 / Published: 3 April 2024
(This article belongs to the Special Issue Advanced Research in Seismic Monitoring and Activity Analysis)

Abstract

:
Earthquakes impact the stability of municipal solid waste (MSW) landfills, especially those with high water levels, and may further lead to disastrous landslides. Numerical analysis offers an efficient and cost-effective way to study the seismic stability of a landfill. In this study, the finite difference nonlinear analysis method was employed to meticulously evaluate the dynamic response of landfills under varying water levels and seismic intensities. The analysis was guided by the seismic instability and centrifuge test outcomes. The rationality of the computational model was verified by examining the responses of acceleration and pore pressure. Subsequently, the time history curve of the dynamic safety factor was derived from the dynamic response of landfills. The results indicated that a landfill was more susceptible to large earthquake effects, and its stability decreased as the water level rose, with the safety factor decreasing to a critical point under the coupling effect of strong earthquakes and high water levels. In contrast, the stability of the landfill with low water levels was good under weak earthquake conditions, with only a slight decrease in the safety factor observed. The seismic stability of a landfill was significantly influenced by both accumulative deformation and negative excess pore pressure. A certain degree of hysteresis in the landfill’s instability was also observed compared to the earthquake loading process. The time history curve of the safety factor can offer a comprehensive insight into seismic stability under diverse conditions. Additionally, future research efforts are needed to better determine the values of strength parameters of MSW in seismic analysis.

1. Introduction

Landfills globally serve as an important method for disposing of municipal solid waste (MSW), typically characterized by leachate within them. Due to the significant proportion of food waste in MSW, landfills in China generally have higher leachate levels compared to those in other countries or regions [1,2,3,4,5]. A study has pointed out that the failure of a landfill correlates with the increase in leachate levels [6]. Furthermore, research has shown that earthquakes can trigger landslide disasters, and landfills as artificial slopes can also be affected by earthquakes [7]. The stability of landfills in China has been threatened by earthquake activities. A failure in the slope of a landfill could be geotechnically and environmentally disastrous. For instance, landslides at the Leuwigajah dumpsite and the Payatas landfill resulted in the destruction of numerous residential houses, claimed the lives of hundreds of people, and caused severe pollution to the local environment [8,9]. Therefore, the seismic stability of landfills with high water levels has become a major concern in China.
Laboratory tests and field measurements are essential for comprehending the dynamic properties of MSW. Several studies have revealed the strain-hardening behavior of MSW [10,11], which complicates the determination of strength parameters. Furthermore, this behavior often makes it challenging to observe an obvious failure in MSW. Studies have also uncovered a reduction in dynamic shear modulus with the development of strain in MSW [11,12,13,14]. The property is crucial when analyzing a landfill’s seismic stability. Nevertheless, these tests are not enough to investigate the seismic stability of a landfill.
Currently, the centrifuge test has become a popular approach for studying the seismic stability of landfills. Using centrifuge tests, many scholars have conducted research on the dynamic response or stability of MSW landfills, owing to the fact that the prototype stress field of a landfill can be restored in centrifuge tests. Peng [15] studied the displacement and acceleration response of landfills under unidirectional and bidirectional seismic waves through shaking table tests under hypergravity conditions, revealing that the water level within a landfill greatly impacted its stability. Kavazanjian and Gutierrez [16] studied the response of landfills with different slopes under different sizes of seismic actions and obtained the relative displacement time history between the bottom of the landfill and the bedrock. Li [11] studied the influence of a slope gradient, leachate water level, and seismic intensity on the stability of landfills using double-sided slope models. His work yielded insights into pore pressure response, settlement at the top of the landfill slope, deformation patterns and modes of potential instability failure of the slope under earthquakes, and suggested that instability of landfills occurred when the water level is high and the earthquake is strong. The research conducted by Thusyanthan et al. [17] overlooked the influence of leachate; thus, no significant instability or failure phenomenon in the landfill was observed during their experimental process. Sarmah et al. [18] studied the failure behavior of a landfill slope with and without fibers using a centrifuge shaking table and found that fibers mainly provide slope stability. Overall, few experimental studies have investigated the impact of dynamic pore pressure response within a landfill on its stability during seismic activities. And centrifuge model tests considering the influence of water level and seismic intensity have not been validated yet.
Although centrifuge tests can be applied to investigate the seismic stability of a landfill, factors such as the high cost of centrifuge tests and the limited availability of experimental equipment make it inconvenient for scholars or engineers to conduct a large number of model tests. Additional studies concerning the seismic analysis of landfills often relied on numerical analysis. Conventional analysis methods for assessing the seismic stability of dams or slopes are not directly applicable to landfills, given their unique characteristics. During earthquake activities, MSW may experience large-scale plastic yielding and plastic flow, which can increase the possibility of landslides or even flow slides in the landfill [11]. Additionally, a composite liner system, installed at the bottom of a landfill, consists of both a drainage system, typically composed of sand, and an anti-seepage system, comprising geotextiles, geomembranes, and clay layers. This composite system plays a vital role in preventing pollution by effectively containing and managing leachate. Nevertheless, it is important to note that the presence of such a liner system makes a landfill prone to sliding along its bottom liner [19]. Pseudo-static analysis has been applied to study the failure of landfills under seismic force [20,21]. However, the seismic coefficient primarily influences the value of the safety factor, and the dynamic response cannot be obtained when taking this approach. Bray and Rathje [15] pointed out significant differences in the dynamic characteristics of MSW and stated that nonlinear analysis methods should be used for the dynamic response analysis of a landfill. In their later work [22], the nonlinear analysis was incorporated into the analysis of seismic stability using Newmark’s sliding block analysis. Newmark’s method relies on the estimated deformation of a landfill to assess its seismic stability and fails to present the dynamic response of a landfill. Hence, traditional methods such as pseudo-static analysis and Newmark’s sliding block analysis are limited in studying the seismic stability of landfills. In recent years, some advanced numerical approaches, such as the finite element method (FEM) and finite difference method (FDM), have been employed to investigate the response and stability of landfills during seismic activities. Using the finite element method, equivalent linear analysis has been applied in many studies to investigate the seismic response of landfills [23,24,25,26]. Yet, the equivalent linear model was considered unsuitable for cases where the acceleration exceeds 0.4 g [27]. Yu and Rowe [28] adopted a nonlinear dynamic response analysis and used the ideal elastoplastic constitutive model and Mohr–Coulomb yield criterion to reflect the mechanical characteristics of bedrock and used the modified Cambridge model to reflect the mechanical characteristics of artificial solid waste. Their results obtained in FDM analysis using FLAC software were in good agreement with the measured data, suggesting that nonlinear analysis using the finite difference method could be considered reliable for analyzing the dynamic stability of landfills. Unfortunately, the study neglected to consider pore pressure within landfills, which is a critical factor influencing their dynamic stability. Feng and Chang [29] conducted the finite element analysis to investigate the seismic response of landfills, treating MSW as a mixture of solid and liquid components and considering the nonlinearity of material and contact. In their work, permanent displacement was utilized to assess the seismic stability of landfills. Even though the response of pore pressure within a landfill can be obtained in their study, it did not match well with the data of centrifuge tests. Moreover, the study neglected to build a relationship between the pore pressure response and the seismic stability of landfills. Therefore, improvements are necessary to better depict the seismic response of pore pressure of a landfill and to make the assessment of the seismic stability of landfills clearer and more effective.
Grounded on prior experimental studies on the analysis of seismic stability of landfills with different water levels, the primary objective of this study is to clearly present the dynamic response of landfills under various water levels and seismic intensities and to provide a more effective approach to analyze the seismic stability of landfills using the finite difference nonlinear analysis method. The secondary objective is to investigate the seismic stability of landfills under different breaking strains based on the provided approach since the strength parameters of MSW are greatly influenced by the breaking strain value. In this study, the finite difference nonlinear analyses are achieved using FLAC3D 6.0 software. Hysteretic damping was applied to the analysis based on the modulus reduction curve. This study provides a basis for the seismic stability assessment and seismic design of landfill slopes.

2. Dynamic Calculation Method for Landfill Based on FLAC3D

The computational analysis of this study is conducted using FLAC3D software, and its calculation method is essentially the finite difference method. The use of tetrahedral calculation elements in the computational analysis can effectively avoid the hourglass problem, where small disturbances during numerical calculations lead to infinite deformation of the element under zero energy dissipation. However, this calculation element cannot meet the deformation requirements in plastic structure analysis. The hybrid discrete theory proposed by Marti and Cundall [30] satisfies the deformation requirements by reducing the number of plastic flow constraints while avoiding the hourglass problem, thus solving this problem well. The hybrid discrete method they proposed first discretizes the structure using polyhedral elements, then further discretizes the obtained polyhedral elements into tetrahedral elements, and finally carries out scientific calculations based on constant strain assumption for tetrahedral elements. FLAC3D finite difference analysis, based on Lagrangian description and continuum mechanics theory, adopts this discretization method, which can better satisfy the deformation needs of model structures while ensuring a certain accuracy.
When employing the modeling, the computational model’s boundary conditions, initial conditions, and body forces are set at the initial time. During static analysis, after the external load is applied, the node velocity, displacement, and position can be solved through the node balance equation (Equation (1)), and then the strain rate tensor and vorticity tensor of the grid cells can be obtained. The control equations are iteratively solved based on the node velocity, position, displacement, strain rate, vorticity, and model initial conditions. When the unbalanced force or unbalanced force ratio tends to zero, the model’s flow field, stress field, and yield failure under the current state can be obtained. The input seismic acceleration, velocity, or stress time history is applied to the specified boundaries in dynamic analysis. The node velocity at any given time is obtained from the previous time step’s velocity and the current node balance equation (Equation (3)), and the displacement, coordinates, strain rate, vorticity, and other information are updated. Similarly, solving the control equations at different time steps can provide dynamic response information at different time steps.
The node balance equation is
F < m > = M < m > d v < m > d t = [ [ T 3 + 1 4 ρ V b ] ] < m > + P < m > , m = 1 , N n o d e .
where <m> represents the node m associated with the grid cell. N n o d e is the number of nodes. [ [ T 3 + 1 4 ρ V b ] ] < m > represents the sum of all components of the constant strain element at node m in the grid cell. P < m > represents the component of external force P at node m.
Correspondingly, M < m > can be expressed as follows:
M < m > = [ [ 1 4 ρ V ] ] < m > , m = 1 , N n o d e .
When considering the influence of damping, the equation becomes:
F < m > + F D < m > = M < m > d v < m > d t , m = 1 , N .
where F D represents the damping force.
The central difference expressions for node velocity, position, and displacement are
v < m > ( t + 1 2 Δ t ) = v < m > ( t 1 2 Δ t ) + F < m > M < m > Δ t , m = 1 , N .
x < m > ( t + Δ t ) = x < m > ( t ) + Δ t v < m > ( t + 1 2 Δ t )
u < m > ( t + Δ t ) = u < m > ( t ) + Δ t v < m > ( t + 1 2 Δ t )
The calculation method for landfills under different water and seismic levels is shown in Figure 1.

3. Establishment of Computational Model

3.1. Model

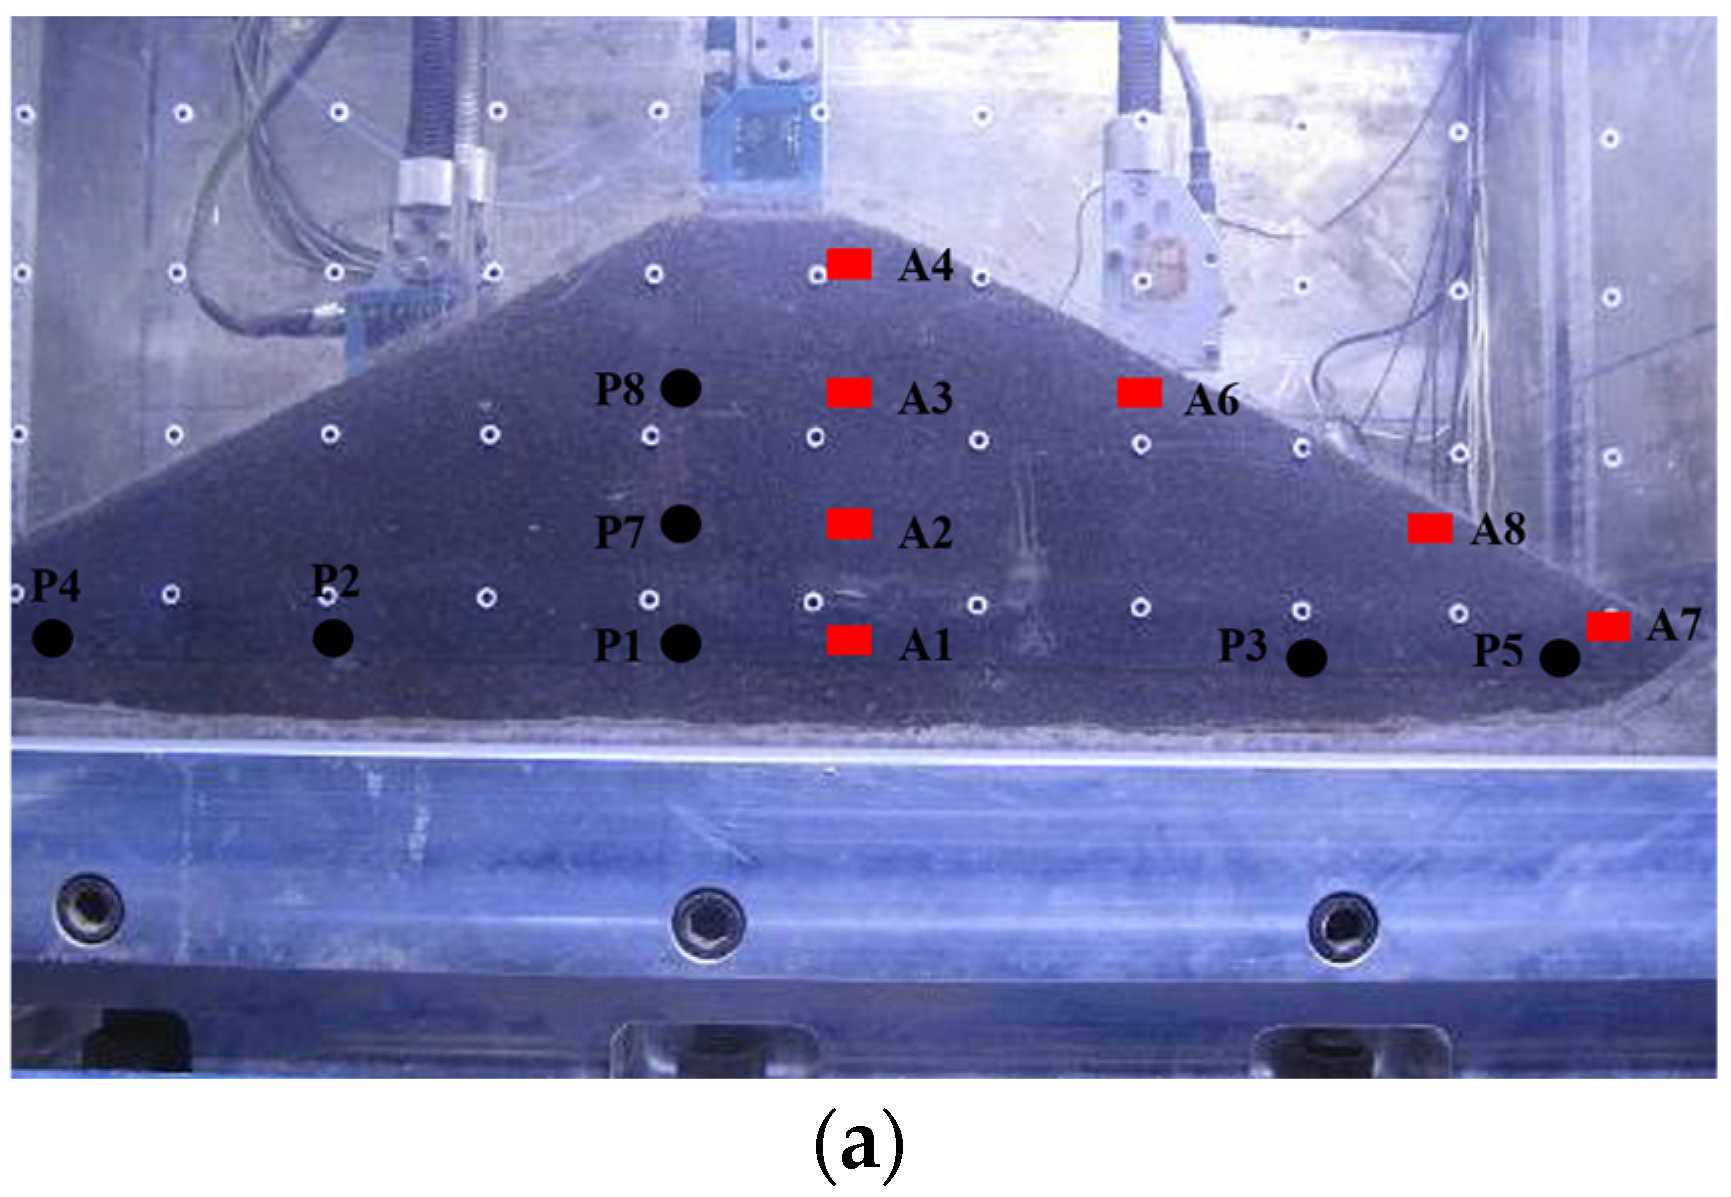
The analysis is based on the centrifugal model shaking table tests conducted by the Geotechnical Institute of Zhejiang University. The test was completed on the ZJU-400 centrifuge shaking table at Zhejiang University. The size of the model box is 770 mm × 400 mm × 530 mm (length × width × height). In order to study the dynamic response of landfill slopes under different water levels, the test was conducted under a gravity acceleration of 50 g. The acceleration, pore pressure, and slope displacement response of the landfill under different water levels and seismic intensities were obtained [11]. The layout of the test model and sensors can be seen in Figure 2a. Among them, P1–P8 are pore pressure gauges and A1–A8 are accelerometers.
The height of the test model heap is 160 mm, the bottom width is 610 mm, and artificial MSW is used [11,31,32]. It is composed of peat: kaolin: quartz sand in a ratio of 1:0.2:0.8. The initial dry density is 633 kg/m3, the initial void ratio is 1.6, and the initial moisture content is 45%. Its physical and mechanical properties are similar to real MSW. The bedrock is made of clay, quartz sand, cement, and water, and the cement content is 37.5%. A HDPE geotextile with a thickness of 0.1 mm is arranged on the top surface of the bedrock, with a single-width tensile stiffness of 7.74 kN/m and a strength of 0.96 kN/m.
The overall process of the experiment is as follows: Set the centrifuge to 50 g. After the displacement value of the slope stabilizes, start applying the water level. After the water level stabilizes to the predetermined height, apply the Taft wave. Input in four levels in ascending order of acceleration amplitude, monitor the response and stability of the slope, and apply the next level of earthquake after the pore pressure and settlement stabilize after each shaking. Then, apply the next level of water level in the same way, wait for the water level to stabilize, and sequentially apply the earthquake to observe the response and stability of the landfill.
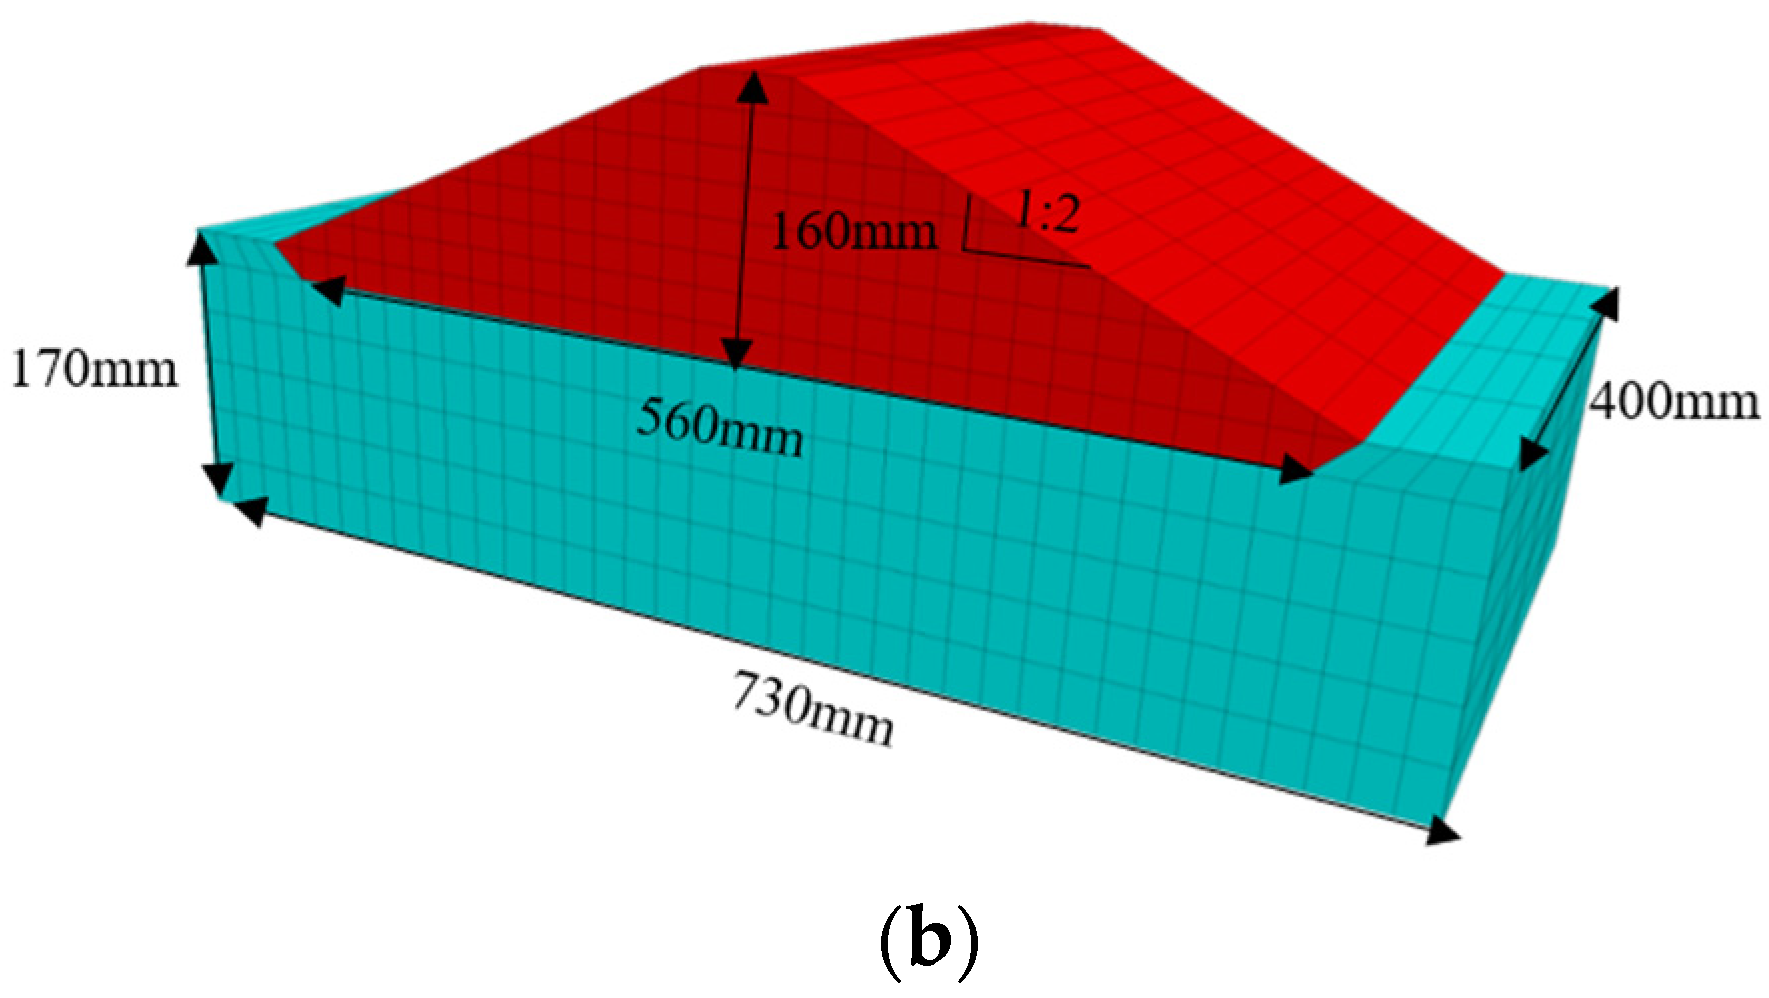
In accordance with the specified test model, a computational model is delineated in Figure 2b. This model incorporates the bedrock, which is specified as follows: a length of 730 mm, a width of 400 mm, and a height (measured from the base of the bedrock to the lower boundary of the landfill) of 170 mm. The maximum height of the solid waste landfill is 160 mm. The lateral slopes of the landfill are designed with a ratio of 1:2, featuring a top width (along the length direction) of 50 mm. Furthermore, the ratio of the landfill slope, the ratio of the demarcating slope between the solid waste landfill and the bedrock, is established at 1:1, with a height of 20 mm.
In the analysis of the solution to the dynamic problem, the accuracy of the background grid needs to meet [33]
Δ l ( 1 10 ~ 1 8 ) λ
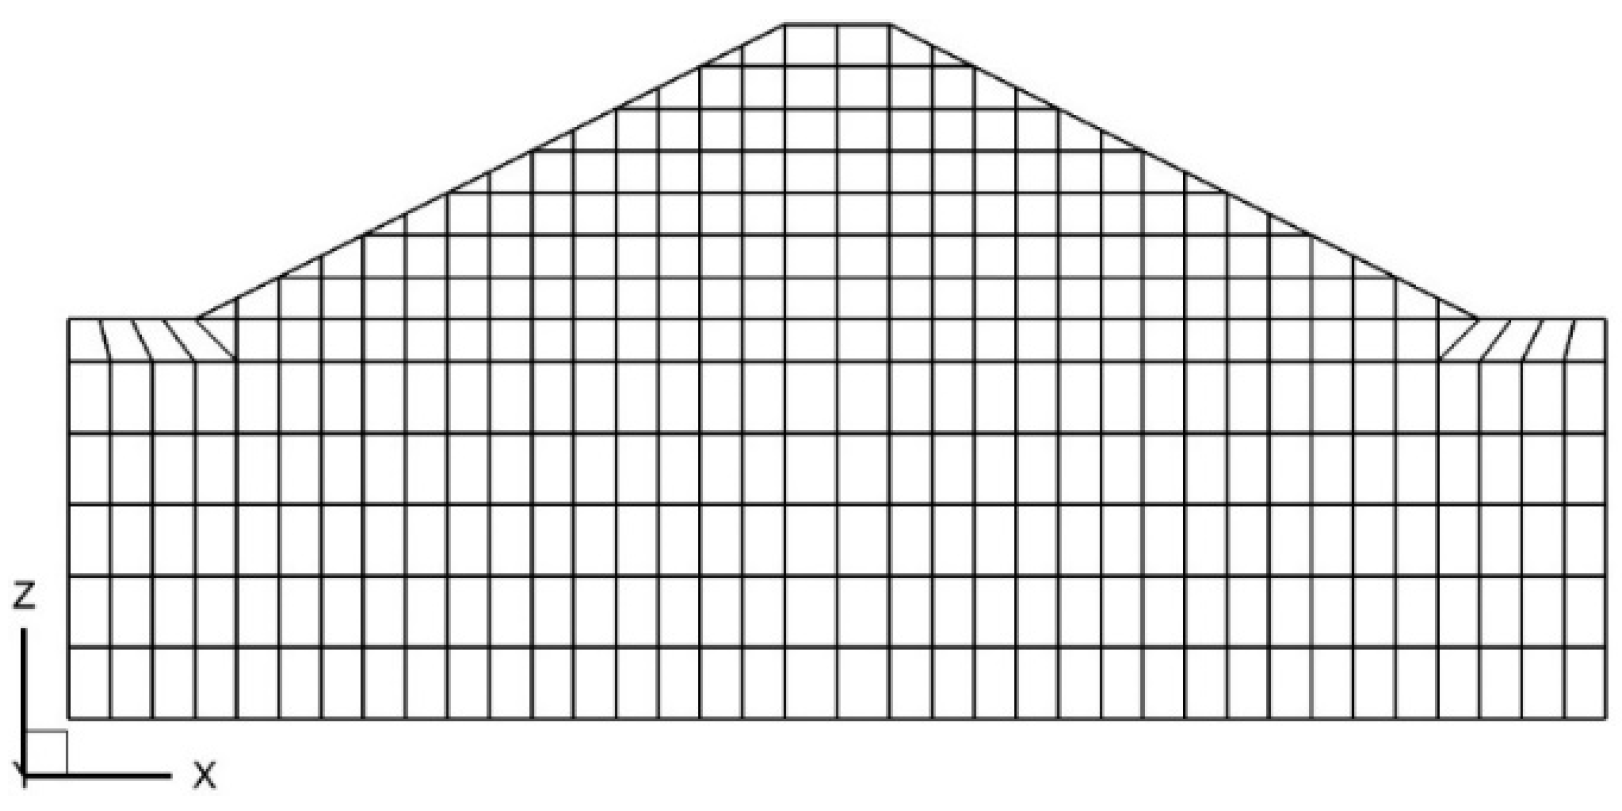
where Δ l is the maximum size of the grid along the direction of wave propagation, and λ is the wavelength corresponding to the maximum frequency. Correspondingly, the model is discretized using hexahedral or tetrahedral grid elements, and the background grid plane diagram is shown in Figure 3.

3.2. Material Parameters

The Mohr–Coulomb constitutive model was taken in the analysis, and parameters for modeling, as shown in Table 1, were determined by referring to previous studies [11,16,34,35]. The shear strength of MSW was selected according to 10% and 20% failure strain.

3.3. Mechanical Damping Settings

In dynamic analysis, commonly used forms of mechanical damping include Rayleigh damping, local damping, and hysteresis damping. Rayleigh damping and local damping are set based on the model’s natural frequency or critical damping ratio, while hysteresis damping can be set using the shear modulus dynamic attenuation relationship curve, which can better reflect the nonlinear characteristics under dynamic loading. The damping ratio of MSW under an earthquake increases with cumulative strain, while the shear modulus decreases with cumulative strain, showing significant nonlinear characteristics. Based on the modulus attenuation curve of MSW obtained from experiments [11,12,13,14], this study introduces hysteresis damping to simulate its dynamic characteristics. In dynamic calculation analysis, the total energy dissipation of the model in one cycle is represented by the energy dissipation corresponding to the constitutive model and hysteresis damping.
Δ E = Δ E H D + Δ E M C
where Δ E H D represents the energy dissipation caused by hysteresis damping in a cycle, and Δ E M C represents the energy dissipation corresponding to the Mohr–Coulomb model in a cycle.

3.4. Boundary Conditions

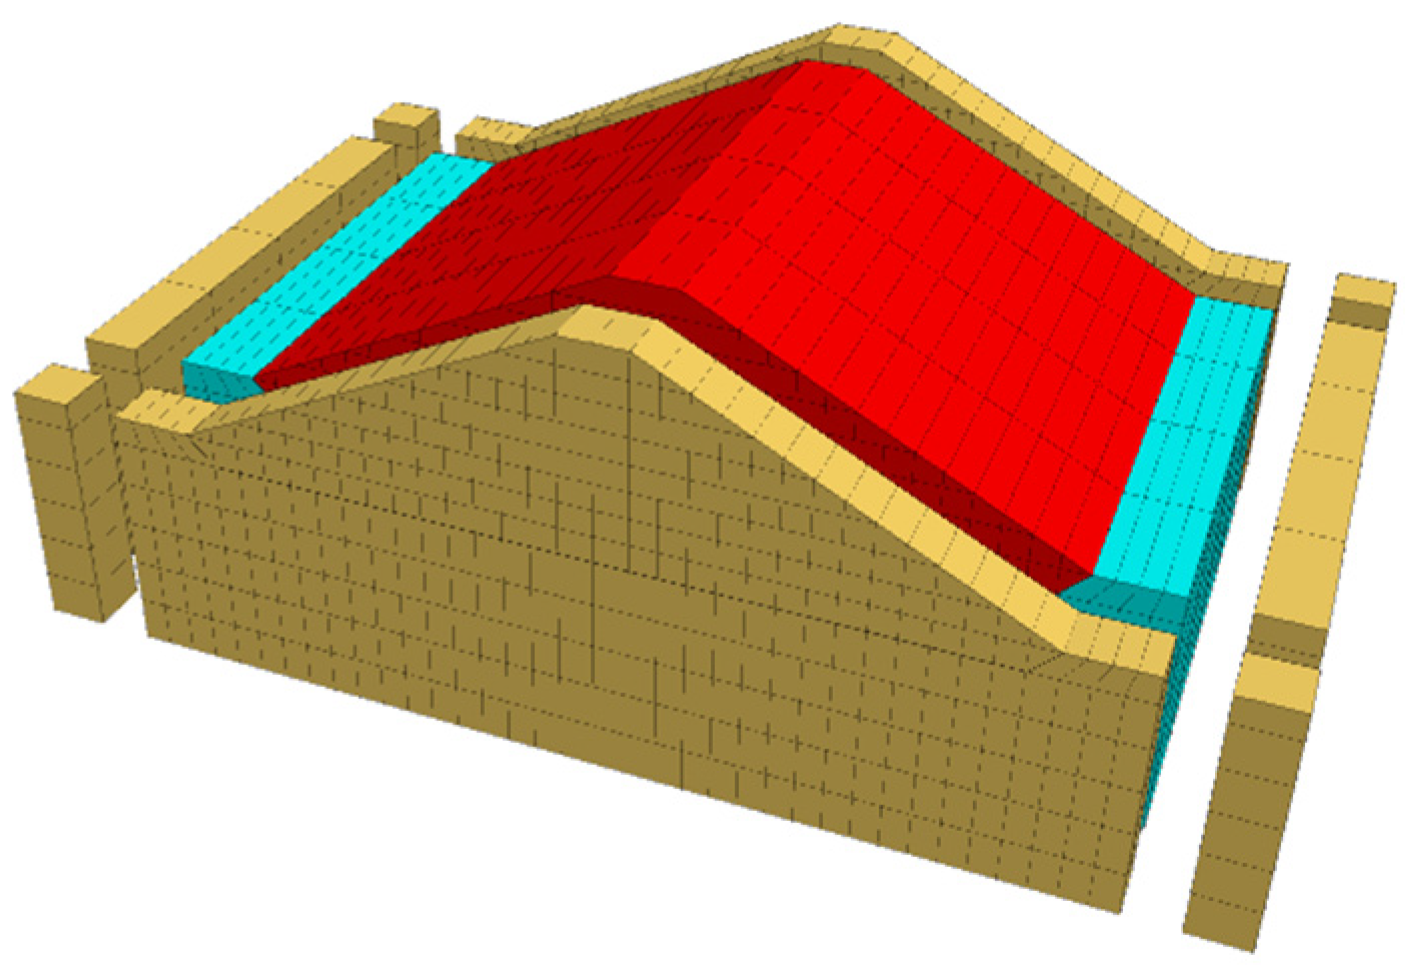
Due to the permeability coefficient of the geomembrane and bedrock being much smaller than the permeability coefficient of MSW, the geomembrane and bedrock are considered impermeable materials. At the same time, the top and side slopes of the MSW slope are set as permeable interfaces. In the dynamic analysis, the seismic wave is applied along the x-direction at the bottom of the bedrock in the form of acceleration time history. Free field boundaries are set around the model to absorb the incident waves on the boundary interface and prevent the reflection of seismic waves on the boundary interface from affecting the calculation and analysis results, as shown in Figure 4.

3.5. Water Level Setting

The ratio of the highest position of the slope water level to the maximum height of the embankment is defined as Rw.
R w = h w / H
where hw represents the maximum height of the water level from the bottom of the heap, and H is the maximum height of the fill (the distance from the top to the bottom of the slope).
According to the centrifuge shaking table test, two water levels, Rw = 0.25 and 0.5, were set for this model.

3.6. Seismic Wave

Define kh as the ratio of the maximum amplitude of the input seismic acceleration at the bottom of bedrock to the amplitude of centrifugal acceleration of the landfill.
k h = a h p e a k / a c
where a h p e a k represents the peak value of seismic acceleration (in the x direction), a c is a fixed value of acceleration in the negative direction of z, perpendicular to the bottom plane of bedrock. In this simulation, it is set to 50 g. The input seismic motion uses the Taft wave, filters out signals above 10 Hz, and extracts the first 30 s of the seismic motion. Four different peak accelerations of seismic motion are applied, which are kh = 0.13, kh = 0.25, kh = 0.34, and kh = 0.46.

4. Numerical Model Verification

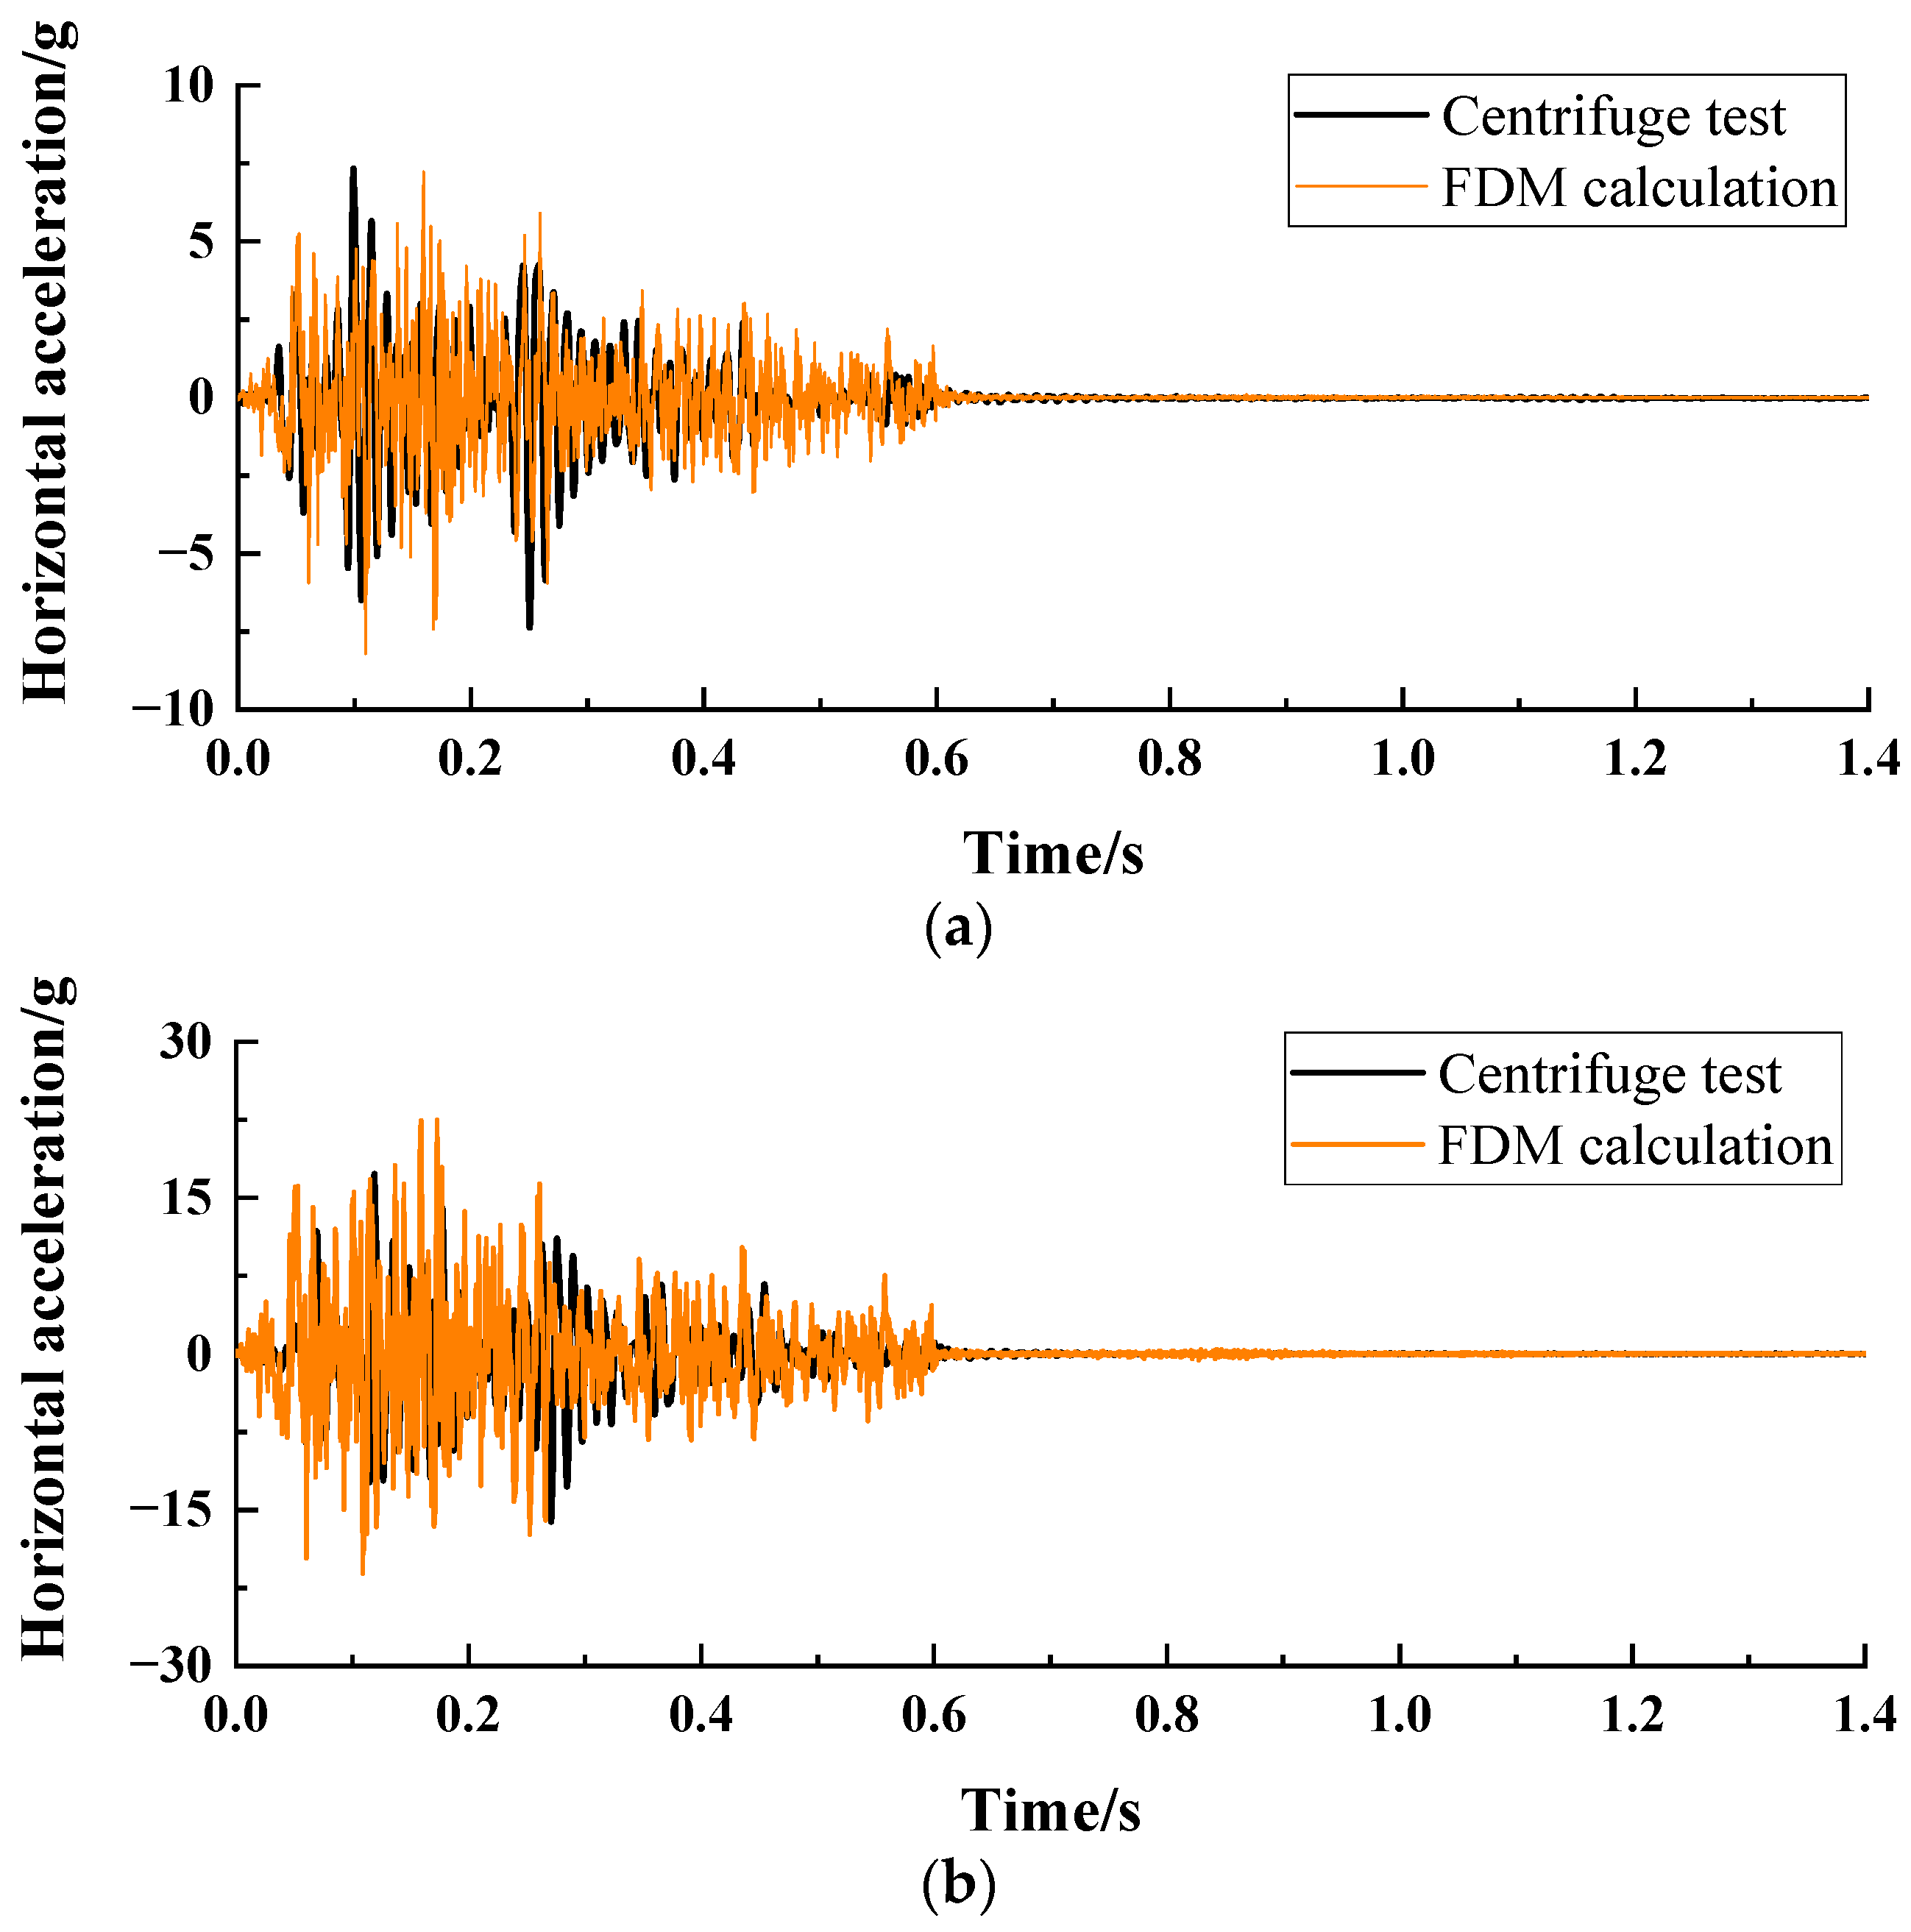
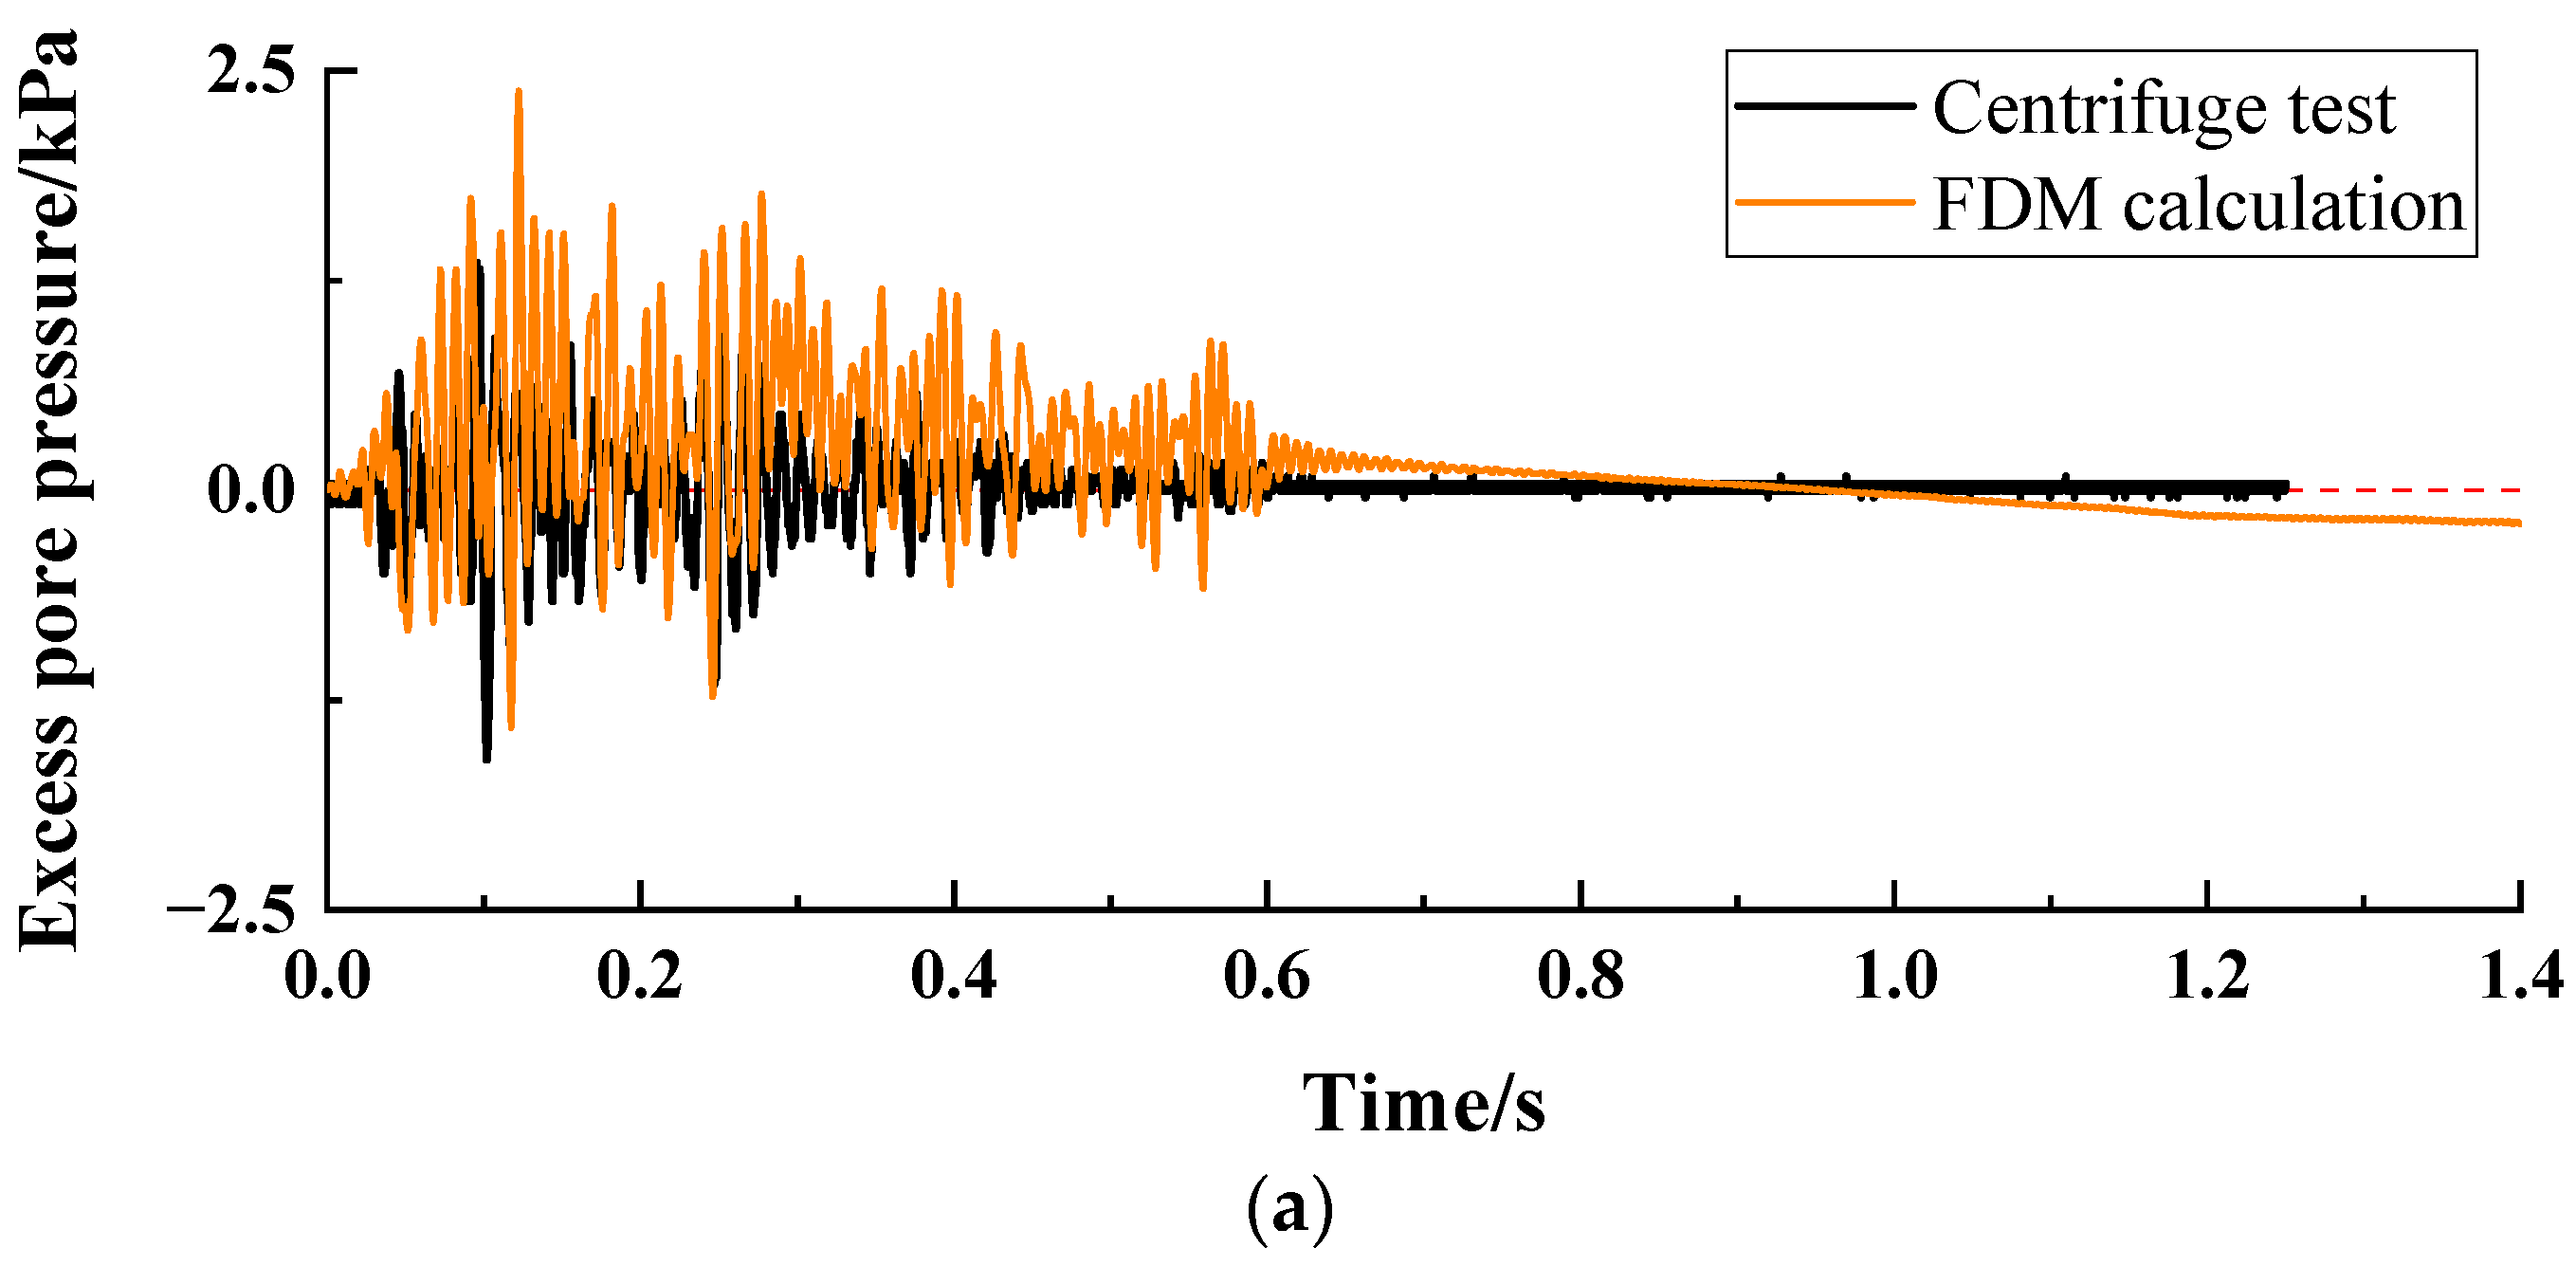
To verify the accuracy and reliability of the numerical model, the dynamic response of the bottom acceleration sensor A1 and pore pressure gauge P5 was obtained using numerical modeling and compared to the centrifuge test data, as shown in Figure 5 and Figure 6. Figure 5 compares the time history curves of the bottom acceleration under different seismic conditions. The time history curve of the bottom acceleration obtained using FDM nonlinear analysis is basically consistent with the peak acceleration value of the centrifuge test results. Figure 6 compares the bottom pore pressure response of the model under different conditions. The FDM nonlinear analysis results are consistent with the centrifuge test results, which can well simulate the variation law of excess pore pressure within the landfill under different water levels and seismic intensities. At low water levels and small earthquakes, the main manifestation is the accumulation of excess pore pressure. At high water levels and large earthquakes, there is a significant negative excess pore pressure, which the tensile stress of the slope under seismic action may cause.
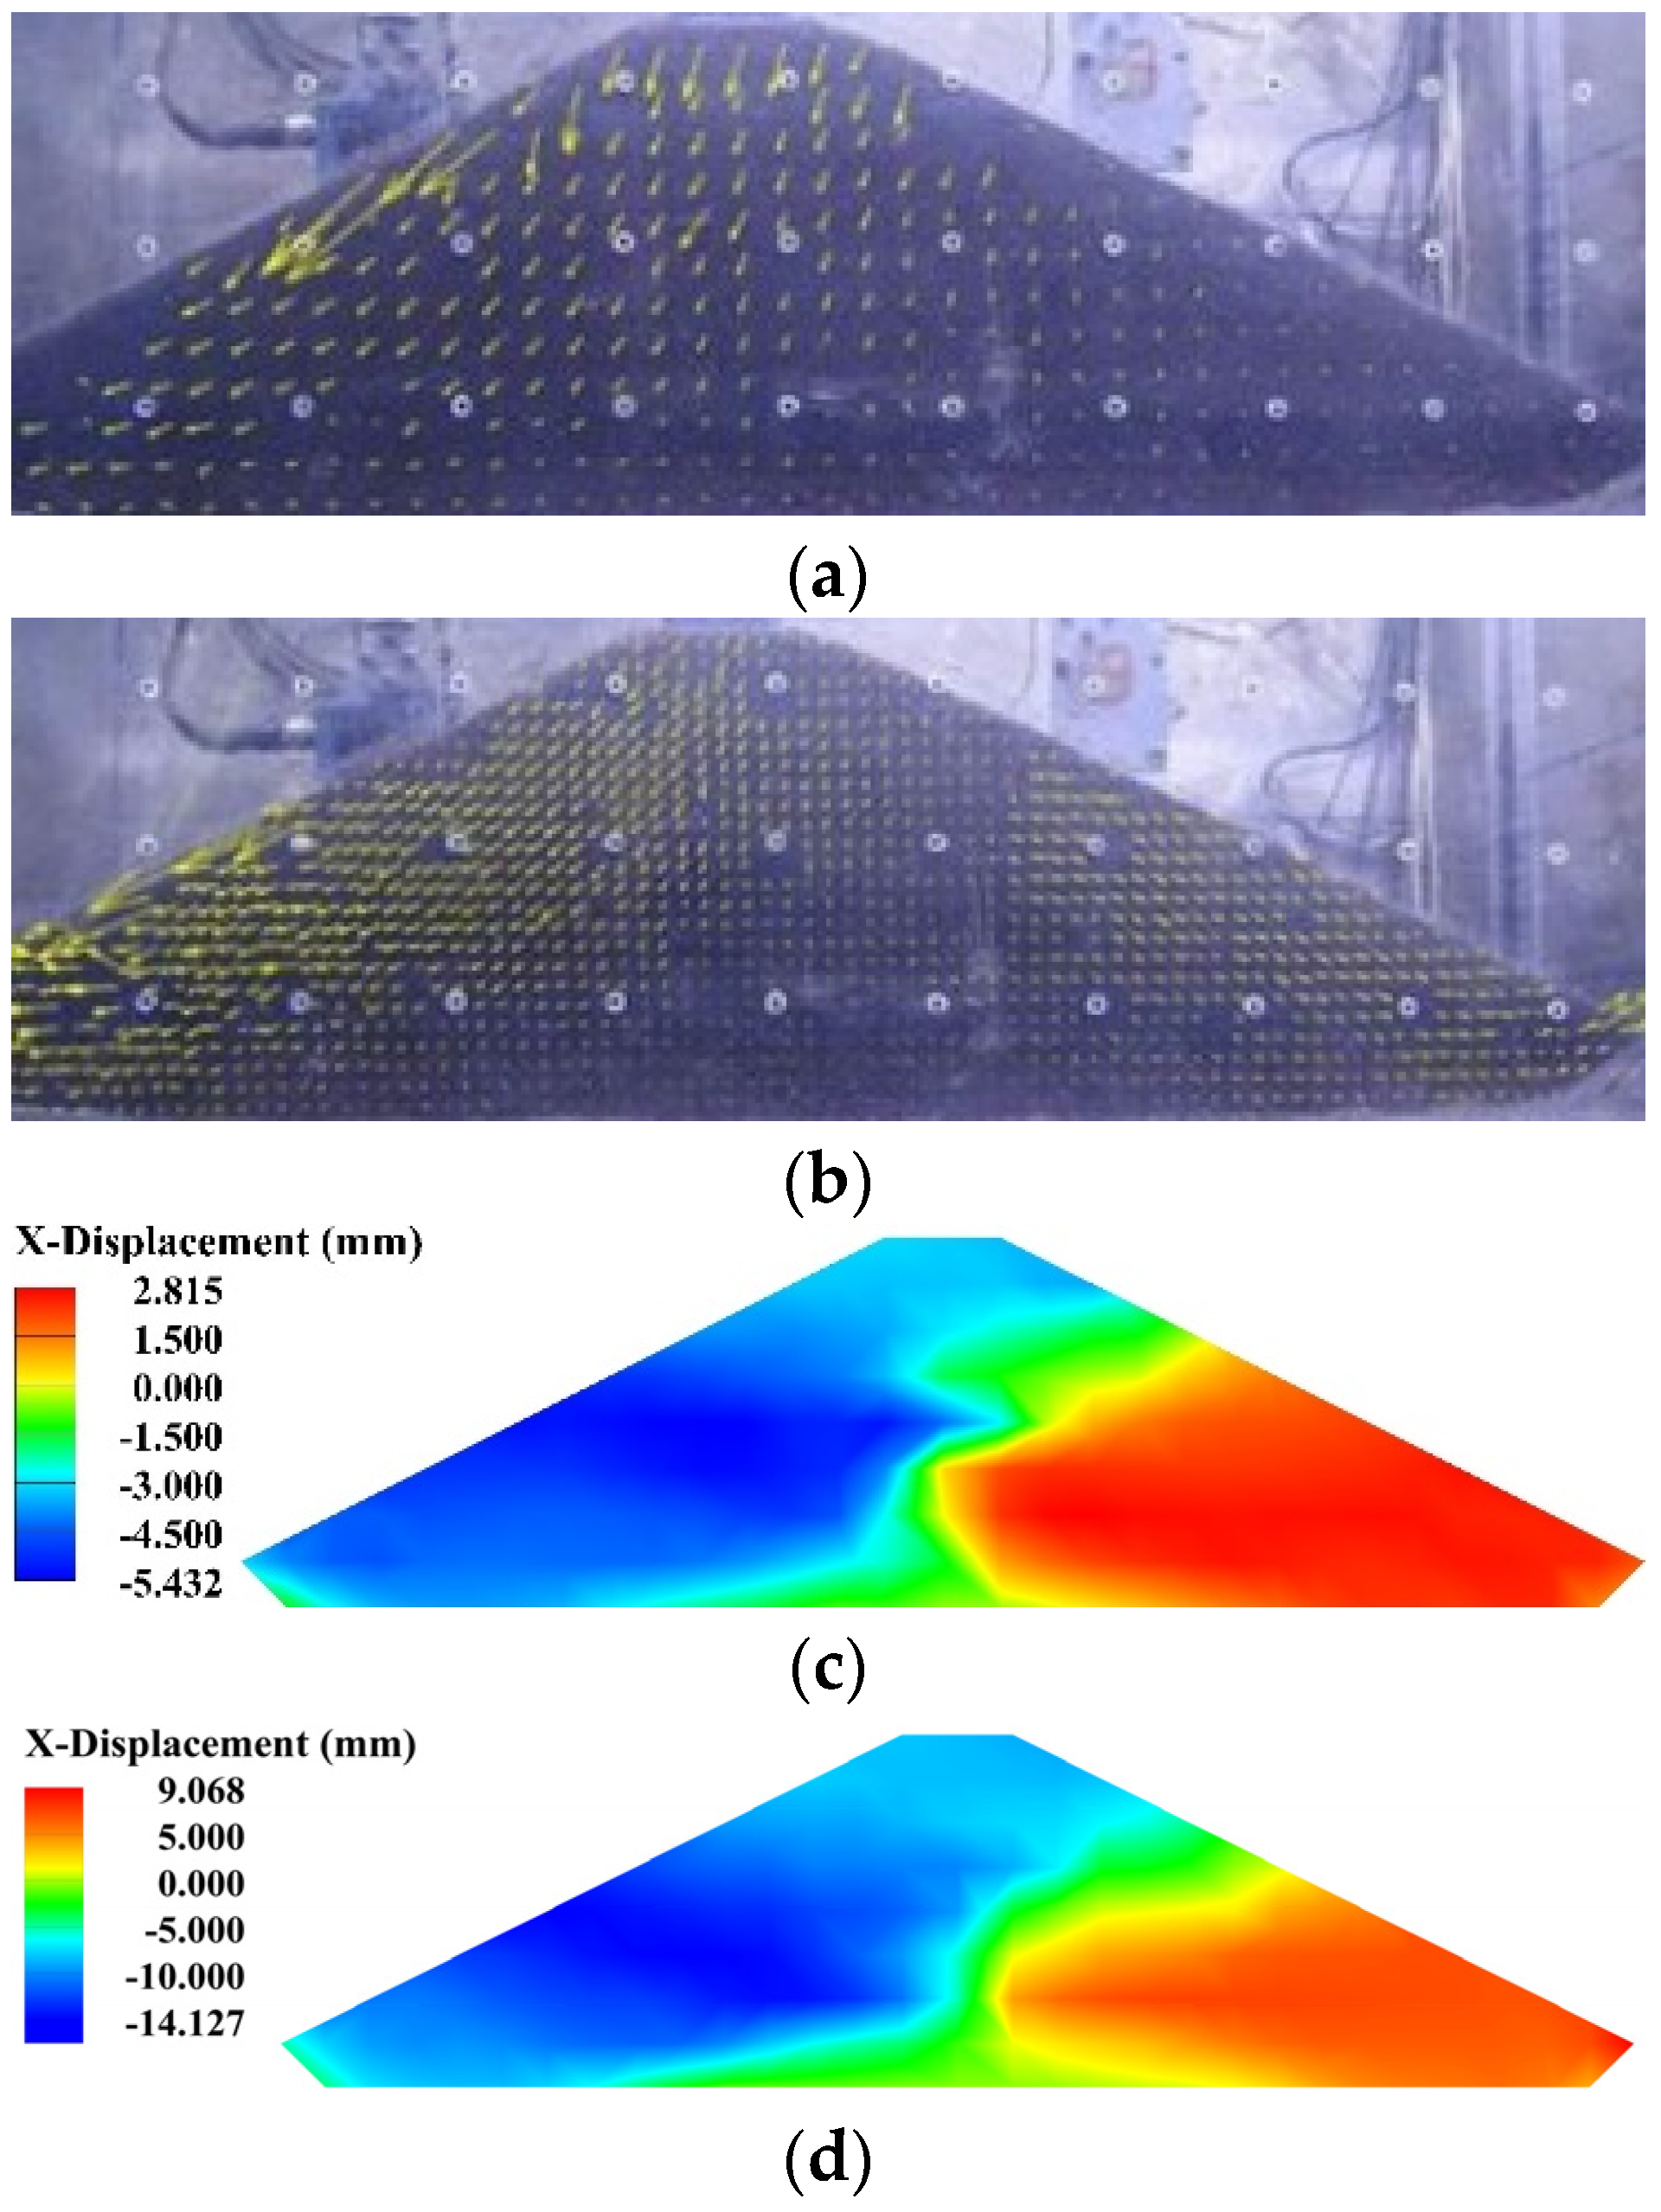
As shown in Figure 7, the deformation pattern of the FDM nonlinear analysis landfill model is consistent with the centrifuge test results. The double-sided slope MSW landfill exhibits an asymmetric deformation pattern after the earthquake: the deformation of the landfill is mainly on one side, including a large area including the top of the landfill, which moves towards that side, while the middle and lower areas of the landfill on the other side move in the opposite direction.

5. Analysis of Dynamic Stability

5.1. Method for Calculating the Dynamic Safety Factor

Computation of the time history of the safety factor of landfills is employed through custom Fish language programming. First, each dynamic analysis of a landfill with a low or high water level is carried out independently under different earthquakes. The total duration of the dynamic calculation under 50 g is 1.5 s. The numerical model’s dynamic response information (including stress, velocity, acceleration, displacement, strain, yield state, damping ratio, porosity, etc.) is exported and stored every 0.001 s during an analysis. When a numerical analysis is completed, the dynamic response information at different moments can be obtained. Then, the previously stored file documenting the dynamic information at a certain moment can be imported and restored for each separate computation of safety factor, realized using the strength reduction method. The implementation principle of the strength reduction calculation method is shown in Equations (11) and (12).
c F S R = c F S S R
ϕ F S S R = arctan ( tan ϕ F S S R )
where F S S R is the reduction factor for strength.
The determination of the potential sliding surface based on the strain rate distribution. At any given moment, if the unbalanced force ratio is less than 1 × 10⁻⁵, it is considered as convergence in calculation. The reduction coefficient at this time is replaced with the lower limit value of the reduction coefficient, and the reduction coefficient is increased for iterative calculation. On the other hand, if the unbalanced force ratio is greater than the convergence value, it is considered non-convergence in calculation. The reduction coefficient at this time is taken as the upper limit value, and the calculation is iterated again. The reduction coefficient is adjusted using the bisection method and iterated continuously until the reduction coefficient tends to a certain value. This value is considered as the safety factor of the landfill at the corresponding moment.
Finally, the approximate time history curve of the safety factor can be obtained by computing the safety factor at various moments in an independent analysis.

5.2. Analysis of the Seismic Stability of a Landfill using Safety Factor Time History

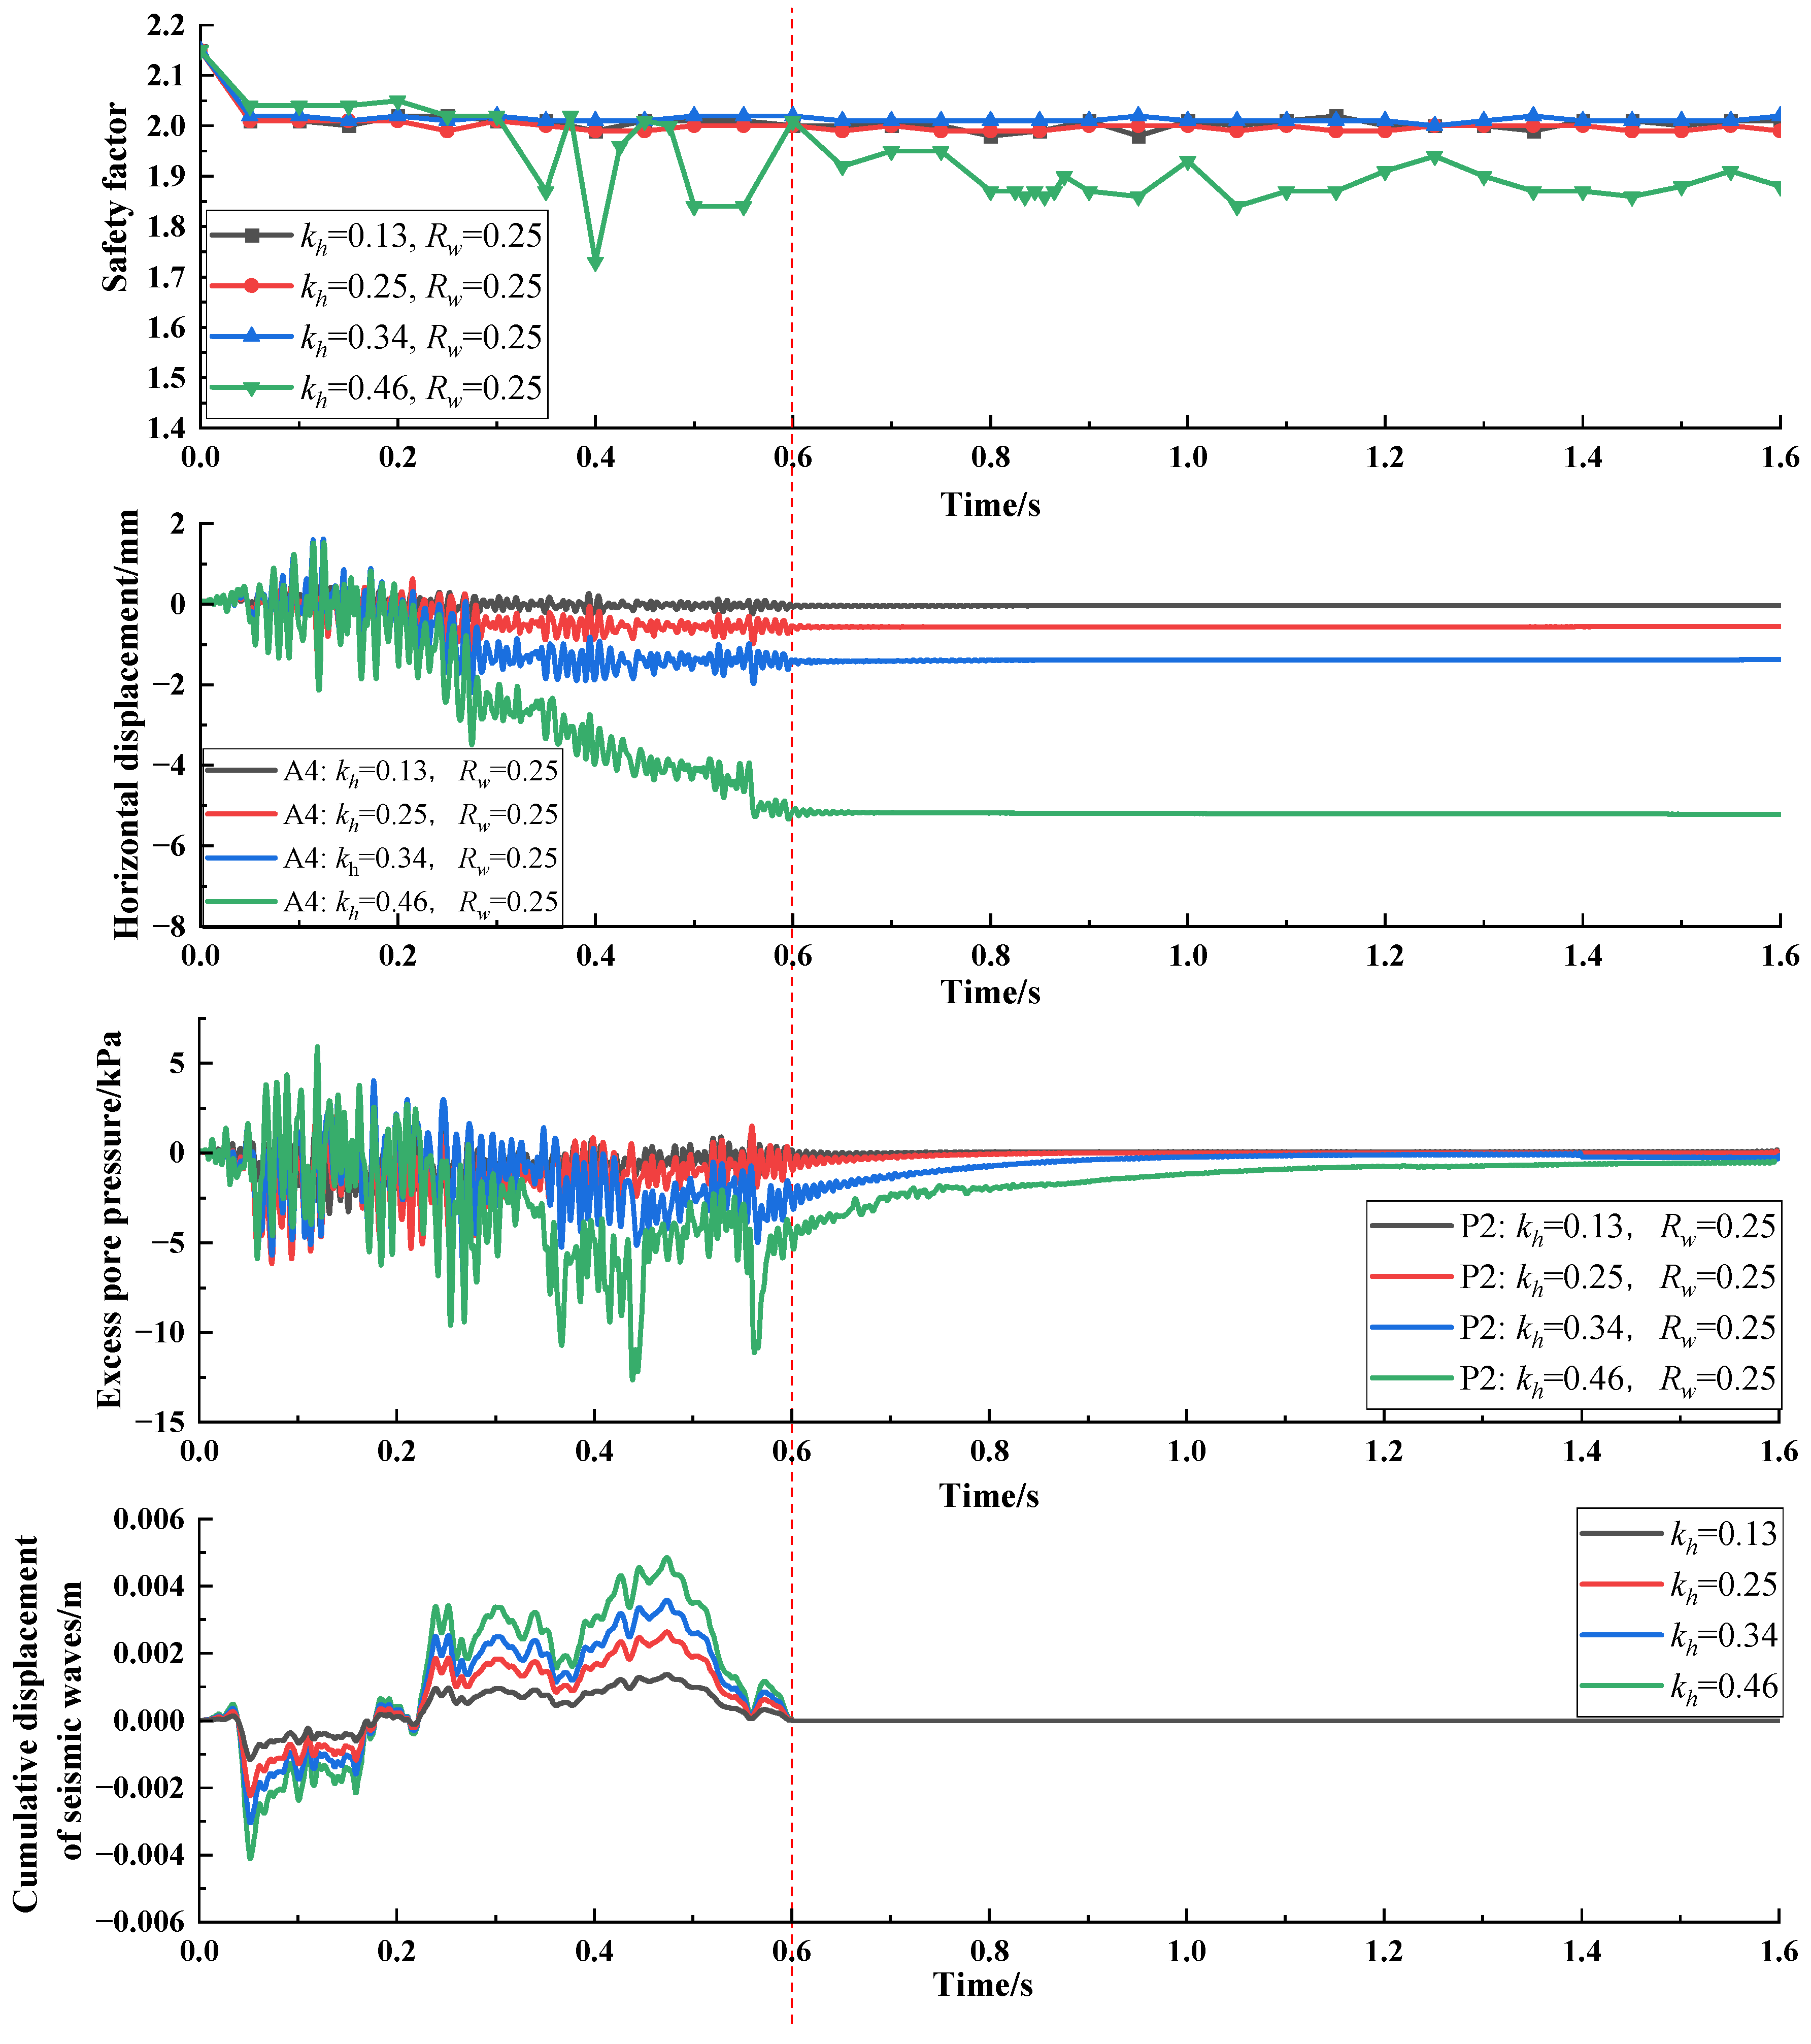
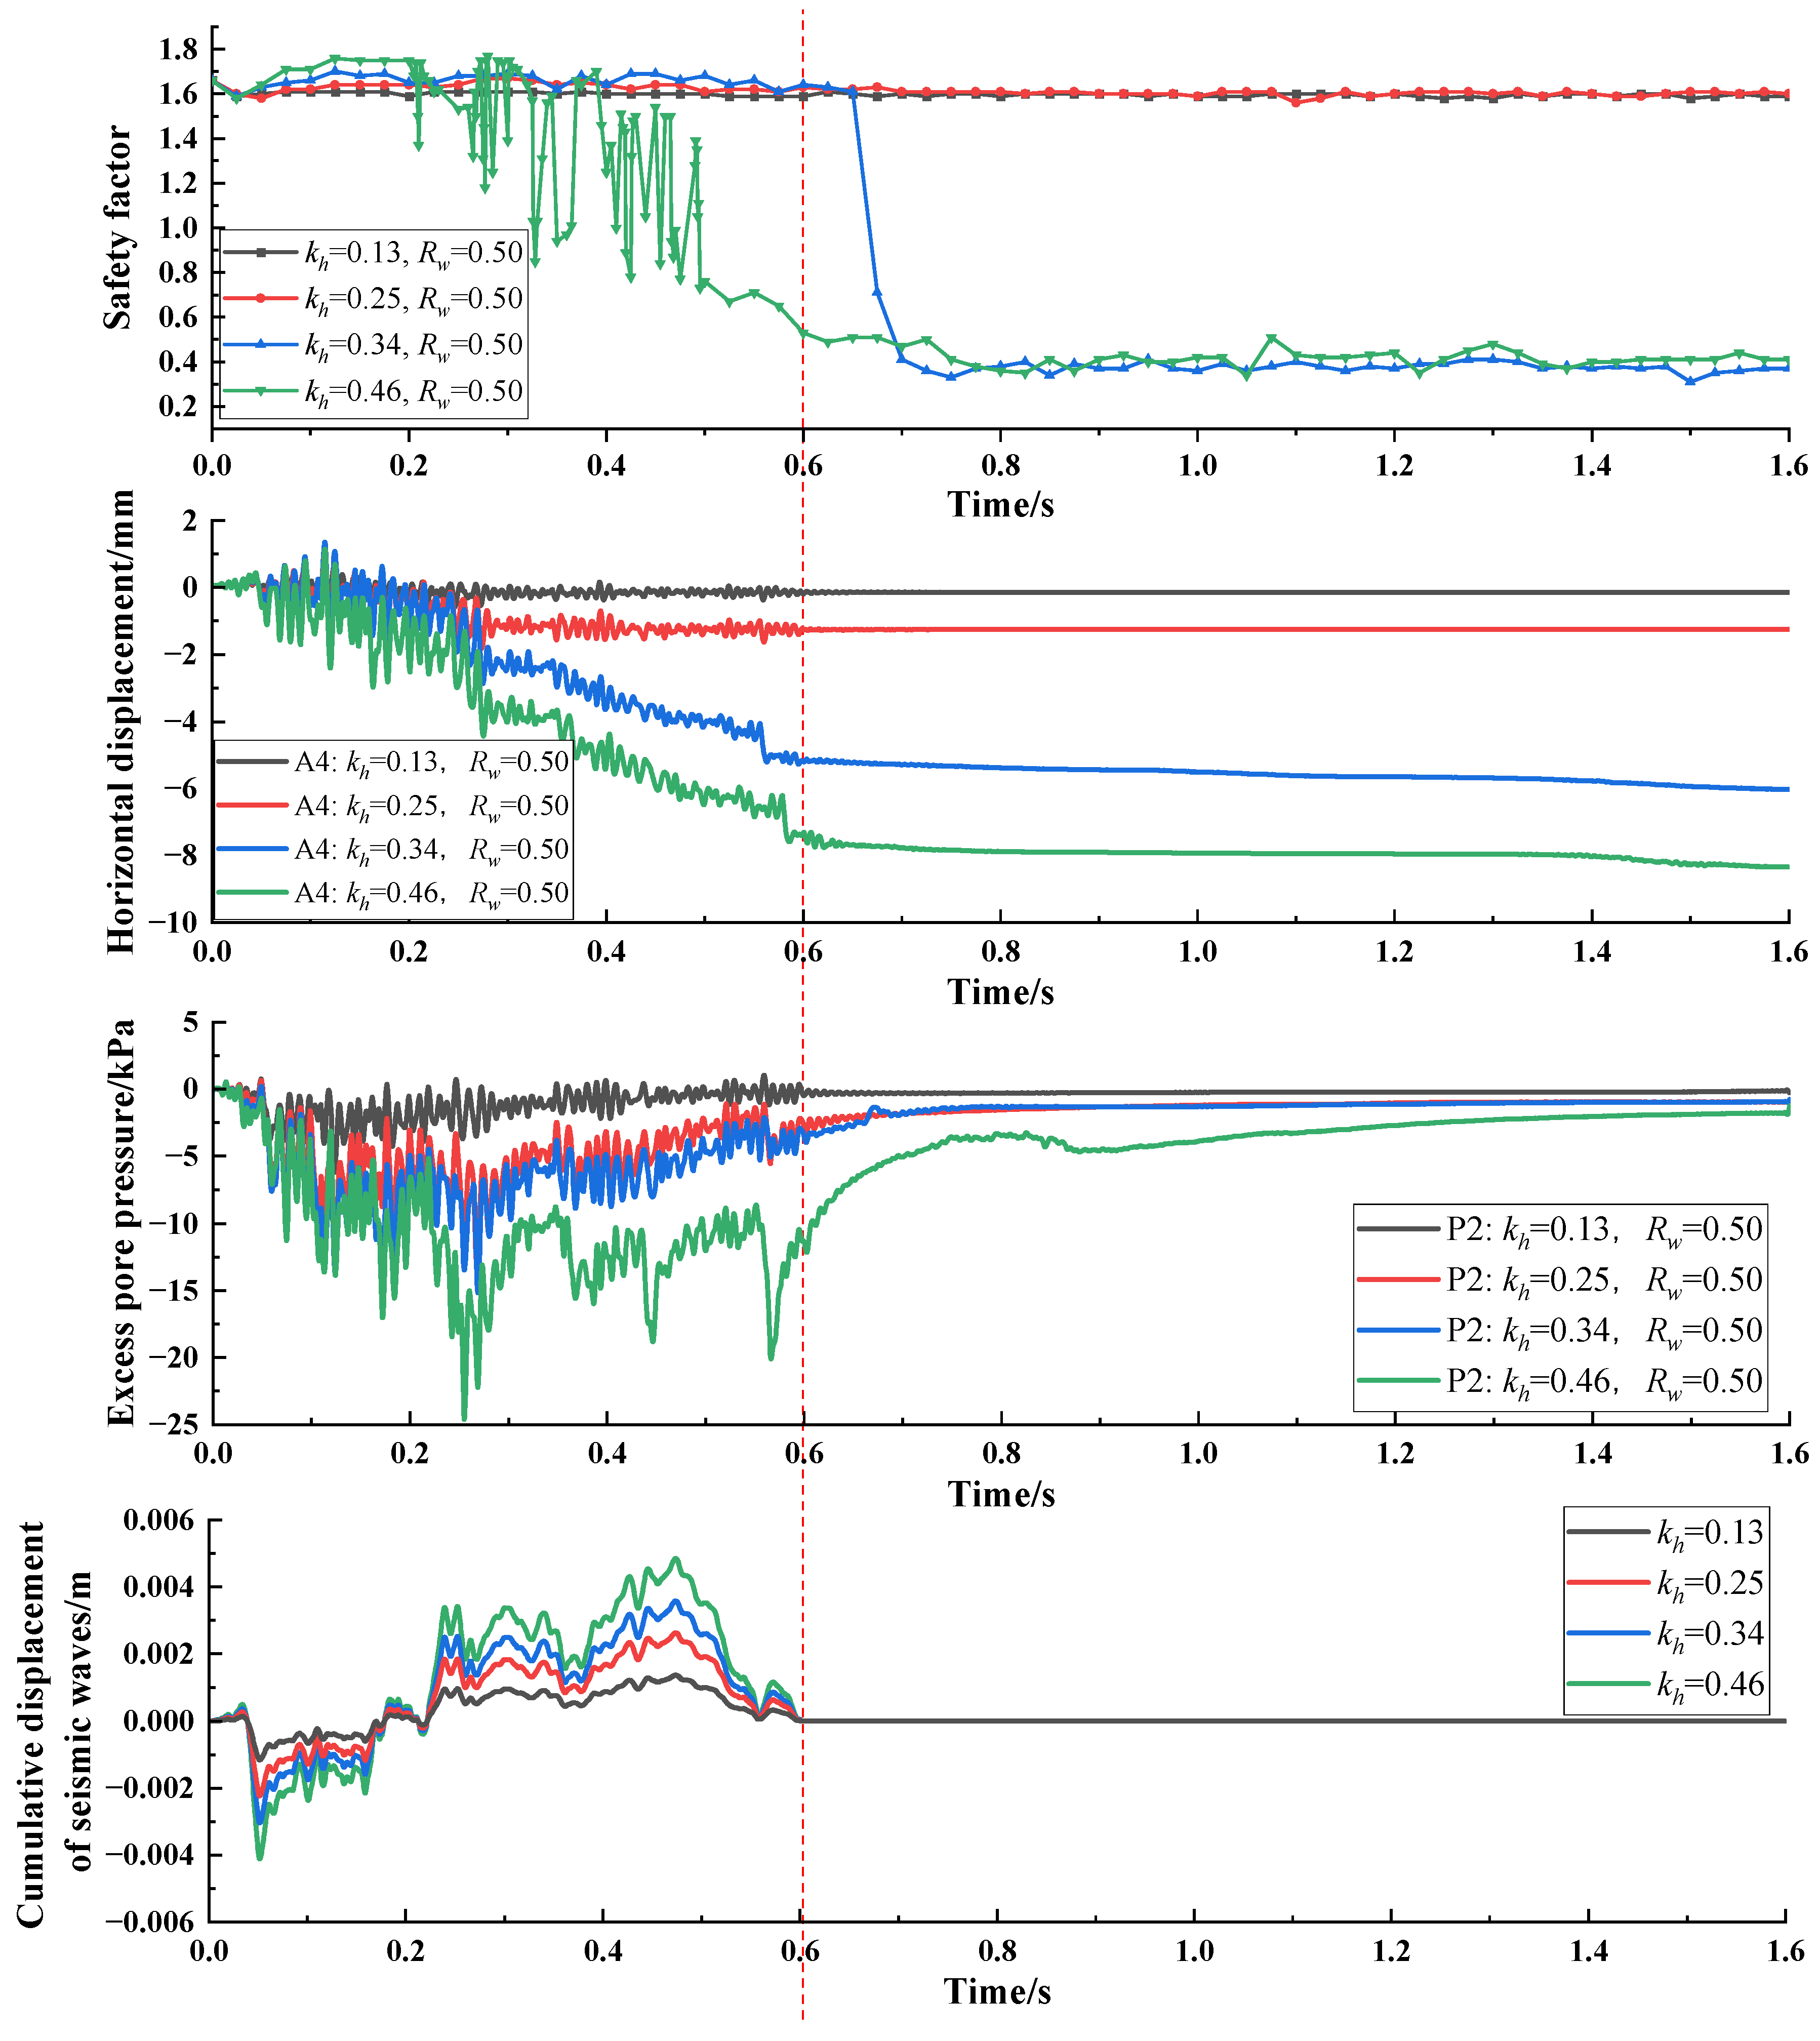
According to the abovementioned method, the safety factor time history of each modeling scenario has been obtained. The time history curves of the safety factor are presented in Figure 8 and Figure 9. The vertical dashed lines depicted in the two figures signify the end of earthquake activities.
The four different time history curves of the safety factor, corresponding to four different earthquakes (kh = 0.13, kh = 0.25, kh = 0.34, and kh = 0.46), of landfills with low water levels are shown in Figure 8. Under the scenarios of kh = 0.13, kh = 0.25, and kh = 0.34, landfills are considered to be stable, with a safety factor value of about 2.0 when the excess pore pressure has nearly dissipated, indicating the good stability of landfills during weak earthquakes. However, when the earthquake intensity is high (kh = 0.46), the safety factor fluctuates significantly, with a minimum value of 1.49. It is noticed that, in the time history of pore pressure response, the negative excess pore pressure within the landfill dissipates considerably by the time the post-earthquake safety factor suddenly decreases, while the pore pressure of the landfill continues to rise. There are three main reasons for the occurrence of this phenomenon: firstly, the increase in pore pressure leads to a decrease in effective stress; secondly, the softening of the MSW during seismic activities; and last, the deformation of the landfill increases during the recovery of pore pressure, resulting in a decrease in the safety factor. Overall, landfills with low water levels can maintain good stability under different earthquake intensities. Yet, attention should also be paid to the impacts of deformation induced by strong earthquakes on the stability of the landfill mass.
The time history curves of the safety factor, corresponding to four different earthquake intensities (kh = 0.13, kh = 0.25, kh = 0.34, and kh = 0.46), of landfills with high water levels are depicted in Figure 9. During the same seismic activity, there is an obvious reduction in the safety factor of a high-water-level landfill compared to the one with a low water level, suggesting the adverse impact of rising water levels on the stability of a landfill. When the seismic intensity is relatively low (kh = 0.13, kh = 0.25), the landfill with a high water level can maintain good stability during the earthquake process. This stability is reflected in the time history curve of the safety factor, as the curve remains near the stable value throughout the earthquake process with minor fluctuations. During moderate or high-intensity earthquakes (kh = 0.34 and 0.46), the safety factor of the landfill with high water initially experiences a slight increase. However, it gradually decreases as the negative excess pore pressure reaches its peak and starts to rebound. The safety factor of the landfill closely correlates with the development trend of negative excess pore pressure. As the negative excess pore pressure approaches complete dissipation and the effective stress of the landfill returns to the pre-earthquake state, significant changes occur in the stiffness and damping characteristics of the solid waste itself during the earthquake process. Additionally, volume expansion occurs under tension. Therefore, although the effective stress remains higher than before the earthquake, instability has already occurred in the landfill.
At the same time, it can be clearly seen that, during the earthquake process, due to the negative excess pore pressure response of the high-water-level landfill, the safety factor actually increases to a certain extent during the period of pore pressure decrease. The minimum safety factor values of the high-water-level landfills under the four intensities of an earthquake are 1.59, 1.60, 0.31, and 0.35, respectively. The seismic stability of the landfill is related to its deformation and pore pressure changes during the earthquake process. Compared with the applied seismic motion time history, there is a certain lag in the response of the safety factor, which is influenced by the lag of pore pressure and acceleration response. The post-earthquake period with negative excess pore pressure has the lowest safety factor for the landfill. The tensile action of the earthquake causes cumulative deformation of the solid waste, resulting in a decrease in strength. Following the dissipation of negative excess pore pressure, the effective stress decreases, and the safety factor reaches its minimum value.

5.3. The Impact of the Values of Solid Waste Strength Parameters on Stability

Figure 10 shows the safety factor of a high-water-level landfill under high-intensity earthquakes when determining the strength parameters of MSW via destruction strains of 10% and 20%, respectively. Under the earthquake of kh = 0.34, different stable results were observed for the centrifugal model of a high-water-level landfill when using strength parameters determined via destruction strains of 10% and 20%. When studying and analyzing with strength parameters determined via a destruction strain of 10%, instability occurred in the high-water-level landfills when negative excess pore pressure almost completely dissipated after an earthquake. However, when analyzing with strength parameters determined via a destruction strain of 20%, the stability of the landfill under an earthquake was good, and no instability occurred. Under the earthquake of kh = 0.46, there was a significant increase in the safety factor at the same time step when analyzing with strength parameters corresponding to a destruction strain of 20%, but instability also occurred. It suggests that if the strength parameters for MSW are determined based on breaking strain, further research is still needed on selecting appropriate values for breaking strains.

6. Conclusions

Based on the results of centrifuge tests, the FDM nonlinear dynamic analysis method was used to analyze the seismic response of landfills under different water levels and seismic intensities. Utilizing state data stored during the seismic modeling process of the landfill, time-history curves of the dynamic safety factor for different water levels and seismic intensities were obtained. The numerical modeling results are consistent with the test results and phenomena. The main conclusions are as follows:
(1)
The seismic acceleration, pore pressure, and deformation response of the landfill obtained through FDM nonlinear dynamic analysis are consistent with the results of centrifuge tests. The development process of pore pressure and deformation under seismic action matches the acceleration time history;
(2)
The time history curve of the safety factor obtained based on the seismic response of the landfill is closely related to the dissipation of deformation and excess pore pressure, providing an approach to clearly and effectively assess the seismic stability of landfills. Under low water levels and small earthquake magnitude conditions, the stability of the landfill is good, though the cumulative deformation caused by earthquakes can slightly decrease the safety factor. Under high water levels and high-intensity earthquakes, the safety factor of the landfill may decrease to a critical point;
(3)
The instability of the landfill during earthquakes lags behind the earthquake loading process, which is related to the development of deformation and pore pressure during earthquakes. In the initial stage of earthquake loading, the safety factor of the landfill slightly increases as negative excess pore pressure accumulates. However, as the accumulated deformation caused by earthquake action weakens the landfill and the rebound of negative excess pore pressure reduces the effective stress, the safety factor gradually decreases. After the dissipation of negative excess pore pressure, the safety factor reaches its minimum value;
(4)
The parameters of MSW are conservative in terms of the value taken via the 10% strain at failure, leading to landfill instability during strong earthquakes. When the strength parameters are determined based on a 20% strain at failure, the stability of the high-water-level landfills is good under seismic intensities of Level III, but instability still occurs under maximum seismic intensity;
(5)
The strength parameters of MSW directly affect the seismic stability of high-water-level landfills. When the strength parameters are determined based on 10% and 20% strain at failure, instability occurs in high-water-level landfills under maximum Level I seismic intensity. This differs from observations made in centrifugal model experiments. Further research is needed to determine strength parameter values in the dynamic response analysis of solid waste;
(6)
Factors that affect the difference between centrifuge test results and FDM nonlinear analysis results include assumptions, boundary conditions, parameter values in numerical calculations, and experimental factors such as loading, operation, and equipment, which have not been explored.

Author Contributions

L.S.: supervision, writing—review and editing. J.L.: conceptualization, methodology, formal analysis, writing—original draft. H.L.: supervision, writing—review and editing. All authors have read and agreed to the published version of the manuscript.

Funding

This work presented in this paper was jointly supported by the Basic Public Welfare Research Program of Zhejiang Province (Grant No. LGF21E080013) and the Basic Science Center Program for Multiphase Media Evolution in Hypergravity of the National Natural Science Foundation of China (Grant No. 51988101).

Data Availability Statement

Data can be acquired upon reasonable request.

Acknowledgments

The authors also would like to gratefully acknowledge laboratory support personnel at the Center for Hypergravity Experimental and Interdisciplinary Research and MOE Key Laboratory of Soft Soils and Geoenvironmental Engineering. The authors also appreciate the three anonymous reviewers for their positive and constructive comments and suggestions on the earlier version of the paper.

Conflicts of Interest

The authors declare no conflicts of interest.

References

  1. Kumar, K.N.; Goel, S. Characterization of Municipal Solid Waste (MSW) and a Proposed Management Plan for Kharagpur, West Bengal, India. Resour. Conserv. Recycl. 2009, 53, 166–174. [Google Scholar] [CrossRef]
  2. Hla, S.S.; Roberts, D. Characterisation of Chemical Composition and Energy Content of Green Waste and Municipal Solid Waste from Greater Brisbane, Australia. Waste Manag. 2015, 41, 12–19. [Google Scholar] [CrossRef]
  3. Wang, H.; Wang, C. Municipal Solid Waste Management in Beijing: Characteristics and Challenges. Waste Manag. Res. 2013, 31, 67–72. [Google Scholar] [CrossRef]
  4. Zhan, L.-T.; Xu, H.; Chen, Y.-M.; Lü, F.; Lan, J.-W.; Shao, L.-M.; Lin, W.-A.; He, P.-J. Biochemical, Hydrological and Mechanical Behaviors of High Food Waste Content MSW Landfill: Preliminary Findings from a Large-Scale Experiment. Spec. Themat. Issue Sanit. Landfilling 2017, 63, 27–40. [Google Scholar] [CrossRef] [PubMed]
  5. Zhu, Y.; Zhang, Y.; Luo, D.; Chong, Z.; Li, E.; Kong, X. A Review of Municipal Solid Waste in China: Characteristics, Compositions, Influential Factors and Treatment Technologies. Environ. Dev. Sustain. 2021, 23, 6603–6622. [Google Scholar] [CrossRef]
  6. Fernandez, G.; Hendron, D.; Castro, A. Pore Pressure Induced Slide in Municipal Solid Waste Doña Juana Landfill—Bogota, Colombia. In Proceedings of the 16th International Conference on Soil Mechanics and Geotechnical Engineering, Osaka, Japan, 12–16 September 2005; Volume 4, pp. 2253–2256. [Google Scholar] [CrossRef]
  7. Matasovic, N.; Kavazanjian, E., Jr.; Augello, A.J.; Bray, J.D.; Seed, R.B. Solid Waste Landfill Damage Caused by 17 January 1994 Northridge Earthquake. Northridge Calif. Earthq. 1994, 17, 221–229. [Google Scholar]
  8. Lavigne, F.; Wassmer, P.; Gomez, C.; Davies, T.A.; Sri Hadmoko, D.; Iskandarsyah, T.Y.W.M.; Gaillard, J.; Fort, M.; Texier, P.; Boun Heng, M.; et al. The 21 February 2005, Catastrophic Waste Avalanche at Leuwigajah Dumpsite, Bandung, Indonesia. Geoenvironmental Disasters 2014, 1, 10. [Google Scholar] [CrossRef]
  9. Merry, S.M.; Kavazanjian, E., Jr.; Fritz, W.U. Reconnaissance of the July 10, 2000, Payatas Landfill Failure. J. Perform. Constr. Facil. 2005, 19, 100–107. [Google Scholar] [CrossRef]
  10. Haque, M.A. Dynamic Chracteristics and Stability Analysis of Muncipal Solid Waste in Bioreactor Landfills. Ph.D. Thesis, The University of Texas at Arlington, Arlington, TX, USA, 2007. [Google Scholar]
  11. Li, J. Studies on Static and Seismic Stability of Landfills with High Water Level by Centrifugal Model Tests. Ph.D. Thesis, Zhejiang University, Hangzhou, China, 2018. [Google Scholar]
  12. Idriss, I.M.; Fiegel, G.L.; Hudson, M.B.; Mundy, P.K.; Herzig, R. Seismic Response of the Operating Industries Landfill. In Earthquake Design and Performance of Solid Waste Landfills; ASCE: San Diego, CA, USA, 1995; pp. 83–118. [Google Scholar]
  13. Matasović, N.; Kavazanjian, E. Cyclic Characterization of OII Landfill Solid Waste. J. Geotech. Geoenvironmental Eng. 1998, 124, 197–210. [Google Scholar] [CrossRef]
  14. Augello Anthony, J.; Bray Jonathan, D.; Abrahamson Norman, A.; Seed Raymond, B. Dynamic Properties of Solid Waste Based on Back-Analysis of OII Landfill. J. Geotech. Geoenvironmental Eng. 1998, 124, 211–222. [Google Scholar] [CrossRef]
  15. Peng, R. Stability of Municipal Solid Waste Landfill within High Water Level. Ph.D. Thesis, Beihang University, Beijing, China, 2016. [Google Scholar]
  16. Kavazanjian, E.; Gutierrez, A. Large Scale Centrifuge Test of a Geomembrane-Lined Landfill Subject to Waste Settlement and Seismic Loading. Waste Manag. 2017, 68, 252–262. [Google Scholar] [CrossRef]
  17. Thusyanthan, I.; Madabhushi, G.; Singh, S. Centrifuge Modeling of Solid Waste Landfill Systems—Part 2: Centrifuge Testing of Model Waste. Geotech. Test. J. 2006, 29, 223–229. [Google Scholar] [CrossRef]
  18. Sarmah, P.; Ishiguro, T.; Maruyama, K.; Xue, T.; Yamawaki, A.; Katsumi, T.; Takai, A.; Omine, K.; Doi, Y. Mechanical Behavior of Inert Waste Landfills under Seismic Condition. J. Mater. Cycles Waste Manag. 2022, 24, 2183–2200. [Google Scholar] [CrossRef]
  19. Mitchell, J.K.; Seed, R.B.; Seed, H.B. Kettleman Hills Waste Landfill Slope Failure. I: Liner-System Properties. J. Geotech. Eng. 1990, 116, 647–668. [Google Scholar] [CrossRef]
  20. Qian, X.; Koerner, R.M. Modification to Translational Failure Analysis of Landfills Incorporating Seismicity. J. Geotech. Geoenvironmental Eng. 2010, 136, 718–727. [Google Scholar] [CrossRef]
  21. Feng, S.-J.; Gao, L.-Y. Seismic Analysis for Translational Failure of Landfills with Retaining Walls. Waste Manag. 2010, 30, 2065–2073. [Google Scholar] [CrossRef]
  22. Rathje, E.; Bray, J. Nonlinear Coupled Seismic Sliding Analysis of Earth Structures. J. Geotech. Geoenvironmental Eng. 2000, 126, 1002–1014. [Google Scholar] [CrossRef]
  23. Zania, V.; Psarropoulos, P.N.; Tsompanakis, Y. Base Sliding and Dynamic Response of Landfills. Adv. Eng. Softw. 2010, 41, 349–358. [Google Scholar] [CrossRef]
  24. Zania, V.; Tsompanakis, Y.; Psarropoulos, P.N. Seismic Displacements of Landfills and Deformation of Geosynthetics Due to Base Sliding. Geotext. Geomembr. 2010, 28, 491–502. [Google Scholar] [CrossRef]
  25. Feng, S.-J.; Chang, J.-Y.; Chen, H.-X. Seismic Analysis of Landfill Considering the Effect of GM-GCL Interface within Liner. Soil Dyn. Earthq. Eng. 2018, 107, 152–163. [Google Scholar] [CrossRef]
  26. Feng, S.-J.; Chang, J.-Y.; Shi, H.; Zheng, Q.-T.; Guo, X.-Y.; Zhang, X.-L. Failure of an Unfilled Landfill Cell Due to an Adjacent Steep Slope and a High Groundwater Level: A Case Study. Eng. Geol. 2019, 262, 105320. [Google Scholar] [CrossRef]
  27. Kavazanjian, E., Jr.; Matasovic, N.; Bonaparte, R.; Schmertmann, G.R. Evaluation of MSW Properties for Seismic Analysis. In Proceedings of the Specialty Conference on Geotechnical Practice in Waste Disposal, New Orleans, LA, USA, 24–26 February 1995; 1995; pp. 1126–1141. [Google Scholar]
  28. Yu, Y.; Rowe, R.K. Modelling Deformation and Strains Induced by Waste Settlement in a Centrifuge Test. Can. Geotech. J. 2018, 55, 1116–1129. [Google Scholar] [CrossRef]
  29. Feng, S.-J.; Chang, J.-Y. Seismic Analysis of Landfill Using Advanced Numerical Approach Considering Material and Contact Nonlinearity. Eng. Geol. 2023, 312, 106955. [Google Scholar] [CrossRef]
  30. Marti, J.; Cundall, P. Mixed Discretization Procedure for Accurate Modelling of Plastic Collapse. Int. J. Numer. Anal. Methods Geomech. 1982, 6, 129–139. [Google Scholar] [CrossRef]
  31. Chen, Y.; Li, J.; Yang, C.; Zhu, B.; Zhan, L. Centrifuge Modeling of Municipal Solid Waste Landfill Failures Induced by Rising Water Levels. Can. Geotech. J. 2017, 54, 1739–1751. [Google Scholar] [CrossRef]
  32. Indrasenan Thusyanthan, N.; Gopal Madabhushi, S.; Singh, S. Centrifuge Modeling of Solid Waste Landfill Systems—Part 1: Development of a Model Municipal Solid Waste. Geotech. Test. J. 2006, 29, 217–222. [Google Scholar] [CrossRef]
  33. Serón, F.J.; Sanz, F.J.; Kindelan, M.; Badal, J. Finite-Element Method for Elastic Wave Propagation. Commun. Appl. Numer. Methods 1990, 6, 359–368. [Google Scholar] [CrossRef]
  34. Anbazhagan, P.; SivakumarBabu, G.; Lakshmikanthan, P.; VivekAnand, K. Seismic Characterization and Dynamic Site Response of a Municipal Solid Waste Landfill in Bangalore, India. Waste Manag. Res. 2016, 34, 205–213. [Google Scholar] [CrossRef]
  35. Naveen, B.P. Measurement of Static and Dynamic Properties of Municipal Solid Waste at Mavallipura Landfill Site, India. Int. J. Geo-Eng. 2018, 9, 26. [Google Scholar] [CrossRef]
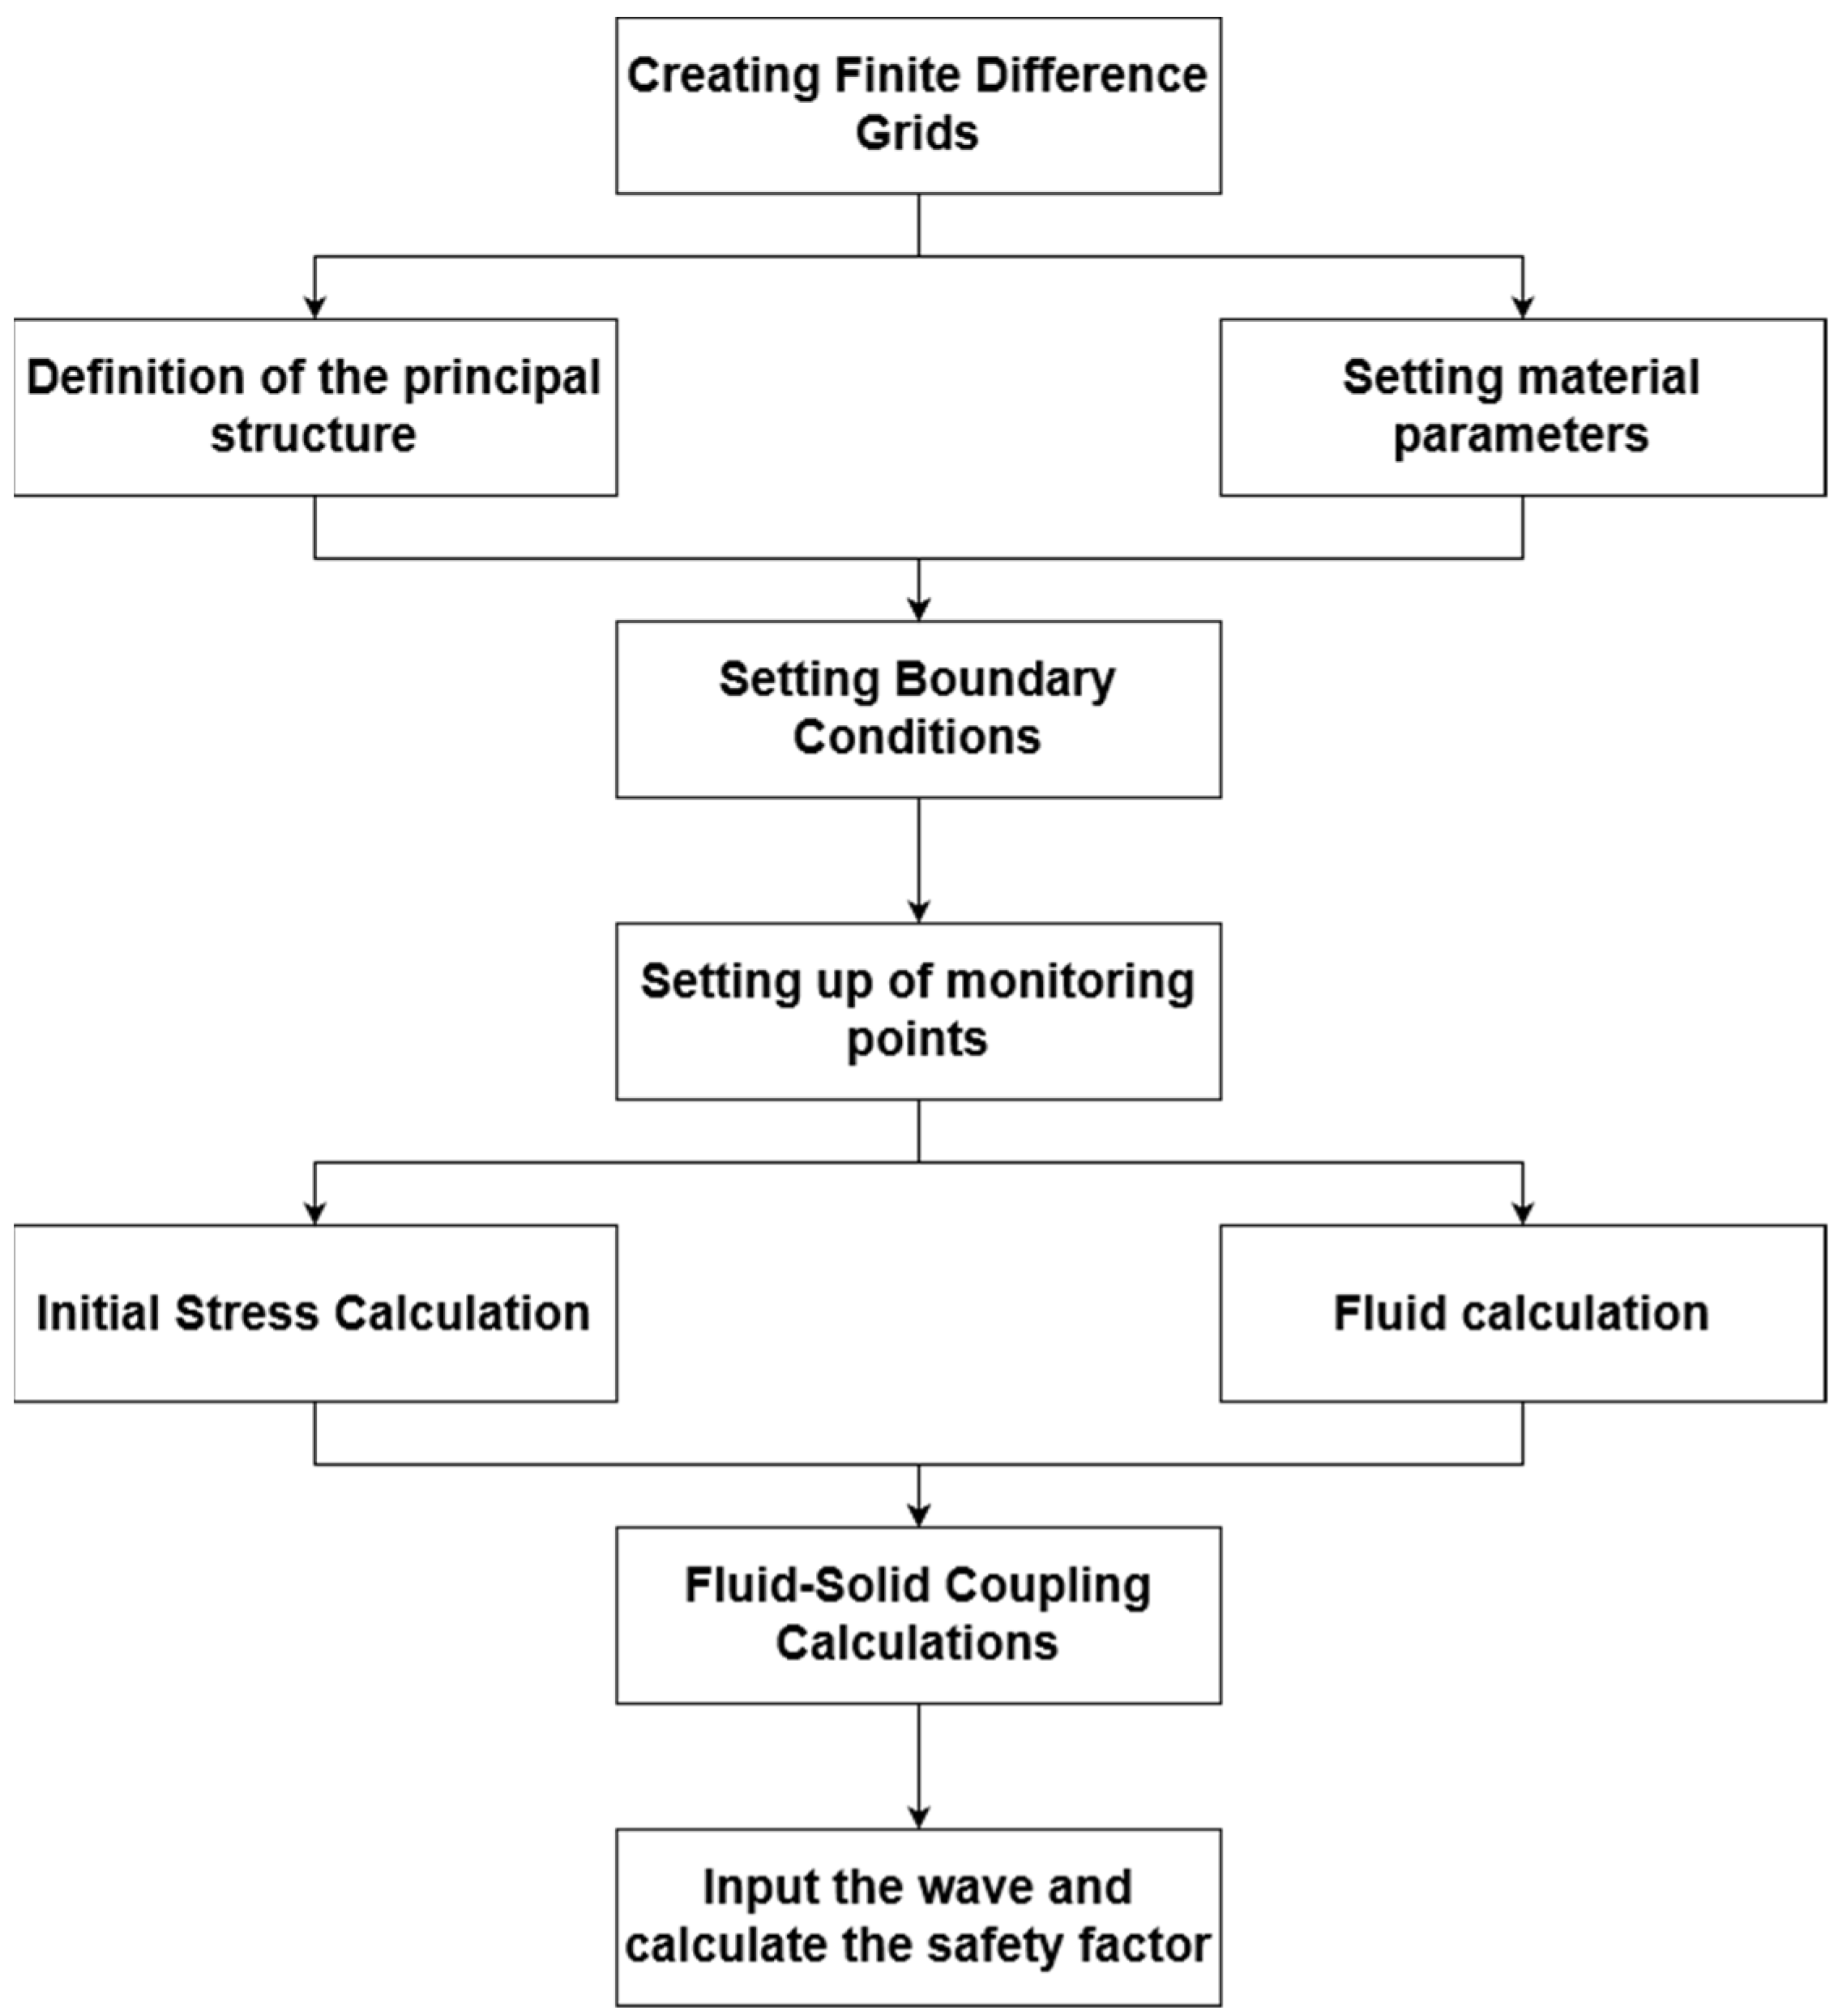
Figure 1. Flow chart of landfill dynamic calculation method.
Applsci 14 03006 g001
Figure 2. Landfill centrifuge test model and computational model: (a) centrifuge test model, and (b) computational model.
Applsci 14 03006 g002aApplsci 14 03006 g002b
Figure 3. Landfill calculation model background grid (xoz plane).
Applsci 14 03006 g003
Figure 4. Free field absorption boundary.
Applsci 14 03006 g004
Figure 5. Comparison of acceleration time history of A1: (a) Rw = 0.25, kh = 0.13, and (b) Rw = 0.50, kh = 0.46.
Applsci 14 03006 g005
Figure 6. Comparison of the pore pressure response of different positions: (a) P5:Rw = 0.25, kh = 0.13 (b) P2:Rw = 0.50, and kh = 0.13.
Applsci 14 03006 g006aApplsci 14 03006 g006b
Figure 7. Comparison of the post-earthquake deformation of landfill: (a) centrifuge test (Rw = 0.25, kh = 0.46); (b) centrifuge test (Rw = 0.50, kh = 0.46); (c) horizontal displacement of FDM analysis (Rw = 0.25, kh = 0.46); and (d) horizontal displacement of FDM analysis (Rw = 0.50, kh = 0.46).
Applsci 14 03006 g007
Figure 8. Time history curves of the safety factor of low water level landfills and their corresponding relationships with the seismic response of pore pressure and displacement under various ground motions.
Applsci 14 03006 g008
Figure 9. Time history curves of the safety factor of high-water-level landfills and their corresponding relationships with the seismic response of pore pressure and displacement under various ground motions.
Applsci 14 03006 g009
Figure 10. The dynamic safety factor of a high-water-level landfill is calculated using the strength parameters when the destruction strain is 10% and 20%.
Applsci 14 03006 g010
Table 1. Basic physical parameters of the model material.
MaterialDry Density (kg/m3)Water Content
(%)
Porosity RatioPoisson RatioPermeability Coefficient (m/s)Friction Angle
(°)
Cohesion
(kPa)
Waste633451.60.31 × 10−510% destruction strain
18.418.0
20% destruction strain
24.028.6
Cemented soil bedrock21000.235.0500.0
Geomembrane10000.317.70.0
Disclaimer/Publisher’s Note: The statements, opinions and data contained in all publications are solely those of the individual author(s) and contributor(s) and not of MDPI and/or the editor(s). MDPI and/or the editor(s) disclaim responsibility for any injury to people or property resulting from any ideas, methods, instructions or products referred to in the content.