Article

An Innovative Polypropylene/Waste Cork Composite Material for Spirit and Wine Stopper Caps

1
Department of Mechanical Engineering and Industrial Design, High Engineering School, Universidad de Cádiz, Campus Río San Pedro s/n, 11510 Puerto Real, Cádiz, Spain
2
Departament de Ciencia de los Materiales e Ing. Met. y Q. I., Universidad de Cádiz, Campus Río San Pedro s/n, 11510 Puerto Real, Cádiz, Spain
*
Author to whom correspondence should be addressed.
Appl. Sci. 2024, 14(7), 3014; https://doi.org/10.3390/app14073014
Submission received: 17 January 2024 / Revised: 1 March 2024 / Accepted: 25 March 2024 / Published: 3 April 2024

Abstract

:
In the wine bottling process, thermoplastics are commonly used to manufacture the crown of cork stoppers. The production of agglomerated cork stoppers generates a type of waste called cork powder (CoP) in large volumes with known properties but which are still underutilized. At present, although there are many agrocomposites available with additives such as natural fibers or solid residues from agricultural products, there are no studies describing the formation of these agrocomposites from petroleum-derived synthetic plastics combined with cork dust as a reinforcement for the polymeric matrix. The present study describes a novel agrocomposite, which has been obtained by mixing polypropylene-type materials, as they are some of the most widely used and versatile thermoplastics, with cork dust, which is a waste product obtained from the cork industry. The composite is obtained directly, without the need for grafting, adhesive polymers, or coupling agents. A superior mechanical performance compared to the unprocessed polymer was highlighted in the test results, thus evidencing the reinforcing function played by the waste in the polymer matrix. Therefore, this novel agrocomposite could be a promising alternative to replace some petroleum-derived synthetic plastics, which are currently experiencing high demand. The use of this new agrocomposite is well aligned with sustainability strategies, the principles of the circular economy, and oriented towards the fulfilment of the Sustainable Development Goals required by the European Union, considering that it contributes (a) to recycling agricultural waste that would otherwise be difficult to recover and valorize; (b) to the reduction in the CO2 footprint; and (c) to promoting the use of high-quality secondary raw materials.

1. Introduction

One of the biggest global consumers of synthetic plastic materials is the wine industry, a fact emphasized in both the packaging and bottling process [1]. Whether through a plastic or cork stopper, the industry’s plastic consumption has led to a proportional surge in waste generation [2]. In addition, the production of cork stoppers called “cabezudos” has been carried out, which are composed of a core of synthetic agglomerate cork fused, through a solid adhesive bond, with materials such as plastic (for example, PP), wood or even the metal alloy Zamak in its upper part [3]. Zamak is a non-ferrous metal alloy basically formed of zinc, aluminum, magnesium and copper, which, together, give rise to its name [4]. This innovative design safeguards the wine by ensuring the cork’s contact while shielding the ensemble from external elements. The use of microgranulated agglomerated cork makes possible the use of very effective methods to extract 2,4,6-trichloroanisole in wine, such as the use of supercritical fluid [5,6]. Figure 1 illustrates the production scheme of this type of “cabezudo” stopper of the two input flows: blue for the input flow of crowns and yellow for the input flow of cork spikes; the brown output flow corresponds to the finished and assembled product.
In the production phase, the cork and crowns move in parallel, with the crowns strategically oriented for facile union. The adhesive is applied to the inner face of the crown, accommodating the insertion of the cork, and the components are pressed together to ensure proper assemblage. Finally, the finished product exits the machine, aided by a manipulator robot placing each stopper in predetermined locations or collecting them as bulk stoppers in boxes. Specialized feeders and orienters, adapted for each crown and cork variant, ensure a fluent flow in this process.
Natural cork, a biomaterial with a global demand exceeding 280 kilotons annually [6], sees approximately 20–30% transformed into CoP, used for various industrial purposes, such as fillers for stoppers [7]. Previous studies [8,9,10] have successfully explored the manufacture of compounds by mixing this material with polymeric matrices like PE or PP. Brites et al., 2019 [11,12] concluded that CoP’s dispersion in a PP matrix achieves better results with smoother and more easily processable surfaces than with HDPE. From the point of view of composite construction, CoP stands as the fundamental load-bearing component of the composite, while the polymer matrix acts as the binder, linking and filling cells to distribute external loads efficiently. Moreover, some studies, such as [13], highlight agglomerated cork’s amphiphilic properties, enabling easy blending with polymeric elements such as latex, polyethylene or polyurethane for wine stopper production.
During the production of agglomerated cork spikes (sticks) currently used to form wine bottle stoppers, significant volumes of cork powder (CoP) emerge from cutting and sanding operations, free of impurities, making them highly desirable for utilization [14]. This material generates cork powder from the original raw material at a proportion of 20–30%, a fact corroborated in references such as [15,16,17].
Given this significant volume and periodicity, opportunities arise for circular economy models where this resource could produce composites in tandem with thermoplastics frequently used in the packaging industry [18,19,20].
Traditionally, this material was converted into pellets for energy through combustion due to its limited commercial value [9]. However, it can be valuable for alternative uses within a circular economy scenario in the geographical area where commercial activities are generated [21].
This study specifically details the procedure for obtaining an innovative agrocomposite material derived from the combination of conventional CoP and PP, a semi-crystalline polymer widely used due to its easy handling, chemical resistance, low density and relatively affordable cost [22].
The produced material conforms to the required mechanical and rheological criteria for effective utilization, particularly in industries like food and wine packaging, where synthetic plastics play a crucial role. Additionally, this product is adaptable for molding through injection molding and extrusion-based 3D printing machines, with the flexibility to adjust the proportion of both components (CoP and polymer). As an example, CoP containing 40% by weight of additive was successfully processed using a twin-screw extruder.

2. Materials and Methods

2.1. Equipment and Materials

Due to its nature and annual production volume, CoP has been identified as an appropriate byproduct. Furthermore, it is classified as a waste with no guarantee of recovery. Table 1 details the chemical properties and the generation procedure of the CoP used in this study, which was obtained in 2021 from a facility belonging to “Herederos de Torrent Miranda” in the province of Cadiz, Andalusia, Spain.
In addition, PP, whose properties are summarized in Table 2, was used in the tests carried out. This was provided by Totalenergies, Barcelona, Spain. The same company that provided the CoP suggested the use of this thermoplastic because it is the one they commonly use in the injection molding processes of their stopper caps.
Figure 2a shows the appearance of CoP. An oven was used to dry the CoP for 24 h at 100 °C, before the mixing step was carried out [24]. The materials, CoP and raw PP, were subjected to a melt compounding process in a twin-screw extruder, model SHJ20, SIEPLA, Barcelona, Spain. The process conditions were Profile T: 140-190-190-190-190-190-160-190; 400 rpm. Sofía Jurado-Contreras et al. [25] conducted an experiment to create a composite by combining polylactic acid (PLA) and olive pits (OPs). This process required a lower rotation speed, but the overall method for manufacturing the composite was the same as that used in our agrocomposite. The goal was to achieve the proper fusion between the PLA and the OPs. To do this, they tested different combinations of parameters, such as the temperatures in each zone of the extruder, the rotation speed of the screws, and the correct feeding of the materials to be intimately mixed. They also took into account the residence time in each zone. In the end, the result was a composite filament ready to be pelletized.
The CAG was then fragmented using WSGM-250 equipment manufactured by J. Purchades, Madrid, Spain. This mill, equipped with stainless steel blades, is specifically designed to cut plastic materials, with an aim to obtain a particle size suitable for the injection process. Subsequently, the resulting material was screened to a minimum size of 3 mm, which is considered suitable for the injection process [19]. The prototype tests were carried out following the performance characteristics and mass distribution of the CoPX:PPY mixture, using a maximum amount of product. Table 3 summarizes the composition percentages of each CAG that were used for the tests.

2.2. Methodology

2.2.1. CAG Manufacturing Process

Figure 2b displays the chopped CAG obtained and shows their uniform extrusion, resulting in solid masses before they go through the chopping process in the knife mill. It is relevant to note that the morphology, composition and granulometry of the CoP remained constant throughout, the only variation being the moisture content of the material, which ranged between 2.46 and 2.63% (at 100 °C for 24 h). The chopping process produces a granular material with a controlled size, suitable for further processing in an injection molding machine.

2.2.2. Description of Materials and Test Methods

In addition, characterization of the mechanical and rheological properties of the materials was carried out, as well as analysis of their microstructure and chemical composition, in order to assess the impact of the filler on the material composite.
A.
Structural and chemical characterization
The materials were subjected to analysis by scanning electron microscopy (SEM) and related techniques to examine their morphology at the microscopic level and the distribution of phases present in the CAG, as well as their composition. The samples were partially coated with silver colloid in order to prevent charging effects during SEM experiments. In particular, the CoP powder and the two agrocomposites resulting from their combination (with a CoP content of 20% and 35% by weight) were examined using a Tescan Solaris FE-SEM/FIB, Brno, Czech Republic, microscope equipped with an X-ray detector. SEM micrographs were acquired with an electron landing energy of 2 keV and a beam current of 30 pA at various magnification levels, with a working distance set at 20 mm.
Fourier transform infrared spectroscopy with attenuated total reflectance (FTIR-ATR) was also carried out on the reference samples in order to identify the constituents of CoP, crude PP and agrocomposites. The test was carried out on n = 3 replicas of each sample. This method provides information on the presence or absence of specific functional groups, as well as on the chemical structure of the compounds present, serving as a reference for the initial formulations. For this analysis, a PerkinElmer Spectrum 3, Shelton, CT, USA was used with the GladyATR Vision accessory, which allows for the recording of FTIR spectra of solid, liquid and gaseous samples in the mid- and near-infrared range.
B.
Mechanical properties
Subsequently, the CAG was processed using an Engel Victory 28 injection molding machine, manufactured by Engel Group, Schwertberg, Austria, in order to obtain the necessary test samples for mechanical characterization. The samples were injected at 180 °C and 3 bar pressure. Analogous to a previous study [13], the mechanical properties of the materials were evaluated using specimens specifically designed for each of the composites and the blended PP, following the guidelines of UNE-EN ISO 527-2 [26] for tensile testing. Charpy impact tests were carried out according to UNE-EN ISO 179 [27] to determine the Charpy impact strength of the CAG, using a Charpy-Izod IMPATS 15 equipment from Metrotec, Lezo, Spain. Five to ten specimens, as specified by the relevant standard (80 mm × 10 mm × 2 mm, length, width, thickness), were tested for each material. These tests were carried out with a pendulum of nominal potential energy of 2 J–5 J and an impact velocity of 2.9 m/s.
To assess the tensile strength characteristics of the materials, we employed a Tinius Olsen H10KS Universal Testing Machine, San Diego, CA, USA, in accordance with the UNE-EN ISO 527-1 [28] and UNE-EN ISO 527-2. This machine offers the flexibility of using two types of load cells—100 N and 10 kN—depending on the specific force range needed for the test. Additionally, it boasts a maximum displacement between grips of 1100 mm, a force sampling range of 200 Hz (nominal), and an extension reading resolution of 0.001 mm. The statistical calculations were performed by using the software package STATGRAPHICS v.19, under license from the University of Cádiz.
C.
Thermal and rheological properties
A flowability measurement was conducted to evaluate how the residue affects the rheological properties of the polymer composite. The flowability indicator (MFI) was determined using an MP600 extrusion plastometer manufactured by Tinius Olsen, Kongsberg, Norway, following the guidelines established by UNE-EN ISO 1133-1 [29]. Masses of 5 and 7 g of the chopped material were introduced under a load of 2.16 kg, at an inner cylinder temperature of 230 °C, with a shear time interval of 5 s.
In accordance with a previous study [15], the thermal characterization was complemented with DSC (Differential Scanning Calorimetry) analyses. DSC measurements were performed for both CAG and pure materials separately (processed PP and CoP), using 1/200 DSC equipment from Mettler Toledo, Barcelona, Spain, connected to a cryogenic device with a working range between −37 °C and 200 °C. This apparatus facilitates the injection of a gas stream into the sample chamber. Each test involved using approximately 10 mg of the sample under the specified experimental conditions: a temperature ramp of 20 °C/min within a range of 30 °C to 350 °C, with a nitrogen (N2) stream set at 50 mL/min. These tests were carried out according to UNE-EN ISO 11357 [25] and were performed in 40 μL aluminum crucibles, using a five-phase thermal program detailed in the following specifications:
  • Phase 1: (−37)–100 °C (10 °C/min);
  • Phase 2: 100 °C (20 °C/min);
  • Phase 3: 100–(−37) °C (10 °C/min);
  • Phase 4: (−37) °C (20 °C/min);
  • Phase 5: (−37)–200 °C (10 °C/min).
Equation (1) was used to calculate the degree of crystallinity, χc [24,30]:
χ c = H cPP H cAgro · w PP
where
  • HcPP is the enthalpy of crystallinity of the pure polymer at 100% crystallinity [31];
  • HcAgro is the enthalpy of crystallinity of the CAG;
  • wPP is the percentage of mass polymer in the CAG (1, 0.8, 0.7 and 0.65).
D.
Injection molded plastic
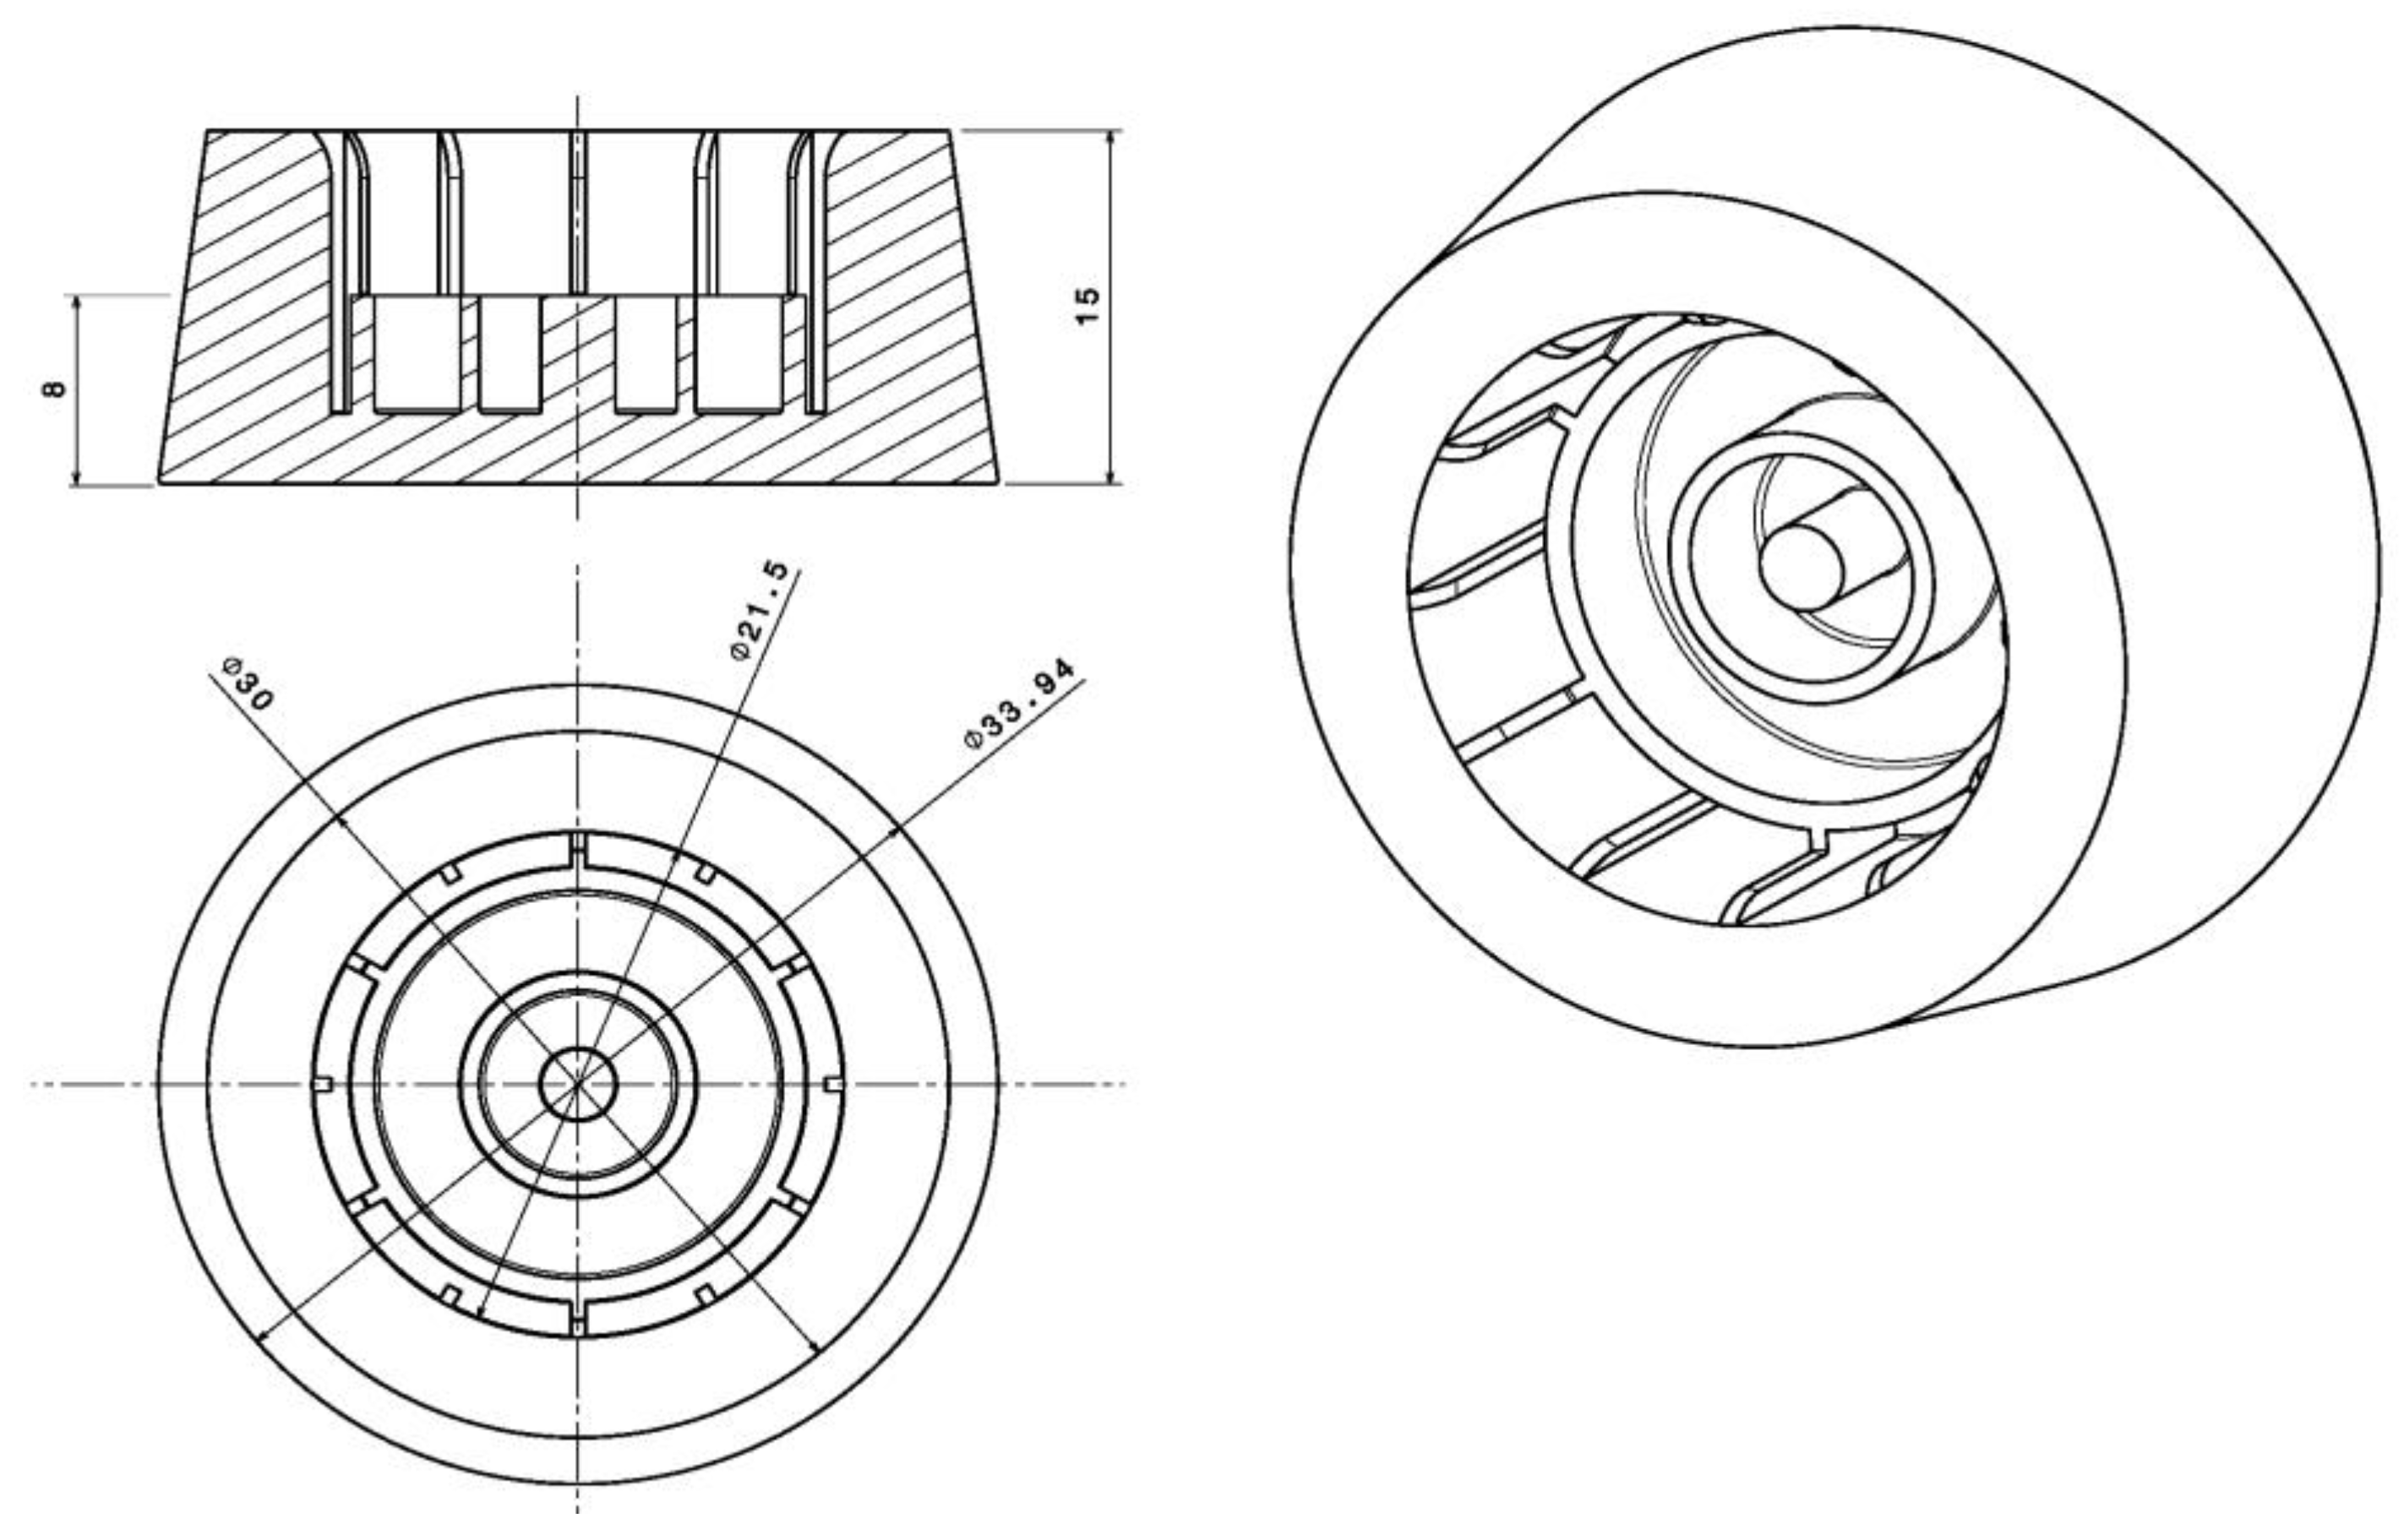
Direct injection tests were carried out using a Krauss Maffei model CX80Tn fuel injection pump, which has a twin screw and is owned by a Jerez, Spain packaging company. In this process, a generic 3D model was used for the manufacture of oversized crowns of cork stoppers, as shown in Figure 3.
E.
Adhesion cap–cork test
Figure 4 shows the preparations for the validation of crowns manufactured with CAG material as closures for fortified wines, which requires verifying proper adhesion with commercial cork spikes. To achieve this, a commercial adhesive (Technomelt Supra 100Plus22, Düsseldorf, Germany Henkel AG & Co., KGaA) used by automated cork stopper manufacturers was employed. In this study, the adhesive had to be applied manually. This approach allowed for the determination of the exact amount of adhesive required to complete the bonding between the crown and cork elements. A cork spikes previously used in reference [13] was obtained for the adhesion test, and crowns made from 20:80 and 30:70 blends were evaluated, with 3 replicas for each blend (n = 3). A Dexter Power HG-DP2000-LCD 2000 W, Ronchin, France heat gun was used to melt the adhesive, which was heated to 190 °C in a crucible covered with aluminum foil, as recommended by the adhesive manufacturer for proper application. During the thermoplastic adhesive heating process, airflow rate (300–350 L/h) and time to reach melting (150–180 s) were controlled. To determine the adhesive mass required for the spindle–crown bond, weighing of the adhesive and the assembly was performed individually before and after impregnating the melted adhesive. Finally, the spindle was manually pressed into the internal housing of the crown for a few seconds until secure adhesion without loosening was achieved.

3. Results and Discussion

3.1. FTIR-ATR and Granulometry Analyses

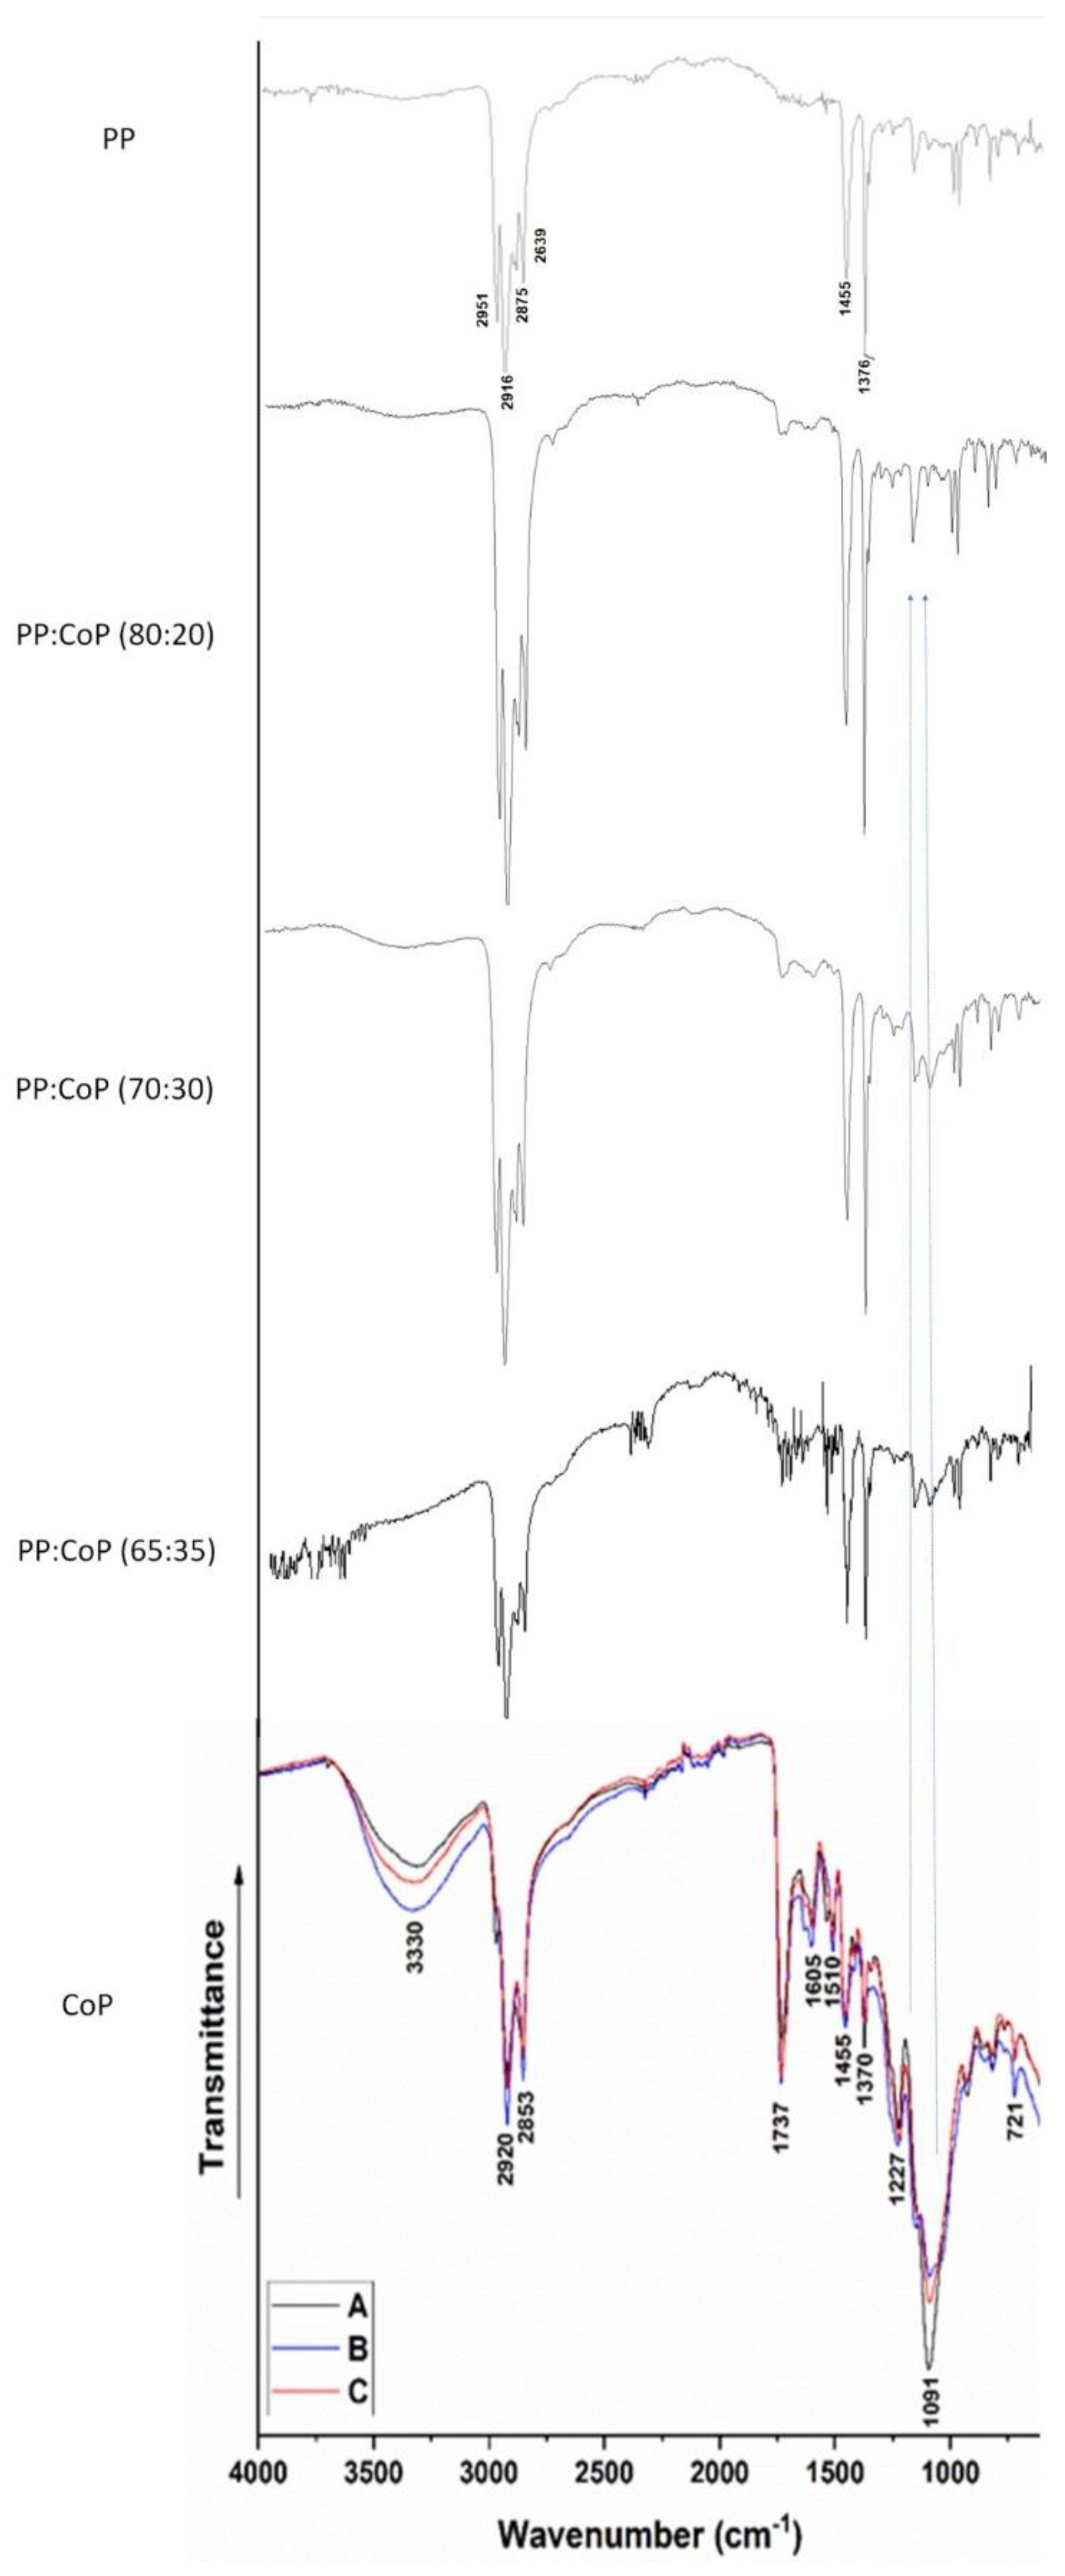
The results of the FTIR-ATR analyses are shown in Figure 5. The different bands are linked to the existence of particular functional groups. In the spectrum of the processed virgin polypropylene, it is possible to highlight the six most characteristic groups of bands for this thermoplastic: the four bands between 2951 and 2839 cm−1, the stretching vibrations of the CH bonds, the band at 1455 cm−1 that coincides with the asymmetrical bending of CH3 and the symmetrical band that appears at 1376 cm−1.
Three superposed spectra corresponding to CoP are shown in the lower part of Figure 5, which are the results published in [13]. For the three types of agglomerated cork, samples from wine corks (A, B, C) have been taken as a reference. They exhibit characteristic vibrations of suberin, lignin and polysaccharides, the main constituent of cork. Thus, in the CoP spectrum, the band at approximately 3330 cm−1 is recognized as the stretching vibrations of O-H bonds. The distinct peaks observed in the bands at 2920 and 2853 cm−1 are indicative of the stretching vibrations of CH2 bonds within the alkyl chain of suberin [11]. The band at 1737 cm−1 is attributed to the stretching vibrations of C=O bonds present in the ester groups of suberin [32]. The two most characteristic peaks of the CoP spectrum are at 1227 and 1091 cm−1, which correspond to the C-O bond tension typical of the esters of the suberin and secondary alcohols of the polysaccharides, respectively.
The spectra associated with the CAG display distinct peaks for CoP, such as those at 1227 and 1091 (marked with arrows), and for PP, such as those at 1455 and 1376 (although the latter are also present in CoP but to a lesser extent). Comparing the evolution of these peaks across the three CAGs in terms of relative proportions reveals a variation in intensity as the proportion of CoP increases.
In Figure 6, SEM micrographs of the specimens’ fractures are shown. These correspond to the agrocomposites with different CoP contents, indicated at the top of each column, to investigate the morphology and distribution of the structures involved. According to the type of footprint presented in the 75× micrographs (the first row), it is possible to determine that the material suffers typical stress fractures with weak spots or small cracks that lead to the crazing of the material. Concerning the 500× magnification micrographs (the second row in Figure 6), the examinations performed on the composites enabled the observation of filler particles formed by blending PP with CoP. These particles exhibit micrometric dimensions and are evenly dispersed throughout the plastic matrix without requiring the addition of coupling agents.
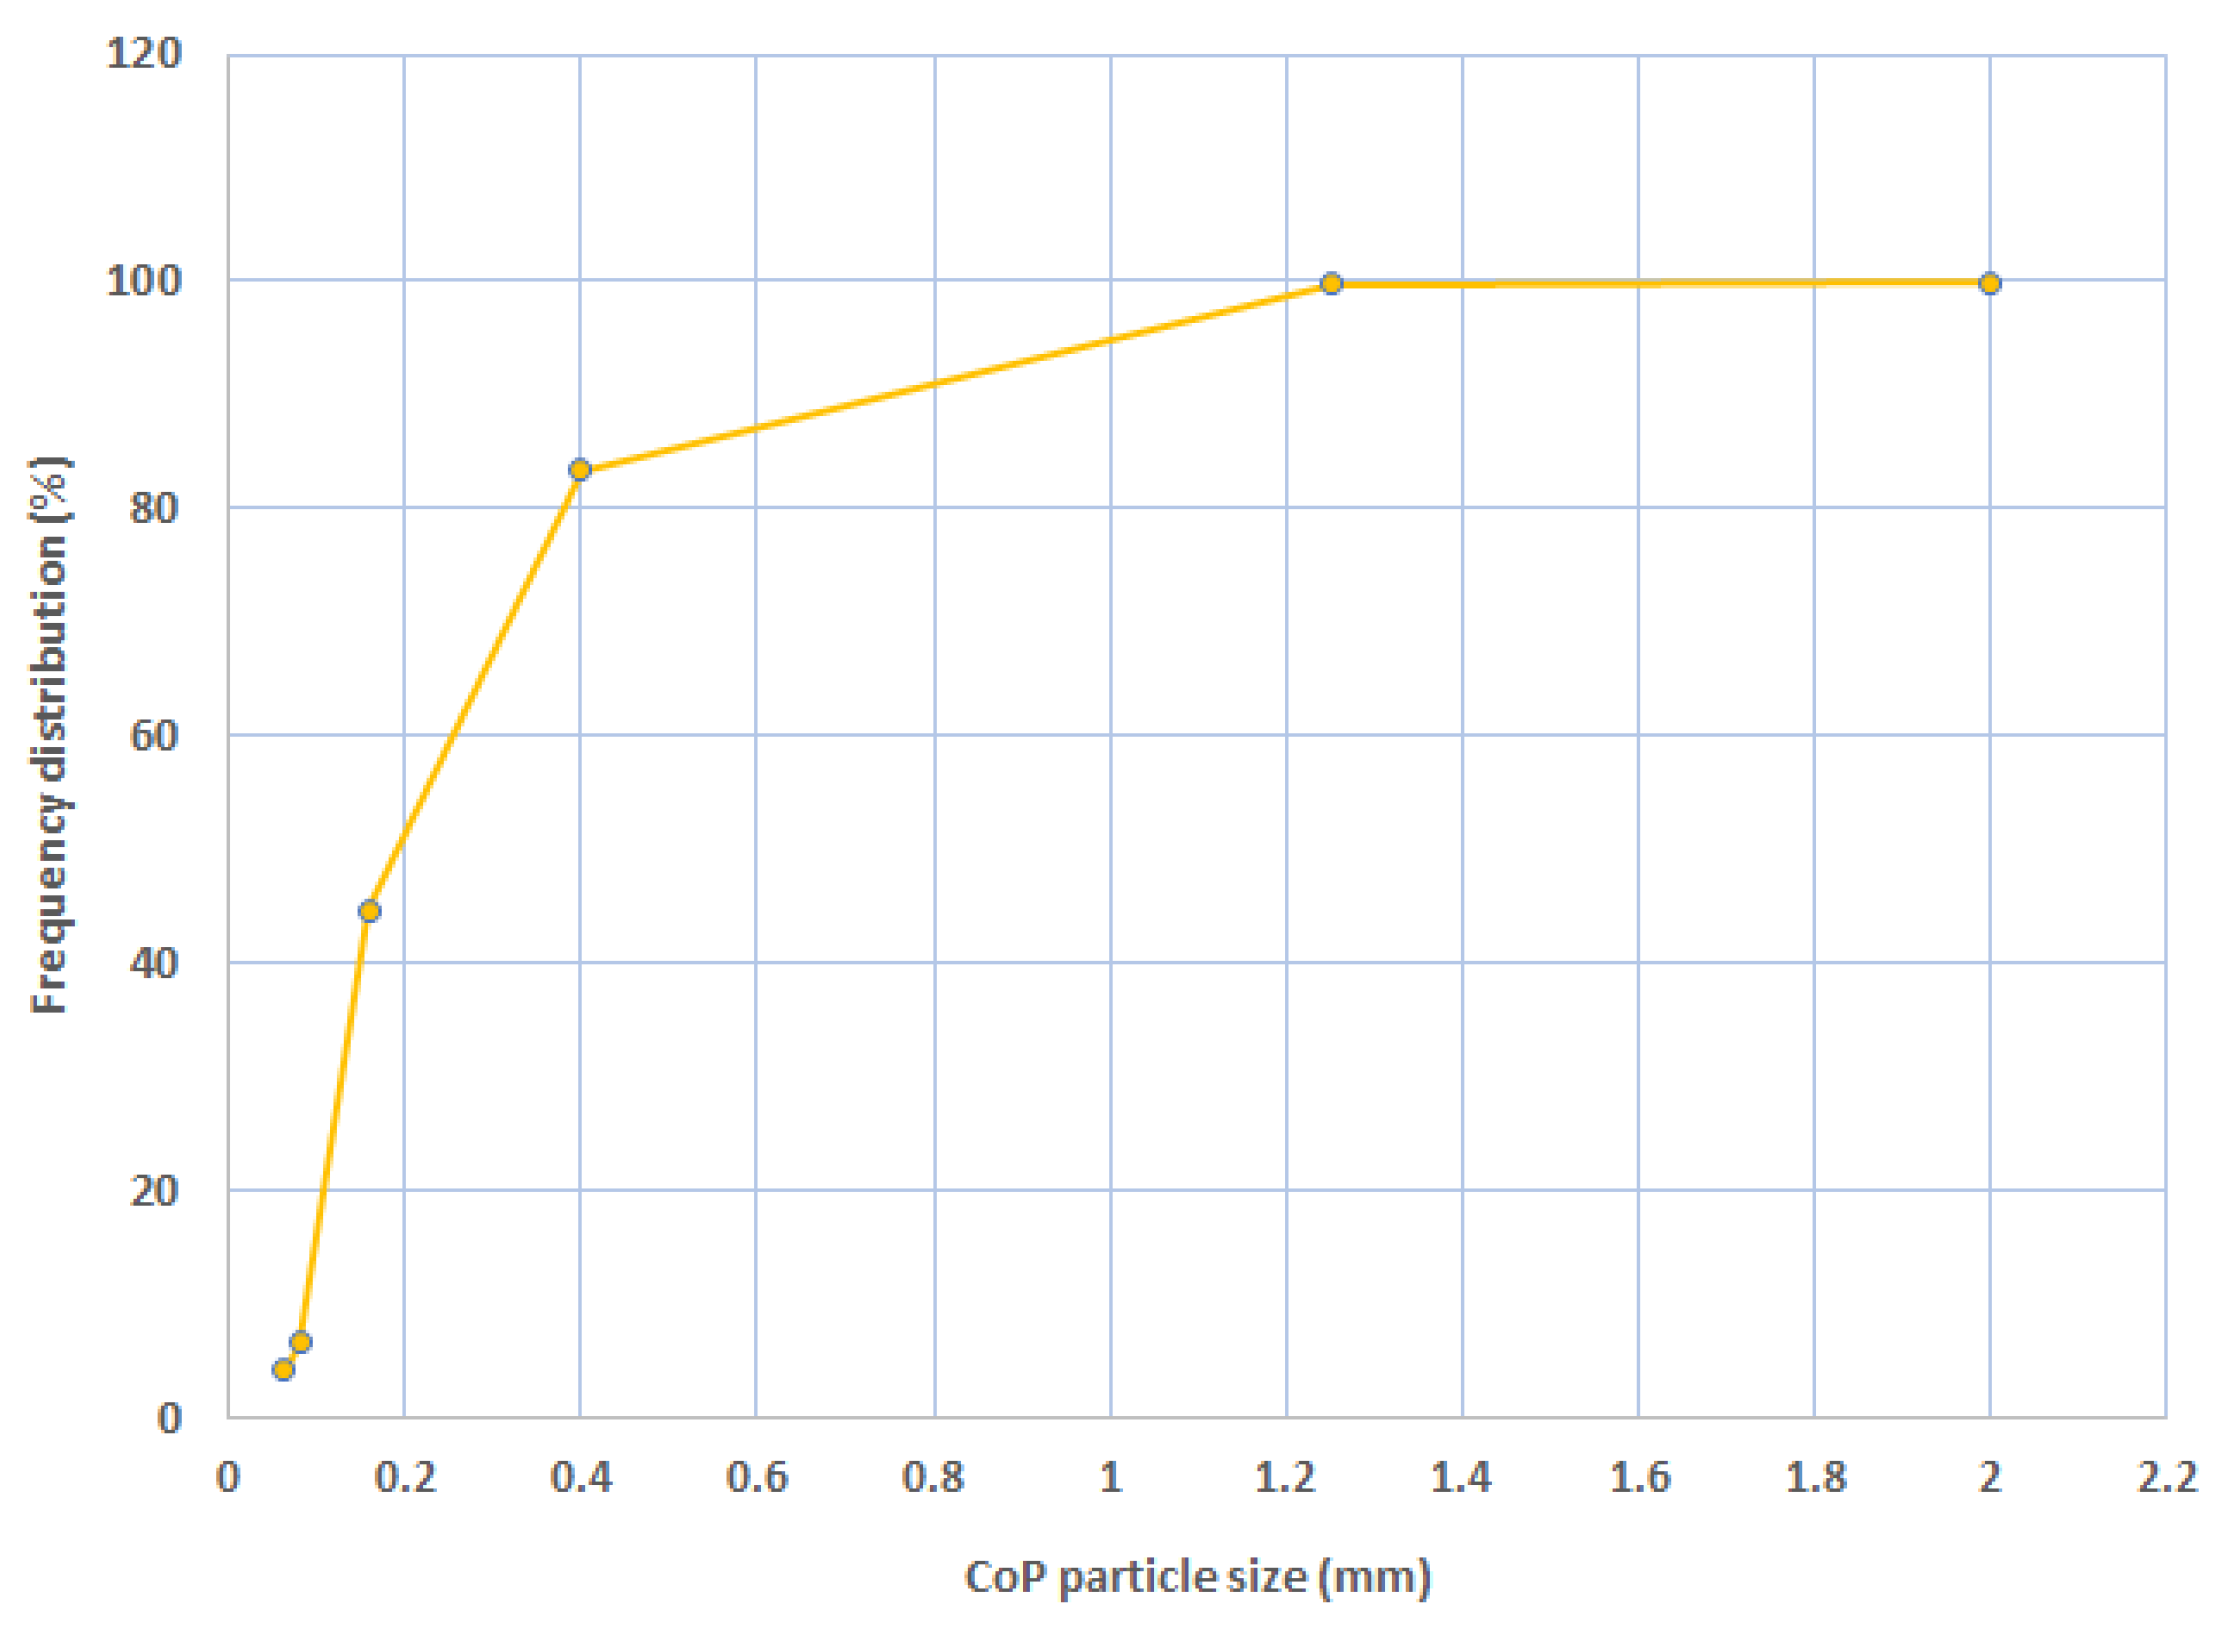
The absence of empty spaces illustrates a favorable interaction between the cork particles and the polymer matrix [11]. It is possible to distinguish how the agglomerations and the cork microstructure are rendered as hexagonal/pentagonal (honeycomb-like) or rectangular (brick wall-like) patterns, when properly aligned, as shown in the higher-magnification images (the third row). Starting from the mixture at a ratio of 30:70, this starts to be displayed and is most easily seen in the 35:65 mix, where particles of around 200 μm are observed. This coincides with the average particle size presented in the granulometric curve of Figure 7, where the majority of the CoP particles were measured as less than 1 mm, and they exhibited a tendency to aggregate into larger clusters ranging from 100 to 400 μm. Similarly to references [13,33], the cork cells along the axial/tangential section show rectangular cross-sections, with dimensions of around 20–30 μm × 40–50 μm, and 1 μm thick walls, approximately. The particle size is relevant for the mechanical properties and the performance of the plant-based filler in the polymer matrix.
Concerning the material’s microstructure, the surface morphology of the CAG revealed interconnected fibrillated structures, forming agglomerations that entrap chained cells. As depicted in the micrographs at 75× magnification in Figure 6, this arrangement of components within the material results in the development of voids and/or cavities within the plastic matrix, significantly impacting the mechanical performance, particularly in terms of elongation and fluidity.

3.2. Thermomechanical Property Tests

Figure 8 illustrates the outcomes of the tensile tests, highlighting the distinct mechanical behavior of the CAG based on its composition, specifically, the CoP/polymer ratio. With an increase in the CoP content, the value of the elastic modulus (Young’s modulus) does not vary significantly with respect to the virgin polymer except in the 20% mixture, which presents a particular dispersion of the average values. However, it is also the one that presents the greatest deviations, probably due to the lower amount of CoP load in this mixture, as the rigidity is not affected as a consequence of providing a reinforcing characteristic to the polymer [34,35], without using a coupling agent like MAPP [36], and using a PP with similar mechanical properties. This phenomenon is revealing considering that the CoP content is increased by up to 35%. Only a slight decrease in the modulus in the 20% mixture stands out, coinciding with the same phenomenon that occurred in the stress, and an inverse phenomenon emerges from the elongation. However, if the minimum and maximum values of the error range or standard deviations are compared, it is possible to confirm the regularity of this mechanical property of CAG. It should be observed that the recorded value for the pure PP remains consistent with the one presented in Table 2, stemming from the temperature treatments applied during the extrusion and injection processes. However, it is in this mixture that the greatest dispersion has been achieved, noting that the maximum value of the range is similar to the average of the previous mixture.
This observed phenomenon can be elucidated by considering the microstructural characteristics identified in the CAG.
As mentioned earlier, the SEM analysis revealed interlinked fibrillated polymer structures formed due to the inclusion of CoP, along with the development of small voids/cavities. At the microscale, these voids/cavities and fibrils demonstrate resilience against substantial deformation prior to failure, thereby improving the material’s ductility and hindering crack propagation.
Therefore, the stability of the elastic modulus in the CAG with varying CoP content signifies the reinforcing role played by solid byproducts/wastes within the polymeric matrix, as reported by other researchers [37].
The data were subjected to parametric ANOVA tests within each dataset (n = 22), resulting in a significant Snedecor F value (F = 13.86) at a significance level of p < 0.05. Consequently, the time groups demonstrated an effect on the variable response (Young’s modulus).
The stress at break exhibited a slight decrease with the addition of the residue [37,38]. As depicted in Figure 9b, the incorporation of CoP led to a reduction in stress, with decreases of 15.8% and 28%, showing a slight decline for composites with 20 wt.% and 30 wt.% of filler compared to the processed raw polymer. Subsequently, the strain at break displayed a gradual recovery for higher filler contents up to 35%. This phenomenon reveals the stability of the agrocomposite when mixed with the load, in the same way as the elastic modulus. There is a slight increase in the elongation in the load mixes (20:80 and 35:65). It is strange that the elongation does not follow a decreasing trend with the increase in the load percentage, since, with this, it would also increase its fragility, a phenomenon that did not occur in this test. These phenomena of trend changes in the CAG blends may be attributed to the particle size of the CoP, as described in [39].
The ANOVA test within each dataset (n = 22) yielded a significant Snedecor F value for both strain at break (p < 0.05, F = 25.88) and elongation (p < 0.05, F = 971.47), signifying the influence of time groups on these variables.
The assessment of the impact fracture energy per unit area, Jc, was conducted through Charpy impact tests (Figure 9a). Similar to [35], the initially processed virgin PP exhibits high impact resistance, which gradually decreases with the addition of the plant-based filler until it remains relatively constant at a CAG of 35%. The loss of impact resistance could be due to PP degradation by chain scission [39]. Despite two heterogeneous materials being present, a perfect integration is observed in the mechanical behavior of the CAG. However, as in the case with charges of mineral origin, elevating the quantity of stress concentrators beyond a specific threshold may induce particle agglomeration, causing the material to gradually become brittle. Consequently, this can lead to rapid crack propagation and eventual material failure through fracture. This phenomenon is not perceived when the CoP content does not exceed 35%.
Similarly, the outcomes of the ANOVA tests within each dataset (n = 34) revealed a significant Snedecor F value (p < 0.05, F = 1461.45). Therefore, the time groups exerted an effect on the response variable (Charpy).
Similar to [40], the fluidity of the CAG increases as a function of the CoP content (Figure 9b), except for a slight drop in the 30% CoP mix, in which this resulting CAG property presents approximately the same rheological properties as virgin PP.
However, when a 35% load is added, the fluidity increases three-fold. This finding aligns with the observations documented by [11], when mixing 5 wt.% CoP caused a reduction of around 50% of the MFI, which was attributed to the extrusion process of the CAG. These phenomena of trend changes are characteristic of PP. Certainly, given that PP is a semicrystalline polymer, one can infer at the initial stage that the most degraded chains are likely to be those from the amorphous phase [39,41]
The ANOVA test within each dataset (n = 29) produced a significant Snedecor F value (p < 0.05, F = 182.12), indicating that the time groups had an impact on the MFI.
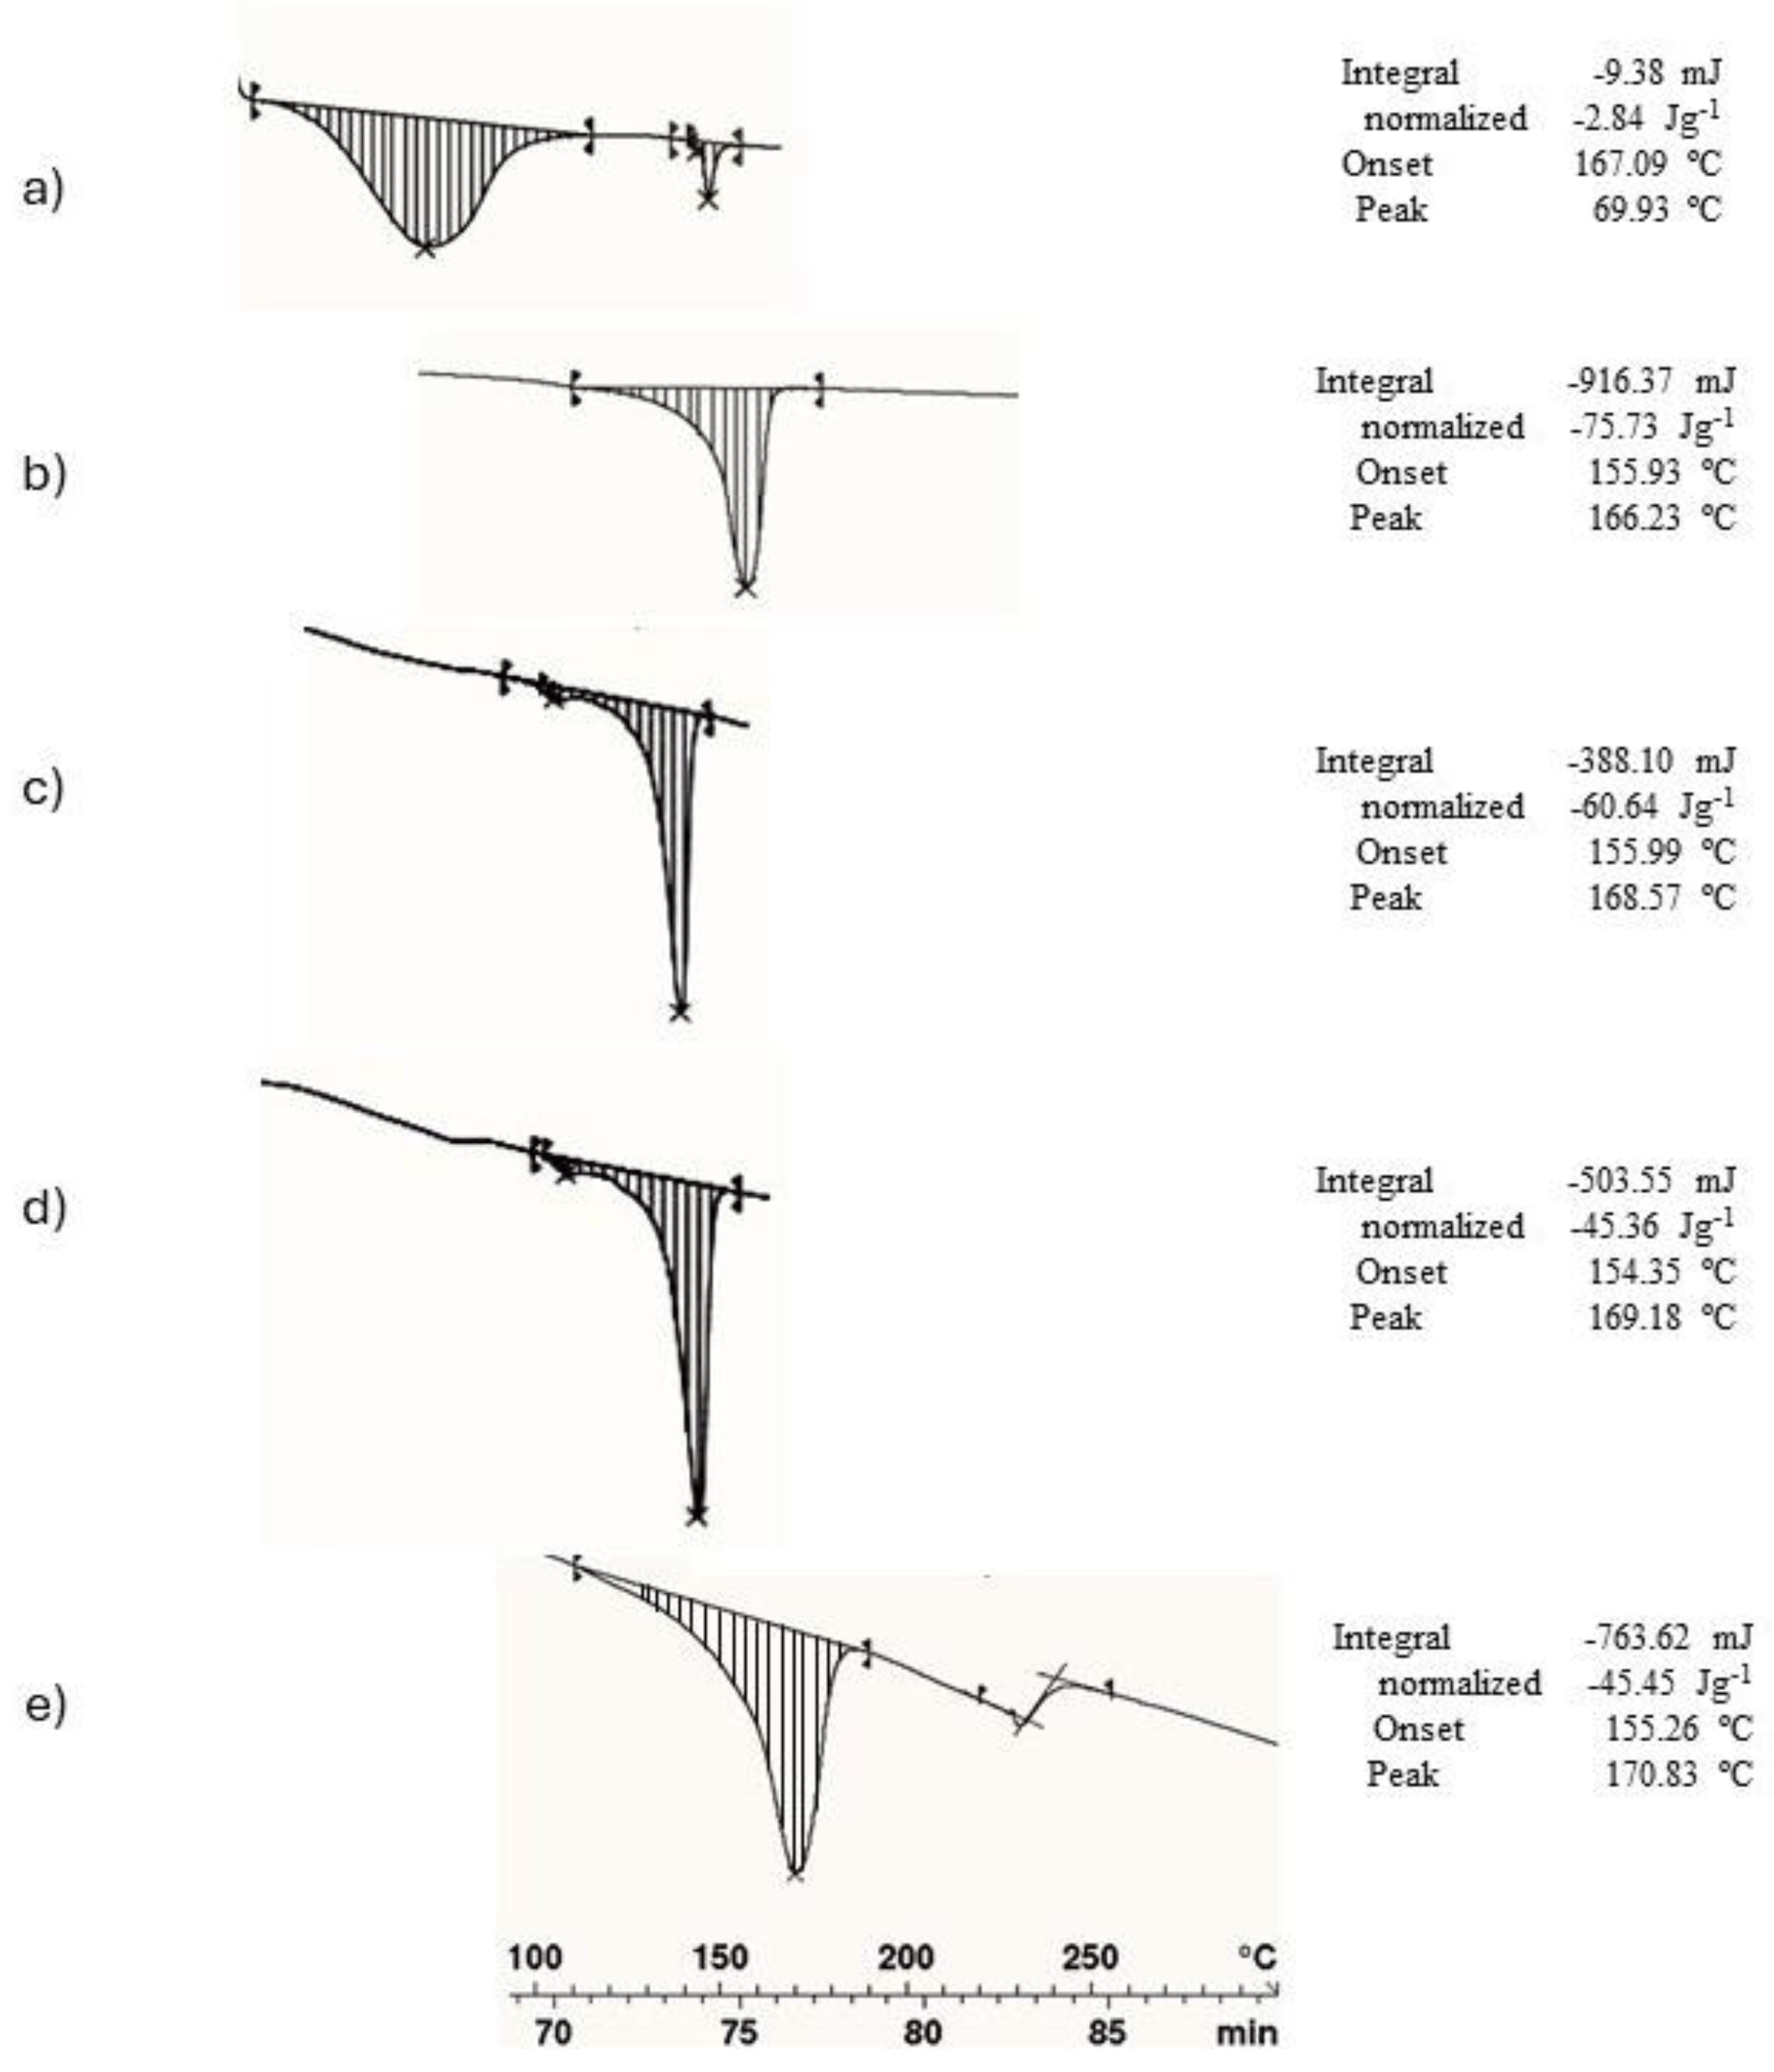
The thermograms depicted in Figure 10 display the DSC results for the 11.1 mg samples. The striped areas corresponding to the pure PP and the CAG exhibited remarkable similarity. The initial phase signifies material homogenization (these phases have been shortened to focus on the relevant processes), while the subsequent phase change indicates polymer melt (Tm). The following line visible in all graphs represents the pulse line or solidification. The enthalpy (ΔH) of the process and the subsequent crystallinity remained consistent across all the cases. The Tm of the pure CoP was approximately 169.93 °C, and the Tm of the processed pure PP was around 166.23 °C, whereas the Tm in the CAG (CoPX:PPY) ranged between 168.59 and 169.18 °C, suggesting no significant change with the addition of the CoP. For semicrystalline thermoplastics, in molten conditions, the long molecular chains form irregular entangled coils, while these chains rearrange themselves and form crystal-like structures when they solidify [42]. According to [38,43], DSC results show that the CAG also improved the nucleating activity of the CoP, making the crystallinity of PP occur at higher temperatures.
Table 4 presents a summary of the crystallinity rates of the CAG, calculated using Equation (1). It is evident that the crystallinity rate, χc, is not notably influenced by the augmentation of the additive content, according to [44]. Note how the 20:80 blend exhibits a 29–31% match between χc and the 30:70 [45] and a change of trend is revealed in the 35:65 mix, with crystallinity increasing once again. Similar to the case of the mechanical properties, this slight change in trend could be attributed to different particle sizes within CoP agglomerates. Additionally, it is likely that increasing the cork percentage may lead to an increase in the size of internal cells, which would become filled with polymer in its crystalline phases. These findings illustrate that CoP is a suitable additive that does not alter the crystalline properties of the polymer matrix.

3.3. Injection and Adhesion Cork Process

Taking into account the previously calculated melting temperatures (Tm), three series (n = 3) were injected: series A: masterbatch 10(30:70)CoP:90PP; series B and C: CoP:PP (30:70 and 20:80, respectively), at the calculated Tm, obtaining excellent results both in terms of appearance and internal geometric details (see Figure 11a). Identical injection parameters were used for all the agrocomposites: 200 ± 20 °C in a nozzle at a speed of 43.8 mm seg−1.
The actual mass used for each crown–cork set is shown in the graph of Figure 11a, having determined a unit mass per pellet of 43.88 ± 0.26 mg. The samples were completely adhered within 2 s of the surfaces contacting. As observed in Figure 11b, the samples manufactured using the masterbatch consumed more adhesive than the others: approximately one extra pellet (almost nine). This reveals a direct relationship between the thermoplastic mass and the amount of adhesive required for bonding. The other two series consumed a similar number of pellets (almost eight). In Figure 11b, the proper validity of the samples can be observed after being tested on the neck of a wine bottle.

4. Conclusions

This study adds value to a plentiful byproduct from the packaging industry, commonly referred to as CoP, which is massively generated during the manufacturing processes of stoppers in local factories which, in turn, are economically relevant in the area and have an extended impact throughout Spain and in other international wine producers. This finding allows companies to recirculate what used to be waste into a raw material with great production potential, which is in line with the global circular economy strategy.
The novel material was blended with traditional thermoplastics like PP, yielding a new composite material categorized as CAG, owing to its agricultural origin. The compatibility between the residue and polymer spans the entire compositional spectrum, with the micrometric filler seamlessly integrated within the polymeric matrix without notable defects. As shown, an increase in the CoP concentration to 35% does not significantly modify the mechanical characteristics of the CAG in relation to the properties of the virgin polymer. Additionally, the calorimetric results show that the polymer structure is preserved and, most importantly, so is the crystallinity. However, due to the formation of conglomerates of CoP with a particle size of 0.5 mm, variations in the MFI could occur that represent trend changes in this rheological property, which have been described by other authors. On the other hand, the adhesion of the cork spike to the new CAG-injected stoppers with different CoP mixtures revealed a direct relationship between the thermoplastic content and adhesive consumption. This correlation is ascribed to the inclusion of CoP in the polymer, thereby eliminating the associated economic expenses. The research further demonstrates the viability of producing components and mechanical assemblies from industrial byproducts using various manufacturing methods, including both conventional (extrusion, injection, etc.) and emerging (3D printing) techniques. This approach helps mitigate the costs associated with raw materials. For the packaging company that manufactures cork stoppers, if firmly committed to this solution, it will lead to them achieving cost savings proportional to the percentage of cork used in the stopper. This new CAG encourages the use of sustainable packaging in an industrial sector that is a large consumer of thermoplastics.

Author Contributions

Methodology, M.S., C.P.-M., G.A. and M.P.V.; Formal analysis, M.S., C.P.-M. and M.P.V.; Investigation, M.S., C.P.-M., G.A. and M.P.V.; Writing—original draft, M.S., C.P.-M. and G.A.; Writing—review & editing, C.P.-M. and M.P.V.; Supervision, M.P.V. All authors have read and agreed to the published version of the manuscript.

Funding

This work was funded by the Junta de Andalucía (Research group ref. TEP-181). Co-funding from the EU is also acknowledged. Furthermore, this work is part of the AGROCOM project, funded by the Call for Operational Groups 2020 (GOPC-CA-20-0004)—Junta de Andalucía, approved by Order of 30 July 2020. Grants aimed at supporting the operation of Operational Groups of the European Innovation Partnership (EIP) in the field of agricultural productivity and sustainability.

Institutional Review Board Statement

Not applicable.

Informed Consent Statement

Not applicable.

Data Availability Statement

The raw data supporting the conclusions of this article will be made available by the authors on request.

Acknowledgments

The authors would like to express their gratitude to the TORRENT group for providing the products. Special thanks are extended to the Peripheral Services of INMAR for conducting the FTIR analyses and to the Peripheral Services of IMEYMAT for conducting the SEM studies.

Conflicts of Interest

The authors declare no conflicts of interest.

Abbreviations

BycowBy-products/co-products/waste
CAGCork agrocomposite
CoPCork powder
CoPXPPYAgrocomposite, X% cork powder weight in grams and Y% PP weight in grams
DSCDifferential Scanning Calorimetry
EtYoung’s modulus, MPa
EMIElectromagnetic interference
HcEnthalpy of crystallinity, J/g
HDPEHigh-density polyethylene
JcFracture energy per unit area, kJ/m2
MFIMelt flow indicator, g/10 min
PEPolyethylene
PETPolyethylene terephthalate
PMCsPolymer–matrix composites
PPPolypropylene
SEMScanning electron microscopy
tTime, min
TTemperature, °C
TmPolymer melt temperature
VRotation speed, rpm
WPPPP weight in grams
ΔHEnthalpy rate, J/g
εStress, %
εbStress at break, %
σbStrain at break, %
χcDegree of crystallinity, %

References

  1. Gil, L. Cork composites: A review. Materials 2009, 2, 776–789. [Google Scholar] [CrossRef]
  2. Oliveira, F.R.; Silva, E.A.A.; do Carmo, S.N.; Steffens, F.; Souto, A.P.G.D.V. Functionalization of natural cork composite with microcapsules after plasma treatment. Adv. Mater. Sci. Eng. 2014, 2014, 685829. [Google Scholar] [CrossRef]
  3. Kunst, S.R.; Bianchin, A.C.V.; Mueller, L.T.; Santana, J.A.; Volkmer, T.M.; Morisso, F.D.P.; Carone, C.L.P.; Ferreira, J.Z.; Mueller, I.L.; Oliveira, C.T. Model of anodized layers formation in Zn-Al (Zamak) aiming to corrosion resistance. J. Mater. Res. Technol. 2021, 12, 831–847. [Google Scholar] [CrossRef]
  4. Wu, Z.; Sandlöbes, S.; Wu, L.; Hu, W.; Gottstein, G.; Korte-Kerzel, S. Mechanical behaviour of Zn–Al–Cu–Mg alloys: Deformation mechanisms of as-cast microstructures. Mater. Sci. Eng. A 2016, 651, 675–687. [Google Scholar] [CrossRef]
  5. Ubeda, C.; Peña-Neira, Á.; Gil i Cortiella, M. Combined effects of the vessel type and bottle closure during Chilean Sauvignon Blanc wine storage over its volatile profile. Food Res. Int. 2022, 156, 111178. [Google Scholar] [CrossRef]
  6. Viguera, M.; Prieto, C.; Casas, J.; Casas, E.; Cabañas, A.; Calvo, L. The parameters that affect the supercritical extraction OF 2,4,6-trichloroanisol from cork. J. Supercrit. Fluids 2018, 141, 137–142. [Google Scholar] [CrossRef]
  7. Novais, R.M.; Senff, L.; Carvalheiras, J.; Seabra, M.P.; Pullar, R.C.; Labrincha, J.A. Sustainable and efficient cork—Inorganic polymer composites: An innovative and eco-friendly approach to produce ultra-lightweight and low thermal conductivity materials. Cem. Concr. Compos. 2019, 97, 107–117. [Google Scholar] [CrossRef]
  8. Kazemi Najafi, S. Use of recycled plastics in wood plastic composites–A review. Waste Manag. 2013, 33, 1898–1905. [Google Scholar] [CrossRef]
  9. Fernandes, E.M.; Correlo, V.M.; Chagas, J.A.M.; Mano, J.F.; Reis, R.L. Cork based composites using polyolefin’s as matrix: Morphology and mechanical performance. Compos. Sci. Technol. 2010, 70, 2310–2318. [Google Scholar] [CrossRef]
  10. Fernandes, E.M.; Correlo, V.M.; Mano, J.F.; Reis, R.L. Cork-polymer biocomposites: Mechanical, structural and thermal properties. Mater. Des. 2014, 82, 282–289. [Google Scholar] [CrossRef]
  11. Brites, F.; Malça, C.; Gaspar, F.; Horta, J.F.; Franco, M.C.; Biscaia, S.; Mateus, A. The Use of Polypropylene and High-Density Polyethylene on Cork Plastic Composites for Large Scale 3D Printing. Appl. Mech. Mater. 2019, 890, 205–225. [Google Scholar] [CrossRef]
  12. Caban, R. FTIR-ATR spectroscopic, thermal and microstructural studies on polypropylene-glass fiber composites. J. Mol. Struct. 2022, 1264, 133181. [Google Scholar] [CrossRef]
  13. Suffo, M.; Sales, D.L.; Cortés-Triviño, E.; de la Mata, M.; Jiménez, E. Characterization and production of agglomerated cork stoppers for spirits based on a factor analysis method. Food Packag. Shelf Life 2022, 31, 100815. [Google Scholar] [CrossRef]
  14. Gil, L. Cork powder waste: An overview. Biomass Bioenergy 1997, 13, 59–61. [Google Scholar] [CrossRef]
  15. Vilela, C.; Sousa, A.F.; Freire, C.S.R.; Silvestre, A.J.D.; Pascoal Neto, C. Novel sustainable composites prepared from cork residues and biopolymers. Biomass Bioenergy 2013, 55, 148–155. [Google Scholar] [CrossRef]
  16. Magalhães da Silva, S.P.; Oliveira, J.M. Cork powders wettability by the Washburn capillary rise method. Powder Technol. 2021, 387, 16–21. [Google Scholar] [CrossRef]
  17. Pintor, A.M.A.; Ferreira, C.I.A.; Pereira, J.C.; Correia, P.; Silva, S.P.; Vilar, V.J.P.; Botelho, C.M.S.; Boaventura, R.A.R. Use of cork powder and granules for the adsorption of pollutants: A review. Water Res. 2012, 46, 3152–3166. [Google Scholar] [CrossRef] [PubMed]
  18. Tumwesigye, K.S.; Oliveira, J.C.; Sousa-Gallagher, M.J. New sustainable approach to reduce cassava borne environmental waste and develop biodegradable materials for food packaging applications. Food Packag. Shelf Life 2016, 7, 8–19. [Google Scholar] [CrossRef]
  19. Suffo, M.; de la Mata, M.; Molina, S.I. A sugar-beet waste based thermoplastic agro-composite as substitute for raw materials. J. Clean. Prod. 2020, 257, 120382. [Google Scholar] [CrossRef]
  20. Ghosh, A. Performance modifying techniques for recycled thermoplastics. Resour. Conserv. Recycl. 2021, 175, 105887. [Google Scholar] [CrossRef]
  21. Kazancoglu, Y.; Ada, E.; Ozbiltekin-Pala, M.; Aşkın Uzel, R. In the nexus of sustainability, circular economy and food industry: Circular food package design. J. Clean. Prod. 2023, 415, 137778. [Google Scholar] [CrossRef]
  22. McNally, T.; McShane, P.; Nally, G.M.; Murphy, W.R.; Cook, M.; Miller, A. Rheology, phase morphology, mechanical, impact and thermal properties of polypropylene/metallocene catalysed ethylene 1-octene copolymer blends. Polymer 2002, 43, 3785–3793. [Google Scholar] [CrossRef]
  23. Totalenergies. Available online: https://polymers.totalenergies.com/ppc-5660 (accessed on 29 July 2023).
  24. Luyt, A.S.; Molefi, J.A.; Krump, H. Thermal, mechanical and electrical properties of copper powder filled low-density and linear low-density polyethylene composites. Polym. Degrad. Stab. 2006, 91, 1629–1636. [Google Scholar] [CrossRef]
  25. Jurado-Contreras, S.; Navas-Martos, F.J.; Rodríguez-Liébana, J.A.; la Rubia, M.D. Effect of Olive Pit Reinforcement in Polylactic Acid Biocomposites on Environmental Degradation. Materials 2023, 16, 5816. [Google Scholar] [CrossRef]
  26. UNE-EN ISO 527-2 UNE-EN ISO 527-2:2012 Plastics; Determination of Tensile Properties. Part 2: Test Conditions for Moulding and Extrusions Plastics. International Organization for Standardization: Geneva, Switzerland, 2012.
  27. UNE-EN ISO179-2 UNE-EN ISO 179-2:2000 Plastics; Determination of Charpy Impact Properties. Part 2: Instrumented Impact Test. International Organization for Standardization: Geneva, Switzerland, 2000.
  28. UNE-EN ISO 527-2 UNE-EN ISO 527-1:2012 Plastics; Determination of Tensile Properties. Part 1: General Principles. International Organization for Standardization: Geneva, Switzerland, 2012.
  29. UNE-EN ISO 1133-1 UNE-EN ISO 1133-1:2012; Determination of the Melt Mass-Flow Rate (MFR) and Melt Volume-Flow Rate (MVR) of Thermoplastics—Part 1: Standard Method. International Organization for Standardization: Geneva, Switzerland, 2012.
  30. Marcovich, N.E.; Villar, M.A. Thermal and mechanical characterization of linear low-density polyethylene/wood flour composites. J. Appl. Polym. Sci. 2003, 90, 2775–2784. [Google Scholar] [CrossRef]
  31. Spadetti, C.; da Silva Filho, E.A.; de Sena, G.L.; de Melo, C.V.P. Propriedades térmicas e mecânicas dos compósitos de Polipropileno pós-consumo reforçados com fibras de cellulose. Polimeros 2017, 27, 84–90. [Google Scholar] [CrossRef]
  32. Martins, I.; Hartmann, D.O.; Alves, P.C.; Martins, C.; Garcia, H.; Leclercq, C.C.; Ferreira, R.; He, J.; Renaut, J.; Becker, J.D.; et al. Elucidating how the saprophytic fungus Aspergillus nidulans uses the plant polyester suberin as carbon source. BMC Genomics 2014, 15, 613. [Google Scholar] [CrossRef] [PubMed]
  33. Paiva, D.; Magalhães, F.D. Dynamic mechanical analysis and creep-recovery behavior of agglomerated cork. Eur. J. Wood Wood Prod. 2018, 76, 133–141. [Google Scholar] [CrossRef]
  34. Greco, A.; Romano, G.; Maffezzoli, A. Selective reinforcement of LLDPE components produced by rotational molding with thermoplastic matrix pultruded profiles. Compos. Part B Eng. 2014, 56, 157–162. [Google Scholar] [CrossRef]
  35. Yan, W.; Lin, R.J.T.; Bhattacharyya, D. Particulate reinforced rotationally moulded polyethylene composites—Mixing methods and mechanical properties. Compos. Sci. Technol. 2006, 66, 2080–2088. [Google Scholar] [CrossRef]
  36. Soccalingame, L.; Perrin, D.; Bénézet, J.C.; Mani, S.; Coiffier, F.; Richaud, E.; Bergeret, A. Reprocessing of artificial UV-weathered wood flour reinforced polypropylene composites. Polym. Degrad. Stab. 2015, 120, 313–327. [Google Scholar] [CrossRef]
  37. Kwon, S.; Kim, K.J.; Kim, H.; Kundu, P.P.; Kim, T.J.; Lee, Y.K.; Lee, B.H.; Choe, S. Tensile property and interfacial dewetting in the calcite filled HDPE, LDPE, and LLDPE composites. Polymer 2002, 43, 6901–6909. [Google Scholar] [CrossRef]
  38. Soccalingame, L.; Bourmaud, A.; Perrin, D.; Bénézet, J.-C.; Bergeret, A. Reprocessing of wood flour reinforced polypropylene composites: Impact of particle size and coupling agent on composite and particle properties. Polym. Degrad. Stab. 2015, 113, 72–85. [Google Scholar] [CrossRef]
  39. Martins, M.H.; de Paoli, M.A. Polypropylene compounding with post-consumer material: II. Reprocessing. Polym. Degrad. Stab. 2002, 78, 491–495. [Google Scholar] [CrossRef]
  40. Luzuriaga, S.; Kovářová, J.; Fortelný, I. Degradation of pre-aged polymers exposed to simulated recycling: Properties and thermal stability. Polym. Degrad. Stab. 2006, 91, 1226–1232. [Google Scholar] [CrossRef]
  41. Jansson, A.; Möller, K.; Gevert, T. Degradation of post-consumer polypropylene materials exposed to simulated recycling—Mechanical properties. Polym. Degrad. Stab. 2003, 82, 37–46. [Google Scholar] [CrossRef]
  42. Bhagat, A.B.; Ghosh, A.K. Estimation of rheological percolation threshold and influence of fibre length on properties of polypropylene/sisal fibre composites having near critical fibre length. Polymer 2022, 258, 125304. [Google Scholar] [CrossRef]
  43. Fuad, M.Y.A.; Hanim, H.; Zarina, R.; Ishak, Z.A.M.; Hassan, A. Polypropylene/calcium carbonate nanocomposites—Effects of processing techniques and maleated polypropylene compatibiliser. Express Polym. Lett. 2010, 4, 611–620. [Google Scholar] [CrossRef]
  44. Lisperguer, J.; Bustos, X.; Saravia, Y.; Escobar, C.; Venegas, H. Efecto De Las Caracteristicas De Harina De Madera En Las Propiedades Físico-Mecánicas Y Térmicas De Polipropileno Reciclado. Maderas. Cienc. Tecnol. 2013, 15, 321–336. [Google Scholar] [CrossRef]
  45. Pluta, M.; Bartczak, Z.; Galeski, A. Changes in the morphology and orientation of bulk spherulitic polypropylene due to plane-strain compression. Polymer 2000, 41, 2271–2288. [Google Scholar] [CrossRef]
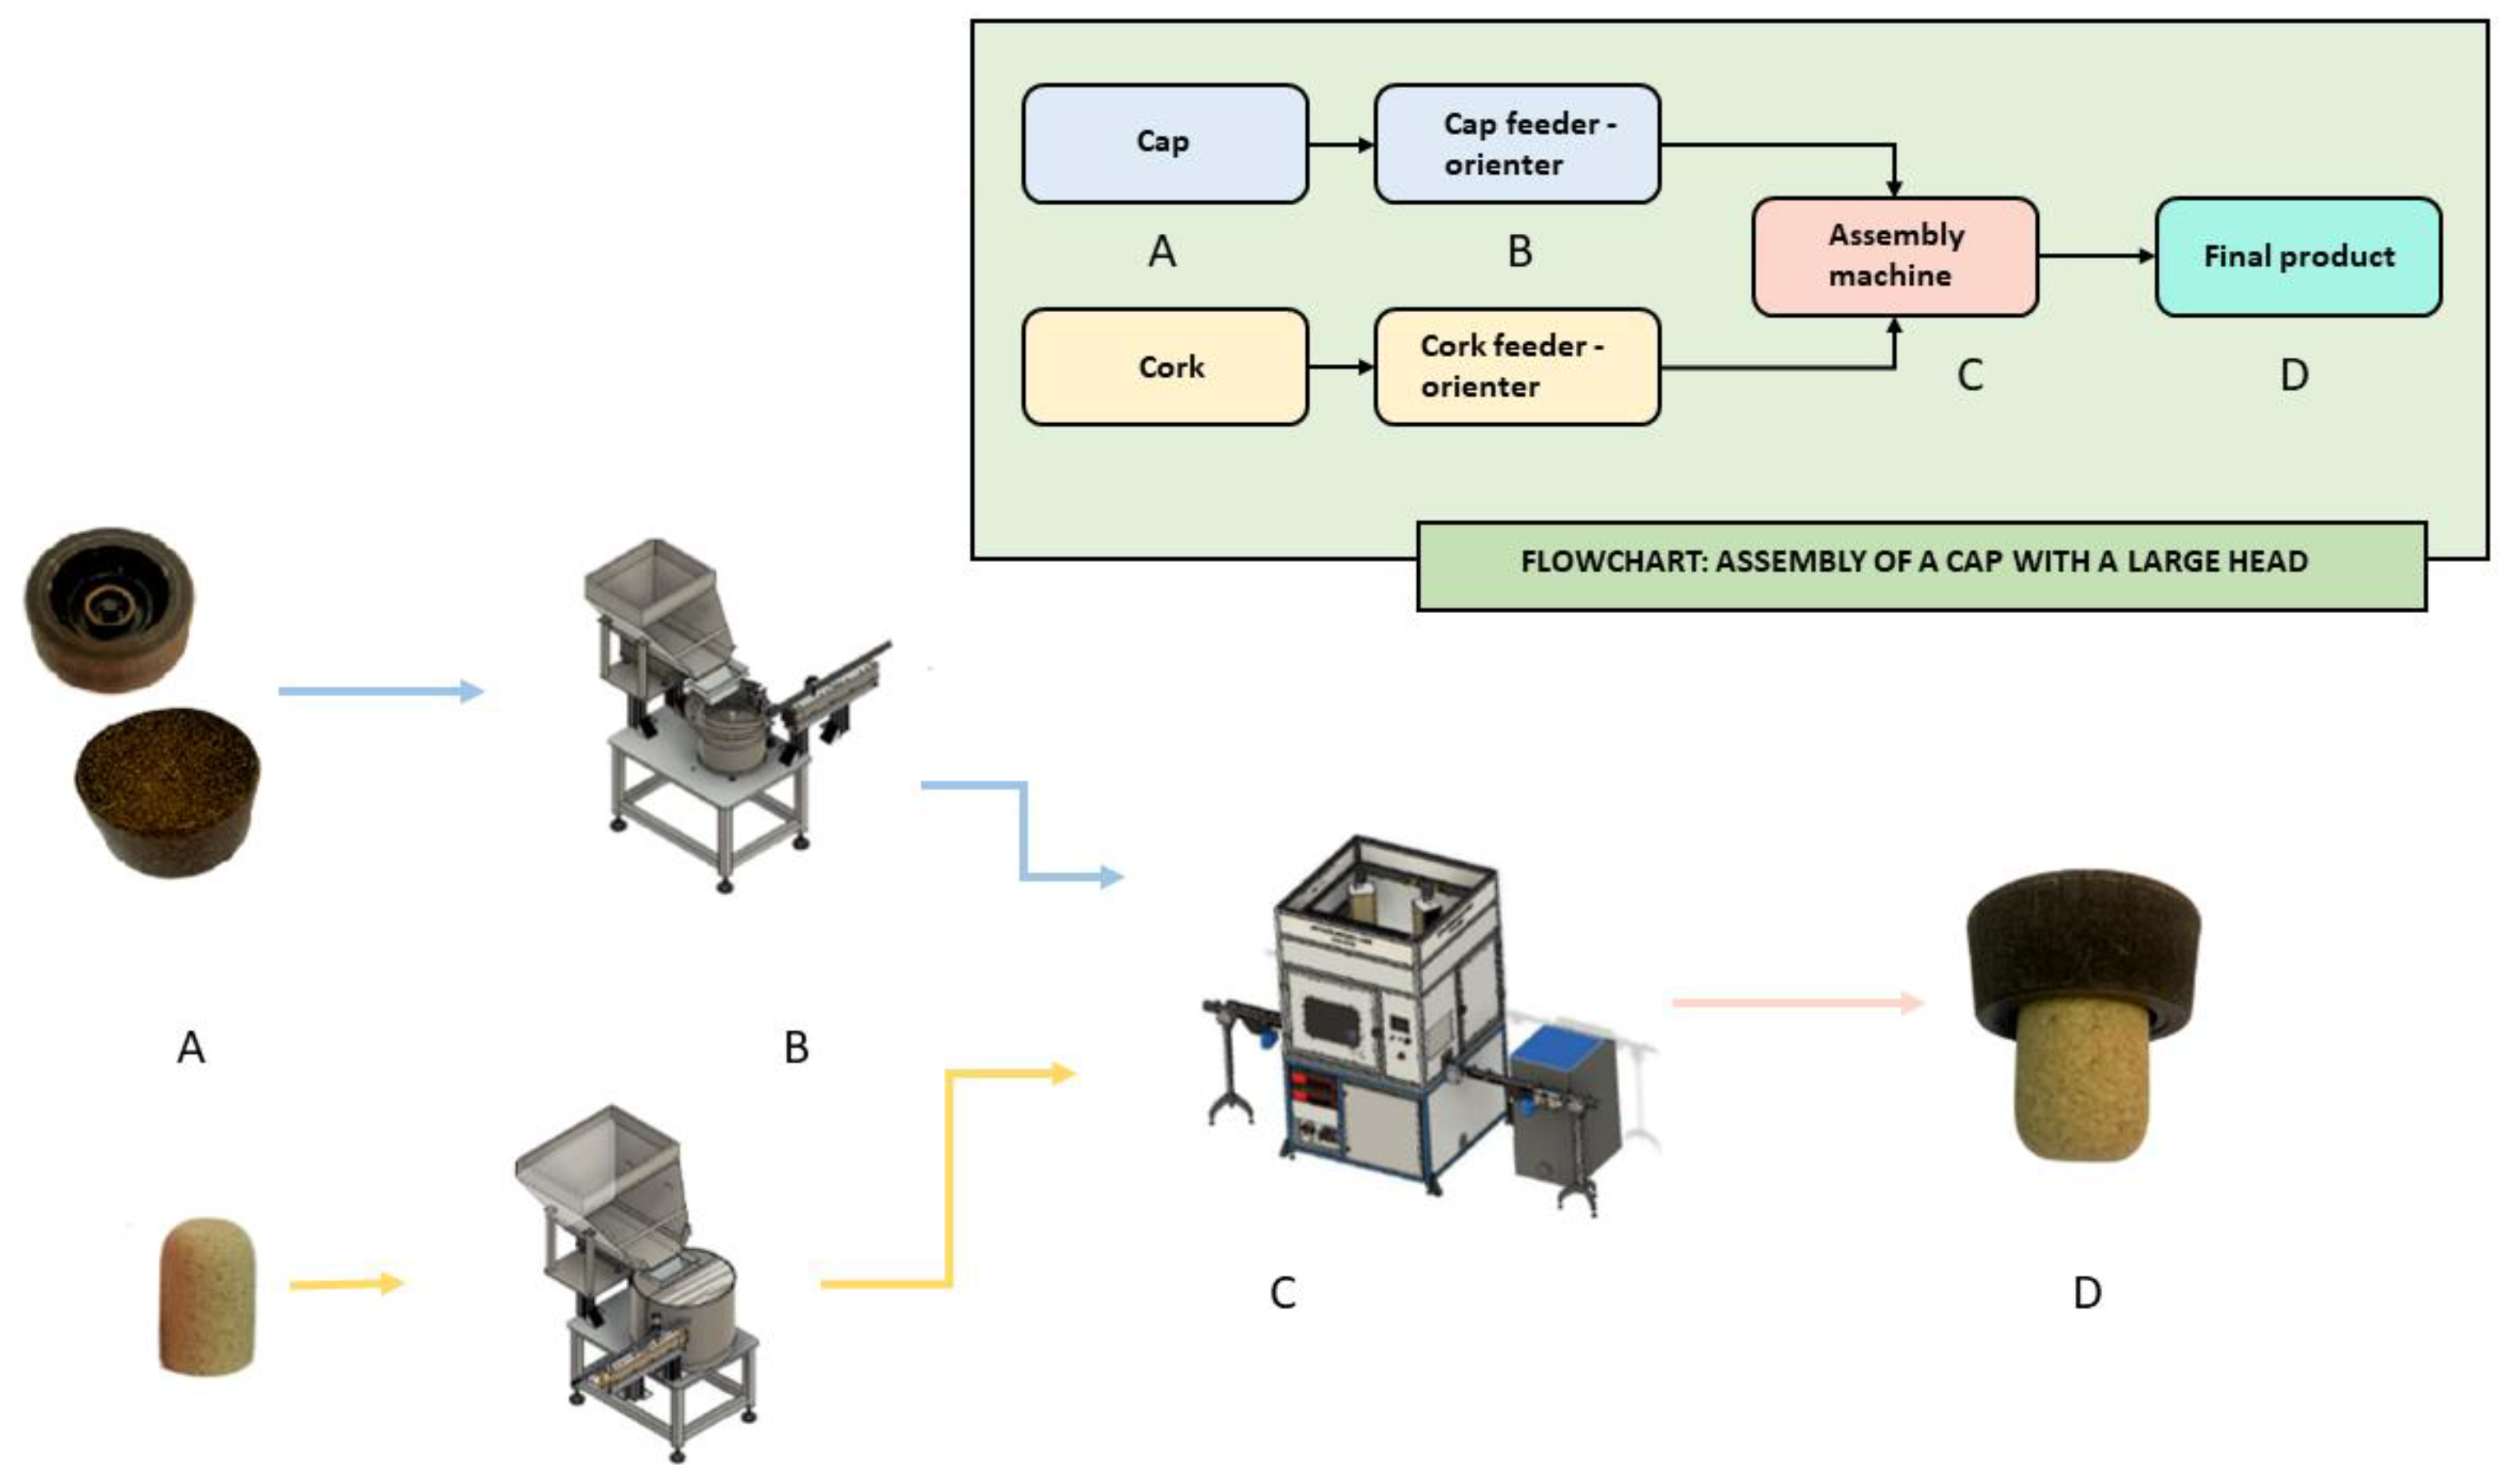
Figure 1. Assembly process of “cabezudo” stoppers. Processes: A. materials; B. Feeders; C. Assembly of the elements (crowns-cork spikes) by means of adhesive; D. Finished product.
Applsci 14 03014 g001
Figure 2. Physical appearance of (a) dry CoP before mixing; (b) CoP30PP70 CAG formed with a 3 mm size.
Applsci 14 03014 g002
Figure 3. Physical model delimited according to measurements taken from the actual plug used as a specimen to carry out the injection molding tests for the following mixing ratios.
Applsci 14 03014 g003
Figure 4. Elements used to perform the adhesion test. The cork samples named as 1 are bevelled and the others cylindrical.
Applsci 14 03014 g004
Figure 5. FTIR spectra of CoP and CoP:PP CAG.
Applsci 14 03014 g005
Figure 6. SEM analyses performed on derived composites with a CoP content of 20%, 30%, and 35%.
Applsci 14 03014 g006
Figure 7. Graphical representation of the CoP particle size curve.
Applsci 14 03014 g007
Figure 8. Mechanical properties of the agrocomposites. (a) Young’s modulus, ET; (b) % elongation and stress at break. (0%: PPC 5660; 0%p: processed PPC 5660; 20%: CoP20PP80; 30%: CoP30PP70; 35%: CoP30PP70).
Applsci 14 03014 g008
Figure 9. Impact test (Charpy) results and MFI properties of the agrocomposites. (a) Impact test, Jc; (b) MFI test. (0%: PPC 5660; 0%p: processed PPC 5660; 20%: CoP20PP80; 30%: CoP30PP70; 35%: CoP30PP70).
Applsci 14 03014 g009
Figure 10. (a) DSC thermogram to the pure CoP; (b) pure PP; (c) CoP20PP80; (d) CoP30PP70; (e) CoP35PP65.
Applsci 14 03014 g010
Figure 11. Prototypes manufactured through injection molding: (a) CAG adhesion tests in a 30:70 ratio, (b) wine bottle insertion tests.
Applsci 14 03014 g011
Table 1. Characteristics of cork powder (CoP).
MorphologyPowder
GenesisManufacturing process of cork stopper cap pins
Chemical composition[13]
Humidity2.46%
Volume30% in incoming raw material [16,17]
Table 2. Characteristics of the PP used in this study [23].
SupplierMelt Flow Indicator
[g/10 min]
Density
[kg/m3]
Stress at Yield
[MPa]
Tensile Modulus [MPa]Elongation at Yield [%]Charpy Impact Notched at 23 °C
[KJ/m2]
Vicat Softening Temperature
at 10 N (VST/A)
[°C]
PPTOTAL PPC 56607 *905251300613145
* for 2.16 kg at 230 °C.
Table 3. Percentage values of the composition of the different CAGs.
CoP [%]PPC 5660 [%]
CoP20PP802080
CoP30PP703070
CoP35PP653565
Table 4. Crystallinity rate of different polymers.
PolymersTm [°C]Hc [J/g]χc [%]
PP pure [38,40]209 100
PP pure166.2375.7336.23
CoP20PP80168.5960.6429.01
CoP30PP70169.1845.3621.7
CoP35PP65165.4954.4626.06
Disclaimer/Publisher’s Note: The statements, opinions and data contained in all publications are solely those of the individual author(s) and contributor(s) and not of MDPI and/or the editor(s). MDPI and/or the editor(s) disclaim responsibility for any injury to people or property resulting from any ideas, methods, instructions or products referred to in the content.