Abstract
Atherosclerosis, a chronic inflammatory and oxidative stress-mediated disease impacting the arterial system, stands as a primary cause of morbidity and mortality worldwide. The complexity of this disease, driven by numerous factors, requires a thorough investigation of its underlying mechanisms. In our study, we explore the complex interplay between cholesterol homeostasis, macrophage dynamics, and atherosclerosis development using a Petri net-based model anchored in credible, peer-reviewed biological and medical research. Our findings underscore the significant role of macrophage colony-stimulating factor (M-CSF) inhibition in reducing atherosclerotic plaque formation by modulating inflammatory responses and lipid accumulation. Furthermore, our model highlights the therapeutic potential of targeting the C-X-C motif ligand 12 (CXCL12)/ C-X-C motif chemokine receptor type 4 (CXCR4) pathway to hinder hematopoietic stem and progenitor cells’ (HSPCs’) mobilization and plaque development. Based on the results obtained, which are in agreement with current studies, additional strategies are also proposed, such as decreasing M1 macrophage polarization for therapeutic gains, opening the door to future research and novel treatment approaches.
1. Introduction
Atherosclerosis is a multifactorial, immuno-inflammatory, fibro-proliferative, chronic disorder with various processes underlying it, including low-grade inflammation, oxidative stress, and lipid deposition, accompanied by endothelial cell dysfunction and smooth muscle cell proliferation [1,2,3].
The initiation of atherosclerotic plaque formation involves the local attraction of inflammatory cells, especially monocytes, critical components of the innate immune system, and the accumulation of low-density lipoprotein cholesterol (LDL-C).
At birth, monocytes arise from bone marrow-derived hematopoietic stem and progenitor cells (HSPCs) and, upon maturation, are released into circulation, where they reach peripheral tissues and maintain endothelial integrity. After detecting microbial disruption (via pathogen-induced signaling) or inflammatory stimuli, monocytes migrate into tissues, where their plasticity allows them to differentiate mostly into macrophage-like cells or dendritic cells, depending on their environmental niche. Alternatively, they can also migrate into tissues in the absence of inflammation and remain undifferentiated, where they play homeostatic roles [4]. While a steady-state macrophage is mostly monocyte-independent, a macrophage residing in an inflamed vascular wall and a diseased heart derive from hematopoietic organs.
Adherent monocytes and infiltrating monocyte-derived macrophages locally release many cytokines, matrix metalloproteinases, and vasoactive and growth factors to promote vascular and tissue remodeling or lead to inflammatory response propagation [5].
They are highly plastic and dynamic; once activated, their morphology and protein expression can change rapidly, producing markers specific to various cells [6]. Within atherosclerotic plaque, macrophages can switch between pro-inflammatory and anti-inflammatory states. However, they can also reveal heterogeneous phenotypes “in-between” and even “out-of-the spectrum”, depending on the local microenvironment, which increases the complexity of the studied phenomenon [6].
Macrophages’ functioning is complex and goes beyond phagocytosis and participation in lipid uptake [3,7] through macrophage-expressed scavenger receptors, but also involves the activation of immune responses and distinct and non-redundant roles in fibrosis, regeneration, and tissue repair and surveillance, highlighting their essential role in atherosclerosis [8,9,10,11].
Due to the complex nature of atherosclerosis, there is currently no single marker known that would allow for a clear assessment of its severity or the prediction of cardiovascular risk [12]. Therefore, much research is carried out to indicate the most important pathways involved, allowing for a better understanding of the process and, consequently, more effective treatment.
As far as we know, no prior research has combined such a wide range of signaling pathways and fundamental processes related to human cholesterol balance, macrophage behavior, and the mechanisms underlying atherosclerosis within a single study. This approach, enabled by the Petri net theory, allows for the development of molecular interaction networks without requiring precise quantitative parameters. This sets it apart from approaches that rely on ordinary differential equations (ODEs) or partial differential equations (PDEs), which require specific parameter values to represent the quantitative aspects of the system accurately. The lack of reliable quantitative reaction data often presents challenges when creating ODE/PDE models, especially for complex biological systems.
Numerous mathematical models exist that illustrate the inflammatory response of macrophages, primarily in the early stages of plaque formation [13,14,15,16,17,18,19,20,21,22]. For example, one of the ODE models focused on the development of atherosclerotic plaques integrates the macrophage response with the dynamics of lipids, examining factors such as macrophage migration and lipid influx in plaque progression [18]. Another extends a lipid framework to account for macrophage responses to lipid levels, specifically their apoptosis, emigration, and proliferation, showing that lipid-influenced macrophage behaviors significantly affect plaque development by modifying lipid patterns [13,19]. Unfortunately, in the models mentioned above, simplification involves consolidating lipoproteins into a single group without distinguishing between their types, and also macrophage polarization is not considered.
To explore macrophage polarization’s role in plaque progression, a dynamic stochastic model was developed, capturing changes in plaque components through PDEs and macrophage phenotype shifts with a Bernoulli distribution [16]. Simulations aligned with experimental data suggest that manipulating macrophage polarization can alter the plaque environment, potentially reversing plaque formation, particularly in the early stages, which is consistent with the results of our analysis. An agent-based model was also proposed that simulates macrophage dynamics and polarization using bifurcation analysis and incorporates the diffusion of cytokines through ODEs [15].
Other mathematical and computational models have been developed to investigate the mechanobiological mechanisms involved in plaque advancement. These include a dynamic interaction between blood flow and arterial walls, together with a system of PDEs and ODEs to capture the multiscale dynamics of solute concentrations in plaque growth [14,22].
Although many models have been previously proposed, differing in the range of details and complexity, most focus on specific and limited aspects of the role of macrophages in atherosclerosis. A comprehensive mathematical model of atherosclerosis that encompasses the fundamental and complex processes associated with macrophage behavior and cholesterol balance has yet to be developed.
In our previous article [23], using the Petri net theory, we created a model of macrophage differentiation and analyzed the impact of selected micro-environmental signals. In addition, we focused on the relationships between different macrophage subpopulations. This allowed us, among other things, to explore the interaction of macrophages in relation to the activation of T lymphocytes. The current model is a continuation of the research on this topic. Here, to better understand the associations between macrophages and atherosclerosis, a system approach was utilized that involved using Petri nets [24,25,26], as explained in this paper. This approach examining the complex link between cholesterol balance, macrophage behavior, and atherosclerosis enhances knowledge organization. It deepens the understanding of the biological system by constructing a mathematical model that depicts a complex network of interactions.
Following this approach, the study aimed to identify molecules, factors, or processes within the examined system that, when blocked, could effectively stop or diminish the progression of atherosclerosis. This was performed using a Petri net-based model illustrating the interaction pathways between cholesterol homeostasis, macrophage dynamics, and atherosclerosis.
It is worth noting that Petri net-based models allow for a detailed description of the structure of the analyzed biological system, even in the case where it is composed of dozens or hundreds of elementary components. The relationships between all of them can be precisely described in the form of a bipartite graph and then simulated and analyzed using formal methods. The graph-based structure of the model helps us to easily understand the structure of the system and to perform a simulation in an intuitive way (i.e., the flow of signals in the system is shown in the graph as a flow of tokens between vertices). Moreover, quantitative data are not necessary to build the model. This is a great advantage in comparison to, e.g., models based on ODEs, which are difficult to construct and analyze for such a large number of model components. In the case of the Petri net-based model presented in this paper, its ODE counterpart should consist of dozens of equations. Moreover, it would be very difficult, or even impossible, to collect all the quantitative data necessary to build such a model at the level of detail of the proposed Petri net-based one. This is a general property of models based on Petri nets, i.e., they allow the construction of models describing the structure of a biological system at a level of detail that is difficult to achieve in ODE models. ODE models are usually used for an analysis of higher-level properties of the system, while a Petri net-based model can help to explain the behavior of the system observed in an ODE model.
This study addresses the issue of macrophage differentiation by using a systems approach. This systematizes knowledge and allows for a better understanding of the presented issues while also identifying possible places for new therapies.
2. Materials and Methods
2.1. Petri Nets
The basis of the system’s approach is a mathematical model of the analyzed phenomenon. Such a model can be created using methods from some branches of mathematics. One of them is the Petri net theory. Models based on such nets are quantitative, which means that they describe the structure of the investigated system, and its quantitative aspects are taken into account only in a very limited manner. This can be seen as a limitation of such models, but in the case of biological systems, it is rather an advantage because the availability of quantitative data describing the properties of biological phenomena is usually very limited. In other words, collecting a complete set of quantitative data necessary for constructing a quantitative model of a biological system is usually difficult or even impossible. Hence, Petri nets are an interesting alternative for differential equations, for example, where such a data set is necessary. Moreover, many extensions of Petri nets exist that allow one to consider quantitative data of various types. So, it is possible to extend a qualitative model when quantitative data are easily available [25,27].
Petri nets have a structure of directed weighted bipartite graphs. Graphs of this type are composed of two disjoint sets of vertices such that each arc is an ordered pair of vertices, where one of them belongs to one of these sets and the other is an element of the second set. In the case of Petri nets, vertices belonging to one of these sets are called places, and elements of the other set are transitions. Places correspond to passive elements of the modeled biological system, e.g., chemical compounds, while transitions are counterparts of elementary processes, e.g., chemical reactions. Arcs connecting places with transitions and transitions with places describe casual relations between passive and active components (elementary processes) of the modeled system.
The bipartite graphs describe the structure of the system. A descriptive power of Petri nets follows from the fact that, by using them, a kind of system dynamic can also be modeled. This is due to the existence of components of another type, i.e., tokens. They are located in different places and can move from one place to another via transitions. The movement of tokens corresponds to the flow of substances, signals, information, etc., through the modeled system. This is governed by the transition firing rule, according to which a transition is active if in every place directly preceding it (such a place is called a preplace of the transition), the number of tokens is equal to at least the weight of the arc connecting the place with the transition. An active transition can be fired, which means that tokens flow from their preplaces to their postplaces, i.e., the ones that directly follow the transition. The number of flowing tokens is equal to the weight of the respective arcs [25,28].
One of the great advantages of Petri nets is their intuitive graphical representation. This helps us to understand the structure of the modeled system and its behavior, especially when software for simulating the nets is used. It is also very helpful at the stage of constructing the model. In this representation, places are depicted as circles, transitions as rectangles, arcs as arrows, and tokens as dots or numbers located inside places.
Although the graphical representation is very useful, it is not very well suited for an algorithmic model analysis. For this purpose, another representation, i.e., incidence matrix A, is used. In this matrix, rows correspond to places, and columns correspond to transitions. A number in entry of matrix A is equal to a change in the number of tokens residing in place before and after firing transition .
As was mentioned before, transitions correspond to some elementary processes, but in the context of biological systems, an analysis of some more complex processes is also very important. These processes do not change the state of the modeled system, and their counterparts in Petri nets are t-invariants. Such invariants are vectors x being solutions of the equation , where A is the incidence matrix. To every t-invariant x there corresponds a set of transitions called a support of this invariant and containing those transitions for which an entry in x is positive, i.e., . If every transition is fired times, then the distribution of tokens over the set of places (called marking) remains unchanged, which means that the state of the modeled system is also unchanged. This is the reason why t-invariants correspond to processes that do not change the state of the biological system, or, in other words, processes maintaining the homeostasis of the system. An analysis of such processes, or equivalently, t-invariants, may lead to the discovery of some essential properties of the modeled system [29,30].
Another important characteristic of Petri nets is their maximal common transition sets (MCT sets). These are composed of transitions that are elements of supports of exactly the same t-invariants. MCT sets correspond to some functional blocks of the modeled biological system [29,30].
The role of the above-mentioned elements of Petri net theory in the analysis of the model proposed in this paper is shown in Figure 1, which presents a straightforward diagram that outlines the entire process, from the initial model development to the final results.
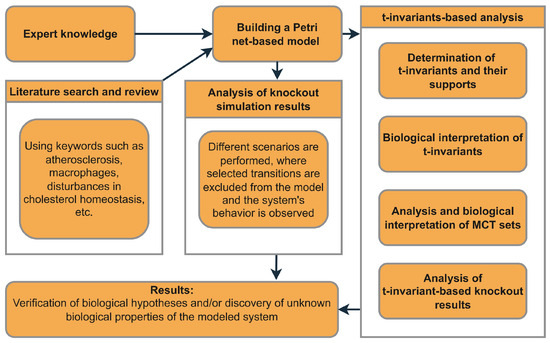
Figure 1.
An overview of the general framework outlining the necessary steps that should be taken to construct the model, perform the analysis, and achieve the outcomes.
2.2. Description of Macrophage–Atherosclerosis-Related Phenomena That Were Taken into Account for Building the Model
2.2.1. Impact of Disturbances in Cholesterol Homeostasis
Defective cholesterol homeostasis is a key factor in the development and progression of atherosclerosis, as it causes the build-up of harmful lipoproteins in the arterial intima. This triggers local inflammation, monocyte recruitment, and the IL-23/IL-17/G-CSF pathway [2,31,32,33]. In the intima, infiltrated monocytes can differentiate into macrophages and release chemokines such as CCL2, CCL5, and CX3CL1 [34]. Consequently, activated endothelial cells express adhesion molecules such as P-selectin and E-selectin. PSGL-1, found on monocytes, neutrophils, and lymphocytes, binds primarily to P-selectin. Since PSGL-1 expression is associated with Ly6C expression, it suggests that P-selectin can selectively recruit a subset of inflammatory monocytes to areas of endothelial dysfunction [33,35]. Monocytes firmly adhere to the endothelium’s luminal surface via VCAM-1’s and ICAM-1’s interactions with VLA-4 and LFA-1 integrins, respectively. This firm attachment induces monocyte polarization, altering their shape and function [5].
2.2.2. IL-23/IL-17/G-CSF Signaling Axis Leading to HSPCs Mobilization from the Bone Marrow
The impaired regulation of cholesterol levels results in elevated IL-23 levels, a key pro-inflammatory cytokine. This stimulates the IL-23/IL-17/G-CSF pathway, increasing neutrophil production [32,36]. Within the IL-23/IL-17/G-CSF axis, IL-23 triggers the transformation of naive forms of helper T cells into Th17 cells, known for their significant pathogenic potential and ability to secrete IL-17. The production of G-CSF, mediated by IL-17, further activates neutrophils and other myeloid cells. Their signaling to progenitor cells in the bone marrow results in an imbalance in myeloid cell production, with a preference to generate more neutrophils rather than monocytic lineages [5,32,33,35,37]. The excessive production of neutrophils subsequently leads to the initiation of two important processes. First, neutrophils create a more proteolytic environment within the bone marrow, leading to the cleavage of a crucial receptor, C-X-C motif chemokine receptor type 4 (CXCR4), which is responsible for the retention of HSPCs [38,39,40]. Second, shifting differentiation preference away from monocytes/macrophages leads to a decrease in the CXCR4 ligand CXCL12 in both mesenchymal stem cells and osteoblasts [35,41,42].
In summary, impaired cholesterol clearance pathways significantly impact the osteoblastic environment and HSPCs’ mobilization via the IL-23/IL-17/G-CSF pathway [38]. This underscores the critical link between impaired lipid metabolism and immune signaling in the management of the bone marrow environment and stem cell activity.
2.2.3. Circulating Monocytes and Their Recruitment in Atherosclerosis
Monocytes are derived from HSPCs in the bone marrow and undergo a series of consecutive differentiation stages: the common myeloid progenitor (CMP) and the granulocyte–macrophage progenitor (GMP), which ultimately give rise to Ly6Chigh monocytes [43]. The differentiation and functions of hematopoietic progenitors in monocytes and macrophages are regulated by a cytokine known as M-CSF. It plays a crucial role in promoting the growth of these progenitors, inducing inflammation, and triggering tissue factor production, which leads to plaque instability and significantly contributes to the development of atherosclerosis [44,45,46].
Humans have two main monocyte categories: classical/inflammatory monocytes with high Ly6C levels (Ly6Chigh) and non-classical/patrolling monocytes with low Ly6C levels (Ly6Clow). The distinction also lies in their expression of CCR2 and CX3CR1, where classical monocytes are CCR2high and CX3CR1low, and non-classical monocytes are CCR2low and CX3CR1high [5,47].
Recent studies have shown that classical monocytes (Ly6Chigh) are drawn to inflammation sites, where they promote inflammation. It is also believed that these monocytes can become non-classical monocytes (Ly6Clow), aiding in anti-inflammatory and repair activities. Normally, non-classical monocytes act as vascular scavengers, keeping blood vessels clean by monitoring the endothelium and removing microparticles [8,9,47].
2.2.4. Macrophage Polarization in Atherosclerosis
Macrophages are key immune cells involved in regulating inflammation, clearing infections, and repairing tissues through processes like phagocytosis and polarization [9,48]. Macrophage polarization refers to the ability of these cells to change their phenotype and exhibit different functions depending on the surrounding environment. In atherosclerosis, macrophages polarize into M1 and M2 subtypes [49,50] due to various signals, each influencing the disease’s development differently [1].
M1 macrophages, derived from Ly6Chigh monocytes, promote inflammation through pro-inflammatory cytokines, accelerating atherosclerosis. They are activated by factors like LPS and INF- [33,48,49,51]. On the contrary, M2 macrophages from Ly6Clow monocytes reduce inflammation and aid tissue repair, influenced by cytokines such as IL-4, IL-13, IL-1, or vitamin D3. They release anti-inflammatory substances, such as IL-10, that aid in the healing of lesions [33,48,49,51].
2.2.5. Atherosclerosis
Atherosclerosis, a chronic inflammatory disease, affects mainly large and medium-sized arteries. Risk factors contribute to endothelial damage, allowing LDL to enter and oxidize within the intima, activating chemokines and adhesion factors such as CCL2, ICAM-1, VCAM-1, and E- and P-selectin. This process recruits monocytes that become M1 macrophages (equipped with scavenger receptors SRA and CD36), which ingest oxidized LDL and transform into foam cells, initiating atherosclerotic lesion formation [3,9,34]. Foam cells secrete pro-inflammatory cytokines (such as IL-1, IL-2, IL-6, IL-23, and TNF) and chemokines (like CCL2, CCL5, and CXCL1), intensifying inflammation [3,34,35]. Over time, foam cell accumulation leads to plaque formation, which can become unstable and potentially rupture, highlighting foam cells’ central role in atherosclerosis progression [33].
Macrophage dynamics affecting atherosclerotic plaque formation, which have been taken into account in this study, are presented in Figure 2.
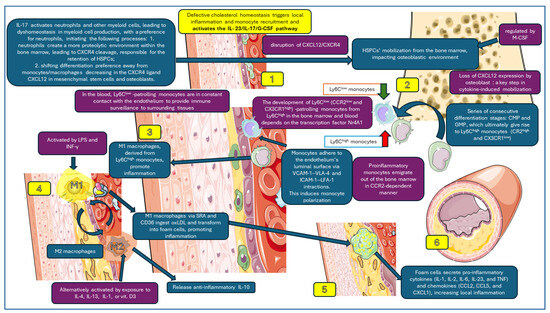
Figure 2.
Macrophage dynamics analyzed in this study. 1. Activation of IL-23/IL-17-G-CSF pathway; 2. HSCPs’ mobilization in the bone marrow; 3. monocyte polarization (Ly6Chigh and Ly6Clow); 4. macrophages M1 and M2 in subendothelial space; 5. M1 phagocytes oxLDL forming foam cells; 6. foam cells secrete pro-inflammatory cytokines and enhance local inflammation, increasing atherosclerotic plaque. Parts of the figure were created using images from Servier Medical Art. Servier Medical Art by Servier is licensed under a Creative Commons Attribution 3.0 Unported License (https://creativecommons.org/licenses/by/3.0/, accessed on 21 March 2024).
3. Results and Discussion
In this section, we introduce a model based on classical Petri that investigates the intricate interactions between disturbances in cholesterol homeostasis, macrophage balance, and the development of atherosclerosis. This model is thoroughly built upon a foundation of data rigorously sourced from reliable, peer-reviewed biological and medical literature, reflecting a wide range of experimental and clinical knowledge. Using analytical techniques such as t-invariants, MCT sets, and knockout analysis within the established framework of Petri net methodologies, this model offers a theoretical basis for our conclusions. Our methodical approach in both modeling and analysis not only ensures replicability but also allows for validation by other researchers using compatible data sources and tools. Although our findings emerge primarily from in silico analyses, they are consistent with current experimental and clinical research in the domain.
The resulting data and the corresponding figures in this section were derived from Holmes [52].
3.1. Presentation of the Model and the Results of Its Formal Analysis
This section introduces and analyzes a Petri net-based model that illustrates the interplay between cholesterol homeostasis disruption, macrophage equilibrium, and atherosclerosis progression. Illustrated in Figure 3, the model comprises 41 transitions and 45 places. These components are described in Table 1 and Table 2, respectively.
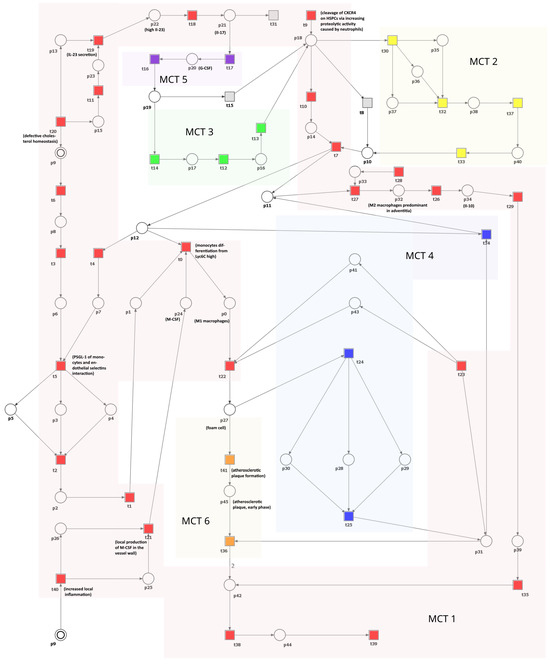
Figure 3.
A Petri net-based model depicting the role of macrophages and disturbances in cholesterol homeostasis in the development and progression of atherosclerosis. This model is segmented into six subprocesses corresponding to MCT sets and is distinguished by various transition colors. Detailed descriptions of these subprocesses can be found in Table 3. In this model, transitions are represented as squares, whereas circles represent places. The locations depicted as two concentric circles refer to identical locations in the model and are referred to as logical places. To improve clarity and comprehension, we have selectively integrated crucial species’ names from Table 1 and Table 2 directly into the figure.

Table 1.
The list of places and their biological meaning.
Table 2.
The list of transitions and their biological meaning.
The network is covered by 12 t-invariants, each detailed in Table A1, along with their respective biological significance. Based on these t-invariants, a series of MCT sets have been computed, resulting in six distinct, non-trivial ones (i.e., the ones containing more than one transition). Table 3 comprehensively describes all MCT sets. Each of them represents interconnected subnetworks, and they partition the structure of the network into separate regions.
Table 3.
The MCT sets of the model and their biological interpretations.
3.2. t-Invariant-Based Knockout Analysis
To evaluate the importance of every functional biological unit in our model, we needed to perform a thorough analysis. To achieve this, we initially knocked out every MCT set, including the trivial ones (single transitions). This step was crucial in determining the number of transitions affected by each knockout.
To understand the concept of an affected transition, it is crucial to first explore the definition of affected t-invariants. Affected t-invariants are characterized by having transitions that have been knocked out within their support. A transition is labeled as affected if it is part of the support of an affected t-invariant. For example, a transition is not considered affected by if it is not included in the support of any t-invariant that has in its support. This criterion was also applied to non-trivial MCT sets. The results, which are elaborated on in Table 4, indicate only single transitions or non-trivial MCT sets had an impact higher than of affected transitions.
Table 4.
The effect of removing certain MCT sets is determined by the percentage of transitions affected. This is calculated using two different methods: the approach described in [61] and simulation knockout, which is performed in the same way as described in [62].
It should be noted that Table 4 presents two distinct percentage values for each MCT set, which quantify the effect of disabled transitions on t-invariants. The first value specifies the percentage of all disabled transitions, including those within the MCT set. The subsequent value, enclosed in parentheses, denotes the percentage of transitions outside the MCT set that become disabled as a result.
Based on the obtained results, it is evident that the transitions comprising have the potential to significantly impact a substantial portion of the network when they are knocked out. Nevertheless, it is important to note that transitions within an MCT set inherently occur simultaneously in t-invariants. Therefore, removing any transition from an MCT set will inevitably affect all other transitions within the same set. It should be emphasized that is composed of 23 transitions, which make up of the total transitions in the model. The transitions belonging to this MCT set represent the signaling pathways triggered by disruptions in cholesterol balance, resulting in the activation of pro-inflammatory cytokines like IL-23 and IL-17. This leads to inflammation, the mobilization of HSPCs due to neutrophil activity, and an increase in the production and differentiation of monocytes. Ultimately, these processes contribute to the formation of atherosclerotic plaque.
Another MCT set that has a substantial inhibitory influence on the network is . If any of the transitions of are knocked out, it has the ability to disable a portion of the network, specifically around of it. This pertains to the mechanisms in which the release of the cytokine G-CSF is triggered by IL-17, resulting in the mobilization of HSPCs within the bone marrow. On the contrary, it can be observed that the elimination of sets , , , and only impacts transitions that are part of these sets.
3.3. Simulation-Based Knockout Analysis
This section provides a comprehensive description of the analysis that was conducted using knockout simulations. In this type of analysis, insights were gained regarding the behavior of the model when certain elementary processes are eliminated. To be more specific, the average number of activations (firings) for each elementary process (transition) was calculated over 10,000 simulation steps. This average was determined by conducting 1000 repeated simulations.
Scenario 1.
The impact of individual transitions within the studied model on the transition representing the development of atherosclerosis, evaluated through a simulation-based knockout analysis.
In this analysis, certain specific transitions were disabled, and a simulation-based knockout analysis was performed. The focus was on examining the effects of this action on the atherosclerosis process, particularly the transition (atherosclerotic plaque formation). Different transitions were deactivated for each simulation, and then data on the firing of transitions were collected. Furthermore, information on the average number of transition firings and token accumulations was gathered. The outcomes are presented in Table 5. Only the results that demonstrate noteworthy alterations in the progression of atherosclerosis are incorporated in this table.
Table 5.
The effect of knocking out selected transitions on the atherosclerosis process () is shown. The change in firing probability is indicated in parentheses, represented as a percentage point difference compared to the reference firing value for , which is provided in the first row (where no knockouts occurred).
Upon examining Table 5, it is evident that the following transitions have the most significant influence on the transition , which is related to atherosclerosis: (monocyte differentiation from Lyc6Chigh), (monocyte entry into subendothelial space diapedesis), (monocyte slow roll on the inflamed endothelium), (endothelial selectin increased expression on cell surface), (monocyte roll over), (PSGL1 of monocyte and endothelial selectin interaction), (chemokine secretion), (enhanced monocyte production in bone marrow), (HSPC shift from the bone marrow into spleen, lungs, and liver), (defective cholesterol homeostasis), (local production of M-CSF in the vessel wall), (SRA1 and CD36 binding), (oxidative processes in the artery wall), and .
Scenario 2.
The effect of inhibiting the cytokine M-CSF.
Colony-stimulating factors (CSFs) are a group of cytokines that are important for forming blood cells, functioning leukocytes, and maintaining immune health. This family consists of M-CSF, G-CSF, and GM-CSF, where M-CSF and G-CSF have a specific influence on the survival, growth, differentiation, and functioning of monocytes/macrophages and neutrophils, respectively. Each member of this family plays a unique role in the development and activity of various immune cells [63]. M-CSF is constantly produced by different cell types, such as endothelial cells, osteoblasts, and macrophages, and plays a crucial role in the regulation of the functions of mononuclear phagocytes, including their survival, proliferation, and differentiation. It contributes to inflammation, which in turn leads to macrophage destruction and the progression of atherosclerosis. Furthermore, M-CSF triggers tissue factor production, which can result in plaque thrombosis and instability, which can lead to acute coronary syndrome [44]. Elevated levels of M-CSF have been observed in the bloodstream not only in cardiovascular diseases (CVDs) but also in various other diseases, such as tumors [45].
To investigate the impact of inhibiting M-CSF, we removed transition (local production of M-CSF in the vessel wall) from the model under study. As a result, it was possible to observe that the atherosclerotic plaque formation process was stopped in the analyzed model (see Figure 4). However, the altered cholesterol homeostasis balance still causes an accumulation of apoB lipoproteins, leading to lipid accumulation. This process triggers cellular responses within the artery wall and, subsequently, increases local inflammation. However, it is important to note that this accumulation does not directly cause plaque development in the model. If the transition (defective cholesterol homeostasis) is also blocked, then these processes stop. Furthermore, the secretion of pro-inflammatory cytokines such as IL-17 and IL-23 is inhibited, affecting the G-CSF cytokine secretion process, which IL-17 usually stimulates.
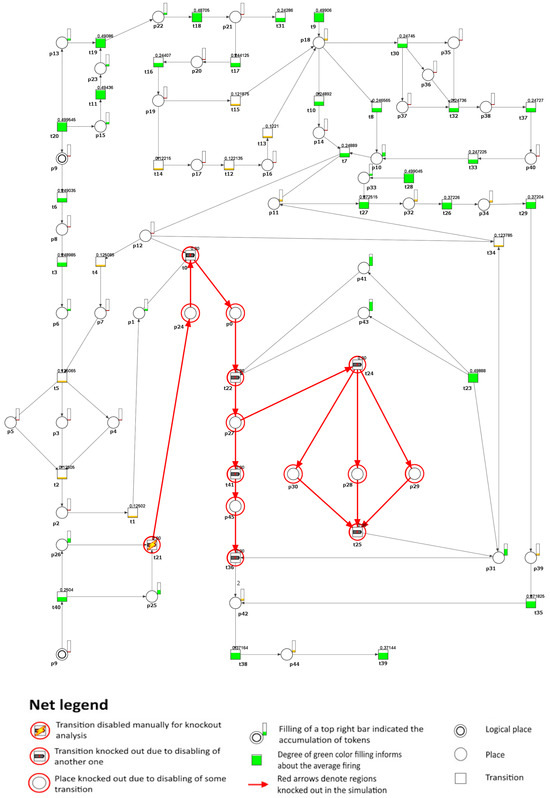
Figure 4.
A graphical depiction is presented to illustrate the impact of knockout on the development of atherosclerosis, specifically focusing on transition regarding the formation of atherosclerotic plaques (). In the graphical representation, the inactive transitions identified through simulation knockout are denoted by red circles. Active transitions are represented by rectangles filled with either green or yellow, indicating whether the activity of the transition has decreased (partially filled) or remained unchanged (fully filled) compared to the reference set.
Similarly, whether is inhibited alone or in conjunction with , the level of interleukin-10 (IL-10) produced by M2 macrophages, a cytokine with wide-ranging anti-inflammatory properties [2], remains unchanged (). Simultaneously, the M1 phenotype of the pro-inflammatory macrophage is inhibited ( (monocyte differentiation from Lyc6Chigh) and (M1 macrophages)).
The results presented in this scenario align with the findings of a previous study [46], which demonstrated that the absence of M-CSF leads to a decrease in macrophage proliferation, an increase in macrophage apoptosis within lesions, and a significant reduction in the development of atherosclerosis.
Scenario 3.
The impact of inhibition of IL-23 cytokine.
IL-23 is recognized for its significant role in chronic inflammation and its critical involvement in the production of IL-17 family cytokines by Th17 cells, thus establishing the IL-23/IL-17 axis. Additionally, it is known for its pro-atherogenic effects. This is further supported by several clinical research studies that have documented a notable increase in IL-23 levels in individuals with atherosclerosis [31,36].
To model the effects of inhibiting the IL-23 cytokine, we have excluded transition (IL-23 secretion) from the net. In a physiological context, the proposed effect might be achievable via two distinct but interconnected biological mechanisms. The first involves an increase in HDL-C levels [64], while the second strategy focuses on the direct inhibition of the IL-23 cytokine [65]. Consequently, in the model, we observed that one of the mechanisms leading to HSPCs’ mobilization, specifically the G-CSF-induced one, has been inhibited.
Another mechanism involved in the mobilization of HSPCs in the model is the CXCL12/CXCR4 pathway, which also plays a significant role in atherosclerosis. The interaction between CXCL12 and CXCR4 has been shown to activate a signaling pathway that inhibits the efflux of ABCA1-dependent macrophage cholesterol, thus intensifying atherosclerosis [66]. Therefore, if transition (cleavage of CXCR4 on HSPCs via increasing proteolytic activity caused by neutrophils) is further removed, the mobilization of HSPCs becomes blocked, ultimately leading to inhibition of atherosclerotic plaque formation in the model (see Figure 5).
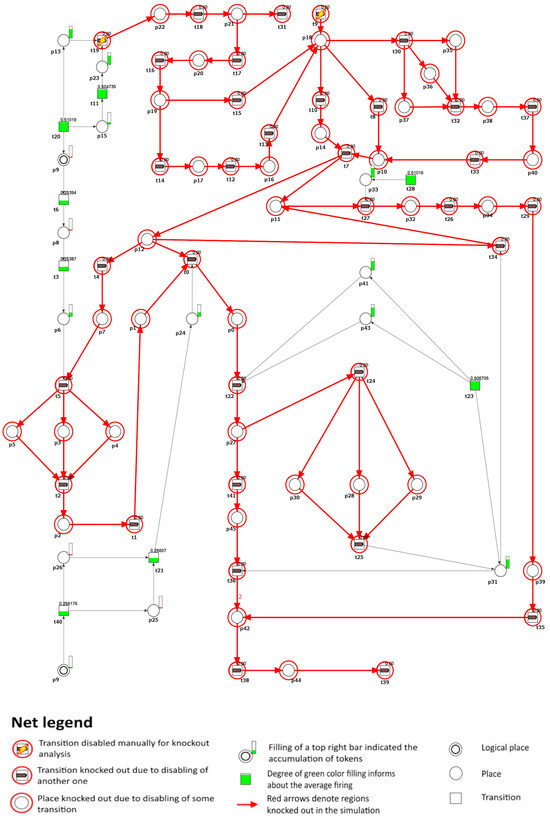
Figure 5.
A graphical representation that demonstrates the impact of knockout on the development of atherosclerosis, specifically focusing on the transitions and involved in the formation of atherosclerotic plaques (). In this graphical depiction, the inactive transitions identified by simulation knockout are represented by red circles. Active transitions are depicted as rectangles filled with green or yellow, indicating whether the activity of the transition has decreased (partially filled) or remained unchanged (fully filled) compared to the reference set.
Scenario 4.
Inhibition of M1 macrophages’ polarization while simultaneously promoting M2 macrophages’ polarization.
The immune system activates a defensive inflammatory response when it detects danger signals. This response includes several processes, with macrophages playing a crucial role. Macrophages, derived from monocytes in the bone marrow, adjust their characteristics and function based on the surrounding conditions, a process called polarization. There are two main types of macrophages: pro-inflammatory M1 and anti-inflammatory M2 [67]. M1 macrophages, stimulated by IFN- and LPS, release pro-inflammatory substances and have a significant impact on the advancement of atherosclerosis and chronic inflammation. This leads to the formation of foam cells and the development of plaque [51].
To simulate the impact of the inhibition of macrophage differentiation in the M1 type, we removed the transition (increased local inflammation) from the model. As a result, the development of atherosclerotic plaque in the model was observed to stop (similarly to that in Figure 4). Furthermore, it was noticed that the firing probability of the transition (monocyte differentiation from Lyc6Clow), as compared to the reference firing value, increased by 4%, indicating a significant influence on macrophage differentiation toward the M2 phenotype.
The results obtained are consistent with the findings described in [48], where it was demonstrated that by decreasing the polarization of M1 macrophages, it was possible to inhibit the formation of foam cells and the production of pro-inflammatory cytokines. Consequently, this led to a decrease in the development of atherosclerotic plaque.
As mentioned above, the same effect in the model can be achieved by blocking the transition (PSGL1 of monocyte and endothelial selectin interaction). Under physiological conditions, this can be obtained by blocking P-selectin and PSGL-1 using, for example, functional monoclonal antibodies [68].
The results are consistent with the previous study, in which it was demonstrated that P-selectin and PSGL-1, in conjunction with an array of inflammatory elements, play a role in the formation and advancement of atherosclerosis [69].
Transitioning from this targeted intervention approach, it is crucial to acknowledge the broader framework within which our model operates. Although the model is comprehensive in its current scope, it naturally focuses on specific aspects of the pathogenesis of atherosclerosis, particularly those related to macrophages and their interactions with other cellular and molecular players. Consequently, certain systemic factors that are recognized to impact the progression of atherosclerosis, such as diabetes, hyperinsulinemia, and endothelial dysfunction, were not explicitly integrated into the model. This choice demonstrates the inherent difficulty in constructing a model that strikes a balance between complexity and specificity, aiming to investigate specific mechanisms in depth while acknowledging the wider context of research on atherosclerosis.
3.4. Limitations of the Study
To effectively model a complex biological system with Petri nets, a certain level of generalization is necessary due to the inherent complexity and multitude of processes that typically underpin the phenomena modeled using such systems. This means that not all possible processes and pathways can be modeled, and certain simplifications are essential to make the model manageable and computationally feasible.
Furthermore, traditional network models mainly aim to capture the structure of biological systems, which is crucial for understanding their functionality. Such qualitative approaches are key to identifying these systems’ fundamental aspects and interactions, despite simplifying complex biological processes. They may not fully cover complex interactions or the entire range of dynamic behaviors, including the specifics of time-dependent changes. Moreover, simulating theoretical knockouts might not accurately mirror the effects of actual interventions in these systems.
Despite these drawbacks, the importance of network-based models in revealing system properties and guiding experimental validation should not be overlooked. However, caution should be exercised in interpreting the results, and, ideally, model-based predictions should be validated through experimental work. Unfortunately, gathering exhaustive experimental evidence covering all aspects of a complex long-term disease such as atherosclerosis might not always be practical or possible.
3.5. Potential Clinical Relevance of the Study
Our investigation into atherosclerosis using a Petri net-based model reveals clinical potential by elucidating the interplay between cholesterol homeostasis, macrophage dynamics, and plaque formation. The discoveries, such as the effects of inhibiting macrophage colony-stimulating factor (M-CSF) and targeting the CXCL12/CXCR4 pathway, introduce innovative approaches to mitigating plaque formation. These insights, in line with previous studies, indicate that alternative strategies, such as regulating macrophage M1 polarization, could drive therapeutic progress.
Nevertheless, translating these theoretical understandings into practical clinical uses encounters challenges, including verifying the accuracy of the model, considering individual patient variables, understanding the intricacies of biological processes, and carrying out thorough clinical tests. There are also ethical concerns surrounding the utilization of model-driven forecasts without solid empirical support and the necessity of effectively educating healthcare providers about the model’s intricacies. In conclusion, although the Petri net model demonstrates significant promise, its integration into clinical environments requires thorough assessment and collaborative work in various fields.
4. Conclusions
The study investigates the complex relationship between cholesterol homeostasis, macrophage dynamics, and atherosclerosis using a classical Petri net model based on biological and medical literature. The model suggests that inhibiting M-CSF significantly affects the formation of atherosclerotic plaques by altering macrophage behavior and inflammatory responses, while disturbances in cholesterol homeostasis continue to lead to lipid accumulation. This is supported by research indicating M-CSF’s pivotal role in macrophage activation, foam cell creation, and chronic inflammation, which are essential for plaque development and instability [44,46,49]. As a result, future therapeutic strategies that aim to target M-CSF and its associated cytokines are proposed to mitigate inflammatory conditions, thus potentially decreasing the risk of adverse events related to atherosclerosis [49].
The inhibition of IL-23 also shows its role in inflammation and atherosclerosis, suggesting therapeutic targets by modulating the IL-23/IL-17 axis. It is also associated with increased mortality in carotid artery stenosis and is detected in atherosclerotic plaques, emphasizing its role in promoting atherosclerosis through TH17 cell activation in mice [70]. Although IL-23 is investigated for atherosclerosis treatment, meta-analyses suggest that IL-23 blockers such as ustekinumab could not improve or worsen cardiovascular outcomes in patients with psoriasis. This highlights the complex role of IL-23, but the primary focus on psoriasis in these studies limits conclusions about its impact on atherosclerosis, making its direct effects uncertain [71,72].
The model also points to the potential of the CXCL12/CXCR4 pathway in the treatment of atherosclerosis by inhibiting HSPCs’ mobilization and plaque formation. This aligns with recent literature, suggesting that the CXCL12/CXCR4 axis performs more complex functions than previously understood. CXCL12 and its receptors are now considered potential therapeutic targets and biomarkers for atherosclerosis [73,74].
It also emphasizes that macrophage polarization towards anti-inflammatory states could markedly reduce plaque development. This aligns with current literature, which suggests that, since macrophage polarization plays a role at various stages, targeting it could be a key strategy for atherosclerosis management. Balancing macrophage subtypes and promoting anti-inflammatory transformations might offer effective prevention and treatment options [48,75,76,77].
The development of atherosclerosis is complex and cannot be fully halted by lipid-lowering therapies. These insights align with current research, highlight strategies such as reducing M1 polarization for therapeutic benefits, and underscore the importance of macrophage regulation and cholesterol pathways in atherosclerosis, suggesting avenues for future research and novel treatment approaches. Furthermore, our comprehensive mathematical model, which surpasses earlier suggestions [13,14,15,16,17,18,19,20,21,22], covers a broad spectrum of processes related to the interplay between cholesterol balance, macrophage behavior, and the development of atherosclerosis. This enhanced predictive capacity of the model not only confirms its value in identifying therapeutic targets but also facilitates the simulation of various clinical scenarios to explore new treatment strategies and responses to potential medications.
Author Contributions
Conceptualization, A.R., D.F. and P.F.; model development, D.F.; system analysis, A.R., D.F. and P.F.; biological conclusions, A.R. and D.F.; writing—original draft preparation, A.R., D.F. and P.F.; funding acquisition, D.F. and P.F. All authors have read and agreed to the published version of the manuscript.
Funding
This work was partially supported by the National Science Centre (Poland) grant No. 2012/07/B/ST6/01537, by statutory funds of Poznan University of Technology and by statutory funds of Poznan University of Medical Sciences.
Institutional Review Board Statement
Not applicable.
Informed Consent Statement
Not applicable.
Data Availability Statement
Data are contained within the article.
Conflicts of Interest
The authors declare no conflicts of interest.
Abbreviations
The following abbreviations are used in this manuscript:
| ABCA1 | ATP-binding cassette protein A1 |
| ABCG1 | ATP-binding cassette protein G1 |
| ApoB | apolipoprotein B |
| ApoE | apolipoprotein E |
| CCL2 | chemokine (C–C motif) ligand 2 |
| CCL5 | chemokine (C–C motif) ligand 5 |
| CCR2 | (C-C motif) chemokine receptor 2 |
| CD36 | cluster of differentiation 36 |
| CD62L | L-selectin |
| CMP | common myeloid progenitors |
| CVD | cardiovascular disease |
| CXCL1 | C-X-C motif ligand 1 |
| CXCL12 | C-X-C motif ligand 12 |
| CX3CL1 | C-X3-C motif ligand 1 |
| CX3CR1 | C-X3-C motif chemokine receptor type 1 |
| CXCR4 | C-X-C motif chemokine receptor type 4 |
| EC | endothelial cell |
| eNOS | endothelial nitric oxide synthase |
| G-CSF | granulocyte colony-stimulating factor |
| GM-CSF | granulocyte–macrophage colony-stimulating factor |
| GMP | granulocyte–monocyte progenitor |
| HDL | high-density lipoprotein |
| HDL-C | high-density lipoprotein cholesterol |
| HSPCs | hematopoietic stem and progenitor cells |
| ICAM-1 | intercellular adhesion molecule-1 |
| IFN- | interferon gamma |
| IL | interleukin |
| IL-3R | interleukin-3 receptor beta |
| LDL-C | low-density lipoprotein cholesterol |
| LFA-1 | lymphocyte function-associated antigen-1 |
| LP | lipoprotein |
| LPS | lipopolysaccharide |
| LXR | liver X receptor |
| Ly6C | lymphocyte antigen 6 complex, locus C1 |
| Ly6Chigh | monocytes with high expression of CCR2 and CD62L and moderate expression of CX3CR1 |
| Ly6Clow | monocytes with high expression of CX3CR1 and low expression of CCR2 and CD62L |
| M-CSF | macrophage colony-stimulating factor |
| M-CSFR | macrophage colony-stimulating factor receptor |
| NR4A1 | nuclear receptor subfamily 4 group A member 1 |
| modLDL | modified low-density lipoproteins |
| ODE | ordinary differential equation |
| oxLDL | oxidized low-density lipoprotein |
| PDE | partial differential equation |
| PSGL-1 | P-selectin glycoprotein ligand-1 |
| SMC | smooth muscle cell |
| SRA1 | scavenger receptor A1 |
| Th17 | T helper 17 cell |
| TLR4 | toll-like receptor 4 |
| TNF | tumor necrosis factor |
| VCAM-1 | vascular cell adhesion molecule |
| VLA-4 | very late activation antigen-4 |
Appendix A
Table A1.
t-invariants of the model.
Table A1.
t-invariants of the model.
| t-Invariant | Contained MCT Sets | Contained Transitions | Biological Interpretation |
|---|---|---|---|
| , | , | The cascade of events resulting from disturbances in cholesterol homeostasis, including the secretion of IL-17, leading to increased eNOS expression without triggering G-CSF release from peripheral cells and simultaneously contributing to inflammation and plaque formation. | |
| , | , | The cascade of events resulting from disturbances in cholesterol homeostasis encompasses the secretion of IL-17, which in turn triggers the release of G-CSF from peripheral cells, but does not lead to increased eNOS expression, while simultaneously contributing to inflammation and plaque formation. | |
| ,, | Disturbances in cholesterol homeostasis contribute to inflammation, oxidative stress, and monocyte differentiation, leading to atherosclerotic plaque development, cellular accumulation in HSPCs, and promotion of early plaque formation with fibrous cap thinning. | ||
| ,, | The activation of IL-17 leads to the stimulation of eNOS expression without triggering G-CSF release from peripheral cells. Simultaneously, it initiates the pathway linked to inflammation and the secretion of chemokines and cytokines by foam cells. | ||
| ,, | , | The activation of IL-17, leading to the release of G-CSF from peripheral cells, which favors neutrophils over monocytes and macrophages but does not increase eNOS expression while also initiating a pathway that causes inflammation and triggers the secretion of chemokines and cytokines by foam cells. | |
| ,, | , | The activation of IL-17 triggers the release of G-CSF from peripheral cells, leading to a decrease in bone marrow macrophages, and simultaneously initiates a pathway that induces inflammation and stimulates foam cells to secrete chemokines and cytokines. | |
| ,,, | The activation of IL-17 leads to the stimulation of eNOS expression without inducing G-CSF release from peripheral cells, contributes to decreased cholesterol efflux in HSPCs due to hypercholesterolemia, and is associated with the growth of atherosclerotic plaques and thinning of the fibrous cap. | ||
| ,,, | The activation of IL-17 leads to the release of G-CSF from peripheral cells, which favors neutrophils over monocytes and macrophages, contributes to decreased cholesterol efflux in HSPCs due to hypercholesterolemia, and is associated with the growth of atherosclerotic plaques and thinning of the fibrous cap. | ||
| ,,, | IL-17 activation triggers G-CSF release from peripheral cells and reduces bone marrow macrophages, affecting cholesterol efflux in HSPCs and contributing to atherosclerotic plaque growth and fibrous cap thinning. | ||
| ,,, | IL-17 activation stimulates eNOS expression without triggering G-CSF release from peripheral cells, affecting cholesterol efflux in HSPCs, and initiating a pathway that causes inflammation and prompts foam cells to secrete chemokines and cytokines. | ||
| ,,,, | IL-17 activation results in the release of G-CSF from peripheral cells, favoring neutrophils over monocytes and macrophages, influencing cholesterol efflux in HSPCs, and triggering a pathway leading to inflammation and stimulating foam cells to secrete chemokines and cytokines. | ||
| ,,,, | Activation of IL-17 leads to the release of G-CSF from peripheral cells and a reduction in bone marrow macrophages, which influences cholesterol efflux in HSPCs and initiates a pathway that induces inflammation and stimulates foam cells to secrete chemokines and cytokines. |
References
- Theofilis, P.; Oikonomou, E.; Tsioufis, K.; Tousoulis, D. The Role of Macrophages in Atherosclerosis: Pathophysiologic Mechanisms and Treatment Considerations. Int. J. Mol. Sci. 2023, 24, 9568. [Google Scholar] [CrossRef]
- Razeghian-Jahromi, I.; Karimi Akhormeh, A.; Razmkhah, M.; Zibaeenezhad, M. Immune system and atherosclerosis: Hostile or friendly relationship. Int. J. Immunopathol. Pharmacol. 2022, 36, 3946320221092188. [Google Scholar] [CrossRef] [PubMed]
- Chistiakov, D.; Melnichenko, A.; Myasoedova, V.; Grechko, A.; Orekhov, A. Mechanisms of foam cell formation in atherosclerosis. J. Mol. Med. 2017, 95, 1153–1165. [Google Scholar] [CrossRef] [PubMed]
- Teh, Y.C.; Ding, J.L.; Ng, L.G.; Chong, S.Z. Capturing the Fantastic Voyage of Monocytes Through Time and Space. Front. Immunol. 2019, 10, 430534. [Google Scholar] [CrossRef] [PubMed]
- Medrano-Bosch, M.; Simón-Codina, B.; Jiménez, W.; Edelman, E.R.; Melgar-Lesmes, P. Monocyte-endothelial cell interactions in vascular and tissue remodeling. Front. Immunol. 2023, 14, 1196033. [Google Scholar] [CrossRef] [PubMed]
- Frodermann, V.; Nahrendorf, M. Macrophages and Cardiovascular Health. Physiol. Rev. 2018, 98, 2523–2569. [Google Scholar] [CrossRef] [PubMed]
- Checkouri, E.; Blanchard, V.; Meilhac, O. Macrophages in Atherosclerosis, First or Second Row Players? Biomedicines 2021, 9, 1214. [Google Scholar] [CrossRef]
- Yang, J.; Zhang, L.; Yu, C.; Yang, X.; Wang, H. Monocyte and macrophage differentiation: Circulation inflammatory monocyte as biomarker for inflammatory diseases. Biomark. Res. 2014, 2, 1. [Google Scholar] [CrossRef]
- Flynn, M.; Pernes, G.; Lee, M.; Nagareddy, P.; Murphy, A. Monocytes, Macrophages, and Metabolic Disease in Atherosclerosis. Front. Pharmacol. 2019, 10, 666. [Google Scholar] [CrossRef]
- Farahi, L.; Sinha, S.K.; Lusis, A.J. Roles of Macrophages in Atherogenesis. Front. Pharmacol. 2021, 12, 785220. [Google Scholar] [CrossRef] [PubMed]
- Vogel, A.; Brunner, J.; Hajto, A.; Sharif, O.; Schabbauer, G. Lipid scavenging macrophages and inflammation. Biochim. Biophys. Acta (Bba) Mol. Cell Biol. Lipids 2022, 1867, 159066. [Google Scholar] [CrossRef] [PubMed]
- Bargieł, W.; Cierpiszewska, K.; Maruszczak, K.; Pakuła, A.; Szwankowska, D.; Wrzesińska, A.; Gutowski, Ł.; Formanowicz, D. Recognized and Potentially New Biomarkers—Their Role in Diagnosis and Prognosis of Cardiovascular Disease. Medicina 2021, 57, 71. [Google Scholar] [CrossRef] [PubMed]
- Watson, M.; Chambers, K.; Myerscough, M. A Lipid-Structured Model of Atherosclerotic Plaque Macrophages with Lipid-Dependent Kinetics. Bull. Math. Biol. 2023, 85, 85. [Google Scholar] [CrossRef] [PubMed]
- Pozzi, S.; Redaelli, A.; Vergara, C.; Votta, E.; Zunino, P. Mathematical Modeling and Numerical Simulation of Atherosclerotic Plaque Progression Based on Fluid-Structure Interaction. J. Math. Fluid Mech. 2021, 23, 74. [Google Scholar] [CrossRef]
- Nickaeen, N.; Ghaisari, J.; Heiner, M.; Moein, S.; Gheisari, Y. Agent-based modeling and bifurcation analysis reveal mechanisms of macrophage polarization and phenotype pattern distribution. Sci. Rep. 2019, 9, 12764. [Google Scholar] [CrossRef]
- Liu, M.; Cai, Y.; Pan, J.; Peter, K.; Li, Z. Macrophage polarization as a potential therapeutic target for atherosclerosis: A dynamic stochastic modelling study. R. Soc. Open Sci. 2022, 9, 220239. [Google Scholar] [CrossRef] [PubMed]
- Minucci, S.; Heise, R.; Reynolds, A. Agent-based vs. equation-based multi-scale modeling for macrophage polarization. PLoS ONE 2024, 19, e0270779. [Google Scholar] [CrossRef]
- Lui, G.; Myerscough, M. Modelling Preferential Phagocytosis in Atherosclerosis: Delineating Timescales in Plaque Development. Bull. Math. Biol. 2021, 83, 96. [Google Scholar] [CrossRef] [PubMed]
- Ford, H.; Byrne, H.; Myerscough, M. A lipid-structured model for macrophage populations in atherosclerotic plaques. J. Theor. Biol. 2019, 479, 48–63. [Google Scholar] [CrossRef]
- Cohen, A.; Myerscough, M.; Thompson, R. Athero-protective effects of High Density Lipoproteins (HDL): An ODE model of the early stages of atherosclerosis. Bull. Math. Biol. 2014, 76, 1117–1142. [Google Scholar] [CrossRef] [PubMed]
- Bulelzai, M.; Dubbeldam, J. Long time evolution of atherosclerotic plaques. J. Theor. Biol. 2012, 297, 1–10. [Google Scholar] [CrossRef] [PubMed]
- Frei, S.; Heinlein, A. Towards parallel time-stepping for the numerical simulation of atherosclerotic plaque growth. J. Comput. Phys. 2023, 491, 112347. [Google Scholar] [CrossRef]
- Rżosińska, K.; Formanowicz, D.; Formanowicz, P. The study of the influence of micro-environmental signals on macrophage differentiation using a quantitative Petri net based model. Arch. Control. Sci. 2017, 2, 331–349. [Google Scholar] [CrossRef]
- Klipp, E.; Liebermeister, W.; Wierling, C.; Kowald, A.; Lehrach, H.; Herwig, R. Systems Biology. A Textbook; Wiley-VCH: Weinheim, Germany, 2009. [Google Scholar]
- Koch, I.; Reisig, W.; Schreiber, F. (Eds.) Modeling in Systems Biology. The Petri Net Approach; Springer: London, UK, 2011. [Google Scholar]
- Formanowicz, D.; Rybarczyk, A.; Radom, M.; Tanas, K.; Formanowicz, P. A Stochastic Petri Net-Based Model of the Involvement of Interleukin 18 in Atherosclerosis. Int. J. Mol. Sci. 2020, 21, 8574. [Google Scholar] [CrossRef] [PubMed]
- David, R.; Alla, H. Discrete, Continuous, and Hybrid Petri Nets; Springer: Berlin/Heidelberg, Germany, 2010. [Google Scholar]
- Murata, T. Petri nets: Properties, analysis and applications. Proc. IEEE 1989, 77, 541–580. [Google Scholar] [CrossRef]
- Sackmann, A.; Heiner, M.; Koch, I. Application of Petri net based analysis techniques to signal transduction pathway. BMC Bioinform. 2006, 7, 482. [Google Scholar] [CrossRef]
- Formanowicz, D.; Kozak, A.; Głowacki, T.; Radom, M.; Formanowicz, P. Hemojuvelin–hepcidin axis modeled and analyzed using Petri nets. J. Biomed. Inform. 2013, 46, 1030–1043. [Google Scholar] [CrossRef]
- Abbas, A.; Gregersen, I.; Holm, S.; Daissormont, I.; Bjerkeli, V.; Krohg-Sørensen, K.; Skagen, K.; Dahl, T.; Russell, D.; Almås, T.; et al. Interleukin 23 levels are increased in carotid atherosclerosis: Possible role for the interleukin 23/interleukin 17 axis. Stroke 2015, 46, 793–799. [Google Scholar] [CrossRef]
- Iwakura, Y.; Ishigame, H. The IL-23/IL-17 axis in inflammation. J. Clin. Investig. 2006, 116, 1218–1222. [Google Scholar] [CrossRef] [PubMed]
- Blagov, A.V.; Markin, A.M.; Bogatyreva, A.I.; Tolstik, T.V.; Sukhorukov, V.N.; Orekhov, A.N. The Role of Macrophages in the Pathogenesis of Atherosclerosis. Cells 2023, 12, 522. [Google Scholar] [CrossRef]
- Gencer, S.; Evans, B.; van der Vorst, E.; Doring, Y.; Weber, C. Inflammatory Chemokines in Atherosclerosis. Cells 2021, 10, 226. [Google Scholar] [CrossRef] [PubMed]
- Moore, K.J.; Sheedy, F.J.; Fisher, E.A. Macrophages in atherosclerosis: A dynamic balance. Nat. Rev. Immunol. 2013, 13, 709–721. [Google Scholar] [CrossRef]
- Liu, W.; Chang, C.; Hu, H.; Yang, H. Interleukin-23: A New Atherosclerosis Target. J. Interferon Cytokine Res. 2018, 38, 440–444. [Google Scholar] [CrossRef] [PubMed]
- Wang, Q.; Wang, Y.; Xu, D. Research progress on Th17 and T regulatory cells and their cytokines in regulating atherosclerosis. Front. Cardiovasc. Med. 2022, 9, 929078. [Google Scholar] [CrossRef] [PubMed]
- Westerterp, M.; Gourion-Arsiquaud, S.; Murphy, A.; Shih, A.; Cremers, S.; Levine, R.; Tall, A.; Yvan-Charvet, L. Regulation of Hematopoietic Stem and Progenitor Cell Mobilization by Cholesterol Efflux Pathways. Cell Stem Cell 2012, 11, 195–206. [Google Scholar] [CrossRef] [PubMed]
- Lévesque, J.P.; Hendy, J.; Takamatsu, Y.; Williams, B.; Winkler, I.; Simmons, P. Mobilization by either cyclophosphamide or granulocyte colony-stimulating factor transforms the bone marrow into a highly proteolytic environment. Exp. Hematol. 2002, 30, 440–449. [Google Scholar] [CrossRef]
- Maurer, A.; Klein, G.; Staudt, N. Assessment of Proteolytic Activities in the Bone Marrow Microenvironment. Methods Mol. Biol. 2019, 2017, 149–163. [Google Scholar] [CrossRef]
- Shahnazari, M.; Chu, V.; Wronski, T.J.; Nissenson, R.A.; Halloran, B.P. CXCL12/CXCR4 signaling in the osteoblast regulates the mesenchymal stem cell and osteoclast lineage populations. FASEB J. 2013, 27, 3505–3513. [Google Scholar] [CrossRef] [PubMed]
- Lund-Katz, S.; Phillips, M.C. High density lipoprotein structure-function and role in reverse cholesterol transport. In Cholesterol Binding and Cholesterol Transport Proteins; Springer: Berlin/Heidelberg, Germany, 2010; Volume 51, pp. 183–227. [Google Scholar] [CrossRef]
- Yáñez, A.; Coetzee, S.G.; Olsson, A.; Muench, D.E.; Berman, B.P.; Hazelett, D.J.; Salomonis, N.; Grimes, H.L.; Goodridge, H.S. Granulocyte-Monocyte Progenitors and Monocyte-Dendritic Cell Progenitors Independently Produce Functionally Distinct Monocytes. Immunity 2017, 47, 890–902.e4. [Google Scholar] [CrossRef] [PubMed]
- Deng, X.; Yang, Q.; Wang, Y.; Yang, Y.; Pei, G.; Zhu, H.; Wu, J.; Wang, M.; Zhao, Z.; Xu, H.; et al. Association of plasma macrophage colony-stimulating factor with cardiovascular morbidity and all-cause mortality in chronic hemodialysis patients. BMC Nephrol. 2019, 20, 321. [Google Scholar] [CrossRef]
- Barceló, C.; Sisó, P.; de la Rosa, I.; Megino-Luque, C.; Navaridas, R.; Maiques, O.; Urdanibia, I.; Eritja, N.; Soria, X.; Potrony, M.; et al. M-CSF as a therapeutic target in BRAFV600E melanoma resistant to BRAF inhibitors. Br. J. Cancer. 2022, 127, 1142–1152. [Google Scholar] [CrossRef] [PubMed]
- Sinha, S.; Miikeda, A.; Fouladian, Z.; Mehrabian, M.; Edillor, C.; Shih, D.; Zhou, Z.; Paul, M.; Charugundla, S.; Davis, R.; et al. Local M-CSF (Macrophage Colony-Stimulating Factor) Expression Regulates Macrophage Proliferation and Apoptosis in Atherosclerosis. Arterioscler. Thromb. Vasc. Biol. 2021, 41, 220–233. [Google Scholar] [CrossRef] [PubMed]
- Olingy, C.E.; San Emeterio, C.L.; Ogle, M.E.; Krieger, J.R.; Bruce, A.C.; Pfau, D.D.; Jordan, B.T.; Peirce, S.M.; Botchwey, E.A. Non-classical monocytes are biased progenitors of wound healing macrophages during soft tissue injury. Sci. Rep. 2017, 7, 447. [Google Scholar] [CrossRef] [PubMed]
- Wu, J.; He, S.; Song, Z.; Chen, S.; Lin, X.; Sun, H.; Zhou, P.; Peng, Q.; Du, S.; Zheng, S.; et al. Macrophage polarization states in atherosclerosis. Front. Immunol. 2023, 14, 1185587. [Google Scholar] [CrossRef]
- Hou, P.; Fang, J.; Liu, Z.; Shi, Y.; Agostini, M.; Bernassola, F.; Bove, P.; Candi, E.; Rovella, V.; Sica, G.; et al. Macrophage polarization and metabolism in atherosclerosis. Cell Death Disease 2023, 14, 691. [Google Scholar] [CrossRef] [PubMed]
- Muñoz, J.; Akhavan, N.; Mullins, A.; Arjmandi, B. Macrophage Polarization and Osteoporosis: A Review. Nutrients 2020, 12, 2999. [Google Scholar] [CrossRef] [PubMed]
- Lee, S.; Oh, J.; Bong, S.; Kim, J.; Park, S.; Kim, S.; Park, S.; Lee, S.; Jang, Y. Macrophage polarization and acceleration of atherosclerotic plaques in a swine model. PLoS ONE 2018, 13, e0193005. [Google Scholar] [CrossRef] [PubMed]
- Radom, M.; Rybarczyk, A.; Szawulak, B.; Andrzejewski, H.; Chabelski, P.; Kozak, A.; Formanowicz, P. Holmes: A graphical tool for development, simulation and analysis of Petri net based models of complex biological systems. Bioinformatics 2017, 33, 3822–3823. [Google Scholar] [CrossRef]
- Allam, G.; Abdel-Moneim, A.; Gaber, A. The pleiotropic role of interleukin-17 in atherosclerosis. Biomed. Pharmacother. 2018, 106, 1412–1418. [Google Scholar] [CrossRef] [PubMed]
- Huo, Y.; Xia, L. P-selectin glycoprotein ligand-1 plays a crucial role in the selective recruitment of leukocytes into the atherosclerotic arterial wall. Trends Cardiovasc. Med. 2009, 19, 140–145. [Google Scholar] [CrossRef][Green Version]
- Akhter, N.; Kochumon, S.; Hasan, A.; Wilson, A.; Nizam, R.; Al Madhoun, A.; Al-Rashed, F.; Arefanian, H.; Alzaid, F.; Sindhu, S.; et al. IFN-γ′ and LPS Induce Synergistic Expression of CCL2 in Monocytic Cells via H3K27 Acetylation. J. Inflamm. Res. 2022, 15, 4291–4302. [Google Scholar] [CrossRef] [PubMed]
- Zhao, L.; Ma, D.; Wang, L.; Su, X.; Feng, L.; Zhu, L.; Chen, Y.; Hao, Y.; Wang, X.; Feng, J. Metabolic changes with the occurrence of atherosclerotic plaques and the effects of statins. Front. Pharmacol. 2023, 14, 1301051. [Google Scholar] [CrossRef] [PubMed]
- Pawig, L.; Klasen, C.; Weber, C.; Bernhagen, J.; Noels, H. Diversity and Inter-Connections in the CXCR4 Chemokine Receptor/Ligand Family: Molecular Perspectives. Front. Immunol. 2015, 6, 429. [Google Scholar] [CrossRef]
- Ruiz de Morales, J.; Puig, L.; Daudén, E.; Cañete, J.; Pablos, J.; Martín, A.; Juanatey, C.; Adán, A.; Montalbán, X.; Borruel, N.; et al. Critical role of interleukin (IL)-17 in inflammatory and immune disorders: An updated review of the evidence focusing in controversies. Autoimmun. Rev. 2020, 19, 102429. [Google Scholar] [CrossRef]
- Ziegon, L.; Schlegel, M. Netrin-1: A Modulator of Macrophage Driven Acute and Chronic Inflammation. Int. J. Mol. Sci. 2021, 23, 275. [Google Scholar] [CrossRef] [PubMed]
- Ma, X.; Feng, Y. Hypercholesterolemia Tunes Hematopoietic Stem/Progenitor Cells for Inflammation and Atherosclerosis. Int. J. Mol. Sci. 2016, 17, 1162. [Google Scholar] [CrossRef] [PubMed]
- Grunwald, S.; Speer, A.; Ackermann, J.; Koch, I. Petri net modelling of gene regulation of the Duchenne muscular dystrophy. Biosystems 2008, 92, 189–205. [Google Scholar] [CrossRef]
- Rybarczyk, A.; Formanowicz, D.; Formanowicz, P. Key Therapeutic Targets to Treat Hyperglycemia-Induced Atherosclerosis Analyzed Using a Petri Net-Based Model. Metabolites 2023, 13, 1191. [Google Scholar] [CrossRef] [PubMed]
- Jeannin, P.; Paolini, L.; Adam, C.; Delneste, Y. The roles of CSFs on the functional polarization of tumor-associated macrophages. FEBS J. 2018, 285, 680–699. [Google Scholar] [CrossRef] [PubMed]
- Soehnlein, O.; Swirski, F. Hypercholesterolemia links hematopoiesis with atherosclerosis. Trends Endocrinol. Metab. 2013, 24, 129–136. [Google Scholar] [CrossRef]
- Yang, K.; Oak, A.; Elewski, B. Use of IL-23 Inhibitors for the Treatment of Plaque Psoriasis and Psoriatic Arthritis: A Comprehensive Review. Am. J. Clin. Dermatol. 2021, 22, 173–192. [Google Scholar] [CrossRef] [PubMed]
- Ngamsri, K.; Jans, C.; Putri, R.; Schindler, K.; Gamper-Tsigaras, J.; Eggstein, C.; Kohler, D.; Konrad, F. Inhibition of CXCR4 and CXCR7 Is Protective in Acute Peritoneal Inflammation. Front. Immunol. 2020, 11, 407. [Google Scholar] [CrossRef] [PubMed]
- Chen, S.; Saeed, A.; Liu, Q.; Jiang, Q.; Xu, H.; Xiao, G.; Rao, L.; Duo, Y. Macrophages in immunoregulation and therapeutics. Signal. Transduct. Target Ther. 2023, 8, 207. [Google Scholar] [CrossRef] [PubMed]
- Muz, B.; Azab, F.; de la Puente, P.; Rollins, S.; Alvarez, R.; Kawar, Z.; Azab, A. Inhibition of P-Selectin and PSGL-1 Using Humanized Monoclonal Antibodies Increases the Sensitivity of Multiple Myeloma Cells to Bortezomib. Biomed. Res. Int. 2015, 2015, 417586. [Google Scholar] [CrossRef] [PubMed]
- Ye, Z.; Zhong, L.; Zhu, S.; Wang, Y.; Zheng, J.; Wang, S.; Zhang, J.; Huang, R. The P-selectin and PSGL-1 axis accelerates atherosclerosis via activation of dendritic cells by the TLR4 signaling pathway. Cell Death Dis. 2019, 10, 507. [Google Scholar] [CrossRef] [PubMed]
- Ma, S.; Zhong, D.; Chen, H.; Zheng, Y.; Sun, Y.; Luo, J.; Li, H.; Li, G.; Yin, Y. The immunomodulatory effect of bone marrow stromal cells (BMSCs) on interleukin (IL)-23/IL-17-mediated ischemic stroke in mice. J. Neuroimmunol. 2013, 257, 28–35. [Google Scholar] [CrossRef] [PubMed]
- Tzellos, T.; Kyrgidis, A.; Zouboulis, C. Re-evaluation of the risk for major adverse cardiovascular events in patients treated with anti-IL-12/23 biological agents for chronic plaque psoriasis: A meta-analysis of randomized controlled trials. J. Eur. Acad. Dermatol. Venereol. 2013, 27, 622–627. [Google Scholar] [CrossRef] [PubMed]
- Engelen, S.; Robinson, A.; Zurke, Y.X.; Monaco, C. Therapeutic strategies targeting inflammation and immunity in atherosclerosis: How to proceed? Nat. Rev. Cardiol. 2022, 19, 522–542. [Google Scholar] [CrossRef] [PubMed]
- Gao, J.H.; He, L.H.; Yu, X.H.; Zhao, Z.W.; Wang, G.; Zou, J.; Wen, F.J.; Zhou, L.; Wan, X.J.; Zhang, D.W.; et al. CXCL12 promotes atherosclerosis by downregulating ABCA1 expression via the CXCR4/GSK3β/β-cateninT120/TCF21 pathway. J. Lipid Res. 2019, 60, 2020–2033. [Google Scholar] [CrossRef]
- Murad, H.; Rafeeq, M.; Alqurashi, T. Role and implications of the CXCL12/CXCR4/CXCR7 axis in atherosclerosis: Still a debate. Ann. Med. 2021, 53, 1598–1612. [Google Scholar] [CrossRef]
- Decano, J.; Aikawa, M. Dynamic Macrophages: Understanding Mechanisms of Activation as Guide to Therapy for Atherosclerotic Vascular Disease. Front. Cardiovasc. Med. 2018, 5, 97. [Google Scholar] [CrossRef] [PubMed]
- Bi, Y.; Chen, J.; Hu, F.; Liu, J.; Li, M.; Zhao, L. M2 Macrophages as a Potential Target for Antiatherosclerosis Treatment. Neural Plast. 2019, 2019, 6724903. [Google Scholar] [CrossRef] [PubMed]
- Liu, Y.C.; Zou, X.B.; Chai, Y.F.; Yao, Y.M. Macrophage Polarization in Inflammatory Diseases. Int. J. Biol. Sci. 2014, 10, 520–529. [Google Scholar] [CrossRef] [PubMed]


Disclaimer/Publisher’s Note: The statements, opinions and data contained in all publications are solely those of the individual author(s) and contributor(s) and not of MDPI and/or the editor(s). MDPI and/or the editor(s) disclaim responsibility for any injury to people or property resulting from any ideas, methods, instructions or products referred to in the content. |
© 2024 by the authors. Licensee MDPI, Basel, Switzerland. This article is an open access article distributed under the terms and conditions of the Creative Commons Attribution (CC BY) license (https://creativecommons.org/licenses/by/4.0/).