Abstract
With the increasing severity of global climate change and environmental degradation, countries have put forward strategies to reduce carbon emissions and promote sustainable development. The construction industry is a major source of carbon emissions, and as such, the development of green concrete is now critically important to the industry’s growth. Traditional concrete production methods use a lot of resources and produce a lot of carbon emissions. The study examines the use of recycled pumice and sodium dodecyl benzene sulfonate to modify waste rubber powder, which is then externally mixed into recycled coarse aggregate concrete. The study analyzes the impact of these modifiers on the rubber powder particles, as well as the effects of particle size and mixing amount on the resulting concrete. The investigation proved that the rubber recycled coarse aggregate concrete’s performance was enhanced by the modifier. This improvement addressed the issue of low compressive strength in rubber concrete to some extent and also had a positive impact on its resistance to freeze-thaw cycles. The experiment concluded that the best results were achieved by selecting rubber powder particles of Sipan 40 with a mesh size of 80 mesh and an external admixture of 6%. This type of green concrete can solve the problem of construction waste disposal while also enhancing the performance and durability of the concrete. It has a promising future application prospect.
1. Introduction
Given the pressing need for sustainable development in light of the increasingly serious global environmental problems, the research and application of green building materials has become a current research hotspot [1]. Concrete, as one of the most commonly used materials in the construction field, cannot ignore the impact of its production process on the environment. The mining of raw minerals, energy use, and carbon dioxide emissions during the production of concrete all have a major negative environmental impact [2]. In the design and optimization of green concrete (GC), researchers are investigating the use of recycled materials and modifiers in place of conventional concrete components in an effort to lessen this impact [3]. Recycled pumice (RP) and modified rubber powder (MRP) are renewable materials that offer several advantages. For instance, their use in concrete reduces the need for raw materials, lowers energy consumption and CO2 emissions, and enhances workability and durability. RP is a granular material obtained by crushing and screening waste construction materials, which provides a certain level of strength and stability. Recycled plastic improves the mechanical qualities and longevity of concrete while lowering the requirement for natural sand and gravel and the exploitation of natural resources. The study aimed to fabricate recycled plastic by utilizing waste building rubble and modifying waste rubber. The study compared Sipan dex 40 and sodium dodecyl benzene sulfonate (SDBS) to determine the optimal modifier and admixture. A scanning electron microscope (SEM) was used to observe the microscopic surface morphology and structural changes of rubber powder before and after modification with two modifiers. To see how the two modifiers altered the rubber powder, a number of experiments were carried out. Ultimately, the controlled variable approach was used to identify the ideal GC mixing ratio. The development of green building materials can benefit from the theoretical underpinnings and real-world experience this study can offer. It can contribute to the promotion of the sustainable building industry, reduce energy consumption and environmental pollution, and help achieve the goal of sustainable development.
2. Related Works
In recent years, as the concept of environmental protection becomes more and more popular, more and more researchers are focusing on the important role of GC in energy saving and emission reduction in the construction industry. Mater, Y et al. proposed a method to predict the compressive strength of GC using an artificial neural networks (ANN) model in response to the demand for sustainable materials in the construction industry. Furthermore, the findings demonstrated that the approach had a 94.2% accuracy rate in predicting the compressive strength of GC [4]. Researchers such as Suresh Kumar, A addressed the problem of difficult disposal of biomedical waste and proposed a method of utilizing biomedical waste as a construction material constituting a new type of GC. The outcomes demonstrated that it can be mixed with geopolymer concrete to replace part of the raw ingredients, enhance concrete performance, and lessen the risk of hazardous waste entering the environment [5]. Pan, L et al. proposed a hybrid model based on genetic algorithm and artificial neural networks (GA-ANN) to predict solutions for the problem of high complexity of GC compressive strength prediction, then compared the prediction effect of support vector regression (SVR) and ANN algorithms. The outcomes demonstrated that the GA-ANN model has the best prediction performance and robustness [6]. Landa-Ruiz, L et al. proposed the use of sugar cane gagasse ash and silica fume (SCBA-SF) as a partial replacement of cement in the preparation of GC to address the problem of the environmental impact of traditional concrete. The outcomes demonstrated that the physical and mechanical properties of GC were comparable to those of traditional concrete, especially at 10% and 20% replacement rates, which is a new option for environmentally friendly building materials [7].
In order to investigate the strength, pore structure, morphology, and mineral composition of natural volcanic ash and silica nanoparticles-based alkali-inspired cementitious materials, Ibrahim, M proposed the use of NMR to assess the pore structure. The results showed that the addition of nano-silica reduced the porosity and improved the mechanical properties, and the NMR assessment effectively revealed the relationship between microstructure and macroscopic properties [8]. In order to solve the problem of environmental pollution caused by Portland cement, Alsaedy S M et al. proposed the use of waste limestone powder and nanomaterials to reduce the amount of cement and produce sustainable high strength concrete. The results showed that 16% replacement of limestone powder for cement could meet the environmental requirements and maintain the quality of concrete, while nanoalumina as a partial replacement for cement worked best at a 1.5% replacement rate [9]. To address the low resistance to seawater erosion, acid resistance, and resistivity of conventional cementitious materials, Rashad A M et al. proposed the use of volcanic rock powder (PP) as a modifier. Based on the results, it was found that the addition of PP enhanced the material’s resistivity, sulfate and saltwater resistance, resistivity, and thermal and acoustic insulating qualities [10]. To address the issue of optimizing the properties of high-performance concrete (HSC), Zeyad A M and other researchers proposed partial replacement of volcanic pumice powder (VPP) as a supplementary cementitious material and the addition of different amounts of polypropylene fibers (PF) to prepare different concrete mixtures. The specimens with the addition of 0.20% PF and 10% VPP replacement of cement demonstrated a minor increase in strength at later age compression, according to the results. The best specimens in terms of tensile and flexural strength were those with 10% VPP replacement and 0.50% PF content [11].
In summary, the application of RP in the field of GC has an adequate theoretical and practical basis. However, few studies have combined it with modified rubber (MR) for concrete manufacturing. Therefore, this study first modified waste rubber, then designed a new type of GC by combining it with RP to further develop energy-saving and emission-reducing solutions in the construction industry.
3. Material Preparation
3.1. Selection and Preparation of Modifiers
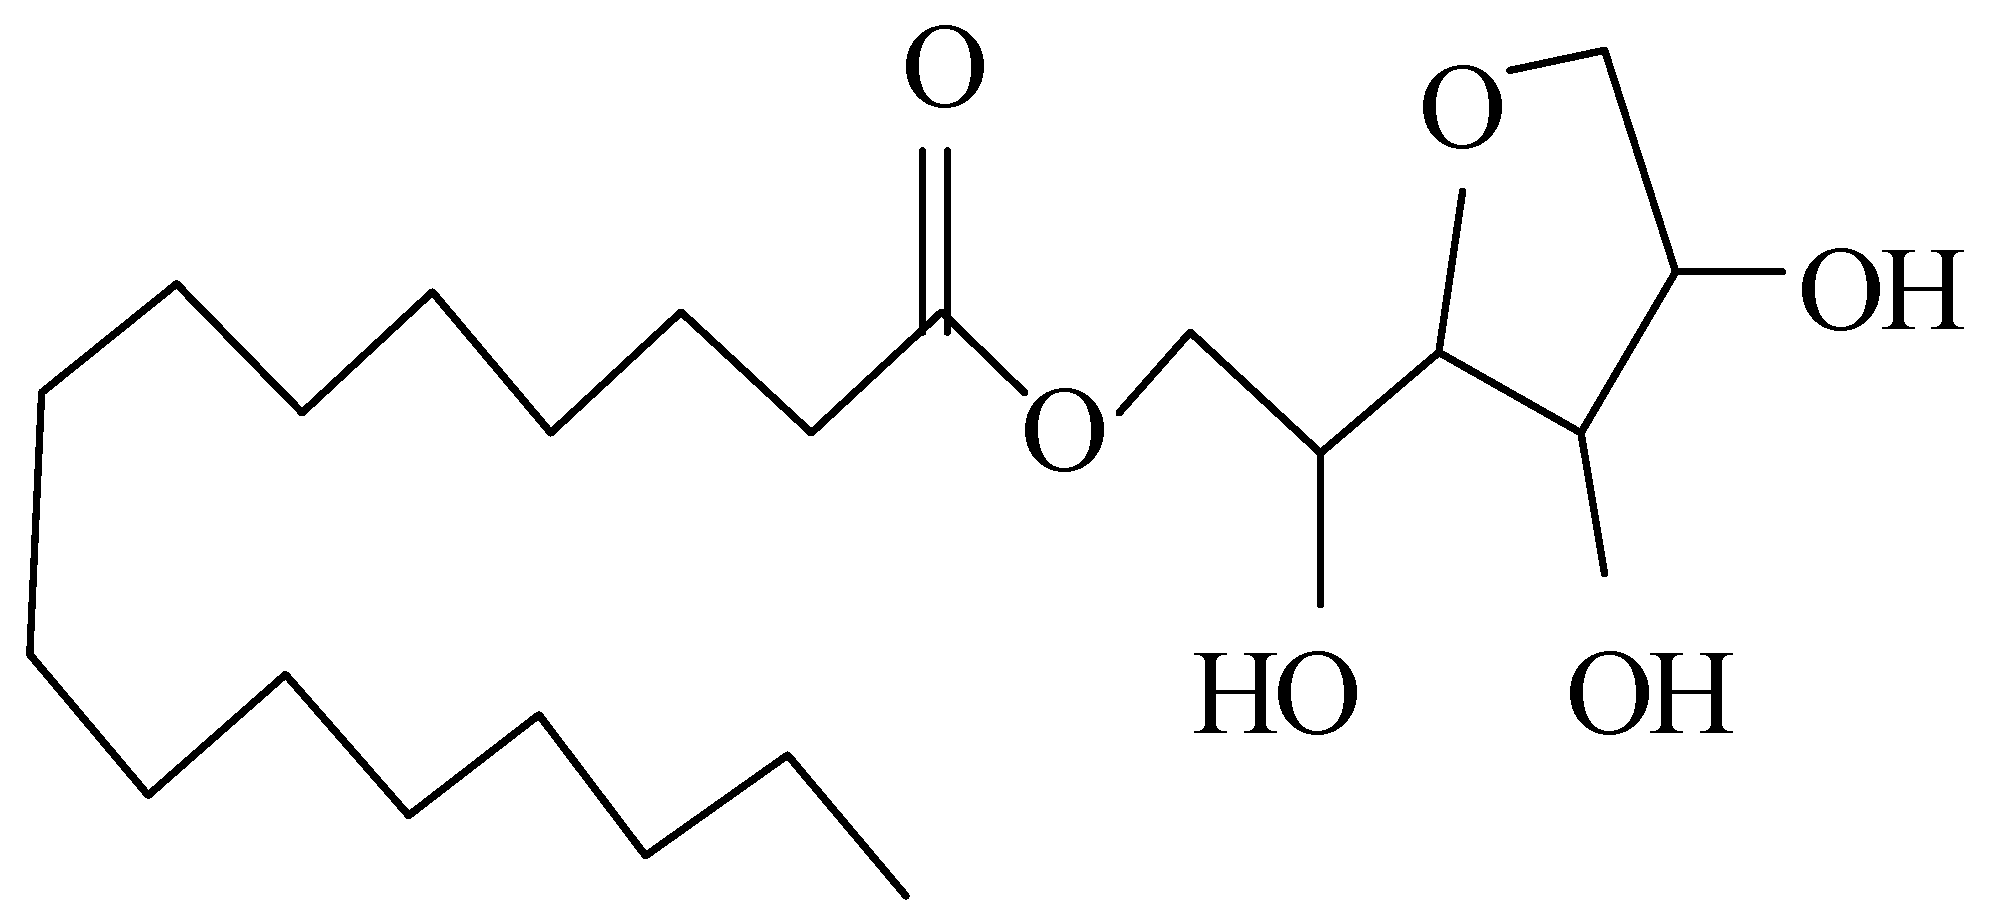
MRP recycled concrete is a kind of special concrete modified by uniformly mixing waste rubber powder into ordinary concrete and adding appropriate modifiers. This kind of concrete not only has the advantages of good toughness, light weight, durability, and strong impact resistance, it can also utilize waste rubber in large quantities, which has good environmental significance. In the relevant literature at home and abroad, the modifiers of rubber powder are mainly categorized into two main groups, i.e., inorganic modifiers and organic modifiers. Inorganic modifiers are further subdivided into different types, such as water, acid, alkali, and salt. These modifiers can change the surface properties of rubber powder and make it bond more tightly with the cement matrix, thus improving the mechanical properties and durability of concrete [12,13]. For example, water can make the rubber powder become wetter and promote its bonding with the cement matrix, while acids, alkalis, and salts can change the surface polarity and chemical properties of the rubber powder to make it more compatible with the cement matrix. In the experimental study, two modifiers that had good surface activity, low or non-toxicity, and were environmentally friendly were selected to modify the rubber powder: Sipan 40 and SDBS. By efficiently enhancing the bonding qualities between rubber powder and the cement matrix, both modifiers can increase the mechanical qualities and longevity of concrete. At the same time, they also have good environmental performance and will not cause harm to the environment or human body. Sipan 40, also known as sorbitan palmitate, is a creamy to light brown waxy solid with a slightly fatty odor. It has a freezing point of 45~47 °C. It can be dispersed in hot water and dissolved in hot oil. At room temperature, Sipan 40 is stable in different pH and electrolyte solutions. In addition, Sipan 40 has emulsifying and dispersing properties. The molecular formula is C22H42O6, nonionic surfactant, HLB value 6.7, and its molecular formula is shown in Figure 1.

Figure 1.
Molecular structure diagram of Sipan 40.
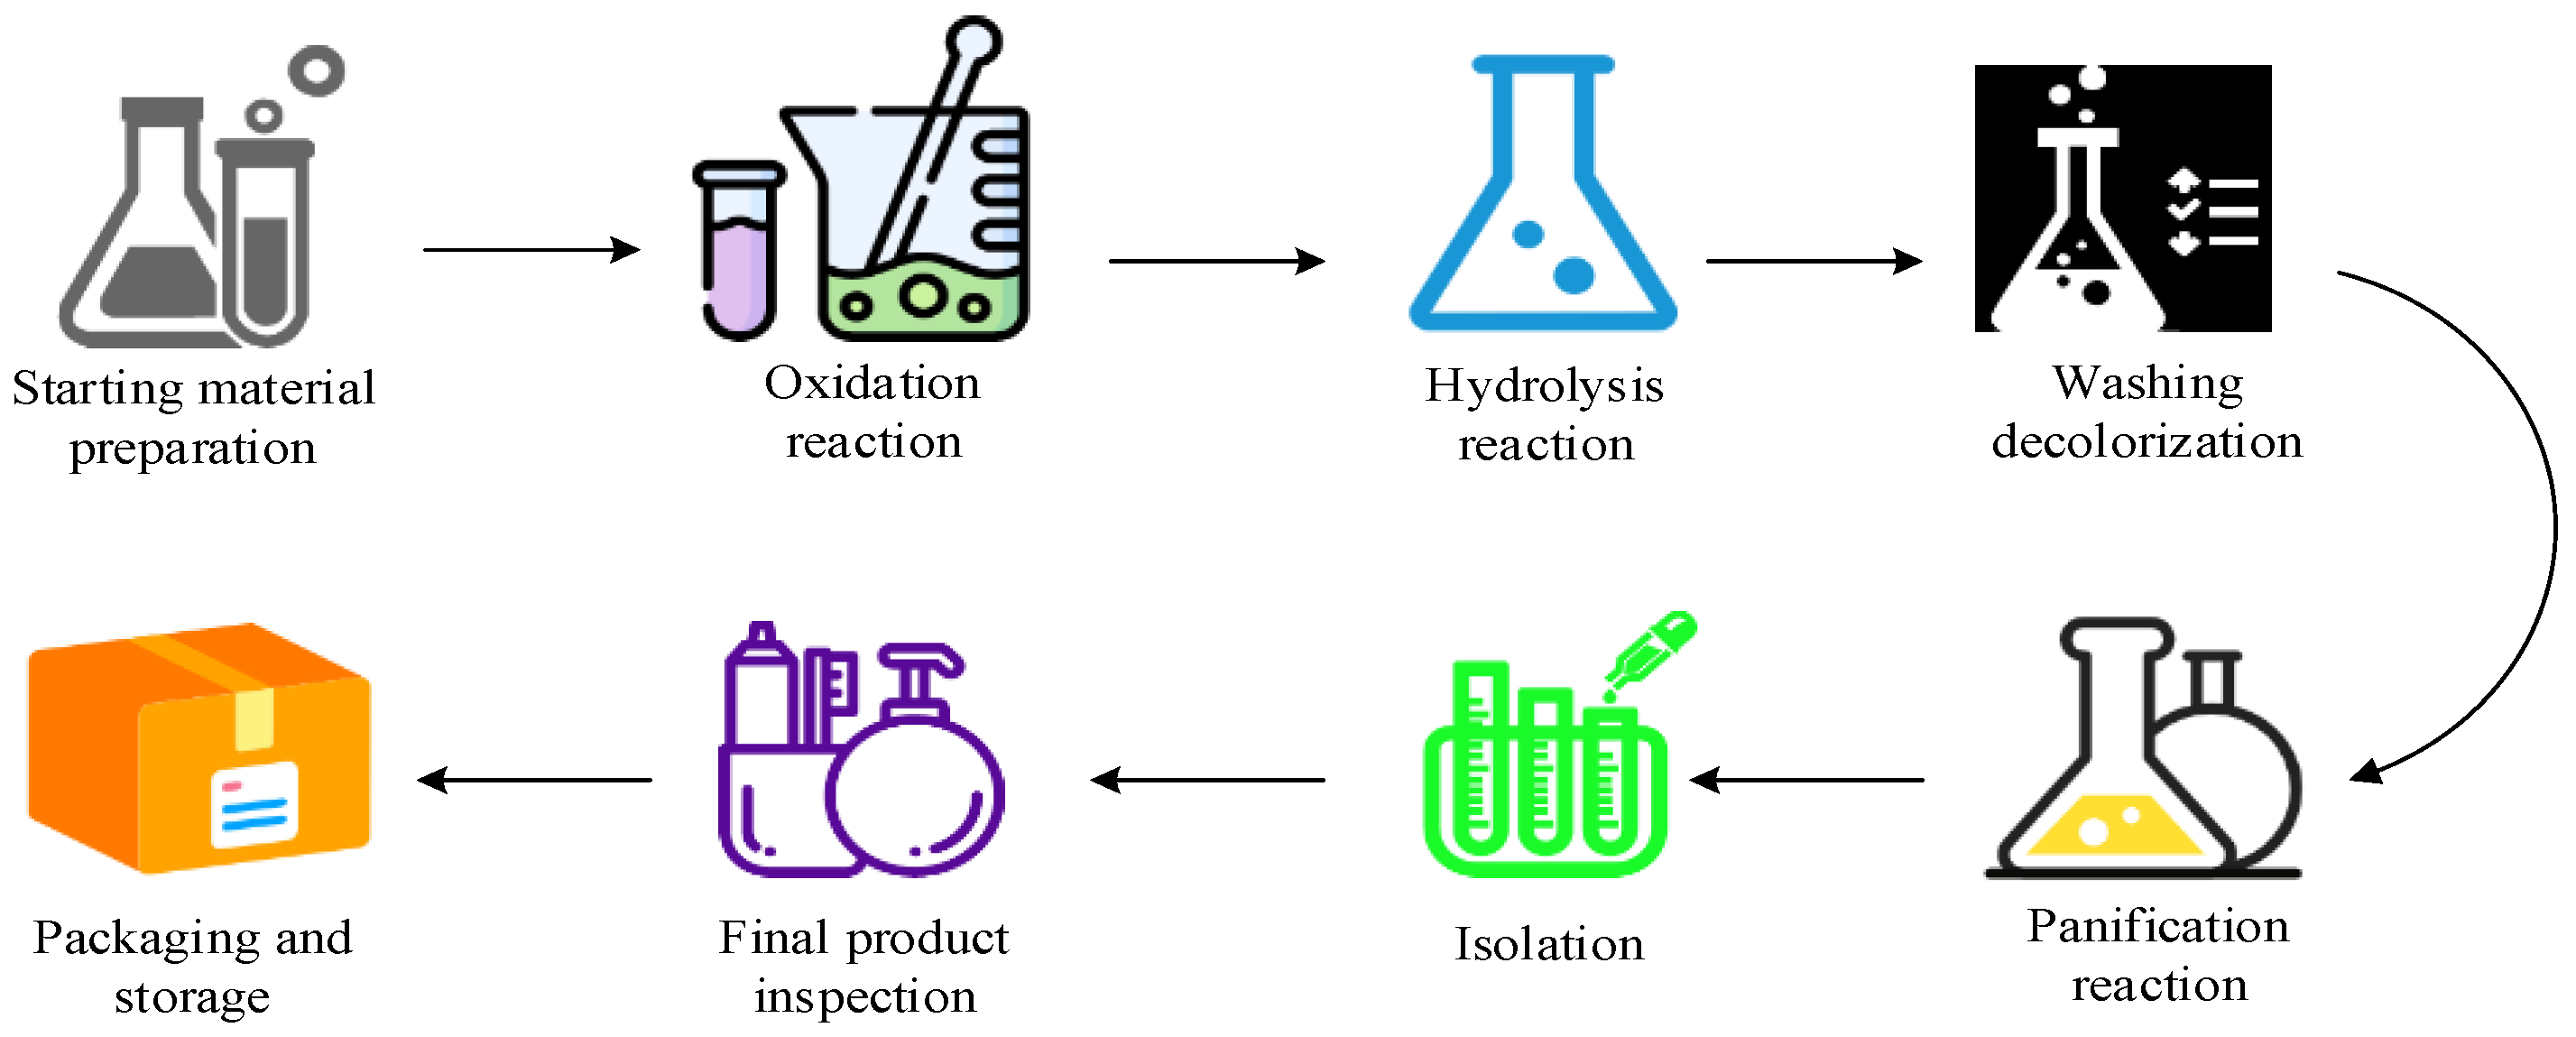
There are numerous methods for the production of strychnine, most of which use direct esterification. First, the following starting materials need to be prepared: refined hexadecanoic acid (C16), chlorine, sodium hydroxide (NaOH) water, methanol (CH3OH), which serve as the basic ingredients for the synthesis of strychnine 40. In the second step, an oxidation reaction is conducted during which the prepared hexadecanoic acid is oxidized with chlorine gas in the presence of sodium hydroxide. The purpose of this step is to produce chlorine hexadecanoate. In the third step, a hydrolysis reaction is carried out in which the generated chlorohexadecanoic acid is hydrolyzed with methanol in the presence of sodium hydroxide to produce sodium hexadecyl methanol. The fourth step is to carry out washing and decolorization, and the generated sodium cetyl methanol needs to be washed and decolorized to remove impurities and colored substances therein. The fifth step is to carry out a stannization reaction, wherein the washed and decolorized sodium cetyl methanol undergoes a stannization reaction with sulfuric acid to generate stannum 40. The sixth step is to carry out separation and purification, wherein the generated stannum 40 needs to undergo a separation and purification process to remove impurities and by-products therefrom. The seventh step is end-product testing; after the separation and purification process, the stannous 40 needs to be subjected to end-product testing to ensure that it meets quality standards. Finally, after the end-product inspection, the spiroplasma 40 needs to be packaged and stored for subsequent use and transportation. The preparation process is shown in Figure 2.
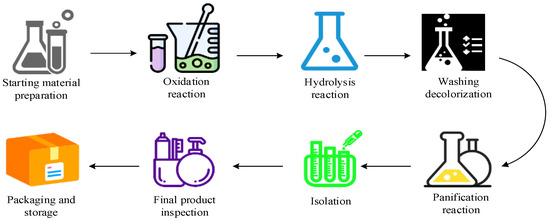
Figure 2.
Schematic diagram of the preparation process for Sipan 40.
One popular anionic surfactant is SDBS. It is a soluble solid that is white or yellowish, flaky or powdery, hard to volatilize, and, when dissolved in water, it forms a transparent solution [14]. It is chemically stable to alkalis, dilute acids, and hard water, and is slightly toxic. In applications, SDBS has excellent detergency. It has significant decontamination effect on particulate dirt, protein dirt and oily dirt, especially on the washing effect of particulate dirt on natural fibers. Its detergency increases with the increase of washing temperature, its effect on protein dirt is higher than that of nonionic surfactants, and it has rich foam. Experimentally, SDBS was prepared using three propylene zwitterionization method. First, propylene undergoes a zwitterionic reaction in the presence of a catalyst to produce tetrapolypropylene. Then, the tetrapolypropylene is subjected to an alkylation reaction with benzene to introduce alkyl side chains to produce an alkylated product. In the third step, the alkylated product is subjected to a sulfonation reaction to introduce sulfonic acid groups to produce a sulfonated product. Finally, the sulfonated product is neutralized with a suitable base to generate SDBS. Through this synthetic method, highly branched SDBS can be obtained, and this compound has excellent surface activity and emulsifying properties. The chemistry of the preparation of SDBS is shown in Figure 3.
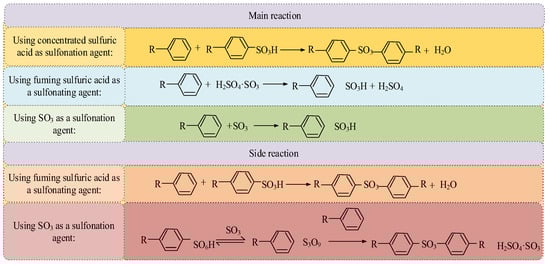
Figure 3.
The reaction principle of SDBS preparation.
The preparation of TPS (trisulfated melamine formaldehyde resin) involves two key steps: the condensation reaction of melamine and formaldehyde and the sulfation process. Initially, melamine and formaldehyde react under appropriate conditions to produce melamine formaldehyde resin (MF resin). Subsequently, the sulfonic acid group can be introduced through the sulfation reaction using different sulfation agents. When using concentrated sulfuric acid as a sulfonation agent, the sulfuric acid molecules react with the amino or amino groups in the resin to form sulfonic acid groups. It is important to control the temperature and stirring conditions to prevent side reactions, such as resin degradation or crosslinking. If smoked sulfuric acid is used as a sulfonation agent, its highly reactive SO3 molecules quickly react with amino or amino groups in the resin to form a sulfonic acid group. However, this may also cause excessive oxidation, leading to carbonization due to the strong oxidation and dehydration of smoked sulfuric acid. Additionally, using SO3 as a sulfonation agent is a viable method. SO3 reacts directly with the amino or imino group in the resin to form a sulfonic acid group. However, it is crucial to control the amount of SO3 and the reaction temperature precisely to prevent undesired side reactions, such as cross-linking or resin degradation.
The chemical components utilized in TPS preparation pose potential hazards. Long-term exposure or inhalation of melamine dust can have adverse effects on health, such as respiratory tract irritation and skin sensitivity. Additionally, it may decompose and produce harmful gases under high temperatures. Formaldehyde has a strong irritant effect on the human body, and long-term exposure may increase the risk of cancer. Concentrated sulfuric acid and fuming sulfuric acid are highly corrosive and oxidizing. Contact with the skin and eyes can cause serious burns, while inhaling vapors can seriously damage the respiratory tract. Additionally, sulfur trioxide is highly irritating and toxic. During the preparation process, it is essential to strictly adhere to safety operating procedures, wear appropriate protective equipment, carry out the process in a closed and well-ventilated environment, and be prepared to handle potential chemical accidents. Particular attention should be paid to the treatment of waste and exhaust gases to prevent harm to the environment and personnel.
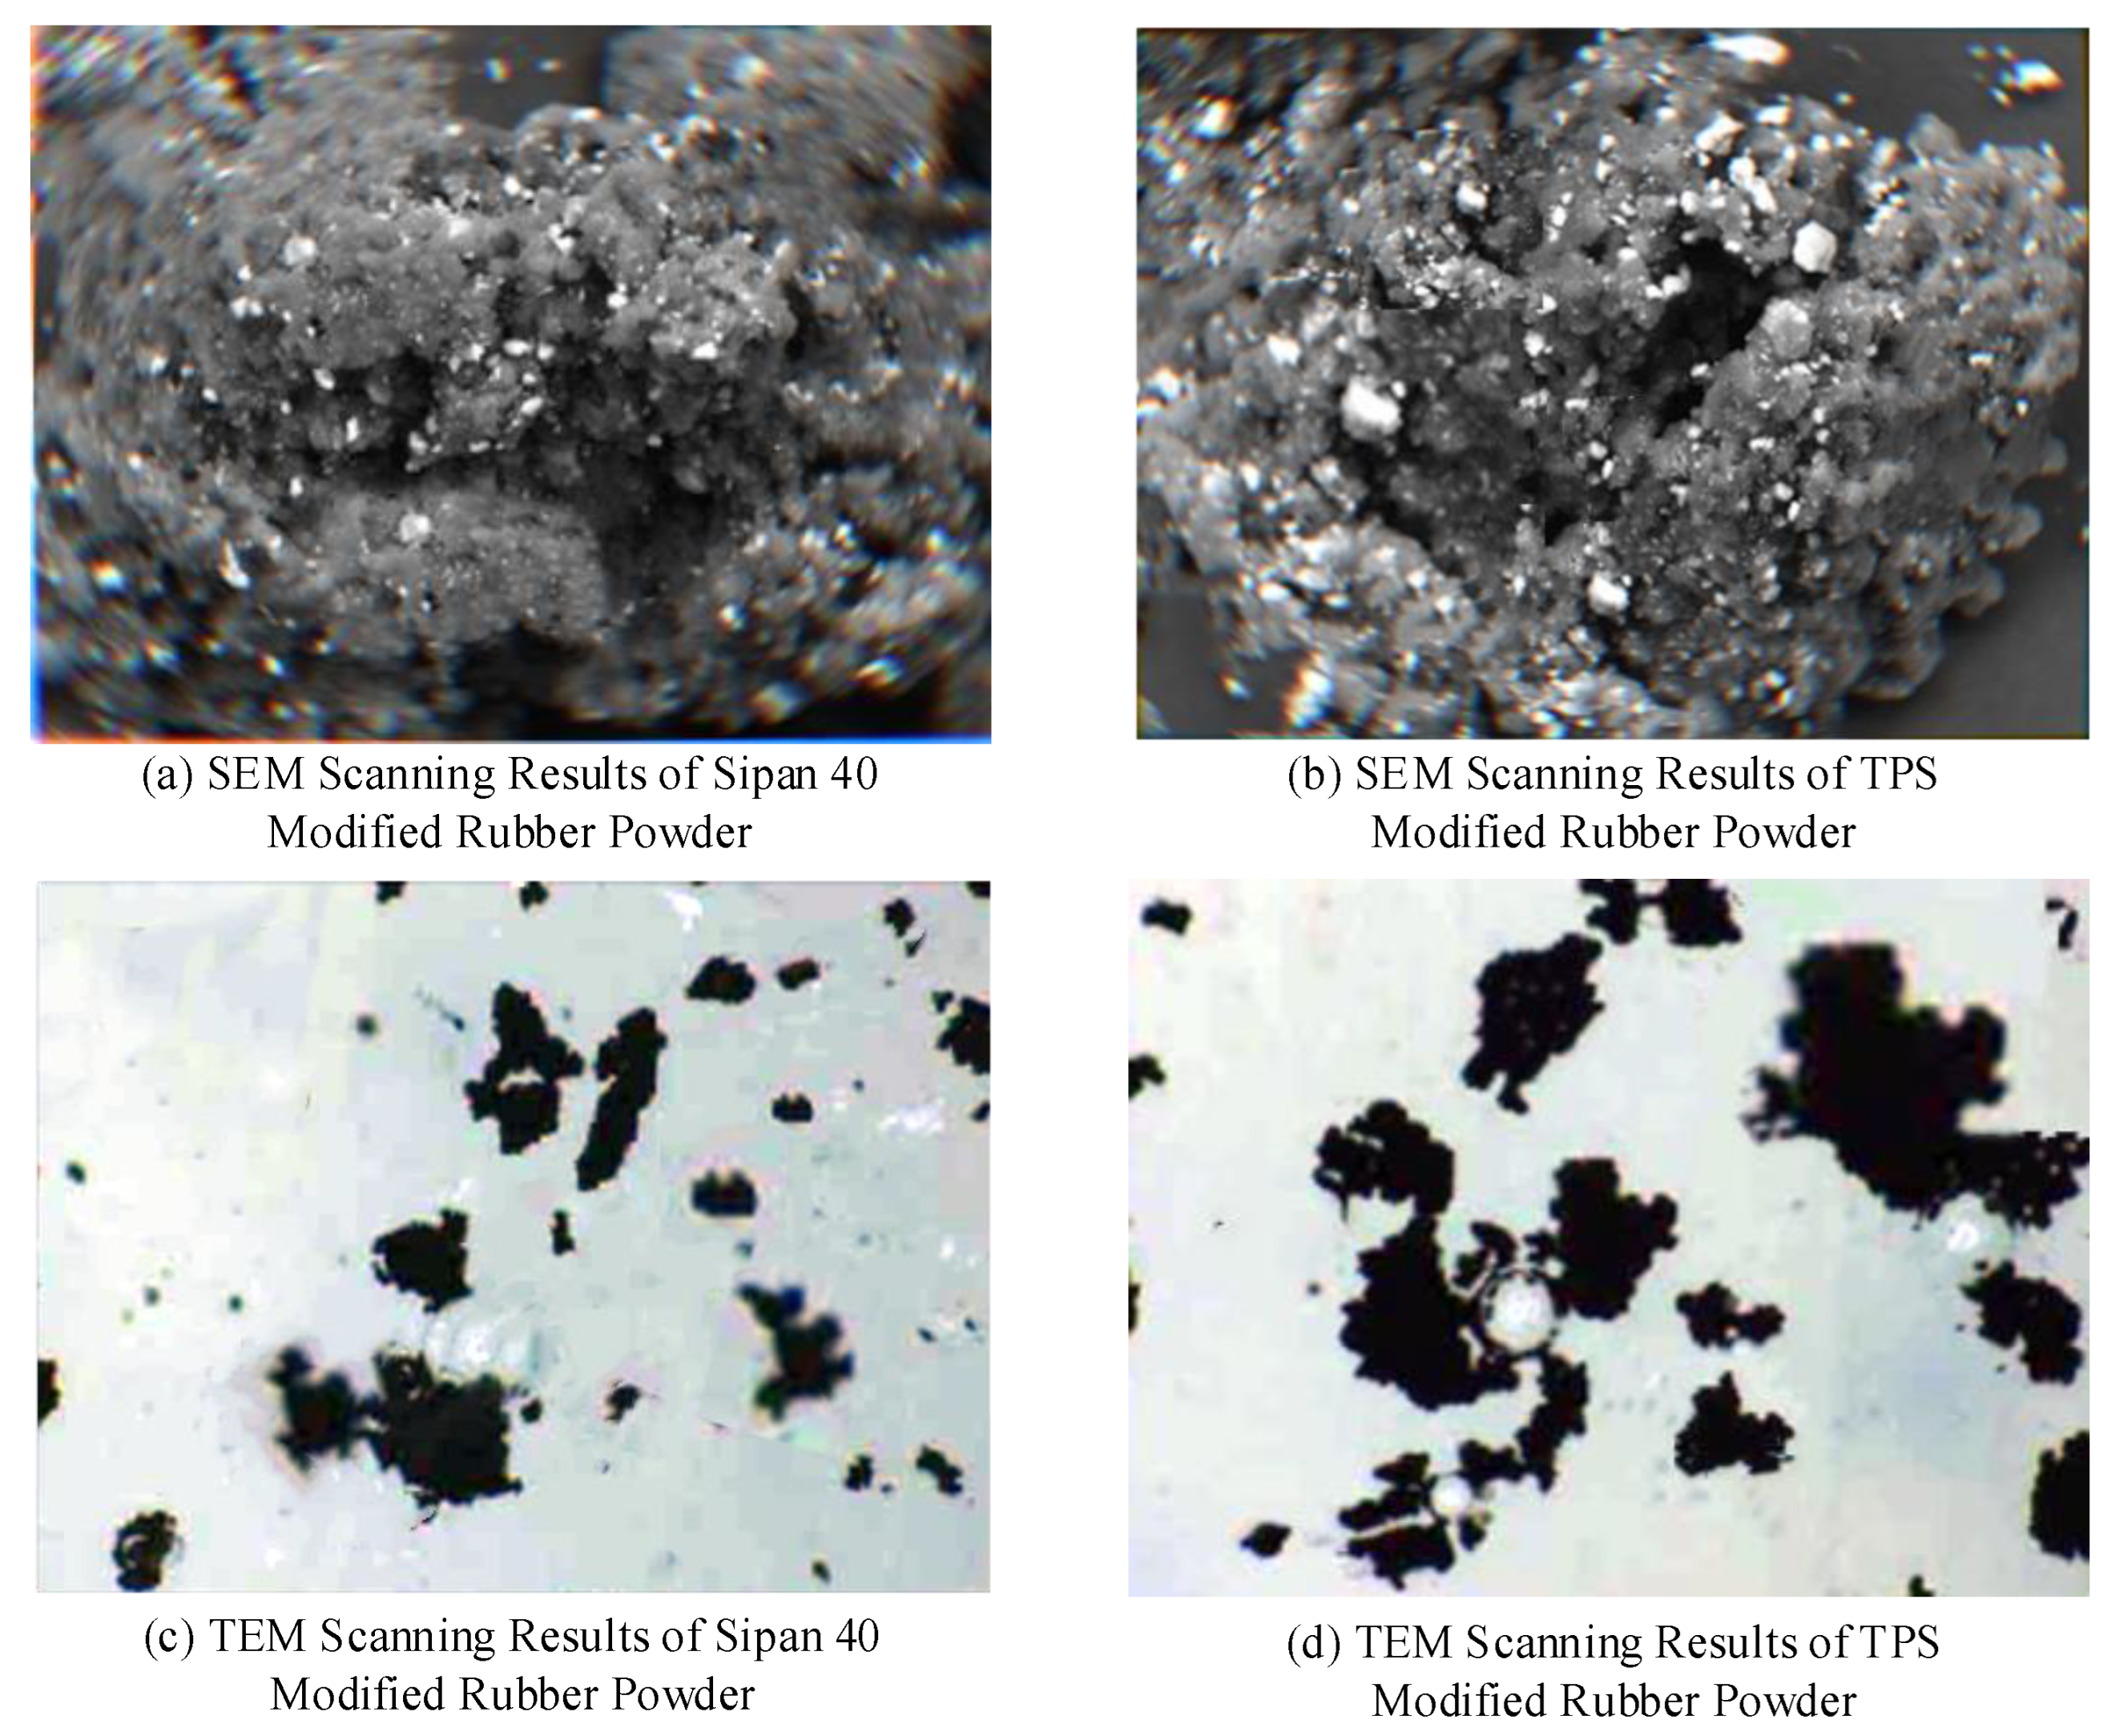
Sipan 40 and SDBS, two surfactants, were chosen to alter the rubber powder primarily for the purpose of enhancing the mechanical characteristics and frost resistance of recycled coarse aggregate concrete (RCAC). Both surfactants can improve the compatibility of the rubber powder with concrete by surface treatment of the rubber powder. Meanwhile, due to the improved elasticity of the rubber powder, the frost resistance of concrete can be improved and its durability increased. Additionally, instead of using natural coarse aggregate, which is a part of GC, it is practical to make RCAC by combining pumice coarse aggregate with recycled coarse aggregate (RCA). External Admixture in recycled coarse is a method of incorporating RCA into fresh concrete and is widely used in RCAC. This is beneficial to the growth of the recycling economy and the utilization of regional advantages by utilizing the region’s abundant pumice resources. In order to understand whether the affinity between MRP and water is enhanced and whether the wettability is stronger, the surface state of rubber powder in a humid state was observed using the H-7650 transmission electron microscope (TEM) manufactured by Tianjin Aodehua Instrument in Tianjin, China [15]. Meanwhile, the experiment also used SEM to observe the microscopic surface morphology and structural changes of the rubber powder before and after the modification of the rubber powder modified by the two modifiers. The experimental results are shown in Figure 4.

Figure 4.
Changes in microstructure and chemical composition of two types of modified rubber powder before and after modification.
Rubber powder was modified with two modifiers, and SEM was used to examine the microscopic surface morphology and structural changes of the powder before and after the modifications. Following the modification treatment, it was discovered that the adhesion between the rubber powder and the cement mortar was improved, the surface of the MRP was smoother and flatter, and the surface displayed a more fluffy state. Additionally, the impurities on the surface of the rubber powder and some surface attachments were reduced. These findings demonstrate that the modifier successfully altered the rubber powder’s surface, strengthened the link between the powder and the substrate at the interfacial interface, and ultimately contributed to the enhancement of concrete materials’ mechanical qualities. The experiment observed the surface state of rubber powder in a wet state. Bubbles were also observed to gather around the rubber powder. It was observed that after the surface modification of plate 40 and TPS modifying agent, the rubber powder was more likely to accumulate together and form a continuous existence.At the same time, the surface of the MRP becomes flatter, the bump has been improved to some extent, and the surface becomes relatively flat.
3.2. Preparation and Properties of Recycled Pumice
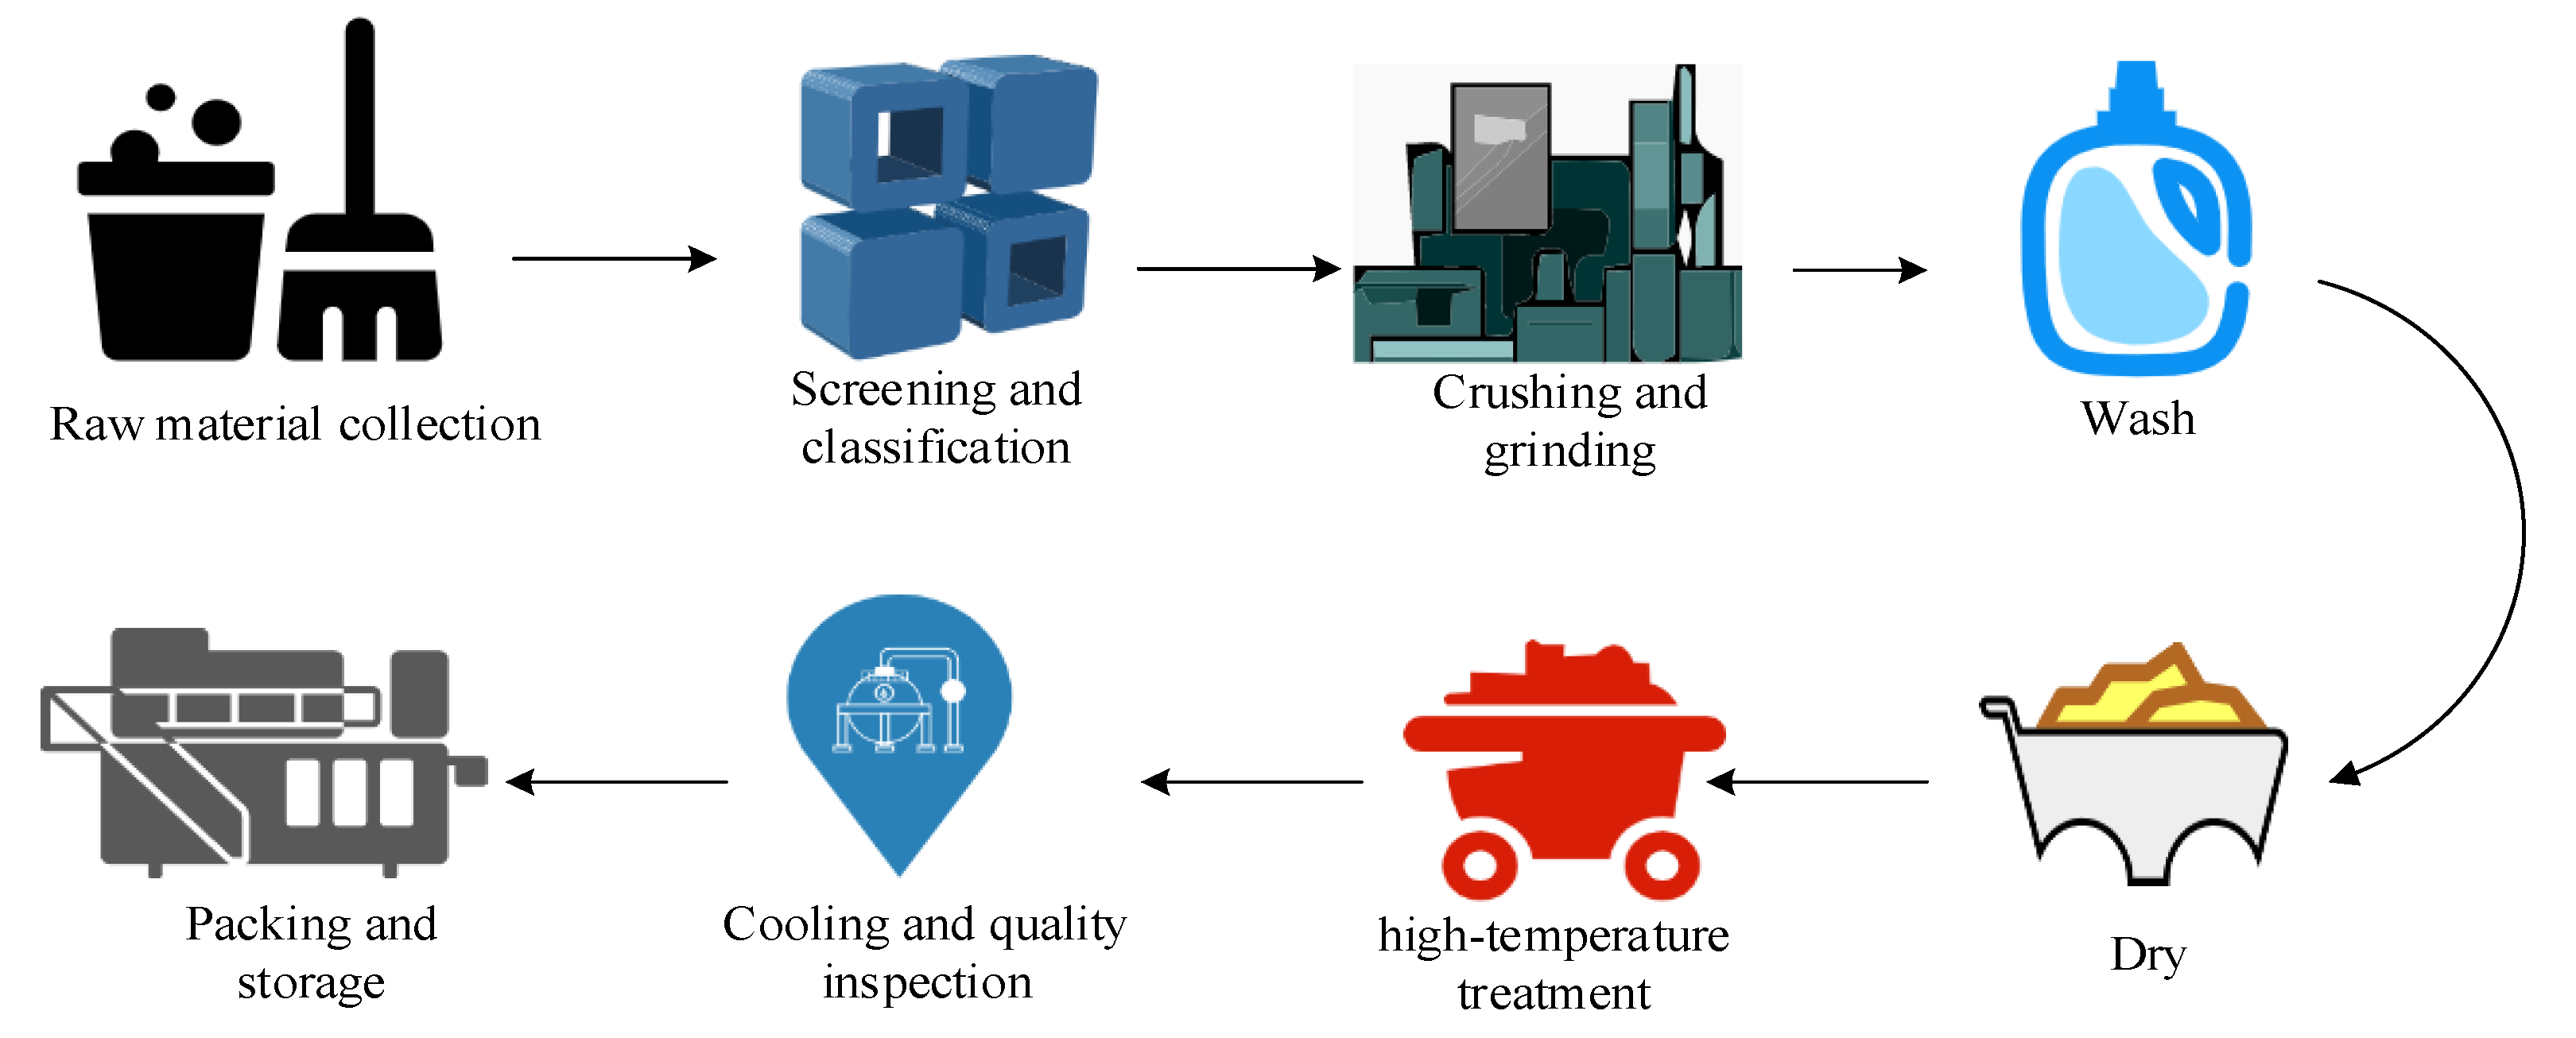
RP refers to the reprocessing and treatment of waste concrete to convert it into reusable building materials. In the construction and infrastructure industry, waste concrete is a common product that is usually sent to landfills or disposal sites for disposal [16]. However, through the technique of RP, waste concrete can be reused to reduce the consumption of natural resources and to reduce environmental pollution. This material has many advantages; first of all, the production process of RP is less polluting to the environment, and it is an environmentally friendly building material. RP has a porous structure, which gives it excellent thermal and heat insulation properties. Second, compared with traditional building materials, RP is lighter in mass, which can reduce the dead weight of the building. Although light in mass, RP has high strength and can meet the load-bearing requirements of buildings. In addition, RP is non-combustible and has a high fire resistance limit, which meets the fire protection requirements of buildings. Due to its porous structure, RP can also effectively block noise and improve the comfort of the indoor environment. Lastly, applying RP can lower the building’s overall cost and increase economic efficiency. Figure 5 illustrates the preparation procedure.

Figure 5.
Basic process for preparing regenerated pumice.
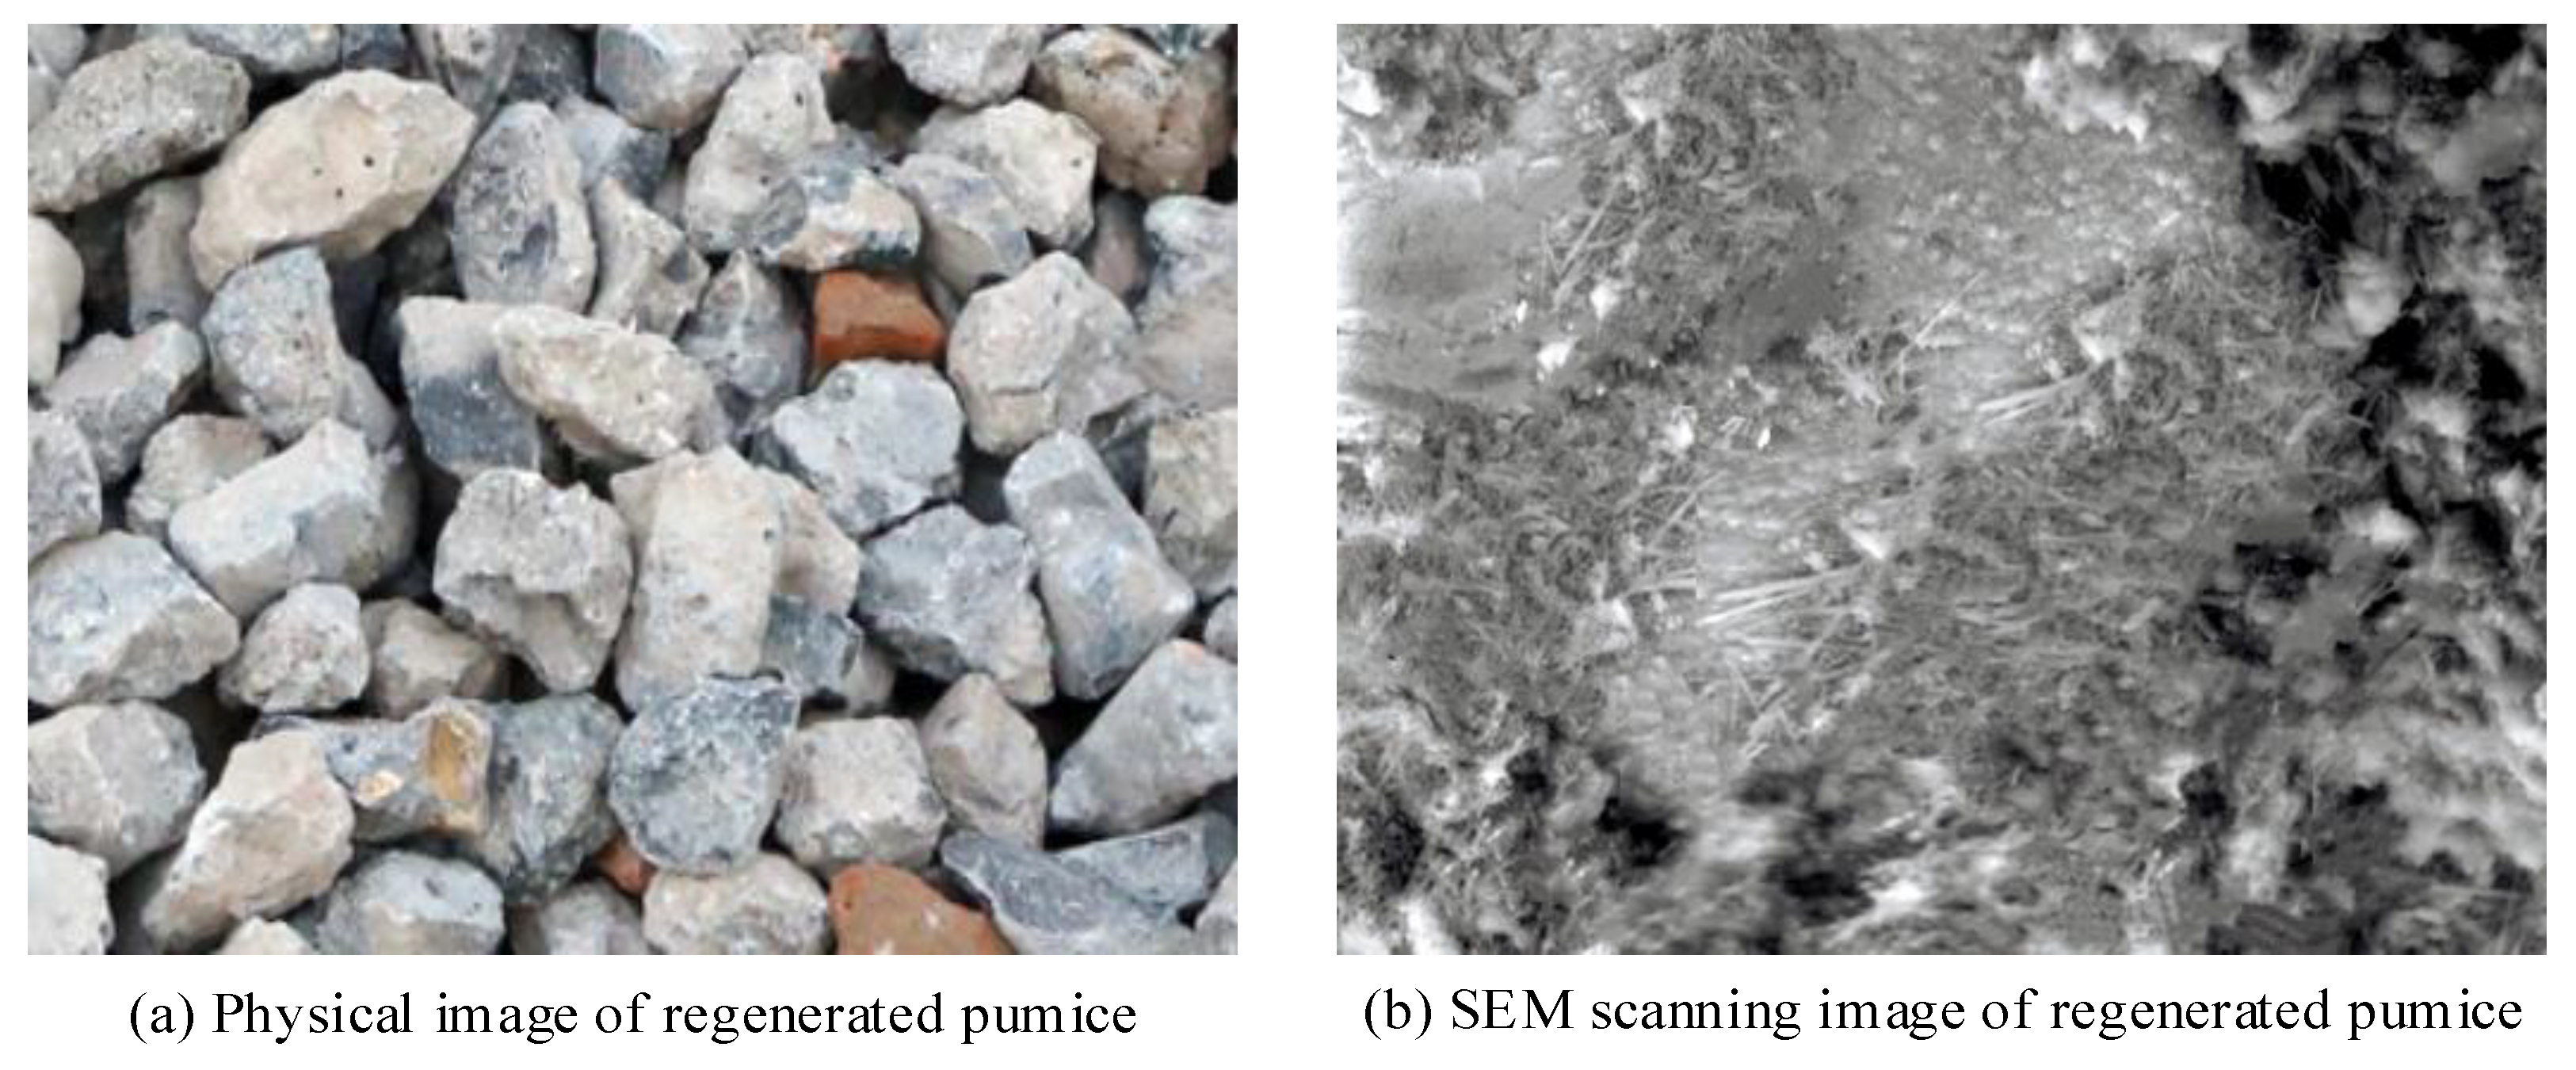
Figure 5 shows the basic process of RP preparation, which is the first step is raw material collection. The second step is screening and sorting, in which the raw materials are screened and sorted to remove the large impurities and non-compliant particles from them to obtain suitable raw materials. The third step is crushing and grinding, and the raw materials are subjected to coarse crushing by a crusher to break the crushed stone into suitable sizes. Then, the coarsely crushed gravel is fed into the grinder for fine crushing to get the required RP particles. The fourth step is washing, in which the finely crushed RP pellets are washed by washing equipment to remove dust, soil, and other impurities. The fifth step is drying. After washing and sieving, the RP granules need to be dried to remove the moisture in them and improve their quality and stability. Next, they undergo a high temperature treatment. After drying, the raw material is sent to a high temperature furnace for high temperature treatment, and this step can further enhance the physical properties of RP. Following this, cooling and quality inspection are conducted again; the RP needs to be cooled naturally after high temperature treatment, and then quality inspection is carried out. This step is mainly to check whether its physical properties and chemical composition meet the standard. Finally, packaging and storing is conducted. After drying, RP pellets can be packaged, usually in bags or bulk, for subsequent use. RP also needs to be stored to ensure that it is not affected by the external environment during preservation. In order to carry out a comprehensive and in-depth study of the prepared RP, the experiment firstly used SEM to observe its microstructure. Through SEM scanning, high magnification images of RP can be obtained, which in turn reveals the fine features and pore structure of its surface. The results are shown in Figure 6.

Figure 6.
Physical image and electron microscope scanning results of regenerated pumice.
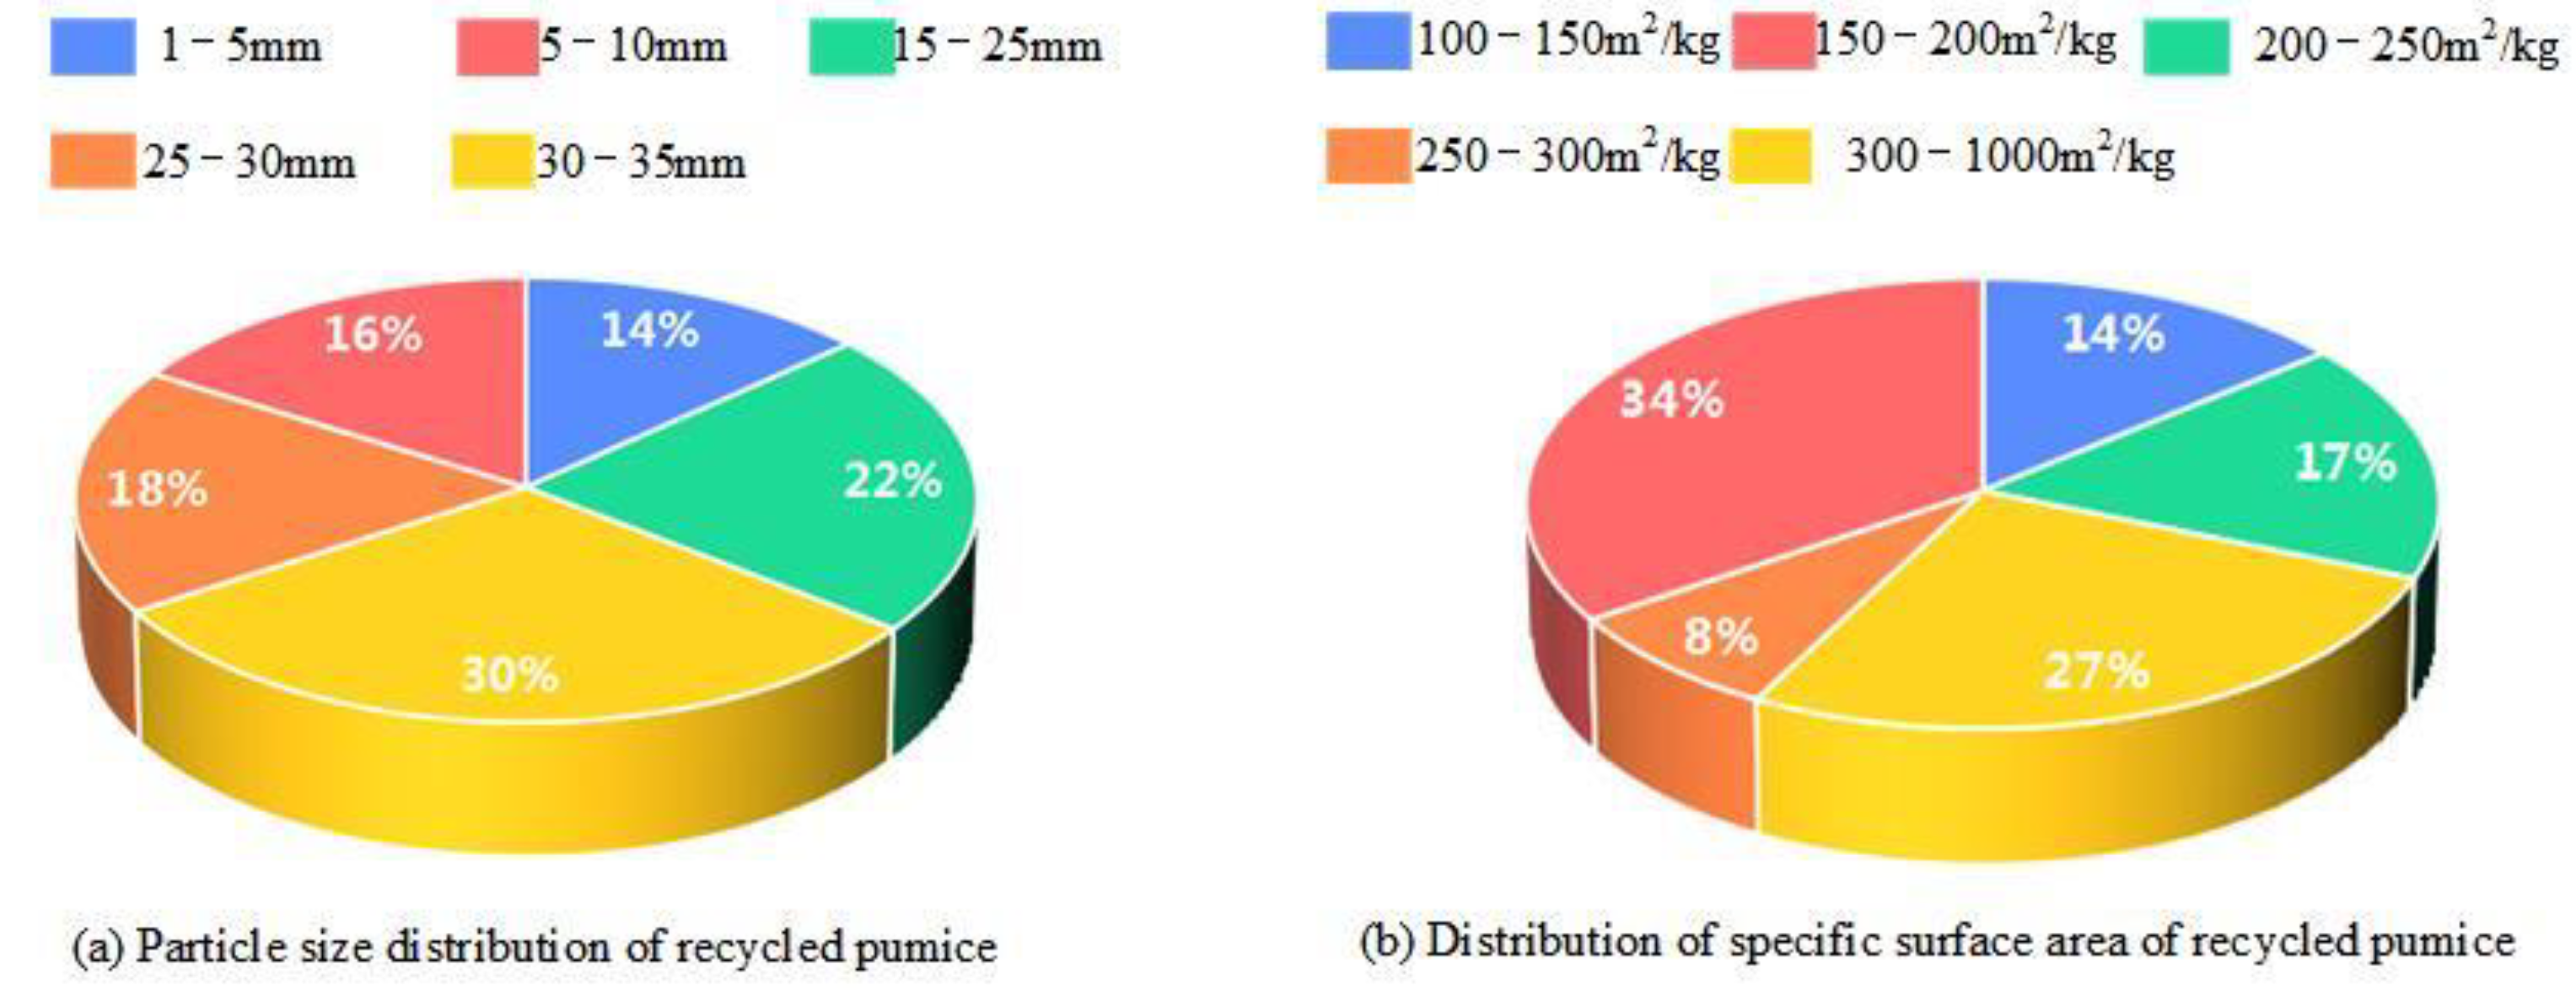
After careful observation of the SEM images of RP, it can be clearly observed that its surface exhibits abundant and uniform porous properties. These pores are uniformly distributed on the surface of RP with good connectivity, which lays the foundation for its excellent physical properties. Further observation reveals that the surface of RP is rough and angular, and there are flaky, needle-like and flocculent hydration products, which directly reflects the high degree of hydration of RP, which undoubtedly provides strong evidence for its excellent physical properties. To determine the key physical properties of RP, such as particle size distribution and specific surface area, the RP was subjected to the sieving method for particle size distribution measurement and to the Brunauer–Emmett–Teller (BET) method for specific surface area calculation. The experimental results are presented in Figure 7.
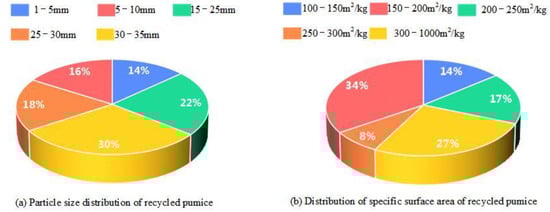
Figure 7.
Particle size distribution and specific surface area distribution of recycled pumice.
The majority of the RP particle size distributions produced experimentally in Figure 7 fell within the 30–35 mm range, with 14% falling within the 1–5 mm range, 16 falling within the 5–10 mm range, and 22% falling within the 15–25 mm range. These RPs may effectively fill the spaces in the concrete and meet the engineering specifications of the concrete, giving it sufficient strength. In Figure 7b, the specific surface area of RP is distributed in the range of 150–200 m2/kg, 300–1000 m2/kg most, and only 8% of RP is distributed in the range of 250–300 m2/kg. This is due to the fact that RP usually has a porous structure, which makes its specific surface area relatively large. The specific surface area size will be affected by factors such as particle size, shape, and pore structure of RP.
4. Experimental Methods
4.1. Preparation of Concrete
The process of preparing concrete is rigorous and multi-step. First, carefully select the raw materials, including cement, aggregate (such as sand and gravel), water, and additives (such as Si plate 40 dikyl benzene sulfonate sodium), based on the required concrete strength and environmental conditions. Next, mix the raw materials in a specific amount of water and other additives until they are evenly blended [17,18]. The process begins by pouring the mixed concrete into the mold to fill it completely and eliminate any bubbles or gaps. Next, a vibrator is used to flatten and densify the surface of the concrete. Finally, the concrete is placed in an environment with appropriate temperature and humidity to allow for gradual hardening [19]. To maintain the moisture of the concrete during the process, its surface is occasionally covered with plastic film or a wet cloth. Once the concrete has fully hardened, it is removed from the mold, a process known as mold release. If the mold is made of wood or steel, gently tapping the side wall of the mold with a hammer can help separate the concrete from the mold. For larger or heavier concrete samples, equipment such as cranes may be necessary to assist with mold release. Finally, the concrete samples that have not been molded will be placed in the curing room or curing box under the appropriate temperature and humidity conditions to ensure that they reach the expected strength. This process typically lasts for at least seven days and is an essential step in the concrete preparation process.
4.2. Compressive Strength Test of Concrete
The YAW-3000 pressure tester manufactured by Chinese mainland Shanghai Tuofeng Instrument Technology Co., Ltd. (Shanghai, China) was used for the concrete compressive strength test. Concrete specimens are prepared according to the previously described experimental method and maintained under standard curing conditions for 7–42 days. The size, shape, and preparation process of the specimen must meet the requirements of the standard for test methods for mechanical properties of ordinary concrete. The compressive strength specimen is typically a cube with a standard side length of 100 mm or 150 mm. Prior to testing, visually inspect the specimen for any obvious defects or injuries. Next, prepare the testing machine by checking the power supply, oil circuit, and control system of the YAW-3000 pressure test machine to ensure proper equipment operation. To ensure proper placement of the specimen, adjust the upper and lower pressure plate spacing of the test machine based on its size. Additionally, set the loading rate in accordance with relevant standards, typically within the range of 0.3–1.0 MPa/s. To properly place the specimen, remove it from the maintenance site and gently wipe away any moisture and debris on the surface. Then, center the specimen on the lower pressure plate of the test machine to ensure even contact without any obvious eccentricity. The test machine is then started to apply pressure on the specimen at the predetermined loading rate. During this process, the deformation and rupture of the specimen are observed, as well as the maximum load at which the specimen ruptures are recorded. Finally, the compressive strength of the concrete is calculated based on the maximum load and the compression area of the specimen.
4.3. Flexural Strength Test of Concrete
The bending strength test is the key to evaluate the fracture resistance of concrete. The CITEMA bending tester manufactured by Chinese mainland Beijing Aiode Equipment Co., Ltd. (Beijing, China) was used for testing and strictly followed the test procedures. After preparing the specimen, cure it under standard conditions for 35 days to ensure it has hardened properly. The sample should be prismatic and meet the required standards, with a width and height ranging from 100 mm to 120 mm. Before testing, ensure that the specimen’s surface is flat and that both ends are parallel to ensure uniform loading. The tester should be checked for integrity, and the support span should be adjusted according to the length of the specimen. The loading rate should remain low and uniform. When placing the specimen, ensure stable support and midline alignment to avoid errors caused by eccentric loading. During the test, the crack condition should be observed, and the maximum load and deflection values recorded. Following the test, the bending strength can be calculated using the formula, and an analysis of the influence of different mixing methods on concrete performance can be conducted. It is important to maintain a safe distance during the operation to prevent injury from potential test piece breakage. Once the test is complete, the power supply should be turned off, and the storage equipment should be cleaned up. Combined with the results of the compressive strength test, the performance of concrete in practical engineering can be comprehensively evaluated. It is important to strictly follow the test steps and precautions to ensure the accuracy and reliability of the test results, which will provide strong support for the application of concrete materials.
4.4. Freeze-Thaw Cycle Experiment of Concrete
The freeze-thaw cycle test is a crucial method for assessing the durability of concrete. It simulates the natural freeze-thaw process caused by temperature changes. Before starting the freeze-thaw cycle, accurately measure the initial mass, dimensions, and other relevant parameters of the specimen using electronic scales and measuring instruments. The sample should be prismatic and meet the required standards, with a width and height ranging from 110 mm to 130 mm. Then, place the specimen in a freeze-thaw test chamber that can control the temperature for a freeze–thaw cycle. The freeze–thaw process involves subjecting the specimen to a set low temperature (e.g., below −18 °C) for a specific duration (e.g., 4 h), followed by transferring it to a set high temperature environment (e.g., above +5 °C) for melting, usually for a specific period (e.g., 4 h). This cycle is repeated until a predetermined number of cycles is reached (e.g., 30, 50, or more). To determine the mass loss, compare the quality of specimens before and after the freeze–thaw cycle and calculate the percentage of mass change. Furthermore, to assess the deformation performance of concrete under dynamic load, GLA331-MCEA 1 manufactured by Shanghai, China will be used Dynamic mechanical analyzer (DMA) to measure the dynamic elastic modulus during testing. Then, the processed sample is placed in the NEL-PDR chloride permeation apparatus for testing. Finally, 200 freeze-thaw tests are performed.
5. Application of External Blending Method in Recycled Coarse Aggregate Concrete
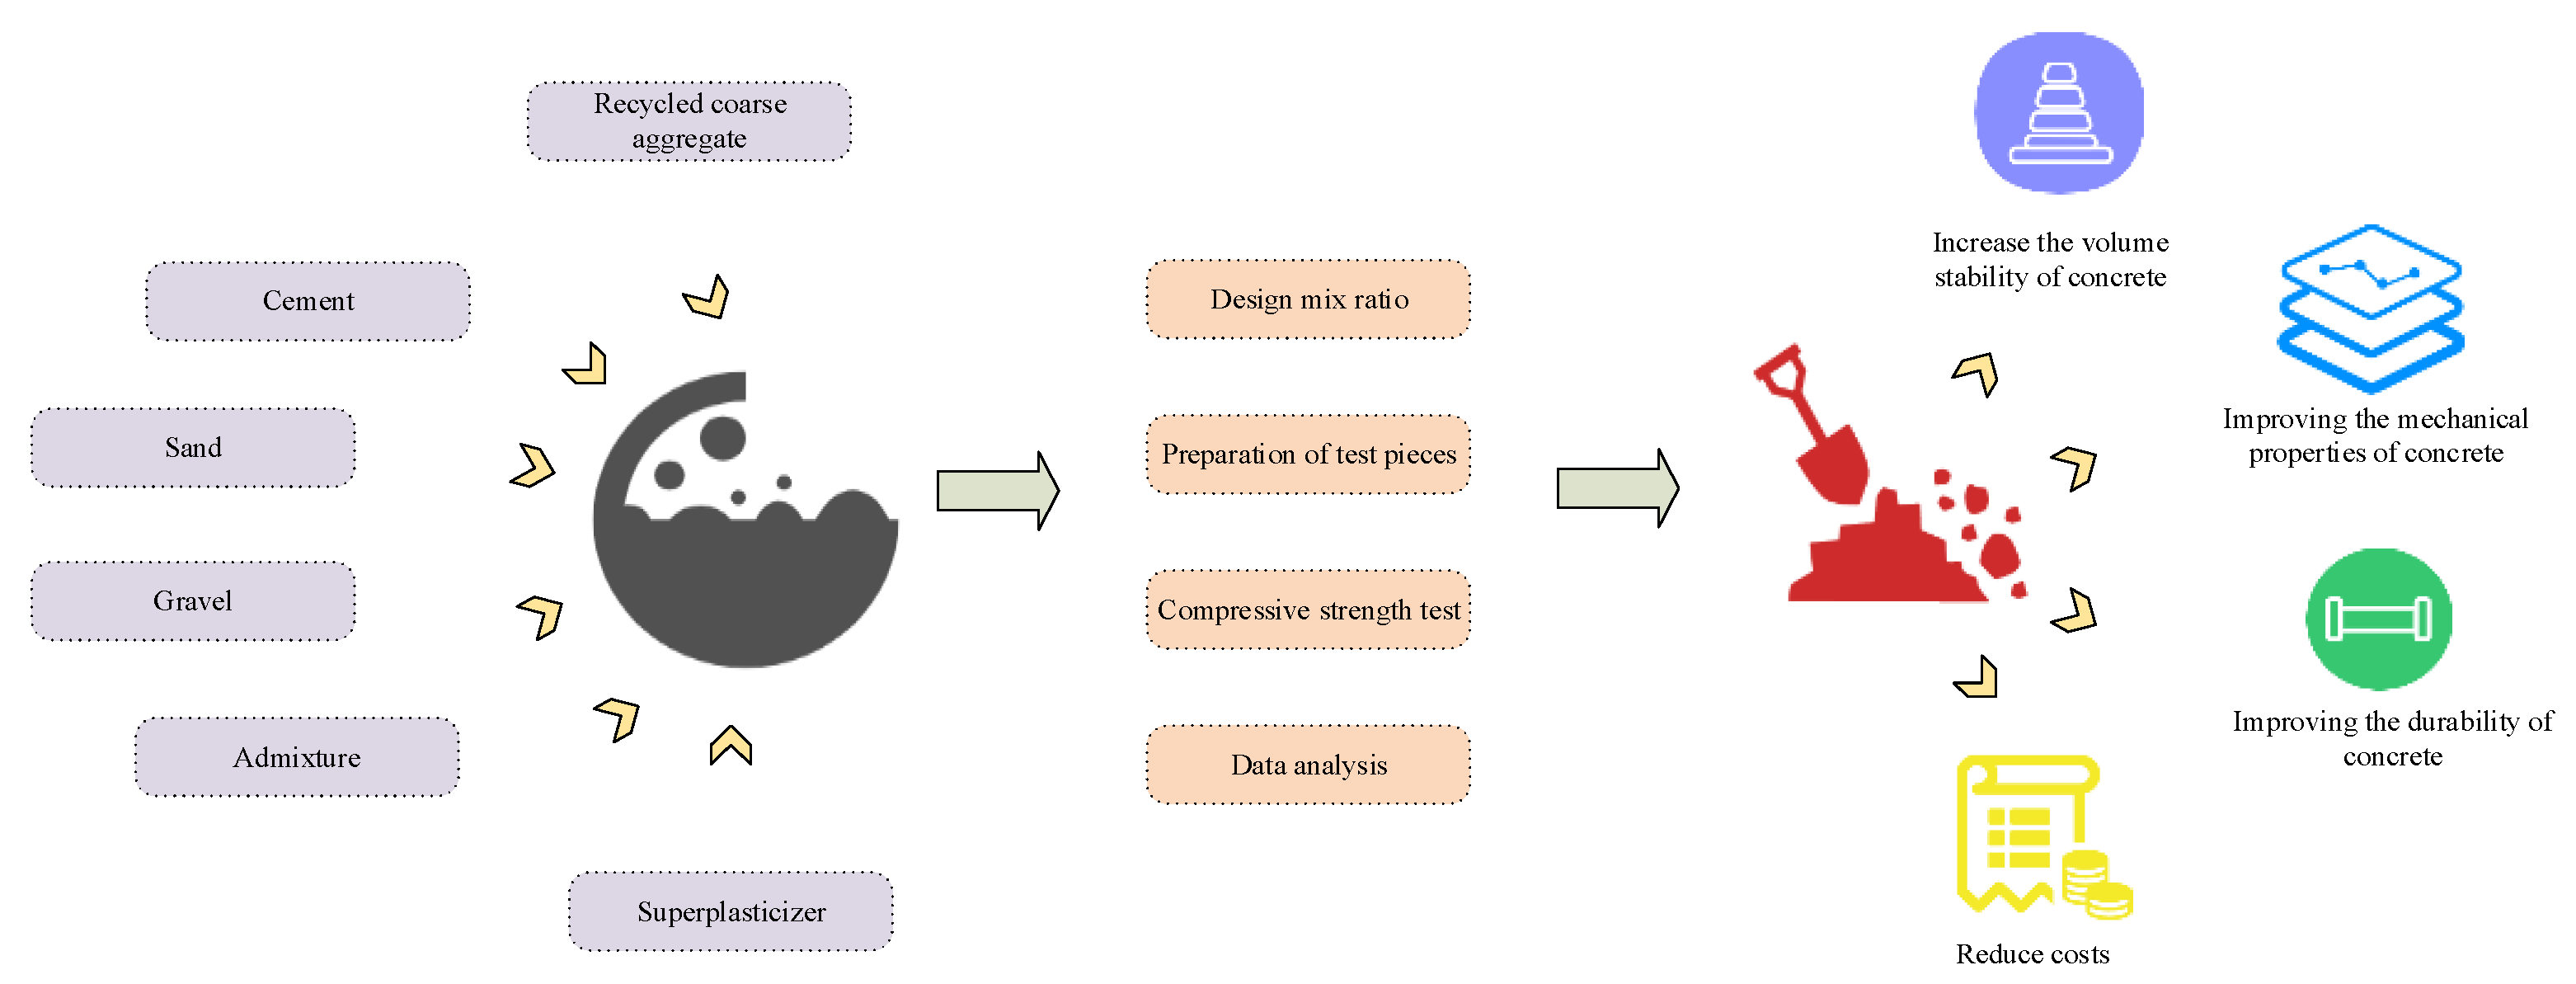
The main objective of the external admixture method is to increase the volume of coarse aggregate in concrete without changing the concrete mix ratio in order to achieve the effective utilization of RCA in concrete [20,21]. The basic principle of the external admixture method is to disperse the rubber powder in the matrix in the form of individual particles, rather than in the form of a dispersed phase, so as to improve its compatibility with the matrix and filling properties [22,23]. The application of external admixture in RCAC has several advantages. By using an external mixing method, concrete’s volume stability can be increased. It can also prevent shrinkage and creep, increase the volume of coarse aggregate in the concrete, and enhance its volume stability. Concrete can have its mechanical qualities enhanced by the addition of an external admixture. This will increase the RCAC’s compressive strength, flexural strength, and other mechanical characteristics, bringing it closer to the technical specifications [24,25,26]. Second, the external admixture approach can enhance the durability characteristics of RCAC, such as its resistance to frost and impermeability, and increase its ability to adjust to variations in the surrounding environment. Finally, costs can be reduced by the external admixture method, which does not require changes in the concrete mix ratio and, therefore, does not increase the cost of new materials. It can also reduce the cost of waste disposal [27,28]. In summary, the use of the external admixture method in RCAC can enhance concrete performance while lowering costs and reducing environmental pollution. It can also help to realize resource utilization of waste. The schematic diagram of the application process of external admixture method in RCAC is shown in Figure 8.
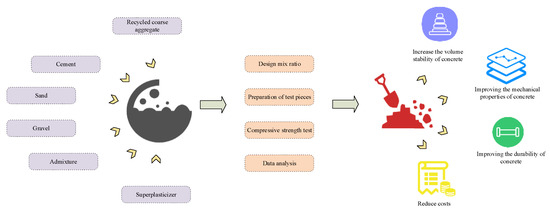
Figure 8.
The schematic diagram of the application process of the external mixing method in recycled coarse aggregate concrete.
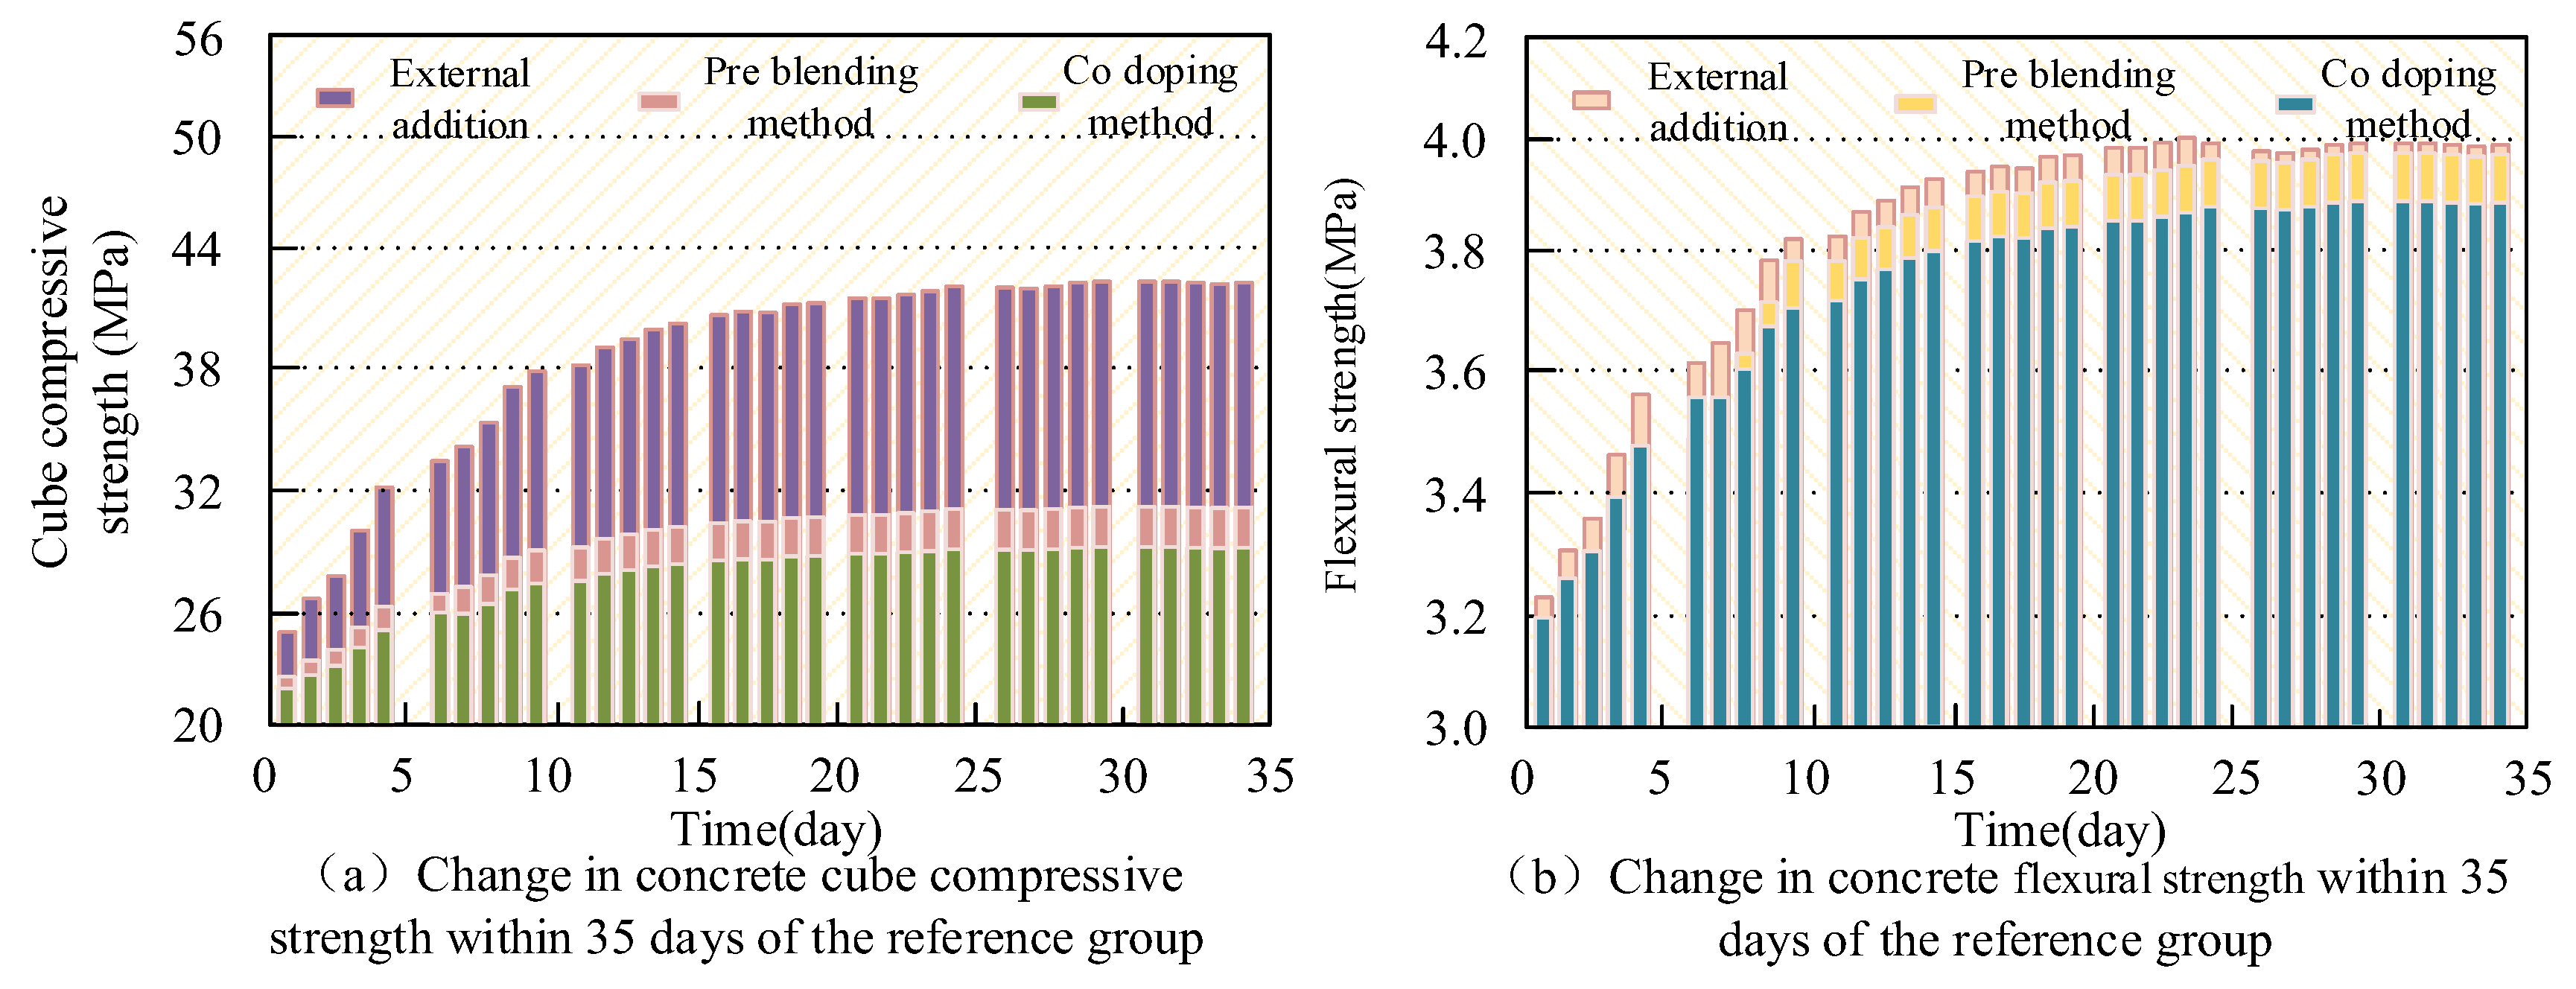
The raw materials used in the experimental process included cement, RCA, crushed stone, and external admixtures. A 42.5 grade ordinary silicate cement was used. RCA was taken from a construction and demolition material treatment plant and made after cleaning, crushing and grading, and its performance indexes conformed to the relevant standards [29]. Medium sand with a fineness modulus of 2.6 and continuous graded gravel ranging from 5 to 25 mm were used. Silica fume, slag powder, and experimentally prepared MRP were also used, and their performance indexes met the relevant standards. A high-efficiency water-reducing agent with a 25% water reduction rate, specifically polycarboxylic acid high-efficiency water-reducing agent, was utilized. The experimental method contains four main steps. First, it is necessary to design the mixing ratio, replacing an amount of sand with an equal amount of silica fume, and designing the test using external mixing method, with the water–cement ratio of 0.35, the dosage of high-efficiency water reducing agent of 1.5%, the dosage of silica fume of 16%, and the sand rate of 34%. After that, the concrete specimens were made in accordance with the design mix ratio and cured under typical curing conditions for 35 days. The test of compressive strength, which is the third phase, was conducted according to the Standard for Test Methods of Mechanical Properties of Ordinary Concrete. Each specimen’s compressive strength value was noted. Lastly, test data analysis was carried out to investigate the impact of the external admixture method on the compressive strength of RCAC. In addition to the external admixture method, the first-mix method and the co-mix method are also commonly used in concrete. The first-mixing method involves mixing the powdered admixture with cement before adding aggregate and water to the mix. The co-mingling method involves pouring liquid and powdered admixtures into the mixer together with concrete materials, or mixing liquid admixtures with water, then mixing them with other materials. Concrete’s performance can be effectively enhanced by all of these techniques. The external admixture of 20 mesh MRP with 4% admixture is the benchmark group of RCAC. In order to compare the three ways of testing the compressive and flexural strengths of concrete, the first admixture method and the identical admixture method were employed as the control group. Figure 9 displays the outcomes of the experiment.
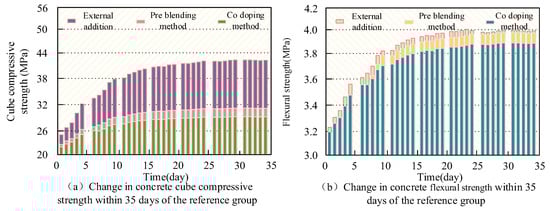
Figure 9.
Three methods for determining the compressive strength and flexural strength of concrete.
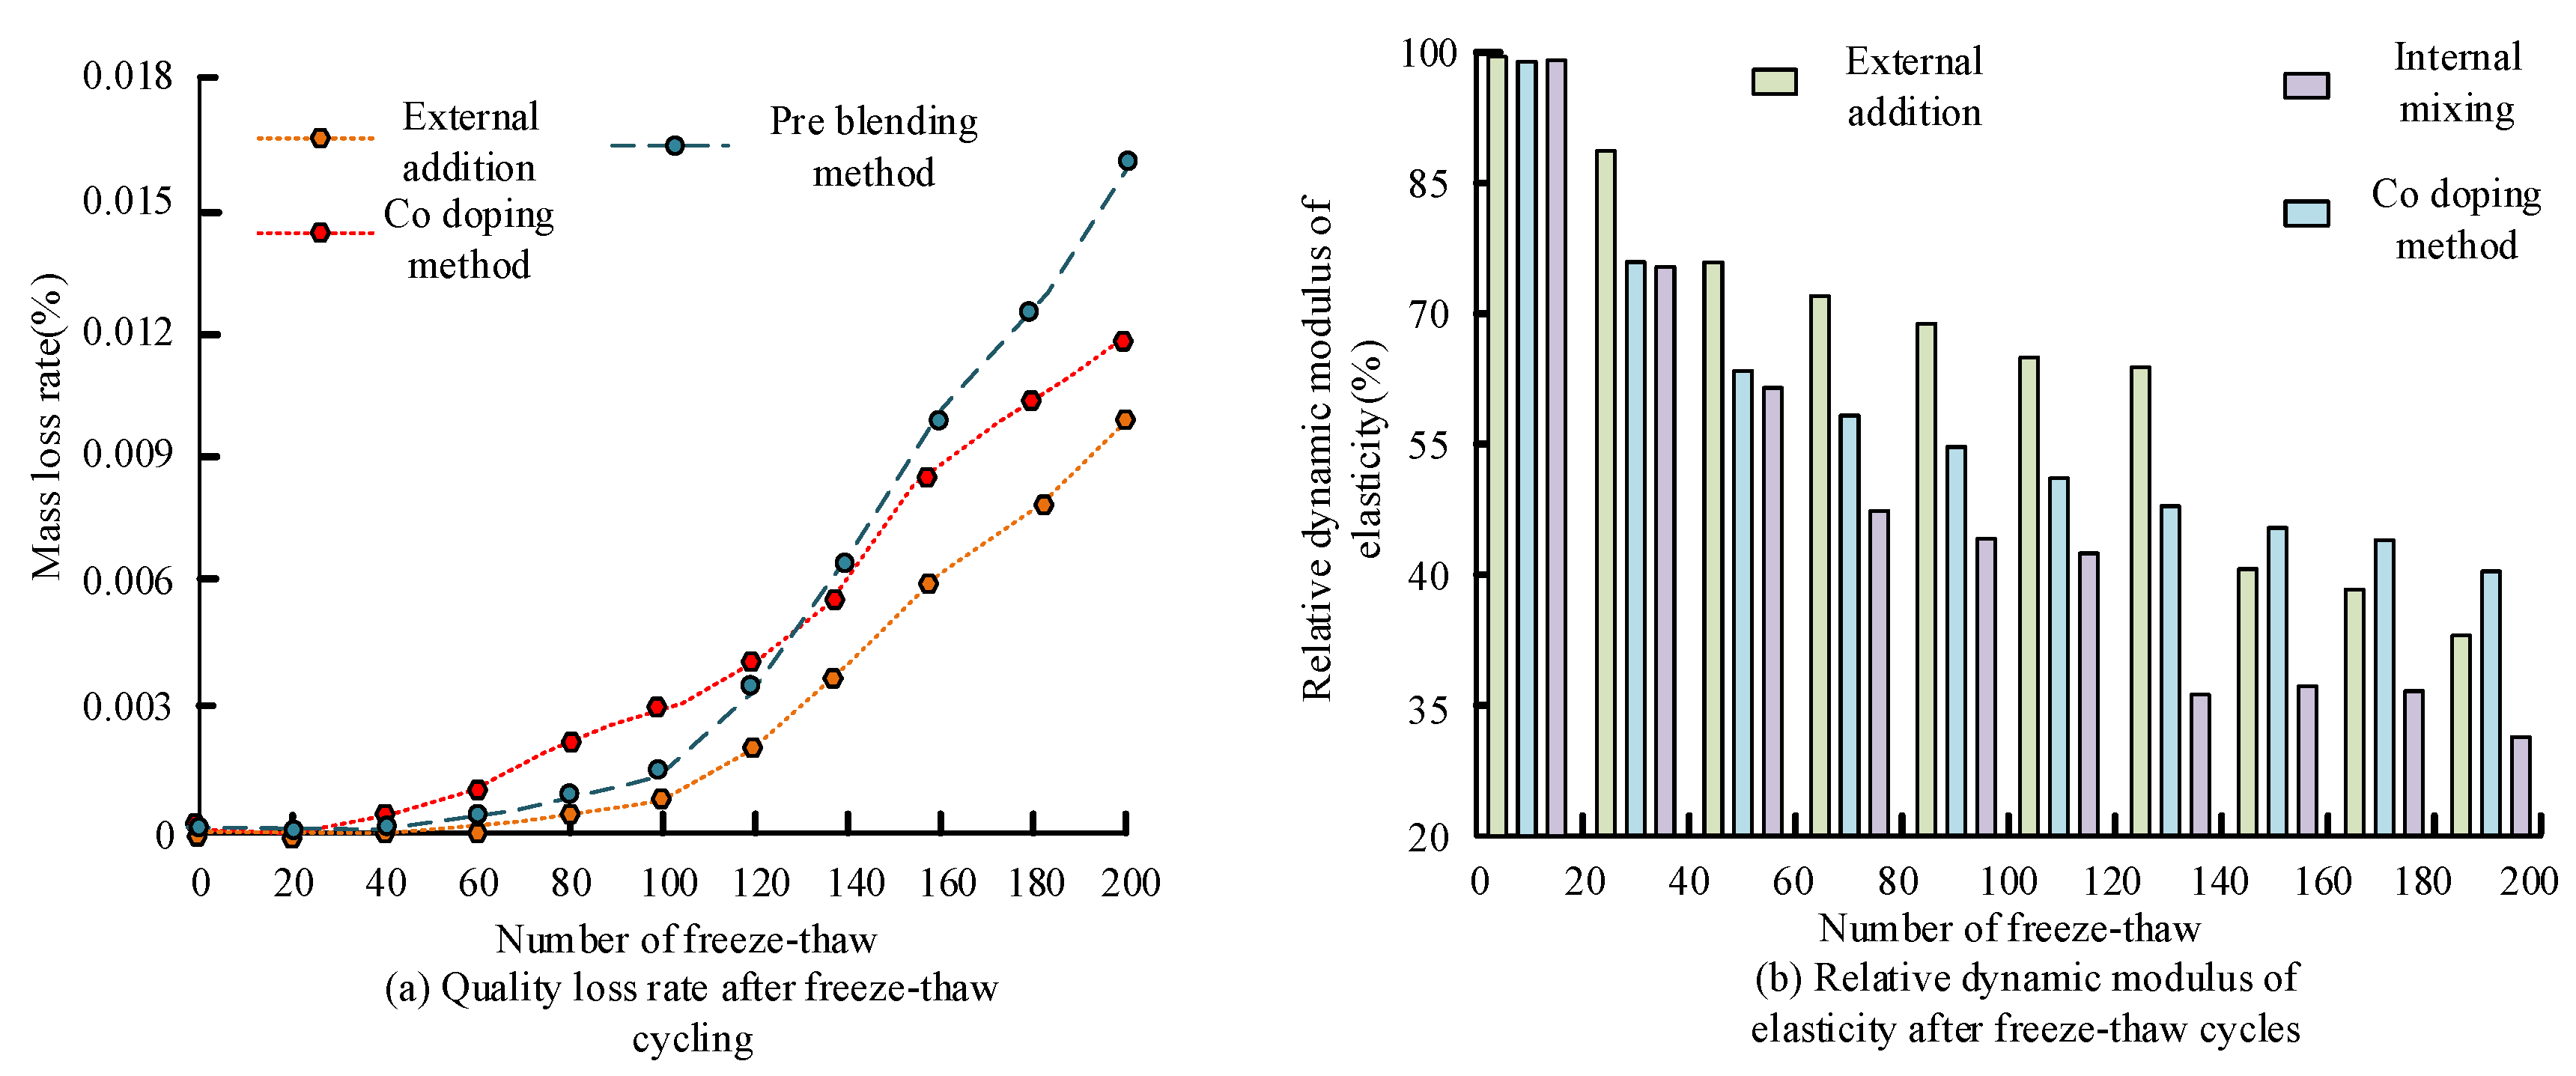
Figure 6 presents the statistical analysis of the impact of the three procedures on the flexural and compressive strengths of concrete. In Figure 9a, the compressive strength of the concrete will go through three stages over time: initial strength, rising strength, and stabilized strength. There is not much difference between the stages of the three admixtures; 0–10 days belongs to the initial strength stage. The strength of concrete grows faster in this stage, mainly due to the hydration reaction of cement. The growing strength stage occurs from 10 to 20 days. The rapid strength growth rate of the concrete gradually slows down, mainly due to the continuation of the hydration reaction of the cement and the gradual reduction of the pore structure within the concrete. The stabilized strength stage occurs from 20 to 35 days. The growth rate of the concrete almost stops at this stage, and the concrete reaches its final strength. Compared to the internal and coadmixing methods, the external method produces the concrete with the highest final strength, mainly due to the fact that the external method allows the admixture to be better dispersed in the concrete. This dispersion improves the homogeneity of the concrete and allows all parts of the concrete to realize their full strength potential. In Figure 9b, the three methods of admixture have little effect on the cracking strength of concrete, which is due to the fact that the amount and manner of admixture of the substances did not change the basic structure and properties of the concrete. A quick freeze–thaw cycle test was used in the experiment to evaluate how the three inclusion techniques affected the longevity and frost resistance of the concrete. Figure 10 displays the outcomes of the experiment.
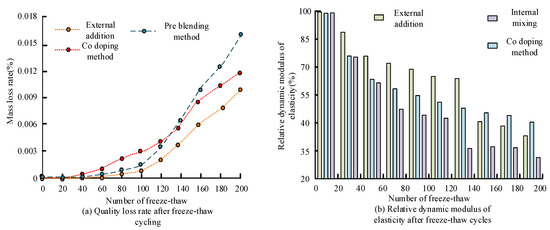
Figure 10.
Relative dynamic elastic modulus and mass loss after freeze–thaw cycles.
In Figure 10a, the three admixture methods did have different effects on the mass loss of concrete. Among them, the concrete produced by the external admixture method exhibited the least mass loss. For the concrete produced by the coadmixture method, the mass loss was higher during 0–140 freeze-thaw cycles (FTC). And after 140 FTC, the most significant mass loss was observed for the concrete produced by the first-mix method. These differences can be attributed to the effect of the admixture method on the internal structure and compactness of the concrete. The external mixing method minimizes the quality loss due to better dispersion of the admixtures, resulting in a more homogeneous and dense internal structure of the concrete, which is more effective in resisting the damage caused by FTC. In the early freeze–thaw cycle, the homogeneous mixing method may result in higher quality loss due to the uneven mixing of the admixtures with the concrete raw materials. The first-mixing method may have a certain degree of admixture aggregation during the production process, which makes the concrete susceptible to damage in these aggregated areas after several FTC, resulting in the greatest loss of quality. As the number of FTC increases, the trend of the elastic modulus change of the concrete made using the other two admixture procedures(i.e., internal admixture and coadmixture) does not differ significantly, as shown in Figure 10b. The concrete produced by the external admixture method, on the other hand, shows slightly better performance, which indicates that the concrete produced by the external admixture method can better maintain its elastic properties and has higher resistance to deformation during the FTC.
6. Physical and Mechanical Properties of Modified Rubber Recycled Concrete
The research team used a rigorous and methodical experimental program to fully and precisely ascertain the impact of numerous parameters on the compressive and flexural strength of concrete. These factors include the particle size of rubber powder, different mesh sizes of Sipan admixture and at 6% external admixture, and different mesh sizes of SDBS admixture and at 6% external admixture. The study investigated how these different factors affect the physical properties of concrete when acting alone or in combination, with A-20-3% denoting the external mixing of 20 mesh of Sipan 40 MRP with 3%, A-40-6% denoting the external mixing of 40 mesh of Sipan 40 MRP with 6%, B-20-3% denoting the external mixing of 20 mesh of SDBSMRP with 3%, and so on. Table 1 displays the experimental results. The dynamic mechanical properties of the material were tested by the dynamic mechanical analyzer (DMA), and the carbon emission content of the concrete was evaluated by the YX 09-TOC carbon emission analyzer manufactured by Beijing Haafuda Technology Co., Ltd. (Beijing, China) [30].

Table 1.
Table for strength development of recycled coarse aggregate concrete.
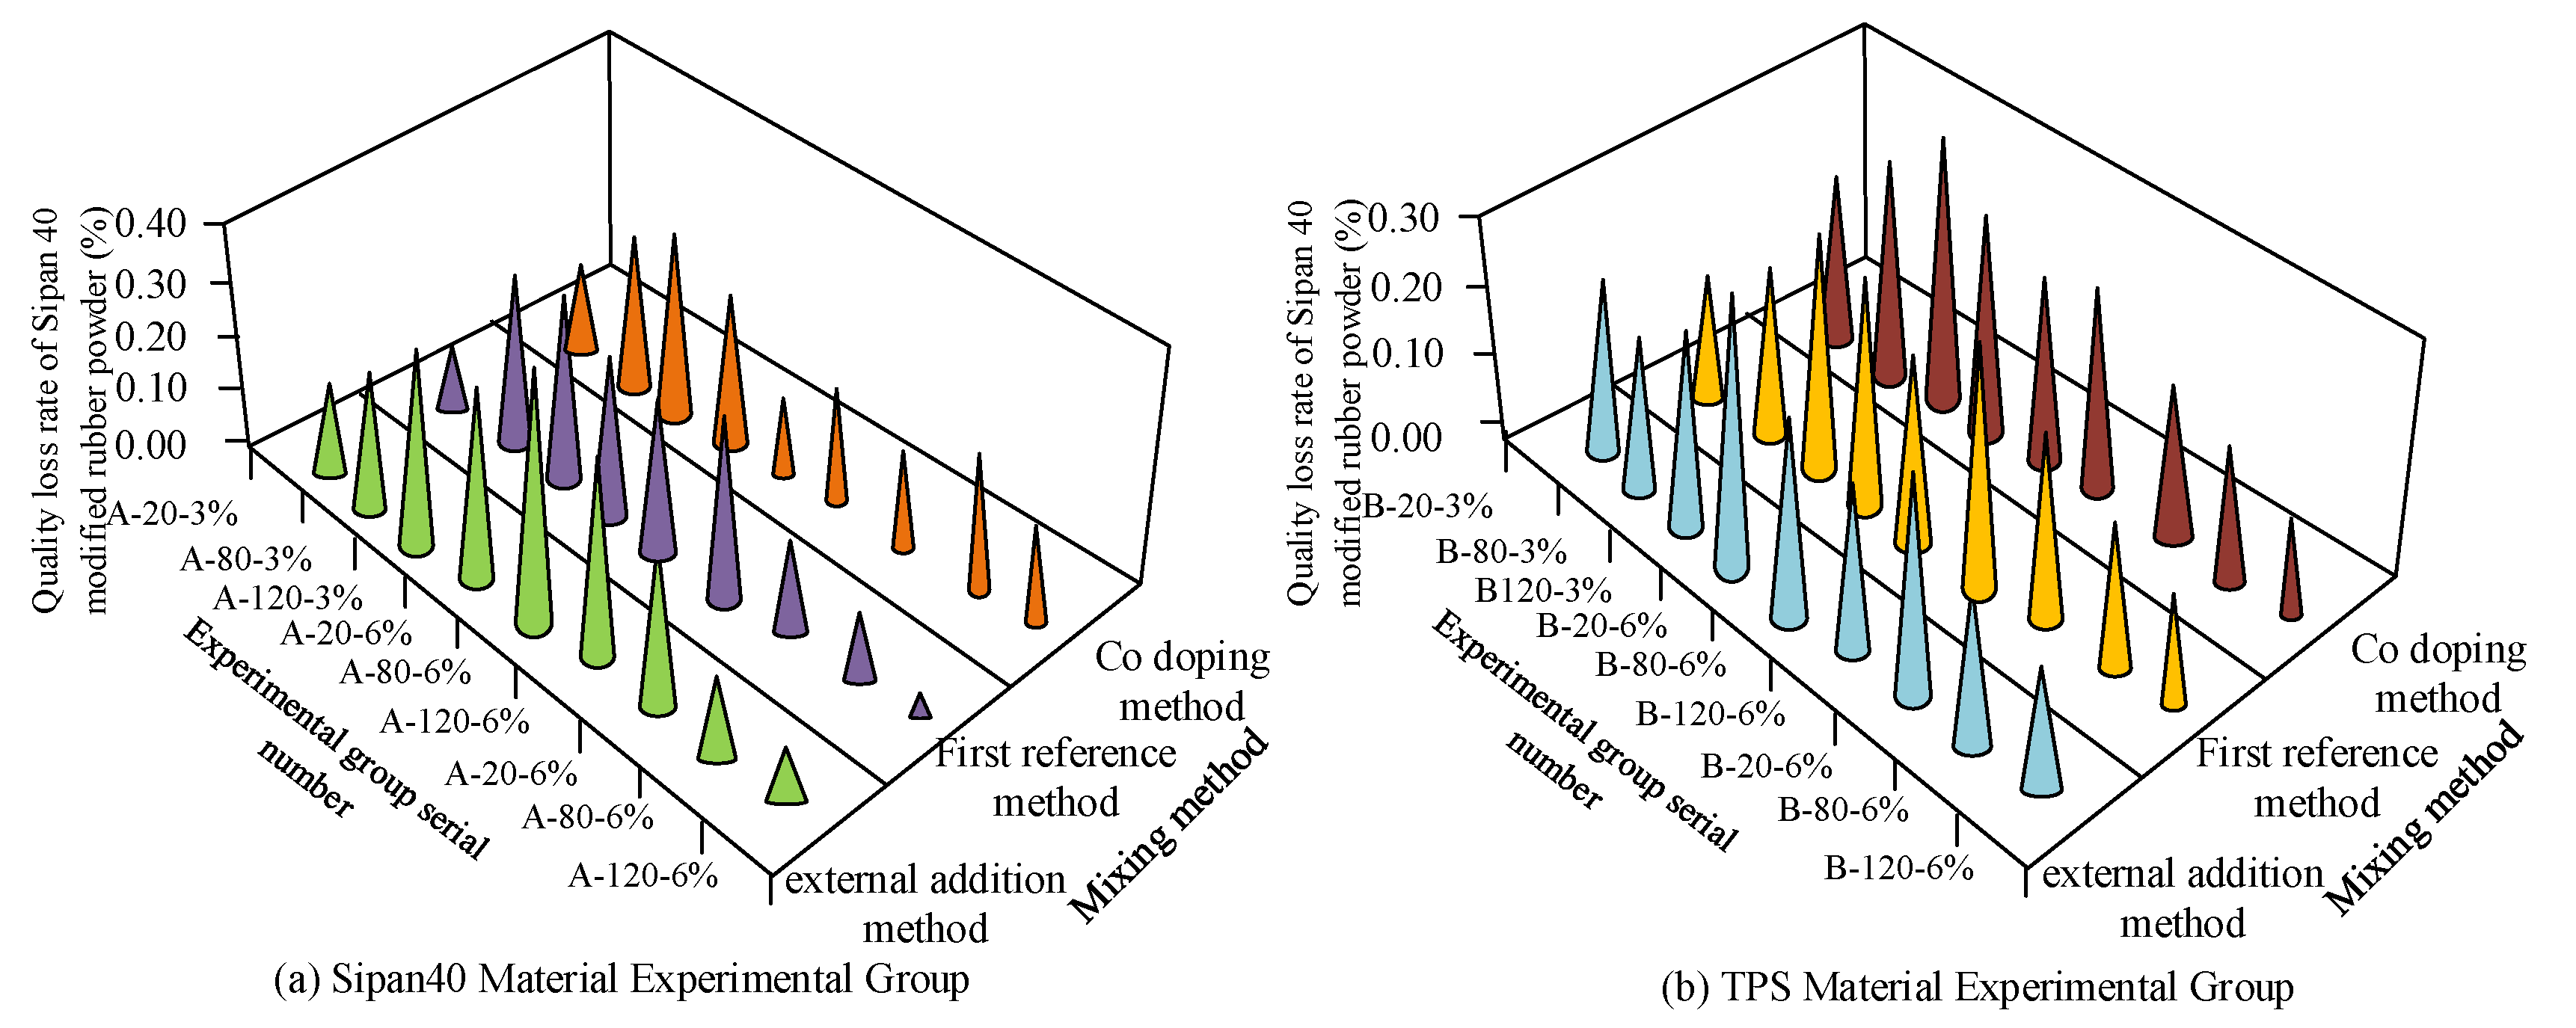
The RCAC strength development table presented in Table 1 reveals the effect of different gum powder particles and mesh size as well as external admixture on the performance of concrete. From the data presented in the table, it is clear that the combination of Sipan 40 micronized particles with 80 mesh and 6% admixture showed the best overall results. The strength development of concrete with this combination was excellent, showing high compressive and flexural strengths. Meanwhile, the combination using SDBS’s gum powder particles with 120 mesh and 6% external admixture showed the next best overall results. Although its performance was slightly inferior to that of the Sipan 40 combination, it still showed relatively good concrete strength development. Compared to these two combinations, the other combinations exhibit slightly inferior performance. Additionally, the table shows that the A-20-6% experimental group has the lowest carbon emissions among all the experimental groups, at only 698 kg/m3. Furthermore, the carbon emissions of both experimental groups, A-80-6% and A-120-6%, are approximately 700 kg/m3, which is significantly lower than the emissions of the other experimental groups. In addition, the experiment also conducted freeze–thaw tests for different experimental groups in accordance with the methods specified in GB/T 50082-2009 [31]. The freeze-resistant mark of concrete was measured using the relative dynamic modulus of elasticity in order to examine the impact of various MRP on the longevity and freeze-resistance of concrete. The experimental outcomes are displayed in Figure 11.
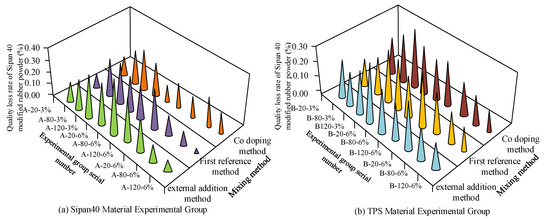
Figure 11.
Relative dynamic elastic modulus results of different experimental groups undergoing 200 rapid freeze–thaw tests.
The findings of the 200 quick freeze–thaw tests show how the relative dynamic modulus of elasticity changed for the various experimental groups (Figure 11). Following 200 quick freeze–thaw experiments, each experimental group’s relative dynamic elastic modulus varied somewhat, as shown in this figure. However, it is worth noting that among all the experimental groups, the four experimental groups, A-80-6%, A-80-3%, A-20-6%, and B-20-6% showed the smallest changes in their relative dynamic elastic modulus. This result may imply that the concrete formulations or treatments used in these four experimental groups are superior in resisting freeze–thaw damage and thus better maintain the stability of their dynamic modulus of elasticity. The manufactured specimens were placed in a curing room for 28 days, after which they were removed for the chloride ion penetration test to evaluate the impact of various conditions on the durability of concrete. For the test, the specimens were placed in a chloride ion penetrometer, pressurized to a specified value and held for 24 h. Then, the mass loss rate of each experimental group was recorded. Figure 12 displays the experimental outcomes.
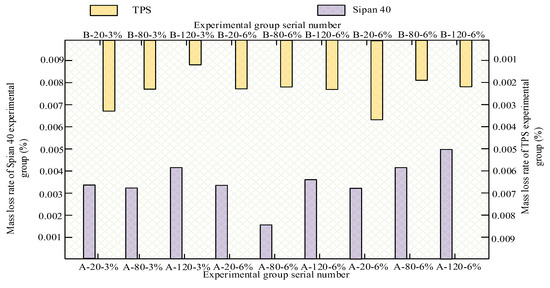
Figure 12.
Results of mass loss rate after chloride ion penetration test in the same experimental group.
Figure 12 demonstrates the results of the mass loss rate of different experimental groups after the chloride penetration test. It is clear from the figure that among all the experimental groups, four experimental groups, A-80-6%, B-120-3%, B-80-6%, and B-120-6%, have the lowest mass loss rate, indicating that these concretes have good resistance to penetration. This suggests that these materials effectively prevent the penetration of chloride ions, reducing damage to the concrete structure. The A-80-6% experimental group demonstrated the best overall performance, as evidenced by the results of dynamic mechanical property tests and freeze–thaw cycle tests. This experimental group used an external mix of 80 mesh Sipandex 40 MRP at a dosage of 6%. The concrete not only performs well in frost durability, but also has excellent performance in compressive strength and flexural strength. This indicates that the concrete in the A-80-6% experimental group has high strength and durability and is able to maintain stable performance under harsh environmental conditions for a long period of time. In addition, the carbon emissions of the A-80-6% experimental group were also lower, indicating that this concrete production method has less environmental impact. Considering the penetration resistance, dynamic mechanical properties and carbon emissions, the concrete from the A-80-6% experimental group can be regarded as an ideal choice with better performance and lower environmental impact.
7. Application and Optimization of Recycled Pumice in Green Concrete
7.1. Application of Recycled Pumice in Green Concrete
In GC, RP can be used as a substitute for aggregate in order to achieve resource recycling and reduce environmental load [32]. The design of the mix ratio is one of the key steps in the preparation process of GC; through the reasonable design of the mix ratio, it can ensure that the performance of the concrete meets the project requirements and realize the goal of energy saving and emission reduction. To determine the most suitable mix ratio for RP as well as MR, the study conducted a series of experiments. The addition ratios of cement, water, RP, sand, water reducer, and natural pumice are shown in Table 2.
Table 2.
Mix proportion of green concrete components.
In the design of the mix ratio, it is necessary to consider the characteristics and properties of RP and the workability requirements of concrete. The experiments under different mix ratios can be used to evaluate the performance indexes of GC, such as compressive strength, flexural strength, durability, and the content of carbon emissions. Comparing the performance under different mix ratios, the best mix ratio can be selected to meet the project requirements with the best energy saving and emission reduction effect. In the experiments, the compressive strength of the concrete was measured using a YAW-3000 digital pressure tester; the flexural strength was measured using a bending tester made by CITEMA. And the durability performance of various mix ratios was tested using a freeze–thaw cycle test for each group of 200 FTC. And finally, the carbon footprint tester was used to calculate the carbon emissions in the production process of each experimental group. Figure 13 displays the outcomes of the experiment.
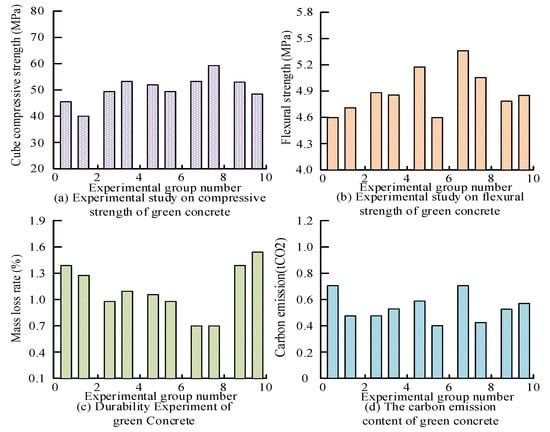
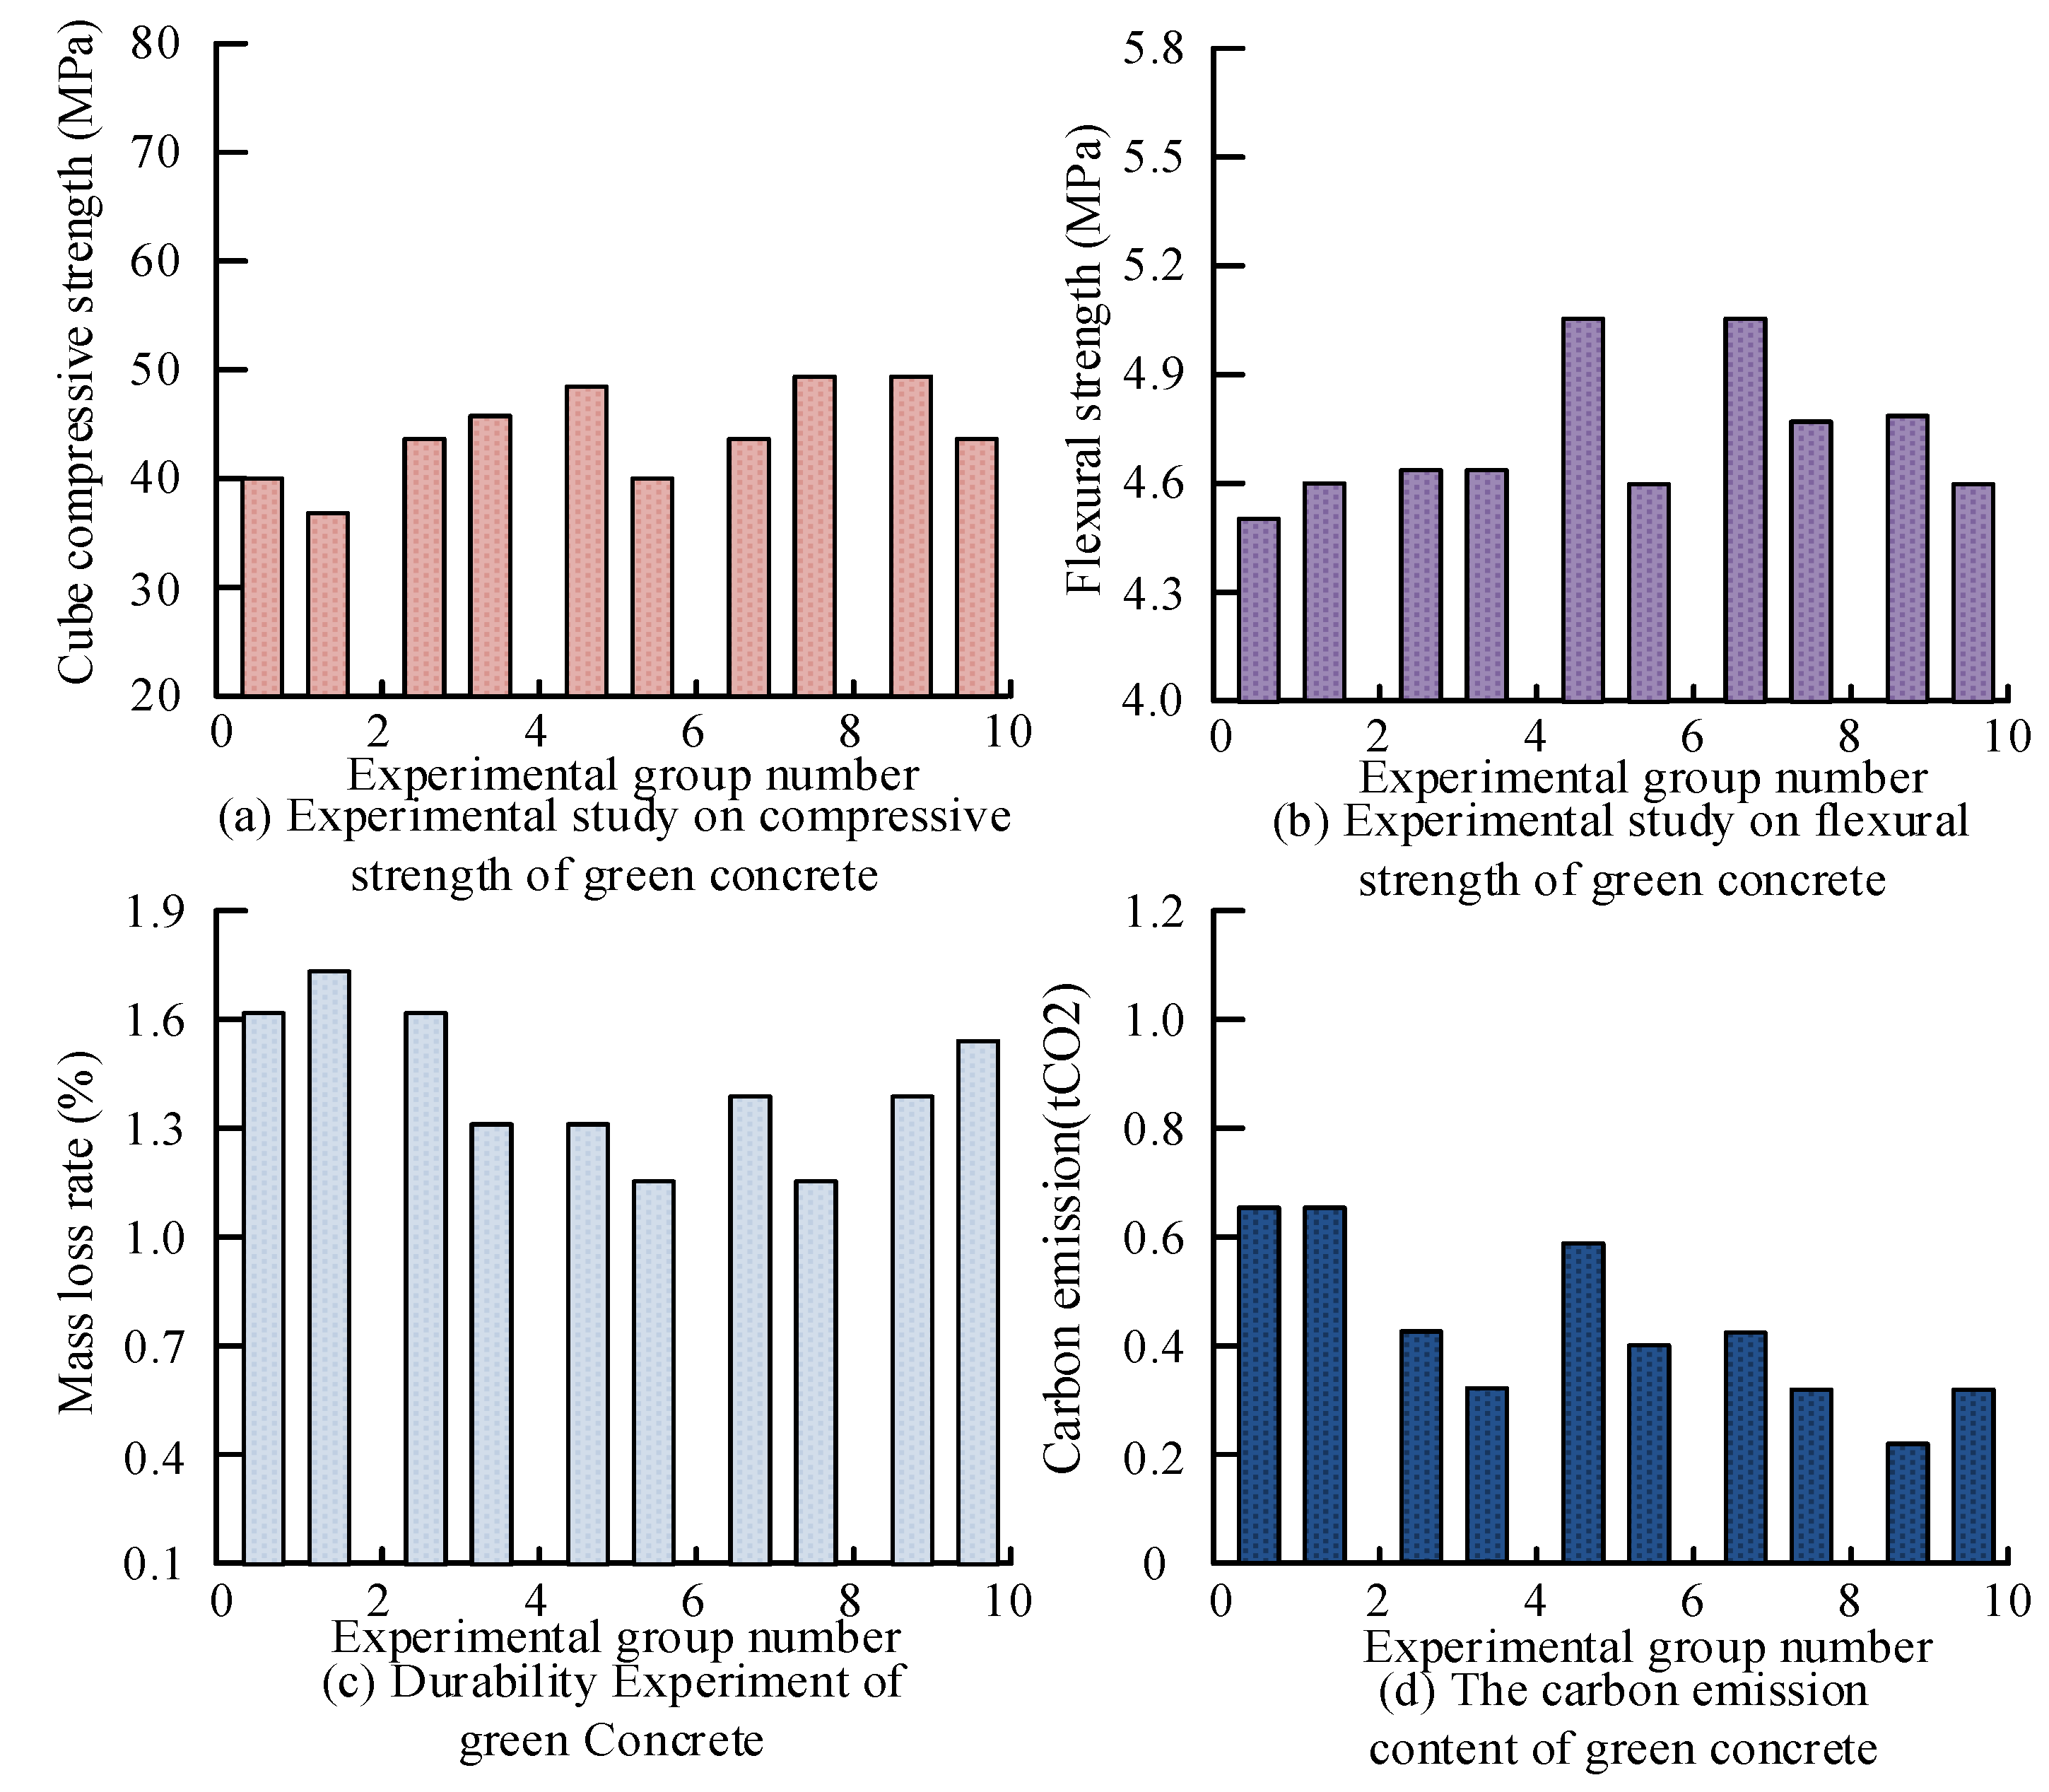
Figure 13.
Statistics of experimental results of green concrete mix ratio.
In Figure 13, the compressive and flexural strengths of experimental group 7 and experimental group 8 performed the best among the 10 groups of experiments. In Figure 13c, after 200 FTC, all groups lost concrete mass, but the seventh and eighth experimental groups lost the least mass. In Figure 13d, there is a large difference in carbon emissions in all groups, with the first and seventh groups having the largest carbon emissions, and the fifth and eighth groups having the smallest carbon emissions, both around 0.4 tons. Based on the experimental results, it can be concluded that the optimal mix ratio is 1:3:1 for cement, sand, and natural pumice. This ratio exhibits superior compressive and flexural strengths, as well as low carbon emissions and excellent weathering resistance.
7.2. Optimization of Green Concrete Performance by Recycled Pumice
To attain the objectives of energy conservation and emission reduction during the concrete production process, optimization strategies that enhance productivity and lower energy usage must be identified. Considering that RP in concrete is produced by recycling waste concrete rubble or crushed construction concrete as raw material, its carbon footprint is relatively low. Therefore, the manufacture of cement becomes the most critical part of the carbon footprint of concrete. Thorough research must be done to determine how to use the highest amount of RP and the lowest quantity of cement while maintaining concrete’s performance in order to minimize carbon emissions. Table 3 lists the primary ingredients used in each batch of concrete during the trial.
Table 3.
Main components used in each batch of concrete during the test period.
To assess GC’s performance, a series of experiments were conducted using the carbon footprint calculation method proposed in the literature. The experiments focused on key indicators, including compressive strength, flexural strength, durability, and carbon emission content, under different mixing ratios. These experiments were designed to identify the optimal concrete proportioning solution by comparing different mixing ratios. The experiments also used a YAW-3000 digital compression tester, bending tester, carbon footprint tester and 200 FTC to test the above properties. Figure 14 presents the experimental results.

Figure 14.
Comprehensive verification results of various performance indicators in different experimental groups.
In Figure 14, after reducing the amount of cement, the performance of all experimental groups decreased, but not by the same amount. Among them, the fourth experimental group ensured that the carbon emissions decreased by 0.25 tCO2 while achieving only a small decrease in other properties. The compressive strength decreased by only 7 MPa, the flexural strength decreased by only 0.2 MPa, and the mass loss rate increased only slightly after 200 FTC. Therefore, the experiment can conclude that the ratio of cement, sand, and RP of 1:2:2 ensures its structural performance as well as realizes greater energy saving and emission reduction. The study suggests incorporating strategies like MRP to increase the GC’s resilience to cold and durability. The most environmentally friendly optimization approach was chosen in order to investigate the ideal level of MRP inclusion while simultaneously concentrating on the effect of these measures on the carbon emissions and energy consumption of GC. A series of experiments were done as part of the investigation, and Table 4 displays the experimental conditions.
Table 4.
Add the proportion of each component of the green concrete components.
It can be observed that the optimum mix ratio was chosen for the experiment, i.e., the ratio of cement, sand, and RP was 1:2:2. The MR admixture also varied using the control variable method. In order to investigate the optimum incorporation amount, the experiment was carried out for 200 FTC for each experimental group, and the changes in relative dynamic modulus of elasticity and carbon emissions were used as evaluation indexes. The experimental results are shown in Figure 15.
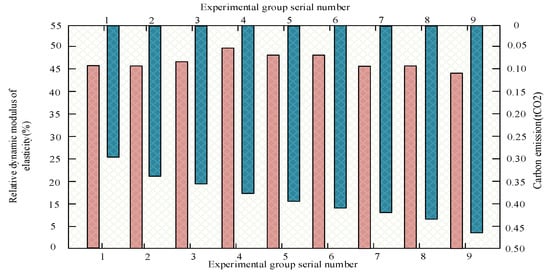
Figure 15.
Optimum incorporation experiment of modified rubber content.
Figure 15 illustrates how the nine experimental groups’ relative dynamic modulus of elasticity changed after 200 FTC and how much carbon was released into the atmosphere during manufacture. In this figure, with the increase of MRP incorporation, the carbon emission in the production process increases accordingly. Therefore, it is necessary to consider the changes in the relative elastic modulus of each experimental group. In this figure, with the increase of MRP incorporation, its relative elastic modulus shows a trend of increasing and then decreasing. Experimental group 4 is the peak value of relative elastic modulus. Taking into account its carbon emission, it can be determined that experimental group 4 is the optimum mix ratio. That is, 20 kg/m3 of MRP is incorporated while the ratio of cement, sand, and RP is 1:2:2, which gives better performance and lower carbon emission.
8. Conclusions
The study is based on the use of RP and modification of rubber powder with Sipan 40 to design a new type of GC. Tests of the damage caused by freeze–thaw cycles were performed on concrete specimens contaminated with chloride ions (in order to simulate the effect of using deicing salts). The experimental groups A-80-6%, B-120-3%, B-80-6%, and B-120-6% showed the least mass loss, indicating good durability in the harsh winter environment with use of deicing salts. In the RP proportioning experiments, experimental group 4 achieved a decrease in carbon emissions of 0.25 tCO2, with only a small decrease in other properties. After 200 FTC, the compressive strength decreased by only 7 MPa, the flexural strength decreased by only 0.2 MPa, and the mass loss rate increased only slightly. Thus, it can be concluded that a 1:2:2 ratio of cement, sand, and RP ensures structural performance and promotes energy efficiency and emission reduction. Additionally, experiments were conducted to determine the optimal amount of MRP incorporation using the control variable method. The results indicated that the relative modulus of elasticity initially increased and then decreased with increasing MRP incorporation. The peak value of relative elastic modulus was observed in experimental group 4. Based on its carbon emissions, it can be concluded that experimental group 4 has the best mix ratio. The mix included 20 kg/m3 of MRP along with a ratio of cement, sand, and RP of 1:2:2, resulting in better performance and lower carbon emissions. The study’s newly designed concrete offers advantages such as high compressive strength, high cold resistance, and environmental friendliness. However, the economic effectiveness of these experiments in real production activities has not yet been verified on a large scale. This aspect needs to be the basis of subsequent studies.
Author Contributions
Formal analysis, X.S.; Investigation, X.C.; Writing—original draft, X.C.; Writing—review & editing, X.L. and X.S.; Supervision, X.L. All authors have read and agreed to the published version of the manuscript.
Funding
This work was sponsored in part by Anhui Provincial Key Natural Science Research Projects in Universities (2022AH052054).
Institutional Review Board Statement
Not applicable.
Informed Consent Statement
Not applicable.
Data Availability Statement
The data presented in this study are available on request from the corresponding author due to privacy.
Conflicts of Interest
There is no conflict of interest in the research.
Abbreviations
| ANN | Artificial Neural Networks |
| GA-ANN | Genetic Algorithm and Artificial Neural Networks |
| SVR | Support Vector Regression |
| SCBA-SF | Sugar Cane Bagasse Ash and Silica Fume |
| NMR | Nuclear Magnetic Resonance |
| HSC | High-Performance Concrete |
| VPP | Volcanic Pumice Powder |
| PF | Polypropylene Fiber |
References
- Wu, Z.; Zhang, N. A Literature Survey of Green and Low-Carbon Economics Using Natural Experiment Approaches in Top Field Journal. Grace 2023, 1, 2–14. [Google Scholar] [CrossRef]
- Usman, A.M.; Abdullah, M.K. An Assessment of Building Energy Consumption Characteristics Using Analytical Energy and Carbon Footprint Assessment Model. Grace 2023, 1, 28–40. [Google Scholar] [CrossRef]
- Wang, Y.; Zeng, S. Waste Haven Transfer and Poverty-Environment Trap: Evidence from EU. Grace 2023, 1, 41–49. [Google Scholar] [CrossRef]
- Mater, Y.; Kamel, M.; Bakhoum, E. ANN-Python prediction model for the compressive strength of green concrete. Constr. Innov.-Engl. 2023, 23, 340–359. [Google Scholar] [CrossRef]
- Kumar, A.S.; Chithambar Ganesh, A. Reduction of hazardous incinerated bio-medical waste ash and its environmental strain by utilizing in green concrete. Water Sci. Technol. 2021, 84, 2780–2792. [Google Scholar] [CrossRef] [PubMed]
- Pan, L.; Guo, X. Predicting compressive strength of green concrete using hybrid artificial neural network with genetic algorithm. Struct. Concr. 2022, 24, 1980–1996. [Google Scholar] [CrossRef]
- Landa-Ruiz, L.; Santiago-Hurtado, G.; Villegas-Apaez, R.; Baltazar-Zamora, M.A. Evaluation of the behavior of the physical and mechanical properties of green concrete exposed to magnesium sulfate. Eur. J. Eng. Technol. Res. 2020, 5, 1353–1356. [Google Scholar]
- Ibrahim, M.; Maslehuddin, M. Influence of pore structure on the properties of green concrete derived from natural pozzolan and nanosilica. J. Sustain. Cem. Based Mater. 2020, 9, 233–257. [Google Scholar] [CrossRef]
- Alsaedy, S.M.; Aljalawi, N. The effect of nanomaterials on the properties of limestone dust green concrete. Eng. Technol. Appl. Sci. Res. 2021, 11, 7619–7623. [Google Scholar] [CrossRef]
- Rashad, A.M. An overview of pumice stone as a cementitious material–the best manual for civil engineer. Silicon 2020, 13, 551–572. [Google Scholar] [CrossRef]
- Zeyad, A.M.; Khan, A.H.; Tayeh, B.A. Durability and strength characteristics of high-strength concrete incorporated with volcanic pumice powder and polypropylene fibers. J. Mater. Res. Technol. 2020, 9, 806–818. [Google Scholar] [CrossRef]
- Szabó, R.; Reaction, S.K. Structure and properties of eco-friendly geopolymer cement derived from mechanically activated pumice. Ceram. Int. 2023, 49, 6756–6763. [Google Scholar] [CrossRef]
- Sari, N.H.; Thiagamani, S.M.K.; Tamimi, S.; Rangappa, M. Evaluation of mechanical, S.S., thermal and morphological properties of corn husk modified pumice powder reinforced polyester composites. Polym. Polym. Compos. 2022, 43, 1763–1771. [Google Scholar] [CrossRef]
- Giachetti, T.; Wright, H.M. The products of primary magma fragmentation finally revealed by pumice agglomerates. Geology 2021, 49, 1307–1311. [Google Scholar] [CrossRef]
- Taheri-Ledari, R.; Shalan, A.E. Convenient conversion of hazardous nitrobenzene derivatives to aniline analogues by Ag nanoparticles, stabilized on a naturally magnetic pumice/chitosan substrate. RSC Adv. 2020, 10, 43670–43681. [Google Scholar] [CrossRef]
- Yılmaz, S.; Şahan, T. Improved anaerobic digestion activity of poultry dung with pumice-supported trace elements: Focus on the statistical optimization approach. Biomass Convers. Bior. 2022, 13, 2469–2486. [Google Scholar] [CrossRef]
- Soltani, S.S.; Foroumadi, A. Synthesis and characterization of a supported Pd complex on volcanic pumice laminates textured by cellulose for facilitating Suzuki–Miyaura cross-coupling reactions. RSC Adv. 2020, 10, 23359–23371. [Google Scholar] [CrossRef] [PubMed]
- Kazemian, M.; Ramezanianpour, A.M. Effects of cyclic carbonation and chloride ingress on durability properties of mortars containing Trass and Pumice natural pozzolans. Struct. Concr. 2021, 22, 2704–2719. [Google Scholar] [CrossRef]
- Ibrahim, T.K.; Yawas, D.S.; Adebisi, A.A. Manufacturing and optimization of the effect of casting process parameters on the compressive strength of aluminum/pumice/carbonated coal hybrid composites: Taguchi and regression analysis approach. Int. J. Adv. Manuf. Technol. 2023, 125, 3401–3414. [Google Scholar] [CrossRef]
- Kurt Albayrak, Z.N.; Gencer, G. The usability of clay/pumice mixtures modified with biopolymer as an impermeable liner. KSCE J. Civ. Eng. 2020, 25, 28–36. [Google Scholar] [CrossRef]
- Hashmi, A.F.; Khan, M.S.; Bilal, M.; Shariq, M.; Baqi, A. Green concrete: An eco-friendly alternative to the OPC concrete. Construction 2022, 2, 93–103. [Google Scholar] [CrossRef]
- Siddika, A.; Amin, M.R.; Rayhan, M.A.; Islam, M.S.; Al Mamun, M.A.; Alyousef, R.; Amran, Y.M. Performance of sustainable green concrete incorporated with fly ash, rice husk ash, and stone dust. Acta Polytech. 2021, 61, 279–291. [Google Scholar] [CrossRef]
- Ning, K.; Tang, Z.; Xie, P.; Hu, J.; Fu, Z. Study on Silicone Rubber Composite Insulator Modified by High-Energy Electron Beam Irradiation. IEEE Trans. Dielectr. Electr. Insul. 2022, 30, 31–40. [Google Scholar] [CrossRef]
- Chandio, S.A.; Memon, B.A.; Oad, M.; Chandio, F.A.; Memon, M.U. Effect of fly ash on the compressive strength of green concrete. Eng. Technol. Appl. Sci. 2020, 10, 5728–5731. [Google Scholar] [CrossRef]
- Zhu, X.; Zhou, Y.; Zhang, Y.; Zhou, L.; Huang, X. The Effects of Nano-ZrO2 on the Mechanical and Electrical Properties of Silicone Rubber and a Corresponding Mechanism Analysis. IEEE Trans. Dielectr. Electr. Insul. 2022, 29, 2218–2226. [Google Scholar] [CrossRef]
- Chun, P.-J.; Hayashi, S. Development of a Concrete Floating and Delamination Detection System Using Infrared Thermography. IEEE/ASME Trans. Mechatron. 2021, 26, 2835–2844. [Google Scholar] [CrossRef]
- Omar, A.; Muthusamy, K. Concrete Industry, Environment Issue, and Green Concrete: A Review. Construction 2022, 2, 1–9. [Google Scholar] [CrossRef]
- Rao, M.S.C.; Vijayalakshmi, M.M.; Praveenkumar, T.R. Behaviour of green concrete (blended concrete) using agro-industrial waste as partial replacement of cement along with nanoparticles. Appl. Nanosci. 2021, 13, 2285–2293. [Google Scholar] [CrossRef]
- Yeganeh, B.; Khatamgooya, A. The feasibility study of stabilizing the automotive paint sludge by recycling, to produce green concrete blocks, considering environmental and mechanical factors. J. Mater. Cycles Waste 2022, 25, 931–943. [Google Scholar] [CrossRef]
- Buller, A.H.; Husain, N.M.; Oad, M.; Memon, B.A.; Sodhar, I.N. Investigating the Deflection and Strain of Reinforced Green Concrete Beams Made with Partial Replacement of RCA under Sustained Loading. Eng. Technol. Appl. Sci. 2022, 12, 9203–9207. [Google Scholar] [CrossRef]
- GB/T 50082-2009; Standard for Test Methods of Long-Term Performance and Durability of Ordinary Concrete. China Academy of Building Research: Beijing, China, 2009.
- Valls-Val, K.; Bovea, M.D. Carbon footprint in Higher Education Institutions: A literature review and prospects for future research. Clean. Technol. Environ. 2021, 23, 2523–2542. [Google Scholar] [CrossRef] [PubMed]


Disclaimer/Publisher’s Note: The statements, opinions and data contained in all publications are solely those of the individual author(s) and contributor(s) and not of MDPI and/or the editor(s). MDPI and/or the editor(s) disclaim responsibility for any injury to people or property resulting from any ideas, methods, instructions or products referred to in the content. |
© 2024 by the authors. Licensee MDPI, Basel, Switzerland. This article is an open access article distributed under the terms and conditions of the Creative Commons Attribution (CC BY) license (https://creativecommons.org/licenses/by/4.0/).