Article

A Novel Optimization Method Using the Box–Behnken Design Integrated with a Back Propagation Neural Network–Genetic Algorithm for Hydrogen Purification

by
Nannan Zhang
1,2,
Sumeng Hu
1,3 and
Qianqian Xin
2,*
1
School of Mechanical Engineering, North China University of Water Resources and Electric Power, Zhengzhou 450045, China
2
School of Automotive Engineering, Wuhan University of Technology, Wuhan 430070, China
3
Ceramic Materials Research Laboratory, Chaozhou Branch of Chemistry and Chemical Engineering Guangdong Laboratory (Hanjiang Laboratory), Chaozhou 521000, China
*
Author to whom correspondence should be addressed.
Appl. Sci. 2025, 15(1), 140; https://doi.org/10.3390/app15010140
Submission received: 22 October 2024 / Revised: 20 December 2024 / Accepted: 23 December 2024 / Published: 27 December 2024
(This article belongs to the Section Energy Science and Technology)

Abstract

:
Pressure swing adsorption (PSA) technology is among the most efficient techniques for purifying and separating hydrogen. A layered adsorption bed composed of activated carbon and zeolite 5A for a gas mixture (H2: 56.4 mol%, CH4: 26.6 mol%, CO: 8.4 mol%, N2: 5.5 mol%, CO2: 3.1 mol%) PSA model was built. The simulation model was validated using breakthrough curves. Then, a six-step PSA cycle model was built, and the purification performance was studied. The Box–Behnken design (BBD) method was utilized in Design Expert software (version 10) to optimize the PSA purification performance. The independent optimization parameters included the adsorption time, the pressure equalization time, and the feed flow rate. Quadratic regression models can be derived to represent the responses of purity and productivity. To explore a better optimization solution, a novel optimization method using machine learning with a back propagation neural network (BPNN) was then proposed, and a kind of heuristic algorithm–genetic algorithm (GA) was introduced to enhance the architecture of the BPNN. The predicted outputs of hydrogen production using two kinds of models based on the BPNN–GA and the BBD method integrated with the BPNN–GA (BBD–BPNN–GA). The findings revealed that the BBD–BPNN–GA model exhibited a mean square error (MSE) of 0.0005, with its R–value correlation coefficient being much closer to 1, while the BPNN–GA model exhibited an MSE of 0.0035. This suggests that the BBD–BPNN–GA model has a better performance, as evidenced by the lower MSE and higher correlation coefficient compared to the BPNN–GA model.

1. Introduction

Hydrogen, a globally clean energy source, is applied in fuel cells. However, currently, the production of hydrogen is mainly conducted using fossil fuels, resulting in mixtures that contain impurities [1]. Various techniques are available for purifying and separating hydrogen [2,3,4,5]. PSA represents a breakthrough technology in the field of gas separation and adsorption, capable of performing adsorption and desorption processes through variations in pressure. The traditional methods and simplified process make it highly suitable for gas separation and purification in industry environments and laboratories [6,7,8]. Freund et al. conducted a comparative analysis of hydrogen separation using PSA and palladium membrane technologies in a polygeneration system for fuel-rich HCCI engines. The results indicated that PSA serves as an excellent method for purifying hydrogen [9].
Achieving optimal purification efficiency in the PSA process is complex, including the steps of selecting adsorbents [10,11], designing adsorption bed structures [12,13], and determining the number of cyclic operation steps [14]. As PSA technology continues to mature and achieve higher accuracy, coupled with the growing demand for efficient PSA separations, developing effective optimization methods has become crucial. Various mathematical models and optimization theories have been employed in an attempt to optimize the PSA process. Rebello and colleagues introduced a novel optimization method for PSA units featuring an optimal Pareto front, effectively balancing the need to maximize productivity while minimizing energy consumption [15]. Subraveti and colleagues developed a unique steam-purge PSA cycle for pre-combustion CO2 capture, using genetic algorithm (GA) optimization to optimize energy consumption while maximizing productivity [16]. Wang and co-authors formulated a graphical approach for optimizing both purification recovery and feed purity, demonstrating that the method can precisely and conveniently optimize both parameters simultaneously [17].
Several studies have explored the optimization and prediction of hydrogen production through the application of response surface methodology (RSM). Tang and colleagues formulated a regression model utilizing RSM and achieved precise predictions for the optimization target [18]. In our preliminary research work, we introduced the Box–Behnken design (BBD) method, which is grounded in RSM, to optimize the PSA model. This approach allowed us to obtain quadratic regression models for the purity, recovery, and productivity of hydrogen, thereby significantly reducing computation time [19]. However, due to complex nonlinear scenarios, using only an RSM quadratic polynomial in the BBD sometimes cannot achieve the required prediction accuracy [20]. In contrast to RSM, artificial neural networks (ANNs) function as mathematical models that mimic the functioning of human neurons, exhibiting excellent prediction capabilities for nonlinear and unrelated data.
As machine learning is widely applied in engineering and science to solve complex problems, the use of ANNs can significantly cut down the computational time and empower the execution of more intricate optimization tasks. To investigate the efficacy of ANN models, Tahir and colleagues conducted a comparison between Bayesian regularization and ANN algorithms. The findings reveal that ANN models are particularly adept at validating and comparing with process models, demonstrating their precision and potential in optimizing biomass gasification processes, with an impressive R2 value of 0.99 [21]. Yu and colleagues designed an ANN model aimed at optimizing the efficiency of the PSA process for generating high-purity hydrogen. Their findings suggest that the ANN could accurately simulate dynamic PSA behavior and performance [22]. Streb and colleagues used an ANN as an alternative model for optimizing VPSA, achieving the integration of H2 purification and CO2 capture. The results showed good performance in the constraint optimization of H2 separation [23].
ANNs have the advantage of not requiring previously specified appropriate fitting functions and the capability for universal approximation, enabling them to closely approximate a wide range of nonlinear functions, such as quadratic functions. Nonetheless, ANNs have certain limitations, as they are unable to ensure globally optimal solutions. To overcome this limitation, researchers have explored integrating ANNs with other techniques to enhance performance. Kani and Ghahremani [24] implemented a hybrid method for heat pipes, using Bayesian techniques and GAs to refine the structure of ANN models and identify the optimal operating point. The findings indicated that the introduced model was capable of decreasing operational and maintenance expenses. Numerous studies have shown that optimizing ANN models through the application of heuristic approaches (like genetic algorithms) and statistical methods (like Bayesian techniques) can elevate the accuracy and precision of their predictions. However, the computational process of ANNs operates as a “black box”, rendering the observation of intermediate results unfeasible. Given the constraints associated with RSM and ANN methods, this work introduces a novel approach. In this work, a frequently utilized ANN model, known as the back propagation neural network (BPNN), was selected. Subsequently, a BPNN structure, optimized through the use of a GA (referred to as BPNN–GA), was designed for the PSA process. Furthermore, a novel optimization model was developed, which integrates the BBD with BPNN–GA (termed BBD–BPNN–GA), to further enhance the hydrogen purification performance of the PSA process.
In this work, a dynamic adsorption model was established using Aspen Adsorption software (version V9). The adsorption column was packed with a blend of activated carbon and zeolite 5A as adsorbent. A mixture gas as used: H2: 56.4 mol%, CH4: 26.6 mol%, CO: 8.4 mol%, N2: 5.5 mol%, CO2: 0.1 mol%. The breakthrough curves were validated against experimental data sourced from reference [25]. To ascertain the ideal operating conditions for purification performance, a six-step PSA cycle model was implemented. Quadratic regression equations between purification performance indicators—namely, hydrogen purity and productivity—and operating parameters were established using the BBD method. However, due to the complex, nonlinear nature of the system, the desired prediction accuracy could not always be achieved solely with the BBD quadratic polynomial in limiting cases. The primary objective of this work was to identify the optimal neural network architecture based on the BPNN–GA model. The secondary objective was to compare different approaches for optimizing operating conditions. Experimental data generated from the BBD were integrated with the BPNN–GA to form the BBD–BPNN–GA model, which was used for predicting and optimizing the PSA process. In this work, the optimization of purification conditions was conducted using both the BPNN–GA model and the integrated BBD–BPNN–GA model.

2. Materials and Methods

2.1. Mathematical Model for PSA Process

To accurately depict the adsorption process, it is necessary to formulate equations for mass balance, energy balance, momentum balance, and adsorption isotherms. The mathematical models refer to reference [26].
The mass balance for the bulk phase within the column consists of two components: for individual components and for the overall mass balance.
D L 2 y i z 2 + y i t + u z y i z + R T p 1 ε b ε b ρ p q i t y i j = 1 N q j t = 0 ,   i = 1 , , N ,
D L 2 p z 2 + p t + p u z + u z p z p T D L 2 T z 2 + T t + u z T z + 1 ε b ε b ρ p R T j = 1 N q j t = 0 ,
where D L represents the axial dispersion coefficient; u z represents the axial physical velocity; y i denotes the molar fraction of species i ; q i denotes the concentration of adsorbed phase of species i ; ε b represents the interparticle void fraction; ρ p represents the adsorbent pellet density; R is the gas constant; T represents the temperature within the adsorption bed; P represents pressure in the adsorption bed; t represent the time; z is the axial position in the adsorption bed.
The energy balance consists of two components in a PSA system: the energy balance between the gas and solid phases during adsorption process, and the energy balance at the wall of the adsorption bed.
K L 2 T z 2 + ε t ρ g C p g + ρ b C p s T t + ρ g C p g ε b u z T z ρ b i N Q i q i t + 2 h i R b i T T w = 0
ρ w C p w A w T w t = 2 π R b i h i T T w 2 π R b o h o T w T a t m ,
A w = π R b o 2 R b i 2
The axial dispersion coefficient of thermal is denoted by K L ; C p g is the heat capacity of gas phase; C p s is the specific heat capacity of adsorbent; ε t and ε b are the total and the interparticle void fraction, respectively; Q i is the heat adsorption for species i ; h i and h o are, respectively, the coefficient of heat transfer of inner wall and outer wall; T w and T a t m are, respectively, the wall and the ambient temperature; R b i and R b o are, respectively, the inside radius and outside radius of adsorption column.
Drawing from the work in [27], the momentum balance is calculated using Ergun’s equation:
d p d z = a μ υ z + b ρ υ z υ ,
where the coefficients a and b are determined by the following equations:
a = 150 4 R p 2 1 ε b 2 ε b 3
b = 1.75 1 ε b 2 R p ε b 3 .
where μ represents the dynamic viscosity; υ z is the Darcy’s velocity; R p stands for the radius of the particle.
In this study, the extended Langmuir–Freundlich (L–F) model is employed to describe the adsorption isotherms:
q i = q m i B i p i n i 1 + j = 1 N B j p j n j ,   i = 1 , , N ,
where q i represents the equilibrium concentration of absorbed phase; q m i   a n d   B i are the isotherm parameters of extended L–F model; p i is the partial pressure of species i .
The isotherm parameters can be expressed as follows:
q m = k 1 + k 2 T , B = k 3 e k 4 T
n = k 5 + k 6 T .

2.2. BBD Method for PSA Process

Within the predefined experimental design space, the response surface methodology (RSM) allows for the identification of the optimal combination of factors and their corresponding responses. RSM designs include Box–Behnken design (BBD) and the central composite design (CCD). Notably, BBD requires fewer experimental groups compared to CCD under identical factorial conditions, making it a more cost-effective and efficient option. Additionally, BBD is frequently employed for predicting nonlinear models [28,29]. As a specific type of response surface methodology, BBD provides comprehensive equations to describe the relationship between factors and responses [30]. In this study, BBD was implemented using Design Expert software (version 10) to establish a correlation between PSA performance and operating parameters, with the objective of determining the optimal operating parameters for hydrogen purification.
For the BBD method, a one-factor design was initially employed to determine the range of independent variables. In this setup, the independent optimization parameters are coded as “–1”, “0”, and “+1” to represent the levels of each factor. Desirability is used as the objective function, which ranges from 0 (indicating non-compliance) to 1 (indicating full compliance). A desirability value of 1 corresponds to the optimal scenario, whereas a value of 0 signifies that one or more responses fail to meet the desired criteria. The overall desirability (D) and the desirability for each individual response (di) are defined as follows:
D = d 1 × d 2 × × d n 1 n = i = 1 n d i 1 n ,
d i = y i L T L w ,
where n represents the number of responses, T is the maximum possible values of responses, L is the minimum possible values of responses, w represents the weight, and yi represents the optimal value of each response.

2.3. BPNN–GA for Optimization

ANNs represent a machine learning technique that mimics the architecture of the human brain. They are commonly well-suited for estimating or approximating complex functions that depend on a large number of input variables, especially when these functions are not explicitly defined. In this study, a BPNN is employed to predict and optimize the performance of PSA. Figure 1 illustrates the architecture of the BPNN.
Despite the fact that the BPNN possesses robust nonlinear mapping capabilities, it does not guarantee a globally optimal solution. Consequently, this work introduces GA as an efficient and cost-effective approach to address the optimization problem. The procedure of optimizing the BPNN using a GA is depicted in Figure 2.

3. Results

3.1. Simulation PSA Process

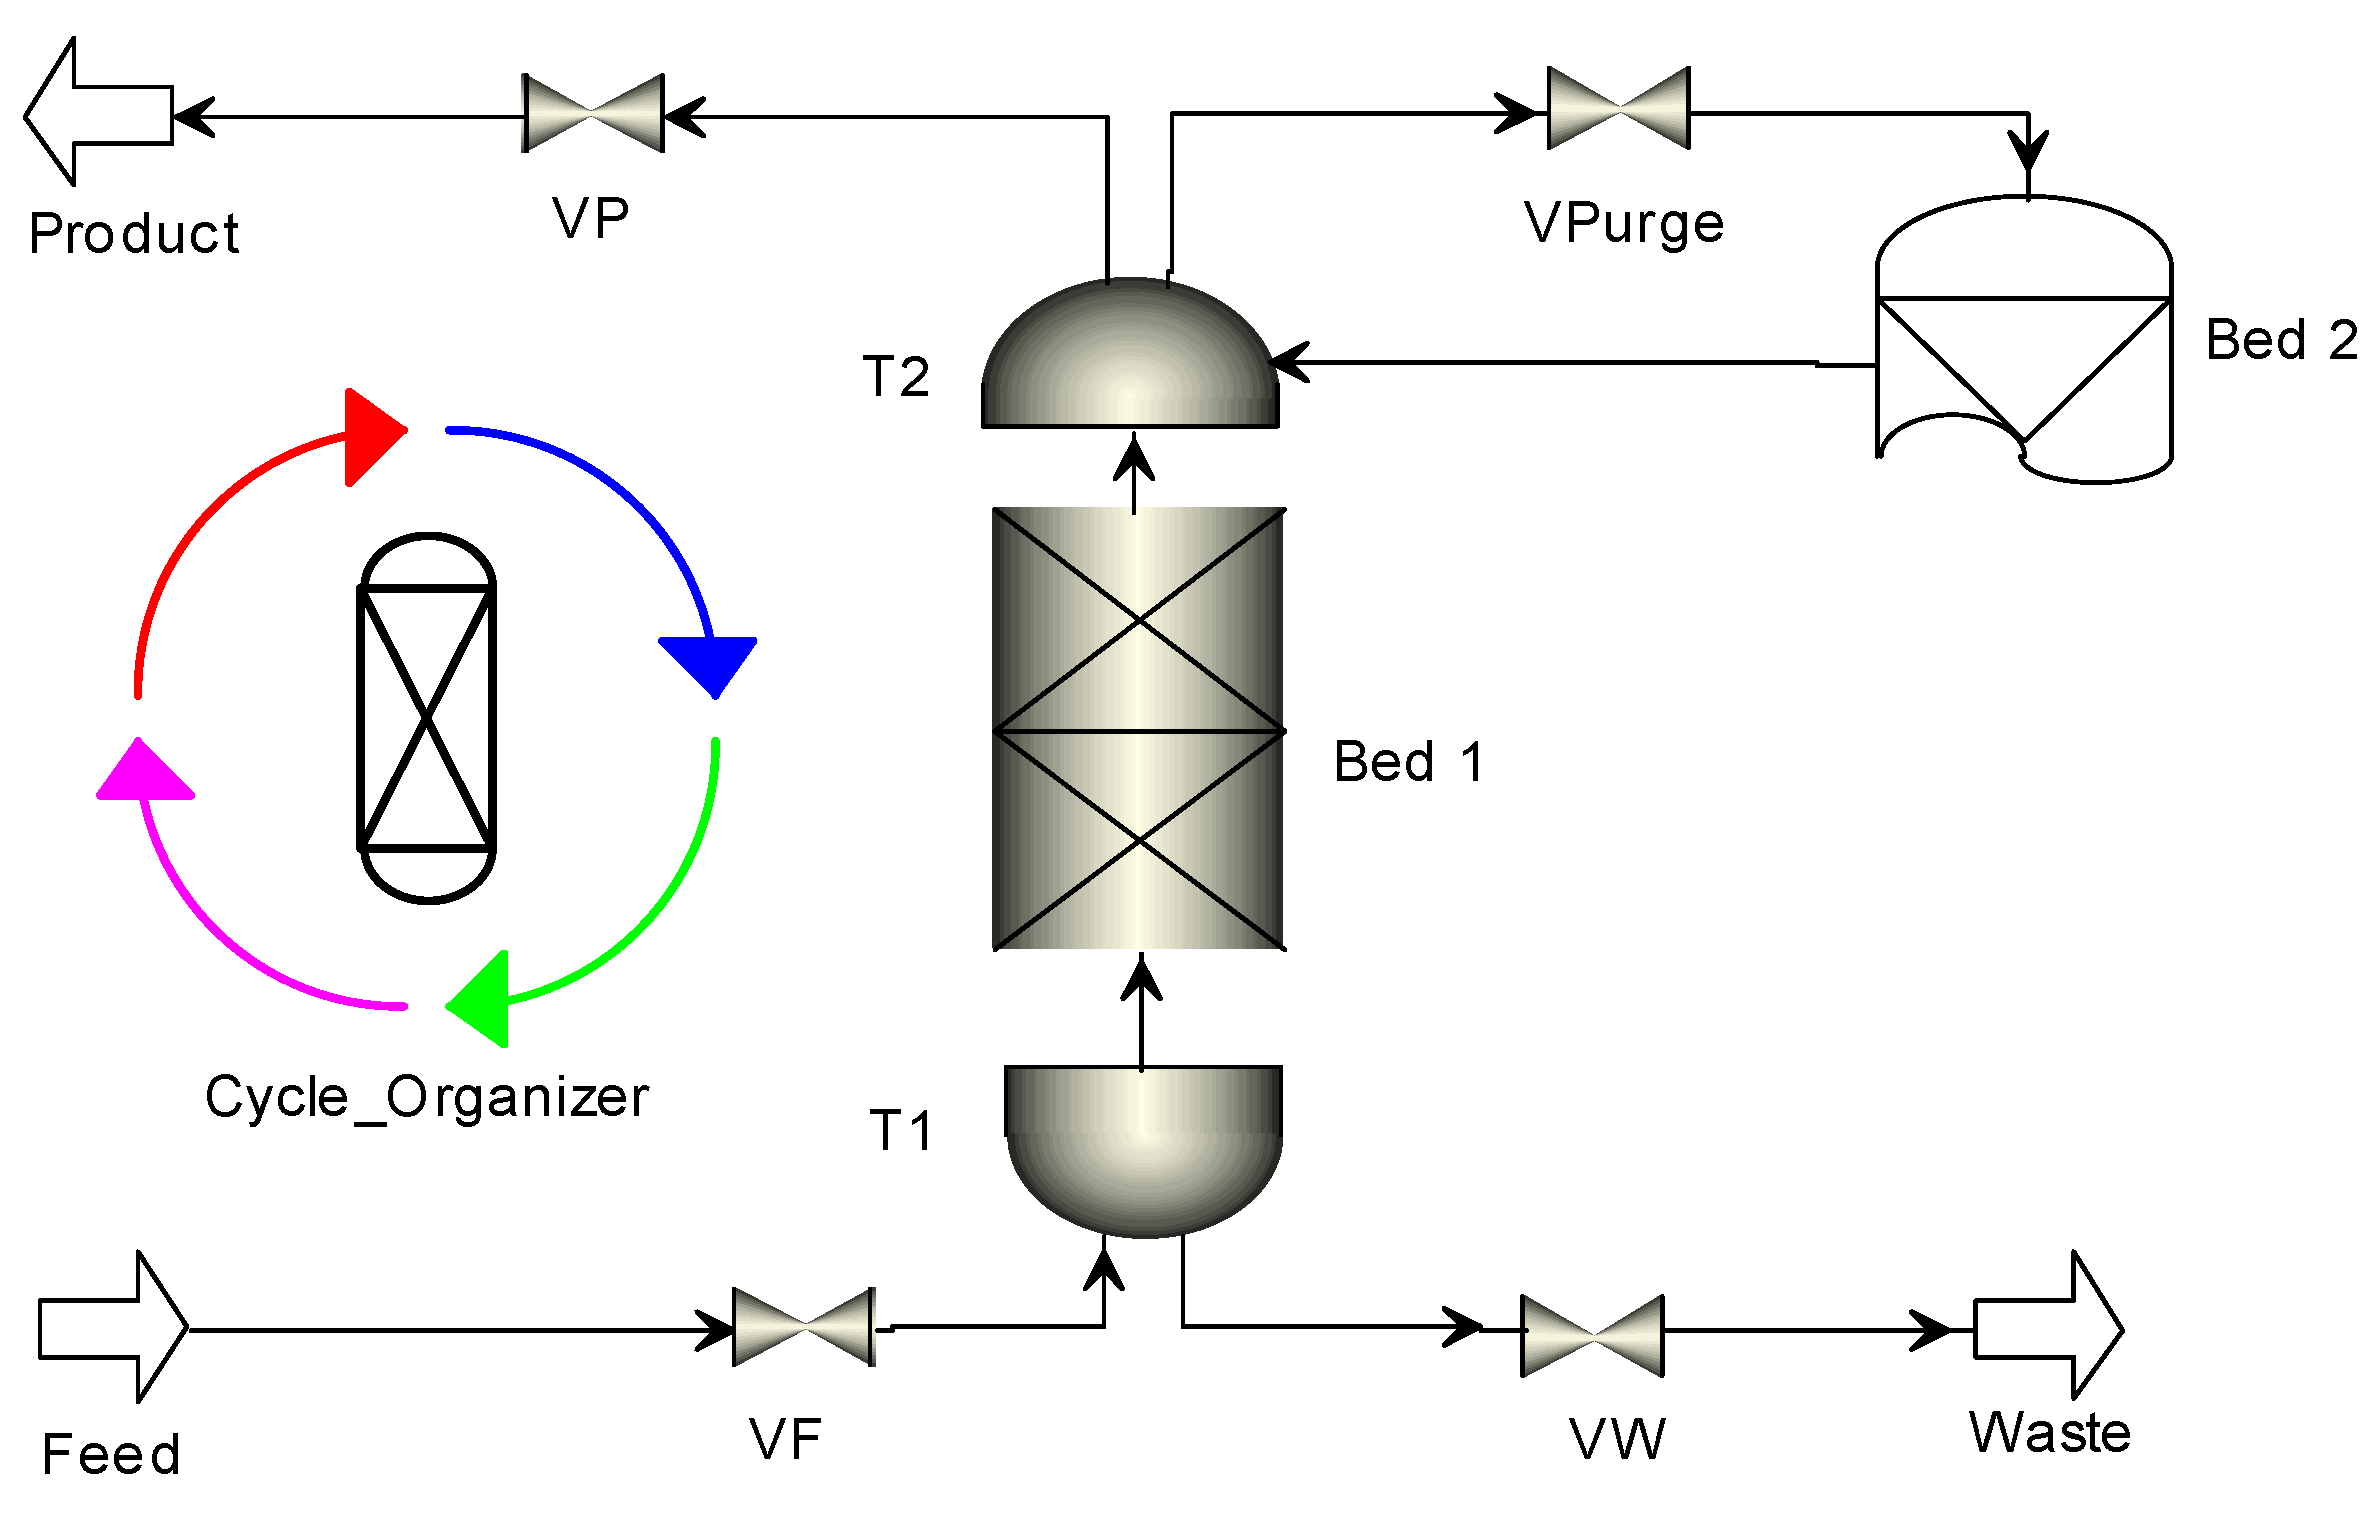
The PSA model was developed in previous research [19], with material characteristics and PSA cycle parameters obtained from studies [25,31,32,33]. Figure 3 illustrates the simulation PSA process in Aspen Adsorption software (version V9).
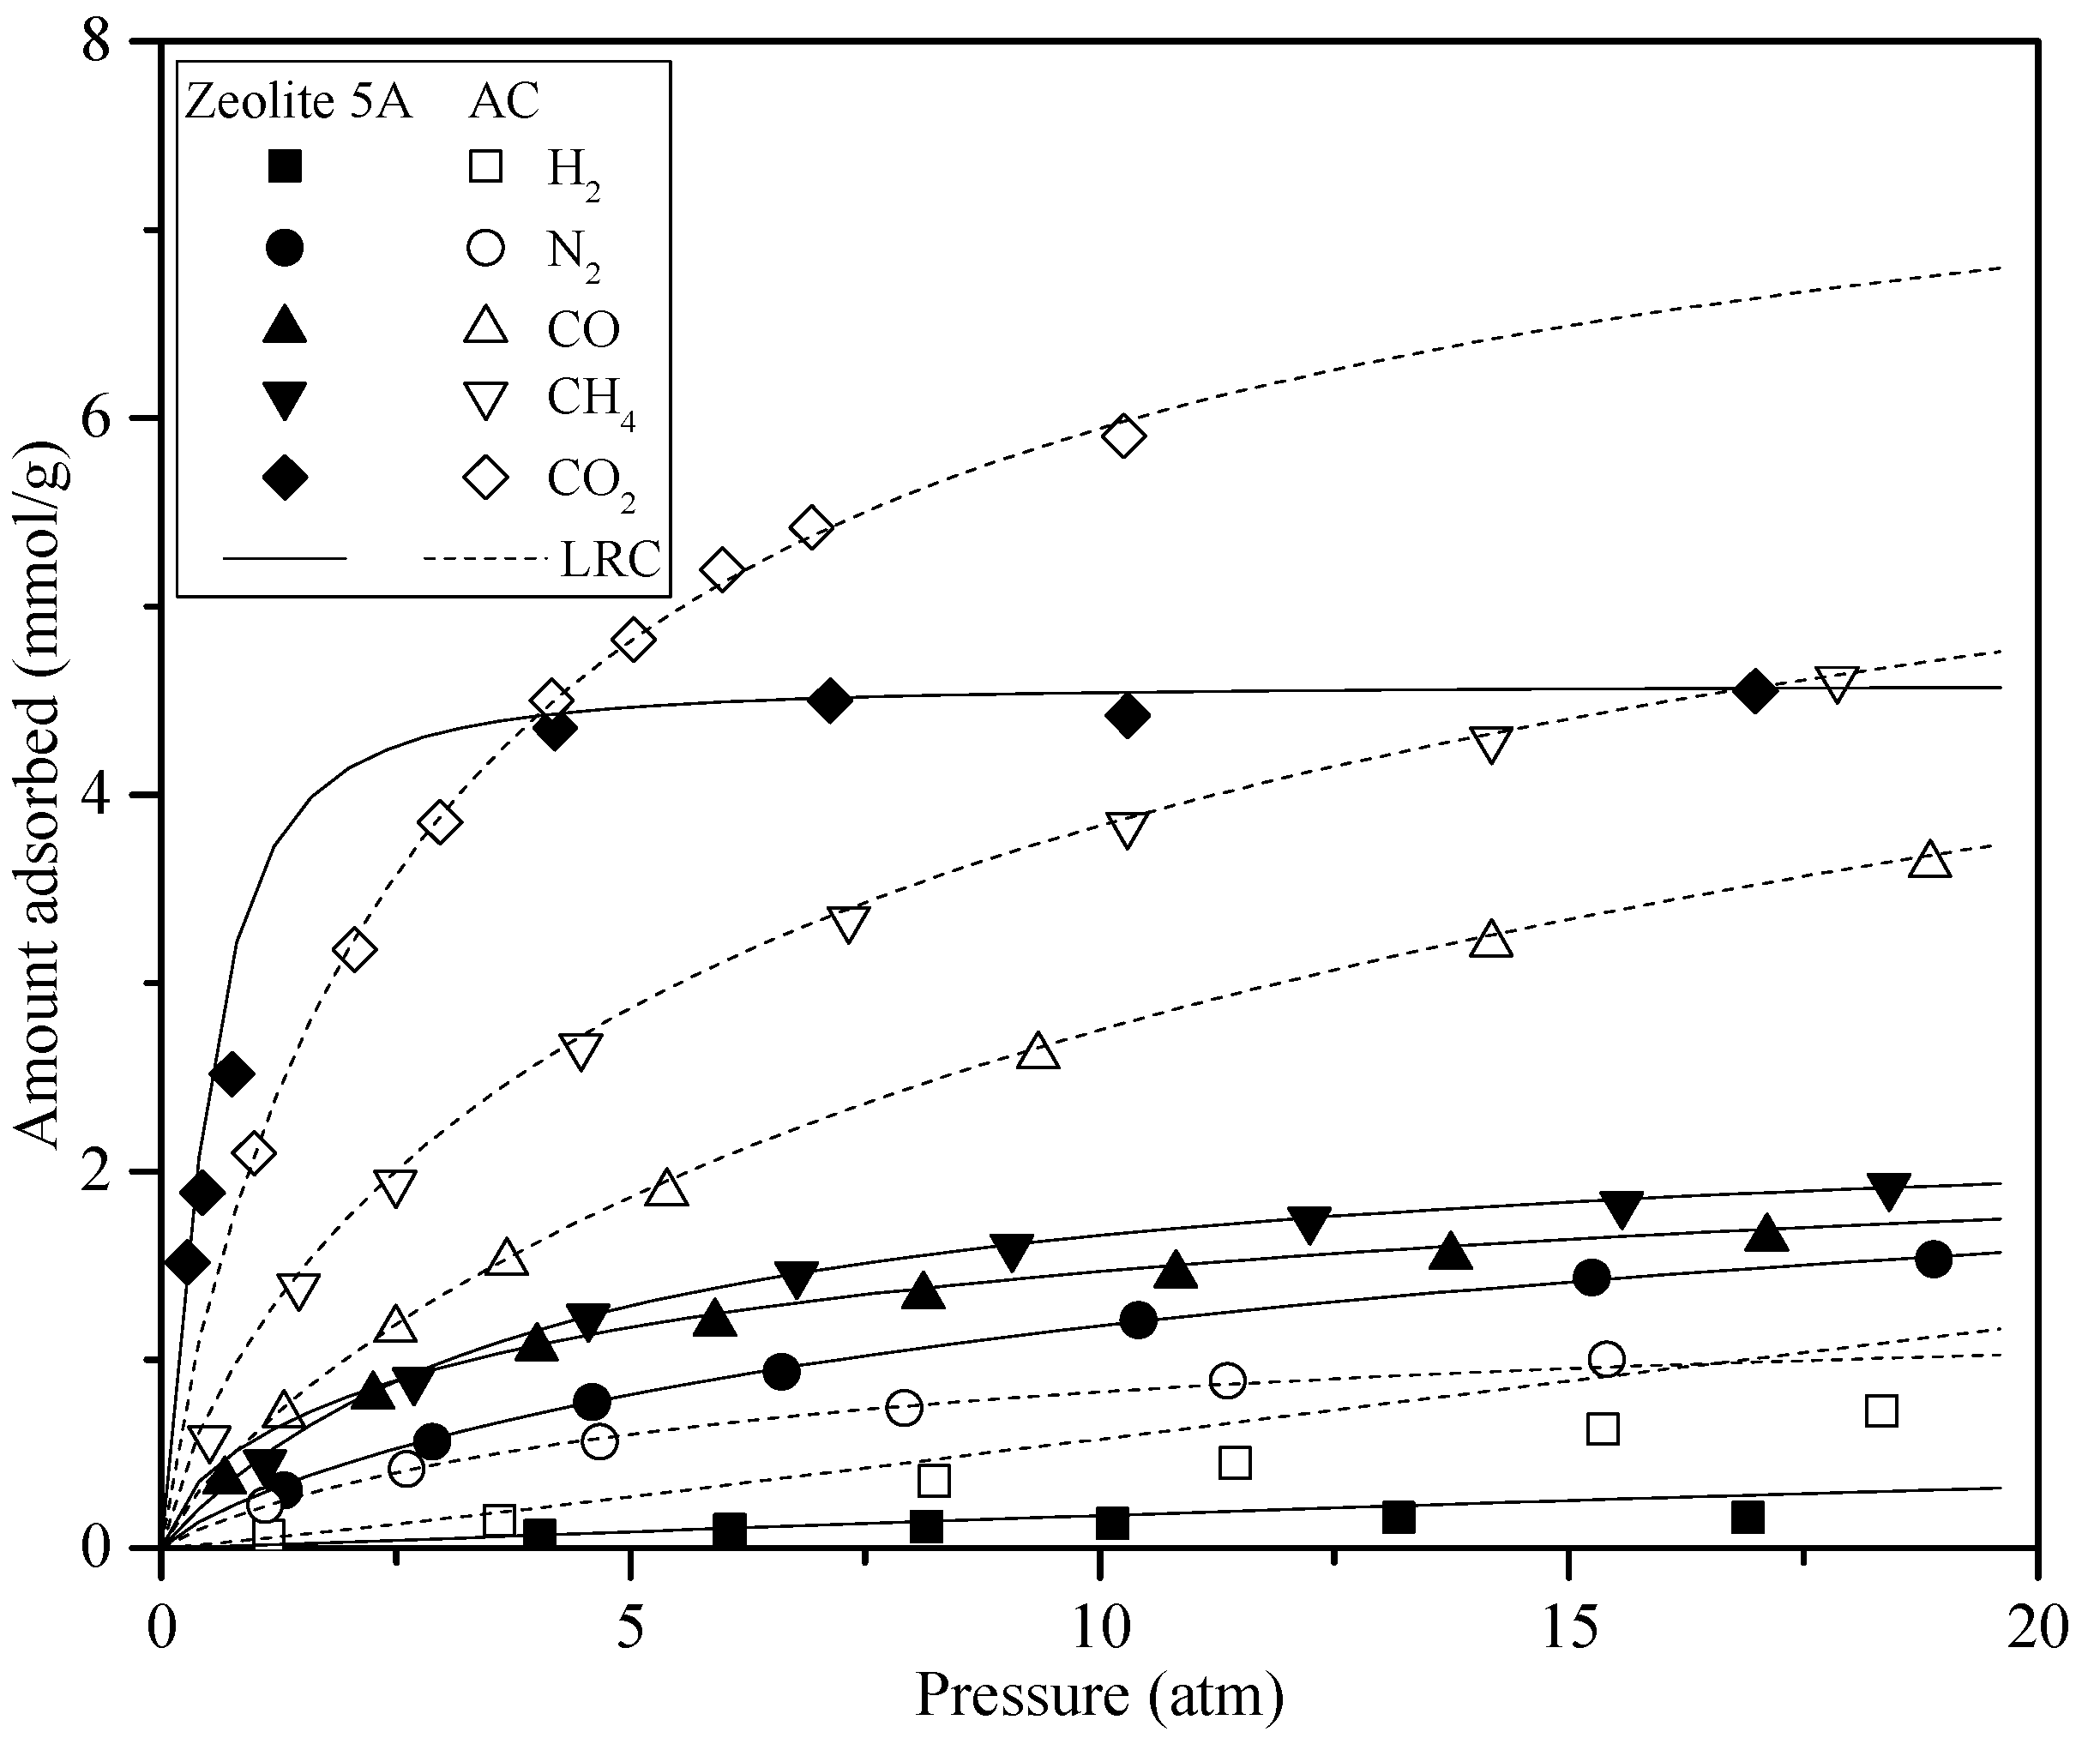
The adsorption isotherms of the mixture gas and breakthrough curves were simulated and subsequently compared with the experimental data to validate the PSA simulation model. Figure 4 demonstrates that the adsorption parameters accurately reflect the experimental data (sourced from [25]), suggesting that the extended L–F model can be effectively applied to predict breakthrough curves in this work. The breakthrough curves were then simulated and compared with experimental data provided by Ahn et al. [25]. Figure 5 displays the simulated (lines) and experimental (symbols) breakthrough curves for a layered adsorption bed with a 0.65 carbon-to-zeolite ratio, an 8.6 L/min feed flow rate, and an adsorption pressure of 10 atm. As Figure 5 shows, the simulations show good agreement with the experimental data, thereby confirming the validity of both the proposed model and the application of the extended L–F isotherm.
After validating the breakthrough models, we implemented a six-step PSA cycle in Aspen Adsorption. The cyclic sequences of the layered bed PSA process are given in Table 1. The simulated PSA process for hydrogen purification followed this cyclic sequence: Step I involved high-pressure adsorption (AD); Step II involved a depressurizing pressure equalization (DPE); Step III involved a concurrent depressurization (DP); Step IV involved purging with H2 product (PG); Step V involved a pressurizing pressure equalization (PPE); Step VI involved a pressurization with feed gas (FP) [25]. Figure 6 depicts the molar fraction of H2 throughout a complete cycle, highlighting that the majority of the H2 product is obtained during Step I.

3.2. Prediction by BBD Method

The BBD method was employed within the Design Expert software (version 10) to establish the relationship between the performance and operating parameters of a PSA system, with the objective of identifying the optimal conditions for the system. In the PSA process, the adsorption duration determines the overall cycle time, which is closely associated with the breakthrough point, where impurities reach the end of column. The ideal adsorption time is influenced by factors such as the adsorber’s bed length and operating conditions [34,35]. Park and colleagues emphasized the importance of incorporating a pressure-equalization step to enhance the purity both of H2 and CO2 [36]. Consequently, in this work, the adsorption time, feed flow rate, and pressure equalization time were selected as independent factors for the BBD design. The system responses of interest were hydrogen purity and productivity. For the BBD method, a one–factor design was used first to define the range of independent factors. Each factor was coded as “–1”, “0”, or “+1”, corresponding to low, center point, and high levels, respectively, as detailed in Table 2. Based on statistical analysis and experimental data, the BBD method was employed, and quadratic regression equations can be obtained.
Through the analysis, quadratic regression models were derived to describe the relationships between hydrogen purity and productivity:
p u r i t y = 85.26 + 0.15 A 0.09 B + 0.70 C 7.11 × 10 5 A B 3.47 × 10 3 A C + 0.01 B C 3.59 × 10 4 A 2 + 7.97 × 10 4 B 2 0.03 C 2
p r o d u c t i v i t y = 9.86 0.21 A + 0.23 B + 2.43 C + 3.28 × 10 4 A B + 6.98 × 10 4 A C 0.03 B C + 5.73 × 10 4 A 2 2.53 × 10 3 B 2 0.05 C 2
where A is adsorption time, B is pressure equalization time, and C is feed flow rate.
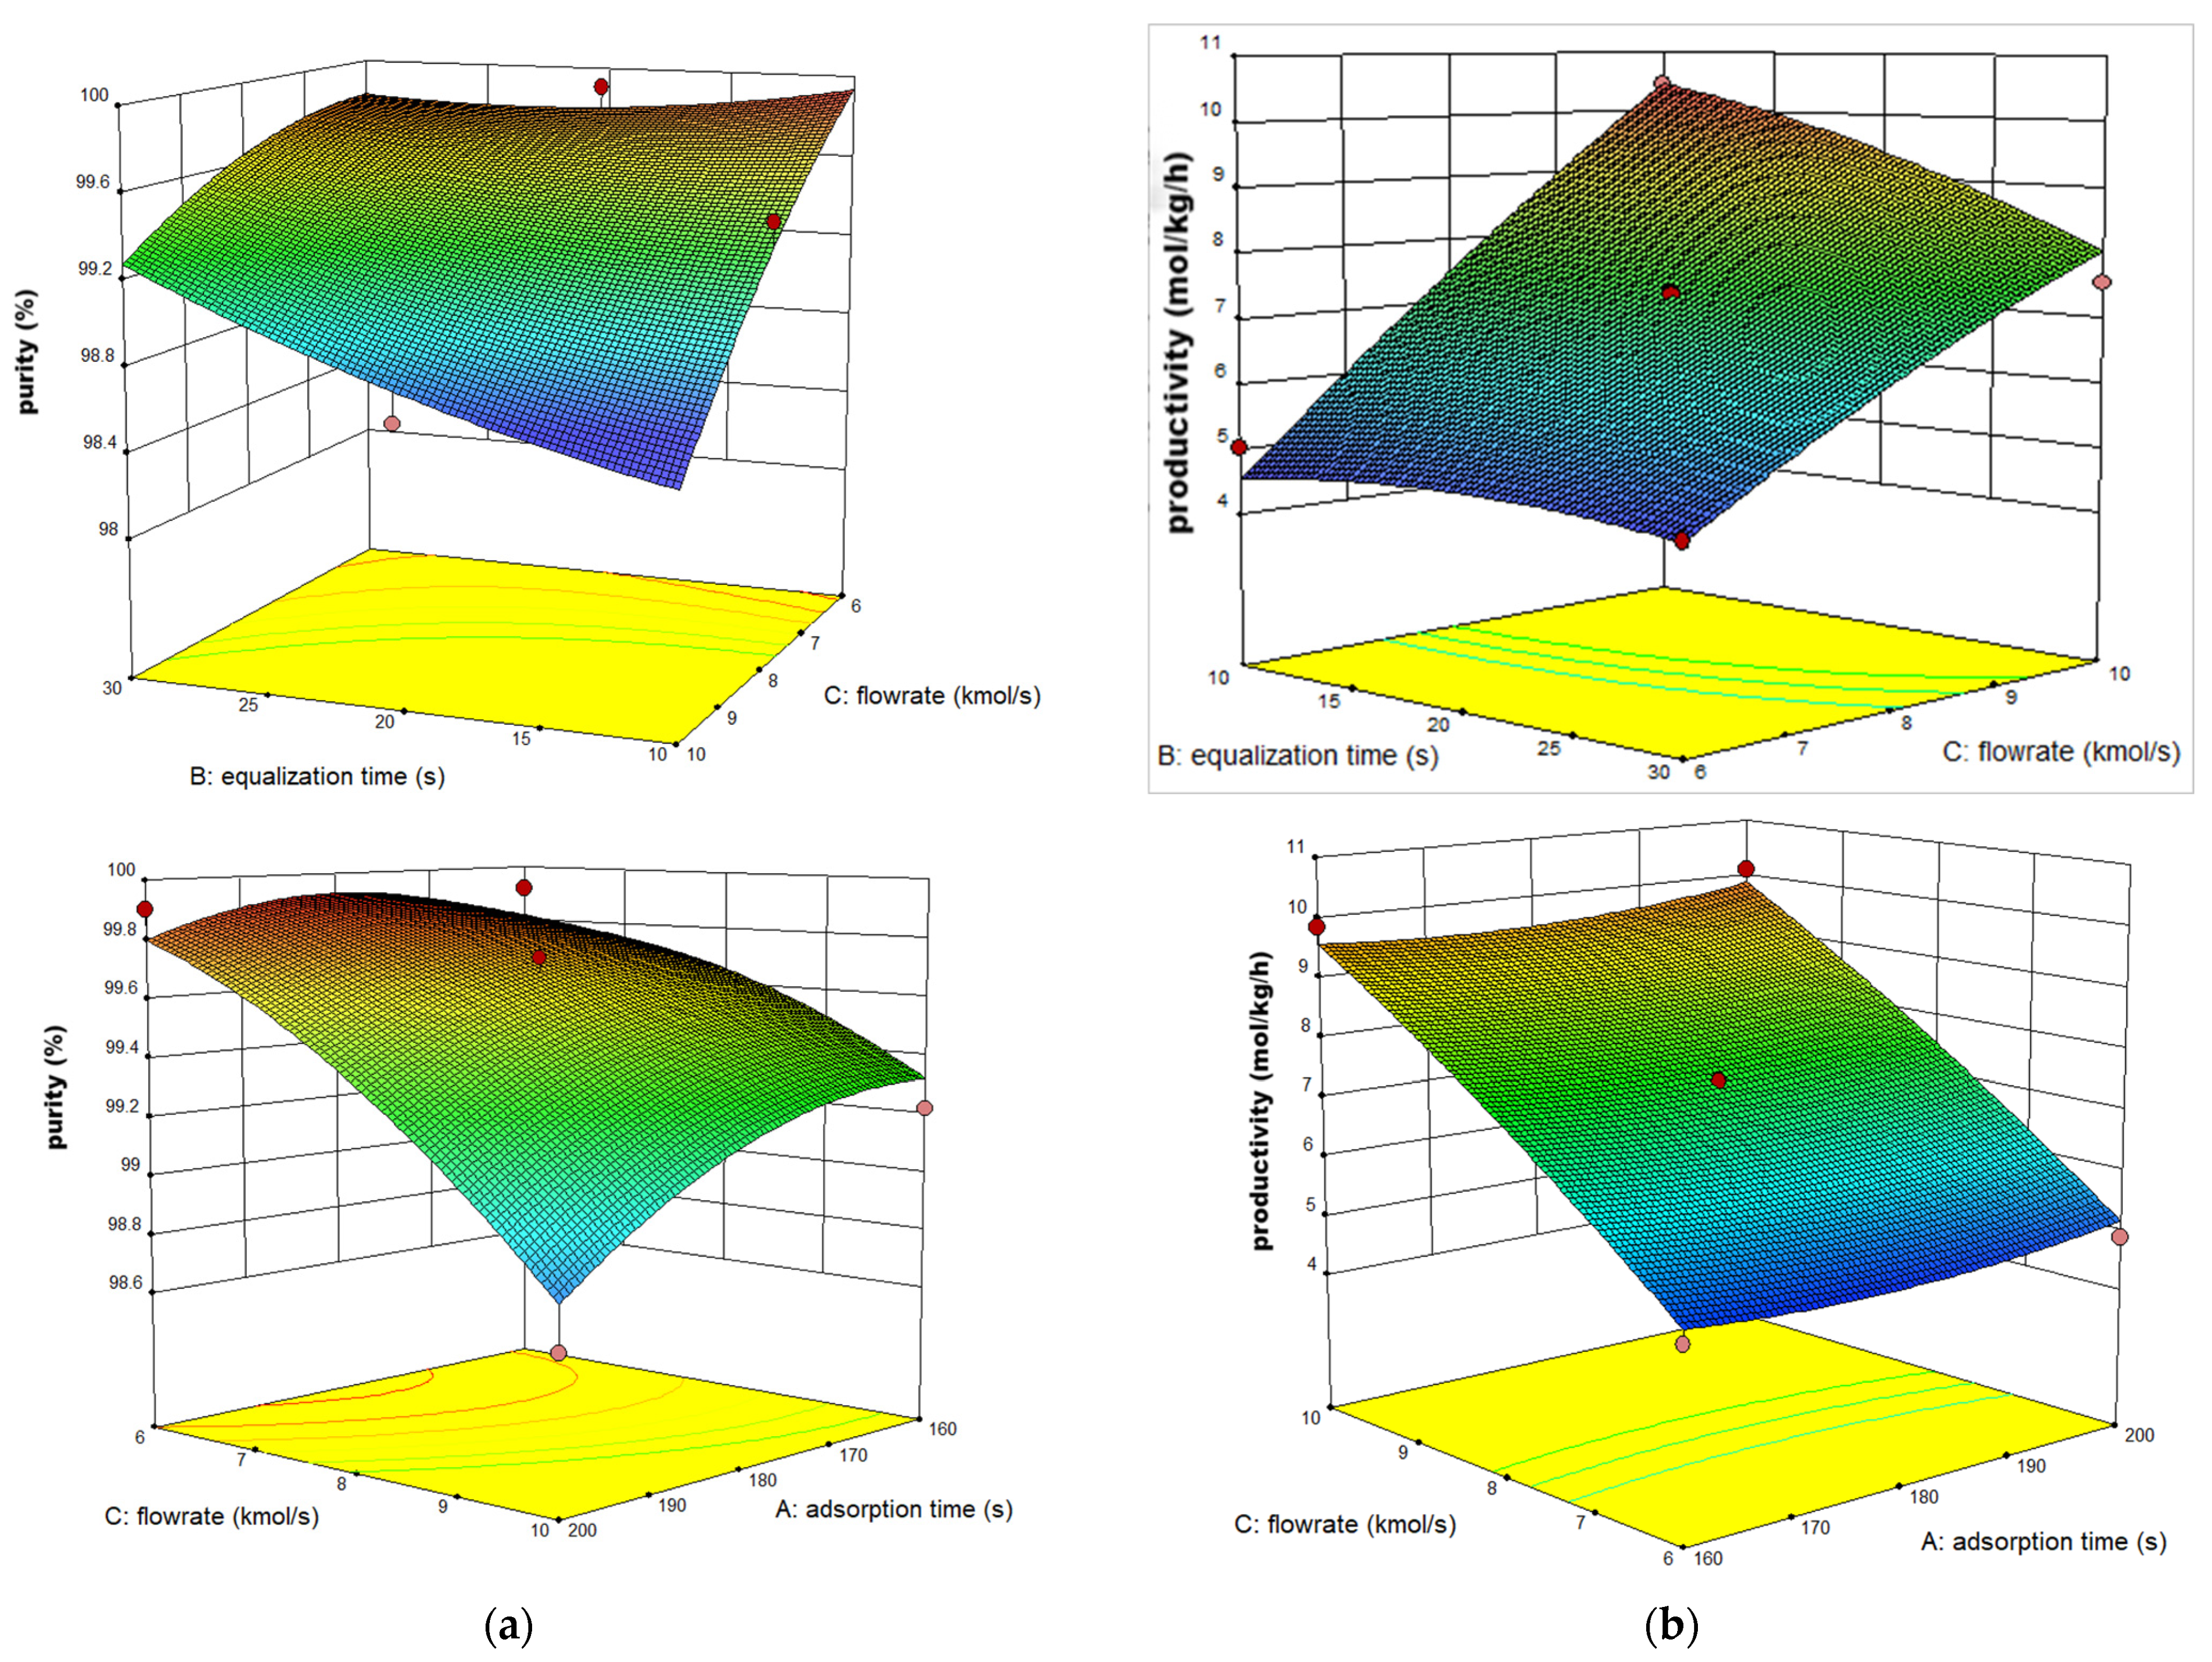
Figure 7 presents 3D response surface plots illustrating the effects of adsorption time, feed flow rate, and pressure equalization time on hydrogen purity (a) and productivity (b). The results indicated that, at a feed flow rate of 8 L/min, hydrogen purity increases with decreasing adsorption time and increasing pressure equalization time. Conversely, productivity increases as pressure equalization time decreases and adsorption time increases. When the adsorption time is 180 s, hydrogen purity increases as the feed flow rate decreases and the pressure equalization time increases. Meanwhile, productivity increases with both an increase in pressure equalization time and feed flow rate. At a pressure equalization time of 20 s, hydrogen purity increases as adsorption time decreases and feed flow rate increases. In this case, productivity also increases when both adsorption time and feed flow rate are increased.

3.3. Prediction by BPNN–GA Model

To evaluate and compare the optimization performances of the BPNN–GA model and the integrated BBD–BPNN–GA model. Initially, the BPNN–GA architecture was employed to predict the performance of PSA. In this model, the inputs parameters included adsorption time, feed flow rate, and pressure equalization time, while the outputs included hydrogen purity and productivity.
Figure 2 presents a flowchart illustrating the procedure of the BPNN–GA model, where the BPNN component is highlighted by the black frame on the right. The procedure can be divided into three main parts. First, the structure of the BPNN is established based on predefined inputs and outputs, and the initial weights and bias values of the neural network are initialized. Second, a GA is introduced to optimize these parameters, resulting in optimal initial weights and bias values for the BPNN. Finally, training and prediction are conducted using an existing database with the optimized BPNN–GA model. The operational procedure of the BPNN–GA primarily consists of population initialization, fitness function calculation, and genetic operator execution. The objective of using the BPNN–GA approach is to improve the accuracy and performance of the model by optimizing the initial weights and bias values.
A total of 130 datasets were utilized for training the neural network. These datasets were partitioned into three segments randomly: 80% for the training set, 10% for the validation set, and 10% for the test set. The training set serves as the primary data for model learning and optimization. The validation set is employed to prematurely terminate training if the performance of network fails to improve or plateaus over several epochs. Meanwhile, the test set is dedicated to evaluating the network’s generalization performance, independently of the training process. The test error is utilized as a metric for assessing the performance of the BPNN–GA. Due to convergence issues arising from using raw experimental data as input, data preprocessing is conducted. This involves normalizing the data using the min–max normalization technique, which scales the data to the range [–1, 1]. This normalization step enhances the efficiency of neural network training. At the conclusion of each algorithm, the outputs are denormalized back to their original data format to obtain the desired results [37].
Figure 8 illustrates the fluctuation of mean square error (MSE) for the training and validation set over various epochs. Initially, the MSE declines rapidly, but as the number of epochs increases, the rate of decline slows down. The MSE reaches its minimum validation value of 0.0035 at epoch 5, prompting the termination of the training process. In Figure 9, the actual values from Aspen and the predicted values generated by BPNN–GA model are compared. The R-value, also known as the correlation coefficient, is utilized to quantify the correlation. An R-value closer to 1 indicates a higher accuracy of the BPNN–GA predictions. Figure 10 displays the R-values for the training, validation, test, and overall sets, comparing the predicted outputs of the BPNN–GA model with the actual outputs from the Aspen model. The results indicate that, despite some errors, the BPNN–GA model can be effectively utilized for predicting and optimizing the PSA process.

3.4. Prediction by BBD–BPNN–GA Model

In this work, the BBD method is utilized to enhance the predictive accuracy of the BPNN–GA model. A total of 100 datasets from the PSA process are employed to develop the integrated BBD–BPNN–GA model.
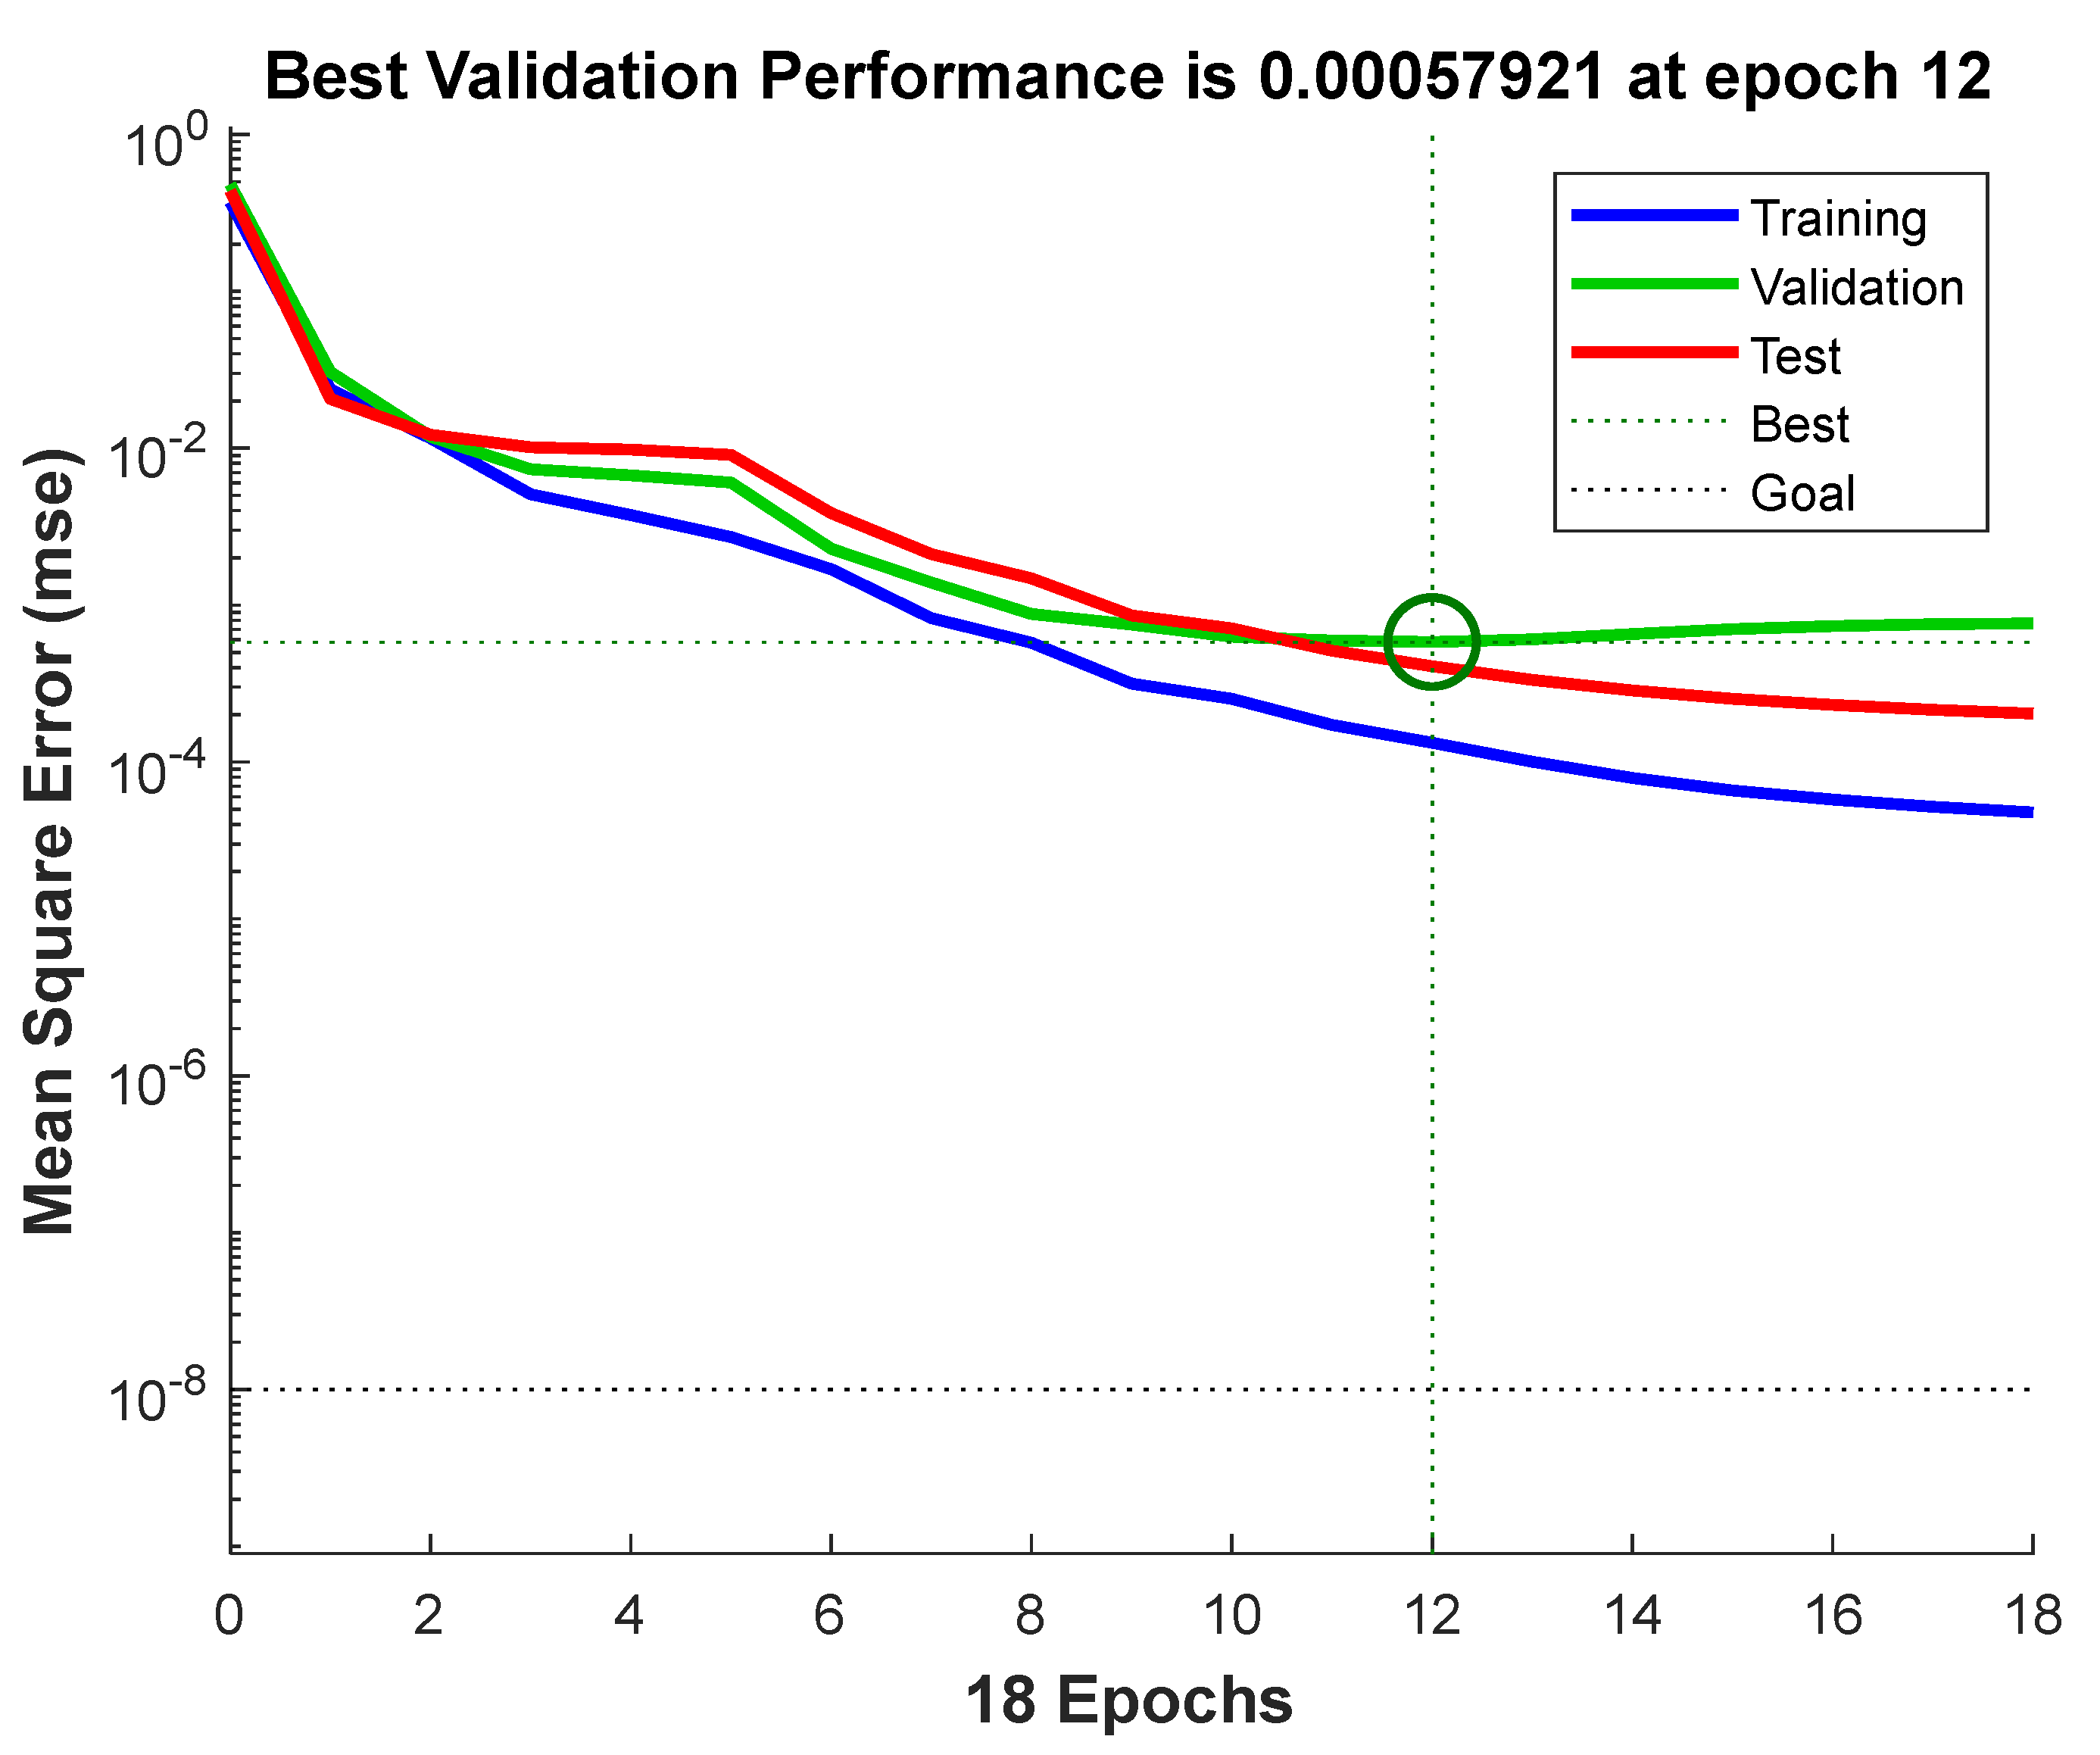
Figure 11 depicts the MSE of the BBD–BPNN–GA mdoel. At epoch 12, the model achieves an optimal validation MSE of 0.0005, which is notably lower than the MSE of 0.0035 observed for the BPNN–GA model. Indicating that the BBD–BPNN–GA model is capable of identifying weights and biases closer to the global optimum, thereby reducing prediction errors. Consequently, the BBD–BPNN–GA model exhibits superior predictive performance for the PSA process.
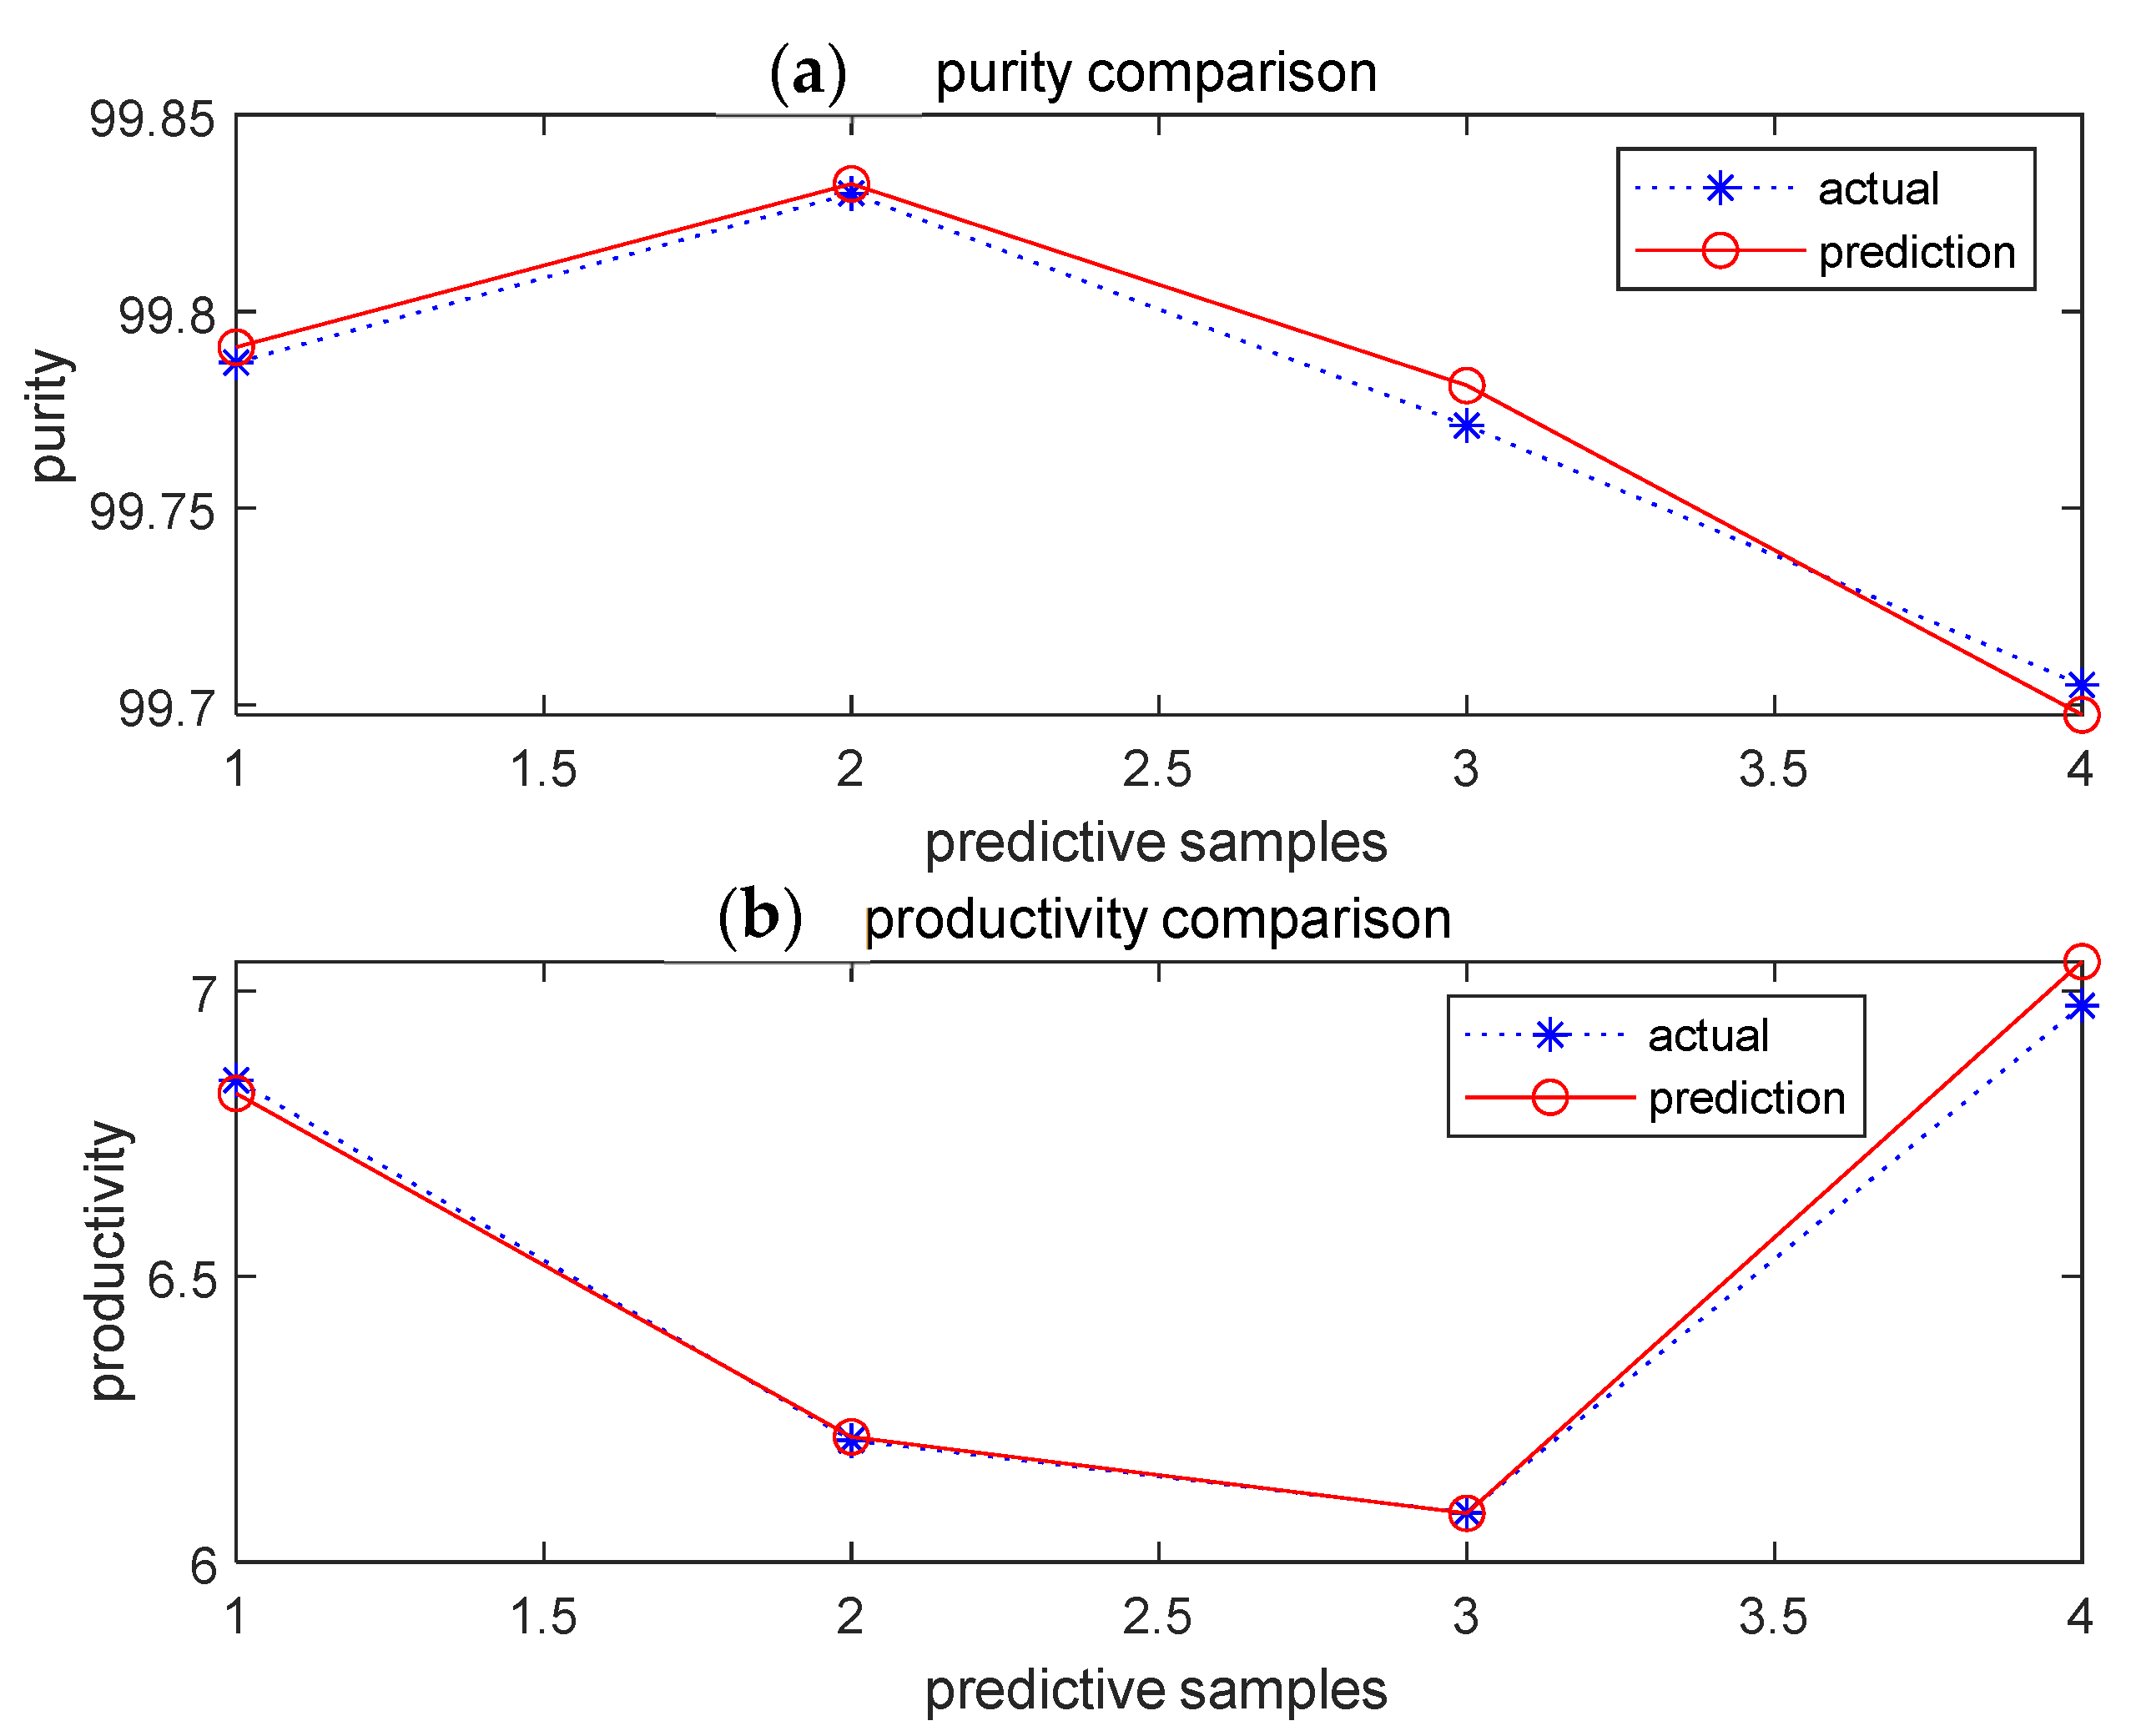
Figure 12 presents a comparison between the actual values of the Aspen model and the predicted values of the integrated BBD–BPNN–GA model. It is evident that, compared to the BPNN–GA model, the integrated model demonstrates better predictive performance, with predictions that correspond closely with the actual values. This further confirms that the integrated BBD–BPNN–GA model can accurately predict PSA performance.
The R-values of the BBD–BPNN–GA model are illustrated in Figure 13. As shown, the R-values of all four sets exceeded 0.99. In contrast, the R-values for the BPNN–GA for the corresponding sets are 0.97678, 0.97668, 0.98846, and 0.97868, respectively. A higher R-value signifies a stronger linear relationship between the predicted and actual values, indicating higher prediction accuracy. The results clearly demonstrate that the predictive performance of the integrated model is superior to that of the traditional model.

4. Conclusions

In this work, a mixture gas with H2: 56.4 mol%, CH4: 26.6 mol%, CO: 8.4 mol%, N2: 5.5 mol%, CO2: 3.1 mol% was used. Breakthrough curves for the flow through a layered bed filled with activated carbon and zeolite 5A were designed and executed. The results showed that the model predictions were in good agreement with the experimental data. To estimate the hydrogen purification performance of the layered bed, a six-step PSA cycle was implemented in Aspen Adsorption, using purity and productivity as response functions. Quadratic regression equations were established between the response variables (hydrogen purity and productivity) and factors (adsorption time, feed flow rate, and pressure equalization time) using the BBD method. Due to the limitations of the BBD method, an integrated BBD–BPNN–GA approach was proposed to optimize purification performance. Firstly, the optimal neural network architecture was determined based on the BPNN–GA model. Then, the integrated BBD–BPNN–GA model was used for predicting and optimizing the PSA process. A comparison of the optimization results from both approaches revealed that the MSE of the BBD–BPNN–GA model is 0.0005 with R-values closer to 1; compared to the MSE of 0.0035 for the BPNN–GA model, this exhibited superior performance. This demonstrates that the BBD–BPNN–GA model can be efficiently applied to predict PSA purification performance.

Author Contributions

Software, N.Z.; writing—original draft preparation, N.Z.; writing—review and editing, N.Z., S.H. and Q.X.; project administration, N.Z.; funding acquisition, N.Z. All authors have read and agreed to the published version of the manuscript.

Funding

This research was funded by Henan Province of Science and Technology Project, grant number 242102240074, Henan Province Key Scientific Research Project Plan for Colleges and Universities, grant number 24A430025 and The APC was funded by Henan Province of Science and Technology Project.

Institutional Review Board Statement

Not applicable.

Informed Consent Statement

Not applicable.

Data Availability Statement

The datasets used and analyzed during the current study are available from the corresponding author on reasonable request.

Conflicts of Interest

The authors declare no conflicts of interest.

References

  1. Xie, X.Y.; Awad, O.I.; Xie, L.L.; Ge, Z.Y. Purification of hydrogen as green energy with pressure-vacuum swing adsorption (PVSA) with a two-layers adsorption bed using activated carbon and zeolite as adsorbent. Chemosphere 2023, 338, 139347. [Google Scholar] [CrossRef] [PubMed]
  2. Golmakani, A.; Fatemi, S.; Tamnanloo, J. Investigating PSA, VSA, and TSA methods in SMR unit of refineries for hydrogen production with fuel cell specification. Sep. Purif. Technol. 2017, 176, 73–91. [Google Scholar] [CrossRef]
  3. Kumar, A.; Muthukumar, P. Experimental investigation on hydrogen transfer in coupled metal hydride reactors for multistage hydrogen purification application. Appl. Energy 2024, 363, 123076. [Google Scholar] [CrossRef]
  4. Achomo, M.A.; Kumar, A.; Muthukumar, P.; Peela, N.R. Experimental studies on hydrogen production from steam reforming of methanol integrated with metal hydride-based hydrogen purification system. Int. J. Hydrog. Energy 2024, 76, 28–43. [Google Scholar] [CrossRef]
  5. Zhang, H.T.; Yang, D.F.; Guan, M.J.; Li, Q. Study of supramolecular organic frameworks for purification of hydrogen through molecular dynamics simulations. Sep. Purif. Technol. 2024, 335, 126106. [Google Scholar] [CrossRef]
  6. Ganley, J. Pressure swing adsorption in the unit operations laboratory. Chem. Eng. Educ. 2018, 52, 44–51. [Google Scholar] [CrossRef]
  7. Bahrun, M.H.V.; Bono, A.; Othman, N.; Zaini, M.A.A. Carbon dioxide removal from biogas through pressure swing adsorption—A review. Chem. Eng. Res. Des. 2022, 183, 285–306. [Google Scholar] [CrossRef]
  8. Abd, A.A.; Othman, M.R.; Helwani, Z.; Kim, J. An overview of biogas upgrading via pressure swing adsorption: Navigating through bibliometric insights towards a conceptual framework and future research pathways. Energy Convers. Manag. 2024, 306, 118268. [Google Scholar] [CrossRef]
  9. Freund, D.; Güngör, A.; Atakan, B. Hydrogen production and separation in fuel-rich operated HCCI engine polygeneration systems: Exergoeconomic analysis and comparison between pressure swing adsorption and palladium membrane separation. Appl. Energy Combust. Sci. 2023, 13, 100108. [Google Scholar] [CrossRef]
  10. Milad, Y.; Habib, E.; Falamaki, C. Competitive adsorption equilibrium isotherms of CO, CO2, CH4, and H2 on activated carbon and zeolite 5A for hydrogen purification. J. Chem. Eng. 2016, 61, 3420–3427. [Google Scholar]
  11. Kacem, M.; Pellerano, M.; Delebarre, A. Pressure swing adsorption for CO2/N2 and CO2/CH4 separation: Comparison between activated carbons and zeolites performances. Fuel Process. Technol. 2015, 138, 271–283. [Google Scholar] [CrossRef]
  12. Lopes, F.V.S.; Grande, C.A.; Ribeiro, A.M. Adsorption of H2, CO2, CH4, CO, N2 and H2O in activated carbon and zeolite for hydrogen production. Sep. Purif. Technol. 2009, 44, 1045–1073. [Google Scholar]
  13. Zhang, N.N.; Xiao, J.S.; Bénard, P.; Chahine, R. Single-and double-bed pressure swing adsorption processes for H2/CO syngas separation. Int. J. Hydrog. Energy 2019, 44, 26405–26418. [Google Scholar] [CrossRef]
  14. Ribeiro, A.M.; Grande, C.A.; Lopes, F.V.S. Four beds pressure swing adsorption for hydrogen purification: Case of humid feed and activated carbon beds. AIChE 2009, 55, 2292–2302. [Google Scholar] [CrossRef]
  15. Rebello, C.M.; Martins, M.A.F.; Rodrigues, A.E.; Loureiro, J.M. A novel standpoint of pressure swing adsorption processes multi-objective optimization: An approach based on feasible operation region mapping. Chem. Eng. Res. Des. 2022, 178, 590–601. [Google Scholar] [CrossRef]
  16. Subraveti, S.G.; Pai, K.N.; Rajagopalan, A.K.; Wilkins, N.S. Cycle design and optimization of pressure swing adsorption cycles for pre-combustion CO2 capture. Appl. Energy 2019, 254, 113624. [Google Scholar] [CrossRef]
  17. Wang, Y.J.; Zheng, M.Y.; Liu, G.L.; Zhang, D.; Zhang, Q. Graphical method for simultaneous optimization of the hydrogen recovery and purification feed. Int. J. Hydrog. Energy 2016, 41, 2631–2648. [Google Scholar] [CrossRef]
  18. Tang, Y.Y.; Long, W.Q.; Wang, Y.; Xiao, G.; Wang, Y.J.; Lu, M.F. Multi-objective optimization of methanol reforming reactor performance based on response surface methodology and multi-objective particle swarm optimization coupling algorithm for on-line hydrogen production. Energy Convers. Manag. 2024, 307, 118377. [Google Scholar] [CrossRef]
  19. Zhang, N.N.; Bénard, P.; Chahine, R.; Yang, T.Q.; Xiao, J.S. Optimization of pressure swing adsorption for hydrogen purification based on Box-Behnken design method. Int. J. Hydrog. Energy 2021, 46, 5403–5417. [Google Scholar] [CrossRef]
  20. Karimifard, S.; Alavi, M.M.R. Application of response surface methodology in physicochemical removal of dyes from wastewater: A critical review. Sci. Total Environ. 2018, 640, 772–797. [Google Scholar] [CrossRef]
  21. Tahir, F.; Arshad, M.Y.; Saeed, M.A.; Ali, U. Integrated process for simulation of gasification and chemical looping hydrogen production using Artificial Neural Network and machine learning validation. Energy Convers. Manag. 2023, 296, 117702. [Google Scholar] [CrossRef]
  22. Yu, X.X.; Shen, Y.H.; Guan, Z.B.; Zhang, D.H.; Tang, Z.L.; Li, W.B. Multi-objective optimization of ANN-based PSA model for hydrogen purification from steam-methane reforming gas. Int. J. Hydrog. Energy 2021, 46, 11740–11755. [Google Scholar] [CrossRef]
  23. Streb, A.; Mazzotti, M. Performance limits of neural networks for optimizing an adsorption process for hydrogen purification and CO2 capture. Comput. Chem. Eng. 2022, 166, 107974. [Google Scholar] [CrossRef]
  24. Kani, G.T.; Ghahremani, A. Optimal design of heat pipes for city gate station heaters by applying genetic and Bayesian optimization algorithms to an artificial neural network model. Case Stud. Therm. Eng. 2024, 55, 104203. [Google Scholar] [CrossRef]
  25. Ahn, H.; Yang, J.; Lee, C.H. Effects of feed composition of coke oven gas on a layered bed H2 PSA process. Adsorption 2001, 7, 339–356. [Google Scholar] [CrossRef]
  26. Silva, F.; Silva, J.; Rodrigues, A. A general package for the simulation of cyclic adsorption processes. Adsorption 1999, 5, 229–244. [Google Scholar] [CrossRef]
  27. Sereno, C.; Rodrigues, A. Can steady-state momentum equations be used in modeling pressurization of adsorption beds? Gas. Sep. Purif. 1993, 7, 167–174. [Google Scholar] [CrossRef]
  28. Srivastava, A.; Aghilesh, K.; Nair, A.; Ram, S. Response surface methodology and artificial neural network modelling for the performance evaluation of pilot-scale hybrid nanofiltration (NF) & reverse osmosis (RO) membrane system for the treatment of brackish ground water. J. Environ. Manag. 2021, 278, 111497. [Google Scholar]
  29. Jang, H.; Lee, C.S.; Kim, J.H.; Kim, J.H. Optimization of photocatalytic ceramic membrane filtration by response surface methodology: Effects of hydrodynamic conditions on organic fouling and removal efficiency. Chemosphere 2024, 356, 141885. [Google Scholar] [CrossRef]
  30. Saberimoghaddam, A.; Nozari, A. An experimental and statistical model of a cyclic pressure swing adsorption column for hydrogen purification. Korean J. Chem. Eng. 2017, 34, 822–828. [Google Scholar] [CrossRef]
  31. Jee, J.G.; Kim, M.B.; Lee, C.H. Adsorption characteristics of hydrogen mixtures in a layered bed: Binary, ternary, and five-component mixtures. Ind. Eng. Chem. Res. 2001, 40, 868–878. [Google Scholar] [CrossRef]
  32. Yang, J.; Lee, C.H. Adsorption dynamics of a layered bed PSA for H2 recovery from coke oven gas. AIChE 2010, 44, 1325–1334. [Google Scholar] [CrossRef]
  33. Ahn, S.; You, Y.W.; Lee, D.G. Layered two- and four-bed PSA processes for H2 recovery from coal gas. Chem. Eng. Sci. 2012, 68, 413–423. [Google Scholar] [CrossRef]
  34. Cavenati, S.; Grande, C.A.; Rodrigues, A.E. Layered pressure swing adsorption for methane recovery from CH4/CO2/N2 streams. Adsorption 2005, 11, 549–554. [Google Scholar] [CrossRef]
  35. Yang, S.I.; Choi, D.Y.; Jang, S.C. Hydrogen separation by multi-bed pressure swing adsorption of synthesis gas. Adsorption 2008, 14, 583–590. [Google Scholar] [CrossRef]
  36. Park, J.; Kang, R.H.; Lee, J.W. Efficient pressure swing adsorption for improving H2 recovery in precombustion CO2 capture. Korean J. Chem. Eng. 2017, 34, 1763–1773. [Google Scholar] [CrossRef]
  37. Kundu, P.; Paul, V.; Kumar, V. Formulation development, modeling and optimization of emulsification process using evolving RSM coupled hybrid ANN-GA framework. Chem. Eng. Res. Des. 2015, 104, 773–790. [Google Scholar] [CrossRef]
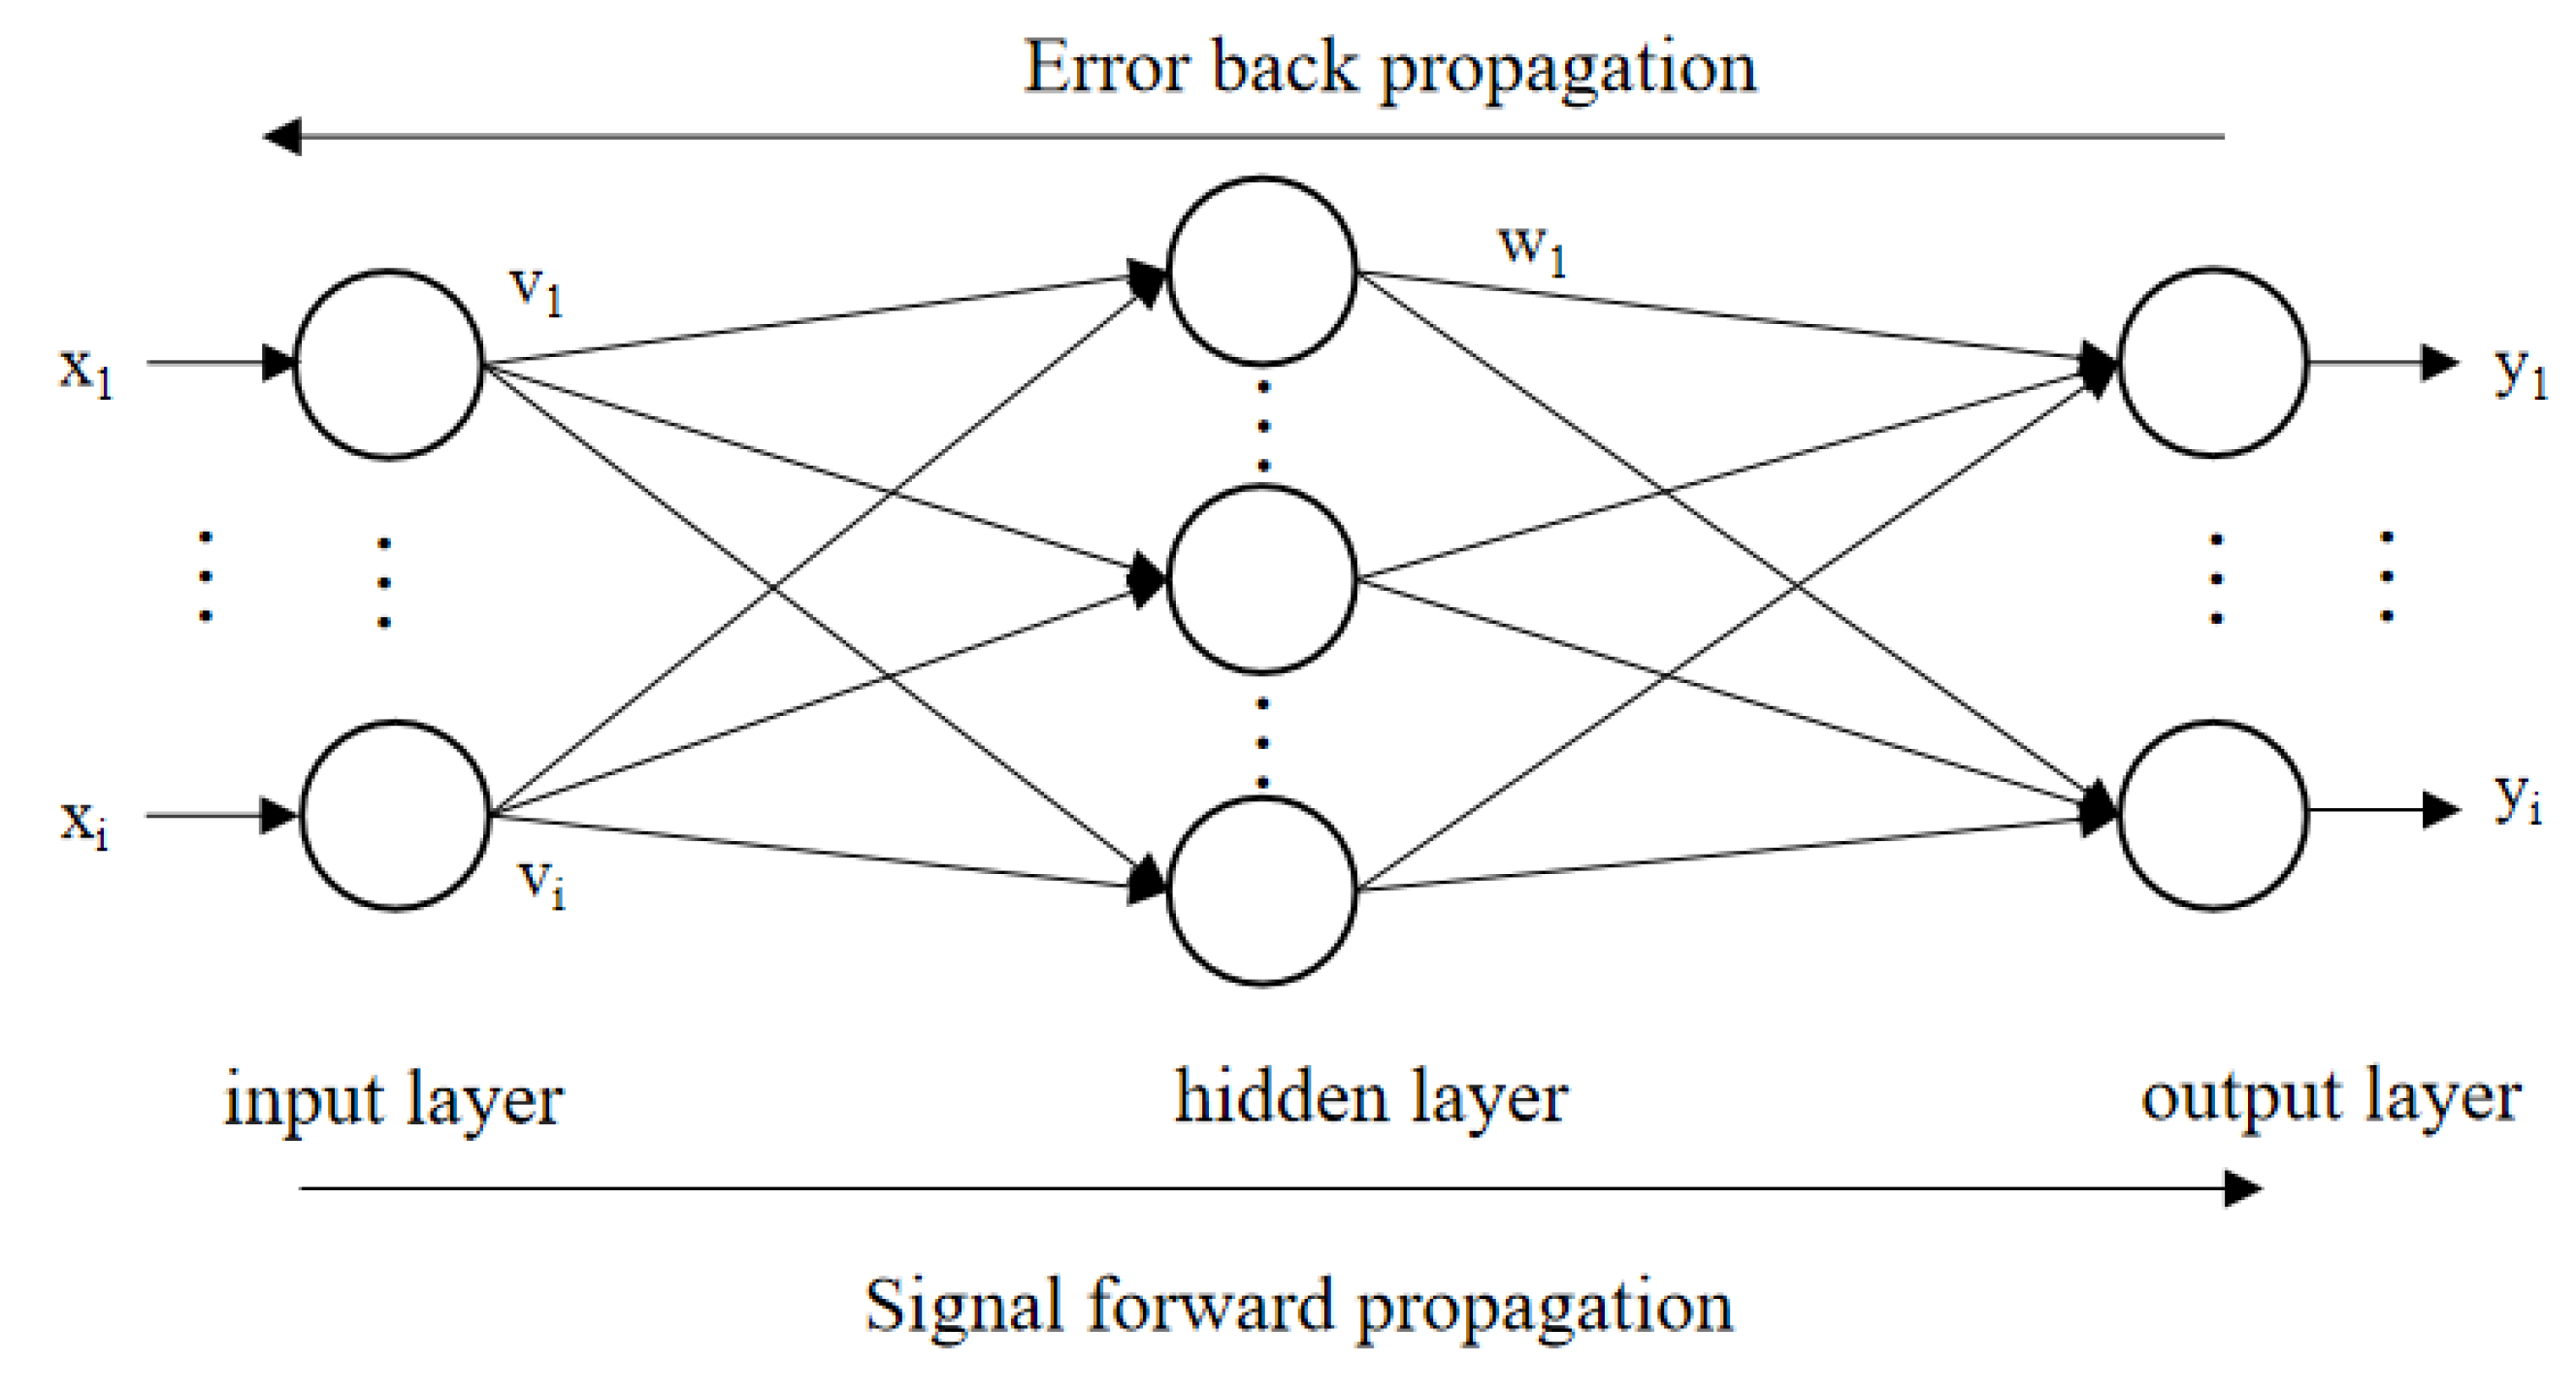
Figure 1. Architecture of BPNN.
Applsci 15 00140 g001
Figure 2. Flow chart of BPNN optimized by GA (the bold border represents the process of the BPNN).
Applsci 15 00140 g002
Figure 3. An Aspen Adsorption simulation schematic of a PSA model (feed: the inlet of mixture; product: the outlet of product hydrogen; VF, VP, VW, VPurge: valves; Bed1, 2: adsorption column; T1, T2: tanks for gas flow; lines represent pipes).
Applsci 15 00140 g003
Figure 4. Adsorption isotherms of H2, CO2, CH4, CO, and N2 on activated carbon and zeolite 5A (Symbol: isotherm parameters from Ref. [25]; line: simulation).
Applsci 15 00140 g004
Figure 5. Experimental (symbol: breakthrough curves from Ref. [25]) and simulated (line) breakthrough curves.
Applsci 15 00140 g005
Figure 6. Molar fraction of H2 and pressure in the layered bed of one cycle.
Applsci 15 00140 g006
Figure 7. The influences of independent optimization parameters on hydrogen purity (a) and productivity (b). (Dots: the performance of the response variable at different levels; contours: the interaction effects between two factors).
Applsci 15 00140 g007aApplsci 15 00140 g007b
Figure 8. The MSE performance of BPNN–GA model (green circle: best validation performance).
Applsci 15 00140 g008
Figure 9. The comparison between predictive and actual values of purity (a) and productivity (b) of BPNN–GA model.
Applsci 15 00140 g009
Figure 10. The correlation coefficient (R) between the predicted outputs of the BPNN–GA and actual outputs of the Aspen model on the training, validation, test, and overall sets.
Applsci 15 00140 g010
Figure 11. The MSE performance of BBD–BPNN–GA model (green circle: best validation performance).
Applsci 15 00140 g011
Figure 12. The comparison between actual and predictive values of purity (a) and productivity (b) of BBD–BPNN–GA model.
Applsci 15 00140 g012
Figure 13. The correlation coefficient (R–value) between the predicted and actual output of the Aspen model.
Applsci 15 00140 g013
Table 1. Six-step cyclic sequences of the PSA process.
StepIIIIIIIVVVI
Schematic diagram of adsorption bedApplsci 15 00140 i001Applsci 15 00140 i002Applsci 15 00140 i003Applsci 15 00140 i004Applsci 15 00140 i005Applsci 15 00140 i006
Bed 1 ADDPEDPPGPPEFP
Bed 2PGPPEFPADDPEDP
Time (s)180208180208
Table 2. The ranges of the independent factors and variables in BBD method.
FactorsVariables and Ranges
Adsorption Time (s)Pressure Equalization Time (s)Feed Flow Rate (L/min)
–1160106
0180208
+12003010
Disclaimer/Publisher’s Note: The statements, opinions and data contained in all publications are solely those of the individual author(s) and contributor(s) and not of MDPI and/or the editor(s). MDPI and/or the editor(s) disclaim responsibility for any injury to people or property resulting from any ideas, methods, instructions or products referred to in the content.