Article

A Knowledge Graph Framework to Support Life Cycle Assessment for Sustainable Decision-Making

Institute for Information Management in Engineering, Karlsruhe Institute of Technology, 76133 Karlsruhe, Germany
*
Author to whom correspondence should be addressed.
Appl. Sci. 2025, 15(1), 175; https://doi.org/10.3390/app15010175
Submission received: 26 November 2024 / Revised: 19 December 2024 / Accepted: 24 December 2024 / Published: 28 December 2024
(This article belongs to the Special Issue Holistic AI Technologies and Applications)

Abstract

:
This study introduces a comprehensive knowledge graph (KG)-based framework designed to support sustainable decision-making by integrating, enriching, and analyzing heterogeneous data sources. The proposed methodology leverages domain expertise, real-world data, and synthetic data generated through language models to address challenges in life cycle assessment (LCA), particularly data scarcity and inconsistency. By modeling the entire product lifecycle, including engineering, production, usage, and disposal phases, the framework facilitates early-stage design decision-making and provides actionable insights for sustainability improvements. The methodology is validated through a case study on 3D printing (3DP), demonstrating its ability to manage complex data, highlight relationships between engineering decisions and environmental impacts, and mitigate data scarcity in the early phases of product development in the context of LCAs. In conclusion, the results demonstrate the framework’s potential to drive sustainable innovation in manufacturing.

1. Introduction and Motivation

Over the past few years, the growing awareness of climate change and environmental deterioration has underscored the critical need for adopting sustainable practices in various industries. Addressing these challenges requires a fundamental shift towards sustainable practices across all industries. This imperative is underscored by global initiatives such as the Sustainable Development Goals (SDGs) of the United Nations, particularly SDG 9 (Industry, Innovation, and Infrastructure), SDG 12 (Responsible Consumption and Production), and SDG 13 (Climate Action). In alignment with these global objectives, the European Union has launched the Green Deal, an ambitious roadmap that aims to make Europe the first climate-neutral continent by 2050. The Green Deal sets interim targets, including a reduction in greenhouse gas emissions by at least 55% below 1990 levels by 2030 [1]. Achieving these targets necessitates transformative changes in production, consumption, and waste management practices, demanding innovative solutions that can be integrated into existing industrial processes. To understand the environmental impacts of the proposed changes and achieve these ambitious targets, we first require comprehensive environmental assessments. These assessments enable us to quantify the effects of different practices and policies on greenhouse gas emissions. Once we understand the environmental impacts, we can identify possible changes that can contribute to emission reductions. Lastly, optimization becomes essential; by leveraging knowledge support systems, we can make informed decisions to implement the best strategies for achieving sustainability goals. Life cycle assessment (LCA) is an essential method for assessing the environmental effects linked to each phase of a product’s lifespan. However, several literature reviews have highlighted inconsistencies and challenges in current LCA practices, such as data quality issues and a lack of transparency. For example, a review of published LCAs on waste management shows inconsistencies between studies [2], and a review of LCAs of salmonid aquaculture production systems revealed poor data quality, complicating the comparison of LCA results. A review of LCAs for 3D printing (3DP) highlighted a lack of transparency and robustness in their methods, often because the authors are not experts in performing LCAs [3]. These challenges indicate the need for more streamlined and integrated approaches to LCA that can handle heterogeneous data sources and incorporate early-stage design decisions. To address these challenges, this article aims to achieve the following research objectives.
  • Develop a comprehensive methodology that uses knowledge graphs (KGs) to integrate, enrich, and analyze heterogeneous data sources, including domain expertise, databases, and language models, to support LCA.
  • Enable the incorporation of early-stage design decisions into the LCA process by modeling the entire product life cycle within a KG, thereby highlighting dependencies and influences across different phases.
  • Facilitate the LCA of products that are traditionally difficult to analyze due to data scarcity or complexity by utilizing language models to estimate missing data and incorporating them into the KG.
  • Demonstrate how the constructed KG can support analytical applications to provide actionable insights for decision-making.
To achieve these objectives, we developed a methodology that leverages KGs as the central tool. KGs offer structured and interconnected representations of data, making them powerful facilitators. In the context of LCA and product development, KGs enable the seamless integration of information across different phases, from material selection and design to manufacturing and end-of-life considerations. By capturing the relationships and dependencies between various components and processes, KGs allow algorithms to analyze environmental impacts holistically. This interconnected data structure supports the identification of how early-stage decisions affect later outcomes, thus facilitating more informed decision-making. For example, altering a material in the design phase can automatically update the environmental impact calculations, thanks to the KG’s ability to propagate changes throughout the system. Moreover, KGs enhance collaboration by providing a shared platform where different stakeholders, designers, engineers, and sustainability experts can contribute and access up-to-date information. This collective intelligence is essential, as it relies on continuous data input and feedback to improve its predictive capabilities and recommendations. By integrating KGs with AI, we can perform real-time LCAs that are more adaptable. Furthermore, AI can identify patterns and suggest optimizations that might not be apparent using traditional analysis methods. This dynamic approach enables the quick calculation of various options and supports the goal of integrating LCA thinking into product development.
In the following sections, the theoretical foundation of the proposed approach is presented, highlighting the role of KGs in the integration and analysis of heterogeneous data sources to support LCAs. The methodology is thoroughly elucidated, with particular attention to various facets, including the acquisition of domain expertise, the integration of data via databases and language models, and small analytical applications. Building on this, the methodology is detailed and validated through a case study on 3DP, illustrating its application to address challenges such as data scarcity and the early integration of the design phase. Finally, the findings are discussed in the context of sustainable product development, emphasizing the scalability of the approach and its alignment with global sustainability goals.

2. Theoretical Foundations and Related Works

2.1. Life-Cycle Assessments

LCAs are performed to quantify the potential environmental impacts of products, services, or companies throughout their entire life cycle [4].
The process of conducting an LCA in general is guided by the ISO 14040:2006 [5] and ISO 14044:2006 [6] standards, which involve four phases: Goal and Scope Definition, Life Cycle Inventory (LCI), Life Cycle Impact Assessment (LCIA), and Interpretation, as illustrated in Figure 1 [5,6].
The Definition of Goal and Scope sets out the framework and objectives for the study, ensuring that they are in line with the intended purpose [7]. It sets the foundation for the methods and boundaries used throughout the LCA.
During the LCI stage, the compilation of inputs and outputs for the product or process is performed. This compilation encompasses data from the entire life cycle of the product or process, covering stages such as raw material acquisition, manufacturing, utilization, and disposal [8]. To maintain consistency and transparency, this compilation must align with the predefined objectives and scope. In the LCIA stage, the potential environmental impacts associated with the inventory’s inputs and outputs are assessed through characterization and evaluation. This assessment utilizes various standardized impact categories and indicators, facilitating the uniform and clear quantification and comparison of climate change impacts across different products or processes. In the Interpretation phase, the findings from the LCI and LCIA are scrutinized to derive conclusions and recommendations and convey those findings to stakeholders. The Interpretation phase is pivotal in supporting informed decision-making and pinpointing opportunities to enhance environmental performance and guide future research [9].
LCAs can be approached in different ways, each with its own focus and scope. Two dominant methodologies have emerged in both the academic literature and industry practices: attributional life cycle assessment (ALCA) and consequential life cycle assessment (CLCA). ALCA assigns an environmental impact share to all stages of a product’s life cycle, ensuring that all processes linked via energy or physical flows are included [10,11,12]. This approach models the life cycle based on a static technosphere, where the boundaries and technologies of the system are assumed to remain constant over time [13]. ALCA requires specific modeling constraints to ensure accuracy, such as avoiding double counting and appropriately partitioning multifunctional processes. This partitioning is particularly crucial during the impact assessment phase to correctly allocate environmental burdens among co-products or shared processes. CLCA, on the other hand, examines the environmental outcomes resulting from changes in demand or supply, such as the impact of an increase in product demand [14]. CLCA is more flexible and dynamic in its modeling, accounting for how changes in one part of the system can cause ripple effects throughout the economy. It allows for various methods of assessing co-products, including system expansion, substitution, or even factoring in added consumption [15,16]. Consequently, the foundation of CLCA is characterized by a dynamic technosphere, acknowledging that technologies and market conditions can change in response to decisions [13]. For the purposes of this research, the focus will be on an ALCA. ALCA provides a comprehensive baseline understanding of the environmental impact of a product under current conditions. It aligns with existing regulatory standards and offers a practical approach to assessing environmental impacts. By establishing a detailed inventory of all relevant inputs and outputs associated with a product, ALCA facilitates the identification of key areas where environmental improvements can be made.

2.2. Knowledge Graphs

KGs represent a structured approach in the realm of data management, offering a unique way to encapsulate relationships within a set of triples [17].
They serve as powerful tools for bridging the gap between vast data availability and the extraction of actionable insights, particularly in domains that require comprehensive understanding and decision-making. The graph structure of KGs enables the representation of complex relationships and interdependencies among data entities, facilitating advanced analytics and knowledge discovery. In 2016, Google advanced the conceptual framework of KGs, laying the foundation for contemporary discussions. They utilized KGs to improve and accelerate their search engine results, aligning with the broader ambition of evolving the Internet into a machine-readable “web of data” [18]. KGs have increasingly become integral across various domains, demonstrating their versatility and utility. In biomedical research, they facilitate knowledge extraction with minimal supervision, aiding in the discovery of new insights and relationships within vast datasets [19]. In cybersecurity education, KGs are used to visualize complex concepts, enhancing learning outcomes by providing clear and interconnected representations of information [20]. They play a crucial role in drug discovery as well, helping to quickly identify candidates for repurposable drugs, as demonstrated during COVID-19 research [21]. In supply chain risk analysis, KGs support decision-making processes by integrating heterogeneous data from multiple sources, allowing for a more holistic assessment of risks [22]. Today, there are mainly two types of KGs [23]. First, labeled property graphs (LPGs) are renowned for their efficient storage, rapid traversal capabilities, and flexibility in modeling a wide array of real-world domains. These attributes make LPGs particularly advantageous for applications that require fast query processing and deep graph analyses, such as subgraph matching, network alignment, and real-time KG queries. LPGs are characterized by their structure, where edges are used to connect nodes that contain embedded properties [24].
This design leads to significant efficiency in data querying and analysis. However, despite these benefits, LPGs lack support for formal knowledge representation, such as ontologies, limiting their applicability in scenarios where automatic knowledge inference is crucial. Secondly, the Resource Description Framework (RDF) serves as a versatile data model engineered for sharing information concerning entities in the Web of Data. Its robustness is demonstrated through the facilitation of formal knowledge representations like ontologies, enabling the automated inference of knowledge [25]. RDF employs a triplet structure consisting of a subject, a predicate, and an object, facilitating the linking of data and its sharing across the web. This makes it ideal for applications where data linking and sharing are paramount. Although RDF is widely adopted within the web community, its tendency towards a high memory footprint and inefficient storage can impede scalable graph analyses, an area where LPGs offer advantages.
In LPGs, properties are stored directly on nodes and edges, rather than being relegated to external schemas or global ontologies. This flexibility facilitates efficient data storage, rapid graph traversal, and the versatile modeling of real-world domains where heterogeneous attributes can be directly associated with elements of the graph structure. However, this comes at the cost of limited support for formal reasoning or inference based on logical frameworks or ontologies.
Throughout this study, when we use the term knowledge graph, we specifically refer to the labeled property graph model as defined here, due to its efficiency and flexibility in handling the complex and extensive data needs of life cycle assessments.
Formally, an LPG is defined as follows [26,27]:
G L P G = ( V , E , Σ , L , P )
it contains the following:
  • V is a finite set of vertices (representing entities, concepts, or objects).
  • E V × V is a finite set of directed edges (representing relationships between entities).
  • Σ is a finite set of labels.
  • L : V E P ( Σ ) is a labeling function assigning one or more labels from Σ to each vertex or edge ( P ( Σ ) , and it denotes the power set of Σ ).
  • P : ( V E ) × K D is a partial function that assigns properties, where K is a set of property keys, and D is a domain of data values (e.g., strings, integers, and floats). If P ( x , k ) is defined for some x V E and k K , then P ( x , k ) D .
An LPG also has the following characteristics:
  • Each vertex, v V , represents an entity, object, or concept. A vertex may have zero, one, or multiple labels indicating its type or category: L ( v ) Σ .
  • Each edge, e E , is a directed relationship between vertices ( v i , v j ) , and may have zero, one, or multiple labels: L ( e ) Σ . Labels typically denote the semantic role of the relationship (e.g., isPartOf, producedBy).
  • Both vertices and edges may have properties, defined as key–value pairs. For a vertex, v V , or an edge, e E , and a key, k K , P ( v , k ) or P ( e , k ) returns a literal value in D if defined. For example, a node representing a product might have properties like weight = 5.3 (in kilograms) and material = “steel”.
The construction of KGs can follow manual or automated approaches, depending on the requirements for precision, scalability, and domain specificity. Manual construction is commonly used when expert knowledge and accuracy are prioritized. The process begins with the identification of entities and relationships, often achieved through a thorough analysis of the domain literature, expert interviews, or existing databases. Ontology management tools, such as Protégé, are frequently used to model and store this knowledge. Competency questions, which define the requirements for the knowledge graph, are formulated and later translated into SPARQL queries to validate the graph’s structure. To ensure quality and consistency, tests based on these queries, encapsulated as SHACL constraints, are conducted. This process ensures that the resulting knowledge graph aligns closely with the specified domain requirements, although it remains time-consuming and resource-intensive [28]. In contrast, automated approaches significantly improve efficiency and scalability. These methods begin with data acquisition from diverse sources, including structured databases and unstructured textual data. Techniques such as named entity recognition (NER) and relation extraction, supported by machine learning models like BERT-BiLSTM-CRF, are employed to identify entities and relationships [29]. Automated systems integrate information from multiple data sources, often employing semantic similarity measures or pre-trained language models to ensure accuracy. Large frameworks such as SAC-KG leverage advanced natural language processing algorithms and large language models to construct and validate knowledge graphs with minimal human intervention. Furthermore, manually curated existing databases are integrated into automated pipelines to enrich and expand the knowledge base [30]. The creation of knowledge graphs, whether manual or automated, involves tools and frameworks that streamline the process. For manual construction, ontology editing platforms such as Protégé and Neo4J provide structured environments for managing knowledge. Automated toolkits, such as GraphGen4Code, enable the extraction and modeling of knowledge directly from large datasets, including codebases and documentation. Frameworks like SAC-KG further simplify this process by automating entity recognition, relationship extraction, and validation, thus reducing the dependence on human supervision [31].
Since these knowledge graphs serve as the backbone of critical analytical processes, their overall quality, completeness, and alignment with source data become crucial factors in achieving their intended applications’ benefits. Typically, the primary focus of the quality of a knowledge graph is its “fitness for purpose” [32] in relation to the application it supports. In the literature, several frameworks were introduced to control the quality of the KG. One study placed emphasis on improving the consistency of automatically constructed KGs [33]. Since such graphs could be generated through automated extraction tools, a notable number of errors and inconsistencies have been observed, particularly in terms of their alignment with the original source data. By leveraging LLMs, inconsistencies between extracted facts and their provenances were detected and corrected. In that study, decoder-only and encoder–decoder LLM architectures were systematically compared. It was demonstrated that smaller models can sometimes surpass larger ones in terms of performance, indicating that model size should not be regarded as the sole indicator of efficacy. Additional efforts were made to address the challenges posed by sparsity and noise within the KGs used for recommendation systems [34]. Long-tailed distributions and irrelevant or misleading connections have been identified as factors that degrade the quality of KG representations. To mitigate these issues, a Knowledge Graph Contrastive Learning (KGCL) framework was proposed. Within this framework, augmented KGs were produced so that noisy relationships could be suppressed, thereby enabling more robust and semantically meaningful entity representations. In [35], a method was proposed to support the efficient detection and explanation of inconsistencies in large-scale KGs. Traditional approaches have been found to become computationally prohibitive as graphs grow in size. To address this limitation, compact KG abstractions were introduced. In doing so, only crucial structural patterns were preserved, and pertinent inconsistencies were highlighted, reducing the computational overhead. Thus, error detection was rendered scalable, while accuracy and interpretability were maintained. A comprehensive framework was introduced to systematically assess the quality of large-scale KGs [32]. Authors claim that a significant number of KG have been developed through the use of automated construction tools and crowdsourcing methods. Within their evaluation framework, a set of metrics was defined to evaluate syntax, semantics, completeness, and scalability. By tailoring these metrics to diverse knowledge discovery applications, the complexity associated with evaluation protocols was reduced. Consequently, a more practical and scalable approach was offered to ensure KG quality. Finally, in [36], a survey of techniques for managing KG quality was presented. Processes such as error detection, error correction, and KG completion were examined in detail. Inaccuracies, outdated information, and incomplete entries were categorized, and a wide range of methodologies to systematically address these challenges were reviewed. As a result, a valuable resource was created for those seeking holistic strategies to enhance and maintain the overall quality of KG.

2.3. Related Works and Research Gap

Several KG-based models have been developed to improve LCA. To date, the main focus of research has been the topic of the life cycle inventory (LCI). An LCA-oriented KG development methodology was introduced by [37] to improve LCI management. In their approach, the semantic representation of LCI data was emphasized, facilitating better data integration and retrieval. By structuring LCI information into a KG, a foundation was provided for more sophisticated analysis and decision-making processes within LCA. The frameworks developed for LCI by [38,39] also utilize knowledge graphs to improve the LCI. The KGs integrate and organize heterogeneous data sources, enabling the automated generation of material and energy flow data for either manufacturing processes [38] or buildings and infrastructure [39]. The approaches enhance data traceability and interoperability, ensuring a robust foundation for comprehensive environmental assessments. Similarly, a consensus model for LCA leveraging semantic catalogs to enhance data sharing and reuse was developed by [40]. Their work focused on creating a standardized semantic framework that improves the efficiency and applicability of LCA data. By adopting semantic technologies, the challenges of data heterogeneity and interoperability were addressed, enabling a more seamless integration of LCA datasets from diverse sources. A semantic approach to modeling LCI databases was proposed by [41], specifically aimed at the management of energy and environmental impact data. In their methodology, the use of ontologies was involved in the semantic representation of LCI data, making the information more accessible and comprehensible. This approach not only improves data retrieval and analysis but also supports the integration of LCI data into broader environmental assessment frameworks. Building upon these foundational works, a comprehensive KG using Neo4j for the management of LCI data was presented by [23], marking a significant shift from traditional relational databases. Their methodology involves the construction of a KG comprising more than 40 million entities and 100 million relationships. By conceptualizing LCI data through interconnected concepts and relationships, a more intuitive and flexible data model was provided. The preprocessing of data for Cypher syntax extraction enabled efficient querying and data manipulation within the Neo4j environment. Improved data visualization and retrieval capabilities were demonstrated in their implementation, highlighting the advantages of KGs over conventional database systems in handling complex LCA data structures. Beyond LCI data management, a study presents a knowledge graph-based model for analyzing and managing the carbon footprint of a product [42]. The proposed model leverages semantic technologies to integrate heterogeneous data sources and represent the complex relationships between materials, processes, and emissions. It can be demonstrated how the knowledge graph facilitates efficient data organization and dynamic updates, addressing key challenges in traditional LCA methods. The findings underscore the importance of combining semantic data representation with LCA to address the growing complexity of environmental impact assessments. However, specific details regarding the technological framework and software used remain limited. More research is needed to evaluate scalability and applicability to other industries and especially environmental factors, broadening its utility beyond carbon footprint analysis. More recent research has further advanced the application of KGs in LCA. A knowledge graph-based methodology tailored for proactive circularity was proposed for the disassembly of smart products, incorporating principles of circular economy [43]. This framework integrates design for circular disassembly (DfCD) concepts into the product lifecycle, providing dynamic indicators for economic, environmental, and social contexts. Using Neo4j, authors demonstrated a system that supports sustainable decision-making during the design phase, emphasizing the importance of considerations of early-stage circularity. Another study introduced an automated LCA system that uses a knowledge graph to optimize the efficiency of life cycle modeling and calculations [44]. Its system integrates advanced mapping algorithms and a domain thesaurus to automate background dataset recommendations and improve data accuracy. Validated through case studies, this approach demonstrated significant improvements in response time and recommendation precision compared to existing search systems. This method underscores the potential of knowledge graphs to bridge data gaps and enhance the overall usability of LCA tools.
In summary, the existing research focuses primarily on the management of LCI data, often overlooking the significant impact of early-stage decisions made during the design and engineering phases on the environmental outcomes of later stages. Although some studies have explored the integration of entire LCAs, these efforts remain domain-specific and have not been widely adopted. Additionally, they concentrate on stages where sufficient data are available to perform an LCA and utilize KGs to enhance the process in various aspects. In contrast, our proposed methodology broadens the scope to encompass the entire product life cycle, including the engineering, manufacturing, usage, and end-of-life phases. We specifically focus on the engineering phase, where data availability is limited, by recommending the use of advanced language models to estimate missing data. This approach is particularly crucial during the product design phase, where immediate access to data is essential for informed decision-making. By integrating synthetically generated data, our methodology addresses the challenge of obtaining precise environmental data during the early stages of the design, enabling more comprehensive and accurate environmental assessments throughout the product’s life cycle.

3. Methodology

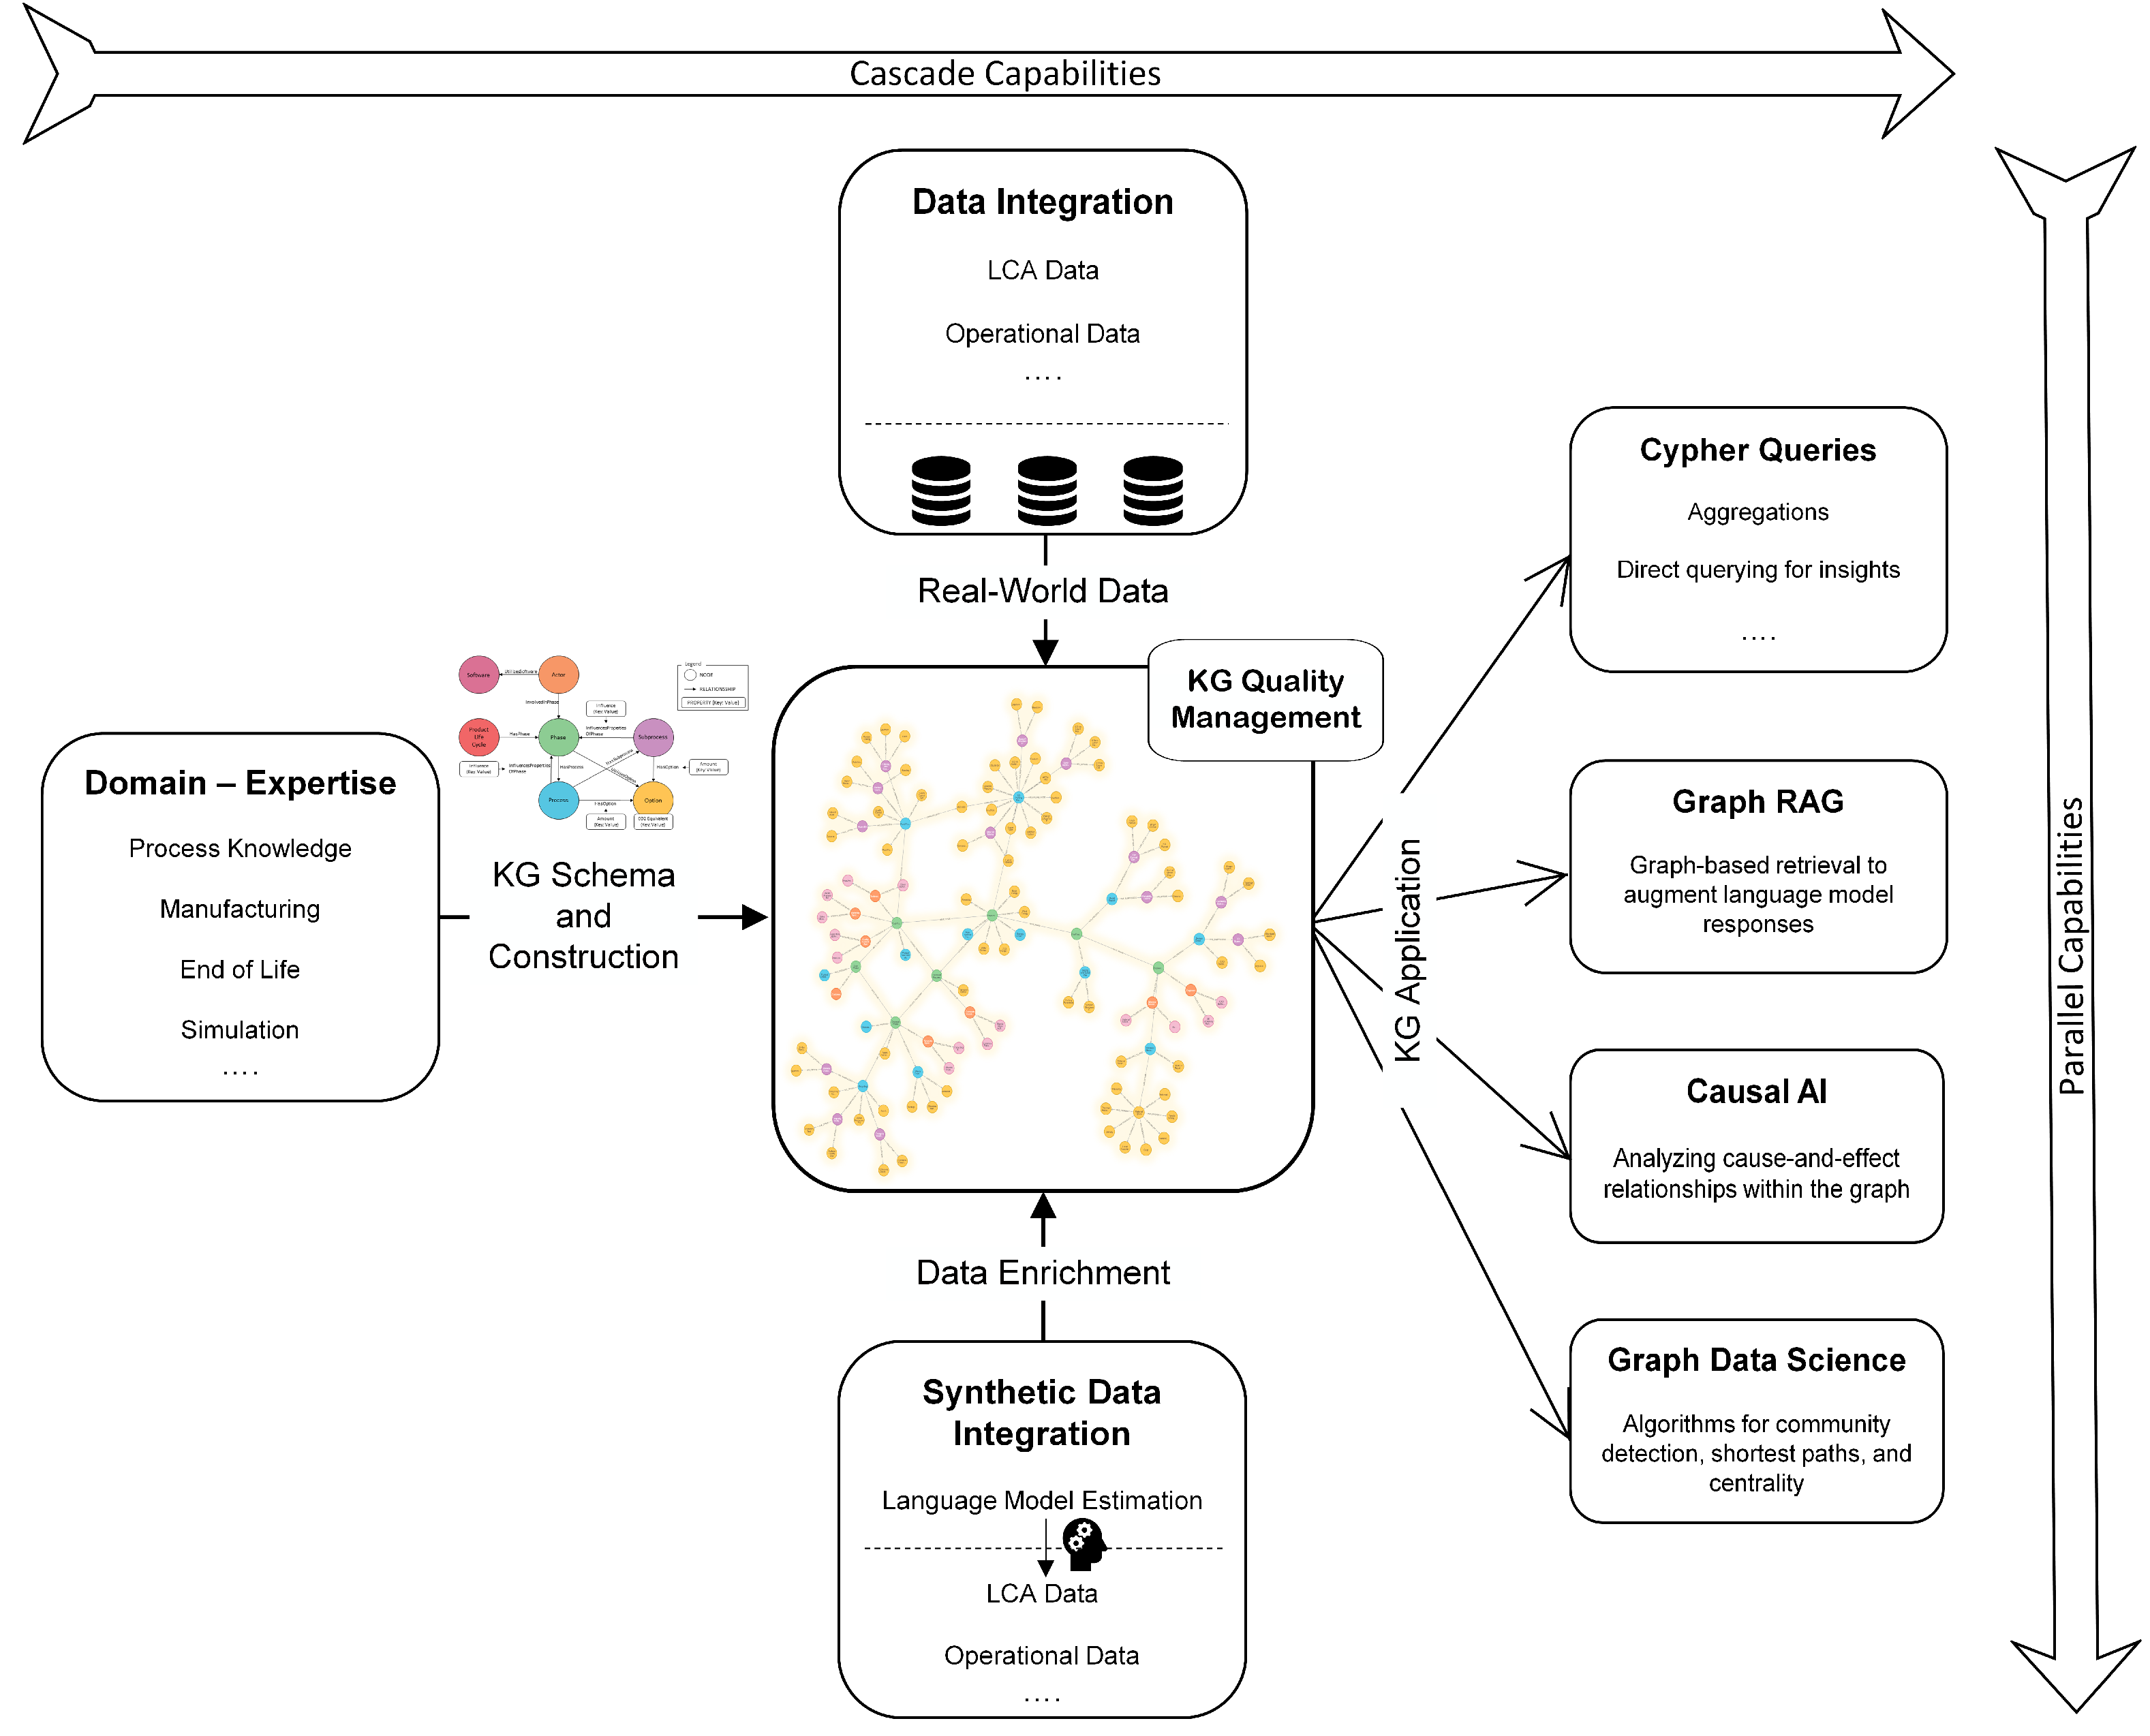
The proposed methodology, illustrated in Figure 2, presents a systematic framework for integrating, enriching, and analyzing heterogeneous data sources within a KG environment. As stated in Section 2.2, the KG, in the center of Figure 2, should be an LPG, since LPGs are renowned for their efficient storage, rapid traversal capabilities, and flexibility in modeling a wide array of real-world domains. They are characterized by their structure, where edges are used to connect nodes that contain embedded properties [24]. This approach takes advantage of domain expertise, real-world data and synthetically generated data to construct a comprehensive KG that supports advanced analytical capabilities essential for informed decision-making in complex domains.
To optimize workflow efficiency, the methodology distinguishes between cascade and parallel capabilities. The cascade capabilities represent the sequential processes of gathering domain expertise, schema definition, and data integration, with each stage building on the previous one to ensure a structured and methodical construction of the KG. Once the KG is established, analytical applications such as Cypher queries, Graph Data Science techniques, causal inference, and graph retrieval–augmented generation (Graph RAG) operate independently and concurrently.
The proposed methodology integrates AI to improve the efficiency and comprehensiveness of LCAs. AI is primarily utilized for estimating missing environmental data, particularly during the early stages of the product lifecycle during which data availability is often limited. Advanced language models, such as GPT-4o, are leveraged to generate synthetic data by inferring plausible values based on contextual understanding and patterns learned from extensive corpora of domain-specific knowledge. This enables rapid iteration and decision-making during the product design phase without the delays associated with manual data collection.

3.1. Domain—Expertise

The initial phase of the methodology focuses on acquiring in-depth domain expertise and meticulously defining the schema for the KG. This foundational step is crucial for accurately modeling the product’s life cycle and ensuring that the KG effectively represents all relevant processes, actors, and environmental impacts. This involves a multifaceted approach to familiarization, including process observation in real operational settings, conducting expert interviews, and engaging in detailed literature research. By immersing oneself in the practical workflows and theoretical underpinnings of the product, one gains the necessary insight to identify key nodes, relationships, and properties that will form the backbone of the KG.
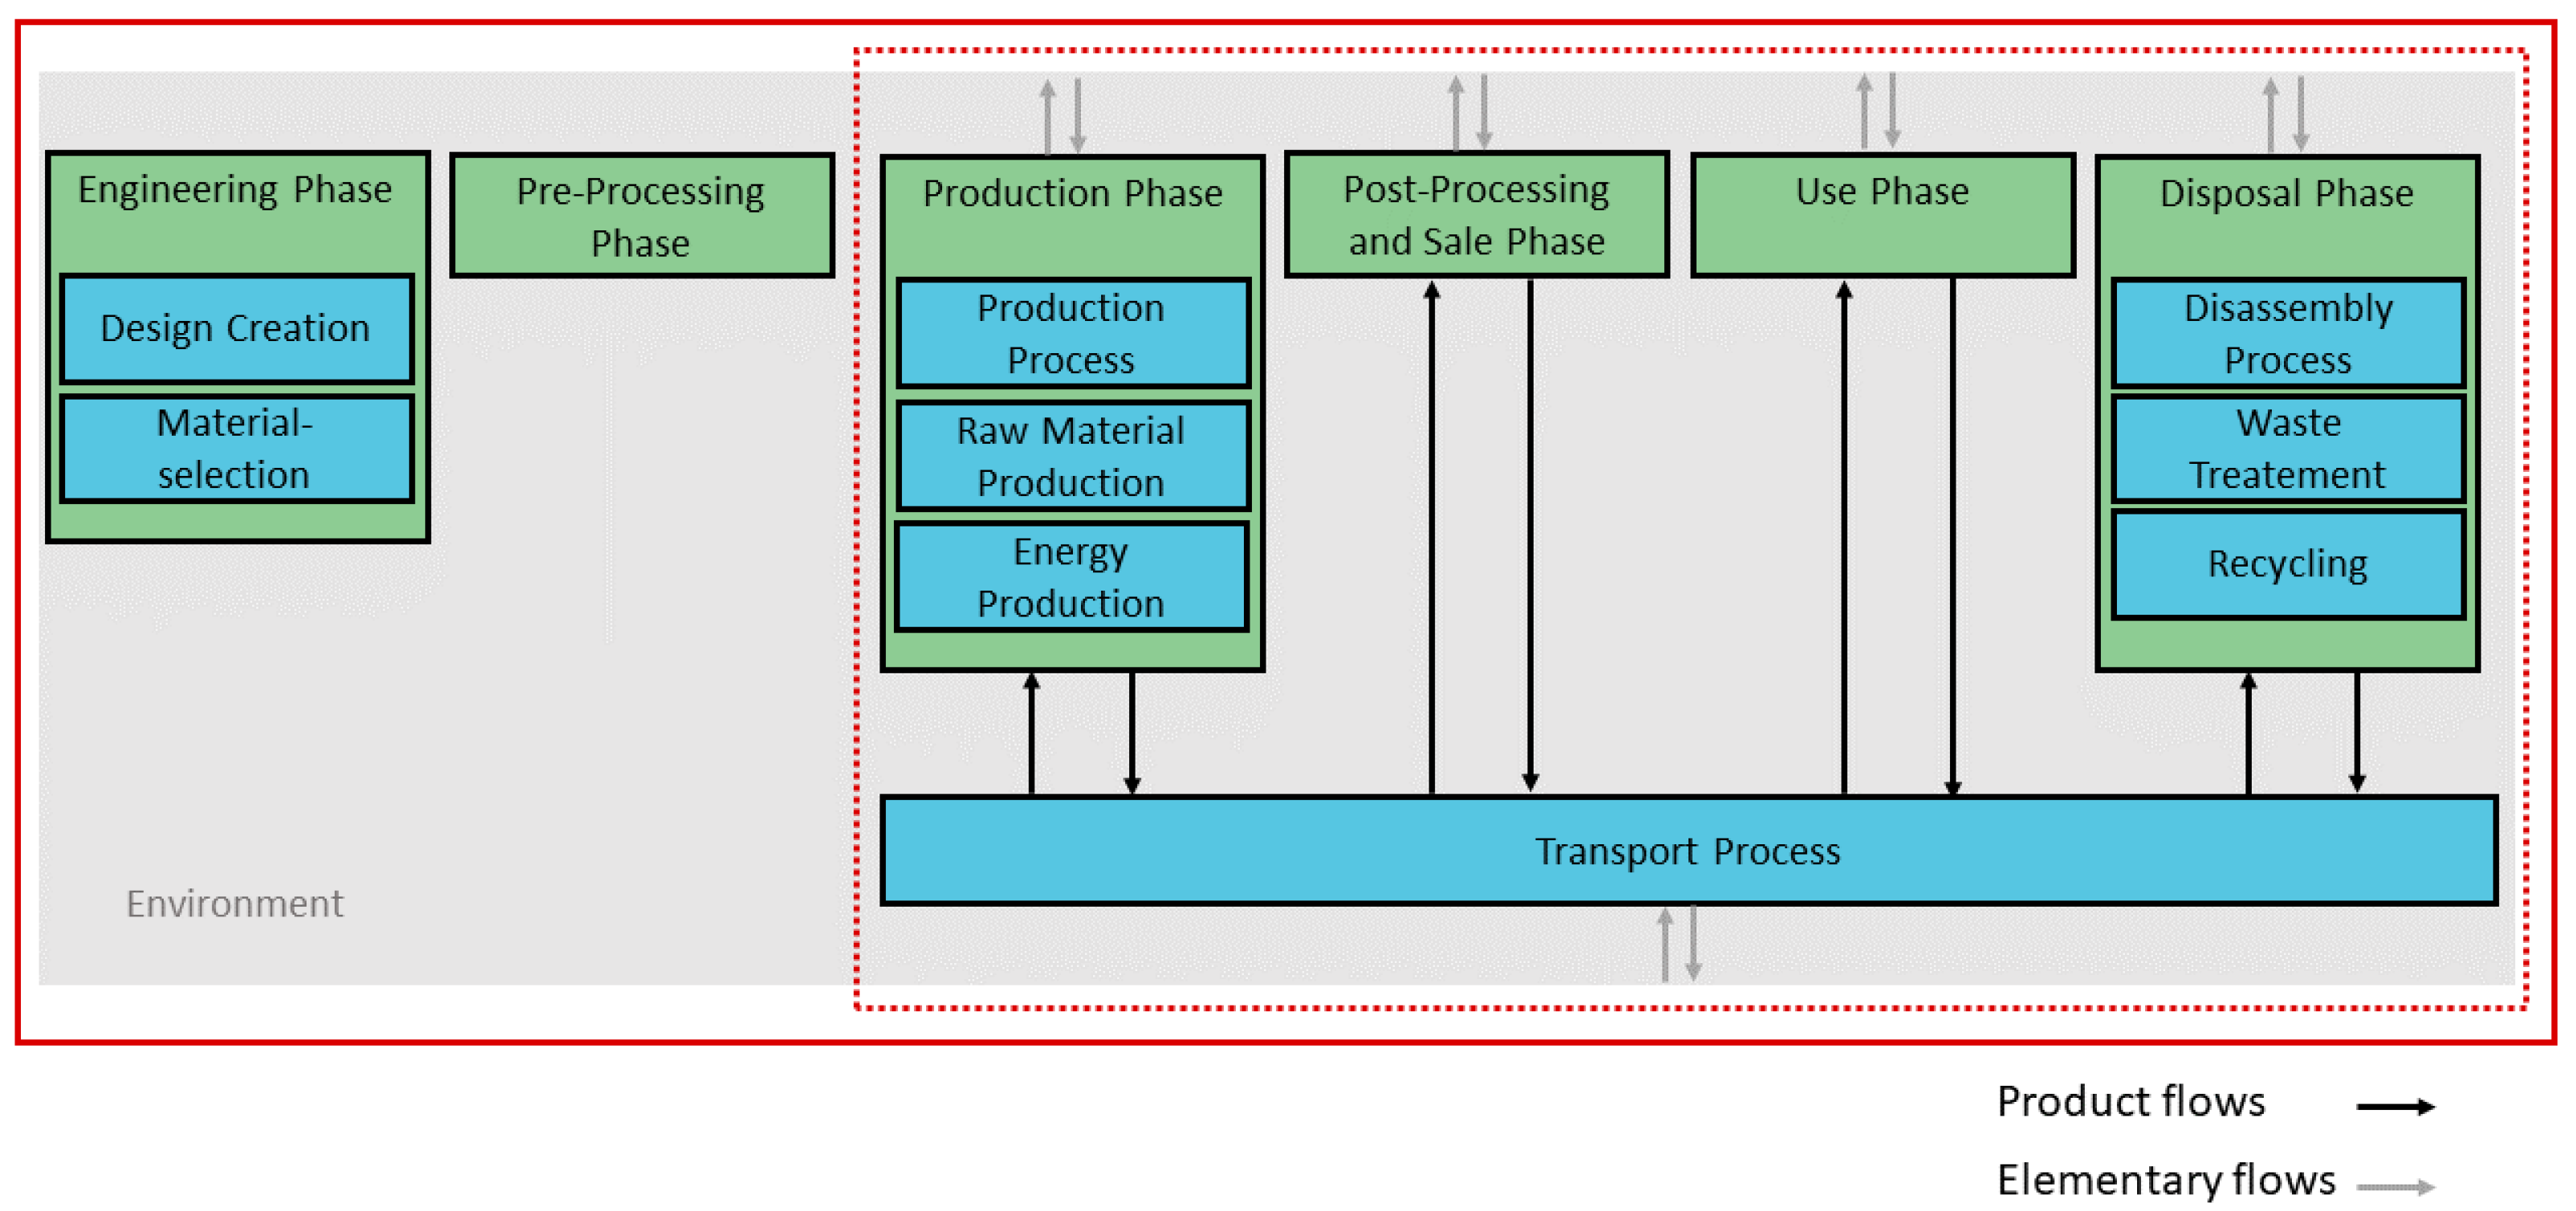
In traditional LCA methodologies, the focus often lies on specific stages of the product life cycle during which direct emissions occur, as depicted in the red dotted box on the right side of Figure 3. However, this approach overlooks the significant influence that early-stage decisions—made during the design and engineering phases—have on the environmental outcomes of later stages. These initial decisions, while not producing immediate emissions, set the parameters for resource utilization, energy consumption, and waste generation throughout the product’s life cycle. To address this limitation, the proposed methodology expands the scope to include the entire product life cycle, encompassing the engineering, manufacturing, usage, and end-of-life phases, as highlighted in red. By incorporating these early stages, the methodology acknowledges that decisions made at the inception of the product can have profound ripple effects on its overall environmental impact. This holistic perspective enables a more comprehensive LCA, identifying opportunities for sustainability improvements at every stage.
Our proposed life cycle model begins with the engineering phase, where the foundational steps of the product design are taken. This phase involves critical activities such as design creation and material selection, which are essential to determine the functionality, sustainability, and environmental footprint of the product throughout its lifecycle. The choices made here, such as the selection of materials or design optimizations, have cascading effects on the downstream phases, influencing resource efficiency and environmental performance. Next, the pre-processing phase represents the transition from conceptual to physical. This phase prepares the materials and processes for the core production stage. Although less emphasized in some LCA studies, pre-processing plays a pivotal role in determining the quality and readiness of inputs for production. The core of the framework is the production phase, which includes the production process, raw material production, and energy production. This phase is particularly significant, as it often involves intensive resource utilization and high levels of emissions. The extraction and preparation of raw materials, coupled with the energy requirements, make this a key area of focus in LCA. Traditional methodologies often place substantial emphasis on this phase due to its direct association with greenhouse gas emissions, energy consumption, and other environmental impacts. Following production, the product enters the post-processing and sale phase, which includes refinement, finishing, and preparation for market distribution. This phase ensures that the product is ready for use by consumers or end-users. The use phase follows, during which the product fulfills its intended function. This phase is critical for understanding how the product interacts with its environment over its functional lifespan, whether through energy consumption (e.g., for electronic devices) or material wear (e.g., consumables). The emissions and resource demands during this phase often rival or exceed those of the production phase, depending on the nature of the product. The cycle ends with the disposal phase, encompassing disassembly, waste treatment, and recycling. This phase aims to recover value from the product, minimize waste, and reduce the environmental burden associated with its end of life. The inclusion of recycling and disassembly processes highlights the potential for circularity in the system, where materials are reintegrated into new production cycles. Throughout the life cycle, the transport process plays a vital integrative role, connecting each phase by enabling the movement of raw materials, intermediate products, energy, and finished goods. The flows in the system are depicted through product flows (represented by solid black arrows) and elementary flows (illustrated by gray arrows). Product flows show how tangible materials and products move through each stage, linking raw materials extracted from natural sources with manufacturing processes, guiding intermediate products along supply chains toward assembly, and ultimately transporting finished goods to markets. Elementary flows illustrate direct interactions with the environment, encompassing resource inputs such as water or minerals drawn from nature, as well as outputs in the form of emissions, effluents, or wastes released back into the environment.

3.2. KG Schema and KG Construction

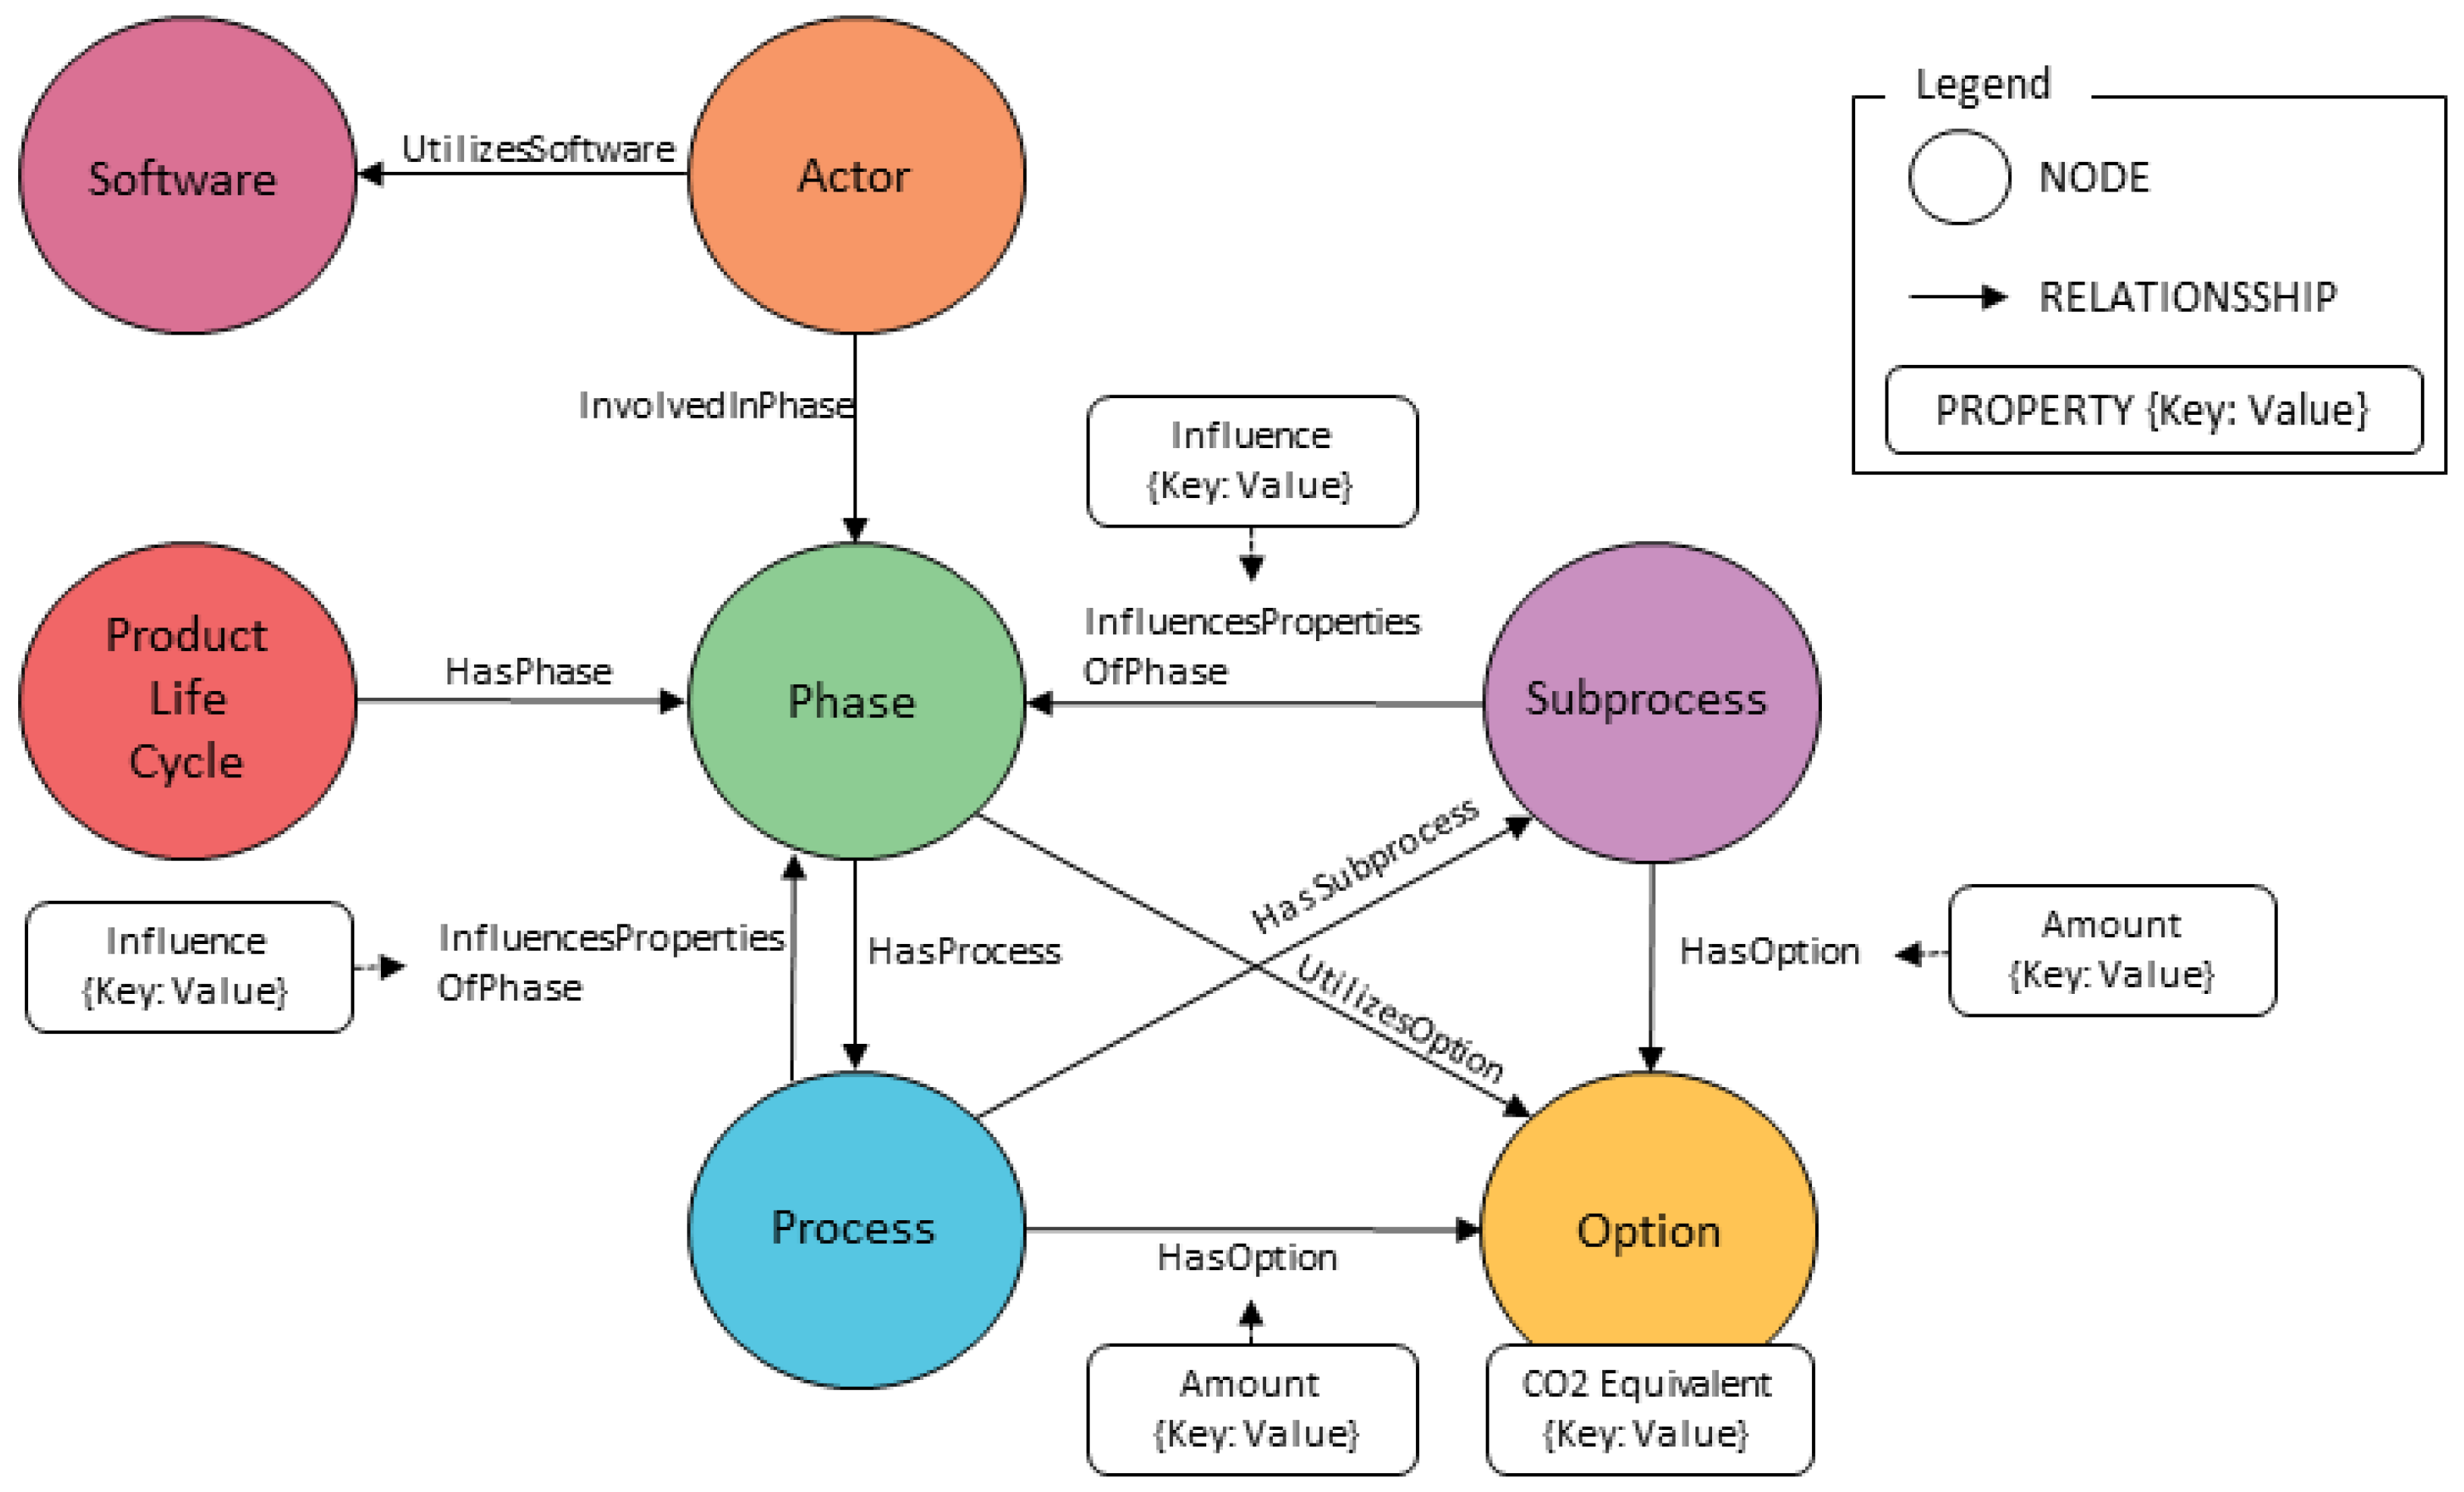
Defining the KG schema is a critical component of developing a KG. The schema serves as the blueprint for the KG, specifying the structure of nodes (entities), relationships (edges), and properties (attributes) that will represent the life cycle of the product. The proposed schema is illustrated in Figure 4.
The schema includes nodes such as “Product Life Cycle”, “Phase,” “Process”, “Subprocess”, “Actor”, “Software”, and “Option”. Relationships like “HasPhase”, “HasProcess”, “HasSubprocess”, “InvolvedIn”, “UtilizesSoftware”, “InfluencesPropertiesOfPhase”, “HasOption”, and “UtilizesOption”, which define how these nodes are interconnected. Properties attached to nodes and relationships, such as “CO2 equivalent”, “Mass”, “Distance”, and “Influence”, provide quantitative and qualitative attributes essential for analysis. The inclusion of standard nodes and relationships facilitates compatibility with existing LCA methodologies and supports the integration of life cycle inventory (LCI) data. By expanding beyond traditional LCI data to incorporate all phases of the life cycle, including design and engineering, the schema allows for a more exhaustive assessment of environmental impacts. The representation of participants and tools is achieved through the “Actor” nodes and “InvolvedIn” relationships, highlighting the roles of individuals and organizations involved in the product life cycle. “Software” nodes and the “UtilizesSoftware” relationships identify the technological tools that influence processes, which can be critical for assessing efficiency and pinpointing areas for optimization. Capturing the influences of early decisions is a pivotal aspect of the schema. The “InfluencesPropertiesOfPhase” relationship connects decisions made in one phase to outcomes in subsequent phases, emphasizing how early-stage choices affect the overall life cycle. The “Influence” property provides detailed information on the nature and magnitude of these effects, facilitating causal analysis and predictive modeling. To enable the comparison of alternatives within processes, the “Option” nodes and “HasOption” relationships are incorporated. These elements allow for modeling different choices, such as material selection or manufacturing methods, and associated properties such as “CO2 equivalent” enable quantitative comparisons based on environmental impact, cost, or performance metrics. Ensuring semantic consistency and interoperability is crucial for the utility of the KG. By aligning the schema with established standards and frameworks—such as the methodology proposed by Saad et al. [23]—the KG maintains a uniform interpretation of nodes and relationships across different datasets and analyses. The reason behind the meticulous schema design is the capture of all relevant information required for a comprehensive LCA and the support of advanced analyses. By modeling actors and software, the KG provides information on the human and technological factors influencing the product life cycle, which are often pivotal in understanding environmental impacts and identifying opportunities for sustainability improvements.
The choice of the KG construction method is highly dependent on the availability and quality of the data, as well as the clarity of the description of the process. When detailed and structured data or well-defined process descriptions are available, automated methods can be more effective. However, in cases where data are sparse or inconsistent, or process descriptions are complex and domain-specific, manual construction becomes crucial to ensure the accuracy and relevance of the knowledge graph.

3.3. Data Integration

To start with data integration, it is crucial to choose the appropriate database. Following this, data import and preprocessing are carried out. This step involves reading the data into a workable format and preparing it for analysis by handling missing values, converting data types, and cleaning inconsistencies. Data filtering follows, allowing the selection of relevant datasets based on specific criteria such as life cycle phases, emission types, or material categories. For example, emissions from certain stages of the life cycle can be incorporated, such as production, use, or end of life, depending on the focus of the analysis. Subsequently, data aggregation consolidates the filtered data to eliminate duplicates and calculate relevant metrics. This involves grouping data by unique identifiers (e.g., UUIDs), summing emission values, and aggregating other pertinent information like product names and reference years. Aggregation ensures that each data entry is unique and that emission values are accurately represented. The search and matching process is crucial to identify specific products or materials within the dataset. This can be achieved through exact matches or by employing fuzzy matching techniques using libraries such as fuzzywuzzy. Fuzzy matching is particularly useful for handling inconsistencies or variations in text data, such as typos or differing naming conventions, to ensure that relevant information is not overlooked. Once the relevant data are identified, extraction and structuring involve organizing the information into a consistent format suitable for integration into a KG. Finally, the structured data are integrated into the KG. This involves mapping the data to existing entities.

3.4. Synthetic Data Integration

While the described data integration enables the integration of available data from various databases into a KG, it is important to recognize that relevant data for every entity may not always be accessible through such databases. In many cases, especially for specific or novel products, detailed environmental data, such as precise CO2 emission values, are not readily available. Traditionally, obtaining this information would require a direct engagement with production facilities to manually record and measure the necessary data. This process involves on-site assessments, data collection from manufacturing processes, and possibly confidential information sharing, which can be time-consuming and resource-intensive. However, this traditional approach is impractical during the product design phase, a stage characterized by rapid iteration and frequent changes. Designers and engineers need immediate access to data to make informed decisions, evaluate different design options, and optimize for sustainability metrics. Waiting for precise data collection from production facilities would significantly slow down the design process and hinder innovation, and it may not be feasible due to the dynamic nature of product development. To address this challenge, we propose leveraging the semantic knowledge embedded in advanced language models to estimate missing values. Language models like GPT-4 have been trained on extensive corpora of text data, which cover a wide range of topics, including materials science, engineering, and environmental studies. These models capture complex relationships and patterns within the data, enabling them to generate plausible estimates based on contextual understanding. By entering known information about a product, such as its material composition, manufacturing processes, and intended use, the model can infer missing environmental data by relating it to similar known entities. The models are able to understand the semantic relationships between concepts, recognizing that certain materials have typical properties or environmental impacts based on their composition and production methods. Furthermore, these models can perform analogical reasoning, comparing the unknown entity to similar entities with available data. For example, if CO2 emission data for a specific type of biodegradable plastic is missing, the model can estimate it by analyzing data from similar plastics with known properties. Advanced language models have been exposed to scientific literature, industry reports, and environmental assessments, allowing them to synthesize this information and provide estimates that align with existing scientific understanding and empirical data trends. The goal is for designers to be able to explore a wider range of materials and design options, even when complete data are not available, providing flexibility in the creative process. Early-stage estimates enable preliminary assessments of environmental impacts, guiding design choices towards more sustainable options from the outset. However, there are limitations to and considerations for this approach. While language models can provide valuable estimates, they may not always match the precision of empirically collected data. It is important to validate model-generated estimates with actual data when they become available to ensure accuracy and reliability. Additionally, care must be taken to ensure that the use of language models does not inadvertently disclose proprietary information or violate data privacy regulations, addressing ethical and confidentiality concerns. The estimated data generated via language models can be incorporated into the KG with appropriate annotations indicating the source and confidence level. This integration enhances the KG’s completeness, allowing for more comprehensive analyses and queries. Over time, as actual data become available, it can replace or refine the estimated values, improving the KG’s accuracy.
The implementation of the approach begins with data pre-processing and vectorization, where existing LCI data from databases are collected and standardized to ensure consistency. These data, which include, for example, material properties, production methods, and environmental impacts, are transformed into vector embeddings using pre-trained language models such as GPT-4 and vectorization tools like sentence transformers. These embeddings encode semantic relationships between variables and are stored in a vector database to facilitate the efficient retrieval of contextually relevant data. When missing data are identified, a structured query is constructed based on the known attributes of the target entity, such as material type, production process, and application context. This query is executed against the vector database using similarity search algorithms to retrieve the most contextually similar entries. These entries serve as the basis for estimating the missing data. A prompt is then constructed to guide the language model in generating the estimate. This prompt incorporates the retrieved context and specifies the known attributes of the target material, ensuring that the model has sufficient information to produce a plausible estimate. The estimated data are integrated into the KG as a property of the relevant node. Furthermore, each estimated value is accompanied by metadata indicating that the data are estimated, rather than sourced from a database. This ensures that the estimation process is transparent and traceable within the KG. As empirical data become available, the estimated values are validated and replaced as necessary. The system supports iterative updates to refine the estimation process, using the KG’s ability to maintain historical annotations for traceability. This iterative approach ensures that the KG evolves over time, progressively improving its accuracy and reliability.

3.5. KG Quality Management

The purpose of the proposed KG is to act as a knowledge support system during the engineering phase, with a particular focus on providing early access to the LCA data. This fit-for-purpose design ensures that the KG serves as a critical tool for engineers, facilitating informed decision-making by seamlessly integrating up-to-date LCI data into the product development process. To address the challenges associated with this application while preserving simplicity, as quality control should not be more complex than the construction and application of the graph, we propose two distinct implementations to support the fitness-for-purpose quality of KGs in our methodology.
Initially, to verify the completeness and basic accuracy of the model, the following Cypher queries will be utilized. To detect nodes with identical labels and properties, we executed the query depicted in Listing 1.
Listing 1. Cypher Query for Identifying Duplicate Nodes.
Applsci 15 00175 i001
This query identifies all pairs of nodes with the same labels and properties. Duplicate nodes might indicate redundancies in the graph that should be reviewed for potential merging or removal. To find relationships between the same pairs of nodes with identical types and properties, we executed the query depicted in Listing 2.
Listing 2. Cypher Query for Identifying Duplicate Relationships.
Applsci 15 00175 i002
Redundant relationships can create unnecessary complexity and should be carefully evaluated for removal. To locate nodes without any relationships, the query in Listing 3 was used.
Listing 3. Cypher Query for Finding Isolated Nodes.
Applsci 15 00175 i003
Isolated nodes may indicate incomplete data or modeling issues that require further investigation. To ensure that all nodes have the required properties, we executed the query depicted in Listing 4.
Listing 4. Cypher Query for Nodes with Missing Properties.
Applsci 15 00175 i004
This query identifies nodes missing specific properties, ensuring consistency in node attributes.
Second, regular updates of LCI data are essential to maintain the temporal integrity of the KG. This can be achieved by implementing update pipelines that periodically retrieve and integrate the latest LCI data from authoritative sources. Typically, LCI data need to be updated annually, as the information is not very granular, and only yearly averages of energy consumption are calculated for regions and various production processes [45]. Once the existing LCI information is updated with these new data, the augmented LCI integration should be repeated. This repetition is necessary because the LLM predictions can change significantly when they are provided with an updated context from the latest LCI data.

3.6. KG Application

The application of an enriched KG provides a wide range of analytical capabilities, leveraging the inherent structure and interconnected nature of graph data to generate actionable insights and improve decision-making. These capabilities encompass direct querying, integration with advanced AI models, graph-based analytical techniques, and causal inference, each of which offers unique advantages.
The use of Cypher queries enables direct interaction with the KG. This allows users to retrieve specific information, identify patterns, and aggregate information efficiently. For example, in a KG representing the lifecycle of a product, Cypher queries can be used to pinpoint all suppliers involved in a particular production phase or to identify nodes with high centrality to reveal key intermediaries within the supply chain. By facilitating a targeted exploration of the graph, Cypher provides an essential mechanism for extracting actionable information from complex datasets. Another application is Graph RAG (Retrieval-Augmented Generation), which combines the structured retrieval capabilities of the graph with the generative power of language models. This integration enables the generation of more accurate, contextually aware responses in applications such as conversational AI or content creation. For example, in a system designed to address sustainability in manufacturing, Graph RAG can retrieve emissions-related data from the KG and incorporate them into a response to a user query, providing highly relevant and informed answers. This approach enhances the depth and quality of AI-driven systems by grounding generated content in reliable graph-based data. The application of Graph Data Science further extends the analytical utility of the KG by employing advanced algorithms to uncover structural and relational insights. Techniques such as community detection help identify tightly connected groups of nodes, which may represent clusters of suppliers or facilities that work closely together. Shortest path analysis, another key technique, can determine the most efficient routes or sequences between nodes, supporting tasks such as supply chain optimization or resource flow analysis. Centrality metrics, which evaluate the importance of nodes within the graph, are particularly useful for identifying critical entities or bottlenecks in complex processes. These tools allow organizations to uncover hidden patterns and relationships that may not be apparent through conventional analysis. Lastly, Causal AI adds a powerful layer of interpretability by moving beyond correlation to identify true cause-and-effect relationships within the data. Using the interconnected nature of the KG, causal inference can reveal dependencies and feedback loops, offering critical insights for decision-making. For example, it can help determine how changes in raw material sourcing impact energy consumption or how delays in one stage of production ripple through the supply chain to affect overall output. This capability enables scenario analysis and supports strategic planning by providing a deeper understanding of potential interventions and their consequences.
Together, these applications transform the KG into a dynamic analytical tool. By enabling advanced querying, integrating contextual knowledge into AI systems, uncovering structural patterns, and identifying causal relationships, the KG becomes an invaluable resource for generating insights, supporting decision-making, and driving innovation.

4. Case Study: 3D Printing

To demonstrate the potential of these applications, we present a case study on 3DP, also known as additive manufacturing. This technology, characterized by producing three-dimensional objects by joining materials layer by layer under computer control [46], serves as an ideal domain for exploring the analytical power of the KG. 3DP involves complex workflows, diverse stakeholders, and intricate interdependencies between design, material selection, production processes, and environmental impacts. By modeling these interactions in a KG, we can showcase how advanced querying, graph algorithms, retrieval-augmented generation, and causal inference can yield actionable insights and optimize 3DP workflows.

4.1. Relevance of 3DP in Advancing Sustainability

3DP is anticipated to continue its rapid growth due to several key advantages over traditional manufacturing technologies. These benefits include enhanced freedom of design [47], allowing the creation of intricate and innovative structures, as well as rapid prototyping [48], which accelerates product development cycles. Furthermore, 3DP supports mass customization and the production of complex structures tailored to highly specific requirements [49,50], allowing manufacturers to meet diverse consumer demands with unprecedented precision. Other notable advantages include one-piece fabrication using multiple materials and the potential for decentralized production, which reduces the reliance on centralized manufacturing hubs and facilitates localized production [49].
In the construction sector, 3DP has emerged as a sustainable and eco-friendly production technology [46,49,50], offering environmental benefits over traditional methods. Its adoption in construction not only supports greener practices but also addresses critical sustainability challenges. Among the most significant environmental advantages of 3DP are the following:
  • Waste reduction: 3DP fabricates products layer by layer, utilizing only the material required to create the final product [49]. This approach results in substantial material savings and significantly reduces waste generation [46,51].
  • Production on demand: 3DP enables the production of only the necessary quantities of a product when needed, thus minimizing the need for large inventories and reducing the risk of overproduction [50].
  • Reduction in transportation: The potential for local production allows products to be manufactured closer to their point of use, thus reducing the distances the goods need to travel. This leads to lower transportation costs and reduced emissions associated with transport [46,51].
  • Efficient use of resources: by promoting more efficient use of resources, as well as enabling recycling and remanufacturing processes, 3DP aligns closely with the principles of a circular economy [49].
  • Efficient use of energy: 3DP reduces overall energy demands [46,49,52]. This efficiency contributes to the adjustment of energy structures, supports circular economy strategies, and encourages the transformation and upgrading of industrial structures [49].
  • Reduction of emissions: Process-related CO2 emissions per unit of GDP can be significantly reduced by adopting 3DP, contributing to lower carbon footprints [46,52].
Nevertheless, in evaluating these prospective advantages, it is crucial to also account for the adverse effects on the environment that may arise from the implementation of 3DP technology. One of the primary concerns is the energy consumption of 3D printers, particularly those that work with high-temperature materials or metal powders. These printers often require significant amounts of energy to operate. If this energy is sourced from non-renewable resources, associated carbon emissions can contribute substantially to climate change [53]. Moreover, the environmental implications of emissions produced throughout the printing process constitute an additional area of concern. Specifically, the thermal melting and subsequent extrusion of plastic materials can emit volatile organic compounds (VOCs), along with ultrafine particulate matter, into the atmosphere. These emissions are identified as harmful, posing significant risks to both human health and the broader environment [53]. Additionally, there exists a considerable deficit in the comprehensive understanding and assessment of the overall environmental repercussions associated with 3DP technologies. Although its technological and economic advantages are frequently discussed, comprehensive investigations of its environmental performance remain limited [3]. Although some LCA studies have been conducted on additive manufacturing [50], they are significantly outnumbered by extensive research focused on the mechanical manufacturing industry [54,55]. The limited studies available often focus on narrow aspects, such as specific case studies [52], or address energy consumption alone [3], without providing a holistic view of the environmental implications throughout the 3DP lifecycle. Conducting LCAs for 3DP presents several challenges. These include a lack of transparency and expertise in performing LCAs, difficulties in defining system boundaries, and the variability in general databases available for reference [3]. Furthermore, limited accessible data on costs, energy use, and CO2 emissions for individual processes in the 3DP chain further complicate LCA evaluations [52]. The diversity of materials, feedstock forms, production processes, and end-use applications in 3DP introduces additional complexity [50]. In addition, the energy consumption of printers varies, depending on multiple factors, such as machine specifications, material types, and printing conditions, making it challenging to compare LCA results in different use cases [3]. Given these challenges, the comprehensive LCA of 3DP products provides an ideal opportunity to validate the methodology presented in this article. By addressing the complexities and data integration issues inherent in 3DP, this case study illustrates the utility of the proposed framework.
To align with the methodological structure of this paper, this section is divided into subsections corresponding to the key components of the methodology: domain expertise, LPG model, data integration, and KG application.

4.2. Domain Expertise of 3DP

In the first step of the methodological framework, a basic understanding of the 3DP process of a product should be established. In this case, the understanding was archived mainly through a literature review. In our earlier publication [56], we presented a preliminary examination of the 3DP process. This current study builds upon that by adding further details to each stage of the product life cycle and by including more information and further studies.
The engineering phase marks the commencement of the process, encompassing both the design formulation and the choice of materials. During the preliminary phase of 3DP, the design is developed, often utilizing advanced software to design and fine-tune complex geometrical structures [57]. Engineers utilizing a 3D design software, known as computer-aided design (CAD) software, or a 3D scanner, have developed this design, serving as the foundation for production. The final output needs to be a closed-volume model with specified dimensions of height, depth, and width [58]. Instead of conventionally using CAD software, it can be beneficial to combine 3D laser scanning with rapid prototyping, highlighting improvements in costs, speed, and accuracy over conventional methods [59]. Furthermore, integrated 3D scanning with reverse engineering can be effective for quality control in the manufacturing of rapid-response products [60]. To make certain the design is feasible, both designers and engineers need to evaluate the capabilities and limitations of 3DP technology. For instance, in multi-material 3D printing, they contribute to the production of functional materials that possess complex microstructural characteristics [61]. In addition, the printing technique must be selected during the creation procedure [58]. Furthermore, the engineer must give careful thought to the integration of various additives, the selection of appropriate post-processing techniques, and the formulation of an effective design strategy. Following the creation of the design, suitable materials are chosen, based on specific application requirements, taking into account mechanical properties, printing speed, and resolution [62]. Materials scientists and engineers play a crucial role in the selection of appropriate materials that meet the requirements [63]. The materials could differ between metal, paper, and plastic [58]. The following activities are part of pre-processing. The 3D-CAD-model has to be exported as a net consisting of triangles. The common file formats are STL for daily use and IGES or STEP for use in industry. After that, the new model has to be checked for printability, focusing on the units of dimensions and the orientation of the net’s normal vectors. These steps could be performed using software. For production, this file has to be transferred to computer-aided manufacturing (CAM) software, called Slicer; through multiple steps, this program creates a CNC code that could be executed via a machine [64]. During the slicing stage, there is the possibility to fine-tune a multitude of parameters within the software for an enhanced outcome. Fundamental configurations are adjustable, such as the height of the individual layers, the density of the infill pattern, the velocity at which printing occurs, and the thickness of the walls. Furthermore, the software provides advanced configurations that allow for an optimized process [58,65]. The majority of 3DP methodologies necessitate the inclusion of support structures, which are systematically integrated into the workflow using the slicer as part of the pre-processing phase [58]. The printing process involves layer-by-layer material deposition to produce the physical object. This process uses a range of printing technologies, each chosen based on the material used and the complexity of the design [66]. The use of certain additives, such as accelerators and decelerators, is often dictated by the chosen printing technology, particularly when working with concrete, which requires materials with unique properties [67]. Zhang et al. (2019) highlight that the practicality, the setting and hardening times, and the mechanical characteristics of 3D-printed concrete can be significantly improved through the careful selection of materials [68]. Furthermore, it is important to note that not all materials can be produced in-house, resulting in the emergence of numerous specialized material suppliers. Once printing has concluded, the process of post-processing initiates. This stage may encompass a variety of activities, such as cleanup tasks [58], the application of color, or treatments aimed at enhancing certain material properties or carrying out other refinement procedures. This phase ultimately culminates in preparing the product for its final application, which can include activities like sales [67] and assembly. Notably, these tasks are exclusively performed by the technician, with no additional personnel involved; hence, all associated actions are characterized as messages intended solely for the technician’s awareness. The duty of quality control specialists is to verify that the completed item, created by the technician, adheres to the essential standards and specifications required for its designated function. Concurrently, marketing experts are responsible for positioning the product to correspond with a target demographic [69]. Subsequently, the product will be delivered to the end-user or customer. Regarding the topic of transport, some important facts must be mentioned. 3DP facilitates the use of locally available materials, providing an avenue for significant cost reduction in various applications. An extreme example is extraterrestrial construction, where local dust, such as lunar regolith, can be used. This approach significantly reduces the costs associated with transporting raw materials to locations outside the Earth. The potential savings are substantial, considering the costs of shipping a single brick to the Moon, which could be as high as $2 million [70]. Moreover, 3DP can enable more efficient distribution networks. Urban centers can be established to coordinate material flows and consolidate expertise. However, raw materials for 3DP still need to be supplied to these centers [71]. This technology alters the traditional mass production and distribution model, moving toward a localized demand-driven production paradigm. Products can be printed according to specific needs and requirements, reflecting a significant change in the manufacturing and distribution approach. 3DP also allows the production of objects near or directly by consumers, employing just-in-time printing techniques [72]. Upon reaching the conclusion of the printed component’s lifespan, the customer has the choice between discarding the part in a landfill, where it will undergo dismantling, or opting for delivery to a recycling facility, where comprehensive processing will occur. Within the domain of 3D printing, recycling encompasses a multitude of intricate procedures, beginning with the critical phase of material characterization and analytical assessment to identify any impurities. This process entails, for example, the evaluation of microstructural characteristics and examining surface integrity in powders to determine levels of oxidation and contamination [73]. This phenomenon can be elucidated within contexts such as analytical laboratories, where the deployment of advanced imaging techniques is prevalent, including the utilization of methods like X-ray tomography imaging for detailed investigation [74]. Further studies underscore the importance of understanding the material for efficient recycling [74,75]. The subsequent phase encompasses the pretreatment of recycling materials, particularly applicable in industrial processing facilities. This stage may incorporate various techniques including, but not limited to, high-energy washing, melt extrusion procedures, and the implementation of compression molding specifically within PLA processes, as delineated by [76]. Ultimately, the additive manufacturing process can be executed with parameters that adhere closely to standard settings or involve marginal adjustments, which have the potential to enhance the mechanical attributes of certain materials, such as recycled polypropylene (PP), as indicated by [77]. Furthermore, the concept of decentralized recycling plays an important role in enabling localized waste management [78], which not only improves the recycling process but also increases overall recycling rates. This is particularly beneficial because not every company has the facilities and capabilities necessary for effective recycling; therefore, decentralizing the process assists in greater adoption and implementation. In the field of 3D polymer printing, a sector that experiences a substantial annual growth rate of 26%, there is a corresponding increase in material waste [79], underscoring the growing importance and need for effective recycling practices. Further studies underscore the importance of the circulatory economy for 3DP in preventing landfill accumulation [80].

4.3. KG Schema and KG Construction

This subsection deals with the KG schema adapted to the 3DP process, which is built according to the methodological framework and is filled with the information obtained in the previous process description.
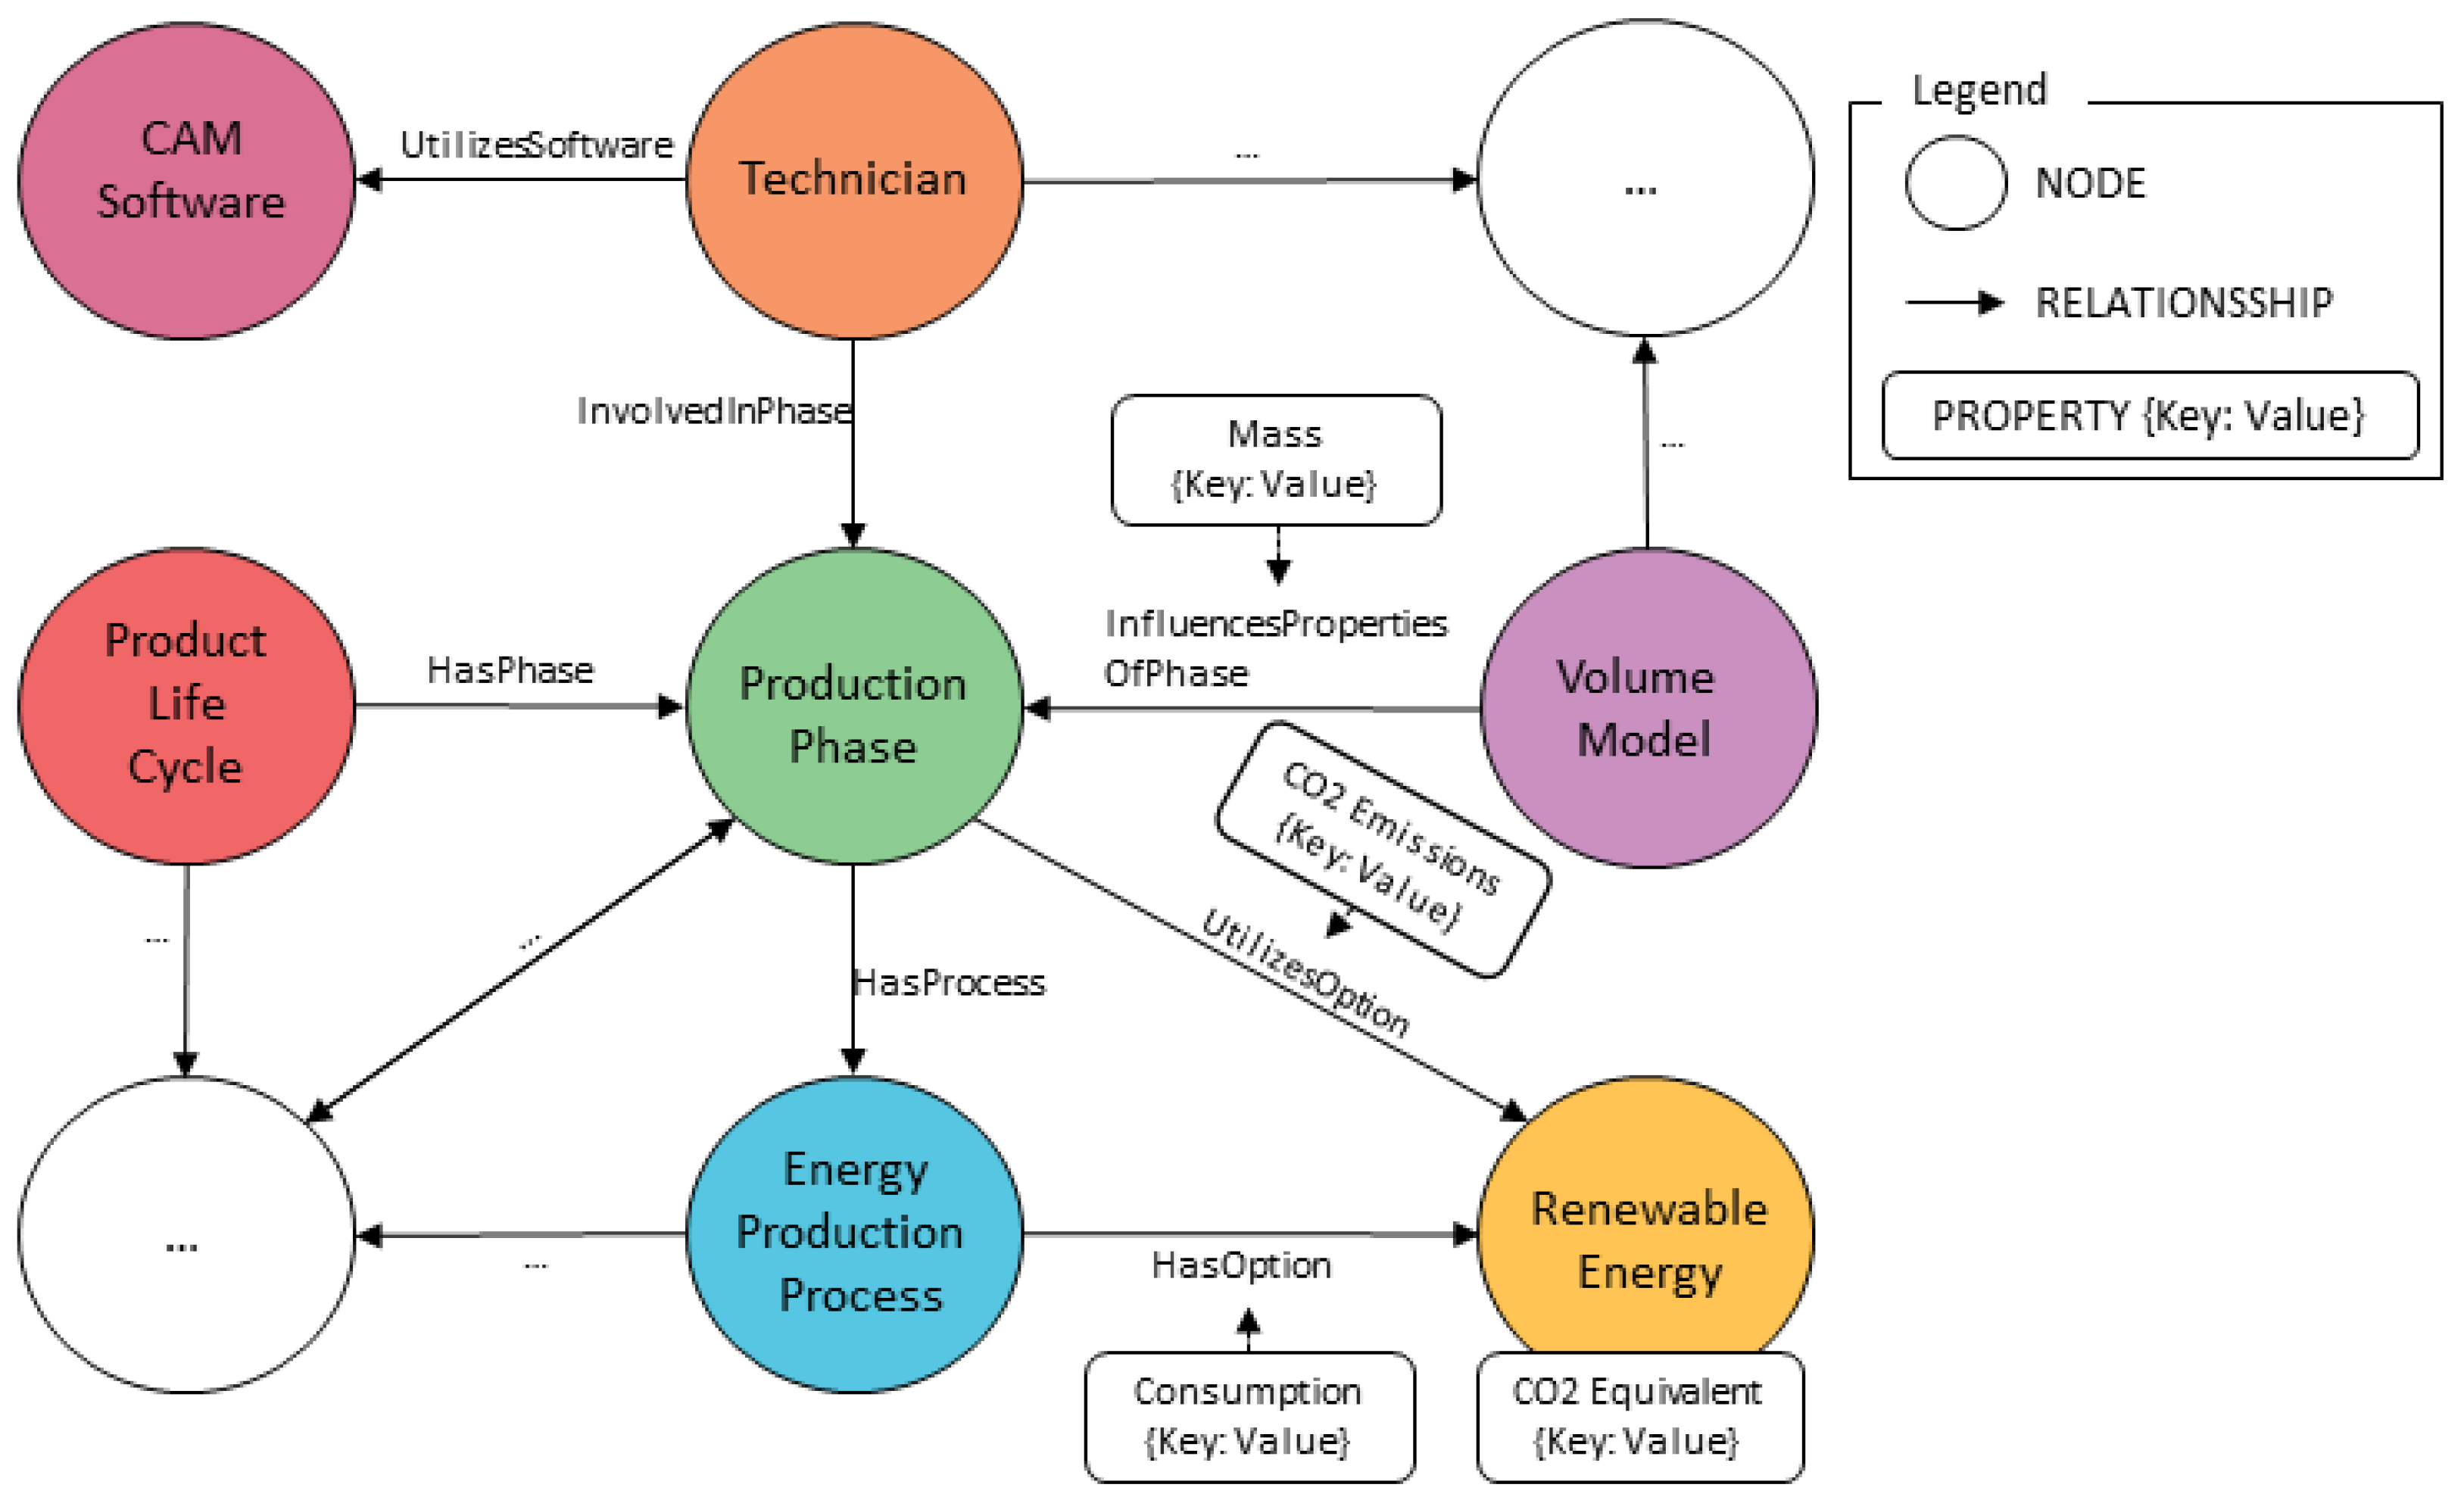
The adapted schema for the 3DP process is illustrated in Figure 5.
On the left-hand side of the illustration, the red “Product Life Cycle” node represents the overarching lifecycle of a 3D-printed part. Among its connections, the “HasPhase” relationship links this node to the “Production Phase”, depicted as a green node. Other connections of the red node, which are not included in the excerpt, are indicated by empty relationships leading to placeholder nodes. This notation is consistently applied to represent relationships with entities not shown in the diagram. The “Production Phase” node is connected to several processes, represented by blue nodes. One such process, the “Energy Production Process”, is included in this excerpt. This node is linked to various option nodes through the “HasOption” relationship, which represents possible energy sources. For example, “Renewable Energy”, shown as a yellow node, is one of the options and is annotated with the property “CO2 Equivalent”, reflecting its environmental impact. Additionally, the “Production Phase” node is directly connected to the “Renewable Energy” node via the “UtilizesOption” relationship, indicating that this specific energy source is employed during the phase. The relationship itself carries properties that further describe its role, though these properties are not explicitly detailed in this excerpt. Above the “Production Phase” and its associated processes, the actors involved in the phase are represented by orange nodes. In this case, the actor is a “Technician”, who is connected to a “CAM Software” node via the “UtilizesSoftware” relationship. This connection signifies the tools or software employed by the technician during the production phase. On the right-hand side of the illustration, the purple “Volume Model” node represents a subprocess related to another phase. It is connected to the “Production Phase” via the “InfluencesPropertiesOfPhase” relationship, which carries the property “Mass”. This connection highlights the impact of the volume model on the properties of the production phase, providing a detailed view of the interdependencies within the process.
In our case study, we opted to construct the KG manually, which is essential for the accurate incorporation of domain-specific information, particularly when data are incomplete or limited. Referencing the information presented in Section 3.1, we created the KG according to the schema described. This approach allowed us to tailor the graph to meet the unique requirements of the application, effectively capturing critical nuances and interdependencies that automated methods might miss.

4.4. Data Integration Through Databases

To start with, it is crucial to choose the appropriate database, and for our case study, we opted for the publicly accessible Ökobau.dat database, given its wealth of material data pertinent to our specific scenario.
Table 1 presents an excerpt of LCI data for construction materials, including their lifecycle modules, global warming potential (GWP) in kg CO2-eq, and ozone depletion potential (ODP) in kg CFC-11-eq. Materials such as wood fiber insulation (A2) have moderate GWP (0.367) and very low ODP (7.33 × 10⁻¹⁰). Fiber cement facade panels (C2) show low GWP (0.042) and negligible ODP (1.08 × 10⁻¹⁵). Clay plaster (A5) has the highest GWP (7.926) but similarly low ODP (2.30 × 10⁻¹⁵). Fly ash (A1–A3) has no measurable impact (GWP and ODP both 0). Cement types (A1–A3) show moderate GWP: 0.688 for CEM IV 42.5 and 0.795 for CEM II 42.5, with low ODP values (around 3.8 × 10⁻¹⁵ for both).
The modules represent different stages or activities in the product’s life cycle, categorized according to standardized frameworks such as EN 15804 [81]. These modules define the boundaries within which environmental impacts are assessed for specific materials or processes. They are typically organized into distinct phases: production (A), construction (B), usage (C), and end of life (D). Each phase is further divided into specific modules, for example, A1 (raw material supply, which includes the extraction and processing of raw materials) and A2 (the transportation of raw materials to the manufacturing site).

4.5. Synthetic Data Integration

As stated in Section 3.4, in many cases, especially for specific or novel products, detailed environmental data, such as precise CO2 emission values, are not readily available; therefore, we propose leveraging the semantic knowledge embedded in language models to estimate missing values. We specifically employed the gpt-4o-2024-08-06 language model.
To evaluate the accuracy of the model estimations, we employed a validation strategy. Starting with a complete dataset where all GWP values are known, we randomly removed 10% to create a test set, with the remaining 90% serving as a contextual knowledge base. We used LangChain to generate embeddings of the 90% dataset, capturing semantic information of the variables of each entry such as material properties, module and environmental impacts, and we stored these embeddings in a vector database for efficient retrieval. For each entry in the test set, we constructed prompts that included known variables and retrieved context from similar entries, instructing the language model to estimate the missing GWP value. The language model, leveraging both its semantic understanding and the retrieved contextual information, generated estimated GWP values. We then compared these estimates with the actual values in the test set, calculating the mean absolute error (MAE) metrics and relative error percentage to evaluate the model performance.
The MAE was 2.19, which indicates the average deviation of the estimated values from the actual values. The mean relative error percentage was 23.74%. These metrics demonstrate a moderate deviation between the estimated and actual values, suggesting a reasonable degree of accuracy.
To illustrate the distribution of original and estimated GWP values, descriptive statistics were calculated as shown in Table 2.
The similarity in central tendencies, such as the mean and median, between the actual and estimated GWP values suggests that the estimates fall within a realistic range. However, the larger standard deviation in the original values indicates that some extreme values are present in the original dataset, which are less represented in the estimated values. This result implies that, while a language model can provide robust approximations, it may not capture extreme values with high accuracy.
To further demonstrate how GPT-4o estimates missing GWP values, two examples of missing values were analyzed. In Table 3 the generated outputs and validation metrics for each example are presented.

4.6. KG Quality Management

The construction of KGs within the current product development phase presents unique quality challenges, primarily due to the limited availability of readily accessible data. Typically, quality concerns arise when KGs are built using automated tools. However, in the absence of sufficient data, the efficacy of automated data crawlers is significantly diminished, necessitating the manual construction of KGs. This manual approach inherently reduces the likelihood of common redundancies associated with automation, as it allows for more deliberate and controlled data integration. Nevertheless, the dynamic nature of KGs within this framework introduces potential risks of both redundancies and omissions. As the KG evolves over time, there is an inherent risk of inadvertently duplicating existing information or omitting previously incorporated data, which can adversely affect the consistency and integrity of the KG. Furthermore, temporal aspects introduce significant quality challenges. The integration of LCI data exemplifies this issue, as such data are subject to change over time due to evolving processes and methodologies. As processes are updated or refined, the associated LCI data can become outdated, leading to discrepancies between the KG and the current state of the processes it represents. This temporal lag can undermine the accuracy and reliability of the KG, which requires ongoing maintenance and updates to ensure that the information remains current and reflective of real-world changes. The queries from Section 3.1 were applied to consistently detect and resolve duplicate nodes and relationships, thereby removing redundancies and refining the graph structure. Furthermore, the queries successfully detected isolated nodes and nodes with missing essential properties, ensuring that all elements within the KG are interconnected and consistently defined. Since the KG was recently constructed, temporal updates were deemed unnecessary at this stage, allowing the focus to remain on maintaining the current quality and structure of the graph.

4.7. Developed KG

Figure 6 illustrates the entire KG that captures the multifaceted and interconnected nature of the 3DP ecosystem, with a zoomed-in excerpt highlighting individual nodes to make their names and relationships readable. The model reflects the complexity of 3DP by encompassing 135 nodes and 128 relationships, distributed across 6 distinct node labels and 7 unique relationship types. The entities and relationships are further enriched by 32 different property keys. For example, property keys for materials include co2EquivalentPerKg, density, and costPerUnit, while energy-related nodes have energyConsumption and emissionFactorPerKwh. Process nodes include keys such as duration and failureRate, and transport nodes capture properties such as distanceKm and greenhouseGasPerTkm. Additionally, phase nodes have descriptive attributes like startDate, endDate, and dependencies, while actor nodes include roleName and expertise. These diverse properties allow for a nuanced analysis of the 3DP ecosystem, supporting tasks such as sustainability assessments, process optimization, and decision-making.
To further analyze the structure and distribution of the KG, Table 4 provides a summary of key metrics, focusing on the most frequent nodes and their connectivity characteristics.
The Top 5 Node Frequencies section highlights the most common node types, with “Option” nodes being the most frequent (76 instances), followed by “Process” and “Software” nodes (14 instances each), reflecting the granularity with which alternative options and processes are captured. “Subprocess” and “Actor” nodes also contribute significantly to the KG, representing detailed workflows and the roles involved.
The Top Five In-Degree Metrics section identifies nodes that receive the highest number of incoming connections. For example, the “Production Phase” node has the highest in-degree (10 connections), indicating its central role as a phase influenced by multiple inputs, such as materials, software, and subprocesses. Similarly, nodes like “Transport Process” and “Post-Processing and Sale Phase” (four connections each) highlight other critical phases within the life cycle.
The Top Five Out-Degree Metrics section shows nodes with the most outgoing connections, which signify their influence within the KG. The “3D Printing Process” node leads with 14 outgoing connections, demonstrating its role as a central hub for downstream activities. Other nodes, such as “Material Option” (eight connections) and “Post-Processing” (seven connections), highlight key options and subprocesses that propagate their influence throughout the system.

4.8. KG Application: Cypher Queries

Although the primary objective of this research was the construction of a KG to represent the life cycle of 3D-printed products, it is essential to demonstrate the analytical capabilities of the KG to showcase its practical utility. To this end, we used Cypher queries to extract and analyze data from the Neo4j graph database, providing insight into various aspects of the product life cycle. These examples illustrate how the KG can facilitate complex queries and aggregations, thereby enabling in-depth analysis and decision-making support.
Using Cypher, we interacted with KG to extract information relevant to the life cycle of 3D-printed products. The following subsections present representative queries and their results.

4.8.1. Roles Involved in Life Cycle Phases

To identify the roles involved in each phase of the product life cycle, we executed the query depicted in Listing 5.
Listing 5. Cypher Query for Querying the corresponding roles for each product life cycle phase.
Applsci 15 00175 i005
This query matches all Actor nodes connected to Phase nodes via the InvolvedInPhase relationship, effectively mapping each phase of the product life cycle, represented by ProductLifeCycle nodes, to the actors involved. The results are summarized in Table 5.
This mapping provides clarity on role responsibilities throughout the product life cycle, which is critical for resource planning and process optimization.

4.8.2. Environmental Impact Assessment

To assess the environmental impact associated with the product’s life cycle, we calculated the total CO2 emissions by aggregating the emissions from material use, energy consumption, and transportation. The calculations mentioned are executed by the query illustrated in Listing 6.
This query calculates CO2 emissions across the product life cycle by focusing on three main sources of emissions: materials, energy, and transportation. Material emissions are computed by multiplying the quantity of material used (um.amount) by the material’s CO2 equivalent per kilogram (m.co2EquivalentPerKg). For example, in the case of cement (CEM IV 42.5), using 100 kg of material with a CO2 equivalent of 0.688 kg CO2/kg results in 68.8 kg CO2. Energy emissions are calculated by multiplying energy consumption (ce.consumption) by the emissions factor of the energy source (e.co2EmissionsPerKwh). For example, consuming 100 kWh of electricity with a factor of 0.4 kg CO2/kWh results in 40.0 kg CO2. Transport emissions are derived from the distance traveled (ut.distanceKm) and the greenhouse gas factor of the transport mode (tm.greenhouseGasPerTkm). For a transport distance of 150 km and a transport mode with a factor of 0.1 kg CO2/tkm, the emissions amount to 15.0 kg CO2.
Listing 6. Cypher Query for Calculating Emissions.
Applsci 15 00175 i006
To ensure flexibility, the query uses dynamic module filtering, allowing emissions to be calculated only for specific stages of the life cycle, such as the extraction of raw materials (A1), transportation (A2) or manufacturing (A3). The dynamic filtering ensures that only emissions corresponding to the selected modules are included. The total emissions are computed by summing material, energy, and transport emissions. These results are illustrated in Table 6, which compares two scenarios involving different types of cement.
Scenario 1 uses cement (CEM IV 42.5) with material emissions of 68.8 kg CO2, energy emissions of 40.0 kg CO2, and transport emissions of 15.0 kg CO2, resulting in total emissions of 123.8 kg CO2. Scenario 2 uses cement (CEM II 42.5) with material emissions of 79.5 kg CO2, energy emissions of 40.0 kg CO2, and transport emissions of 10.0 kg CO2, leading to total emissions of 129.5 kg CO2. In both scenarios, the energy emissions remain constant at 40.0 kg CO2 because the same amount of energy (100 kWh) is consumed during the production process, regardless of the type of cement used. However, transport emissions vary between the scenarios due to differences in the transport distances. For Scenario 1, the transport distance is 150 km, resulting in higher emissions compared to the shorter transport distance of 100 km in Scenario 2. This comparison demonstrates how material selection and transportation strategies can influence the overall CO2 emissions of 3D-printed components, enabling designers to make more sustainable decisions early in the product life cycle. The modular approach ensures that the query can be adapted to include other phases or environmental indicators, such as ozone depletion potential or acidification potential, for a more comprehensive analysis.

4.8.3. Influence of Engineering Decisions on Production Phase

To investigate the dependencies and influences of early engineering decisions on subsequent production phases, we executed the query depicted in Listing 7:
Listing 7. Cypher Query for Identifying Influences in 3D Printing.
Applsci 15 00175 i007
This query retrieves pairs of nodes connected by the InfluencesPropertiesOfPhase relationship, indicating how specific decisions or parameters influence downstream phases of the product life cycle. The results are summarized in Table 7.
These results illustrate how engineering decisions, such as the selection of a volume model or CAM software parameters, propagate downstream and influence multiple phases of the 3DP product life cycle. For example, the “VolumeModel” directly impacts the “Production Phase” by determining the mass of the product, which affects material consumption and energy requirements during manufacturing. Additionally, it influences the complexity of assembly and disassembly processes, which are critical for the post-processing and disposal phases. Similarly, decisions made in the “Material Selection” phase influence the transport distance required in the “Transport Process”, highlighting the interdependencies between design choices and logistical considerations.
Understanding these relationships allows engineers to anticipate the downstream effects of early decisions, enabling the optimization of product design for efficiency and sustainability.

5. Discussion

This research highlights the remarkable potential of blending domain-specific knowledge with cutting-edge knowledge graph techniques to improve practices in life cycle assessment. By expanding the scope of traditional LCA to include early-stage decisions of the design and engineering phases, we have demonstrated a more holistic approach that captures the full spectrum of a product’s environmental impact. The development of a meticulously defined schema using a labeled property graph (LPG) model proved effective in representing the complex relationships and entities involved in a product’s life cycle. This comprehensive schema facilitated the inclusion of not only the standard life cycle phases but also the intricate interactions between actors, software tools, and decision-making processes that influence environmental outcomes. Our case study on 3DP serves as a compelling proof of concept for the proposed methodology. The 3DP domain, characterized by rapid technological advancements and a paucity of comprehensive LCA data, presented an ideal context to test the efficacy of our approach. By constructing a KG that encapsulates 135 nodes and 128 relationships, we successfully modeled the entire life cycle of a 3D-printed product, from the initial design to end-of-life considerations. One of the most salient findings from the KG analysis is the profound influence of early-stage engineering decisions on subsequent production phases and the overall environmental impact. For example, choices made during the design phase, such as material selection and geometric configurations, were found to significantly affect material consumption, energy usage, and waste generation in the later stages. The ability to trace these influences within the KG highlights the critical importance of proactively integrating sustainability considerations at the beginning of the product development process. Secondly, through this ability to trace influences of early decisions, the focus can lie reactively on important levers for sustainability for the next product generations in order to ensure sustainable development in the future. The analytical applications of the KG further demonstrate its utility in extracting actionable insights. Through precise Cypher queries, we identified the specific roles involved in each life cycle phase, providing clarity on stakeholder responsibilities and facilitating more effective resource allocation. The aggregation of CO2 emissions data across materials, energy sources, and transportation modes enabled a quantifiable assessment of the product’s environmental footprint. This comprehensive emission profiling is instrumental for organizations aiming to meet stringent sustainability targets and for policymakers formulating environmental regulations. Moreover, the KG’s capability to model alternative scenarios through “Option” nodes allows for comparative analyses of different design and production choices. This feature allows decision-makers to evaluate trade-offs between various materials, processes, and technologies based on quantitative environmental metrics. Such analyses can inform strategic decisions that optimize both performance and sustainability, driving innovation in product development. The integration of data using advanced language models to estimate missing values represents a significant advance in addressing data gaps common in the early design phases. Using the semantic understanding of models like GPT-4, we were able to generate plausible estimates for critical environmental data, such as CO2 emissions for specific materials or processes. This approach not only accelerates the design process by providing immediate access to the necessary data but also enhances the completeness and robustness of the KG. Our validation results indicate that the language model estimations align closely with the actual data, demonstrating mean absolute errors and relative error percentages within acceptable ranges for preliminary assessments. This finding suggests that advanced language models can serve as reliable tools for supplementing incomplete datasets, thereby improving the quality of LCA in contexts where empirical data are scarce or difficult to obtain. The successful application of the methodology to the 3DP case study also highlights its scalability and adaptability to other domains. The modular nature of the KG schema allows customization to accommodate different industries, products, and processes. This flexibility positions the methodology as a valuable framework for organizations in various sectors looking to enhance their sustainability assessments. In addition, KG facilitates advanced analyses such as causal inference, which can uncover hidden dependencies and causal relationships within the product life cycle. Identifying these relationships is crucial to developing strategies that mitigate adverse environmental impacts and improve the overall efficiency of the product development process. The findings of this study contribute significantly to the field of sustainable product development and LCA by providing a robust methodology that integrates advanced data modeling techniques with domain-specific knowledge. The ability to capture the intricate web of interactions and influences throughout the product life cycle enables a more accurate and comprehensive assessment of environmental impacts. Furthermore, the methodology promotes a shift towards proactive sustainability, where environmental considerations are integrated into decision-making processes from the earliest stages. This proactive approach is essential to achieve long-term sustainability goals and promote innovation that aligns with environmental stewardship.

6. Limitations

Despite the promising results and the comprehensive nature of the proposed methodology, several limitations must be acknowledged to contextualize the findings and guide future research.
Firstly, the construction of the KG demands significant domain expertise and meticulous attention to detail in the schema definition. The process involves identifying and modeling a wide array of entities, relationships, and properties, which can be time-consuming and complex. This requirement may pose a barrier for organizations or researchers with limited resources or expertise in both domain and graph database technologies. The same challenges occur for the maintenance of the KG. The dynamic nature of the product life cycles and environmental impact factors means that the KG must be regularly updated to remain relevant and accurate. This maintenance requires ongoing effort and resources, which may not be feasible for all organizations, particularly smaller entities or those operating in rapidly changing industries. Furthermore, ensuring semantic consistency and interoperability with existing standards requires ongoing efforts for construction and maintenance, especially as new data become available or as industry standards evolve.
Secondly, data integration from sources like the Ökobau.dat database, although beneficial, comes with challenges related to data quality and compatibility. Discrepancies in data formats, units of measurement, or varying levels of data granularity can lead to integration problems. Incomplete or outdated data can also affect the robustness of the KG and, consequently, the reliability of the analytical results derived from it.
In addition, reliance on advanced language models such as GPT-4 to estimate missing environmental data introduces a degree of uncertainty. Although these models are powerful tools capable of generating plausible estimates based on vast amounts of training data, they may not always capture the specific nuances of novel or highly specialized materials and processes. Estimates are inherently probabilistic and may lack precision when applied to unique cases without sufficient historical data. This limitation can impact the accuracy of the LCA, particularly in industries like 3DP, where innovation is rapid and new materials or methods are continually emerging.
Furthermore, while Cypher queries offer an accessible means for users to interact with the KG and retrieve valuable insights with relative ease, the other analytical applications, such as the Graph Data Science algorithms, Graph RAG, and Causal AI, are more complex and require specialized technical expertise. These advanced analyses involve sophisticated concepts in graph analysis, machine learning, and artificial intelligence. Organizations may face challenges in acquiring or developing the expertise required to fully leverage these tools, which could limit the practical implementation of the methodology in real-world settings. The steep learning curve associated with these advanced techniques may hinder their adoption, particularly in organizations without dedicated data science teams.
The case study focused exclusively on 3DP, a domain that, while illustrative, may limit the generalizability of the methodology. The unique characteristics of 3DP, such as its diverse materials, processes, and rapid innovation cycles, mean that the findings may not directly translate to other industries or sectors. There is a need for further comprehensive investigations to implement and verify the methodology across diverse contexts, aiming to evaluate its flexibility and efficacy on a broader scale.
Lastly, the overall quality, comprehensiveness, and size of the constructed KGs can significantly influence the efficacy and interpretability of this methodology. Insufficient domain coverage, ambiguous or poorly validated relationships, and inconsistencies in taxonomy or schema may undermine the reliability of derived insights. On the other hand, overly extensive or densely interconnected KGs, especially those assembled without deliberate curation or pruning, can lead to computational overhead, complex query formulation, and difficulties in maintaining semantic coherence. Although we relied primarily on queries to assess and mitigate redundancy within KG, this approach alone is not entirely sufficient, as it can overlook subtle or context-dependent forms of duplication.

7. Future Work

Based on the findings and acknowledging the limitations of this study, several avenues for future research and development emerge that could improve the robustness, applicability, and ease of use of the methodology.
First, regular maintenance of the KG is vital due to the dynamic nature of product life cycles. Future research could explore the implementation of automated update mechanisms using continuous integration and deployment (CI/CD) pipelines. These systems could detect changes in data sources or industry standards and update the KG accordingly. Developing community-driven platforms where multiple stakeholders contribute to the KG’s upkeep could distribute the maintenance workload and keep the KG current. Second, future work could focus on integrating real-time data acquisition methods, such as sensors and Internet of Things (IoT) technologies, to collect empirical data during the production process. This integration would enable the dynamic updating of the KG and more precise LCA calculations. Third, incorporating uncertainty quantification methods into the KG analysis could provide insight into the confidence levels of the results, helping decision-makers in risk assessment. Furthermore, to address the uncertainty associated with using advanced language models for estimating missing environmental data, future work could focus on fine-tuning these models using domain-specific datasets to create specialized estimation tools. By tailoring language models to specific industries or materials through fine-tuning, we can significantly enhance their accuracy in generating environmental impact estimations. This process involves training the models on specialized datasets that reflect the unique characteristics and nuances of the target domain, thereby improving their contextual understanding and predictive capabilities. To make advanced analytical applications more accessible, the development of user-friendly interfaces and visualization tools is key. Future initiatives could include creating dashboards and graphical tools that allow non-experts to perform complex analyses without deep technical knowledge. Educational programs and training workshops could help build the necessary expertise within organizations, promoting the wider adoption of these advanced techniques. Expanding the applicability of the methodology beyond the 3DP domain is another important direction. Conducting more case studies in diverse industries such as automotive, aerospace, consumer electronics, and sustainable energy systems would test the methodology’s adaptability and identify industry-specific challenges. Such cross-sector analyses could lead to the development of standardized schemas and best practices that facilitate a wider implementation. Enhancing the accuracy of environmental impact metrics is essential. Future research must emphasize not only robust standards and practices for KG construction, validation, and refinement but also the development of systematic metrics to evaluate graph quality, coverage, and scalability. In line with the strategy proposed by [33], integrating LLMs into the workflow can provide a more powerful means of reducing redundancy and improving completeness. LLMs can identify and correct inconsistencies and duplicates—going beyond simple query-based validation—while also enriching the KG with additional information. This ensures a more accurate, coherent, and comprehensive dataset, ultimately increasing the KG’s overall utility. Lastly, investigating the ethical considerations and aspects of data privacy associated with the use of language models and KGs in LCA is important. In forthcoming research endeavors, it is imperative to scrutinize the ramifications associated with data sharing, safeguarding proprietary information, and adhering to legal frameworks such as the General Data Protection Regulation (GDPR). The formulation of comprehensive guidelines and best practices that govern the ethical utilization of data will significantly advance the responsible integration and application of the methodology in question.

Author Contributions

Conceptualization and original draft preparation, L.G. and S.H.; visualization, L.G. and S.H.; writing—review and editing, L.G., S.H. and A.K.; supervision, J.O.; project administration, A.K.; funding acquisition, A.K. All authors have read and agreed to the published version of the manuscript.

Funding

The research was partially funded by the German Federal Ministry for Economic Affairs and Climate Action (BMWK) through a research project (No. 03LB2041E).

Institutional Review Board Statement

Not applicable.

Informed Consent Statement

Not applicable.

Data Availability Statement

Data will be made available upon request.

Conflicts of Interest

The authors declare no competing or financial interests.

References

  1. European Commission. The European Green Deal; European Commission: Brussels, Belgium, 2019.
  2. Laurent, A.; Clavreul, J.; Bernstad, A.; Bakas, I.; Niero, M.; Gentil, E.; Christensen, T.H.; Hauschild, M.Z. Review of LCA studies of solid waste management systems—Part II: Methodological guidance for a better practice. Waste Manag. 2014, 34, 589–606. [Google Scholar] [CrossRef] [PubMed]
  3. Saade, M.R.M.; Yahia, A.; Amor, B. How has LCA been applied to 3D printing? A systematic literature review and recommendations for future studies. J. Clean. Prod. 2020, 244, 118803. [Google Scholar] [CrossRef]
  4. Vilches, A.; Garcia-Martinez, A.; Sanchez-Montanes, B. Life cycle assessment (LCA) of building refurbishment: A literature review. Energy Build. 2017, 135, 286–301. [Google Scholar] [CrossRef]
  5. ISO 14040:2006; Environmental Management–Life Cycle Assessment–Principles and Framework. ISO: Geneva, Switzerland, 2006.
  6. ISO 14044:2006; Environmental Management—Life Cycle Assessment—Requirements and Guidelines. ISO: Geneva, Switzerland, 2006.
  7. Curran, M.A. Overview of Goal and Scope Definition in Life Cycle Assessment. In Goal and Scope Definition in Life Cycle Assessment; Springer: Dordrecht, The Netherlands, 2017; pp. 1–62. [Google Scholar] [CrossRef]
  8. Suh, S.; Huppes, G. Methods for life cycle inventory of a product. J. Clean. Prod. 2005, 13, 687–697. [Google Scholar] [CrossRef]
  9. Hauschild, M.Z.; Bonou, A.; Olsen, S.I. Life cycle interpretation. In Life Cycle Assessment: Theory and Practice; Springer Nature: Cham, Switzerland, 2018; pp. 323–334. [Google Scholar]
  10. Curran, M.A.; Mann, M.; Norris, G. The international workshop on electricity data for life cycle inventories. J. Clean. Prod. 2005, 13, 853–862. [Google Scholar] [CrossRef]
  11. Finnveden, G.; Hauschild, M.Z.; Ekvall, T.; Guinée, J.; Heijungs, R.; Hellweg, S.; Koehler, A.; Pennington, D.; Suh, S. Recent developments in life cycle assessment. J. Environ. Manag. 2009, 91, 1–21. [Google Scholar] [CrossRef]
  12. Soimakallio, S.; Cowie, A.; Brandão, M.; Finnveden, G.; Ekvall, T.; Erlandsson, M.; Koponen, K.; Karlsson, P.E. Attributional life cycle assessment: Is a land-use baseline necessary? Int. J. Life Cycle Assess. 2015, 20, 1364–1375. [Google Scholar] [CrossRef]
  13. Ekvall, T.; Azapagic, A.; Finnveden, G.; Rydberg, T.; Weidema, B.P.; Zamagni, A. Attributional and consequential LCA in the ILCD handbook. Int. J. Life Cycle Assess. 2016, 21, 293–296. [Google Scholar] [CrossRef]
  14. Yang, Y. Two sides of the same coin: Consequential life cycle assessment based on the attributional framework. J. Clean. Prod. 2016, 127, 274–281. [Google Scholar] [CrossRef]
  15. Weidema, B.P.; Pizzol, M.; Schmidt, J.; Thoma, G. Attributional or consequential life cycle assessment: A matter of social responsibility. J. Clean. Prod. 2018, 174, 305–314. [Google Scholar] [CrossRef]
  16. Schaubroeck, S.; Schaubroeck, T.; Baustert, P.; Gibon, T.; Benetto, E. When to replace a product to decrease environmental impact?—A consequential LCA framework and case study on car replacement. Int. J. Life Cycle Assess. 2020, 25, 1500–1521. [Google Scholar] [CrossRef]
  17. Akroyd, J.; Mosbach, S.; Bhave, A.; Kraft, M. Universal Digital Twin—A Dynamic Knowledge Graph. Data-Centric Eng. 2021, 2, e14. [Google Scholar] [CrossRef]
  18. Ehrlinger, L.; Wöß, W. Towards a Definition of Knowledge Graphs. In Proceedings of the International Conference on Semantic Systems, Leipzig, Germany, 12–15 September 2016. [Google Scholar]
  19. Yuan, J.; Jin, Z.; Guo, H.; Jin, H.; Zhang, X.; Smith, T.H.; Luo, J. Constructing biomedical domain-specific knowledge graph with minimum supervision. Knowl. Inf. Syst. 2019, 62, 317–336. [Google Scholar] [CrossRef]
  20. Agrawal, G.; Deng, Y.; Park, J.; Liu, H.; Chen, Y. Building Knowledge Graphs from Unstructured Texts: Applications and Impact Analyses in Cybersecurity Education. Information 2022, 13, 526. [Google Scholar] [CrossRef]
  21. MacLean, F. Knowledge graphs and their applications in drug discovery. Expert Opin. Drug Discov. 2021, 16, 1057–1069. [Google Scholar] [CrossRef]
  22. Zhang, W.; Liu, Y.; Jiang, L.; Shah, N.; Fei, X.; Cai, H. The Construction of a Domain Knowledge Graph and Its Application in Supply Chain Risk Analysis. In Proceedings of the Advances in E-Business Engineering for Ubiquitous Computing, ICEBE 2019; Lecture Notes on Data Engineering and Communications Technologies; Springer: Berlin/Heidelberg, Germany, 2019; Volume 41, pp. 464–478. [Google Scholar] [CrossRef]
  23. Saad, M.; Zhang, Y.; Tian, J.; Jia, J. A graph database for life cycle inventory using Neo4j. J. Clean. Prod. 2023, 393, 136344. [Google Scholar] [CrossRef]
  24. Robinson, I.; Webber, J.; Eifrem, E. Graph Databases: New Opportunities for Connected Data; O’Reilly Media, Inc.: Sebastopol, CA, USA, 2015. [Google Scholar]
  25. Purohit, S.; Van, N.; Chin, G. Semantic Property Graph for Scalable Knowledge Graph Analytics. In Proceedings of the 2021 IEEE International Conference on Big Data (Big Data), Atlanta, GA, USA, 10–13 December 2020; pp. 2672–2677. [Google Scholar] [CrossRef]
  26. Sharma, C.; Sinha, R. A schema-first formalism for labeled property graph databases: Enabling structured data loading and analytics. In Proceedings of the 6th IEEE/ACM International Conference on Big Data Computing, Applications and Technologies, Auckland, New Zealand, 2–5 December 2019; pp. 71–80. [Google Scholar]
  27. Baken, N. Linked data for smart homes: Comparing RDF and labeled property graphs. In Proceedings of the LDAC2020—8th Linked Data in Architecture and Construction Workshop, Dublin, Ireland, 17–19 June 2020; pp. 23–36. [Google Scholar]
  28. Mynarz, J.; Haniková, K.; Svátek, V. Test-driven Knowledge Graph Construction. In Proceedings of the KGCW’23: 4th International Workshop on Knowledge Graph Construction, Hersonissos, Greece, 28 May 2023. [Google Scholar]
  29. Zhong, L.; Wu, J.; Li, Q.; Peng, H.; Wu, X. A Comprehensive Survey on Automatic Knowledge Graph Construction. arXiv 2023, arXiv:2302.05019. [Google Scholar] [CrossRef]
  30. Nicholson, D.N.; Greene, C. Constructing knowledge graphs and their biomedical applications. Comput. Struct. Biotechnol. J. 2020, 18, 1414–1428. [Google Scholar] [CrossRef] [PubMed]
  31. Chen, H.; Shen, X.; Lv, Q.; Wang, J.; Ni, X.; Ye, J. SAC-KG: Exploiting Large Language Models as Skilled Automatic Constructors for Domain Knowledge Graph. In Proceedings of the 62nd Annual Meeting of the Association for Computational Linguistics (Volume 1: Long Papers), Bangkok, Thailand, 11–16 August 2024; Association for Computational Linguistics: Kerrville, TX, USA, 2024. [Google Scholar]
  32. Chen, H.; Cao, G.; Chen, J.; Ding, J. A Practical Framework for Evaluating the Quality of Knowledge Graph. In Proceedings of the International Conference on Knowledge Management, Zamora, Spain, 15–18 July 2019; pp. 111–122. [Google Scholar] [CrossRef]
  33. Padia, A.; Ferraro, F.; Finin, T. Enhancing Knowledge Graph Consistency through Open Large Language Models: A Case Study. In Proceedings of the AAAI Symposium, Stanford, CA, USA, 25–27 March 2024; pp. 203–208. [Google Scholar] [CrossRef]
  34. Yang, Y.; Huang, C.; Xia, L.; Li, C. Knowledge Graph Contrastive Learning for Recommendation. In Proceedings of the 45th International ACM SIGIR Conference, Madrid, Spain, 11–15 July 2022. [Google Scholar] [CrossRef]
  35. Tran, T.; Gad-Elrab, M.H.; Stepanova, D.; Kharlamov, E.; Strötgen, J. Fast Computation of Explanations for Inconsistency in Large-Scale Knowledge Graphs. In Proceedings of the Web Conference, Taipei, Taiwan, 20–24 April 2020. [Google Scholar] [CrossRef]
  36. Xue, B.; Zou, L. Knowledge Graph Quality Management: A Comprehensive Survey. IEEE Trans. Knowl. Data Eng. 2023, 35, 4969–4988. [Google Scholar] [CrossRef]
  37. Zhang, Y.; Luo, X.; Buis, J.J.; Sutherland, J. LCA-oriented semantic representation for the product life cycle. J. Clean. Prod. 2015, 86, 146–162. [Google Scholar] [CrossRef]
  38. Wang, Y.; Tao, J.; Liu, W.; Peng, T. A Knowledge-enriched Framework for Life Cycle Assessment in Manufacturing. Procedia CIRP 2022, 105, 55–60. [Google Scholar] [CrossRef]
  39. Shaw, C.; Hoare, C.; de Riet, M.; de Andrade Pereira, F.; O’Donnell, J. An end-to-end Asset Life Cycle Knowledge Graph. In Proceedings of the 2024 W78 Conference, CIB W78, Marrakech, Morocco, 2–3 October 2024; pp. 81–90. [Google Scholar]
  40. Kuczenski, B.; Davis, C.; Rivela, B.; Janowicz, K. Semantic catalogs for life cycle assessment data. J. Clean. Prod. 2016, 137, 1109–1117. [Google Scholar] [CrossRef]
  41. Bertin, B.; Scuturici, V.M.; Risler, E.; Pinon, J.M. A semantic approach to life cycle assessment applied on energy environmental impact data management. In Proceedings of the 2012 Joint EDBT/ICDT Workshops, Berlin, Germany, 26–30 March 2012; pp. 87–94. [Google Scholar] [CrossRef]
  42. Di, F.; Wu, J.; Li, J.; Wang, Y. Research on the knowledge graph based life cycle carbon footprint labeling representation model for electromechanical products. In Proceedings of the 5th International Conference on Computer Information Science and Application Technology (CISAT 2022), International Society for Optical Engineering (SPIE), Chongqing, China, 20 October 2022; Volume 12451, p. 124511O. [Google Scholar] [CrossRef]
  43. Marconnet, B.; Gaha, R.; Eynard, B. Context-Aware Sustainable Design: Knowledge Graph-Based Methodology for Proactive Circular Disassembly of Smart Products. In Proceedings of the Technological Systems, Sustainability and Safety, Jeddah, Saudi Arabia, 15–16 May 2024. [Google Scholar]
  44. Peng, T.; Gao, L.; Agbozo, R.S.; Xu, Y.; Svynarenko, K.; Wu, Q.; Li, C.; Tang, R. Knowledge graph-based mapping and recommendation to automate life cycle assessment. Adv. Eng. Inform. 2024, 62, 102752. [Google Scholar] [CrossRef]
  45. Kim, S.; Dale, B. Life Cycle Inventory Information of the United States Electricity System (11/17 pp). Int. J. Life Cycle Assess. 2005, 10, 294–304. [Google Scholar] [CrossRef]
  46. Nadagouda, M.N.; Ginn, M.; Rastogi, V. A review of 3D printing techniques for environmental applications. Curr. Opin. Chem. Eng. 2020, 28, 173–178. [Google Scholar] [CrossRef] [PubMed]
  47. Chen, X.; Chen, G.; Wang, G.; Zhu, P.; Gao, C. Recent Progress on 3D-Printed Polylactic Acid and Its Applications in Bone Repair. Adv. Eng. Mater. 2019, 22, 1901065. [Google Scholar] [CrossRef]
  48. Yin, H.; Qu, M.; Zhang, H.; Lim, Y. 3D Printing and Buildings: A Technology Review and Future Outlook. Technol. + Des. 2018, 2, 94–111. [Google Scholar] [CrossRef]
  49. Wang, D.; Zhang, T.; Guo, X.; Ling, D.; Hu, L.; Jiang, G. The potential of 3D printing in facilitating carbon neutrality. J. Environ. Sci. 2023, 130, 85–91. [Google Scholar] [CrossRef]
  50. Annibaldi, V.; Rotilio, M. Energy consumption consideration of 3D printing. In Proceedings of the 2019 II Workshop on Metrology for Industry 4.0 and IoT (MetroInd 4.0 & IoT), Naples, Italy, 4–6 June 2019; pp. 243–248. [Google Scholar] [CrossRef]
  51. Jandyal, A.; Chaturvedi, I.; Wazir, I.; Raina, A.; Ul Haq, M.I. 3D printing—A review of processes, materials and applications in industry 4.0. Sustain. Oper. Comput. 2022, 3, 33–42. [Google Scholar] [CrossRef]
  52. Gebler, M.; Schoot Uiterkamp, A.J.; Visser, C. A global sustainability perspective on 3D printing technologies. Energy Policy 2014, 74, 158–167. [Google Scholar] [CrossRef]
  53. Elbadawi, M.; Basit, A.W.; Gaisford, S. Energy consumption and carbon footprint of 3D printing in pharmaceutical manufacture. Int. J. Pharm. 2023, 639, 122926. [Google Scholar] [CrossRef] [PubMed]
  54. Cucchiella, F.; Gastaldi, M.; Trosini, M. Investments and cleaner energy production: A portfolio analysis in the Italian electricity market. J. Clean. Prod. 2017, 142, 121–132. [Google Scholar] [CrossRef]
  55. Wei, C.; Liu, F.; Zhou, X.; Xie, J. Fine energy consumption allowance of workpieces in the mechanical manufacturing industry. Energy 2016, 114, 623–633. [Google Scholar]
  56. Hauck, S.; Greif, L. Facilitating the Preparation of Life Cycle Assessment Through Subject-Oriented Process Modeling: A Methodological Framework. In Proceedings of the Subject-Oriented Business Process Management. Models for Designing Digital Transformations; Elstermann, M., Lederer, M., Eds.; Springer Nature: Cham, Switzerland, 2025; pp. 173–188. [Google Scholar]
  57. MacDonald, E.; Wicker, R. Multiprocess 3D printing for increasing component functionality. Science 2016, 353, aaf2093. [Google Scholar] [CrossRef] [PubMed]
  58. Wesselak, V.; Voswinckel, S. Photovoltaik: Wie Sonne zu Strom Wird; Springer Vieweg: Berlin/Heidelberg, Germany, 2012. [Google Scholar]
  59. Goedert, J.D.; Bonsell, J.; Samura, F. Integrating Laser Scanning and Rapid Prototyping to Enhance Construction Modeling. J. Archit. Eng. 2005, 11, 71–74. [Google Scholar] [CrossRef]
  60. Yao, A. Applications of 3D scanning and reverse engineering techniques for quality control of quick response products. Int. J. Adv. Manuf. Technol. 2005, 26, 1284–1288. [Google Scholar] [CrossRef]
  61. Kokkinis, D.; Schaffner, M.; Studart, A. Multimaterial magnetically assisted 3D printing of composite materials. Nat. Commun. 2015, 6, 8643. [Google Scholar] [CrossRef]
  62. Lee, J.Y.; An, J.; Chua, C. Fundamentals and applications of 3D printing for novel materials. Appl. Mater. Today 2017, 7, 120–133. [Google Scholar] [CrossRef]
  63. Zhang, Y.; Zhang, F.; Yan, Z.; Ma, Q.; Li, X.; Huang, Y.; Rogers, J. Printing, folding and assembly methods for forming 3D mesostructures in advanced materials. Nat. Rev. Mater. 2017, 2, 17019. [Google Scholar] [CrossRef]
  64. Rother, H. D-Drucken… und Dann?: Weiterbearbeitung, Verbindung & Veredelung von 3D-Druck-Teilen; Carl Hanser Verlag GmbH Co. KG: München, Deutschland, 2017. [Google Scholar]
  65. Rapp, P.; Hotz, F. Perfekte 3D-Drucke mit Simplify3D; Carl Hanser Verlag GmbH Co. KG: München, Deutschland, 2022. [Google Scholar]
  66. Kabir, S.; Mathur, K.; Seyam, A. A critical review on 3D printed continuous fiber-reinforced composites: History, mechanism, materials and properties. Compos. Struct. 2020, 232, 111476. [Google Scholar] [CrossRef]
  67. Ngo, T.; Kashani, A.; Imbalzano, G.; Nguyen, K.; Hui, D. Additive manufacturing (3D printing): A review of materials, methods, applications and challenges. Compos. Part B Eng. 2018, 143, 172–196. [Google Scholar] [CrossRef]
  68. Zhang, J.; Wang, J.; Dong, S.; Yu, X.; Han, B. A review of the current progress and application of 3D printed concrete. Compos. Part A Appl. Sci. Manuf. 2019, 125, 105533. [Google Scholar] [CrossRef]
  69. Lemu, H. Study of capabilities and limitations of 3D printing technology. AIP Conf. Proc. 2012, 1431, 857–865. [Google Scholar] [CrossRef]
  70. Leach, N. 3D Printing in Space. Archit. Des. 2014, 84, 108–113. [Google Scholar] [CrossRef]
  71. Boon, W.; van Wee, B. Influence of 3D printing on transport: A theory and experts judgment based conceptual model. Transp. Rev. 2018, 38, 556–575. [Google Scholar] [CrossRef]
  72. Birtchnell, T.; Urry, J. Fabricating Futures and the Movement of Objects. Mobilities 2013, 8, 388–405. [Google Scholar] [CrossRef]
  73. Gorji, N.; O’Connor, R.; Brabazon, D. XPS and SEM characterization for powder recycling within 3d printing process. In Proceedings of the ESAFORM 2021, 24th International Conference on Material Forming, Liège, Belgium, 14–16 April 2021. [Google Scholar] [CrossRef]
  74. Patterson, B.; Cordes, N.; Henderson, K.; Pacheco, R.; Herman, M.; James, C.E.; Mertens; Xiao, X.; Williams, J.J.; Chawla, N. In situ Synchrotron X-ray Tomographic Imaging of 3D Printed Materials During Uniaxial Loading. Microsc. Microanal. 2016, 22, 1760–1761. [Google Scholar] [CrossRef]
  75. Byard, D.J.; Woern, A.L.; Oakley, R.; Fiedler, M.J.; Snabes, S.L.; Pearce, J.M. Green fab lab applications of large-area waste polymer-based additive manufacturing. Addit. Manuf. 2019, 27, 515–525. [Google Scholar] [CrossRef]
  76. Beltrán, F.; Arrieta, M.; Moreno, E.; Gaspar, G.; Muneta, L.M.; Carrasco-Gallego, R.; Yáñez, S.; Hidalgo-Carvajal, D.; de la Orden, M.U.; Urreaga, J.M. Evaluation of the Technical Viability of Distributed Mechanical Recycling of PLA 3D Printing Wastes. Polymers 2021, 13, 1247. [Google Scholar] [CrossRef]
  77. Vidakis, N.; Petousis, M.; Tzounis, L.; Maniadi, A.; Velidakis, E.; Mountakis, N.; Papageorgiou, D.; Liebscher, M.; Mechtcherine, V. Sustainable Additive Manufacturing: Mechanical Response of Polypropylene over Multiple Recycling Processes. Sustainability 2020, 13, 159. [Google Scholar] [CrossRef]
  78. Kumar, R.; Singh, R.; Farina, I. On the 3D printing of recycled ABS, PLA and HIPS thermoplastics for structural applications. PSU Res. Rev. 2018, 2, 115–137. [Google Scholar] [CrossRef]
  79. Anderson, I. Mechanical Properties of Specimens 3D Printed with Virgin and Recycled Polylactic Acid. Procedia CIRP 2017, 4, 110–115. [Google Scholar] [CrossRef]
  80. Zhu, C.; Li, T.; Mohideen, M.M.; Hu, P.; Gupta, R.; Ramakrishna, S.; Liu, Y. Realization of Circular Economy of 3D Printed Plastics: A Review. Polymers 2021, 13, 744. [Google Scholar] [CrossRef] [PubMed]
  81. EN 15804:15804:2012+A2:2019; Sustainability of Construction Works—Environmental Product Declarations—Core Rules for the Product Category of Construction Products. CEN (European Committee for Standardization): Brussels, Belgium, 2019.
Figure 1. The four phases of life cycle assessment.
Applsci 15 00175 g001
Figure 2. Methodology.
Applsci 15 00175 g002
Figure 3. Stages of the product life cycle that are included in the methodology: from the engineering phase to the disposal phase.
Applsci 15 00175 g003
Figure 4. General schema for LPG model.
Applsci 15 00175 g004
Figure 5. Excerpt of adapted KG schema for 3DP process.
Applsci 15 00175 g005
Figure 6. LPG model for 3DP process with an excerpt highlighting the different nodes and relations.
Applsci 15 00175 g006
Table 1. LCI data for various materials according to Ökobau.dat.
MaterialModulGWP (kg CO2-eq)ODP (kg CFC-11-eq)
Wood fiber insulationA20.3677.33 × 10−10
Fibre cement facade panelC20.0421.08 × 10−15
Clay plasterA57.9262.30 × 10−15
Fly ashA1–A30.0000.000
Cement (CEM IV 42.5)A1–A30.6883.79 × 10−15
Cement (CEM II 42.5)A1–A30.7953.86 × 10−15
Table 2. Descriptive statistics of original and estimated GWP values.
MetricOriginal GWP ValuesEstimated GWP Values
Count637637
Mean39.1345.32
Standard deviation486.45417.73
Minimum−5674.33−1768.63
Median0.120.11
Maximum19,900.006110.47
Table 3. GPT-4o GWP estimations and validation results for two examples.
AttributeExample 1: Facade Paint (Dispersion Paint) in Modul C2Example 2: Asphalt Base Layer in Modul D
GPT-4o Estimation“Given that this product is a type of paint in Modul C2 and based on the GWP patterns observed for similar products, I estimate the GWP for ‘facade paint (dispersion paint)’ to be approximately 0.004.”“Considering that the ‘asphalt base layer’ is a type of asphalt layer used in Modul D, and noting that similar materials in end-of-life stages often have GWP values close to zero or slightly negative due to recycling credits, I estimate the GWP for the ‘asphalt base layer’ to be approximately −0.025.”
Actual GWP0.0032−0.0263
Estimated GWP0.004−0.025
AE0.00080.0013
REP25.19%4.96%
CommentHigh relative error due to the low actual GWP magnitude; minor deviations yield significant percentage differences.Low relative error shows a close match between the estimate and the actual GWP value.
Table 4. Summary of top five node frequencies and degree metrics.
Top 5 Node Frequency
Node NameCount
Option76
Process14
Software14
Subprocess13
Actor8
Top 5 In-Degree
Node NameCount
Production phase10
Transport process4
Post-processing and sale phase4
Use phase2
Disposal phase2
Top 5 Out-Degree
Node NameCount
3D printing process14
Material option8
Post-processing7
Recycling6
Table 5. Roles involved in each phase of the product life cycle for 3DP.
Product Life CyclePhaseInvolved Actors
3DP Component AProduction phaseTechnician, operator
3DP Component AEnergy production processEnergy manager, technician
3DP Component AUse phaseUser, maintenance engineer
3DP Component ADisposal phaseRecycling specialist, waste manager
3DP Prototype BDesign creationCAD designer, engineer
3DP Prototype BPre-processing phaseMaterial specialist, technician
3DP Prototype BPost-processing phaseQuality inspector, technician
Table 6. Comparison of emissions for different scenarios in 3DP phases.
Scenario 1: Cement (CEM IV 42.5)
Phase NameEmissions (kg CO2-eq)
Production phase—material68.8
Production phase—energy40.0
Transport phase15.0
Total emissions123.8
Scenario 2: Cement (CEM II 42.5)
Phase NameEmissions (kg CO2-eq)
Production phase—material79.5
Production phase—energy40.0
Transport phase10.0
Total emissions129.5
Table 7. Illustration of influence from start node to end node in the 3DP process.
Start NodeInfluenceEnd Node
Volume modelMassProduction phase
Material selectionTransport distanceTransport process
CAM softwareSupport structurePost-processing and sale process
CAM softwarePrinting time,Production phase
material consumption,
energy consumption
Volume modelAssembly complexityPost-processing and sale process
Volume modelDisassembly complexityDisposal phase
Disclaimer/Publisher’s Note: The statements, opinions and data contained in all publications are solely those of the individual author(s) and contributor(s) and not of MDPI and/or the editor(s). MDPI and/or the editor(s) disclaim responsibility for any injury to people or property resulting from any ideas, methods, instructions or products referred to in the content.