Article

Co-Simulation Model for Determination of Optimal Active Power Filters Settings in Low-Voltage Network

Faculty of Electrical Engineering, Computer Science and Information Technology Osijek, 31000 Osijek, Croatia
*
Author to whom correspondence should be addressed.
Appl. Sci. 2025, 15(1), 469; https://doi.org/10.3390/app15010469
Submission received: 26 November 2024 / Revised: 30 December 2024 / Accepted: 2 January 2025 / Published: 6 January 2025
(This article belongs to the Collection Advanced Power Electronics in Power Networks)

Abstract

:
Current trends in the use of energy storage, electric mobility, and the integration of a large number of distributed generations at the distribution level can have positive effects on reducing loads and losses in the network. An excessive and uncontrolled level of integration of the above trends leads to various problems related to the power quality. Distortion of the voltage and current waveforms caused by nonlinear loads is manifested through harmonics and can be classified as one of the most essential parameters of electricity quality. Reducing harmonics thus becomes the primary goal for improving the quality of electricity at the distribution level. This paper, along with a detailed analysis of the literature, provides an overview of different views on the problems of optimal allocation of active filters and emphasizes the importance that the problem of optimal allocation of active filters should be based on the variability of the harmonic spectrum as a function of time. Installing devices for reducing harmonics in the network, in terms of improving the quality of electricity, is one of the essential elements from both a technical and an economic point of view and can solve these challenges. Therefore, it is necessary to develop methods for solving the problem of determining the position, size and parameters of filters, as well as the number of buses on which such devices can be integrated. Applying optimization techniques enables the development of more realistic models for applying active power filters. The research in this paper is directed toward developing a co-simulation optimization model to determine optimal settings of the parallel APF due to harmonic reduction in a real low-voltage network using particle swarm optimization for 24 h intervals. The research in this paper was conducted on a real radial low-voltage feeder, where at each node, the variability of production and/or consumption is taken, which is obtained on the basis of real measurements and tests. Based on this, the position and dimensioning of the shunt active power filters (APFs) depend on the load range within a 24 h interval at all nodes in the observed time interval. Furthermore, the paper emphasizes the importance of observing Voltage Total Harmonic Distortion (THDV) on the busbars in the depth of the feeder as well as the importance of observing THDV in each phase.

1. Introduction

The increased integration of distributed generation (DG) into distribution network can enhance the reliability of power supply, decrease energy loss, and improve voltage profiles. However, when DG is combined with a continuously growing number of nonlinear loads, it can cause serious issues concerning the power quality aspect. Photovoltaic (PV) systems are the most widely spread DG type at the low-voltage (LV) distribution level due to their ease of installation and maintenance as well as low cost [1]. Stochastic and variable production and the pulse-width modulation (PWM) of power converters in a case of large PV integration results in the poor harmonic composition of voltage (i.e., current waveform distortion), thus deteriorating the power quality in the distribution network. Decreasing prices of other low-carbon (LC) technologies, such as battery energy storage and electric mobility, will significantly affect a higher share of LC technologies in the LV distribution network. The rising number of PV systems, electric vehicles (EVs), and battery storage systems connected to distribution networks may cause voltage and current waveform distortions. Although harmonic distortion values of distribution networks with DG and LV technologies can meet the requirements prescribed by standards, when such systems are connected to radial distribution feeders, the cumulative effect can increase the harmonic distortion level above limits set by standards [2] EN 50160 and [3] IEEE 519 [4,5]. Modern distribution networks, in which over 70% of the generated energy is converted using power electronic converters [6], set the mitigation of harmonics as their primary goal for power quality improvement. Power quality disturbance is a phenomenon whose effects often pass unnoticed until a failure occurs, impacting both power system devices and end users [7]. Monitoring and maintaining power quality in the distribution networks, in the context of liberalization of the electricity sector, has become one of the fundamental requirements of power systems. The emphasis is undoubtedly on distribution system operators, who are obligated and responsible for ensuring adequate levels of power quality for end users [8]. To mitigate the impact of harmonics, various techniques are applied to maintain harmonic voltages and currents within recommended levels [7] such as the design of equipment, lines or transformers, optimal placement and sizing of capacitor banks, power reduction in power systems, different harmonic filters and other adaptive devices. Various factors, such as the source of harmonic, supply network parameters, or economic aspects, influence the selection of an appropriate method for mitigating harmonics [9]. Over the past fifty years, various devices for harmonic mitigation have been developed with passive filters being one of the most popular methods due to their relatively low cost and simple design. Due to passive filters’ robustness and certain drawbacks, the most significant of which include the possibility of parallel resonance with the network’s impedance, excessive reactive power compensation at the nominal system frequency, poor flexibility for dynamic compensation, as well as the increasing levels and variability of harmonics, some new solutions have been implemented. Active power filters are the more recent and most commonly used solutions [7,10].
The active power filter (APF) is presented in the most relevant literature [11,12,13] as a current source. The APF acts as a controlled current source when parallel connected with nonlinear unbalanced loads, and it can generate harmonic current components present in the load current [14]. The APF serves as a device that generates the compensation current i A P F , which must satisfy Kirchhoff’s current laws at the point of common coupling (PCC).

2. Literature Overview

Most research papers dealt with harmonics using APFs through different optimization problems in terms of defining different objective functions with different constraints using various optimization algorithms. In chronological order since 2010, optimization algorithms such as the Tabu algorithm [15], the Fuzzy algorithm [16], the music-inspired algorithm [17], ant colony algorithms [18], wave algorithms [19], the gray wolf algorithm [20], and the bacterial foraging algorithm [21] are used. However, the most popular optimization methods are associated with evolutionary algorithms, with genetic algorithm (GA) [22,23] and swarm-based algorithms in focus. Numerous authors focus their research on highlighting the advantages and potential of specific optimization methods, while the aspect of the actual resolution of the APF placement problem is neglected [9]. According to the most recent literature, particle swarm optimization (PSO) and modifications of PSO have been taken as the most prominent optimization methods [24,25,26,27,28]. Considering the above-mentioned observations and the authors in [29], which stated that PSO algorithms have been widely applied in various scientific fields in recent years, this paper uses PSO as an optimization algorithm. Additionally, observing the literature overview, it is noted that authors often neglect one critical aspect when addressing the optimal placement and sizing of the APF: the time variability of harmonics during the day. Ignoring the significance of nonlinear loads’ time and harmonic spectrum variability, emphasizing new integrated forms of load (DGs, EV chargers, and energy battery storage) can lead to sub-optimal solutions. A group of authors of reviewed papers have taken a similar approach in the optimization process, using the same objective function and constraints. Still, the lack of standardized test systems and problem descriptions enabled a direct analysis result comparison. As shown in Table 1, linear test networks are mainly used in which authors arbitrarily apply nonlinearities. Nonlinearities are often not implemented throughout the network; instead, they focus only on specific buses and limit the search space to the predefined buses. Predefined IEEE systems are frequently used where load and harmonic level variations are not incorporated. Also, authors rarely refer to real-world cases of power systems, missing the opportunities for comparative analysis of the effectiveness of different optimization methods. Since nonlinear loads are variable, harmonics also fluctuate over time. In the papers [30,31], the authors noted the importance of time variability of loads, and the influence of load variation on power quality indicators was pointed out. Neglecting the time variability feature of loads in the optimization process can result in a sub-optimal solution [32]. Given the substantial impact of nonlinear loads and injecting variable harmonics, the analysis should include this variation. A summary of referenced systems used in studies over the last ten years is provided in Table 1, indicating load or harmonic order variation implementation in tested systems.
In a paper [9], a group of authors concluded that research should focus on optimizing the sizing and placement of APFs in LV distribution networks, such as radial distribution systems (RDSs) and industrial facility networks. An optimization solution for these networks could improve power quality, reduce installation costs, and achieve actual economic savings. Additionally, according to the authors in [9], it is essential to explore optimization with global control of groups of APFs, where it would be possible to generate waveforms different from those resulting from the connection point of the APF devices. Numerous authors tested their optimization processes on medium voltage (MV) networks even though the majority of nonlinearities occur in LV networks (<1 kV), as confirmed by publications [23,33].
Table 1. Test network overview.
Test SystemReferenceVariable Load/Variable Harmonic LevelNonlinearity in Bus
IEEE 5[16]No1 bus
[20]No2 bus
IEEE 16[34]No5 bus
IEEE 17[22]No8 bus
IEEE 18[35]No3 bus
[36]Two cases5 bus
[36]Three test cases3 NLL *1
[37]Three test cases5 + 2 NLL *1
[38]Three test cases6 bus
[17]No3 bus
[39]No3 bus
IEEE 33[11]Three test casesmax 5 bus
[40]No5 bus with PV
[39]No3 bus
IEEE 69[32]YES8 bus (ends of RDS *2)
[34]No19 bus
RDS 5 [16]No3 NLL *1
RDS 13[18]No6 bus
RDS 17[12]Yes (three cases)7 bus
[41]No7 bus
[42]Three cases3 type of NLL *1
RDS 20[15]No4 bus
RDS 33[20]No4 bus (ends of RDS *2)
Lab. setup
7. Buses
[43]No3 NLL *1
Industrial plant[44,45]Nonot specified
[23]Percentage increase in the share of RES *3different types—34% of the load
Ski station[4]No20 bus
Mine[33]Nodifferent types of NLL *1
3-phase 415 V AC system[46]Yes (six test cases)different types of NLL *1
*1 NLL—nonlinear load. *2 RDS—radial distribution system. *3 RES—renewable energy sources.

Applied Optimization Objective Functions with Constraints in APF Allocation

The optimal allocation of APFs can generally be described through two different approaches to the optimization problem, as the authors in [12] presented. The first category of approach to the optimization problem aims to minimize harmonic voltage distortions in the entire network while meeting the limits of filter currents as well as Individual Harmonic Voltage Distortion (IHDV) and Voltage Total Harmonic Distortion (THDV) on all buses of the observed network. The second approach focuses on minimizing the injected currents of APFs while simultaneously ensuring that the standard harmonic levels and filter current limits are met. The optimization problem of active filter placement involves defining an objective function and constraints. Minimizing the effective current values of the source and optimally placing the APFs in the tested network are the most common objectives for APFs. The currents of the APFs are determined using a control algorithm to compensate for all harmonics in the line current at the bus where the APF is connected. Minimizing the number and size of APFs provides a proper Total Harmonic Distortion (THD) level considering the limits prescribed by the standards and loss reduction caused by harmonics and economic indicators improvement [9].
The expression given in (1) presents the most commonly used objective function, which is defined as the sum of the effective current values of all APFs installed in the test network [4,11,13,20,22,28,38,41,47]. The objective function presented here functions as a general framework; however, it is worth noting that it does not fully incorporate additional factors related to the positioning of the APF connection. Acknowledging these factors may enhance the overall understanding of the APF’s performance and its effects in different scenarios. The possibility of improving this objective function can be achieved by introducing a set of multipliers. Modified versions of this function consider additional factors, such as preferred buses for APF installation due to accessibility or ease of installation as well as minimizing the maximum APF current [40]. The objective function, shown in expression (2), is related to the voltage or current THD. Minimizing the maximum value of THDV or THDI depends on the reference standards cited by the authors [12,23,28,38,40,41,43,44,45,46,48]. Different modifications of this objective function involve minimizing these factors at the PCC point, at each bus, or as the total sum of factors across all buses. In addition to the factors mentioned, THDV and THDI, the Total Demand Distortion (TDD) factor [41,42] is also commonly applied in objective functions. Expression (3) refers to the objective function aimed at minimizing power losses, whether they are related to basic losses or harmonic losses [4,12,28,33,42]. Minimizing higher voltage harmonics at all buses is shown in expression (4), while expressions (5) and (6) refer to reducing financial costs. The expression given in (5) focuses on minimizing the number of APFs and does not have precisely defined values of other vital parameters. Such an objective function requires additional constraints or the introduction of an additional objective function. Some authors assume, in the function, that the expression given in (1) leads to financial cost minimization, assuming that the cost is proportional to the APF rating. A sophisticated approach considers fixed and variable costs as given in expression (6), using coefficients cfix as fixed and cvar as variable costs of the APF. Modifications of the optimization function that consider costs related to investment, as well as operational and maintenance costs, are presented in papers [12,32].
min f = n = 1 N I APF , n ;   n N
min f = n N T H D V n ;   min f = n N T H D I n   ;   n N
min f = i = 1 I P i ;   i I
min f = w = 1 W h = 2 H V n , h ;   n N ,   h H
min x   f = Z APF
min f = n = 1 N ( c var I APF , n c fix )
For the previous expressions, (1)–(6) stands I APF , n —defined as the sum of current RMS values of all installed APFs, n—number of APFs, h—harmonic order number, N—maximum number of buses where an APF can be installed, M—total number of buses in systems (M ≥ N), c fix and c var —coefficients for fixed and variable costs, and Z APF —total number of APFs.
By the reviewed literature, the constraints associated with the objective functions can generally be divided into two groups. The first group consists of the physical constraints of the APFs themselves, such as the following:
  • The effective values of the APF currents must be greater than the lower limit ( I APF m i n ) and less than the upper limit ( I APF m a x ) that the filter can provide.
  • The effective values of the successive current harmonics of the APF are limited according to the physical limits of the APF.
  • Commercially available sizes of APFs can be considered by introducing the size of the basic unit of the APF.
Constraints related to the test network are summarized in second group as outlined below:
  • The values of THDV and/or THDI at all buses must be lower than the specified prescribed values based on the standards and regulations that the authors refer to.
  • The individual values of voltage and/or current harmonics at all buses must be lower than the specified prescribed values, depending on the standards and regulations referenced by the authors.
Based on the gap in the literature, this paper focuses on implementing APFs on a radial low-voltage distribution feeder, considering the variability of production and consumption at each bus. The positioning and sizing of the APF will be based on the load range at the buses over time rather than relying on a predetermined operating point at the installation site. As the authors in the literature overview often overlook nonlinearity throughout the whole network, this paper models a full-scale nonlinear state of the network throughout the entire network. Additionally, this paper focuses on an optimization framework that allows monitoring the network’s state with respect to power changes and harmonics spectrum during the optimization problem.
The co-simulation process described in this paper integrates a metaheuristic optimization method with a simulation tool designed for modeling and analyzing power networks. Specifically, the black-box optimization problem in this co-simulation setup involves an LV radial distribution network model created using DIgSILENT PowerFactory 2022, SP4, which is a specialized power system modeling and analysis simulation tool. This integration results in a user-friendly and time-efficient approach, yielding a more realistic three-phase and unbalanced network model than the traditional manual coding process for developing such a model.
The scientific contributions of the paper can be listed as the following:
  • Developing a co-simulation optimization model to determine the parameters and optimal settings of the parallel APF in an unbalanced low-voltage network.
  • Optimal allocation of APFs with variability of harmonic spectra of different load types.
According to this paper’s authors, research in optimizing the sizing and placement of APFs should focus on improving the efficiency of optimization processes, particularly in low-voltage networks. Such optimization could offer significant benefits, including enhanced power quality and reduced installation costs. Additionally, the authors focused their research on optimizing the control of a group of APFs, which enables the generation of current or voltage waveforms that monitor the THDV across all nodes in the network. These waveforms are distinguished from the waveforms when the APF is monitored locally, i.e., when only the connection point is observed. In this context, in addition to the optimal sizing and placement of the APF, the authors propose an algorithm to determine the optimal operating point of the APF, taking into account the current load of the network. At the same time, a co-simulation framework enables more user-friendly integration of a three-phase network model, making it possible to analyze an unbalanced network state, resulting in a more realistic model and reduced coding time. The position and dimensioning of the APF will be determined by the load in specific nodes rather than by the operating point set on the node where the APF is installed.
The paper, through seven sections, first elaborates on the problem of optimal allocation by defining the objective function and associated constraints. Furthermore, the paper evaluates and analyzes the obtained results in detail through the algorithm and optimization framework. Finally, certain conclusions are drawn as well as future research.

3. Optimization Framework

This paper formulates the optimization problem of optimal allocation of the APF as a nonlinear optimization problem, which is treated as a black-box model within a co-simulation process.
The co-simulation process involves the interconnection of a metaheuristic optimization method with a simulation tool for modeling and analyzing power networks. The black-box optimization problem in this co-simulation setup is an LV radial distribution network model developed in the software DIgSILENT PowerFactory 2022, SP4, which is a simulation tool specialized for power system modeling and analysis. This simulation tool has developed models of typical power system components, electrical constraints, and the implementation of load flow and harmonic flow analysis.
Figure 1 shows the co-simulation optimization framework used, which illustrates the exchange of information between the optimization method and the simulation tool for modeling and analyzing networks. The optimization framework uses the PSO optimization method realized in the Python 3.10 programming language.
The co-simulation process was performed on a computer with an i5-11400 processor, 16 GB RAM, and Win 10 and begins with the exchange of information, where the DIg-SILENT Power Factory 2022 SP4 sends load flow and harmonic load flow calculation results as input data to the optimization method. Using the input data, the optimization method determines the objective function values and generates decision variables, considering the set constraints. These generated decisions are then returned as input data to the DIgSILENT Power Factory 2022, SP4 to perform load flow and harmonic flow calculations, closing the co-simulation process.
Harmonic compensation, as presented in this paper, is necessary when the amount of harmonic distortion exceeds the standard limits across all buses of the test network. This analysis includes each bus’s phases and their corresponding THDV values. Considering the future transformation of electricity networks in the context of smart grids, the inevitable increase in the integration of nonlinear loads, and the variability in DGs, this analysis determines the relative amplitudes of current harmonic components for all defined models. Throughout this process, it is ensured that the THDV values in all phases and the overall THDV never exceed the limit specified by the EN 50160 standard.

4. Problem Formulation

This paper defines the optimal allocation of APFs in an LV distribution network through a problem description that includes a definition of an objective function with corresponding constraints, a model of a realistic nonlinear LV distribution network, and the use of an algorithm to determine the optimal location and settings of APFs.

4.1. Optimization Problem Formulation

In this paper, the authors presented the optimization problem for determining the optimal settings of APF in an LV distribution network with a defined objective function shown in expression (7), the associated decision variables, expression (9), and through the constraints that are defined by expressions (10) to (14). The THDV for each bus m is calculated using the total harmonic load according to (8).
min f x = min m = 1 M T H D V m
T H D V , m = h H   V m , h bus 2 V m , 1 bus ,   m M ,   h H
As in previous expressions, m defines the bus number, THDV,m represents the value of THDV at bus m, and ℎ stands for harmonic order number (according to EN 50160, the 40th harmonic order is the maximum order considered). V m , h bus is set for the voltage value at bus m for harmonic order number h, while V m , 1 bus presents the voltage value at bus m at nominal frequency.
Decision variable vector x given in (9) is defined for every phase p and harmonic order number h with the associated angle φ.
x = I 1 , 1 , ,   I p , h ,   φ 1 , 1 ,   , φ p , h ,       p P ,   h H
The limitations of the created optimization problem are defined through the physical limitations of the active filters themselves and the observed network as well as the limitations of the network rules or related norms. The physical limitations of APFs specify the use of only three-phase, three-wire APFs capable of generating only the first 12 odd harmonics specifically from the 3rd harmonic order up to the 25th harmonic order. This limitation, formulated in Equation (10), is defined because EN 50160 only defines threshold values for the first 25 odd harmonic orders. The remaining odd harmonics (from the 25th to the 40th order) are not strictly regulated, as their values are typically low, contributing minimally to the overall voltage harmonic distortion [2].
I APF   = h = 3 H I h   ;   h = 3 , 5 , 7 , 25  
where I APF   represents the current generated by the APF and I h is the harmonic current. The rated current constraint of APF is considered in the optimization process, which is presented in expression (13). Since only commercially available APF sizes can be selected during the optimization process, this constraint can also be considered a possible decision variable value. This study incorporates a database of market-available devices into the optimization process.
I n APF   r a t e d I m i n APF , , I APF , , I m a x APF ;   n N
The APF’s rated RMS (root mean square) current constraint, as defined in Equation (12), specifies that the total sum of absolute values of individual harmonic currents across all three phases must not exceed the filter’s rated current. This constraint is related to the constraint defined in the previous expression (11). Specifically, it allows APFs to generate different effective amplitude values per phase and permits the normalization of the maximum amplitude to 100% of the rated current.
I n APF   r a t e d p = 1 P h = 3 H I p , h
The constraint shown with expression (13) is related to the APF method of generating currents to reduce harmonics. The generating current method implemented in the optimization process of this paper is prioritizing the generation of currents that cancel triplen harmonics (harmonics order of multiple of number 3), which is followed sequentially by the remaining odd harmonics in ascending order, such as the 5th, 7th, and so on. This approach is motivated by the issues caused by harmonics that are multiples of 3, highlighting the importance of eliminating these specific harmonics from the system.
I n A P F   r a t e d   I t A P F , I b A P F , ; n N t = 3 ,   9 ,   15 ,   21 b = 5 ,   7 ,   11 ,   13 ,   17 ,   19 ,   23 ,   25
Network constraints are tied to the distribution system’s fundamental operating limits, and these are important because the system’s technical capabilities can affect the optimization process result. Specifically, the number of connected filters and their corresponding rated currents depend on the network load. This is shown with expression (14), which occurs since nonlinear loads have a variable nature, and the value of harmonics depends on time and load variability. Before starting the optimization process of finding the proper locations of APFs, the state of the network is observed, and the load across all lines within the network is examined. The process then defines the maximum allowable rated current of the APF based on network capacity.
I n , h APF m = 1 M I m max ;     m M
The final constraint concerns the voltage harmonic levels across all buses in the observed network. This constraint requires that the observed values of voltage harmonics remain below specified maximum limits. As shown in Equation (15), this limitation applies to all buses within the LV network and is essential for maintaining power quality. Legal regulations and grid codes often mandate compliance with this constraint, ensuring the harmonics do not exceed the established thresholds.
V m h V m h m a x ; m M , h = 3 , 5 , 7 , 25

4.2. Algorithm for Determining Optimal Settings for APF

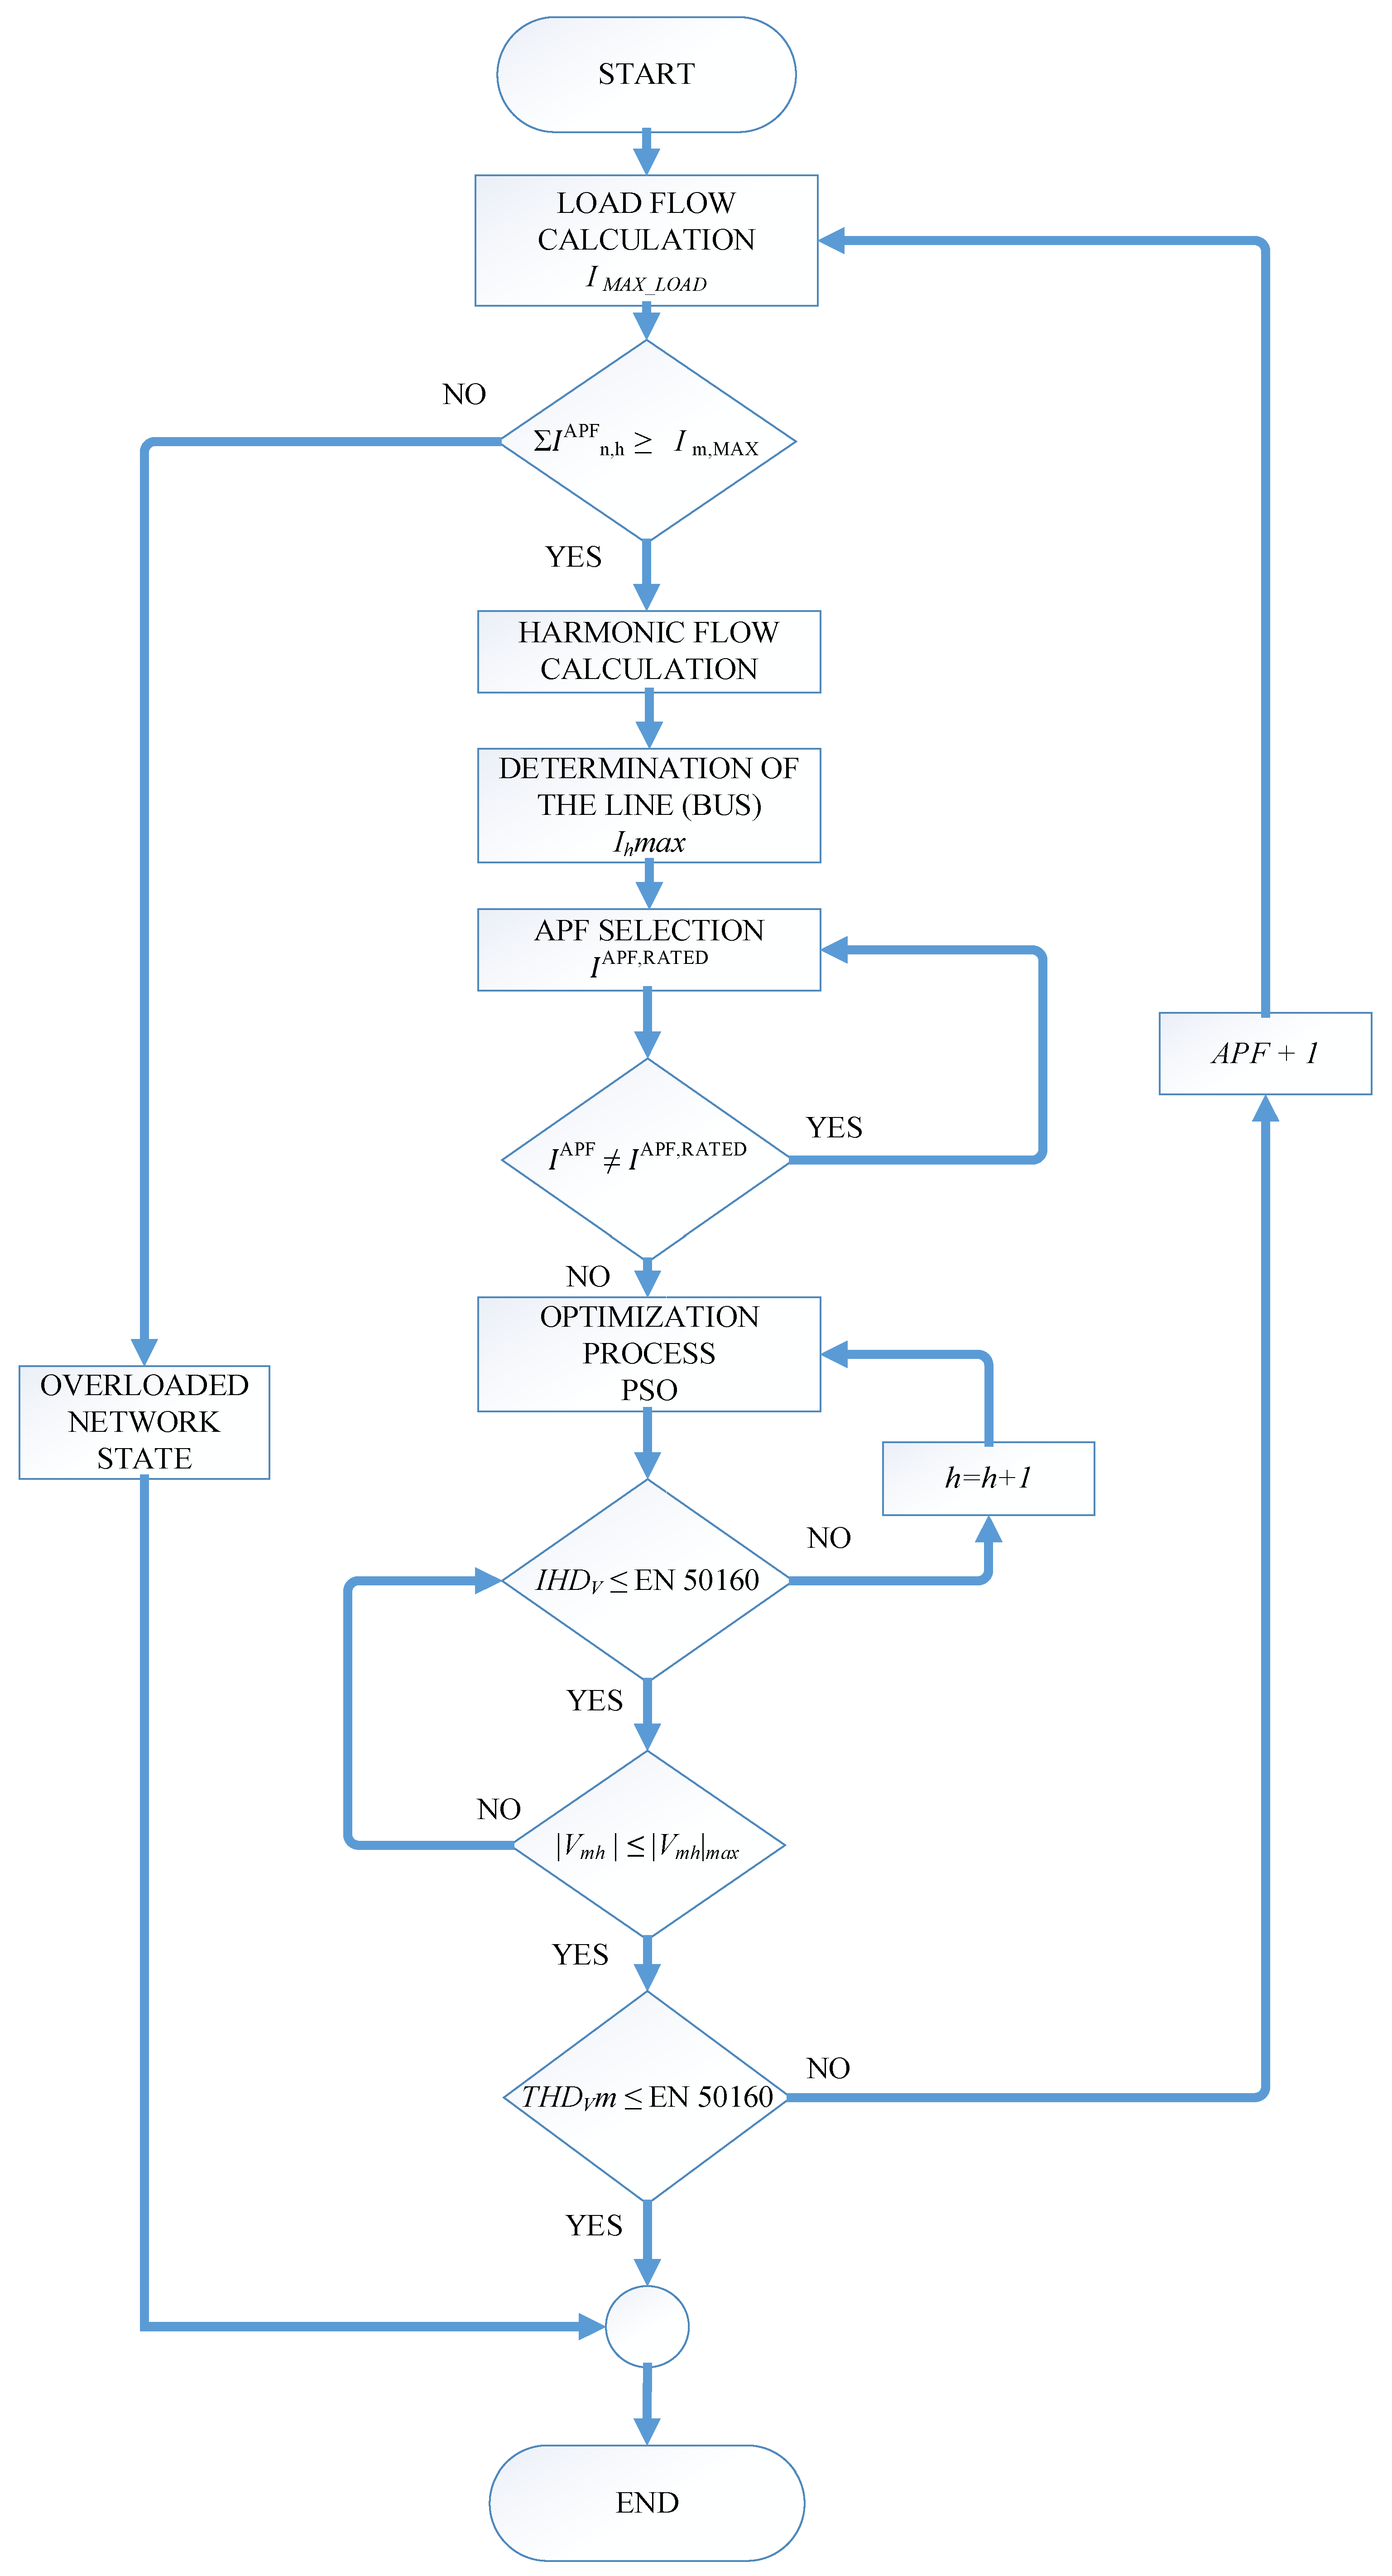
The flowchart presented in Figure 2 illustrates the algorithm for determining the optimal APF settings in a test network. The algorithm’s execution consists of the following steps: load flow calculation, harmonic flow calculation, determination of the line (bus), APF selection, determining nominal filtering current, and optimization process.
The load flow calculation is carried out to determine the network’s state, analyzing the status of the entire test network. Based on the results obtained from the load flow calculation regarding the test network state, the algorithm decides whether integrating the APF into the test network is possible. Suppose there is no sufficient capacity for the APF integration; in that case, the process of determining the setting of APF is canceled, and the algorithm outputs a message indicating that adding the APF is not possible. This approach limits the maximum number of APFs connected to the test network in terms of its technical limits. Suppose it is possible to integrate APFs into the test network; i.e., in that case, if there is enough space in the network concerning loads and generation, the algorithm moves to the harmonic calculation of power flows as the next step.
Harmonic flow calculation is performed after the load flow status of the entire test network. This calculation comprehensively analyzes the whole harmonic spectrum (from the 1st to the 40th order) to determine harmonic content across all lines and cables within the test network. Based on the results obtained, the analysis defines the relative contributions of individual harmonics.
Determination of the line (bus) for APF placement is the next step of the algorithm. Analyzing the results of the harmonic flow calculation identifies the line or cable with the highest share of the third harmonic. The position of the highest value of the third harmonic is set for the initial point for placing the APF. The negative impact of the triplen harmonics in three-phase systems with neutral conductors is the main reason for setting this condition for this step [49]. APF, as a current source, cannot be connected directly to the line; it is necessary to identify the node where the APF should be added. From the point of view of the substation, the algorithm will define the node (bus) located at the end of the line based on the specified physical limitation. The reason for choosing the node at the end of the line is due to the principle of operation of APF; i.e., APF, as a current source, generates currents that cancel the injected harmonic components of nonlinear loads coming from the network, and it is necessary to install it at the end of the lines.
APF selection is performed after the algorithm determines the location (bus) to which the APF is connected. Based on the obtained technical capabilities of the test network, the algorithm determines the maximum current that the APF can generate provided that the physical constraints of the network are met. The obtained value represents the maximum filtering current and enables the algorithm to define the nominal filter current from the base of commercially available devices. The APF model used in the algorithm, as well as commercially available devices, supports the generation of different currents per phase with corresponding phase angles. Also, the APF model is configured to allow the generation of harmonic currents per phase with a specific spectrum based on each harmonic current’s relative amplitude and angle.
The nominal filtering current is selected from the database of commercially available devices by selecting the device with the nominal current closest to but not exceeding the calculated maximum current. Most commercially available APFs have the physical constraint that limits them to generating no more than 15 higher-frequency harmonic currents simultaneously. This restriction, along with constraints given by the EN 50160 standard (specifying limit values for only the first 12 odd-order harmonics), models APFs as real-life devices that can be used in the algorithm for determining the optimal settings of APFs in the modeled test network. All mentioned constraints are applied to the APF model and are crucial for optimization. Using the APF model with the same limitations as the actual APF prevents the algorithm from compensating for odd-order harmonics above the 25th order.
The optimization process is conducted using the PSO metaheuristic method. Once the bus and APF are selected, the algorithm initiates the optimization method to determine the optimal APF settings by adjusting the relative amplitude and the phase angle of each odd harmonic across all three phases. The optimization method, following the objective function defined in expression (7), monitors the THDV values at all buses of the test network, aiming to reduce its level. This method first adjusts the relative amplitude and phase angle in all three phases, generating currents from the APF to counteract the effect of the third harmonic while continuously monitoring the THDV levels across all buses in the test network. When a further reduction in THDV through the amplitude and angle of the third harmonic is no longer possible or when convergence is reached, the optimization process repeats the procedure, initially for all triplen harmonics, which is followed by all other odd harmonics in ascending order: 5th, 7th, and so on. After fully utilizing the capacity of the first APF, the optimization process repeats the entire selection procedure for the next APF in the same defined manner.
According to the steps defined above, the algorithm for determining the optimal APF settings in the test network is executed 24 times within the optimization process (corresponding to 24 time intervals). This defined number of iterations is related to hourly load variations throughout the day in each test network bus. The load variations in this paper are applied to all modeled controllable and uncontrollable loads and at DGs with corresponding harmonic spectra (applying relative amplitudes and phase angles in all phases for all odd harmonics from the 3rd to the 40th order). For implementing the proposed algorithm, the application of APF is customized according to load levels in the test network, the penetration of DGs, and the usage of electric vehicle household charging stations. Considering daily variability, different network states can be represented along with the associated load levels, which can serve as the basis for assessing the condition of asymmetrical low-voltage networks. These network states are defined below:
  • Underloaded state of the test network
This defined network state refers to the relative load of all connection elements, which predominantly occurs during the lower tariff period with minor stochastic load fluctuations. This state enables the implementation of APFs to reduce harmonics at all buses in the test network that physically (positionally) permit it. The underloaded state of the test network allows the algorithm to select APF devices with higher nominal values and potentially implement a larger number of APFs in the test network. In this network state, the optimization process has sufficient energy capacity to reduce harmonic currents successfully.
2.
Additional underloaded state of network
This additional network state occurs when the network’s IHD and THDV values are within the limits prescribed by standards. In this state, the optimization process is not required.
3.
Normal state of the test network
The normal state of the test network is classified as the most common network condition, where the relative load on all connection elements is between 60% and 85%. This state typically has substantial stochastic load variations during the higher tariff period. The algorithm for determining optimal APF settings can perform optimization, but it has partial limitations related to the state of observed connected elements in the test network. At the normal state of the test network, the algorithm has to deal with restricted capabilities for selecting APF devices and a limited capacity to implement a larger number of APFs within the test network. For this state of the test network, the optimization process has an energy capacity that may not eliminate all harmonics; instead, it will reduce only the part of harmonics in the network.
4.
Additional normal state of network
In this additional normal state of the network, the integration of two or more APFs is limited by the network load. In this state, only one APF can be maximally integrated.
5.
Overloaded state of the test network
This network state refers to the condition where all connected elements exceed 90% of their rated load value. The algorithm’s application is impossible in this state of the test network, meaning that the algorithm cannot place an APF into the network. For further explanation, the rated current of the APF exceeds the current network can bear. Therefore, the optimization process cannot be executed under these conditions.

5. Evaluation of the Optimization Method for Determining Parameters and Optimal APF Settings in the Test Network

5.1. Test Network Model

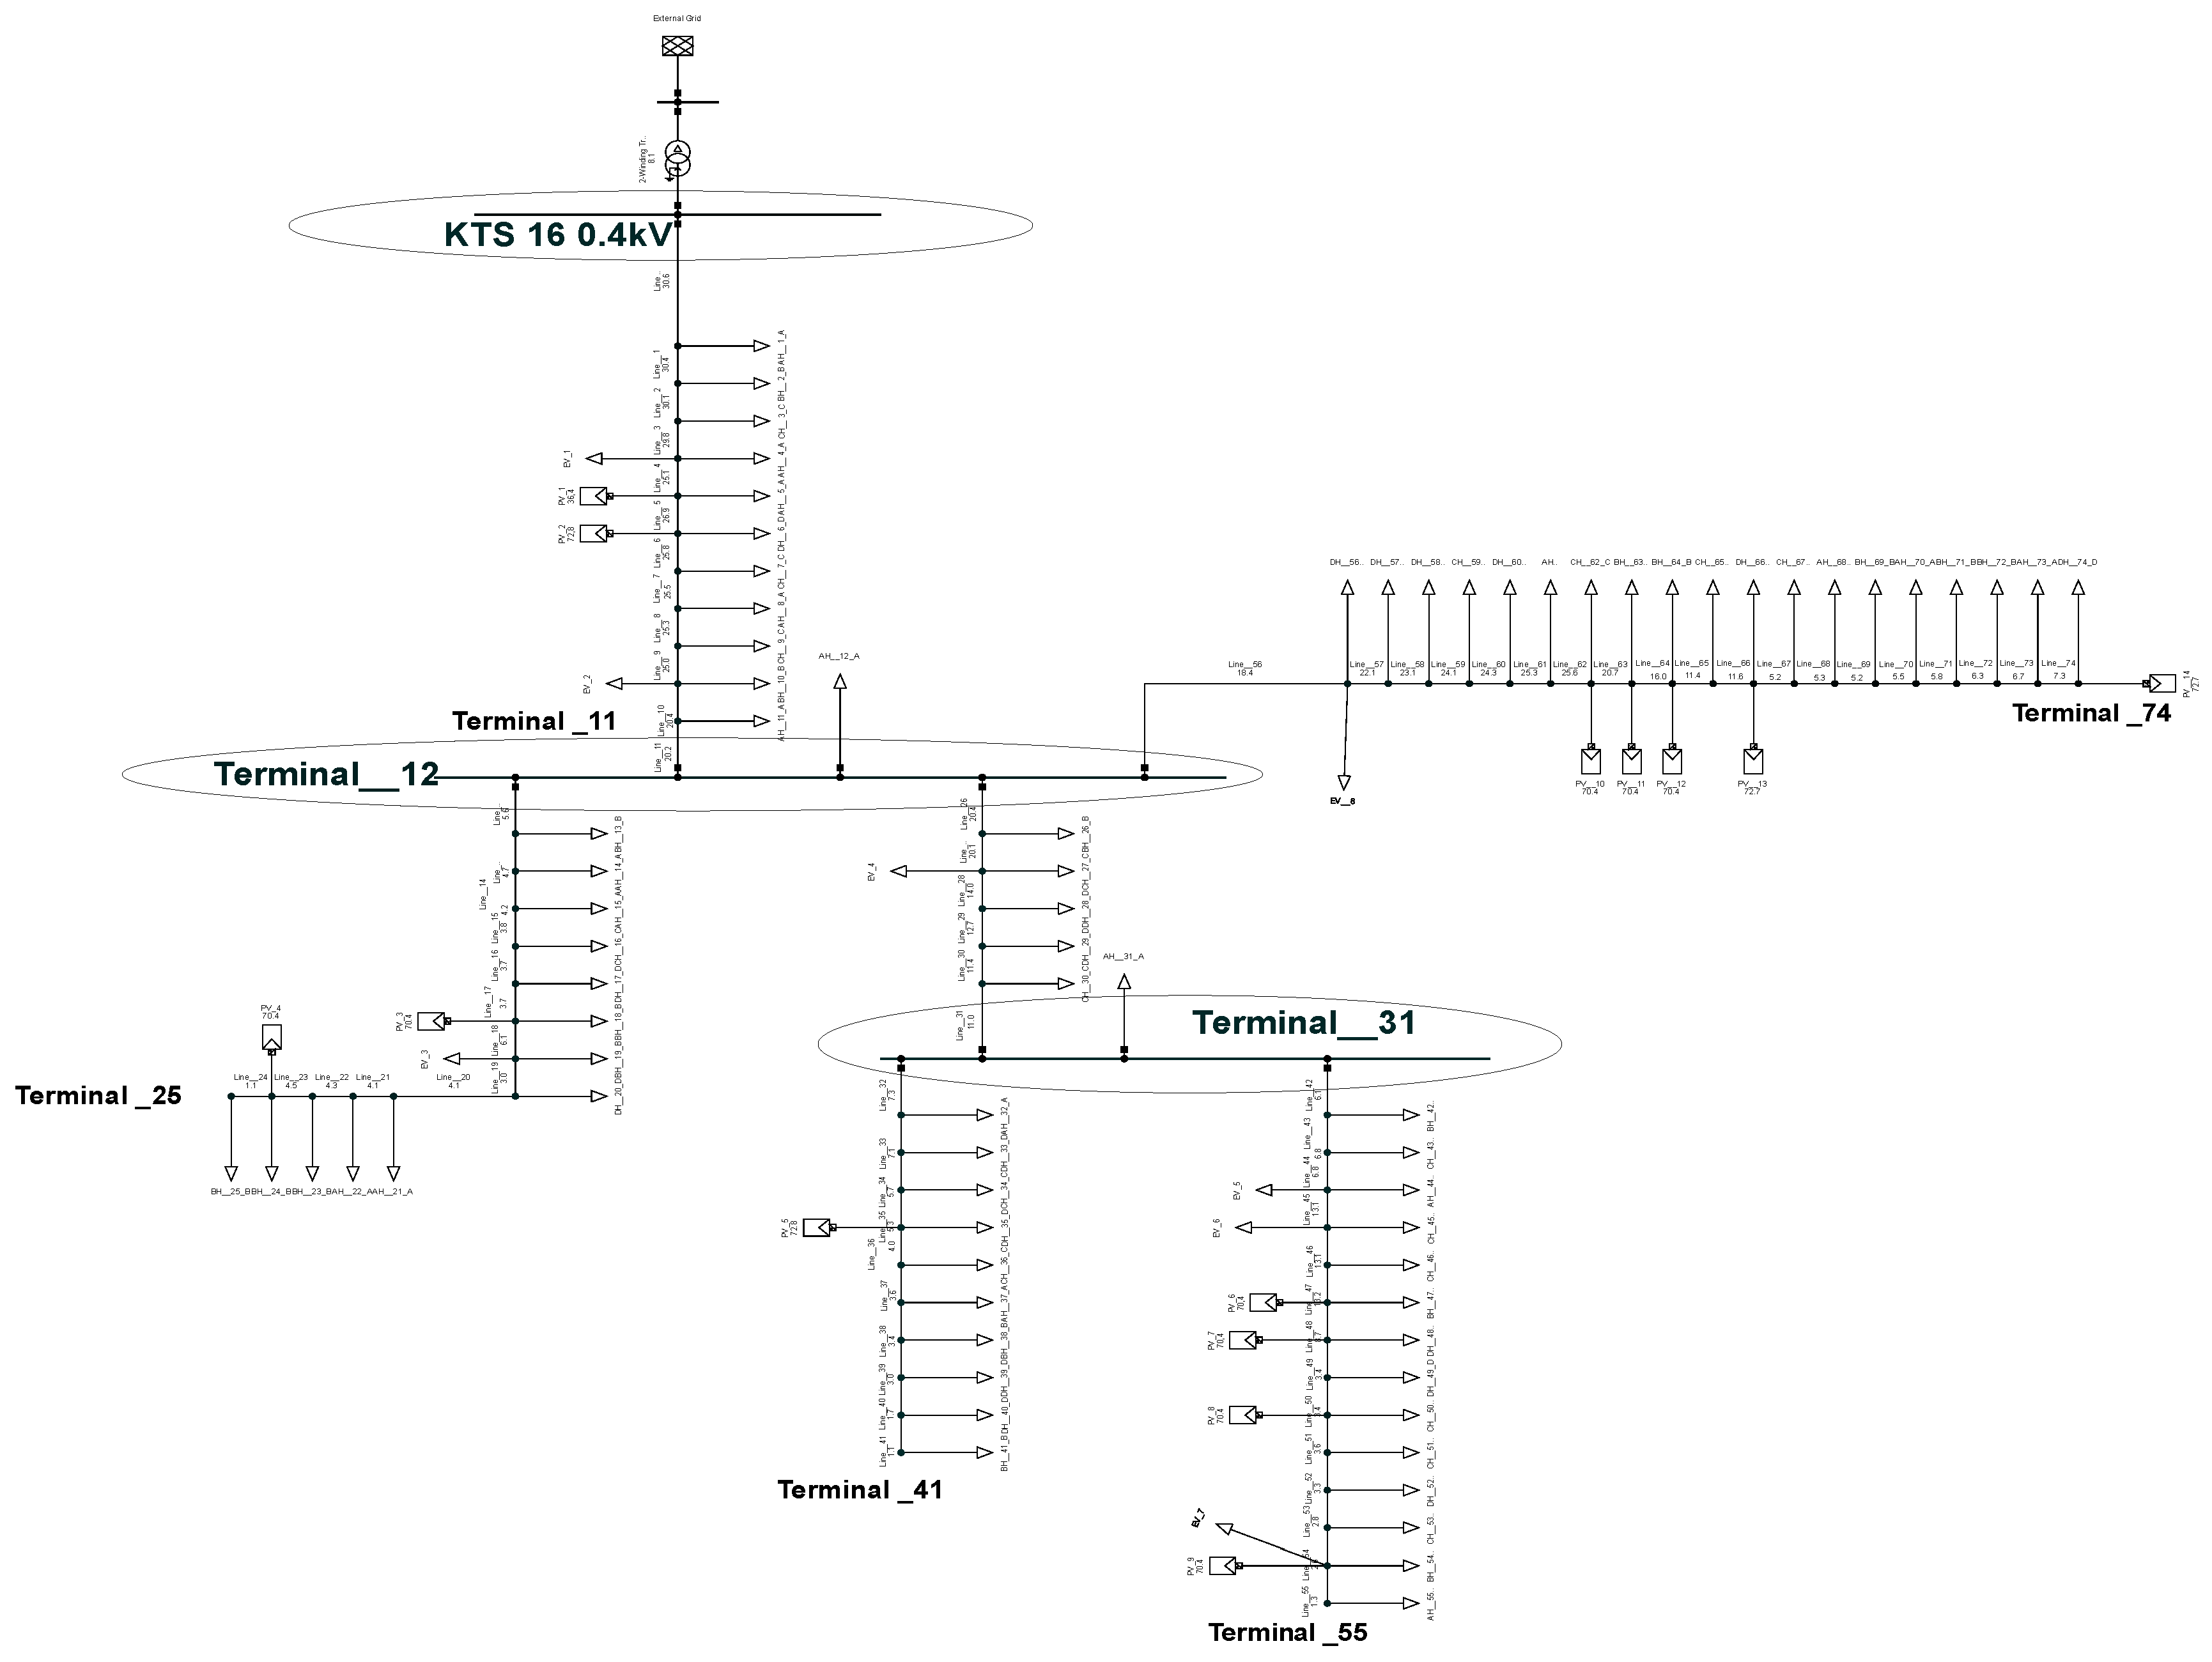
A tested network model of a real radial LV distribution network, shown in Figure 3, has been modeled in DigSILENT Power Factory. The modeled test network is used to simulate an actual rural distribution feeder with a total length of 870 m, consisting of a 170 m section of PPOOA 4 × 120 mm2 cable and a 700 m section of overhead line FR-N1XD9-AR 3 × 70 + 70 + 2 × 16 mm2. A total of 74 different consumers are connected to the tested network. The consumer models represented as loads in this study are generally divided into uncontrollable and controllable loads. Uncontrollable loads are modeled as households with constant and uninterrupted electricity supply whose consumption cannot be actively managed or modified. Real measurement data from four different types of households, considering their characteristics and connection methods, are implemented in uncontrollable loads models. The controllable load model allows for shifting consumption to a desired time period, enabling load management.
An EV home charging station has been taken as a controllable load model in the test network. This approach enhances grid flexibility and allows for determining the maximum charging power available for EVs. Two controllable load models have been used in test networks, depending on their connection type (three-phase or single-phase loads). The test network uses three-phase and single-phase PV power plants as the DGs. The DG in this paper does not use parameters such as solar irradiance, ambient temperature, orientation, or PV panel tilt angle as a direct input variable. Instead, the parameters mentioned are included within real measured data conducted across various types of PV plants. Two PV system models have been developed, each with corresponding inverters: a single-phase model with an installed power of 3.2 kWp and a three-phase model with an installed power of 6 kWp.
Uniform continuous distribution determines the layout of loads (uncontrollable and controllable) and sources across the test network. This approach ensures that load locations are assigned uniformly, enabling a balanced representation of demand points across the feeder. A total of 74 uncontrollable loads (households), 8 controllable loads (home EV charging stations), and 14 DGs (PV power plants) are modeled within the test network. The results of the uniform continuous distribution, representing the connection points (buses) of these consumers and DGs, are presented in Table 2.
The distance between consumers is defined by the mutual distance calculated as the total feeder length (cable or overhead line) ratio to the number of consumers connected along each section. Consequently, consumers connected to the substation by cable are 14 m apart, while those connected by overhead line are 11 m apart. The distance between the substation and the first bus (i.e., the first consumer) is 16 m. The radial feeder’s branching is designed to increase the feeder’s complexity and broaden the search space for the optimization method.
A double-tariff electricity pricing system is also considered while modeling the test network. The higher tariff is active from 8:00 a.m. to 10:00 p.m., while the lower tariff is active from 10:00 p.m. to 8:00 a.m.
Three specific terminals have been observed. The first characteristic terminal, marked as KTS 16 (0.4 kV), stands for the connection point of the radial network to the transformer. This terminal is considered a PCC where voltage conditions are monitored according to the EN 50160 standard, which defines voltage characteristics and limitations for the PCC. The second characteristic terminal is terminal 12, marked as Terminal_12 in Figure 3. It represents the point where the cable transitions into an overhead line, where the conductor cross-section is reduced. The point marked as Terminal_31 is the last characteristic terminal, and it is considered a point where multiple overhead lines are branching. The specific terminals are defined for locations in the test network where an odd harmonic order spectra (from 3rd to 40th) will be shown. The THDV will be presented for all buses before and after the APFs are connected to the test network.

5.2. Algorithm Results over 24 H

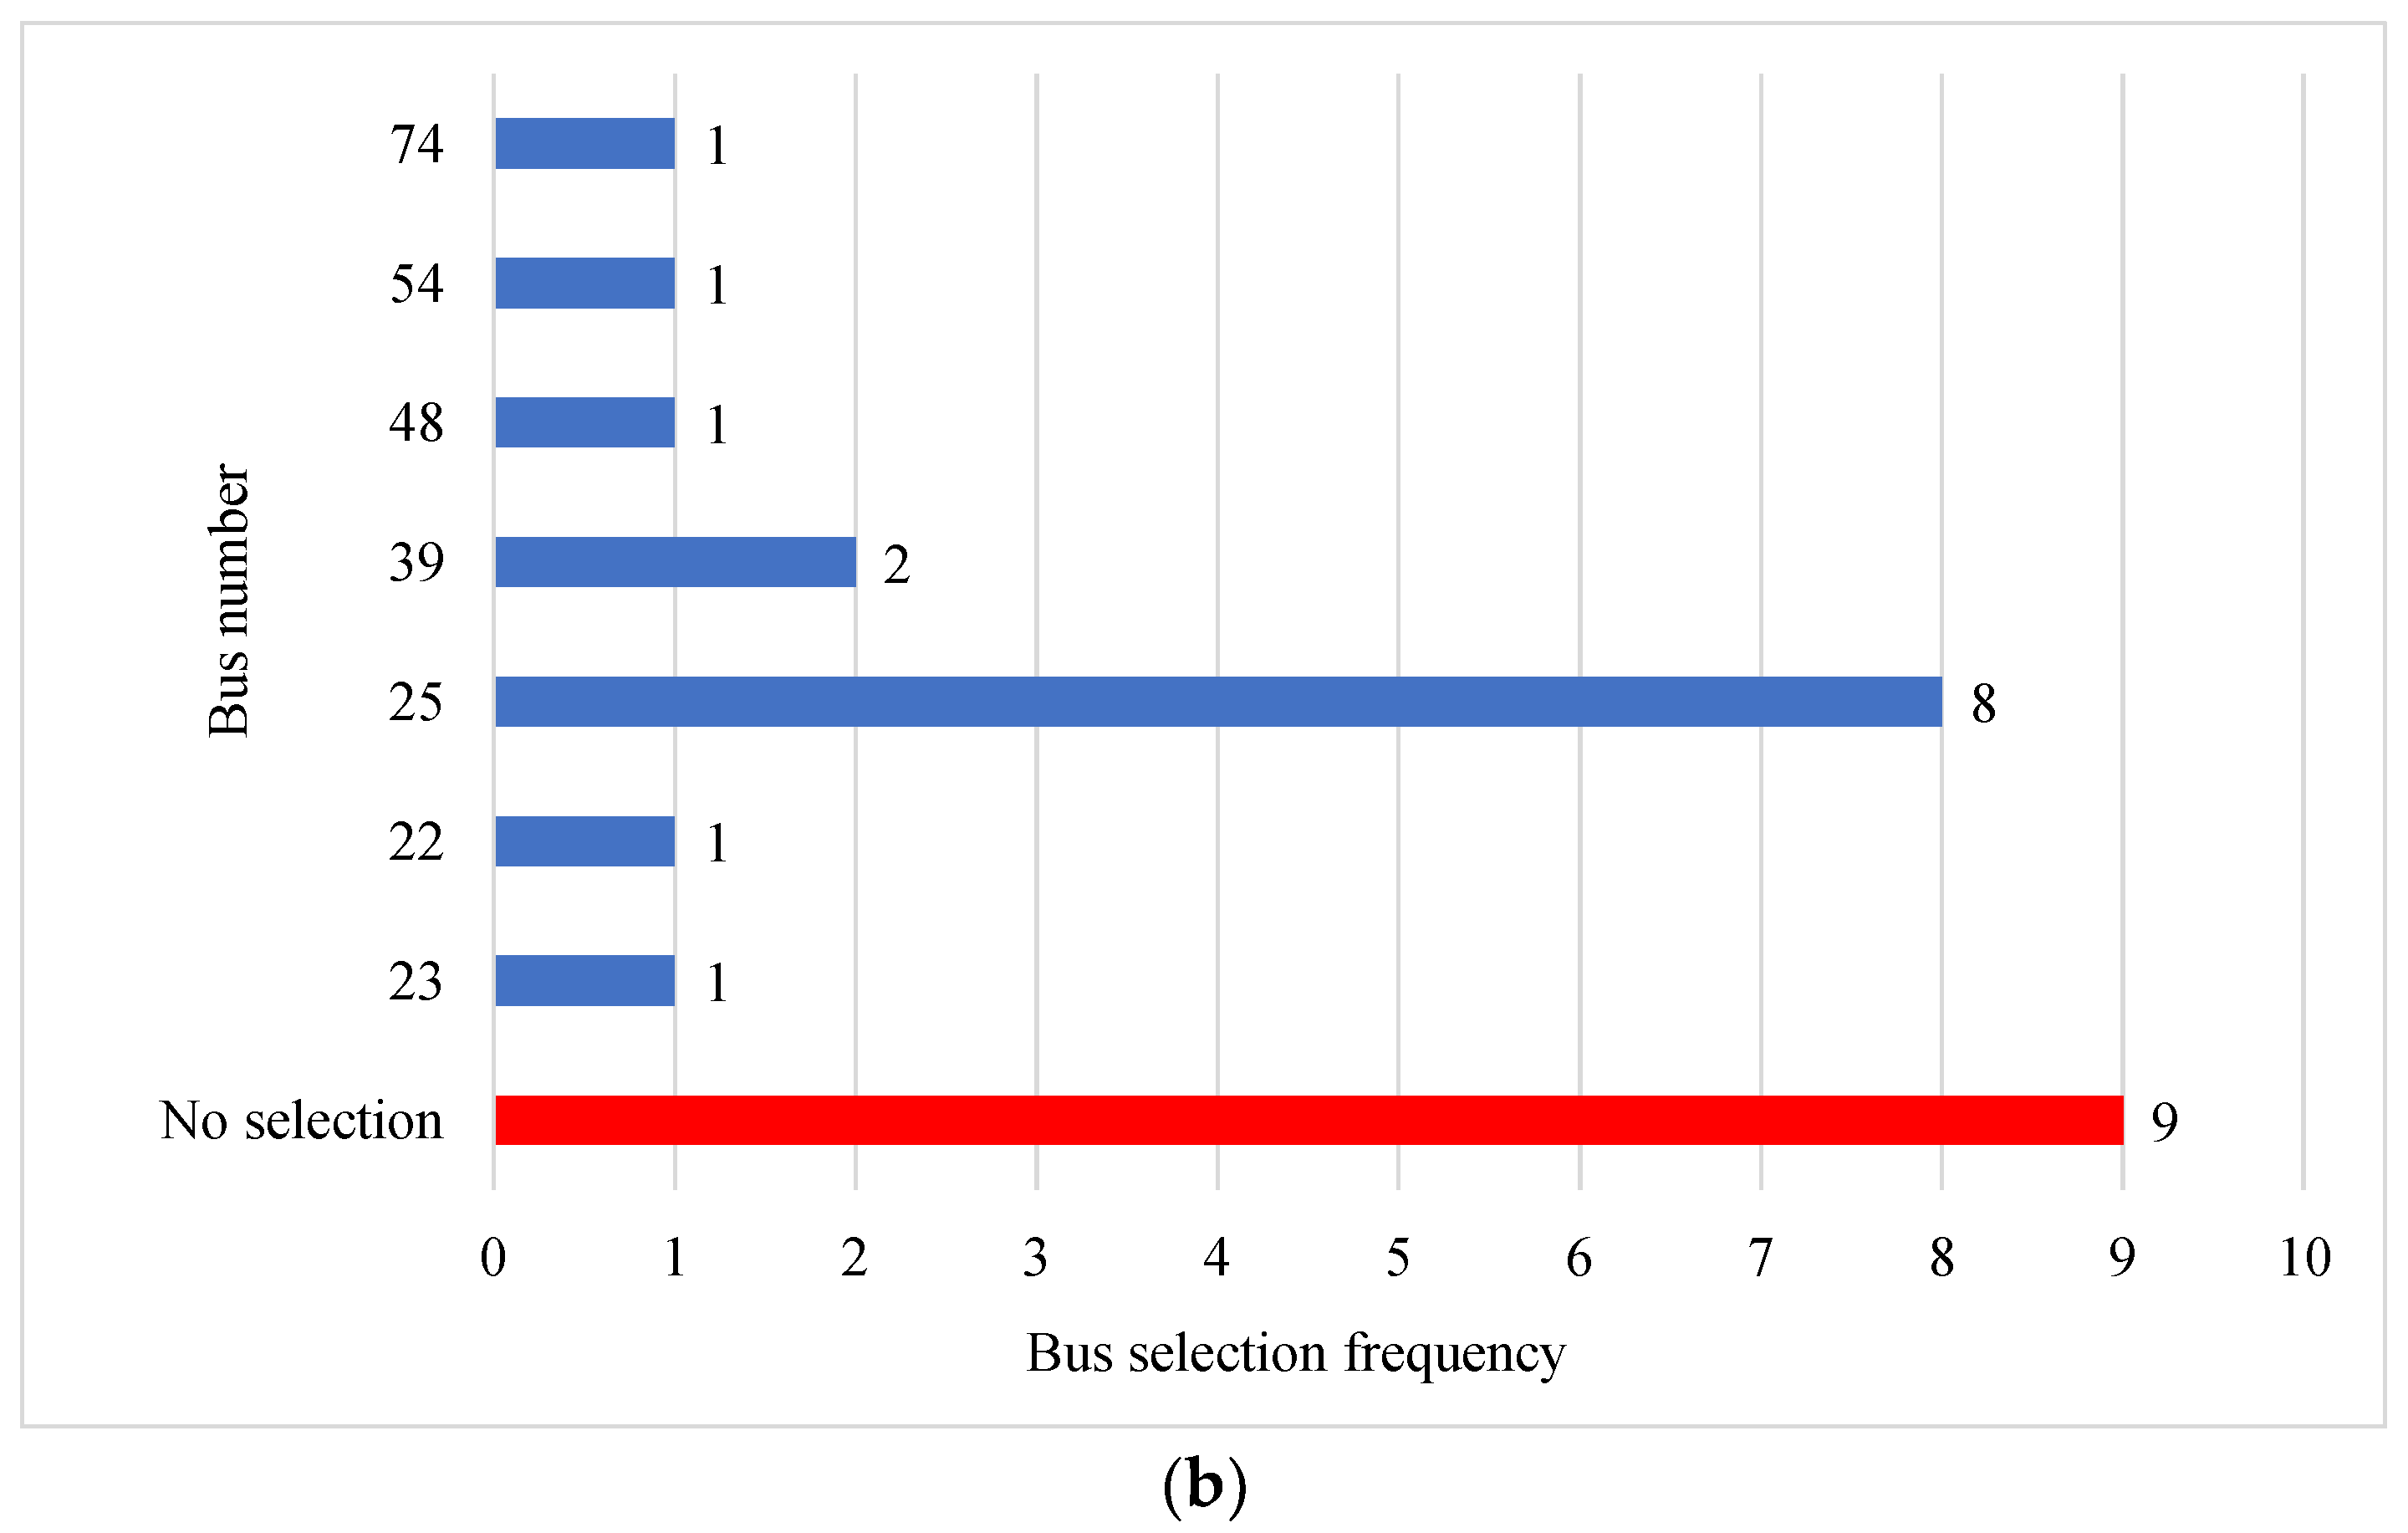
The co-simulation model for determining the optimal placement of APFs in the LV distribution network was performed according to the algorithm described in Section 4.2. where the algorithm takes into account only commercially available filters, i.e., filters with rated currents size of 30 A, 45 A, 60 A, and 70 A, and as such are in the database of available APF models. The optimal locations of APFs in the test network are algorithm results over a 24 h period in which more than two APFs were not used. The algorithm could not place an APF during certain periods of the day. The results for the first and second selected locations where the algorithm positioned an APF are shown in Figure 4a,b. The algorithm’s results for choosing the first location for APF placement indicate that bus 41 was the most frequently chosen with the APF being placed there eight times. In relative terms, this means the algorithm assigned the APF to this bus in 33.33% of cases. The second most frequently selected location for the first APF was bus number 74, which was chosen four times, representing 16.67% of cases. It is important to note that in the results for the first location selection, the algorithm decided five times, or in 20.83% of cases, that due to the network’s state, it was impossible to connect the APF to the test network. This inability to use the APF in the test network, as depicted in Figure 4a, is labeled as “No selection” and is marked in red on the graph. This outcome represents a network condition where the network load exceeds 90%, categorizing it as an overloaded state of the test network.
After selecting the first location, if possible, the algorithm searches for a location to place a second APF and adjusts the filter’s optimal settings using the PSO method. The algorithm’s results for determining the possible location for the second APF placement are shown in Figure 4b. The algorithm’s placement results for selecting the location for the second APF indicate that the algorithm most frequently positioned the second APF at bus number 25 (8 times), accounting for 33.33% of cases. When selecting the location for the second APF, the algorithm determined nine times that the integration of a second APF was not feasible due to network loading. As in the case of locating the first APF location, the impossibility of connecting the second APF to the test network was marked with red color and labeled as “No selection” in Figure 4b. Observing the “No Selection” outcomes from the results for the first and second APFs locations, only four time intervals are possible where only one APF can be positioned in the test network. This result defines a new state of the network.
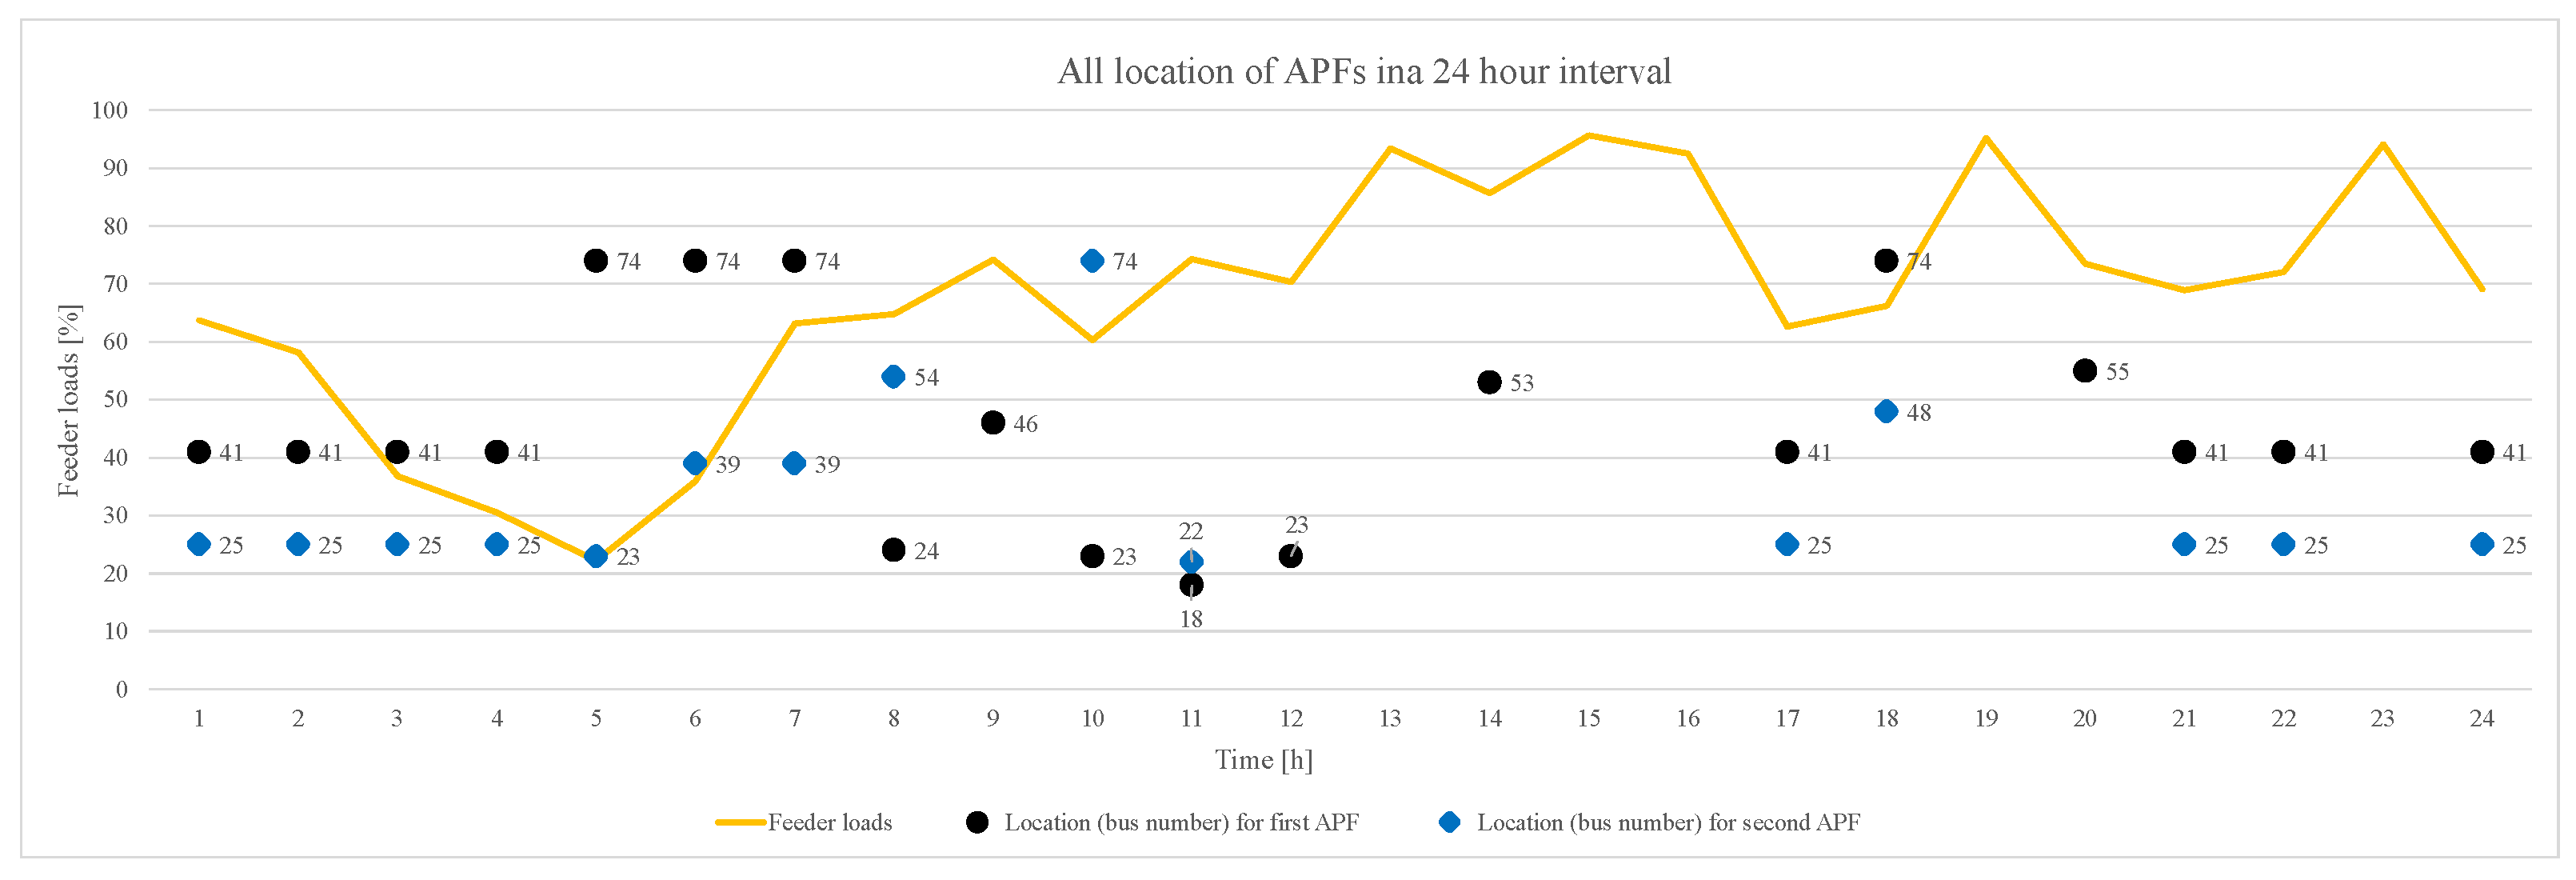
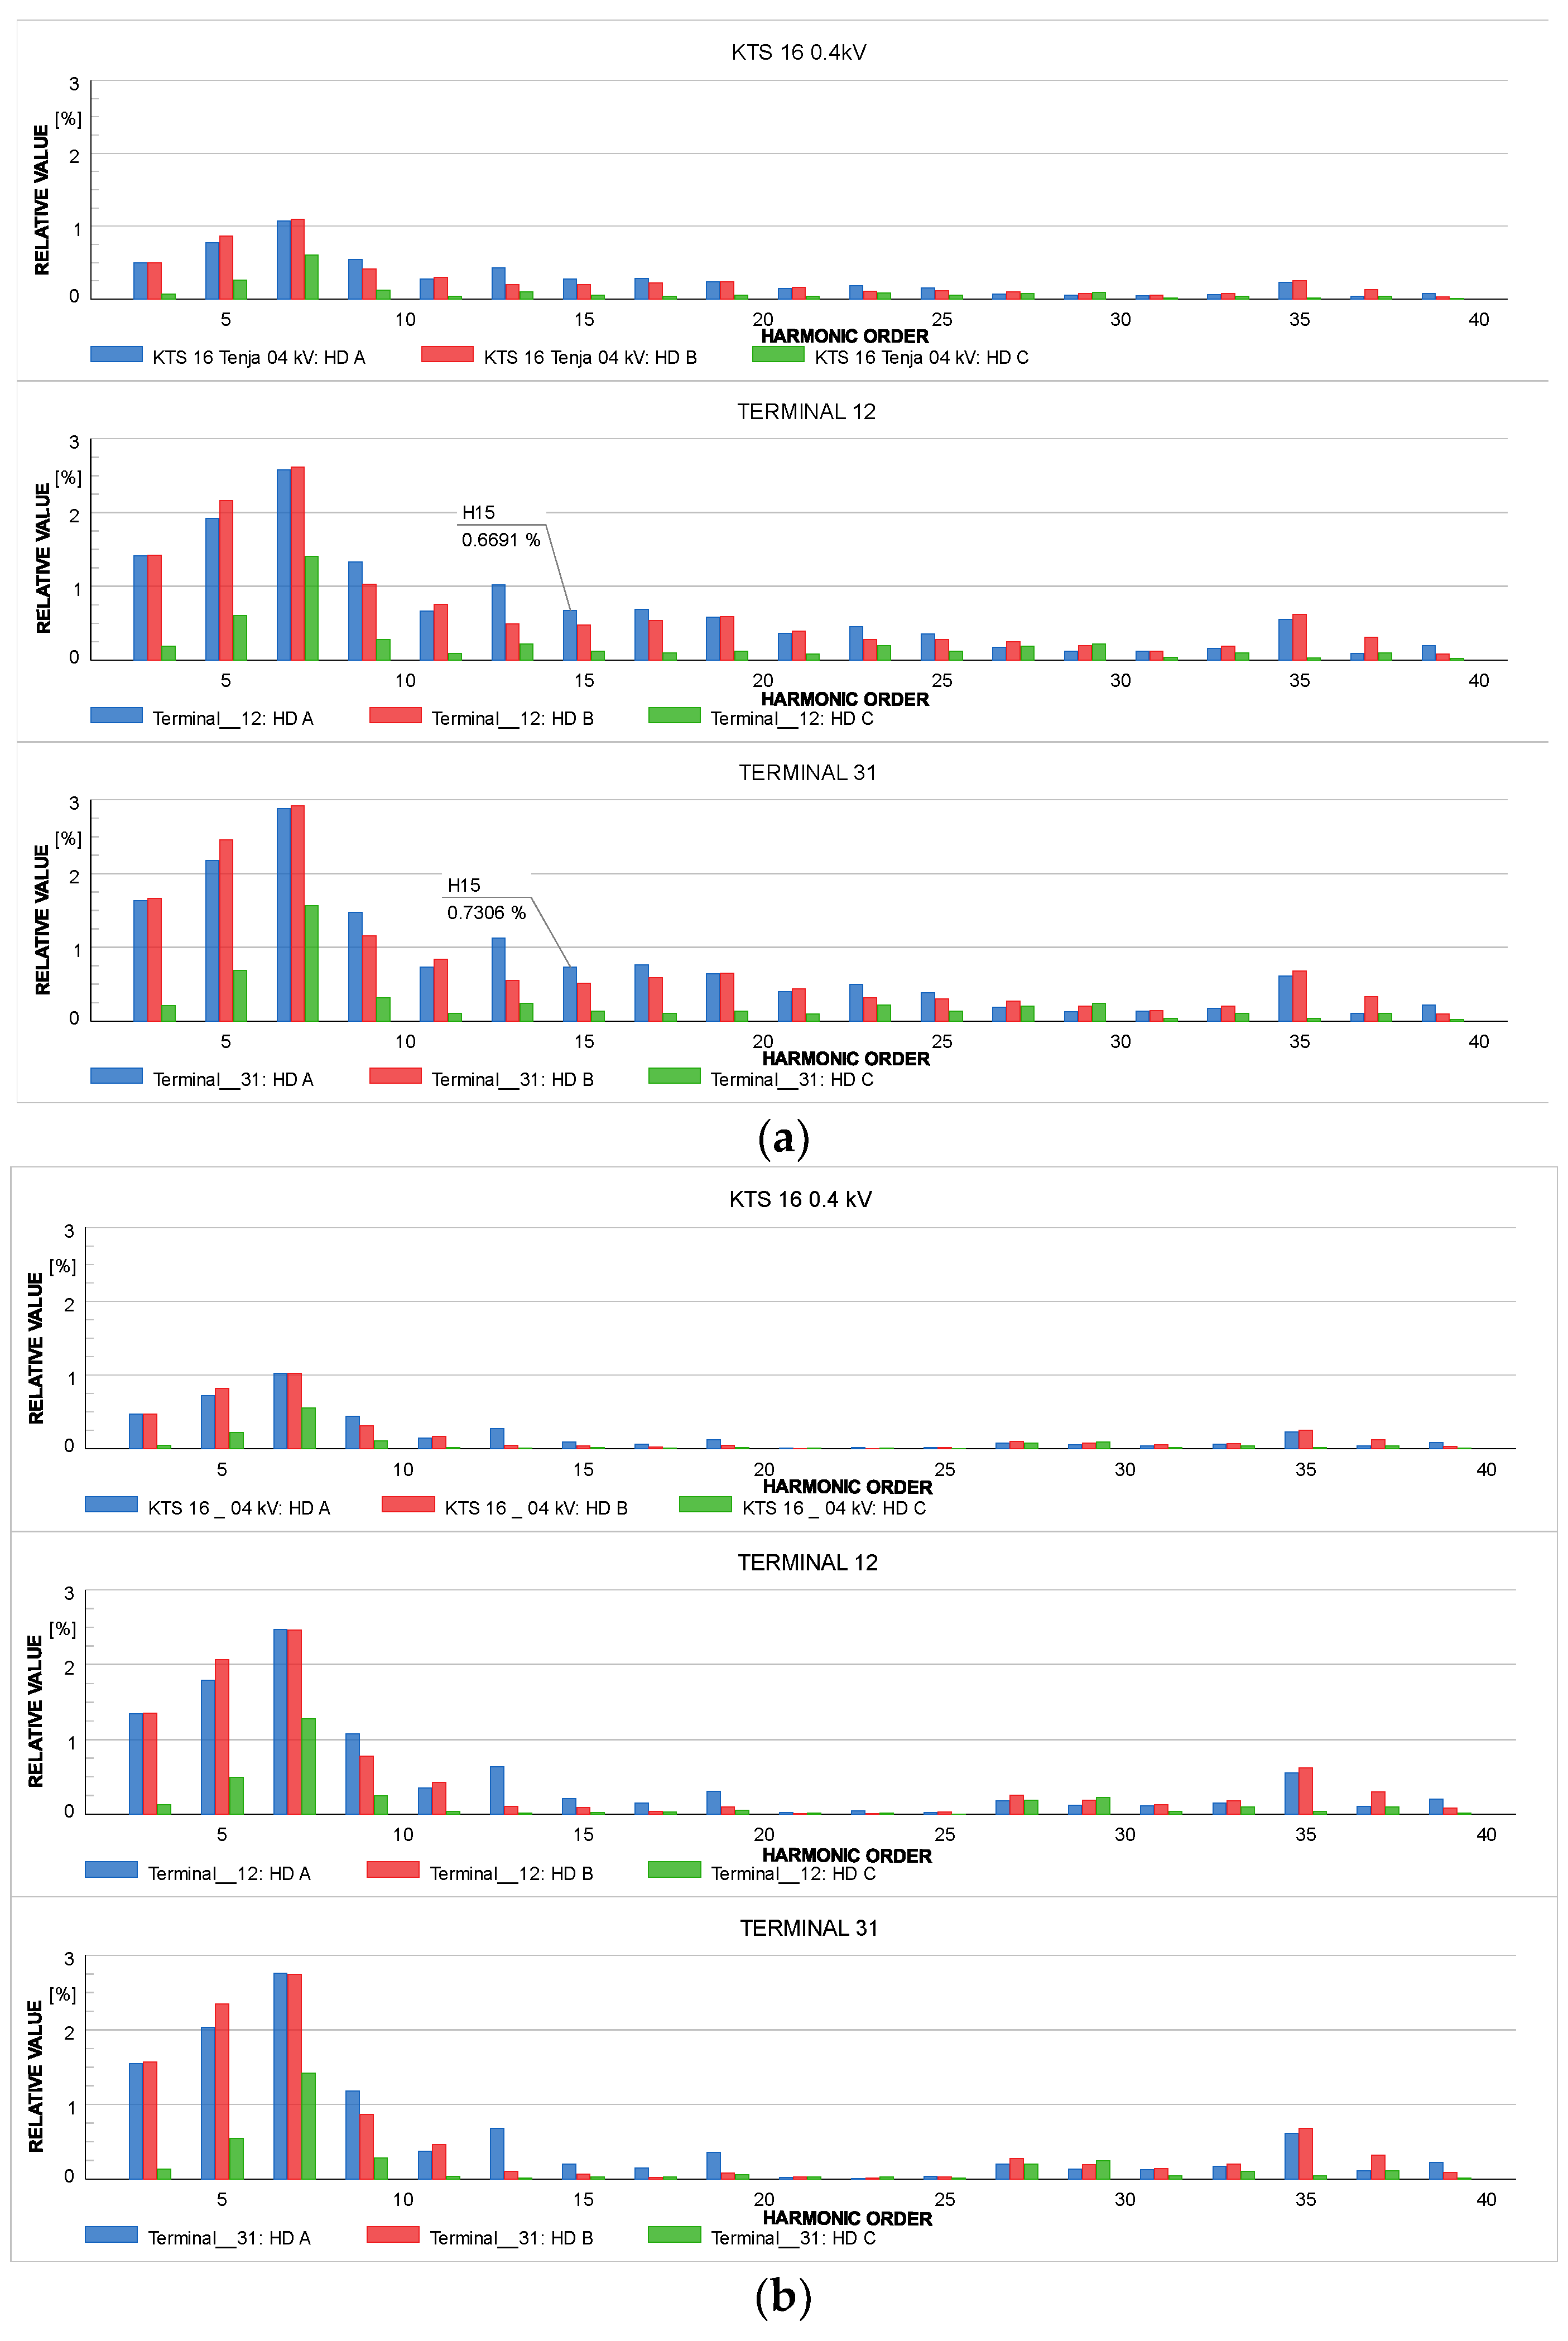
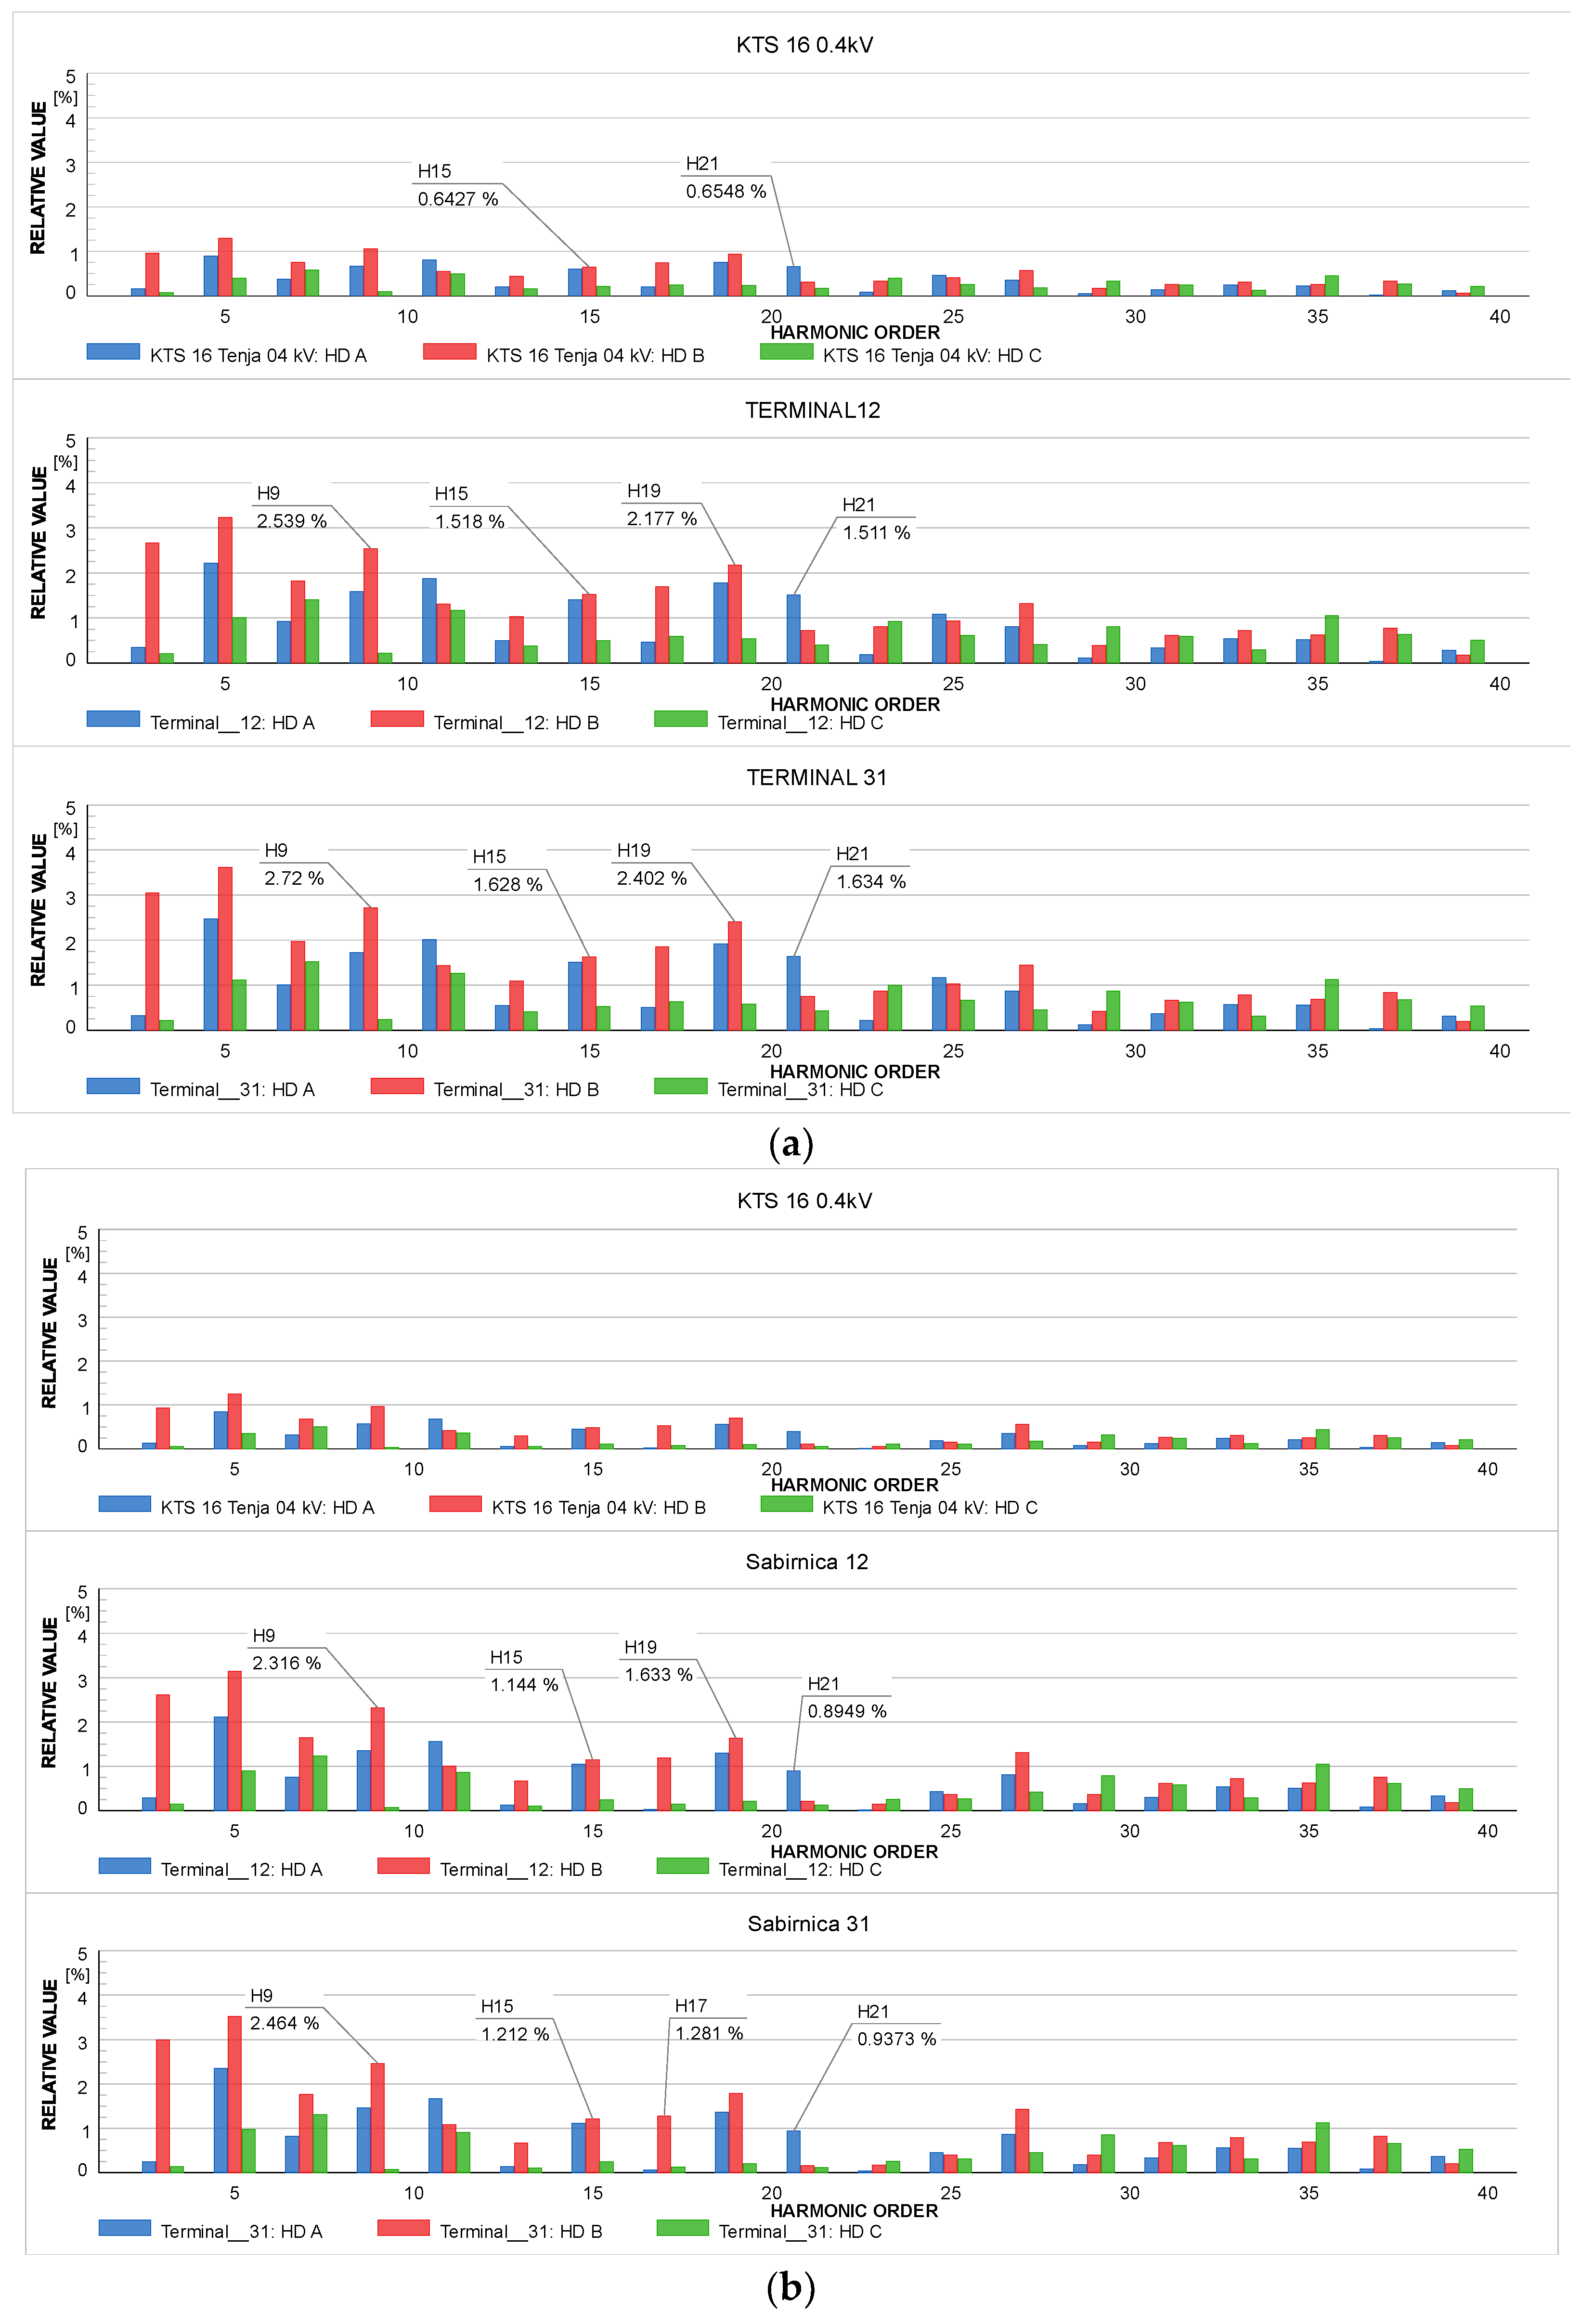
The results obtained for the distribution of APFs in the test network, using the algorithm for the optimal location of the APF, were performed over one day, i.e., within 24 observed time intervals, and are shown alongside the daily load diagram of the feeder in Figure 5. The determination of APF positions, considering the capabilities of the test network for setting optimal parameters of APF, will be observed at characteristic moments during specific network states. All defined network states will be examined while the optimization method is evaluated. The optimization procedure for determining the location and capacity of the APF would be assessed over five periods that occurred during one day (across 24 different network states). The results of all five test network states are explained and presented in graphs before and after the optimization process. Each column in the graphical representation represents the relative amount of each harmonic order (1–40) in each phase. In the graphical representation of the harmonic spectrum at key buses, the numerical values indicate levels of harmonics that exceed the limits specified by the EN 50160 standard.
  • First state of test network (24:00 p.m.–4:00 a.m.)
This test network state occurred during the low-tariff period, and the test network load values consider consumption from models of uncontrolled loads, which are minimal in the observed period. Meanwhile, the controllable load models operated at 80% of their rated power during the observed time interval. This test network state is defined as an underloaded state and takes place from 24:00 to 4:00 a.m. This observed state will be analyzed at 24:00, as the network conditions in the other specified intervals are very similar.
Figure 6a presents the voltage harmonic spectra at 00:00 before the algorithm for determining the optimal settings of APF at the test network is applied. Figure 6b shows the network state (voltage harmonic spectra) after the APF is connected to the test network as a result of the optimization process.
The current state of the network shown in Figure 6a observed only in the KTS 16 0.4 kV busbar shows that all relative harmonic values are below the value defined by the standard (i.e., less than Uh ≤ 0.5% Un), which fully meets the standard requirements. However, if the individual harmonics are observed in the depth of the feeder, it is noticeable that in the characteristic Terminal_12 and Terminal_31, an excessively high value of the 15th voltage harmonic appears. The above results meet the conditions prescribed by the standard only in the KTS 16 0.4 kV, while an optimization procedure is required in the depth of the feeder. The results after implementing the algorithm and optimization procedure are shown in Figure 6b.
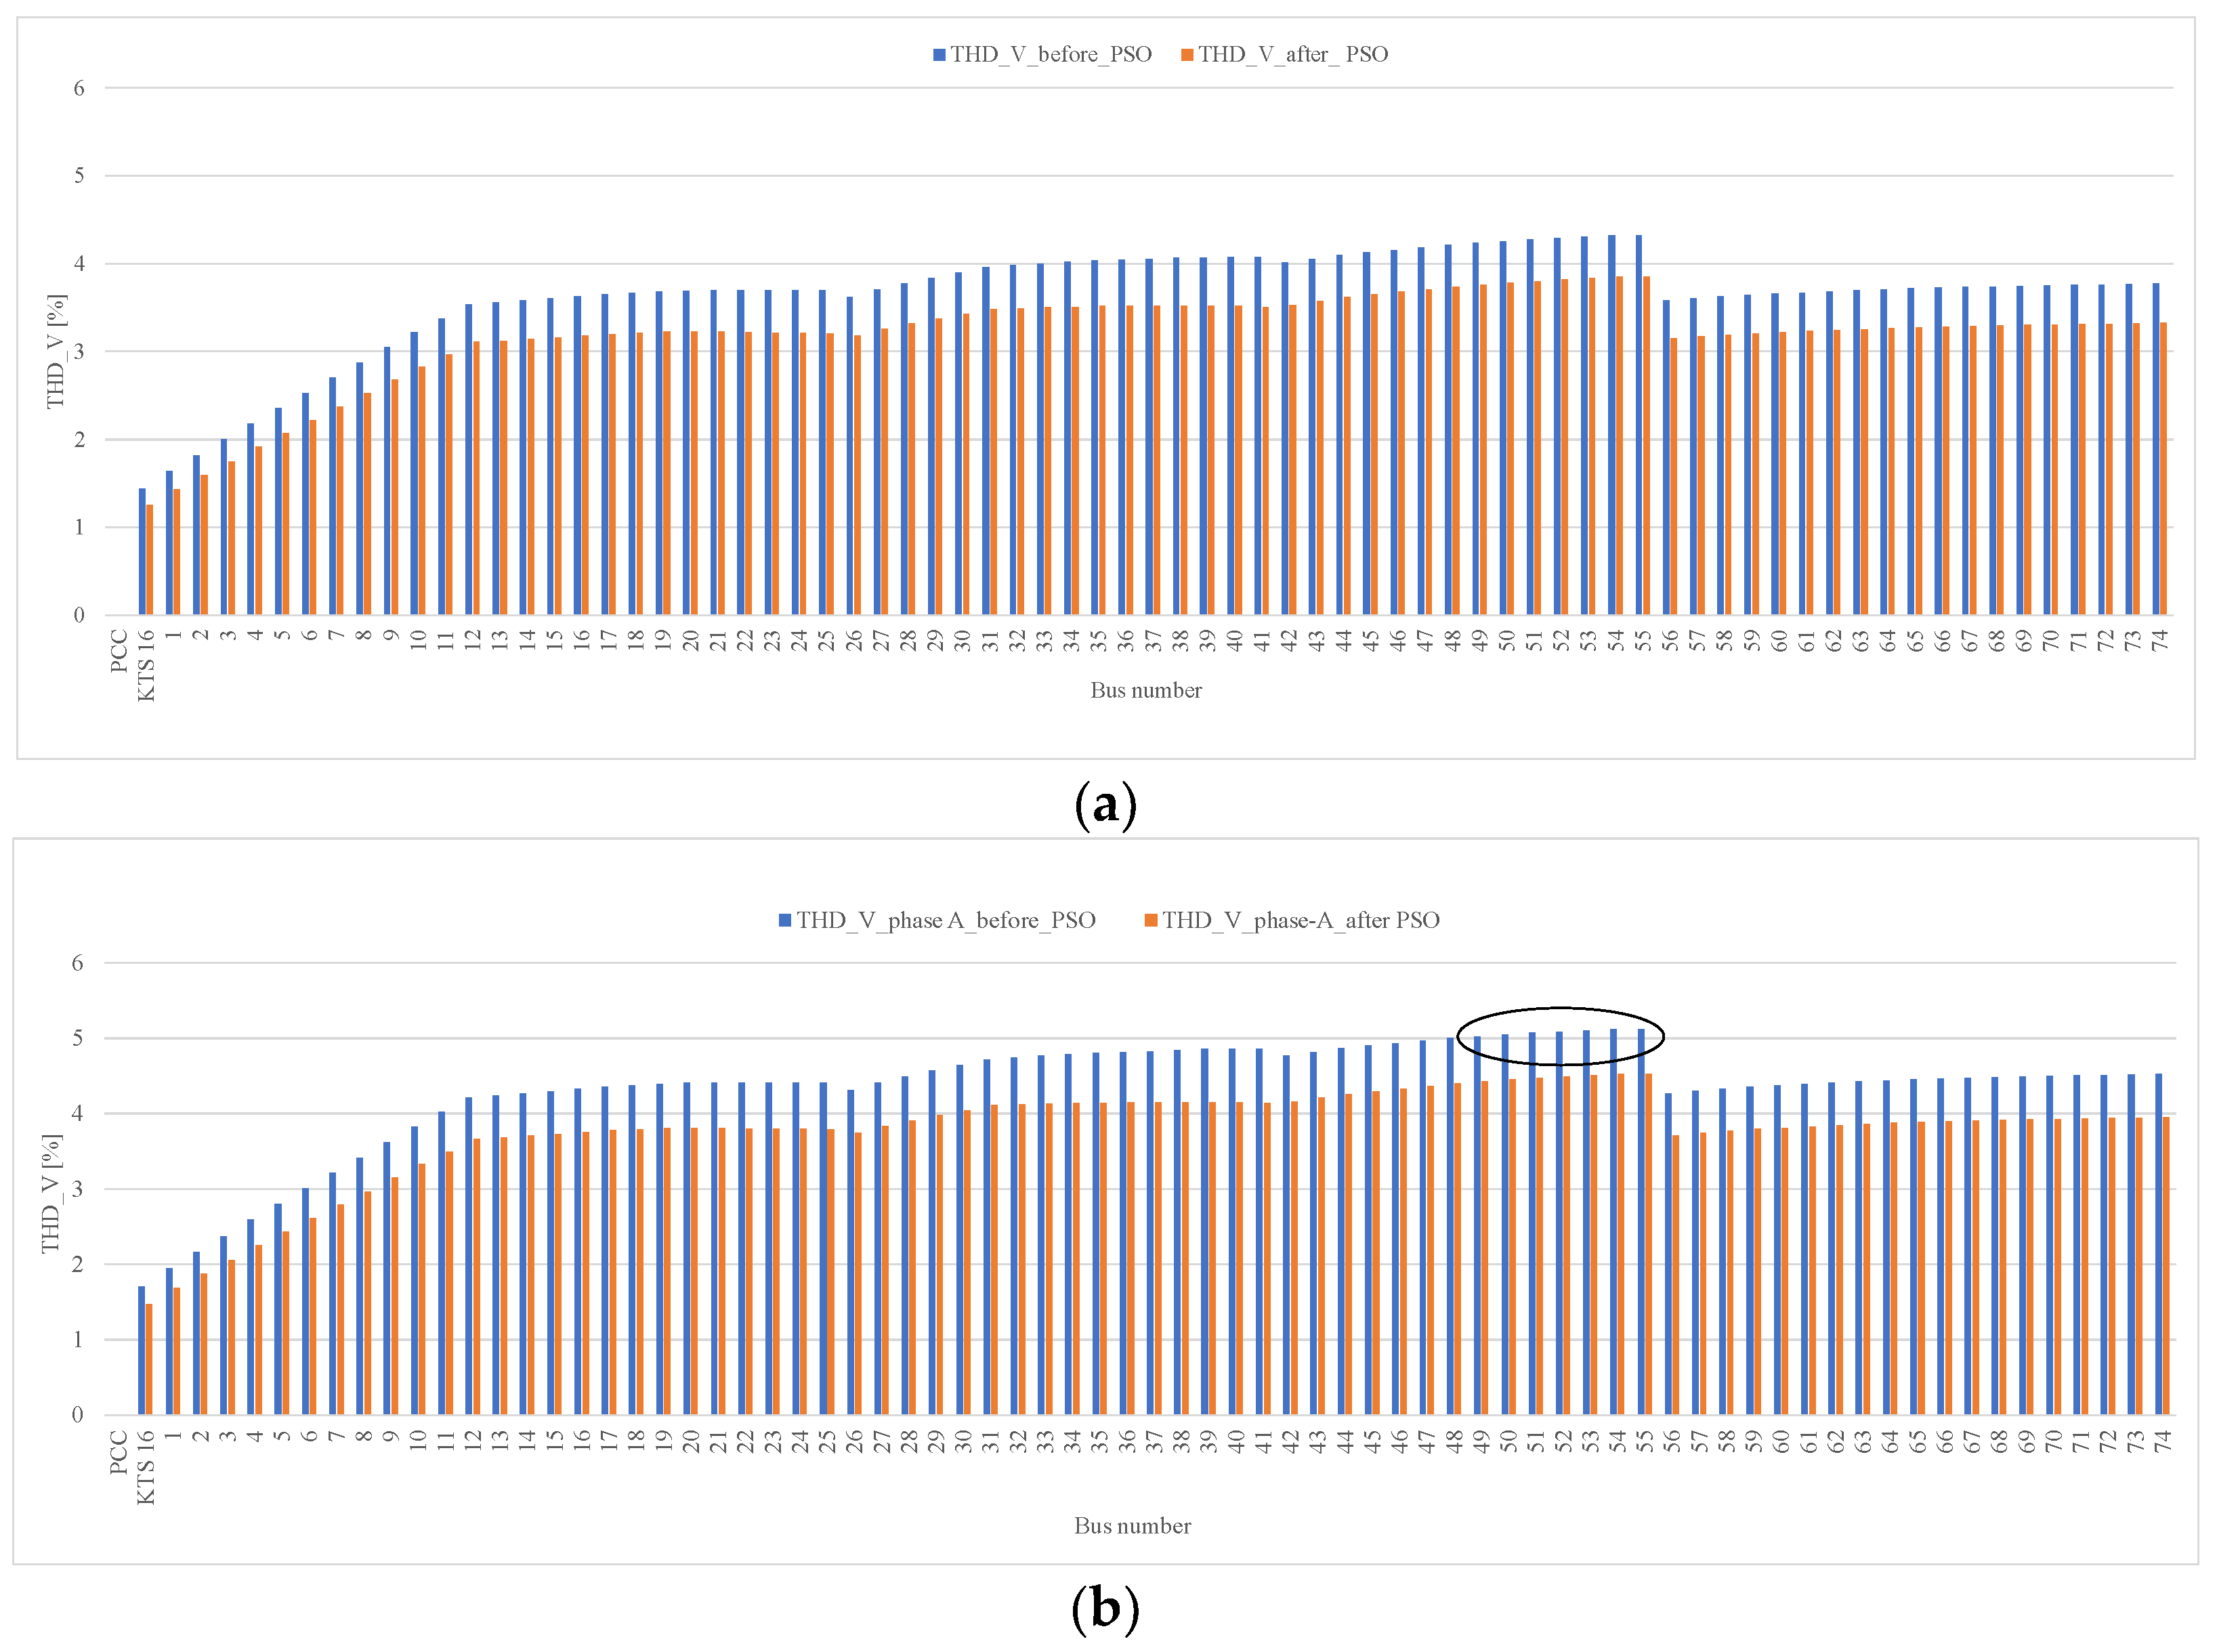
The results of the optimization process, which lasts an average of 3:30 h, and after connecting two APFs on buses 41 (rated current 70 A) and 25 (rated current 30 A), confirm that the optimization method successfully determined the parameters and optimal settings for the APF. The result of the corresponding objective function is the minimization of THDV across all buses, which the optimization method successfully achieved. In Figure 7a, results are presented, and it can be concluded that THDV values across all network buses decreased. The reduction in THDV across all buses in relative terms is from 10.82% to 13.95%. After the optimization process, the total relative reduction in harmonic losses for the observed time interval is 14.29%, while in other time intervals, the total reduction in harmonic losses ranged between 17.64% and 25.00%. It is important to note that the total values of THDV in all three phases before the optimization process, only in some nodes, are greater than 4%. This condition suggests that the optimization process is unnecessary, as THDV values below 5% are within the limits of the test network requirement and imply that any resulting issues are minor and rare [50]. However, monitoring the network status throughout every phase of the test network is vital for ensuring optimal performance and identifying potential problems early on. Figure 7b shows the THDV levels in phase A, where single-phase controllable and uncontrollable load models are connected, and specific buses (from 49 to 55) exceed the recommended 5% threshold. Since the optimization process uses the three-phase APFs, affecting all three phases, THDV is also successfully reduced in phase A.
  • Second state of test network (4:00 a.m.–7:00 a.m.)
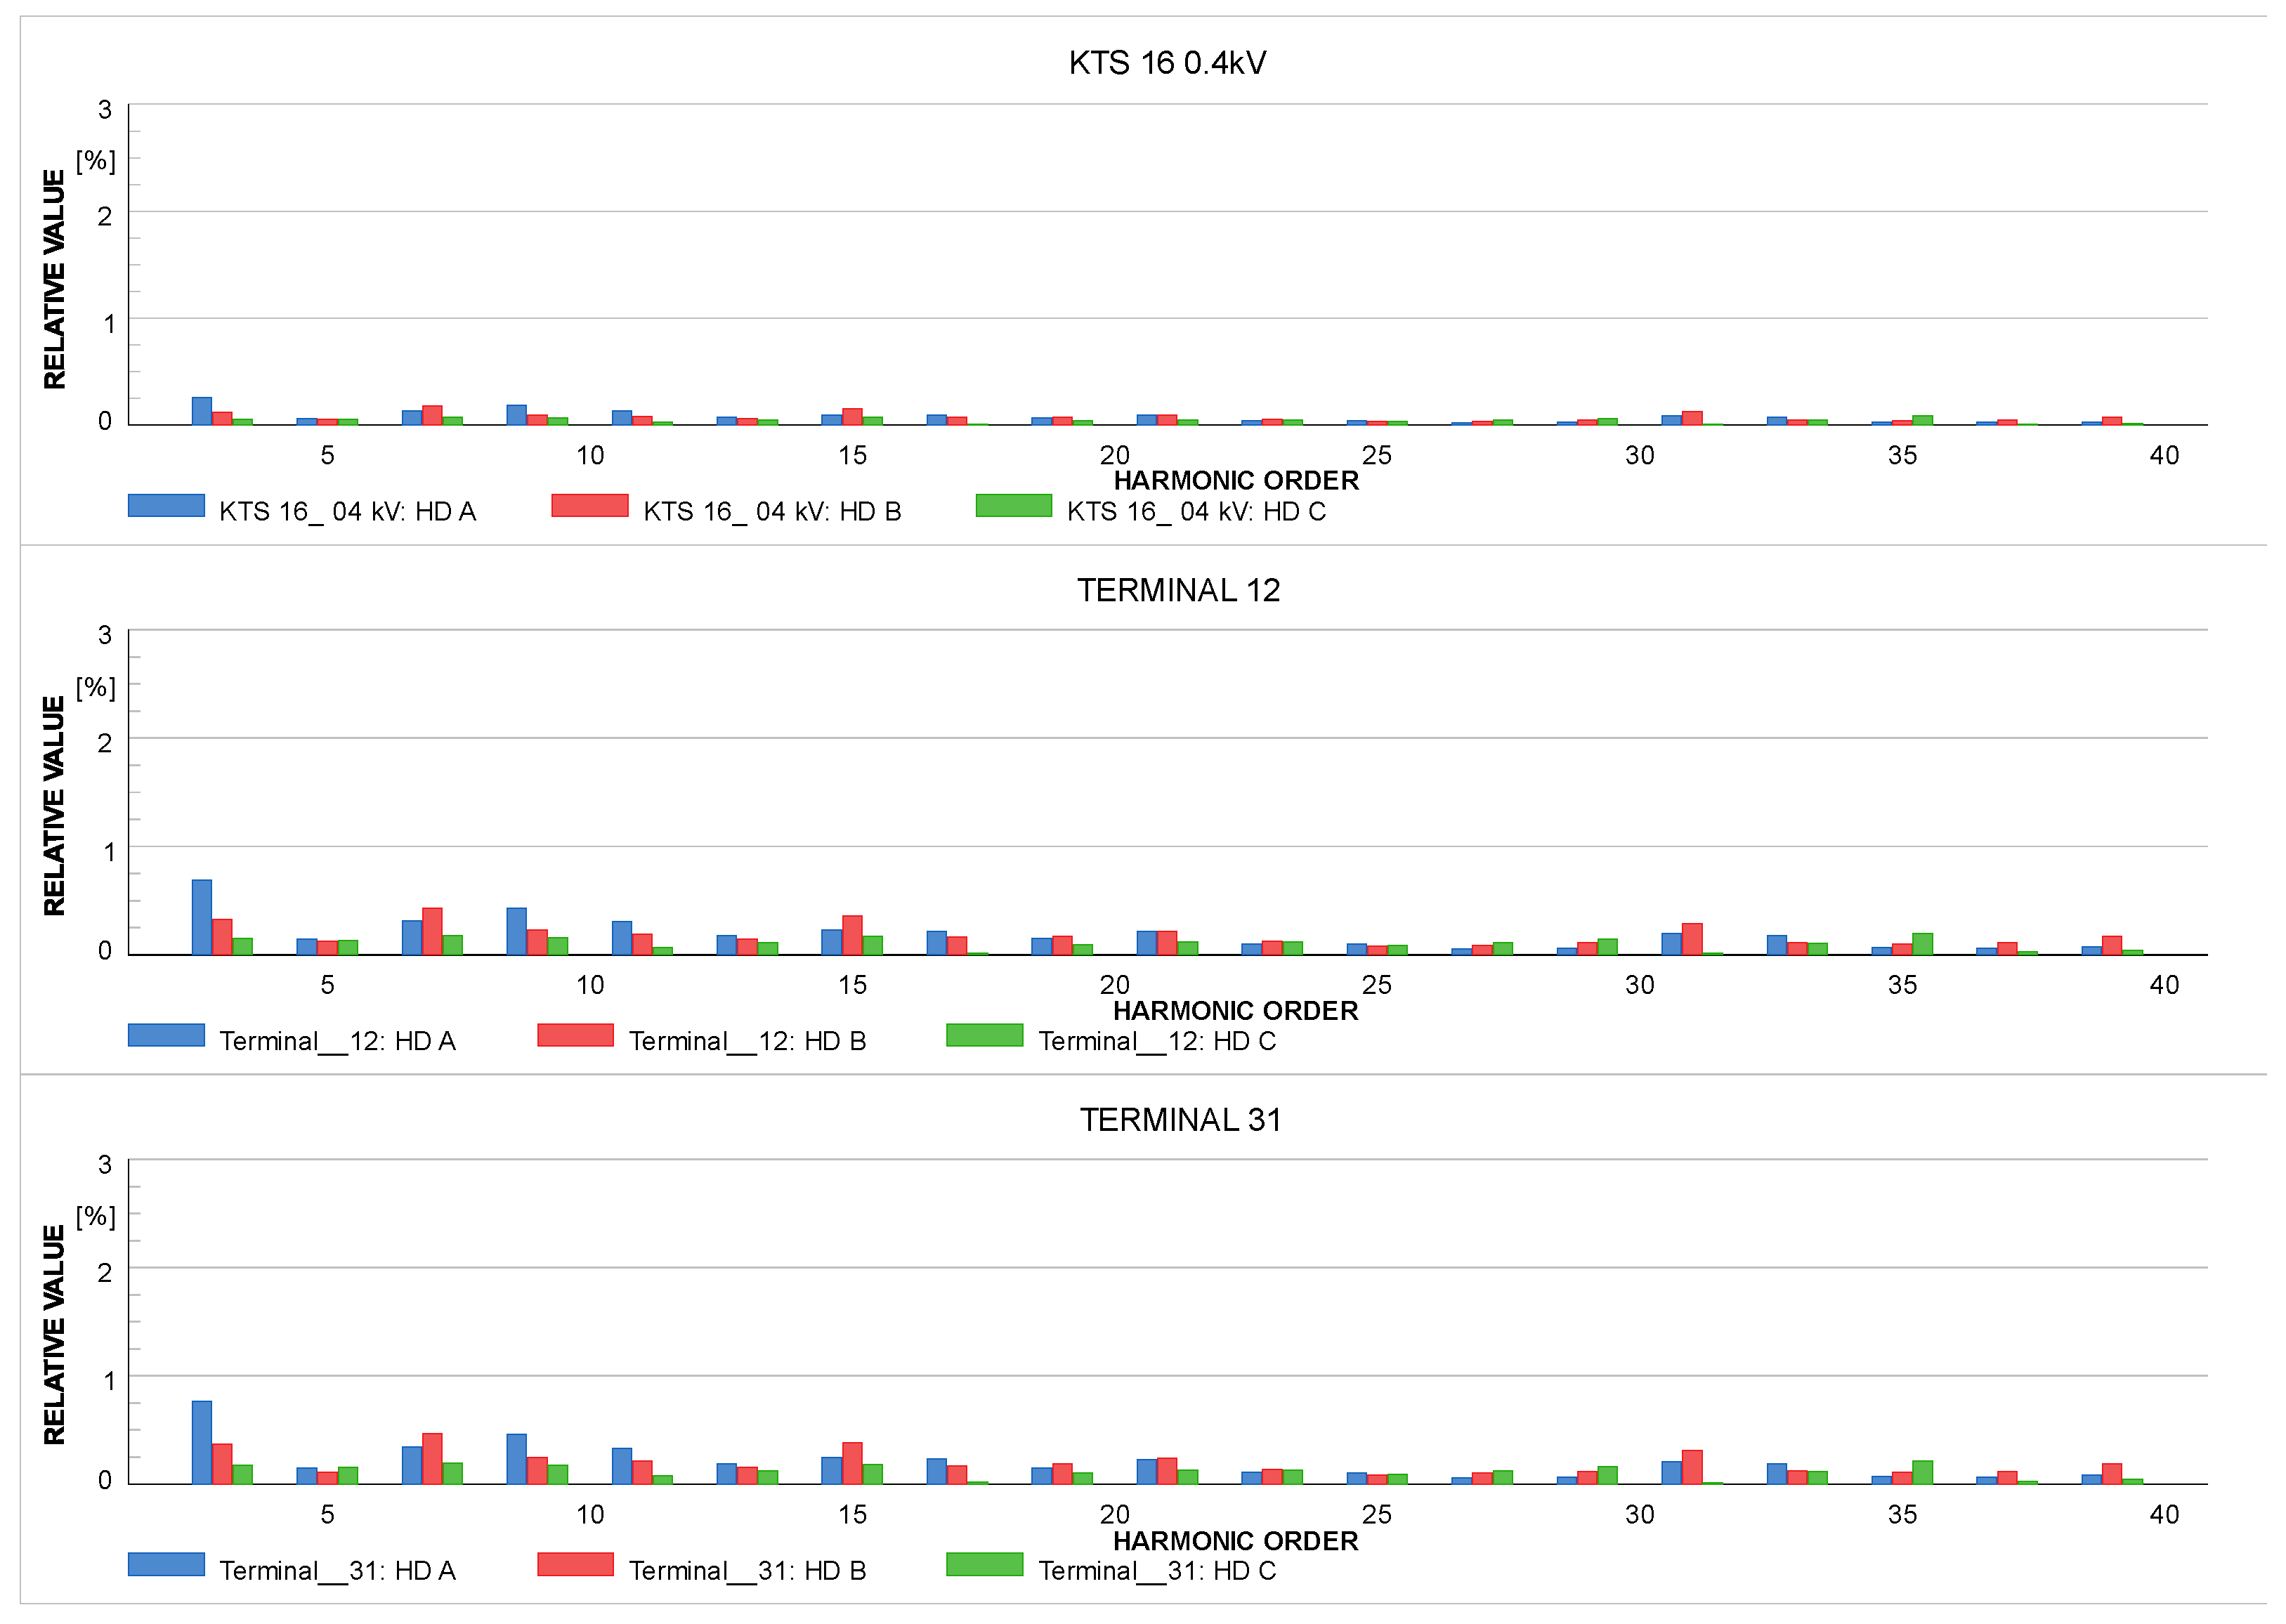
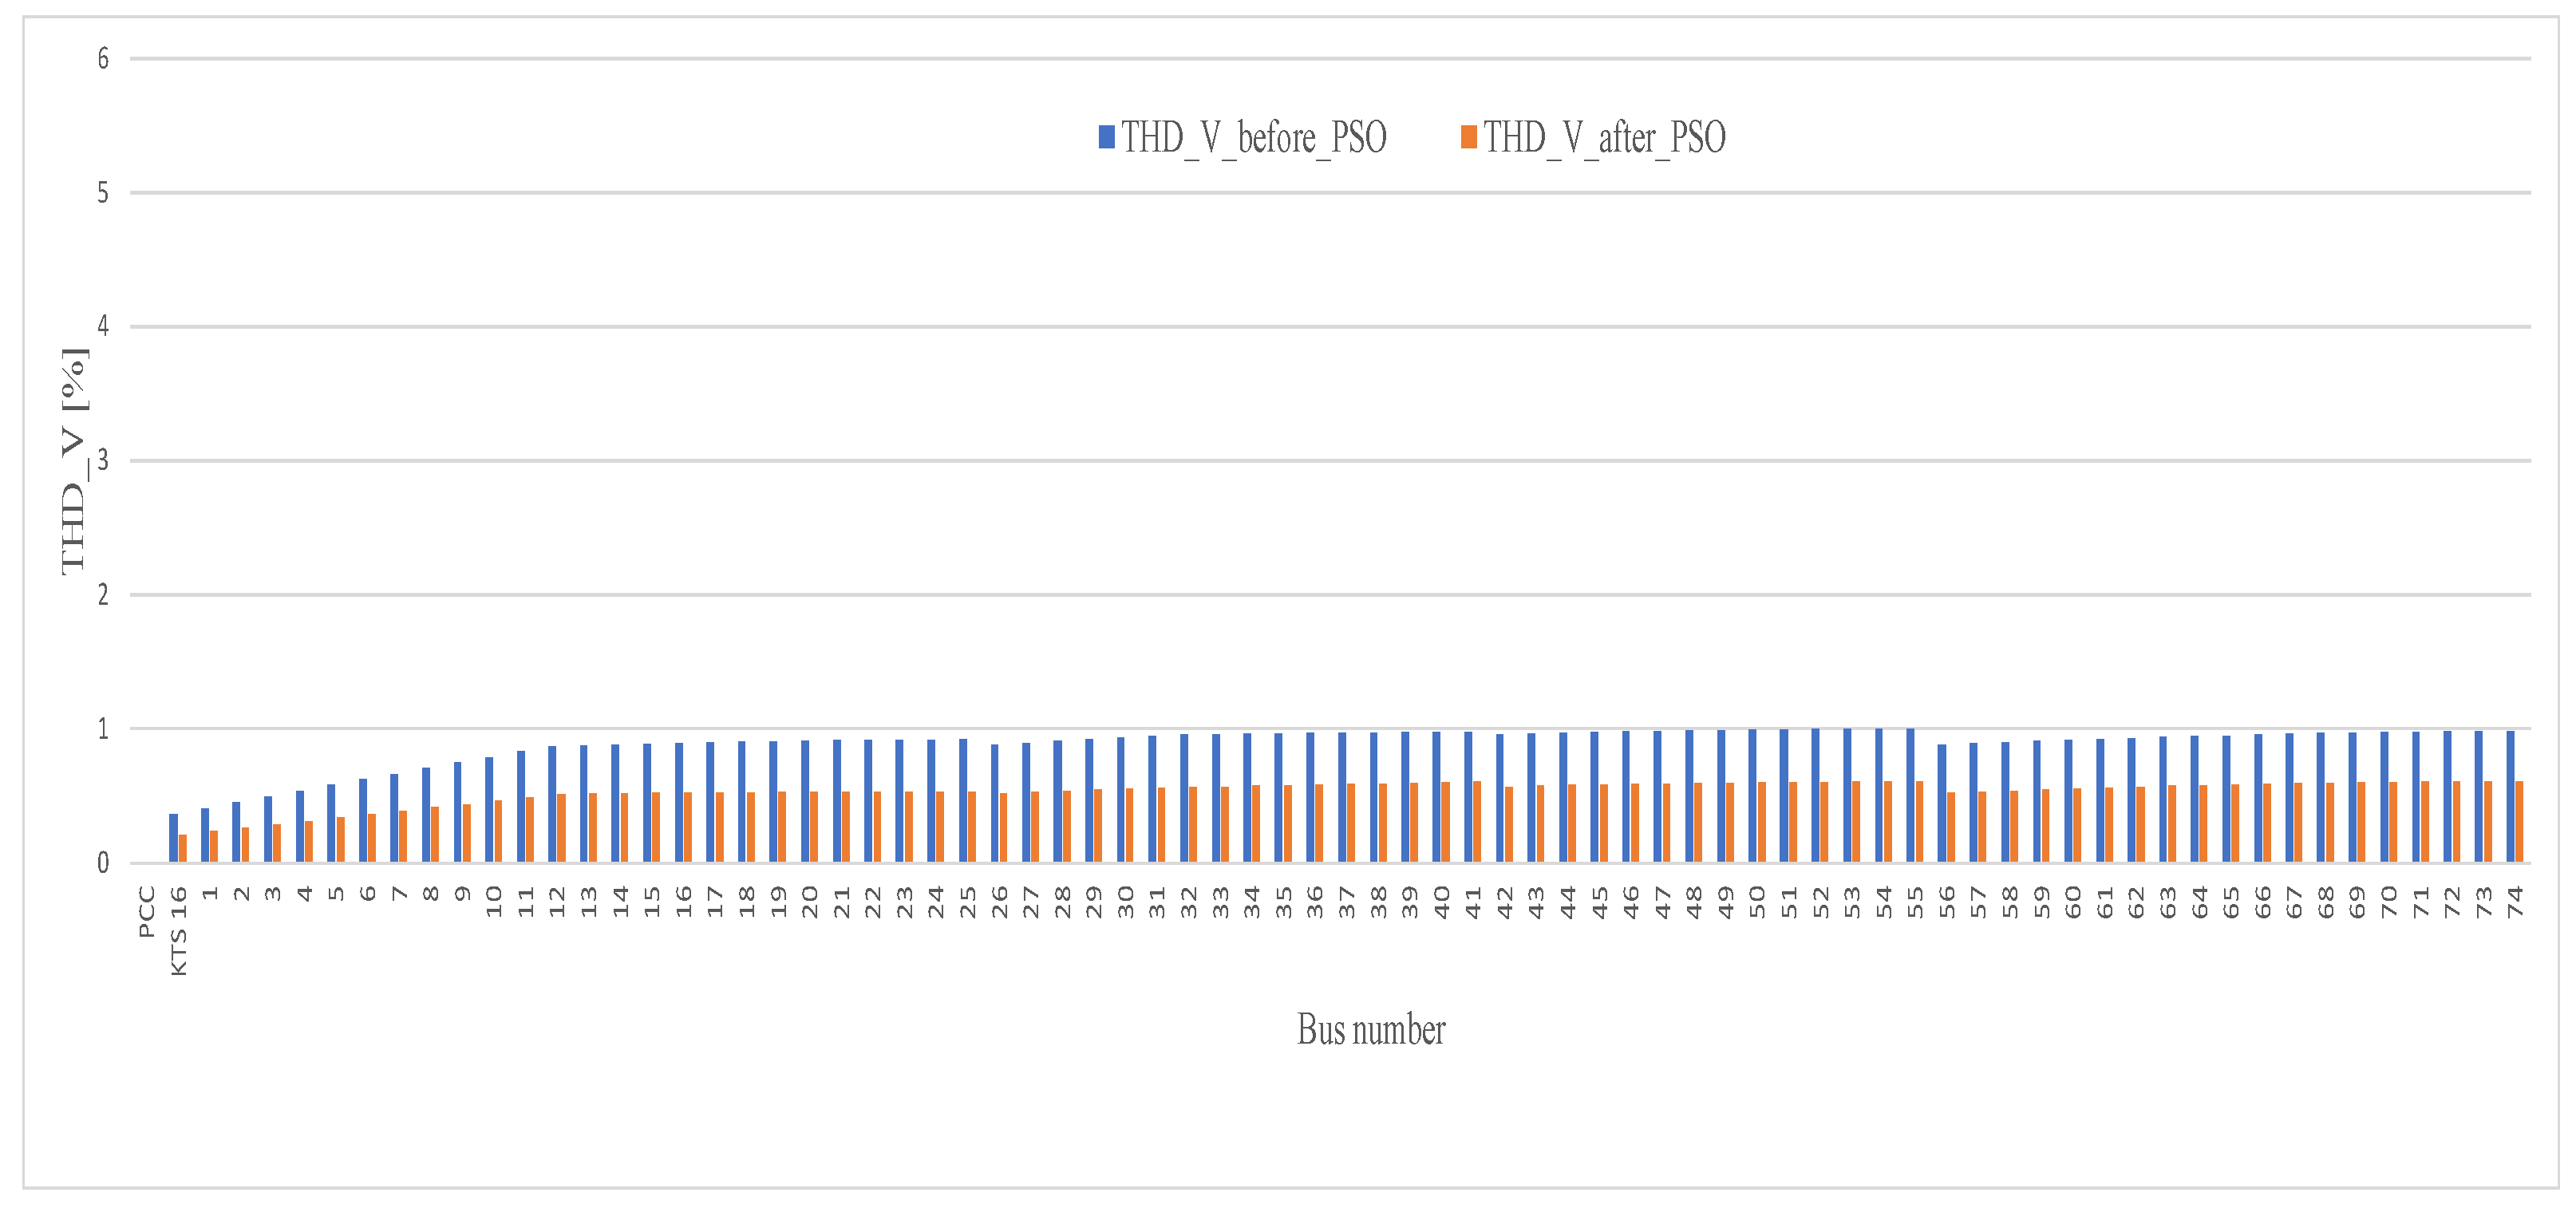
The second state describes the state of the test network during the low-tariff period, specifically in the time intervals from 4:00 a.m. to 7:00 a.m. In these time intervals, the test network considers uncontrollable and controllable loads in single-phase models, while three-phase controllable loads remain inactive. The load on the test network during this time is minimal, ranging from 22.2% to 35.9%. For this second state, the analysis is focused on the characteristic buses for the 4:00 a.m. interval, as shown in Figure 8. Other time intervals for this state are not presented, since the results are very similar. For this state of the test network, IHDV values at all characteristic terminals and buses are within the prescribed limits, meeting the requirements of the EN 50160 Standard. The THDV levels in all test network buses and phase A buses (illustrated in Figure 9) remain below the values mandated by the EN 5160 standard [2]. The maximum THDV value occurred at bus 74 in phase A, with a value of 1.23%, while a relative line load was 36.8%. This observed state of the test network, along with the corresponding voltage harmonic spectra, aligns with network loading that, in this paper, is defined as the underloaded state of the network. The algorithm for determining the optimal settings of APF and the associated optimization process was not necessary for this state of the test network. All indicators of harmonic distortion were satisfactory, meaning their values in all buses of the test network were below the maximum values prescribed by the EN 50160 standard.
  • Third state of test network (at 7:00 a.m., 8:00 a.m., 10:00 a.m., 11:00 a.m., 5:00 p.m., 6:00 p.m., 9:00 p.m., and 10:00 p.m.)
The most frequent network state during the 24 time intervals is defined as the third state of the test network. Although this state appears during high and low tariff periods, it is detected more often during the high tariff period. The observed time intervals correspond to the test network load at 7:00 a.m., 8:00 a.m., 10:00 a.m., 11:00 a.m., 5:00 p.m., 6:00 p.m., 9:00 p.m., and 10:00 p.m., during which the optimization process assigned two APFs to the test network. Loads from uncontrollable loads models and PV system models primarily form the network loads during the peak tariff period. During the low tariff period, the third network state occurs when the loads from uncontrollable load models are very high and single-phase controllable load models start operating.
The load on the test network during this period ranges from 60.3% to a maximum of 74.3%. The analysis is conducted for the time interval during the high tariff period, which is characterized by significant stochastic variations in load and low production from the DGs (PV systems). As in the previous cases, this observed time interval is very similar to all the other intervals mentioned above, so only the interval occurring at 5:00 p.m. is presented. Figure 10a shows the state of the test network (voltage harmonic spectrum) before the algorithm for determining the optimal settings of APF are executed on the characteristic terminal at 5:00 p.m. The state of the test network at 5:00 p.m. on the characteristic terminal after the optimization process is given in Figure 10b.
The results obtained after the optimization process for the third state of the test network confirm that the optimization method successfully determined the parameters and optimal settings of the APFs. The optimization process took an average of 4:35 h and assigned two APFs to the test network at buses 41 (rated current 70 A) and 25 (rated current 30 A), successfully minimizing the THDV on all buses. The results can be noticed comparing Figure 10a,b, where in Figure 10b, the values of IHDV have significantly decreased. At the characteristic terminal KTS 16 0.4 kV, the standard’s requirements are fully complied with, while at the characteristic terminals Terminal 12 and Terminal 31, the APFs could not reduce the values of all harmonics above the prescribed limits. Although the harmonic values were reduced, it is noticeable that the values of the 9th, 15th, 19th, and 21st harmonics are still above the values prescribed by the standard.
Due to the test network’s physical limitations and load, the optimization method could not implement sufficiently powerful filters. Although the prescribed values are low—for the 15th and 21st, Uh ≤ 0.5% Un, and for the 19th harmonic, Uh ≤ 1.5% Un—the optimization method failed to eliminate the harmonics that exceeded the standard prescribed limits completely. Achieving these voltage harmonic values requires a lot of energy, which the APFs would need to supply to bring these harmonics to the desired standard prescribed values. To verify the performance of the optimization process aimed at minimizing THDV across all buses in the test network, it is necessary to observe the THDV state at all buses, as illustrated in Figure 11a. Figure 11b presents the THDV values at all buses for the phase with the worst state, which is in this state phase B. The obtained optimization process results confirmed that the THDV value in all buses of the test network has decreased. The reduction in THDV across all buses varies from 13.75% (bus 74) to 17.92% (bus 41). The highest relative reduction, as expected, is in bus 41, as an APF was connected to that bus. Observing the THDV value and examining the load per phase is also important. It is noted that phase B, in this state of the test network, exhibits the highest relative values of harmonic distortion close to the value of 8% Un, which is the upper limit value defined by the EN 50160 standard. For the network state with THDV values between 5% Un and 7% Un, problems in the network appear more frequently. The reduction in THDV in phase B through optimization processes was also successfully performed in all buses of phase B with the relative decrease in this phase ranging from 10.93% to 14.29%. The maximum THDV value before the optimization in phase B was 7.89% Un at bus 55. Following the optimization process, the THDV value at this bus decreased to 6.80%, resulting in a relative reduction of 11.56%. The THDV reduction somewhat satisfies the condition of the test network. Still, due to the aforementioned physical limitations related to the load, the target desired value of THDV < 5% Un could not be achieved.
After optimization, the total relative reduction in harmonic losses in the observed time interval is 9.78%. In the other time intervals for this test network’s state, harmonic losses decreased from 1.75% (achieved at 9 p.m.) to 15.38% (achieved at 7:00 a.m.).
  • Fourth state of test network (9:00 a.m., 12:00 a.m., 2:00 p.m., and 8:00 p.m.)
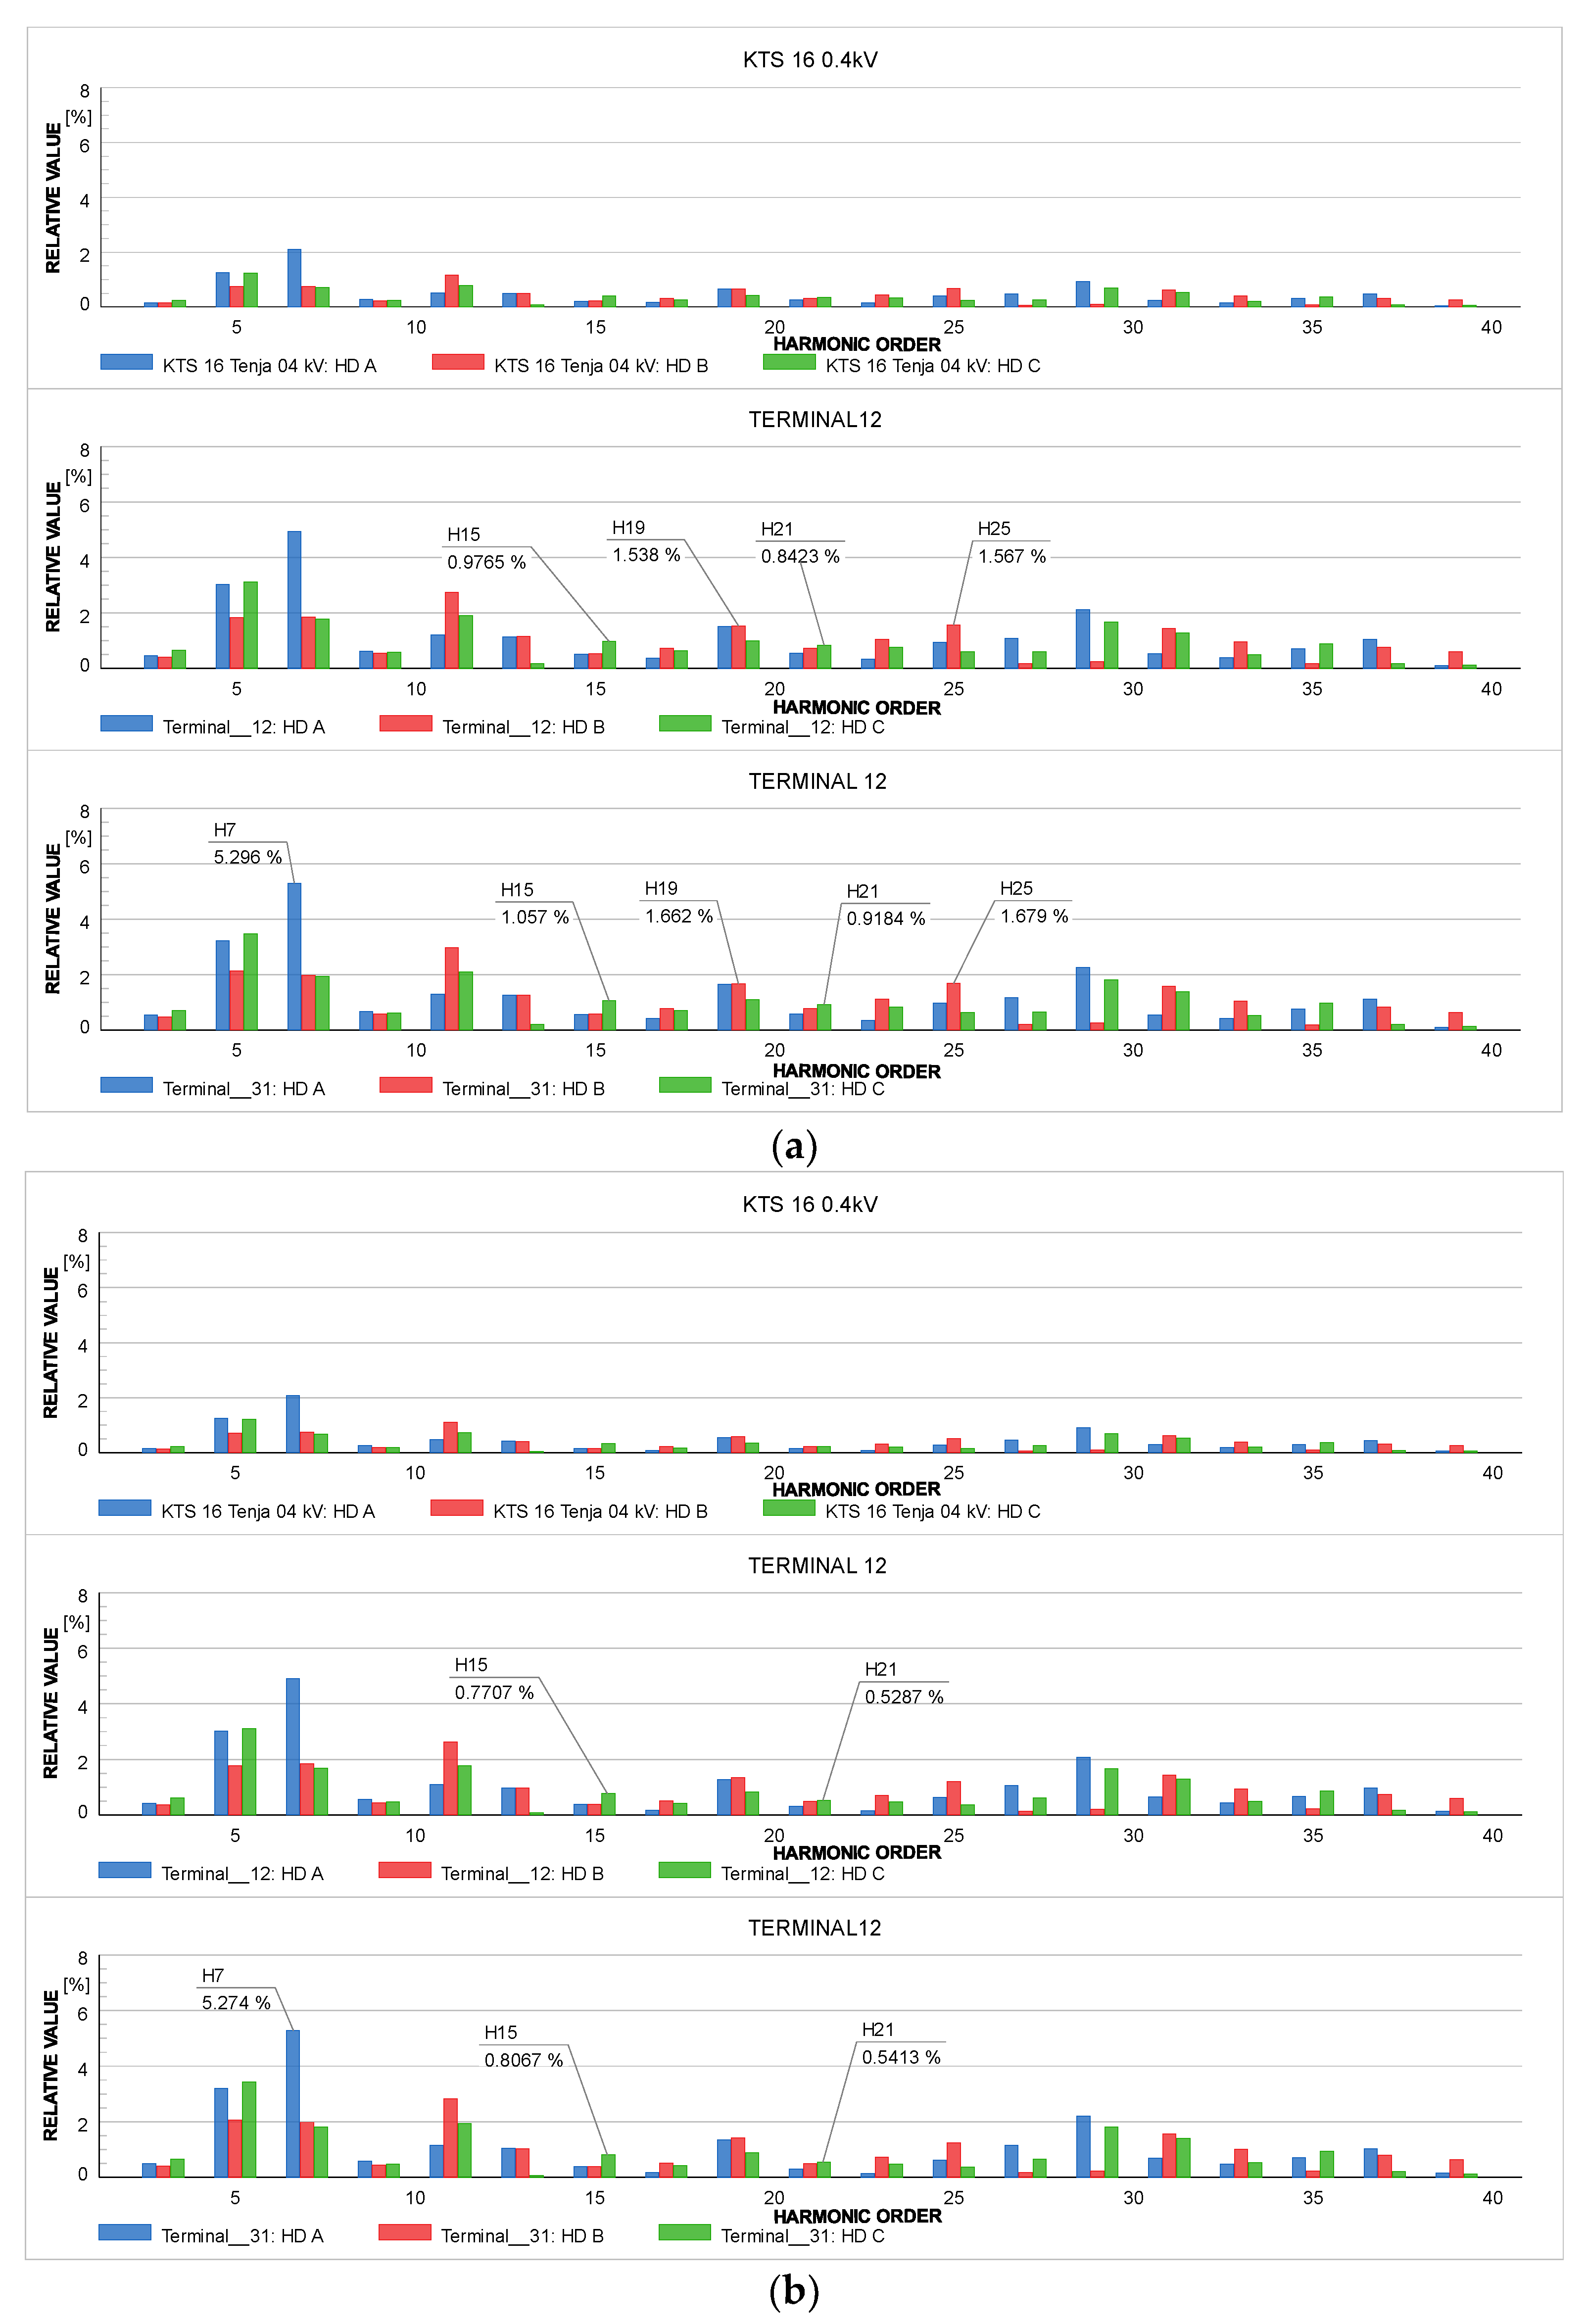
The fourth state of the test network is also considered a normal network state, and it appears during the four time intervals. The time intervals of the fourth state refer to the test network load that occurred during the high tariff period, specifically at 9:00 a.m., 12:00 a.m., 2:00 p.m., and 8:00 p.m. For this state, loads from the uncontrollable load models were connected, and PV systems were also present for a large part of the day. The load during this period ranges from 70.4% to a maximum of 74.2%. The observed time interval exhibits significant stochastic load variations and substantial production from the PV systems, which are characteristic of the high tariff period. The presented time interval occurred at 2:00 p.m., and the test network state before and after the optimization process is shown in Figure 12a,b, which are very similar to the other time intervals within this network state.
The harmonic flow calculation results for the characteristic terminals of the test network before the optimization process show that the first characteristic terminal, KTS 16 0.4 kV, does not have elevated harmonic values. In contrast, the individual harmonic distortions of the odd harmonics at the characteristic terminals 12 and 31 are exceeded. Also, it is noted that while examining harmonics above the 25th order, an increase in the values of the 29th harmonic is significant. However, the EN 50160 standard does not define values for harmonics above the 25th order.
The optimization in this state of the test network takes an average of 4:00 h, during which results are obtained that confirm that the method successfully identified the APF’s parameters and optimal settings. In this test network state, the optimization process assigns only one APF with a rated current of 45 A to bus 55. The optimization process with a single APF has reduced the IHDV in all characteristic buses. The results obtained from the characteristic terminals are shown in Figure 12b. The IHDV levels at the KTS 16 0.4 kV terminal fully complied with the standard requirements. The IHDV values at the other characteristic terminals, terminal 12 and terminal 31, also decreased. The value of the 25th harmonic has decreased below the value prescribed by the standard, while the other harmonic orders have also been reduced but not entirely. The lack of complete reduction in the 7th harmonic arises from the optimization method, which primarily targets harmonics that are multiples of number 3 and then addresses other odd harmonics. Additionally, the physical distance between the bus and the location of the APF contributes to this incomplete reduction. Due to physical constraints and network load, the optimization method could not add a second APF that could cancel the harmonics’ effects. The fourth test network state requires considerable energy for the APFs to achieve the desired network condition. Given the constraints of the optimization process and the physical and load network limitations in this state, the performance of the APFs is understandably reduced.
As with previous test network states, the results confirmed that the THDV values in all network buses have been reduced. The reduction in THDV, in relative terms, ranges from 4.38% (bus 74) to 6.89% (bus 53). As anticipated, the most significant relative reduction occurred at bus 53, which is understandable due to the presence of an APF at that bus location. Similarly, to the third network state, it is essential to observe the THDV values by phase, where it can be noticed that phase A has the highest relative harmonic distortion values, which are very close to 8% Un. The representation of the obtained THDV values across all buses in the test network is shown in Figure 13a, while Figure 13b shows the THDV values in phase A. The reduction in THDV in phase A through the optimization process has been successfully achieved for all buses in phase A with the results ranging from 2.49% to 5.33%. Overall, the reduction in THDV across all buses of the test network largely satisfies the requirements. However, due to the aforementioned physical constraints related to the load of the test network, achieving the targeted THDV value below 5% Un is impossible.
  • Fifth state of test network (1:00 p.m., 3:00 p.m., 4:00 p.m., 7:00 p.m. and 11:00 p.m.)
The last state of the test network is classified as an overloaded network state, which occurs during several time intervals in both the high and low tariff periods. This state arises when the load on the test network exceeds 92.5%, and there are no conditions in the test network to add additional APFs. This test network state is tied to the following time intervals: 1:00 p.m., 3:00 p.m., 4:00 p.m., 7:00 p.m. and 11:00 p.m. The network load is primarily attributed to the loads from the uncontrolled load model and, most of the day, to the harmonic generated by the PV systems model. During the low tariff periods, all controllable load models were included. The observed time intervals during the high tariff period are characterized by notable stochastic variations in load, which are accompanied by significant power generation from PV systems. In contrast, during the low tariff period, this test network condition is marked by considerable stochastic fluctuations in load as well as peak consumption from controllable loads (EV home chargers). In this overloaded test network state, the optimization process can identify the initial location in the network for adding an APF. However, the process becomes interrupted when including a second APF risks further network overload.

6. Discussion

The LV radial network represents a real radial feeder with associated consumers and sources created as current sources that generate harmonics. The metaheuristic optimization method PSO was executed using an algorithm to determine the optimal settings of active filters in the LV network. The algorithm mentioned above in the optimization process was performed 24 times for 24 time intervals; that is, it monitored hourly load changes over one day in each test network node. The load changes were related to all consumer and source models with the corresponding harmonic spectra. The created variability during the day represented different states of the created LV network, which considers the possible future transformation of electrical networks, the inevitable increase in the integration of consumers with more pronounced nonlinearity, and the variability of the production of DGs. The observed cases are defined based on the results obtained during the evaluation of the optimization method. More precisely, the observed cases occurred when the test network was in an underloaded state, a normal state, an overload state, and a state of the test network when the values of IHD and THDV were within limits prescribed by the standard, i.e., when no optimization process is required.
The obtained results of APF layouts in the test network using the algorithms were performed in a 24 h interval and are shown in Table 3. The defined algorithm for the optimal location of the active filter used a maximum of two active filters. However, the algorithm could not be performed in certain parts of the day; i.e., at those times, it was not possible to add an active filter to the test network due to overload (labeled OL in the table).
When an overloaded state occurs, and it is impossible to integrate APFs, there are some other potential solutions. One possible solution is replacing existing PV systems with multifunctional devices (MFRES) that generate harmonic currents. Such systems should also include battery energy system storage (BESS) to reduce harmonics throughout the day. In addition to the above, it is possible to integrate only BESS with MFREs, which would replace existing PV sources and reduce the harmonic load of the observed network. Apart from replacing existing systems, possible solutions are load shifting, peak shaving, etc.
Results obtained by the algorithm for determining the optimal location of the APF, which was achieved by defining the line with the highest third harmonic content after performing a harmonic calculation of power flows and, consequently, the corresponding node, do not have a unique solution. The obtained solutions define the crucial fact that the influence of the harmonic spectrum depends on the change in load and that the optimal location of the APF is a function of the load, which is of a variable nature.
Suppose the branches in the test network are observed in both tariff periods and satisfy all the states in the network that occur in 24 h and the values defined by the norm. In that case, it is necessary to integrate APFs in each network branch. The above conclusion comes from the fact that in 21% of cases, the algorithm could not integrate APFs due to the state of the network, or in 16.67% of cases, the algorithm, due to the load level, could integrate only one APF. Before reaching a final conclusion, the financial implications of installing such devices in the LV network should be considered. As part of the Croatian Science Foundation project “Prosumer-rich distribution power network” (project number: UIP-2020-02-5796), which supports this paper, one APF rated at 60 A was purchased to determine the capabilities of such a filter. The cost of delivery, installation, and adjustment was about €19,500. Since the paper evaluates only commercially available filters with rated current sizes of 30 A, 45 A, 60 A, and 70 A, the estimated installation cost of such a device would range from €15,000 to €20,000. The condition of the network plays a crucial role in determining both the quantity of APFs that will be installed and the overall costs involved.

7. Conclusions

In distribution networks in the last decade, in order to reduce the increasing amounts of harmonics, the possibilities of APFs were most often investigated. Their advantage is manifested in the continuous monitoring of harmonic currents and the generation of currents that successfully reduce unwanted harmonic currents and meet all the requirements prescribed by reference norms and standards. In an LV network with a significant number of nonlinear devices, integrating APFs requires the development of a method that would solve the problem of determining the position and optimal settings of the filter. An optimization approach is needed to encompass the entire LV network with its technical capabilities and the physical properties of the connected loads and sources. By determining the position and optimal settings of APFs through an optimization approach, this research aims to create an optimization framework that enables monitoring different network states through changes in power and associated harmonic spectra during the optimization problem for different load and source models.
A comprehensive analysis of the research conducted using a co-simulation model for determining the optimal settings of active filters in a low-voltage network and the application of the created algorithm for determining the optimal settings of active filters in an LV network brought certain conclusions: The created model shows a larger number of harmonics on the buses (and nodes) in the depth of the network, which is proof of the justification of this method. The model shows an increased occurrence of 3rd-order harmonics, which justifies the defined order of harmonic suppression: first triplen harmonics and then the remaining odd harmonics. The most common solution of the optimization procedure in the 24 observed time intervals was in nodes under ordinal numbers 41 and 25. The nodes are locations where the installation of APFs would ensure a satisfactory level of THDV in all nodes of the test network during the vast majority of days. However, the authors see the solution in the multifunctional renewable energy source (MFRES) is one of the possible solutions. MFRES, as the latest generation devices, are renewable energy sources (RESs) with a multipurpose role that will play a significant role in future networks. Such RESs are continuously being developed for more efficient use. Adding auxiliary services for converters in power systems, such as an active filter or BEES, is possible. Further research will undoubtedly be related to the possibilities of using MFRES, and further expansion of individual models of system elements and the addition of new ones is also planned. In addition to the above, the authors will focus their future research on the application of other metaheuristic methods and adding a financial aspect to the objective function.

Author Contributions

Conceptualization, M.P. and H.A.; Methodology, M.P., Z.K. and H.A.; Formal analysis, M.P., H.A. and M.Ž.; Writing—original draft, M.P. and H.A.; Writing—review & editing, Z.K. and M.Ž.; Funding acquisition, Z.K. All authors have read and agreed to the published version of the manuscript.

Funding

The APC was funded by the Croatian Science Foundation under the project ”Prosumer-rich distribution power network” (project number: UIP-2020-02-5796) and the European Union’s Horizon Europe Framework Programme: HORIZONWIDERA-2023-ACCESS-04, Pathways to Synergies—Coordination and Support Actions—under the project name SynGRID—Creating synergies in Widening countries on the topic of low-voltage grid management (grant number 101160145).

Institutional Review Board Statement

Not applicable.

Informed Consent Statement

Not applicable.

Data Availability Statement

The original contributions presented in the study are included in the article, further inquiries can be directed to the corresponding author.

Acknowledgments

This work was supported by the Croatian Science Foundation under the project ”Prosumer-rich distribution power network” (project number: UIP-2020-02-5796) and the European Union’s Horizon Europe Framework Programme: HORIZONWIDERA-2023-ACCESS-04, Pathways to Synergies—Coordination and Support Actions—under the project name SynGRID—Creating synergies in Widening countries on the topic of low-voltage grid management (grant number 101160145).

Conflicts of Interest

The authors declare no conflict of interest.

References

  1. Antić, T.; Thurner, L.; Capuder, T.; Pavić, I. Modeling and open source implementation of balanced and unbalanced harmonic analysis in radial distribution networks. Electr. Power Syst. Res. 2022, 209, 107935. [Google Scholar] [CrossRef]
  2. EN 50160:2010; Voltage Characteristics of Electricity Supplied by Public Electricity Networks. European Standard: Brussels, Belgium, 2010.
  3. 519-2022; IEEE Standard for Harmonic Control in Electric Power Systems. IEEE: Piscataway, NJ, USA, 2022. Available online: https://ieeexplore.ieee.org/servlet/opac?punumber=9848438 (accessed on 20 April 2024). [CrossRef]
  4. Klimas, M.; Grabowski, D.; Buła, D. Application of decision trees for optimal allocation of harmonic filters in medium-voltage networks. Energies 2021, 14, 1173. [Google Scholar] [CrossRef]
  5. Jain, S. Control strategies of shunt active power filter. In Modeling and Control of Power Electronics Converter System for Power Quality Improvements; Elsevier: Amsterdam, The Netherlands, 2018; pp. 31–84. [Google Scholar] [CrossRef]
  6. Maciążek, M. Active Power Filters and Power Quality. Energies 2022, 15, 8483. [Google Scholar] [CrossRef]
  7. Fuchs Ewald, F.; Masoum Mohammad, A.S. Power Quality in Power Systems, Electrical Machines, and Power-Electronic Drives, 3rd ed.; Third. Elsevier Inc.: Amsterdam, The Netherlands, 2023. [Google Scholar] [CrossRef]
  8. Mrežna Pravila Distribucijskog Sustava. [Online]. Available online: https://narodne-novine.nn.hr/clanci/sluzbeni/2018_08_74_1539.html (accessed on 20 April 2024).
  9. Buła, D.; Grabowski, D.; Maciążek, M. A Review on Optimization of Active Power Filter Placement and Sizing Methods. Energies 2022, 15, 1175. [Google Scholar] [CrossRef]
  10. Hermina, A.; Alan, A.; Angelo, B. Handbook of Power Quality, 1st ed.; John Wiley & Sons Ltd.: Chichester, UK, 2008; Volume 1. [Google Scholar]
  11. Brahmachary, R.; Bhattacharya, A.; Ahmed, I. Allocation of Active Power Filter in Distribution Network Considering Nonlinear Loads. In Proceedings of the 2021 IEEE 2nd International Conference on Smart Technologies for Power, Energy and Control, STPEC 2021, Bilaspur, India, 19–22 December 2021; Institute of Electrical and Electronics Engineers Inc.: New York, NY, USA, 2021. [Google Scholar] [CrossRef]
  12. Carpinelli, G.; Proto, D.; Russo, A. Optimal Planning of Active Power Filters in a Distribution System Using Trade-off/Risk Method. IEEE Trans. Power Deliv. 2017, 32, 841–851. [Google Scholar] [CrossRef]
  13. Guo, M.; Jin, Q.; Yao, Z. Implementation of Adaptive Step-Size Algorithm in Distribution Network for Optimal Location and Sizing of SAPFs. In Proceedings of the 2020 IEEE/IAS Industrial and Commercial Power System Asia, I and CPS Asia 2020, Weihai, China, 13–16 July 2020; pp. 1562–1566. [Google Scholar] [CrossRef]
  14. Revuelta, P.S.; Litrán, S.P.; Thomas, J.P. Active Power Line Conditioners: Design, Simulation and Implementation for Improving Power Quality; Academic Press: Cambridge, MA, USA, 2015; pp. 1–421. [Google Scholar] [CrossRef]
  15. Wang, Y.S.; Hua, S.; Liu, X.M.; Jun, L.; Gou, S.B. Optimal allocation of the active filters based on the Tabu algorithm in distribution network. In Proceedings of the International Conference on Electrical and Control Engineering, ICECE 2010, Wuhan, China, 25–27 June 2010; pp. 1418–1421. [Google Scholar] [CrossRef]
  16. Moradifar, A.; Soleymanpour, H.R. A fuzzy based solution for allocation and sizing of multiple active power filters. J. Power Electron. 2012, 12, 830–841. [Google Scholar] [CrossRef]
  17. Shivaie, M.; Salemnia, A.; Ameli, M.T. A multi-objective approach to optimal placement and sizing of multiple active power filters using a music-inspired algorithm. Appl. Soft Comput. J. 2014, 22, 189–204. [Google Scholar] [CrossRef]
  18. Alhaddad, F.M.; El-Hawary, M. Optimal filter placement and sizing using ant colony optimization in electrical distribution system. In Proceedings of the 2014 Electrical Power and Energy Conference, EPEC 2014, Calgary, AB, Canada, 12–14 November 2014; Institute of Electrical and Electronics Engineers Inc.: New York, NY, USA, 2014; pp. 128–133. [Google Scholar] [CrossRef]
  19. Rosyadi, A.; Penangsang, O.; Soeprijanto, A. Optimal filter placement and sizing in Radial Distribution System using whale optimization algorithm. In Proceedings of the 2017 International Seminar on Intelligent Technology and Its Application: Strengthening the Link Between University Research and Industry to Support ASEAN Energy Sector, ISITIA 2017—Proceeding, Surabaya, Indonesia, 28–29 August 2017; pp. 87–92. [Google Scholar] [CrossRef]
  20. Lakum, A.; Mahajan, V. Optimal placement and sizing of multiple active power filters in radial distribution system using grey wolf optimizer in presence of nonlinear distributed generation. Electr. Power Syst. Res. 2019, 173, 281–290. [Google Scholar] [CrossRef]
  21. Sindhu, M.R.; Jisma, M.; Maya, P.; Krishnapriya, P.; Mohan, M.V. Optimal Placement and Sizing of Harmonic and Reactive Compensators in Interconnected Systems. In Proceedings of the 2018 15th IEEE India Council International Conference (INDICON), Coimbatore, India, 16–18 December 2018. [Google Scholar] [CrossRef]
  22. MacIazek, M.; Grabowski, D.; Pasko, M. Genetic and combinatorial algorithms for optimal sizing and placement of active power filters. Int. J. Appl. Math. Comput. Sci. 2015, 25, 269–279. [Google Scholar] [CrossRef]
  23. Ahmed, M.; Al Masood, N.; Aziz, T. An approach of incorporating harmonic mitigation units in an industrial distribution network with renewable penetration. Energy Rep. 2021, 7, 6273–6291. [Google Scholar] [CrossRef]
  24. Ziari, I.; Jalilian, A. Optimal placement and sizing of multiple APLCs using a modified discrete PSO. Int. J. Electr. Power Energy Syst. 2012, 43, 630–639. [Google Scholar] [CrossRef]
  25. Houran, M.A.; Sabzevari, K.; Hassan, A.; Oubelaid, A.; Tostado-Véliz, M.; Khosravi, N. Active power filter module function to improve power quality conditions using GWO and PSO techniques for solar photovoltaic arrays and battery energy storage systems. J. Energy Storage 2023, 72, 108552. [Google Scholar] [CrossRef]
  26. Samet, H.; Hashemi, F.; Ghanbari, T. Minimum non detection zone for islanding detection using an optimal Arti fi cial Neural Network algorithm based on PSO. Renew. Sustain. Energy Rev. 2015, 52, 1–18. [Google Scholar] [CrossRef]
  27. Krama, A.; Zellouma, L.; Benaissa, A.; Rabhi, B.; Bouzidi, M.; Benkhoris, M.F. Design and Experimental Investigation of Predictive Direct Power Control of Three-Phase Shunt Active Filter with Space Vector Modulation using Anti-windup PI Controller Optimized by PSO. Arab. J. Sci. Eng. 2019, 44, 6741–6755. [Google Scholar] [CrossRef]
  28. El-Arwash, H.M.; Azmy, A.M.; Rashad, E.M. A GA-Based Initialization of PSO for Optimal APFs Allocation in Water Desalination Plant. In Proceedings of the 2017 Nineteenth International Middle East Power Systems Conference (MEPCON), Cairo, Egypt, 19–21 December 2017. [Google Scholar] [CrossRef]
  29. Gad, A.G. Particle Swarm Optimization Algorithm and Its Applications: A Systematic Review. Arch. Comput. Methods Eng. 2022, 29, 2531–2561. [Google Scholar] [CrossRef]
  30. Al-Shetwi, A.Q.; Sujod, M.Z.; Hannan, M.A.; Abdullahd, M.A.; Al-Ogaili, A.S.; Jern, K.P. Impact of Inverter Controller-Based Grid-Connected PV System in the Power Quality. Int. J. Electr. Electron. Eng. Telecommun. 2020, 9, 462–469. [Google Scholar] [CrossRef]
  31. Ikic, M.; Colic, B.; Mikulovic, J.; Jokic, S. Impact assessment of irradiance and temperature variation on PV system current harmonics injection. In Proceedings of the 2022 21st International Symposium Infoteh-Jahorina, Infoteh 2022—Proceedings, East Sarajevo, Bosnia and Herzegovina, 16–18 March 2022; Institute of Electrical and Electronics Engineers Inc.: New York, NY, USA, 2022. [Google Scholar] [CrossRef]
  32. Lakum, A.; Mahajan, V. A novel approach for optimal placement and sizing of active power filters in radial distribution system with nonlinear distributed generation using adaptive grey wolf optimizer. Eng. Sci. Technol. Int. J. 2021, 24, 911–924. [Google Scholar] [CrossRef]
  33. Buła, D.; Grabowski, D.; Lewandowski, M.; Maciażek, M.; Piwowar, A. Software solution for modeling, sizing, and allocation of active power filters in distribution networks. Energies 2021, 14, 133. [Google Scholar] [CrossRef]
  34. Farhoodnea, M.; Mohamed, A.; Shareef, H.; Zayandehroodi, H. Optimum placement of active power conditioner in distribution systems using improved discrete firefly algorithm for power quality enhancement. Appl. Soft Comput. 2014, 23, 249–258. [Google Scholar] [CrossRef]
  35. Keypour, R.; Seifi, H.; Yazdian-Varjani, A. Genetic based algorithm for active power filter allocation and sizing. Electr. Power Syst. Res. 2004, 71, 41–49. [Google Scholar] [CrossRef]
  36. Ziari, I.; Jalilian, A. A new approach for allocation and sizing of multiple active power-line conditioners. IEEE Trans. Power Deliv. 2010, 25, 1026–1035. [Google Scholar] [CrossRef]
  37. Chicco, G.; Postolache, P.; Toader, C. Triplen harmonics: Myths and reality. Electr. Power Syst. Res. 2011, 81, 1541–1549. [Google Scholar] [CrossRef]
  38. Yang, Z.; Zhuo, F.; Tao, R.; Zhang, Z.; Yi, H.; Wang, M.; Zhu, C. Implementation of Multi-objective Particle Swarm Optimization in Distribution Network for Highefficiency Allocation and Sizing of SAPFs. In Proceedings of the 22nd International Conference on Electrical Machines and Systems (ICEMS), Harbin, China, 11–14 August 2019. [Google Scholar] [CrossRef]
  39. Far, A.M.; Foroud, A.A. Cost-effective optimal allocation and sizing of active power filters using a new fuzzy-MABICA method. IETE J. Res. 2016, 62, 307–322. [Google Scholar] [CrossRef]
  40. Guo, W.; Xu, W. Research on optimization strategy of harmonic suppression and reactive power compensation of photovoltaic multifunctional grid connected inverter. Int. J. Electr. Power Energy Syst. 2023, 145, 108649. [Google Scholar] [CrossRef]
  41. Guido, C.; Angela, R.; Pietro, V. Active filters: A multi-objective approach for the optimal allocation and sizing in distribution networks. In Proceedings of the 2014 International Symposium on Power Electronics, Ischia, Italy, 18–20 June 2014. [Google Scholar] [CrossRef]
  42. Carpinelli, G.; Mottola, F.; Proto, D.; Russo, A. A Decision Theory Approach for the Multi-objective Optimal Allocation of Active Filters in Smart Grids. In Proceedings of the International Conference on Harmonics and Quality of Power, ICHQP, Naples, Italy, 29 May–1 June 2022; IEEE Computer Society: Washington, DC, USA, 2022. [Google Scholar] [CrossRef]
  43. Zhai, H.; Zhuo, F.; Zhu, C.; Yi, H.; Wang, Z.; Tao, R.; Wei, T. An Optimal Compensation Method of Shunt Active Power Filters for System-Wide Voltage Quality Improvement. IEEE Trans. Ind. Electron. 2020, 67, 1270–1281. [Google Scholar] [CrossRef]
  44. Biswas, P.P.; Suganthan, P.N.; Amaratunga, G.A.J. Minimizing harmonic distortion in power system with optimal design of hybrid active power filter using differential evolution. Appl. Soft Comput. J. 2017, 61, 486–496. [Google Scholar] [CrossRef]
  45. Zobaa, A.F. Optimal multiobjective design of hybrid active power filters considering a distorted environment. IEEE Trans. Ind. Electron. 2014, 61, 107–114. [Google Scholar] [CrossRef]
  46. Mahaboob, S.; Ajithan, S.K.; Jayaraman, S. Optimal design of shunt active power filter for power quality enhancement using predator-prey based firefly optimization. Swarm Evol. Comput. 2019, 44, 522–533. [Google Scholar] [CrossRef]
  47. Chang, W.K.; Empros, S.; Park, B. Minimizing Harmonic Voltage Distortion with Multiple Current-Constrained Active Power Line Conditioners. IEEE Trans. Power Deliv. 1997, 12, 837–843. [Google Scholar] [CrossRef]
  48. Devassy, S.; Singh, B. Implementation of Solar Photovoltaic System with Universal Active Filtering Capability. In IEEE Transactions on Industry Applications; Institute of Electrical and Electronics Engineers Inc.: New York, NY, USA, 2019; pp. 3926–3934. [Google Scholar] [CrossRef]
  49. Kumar, V.; Yadav, S.M. A State-of-the-Art Review of Heuristic and Metaheuristic Optimization Techniques for the Management of Water Resources; IWA Publishing: London UK, 2022. [Google Scholar] [CrossRef]
  50. Klaić, Z. Kvaliteta Električne Energije—Harmonici, Predavanja; FERIT: Osijek, Croatia, 2023. [Google Scholar]
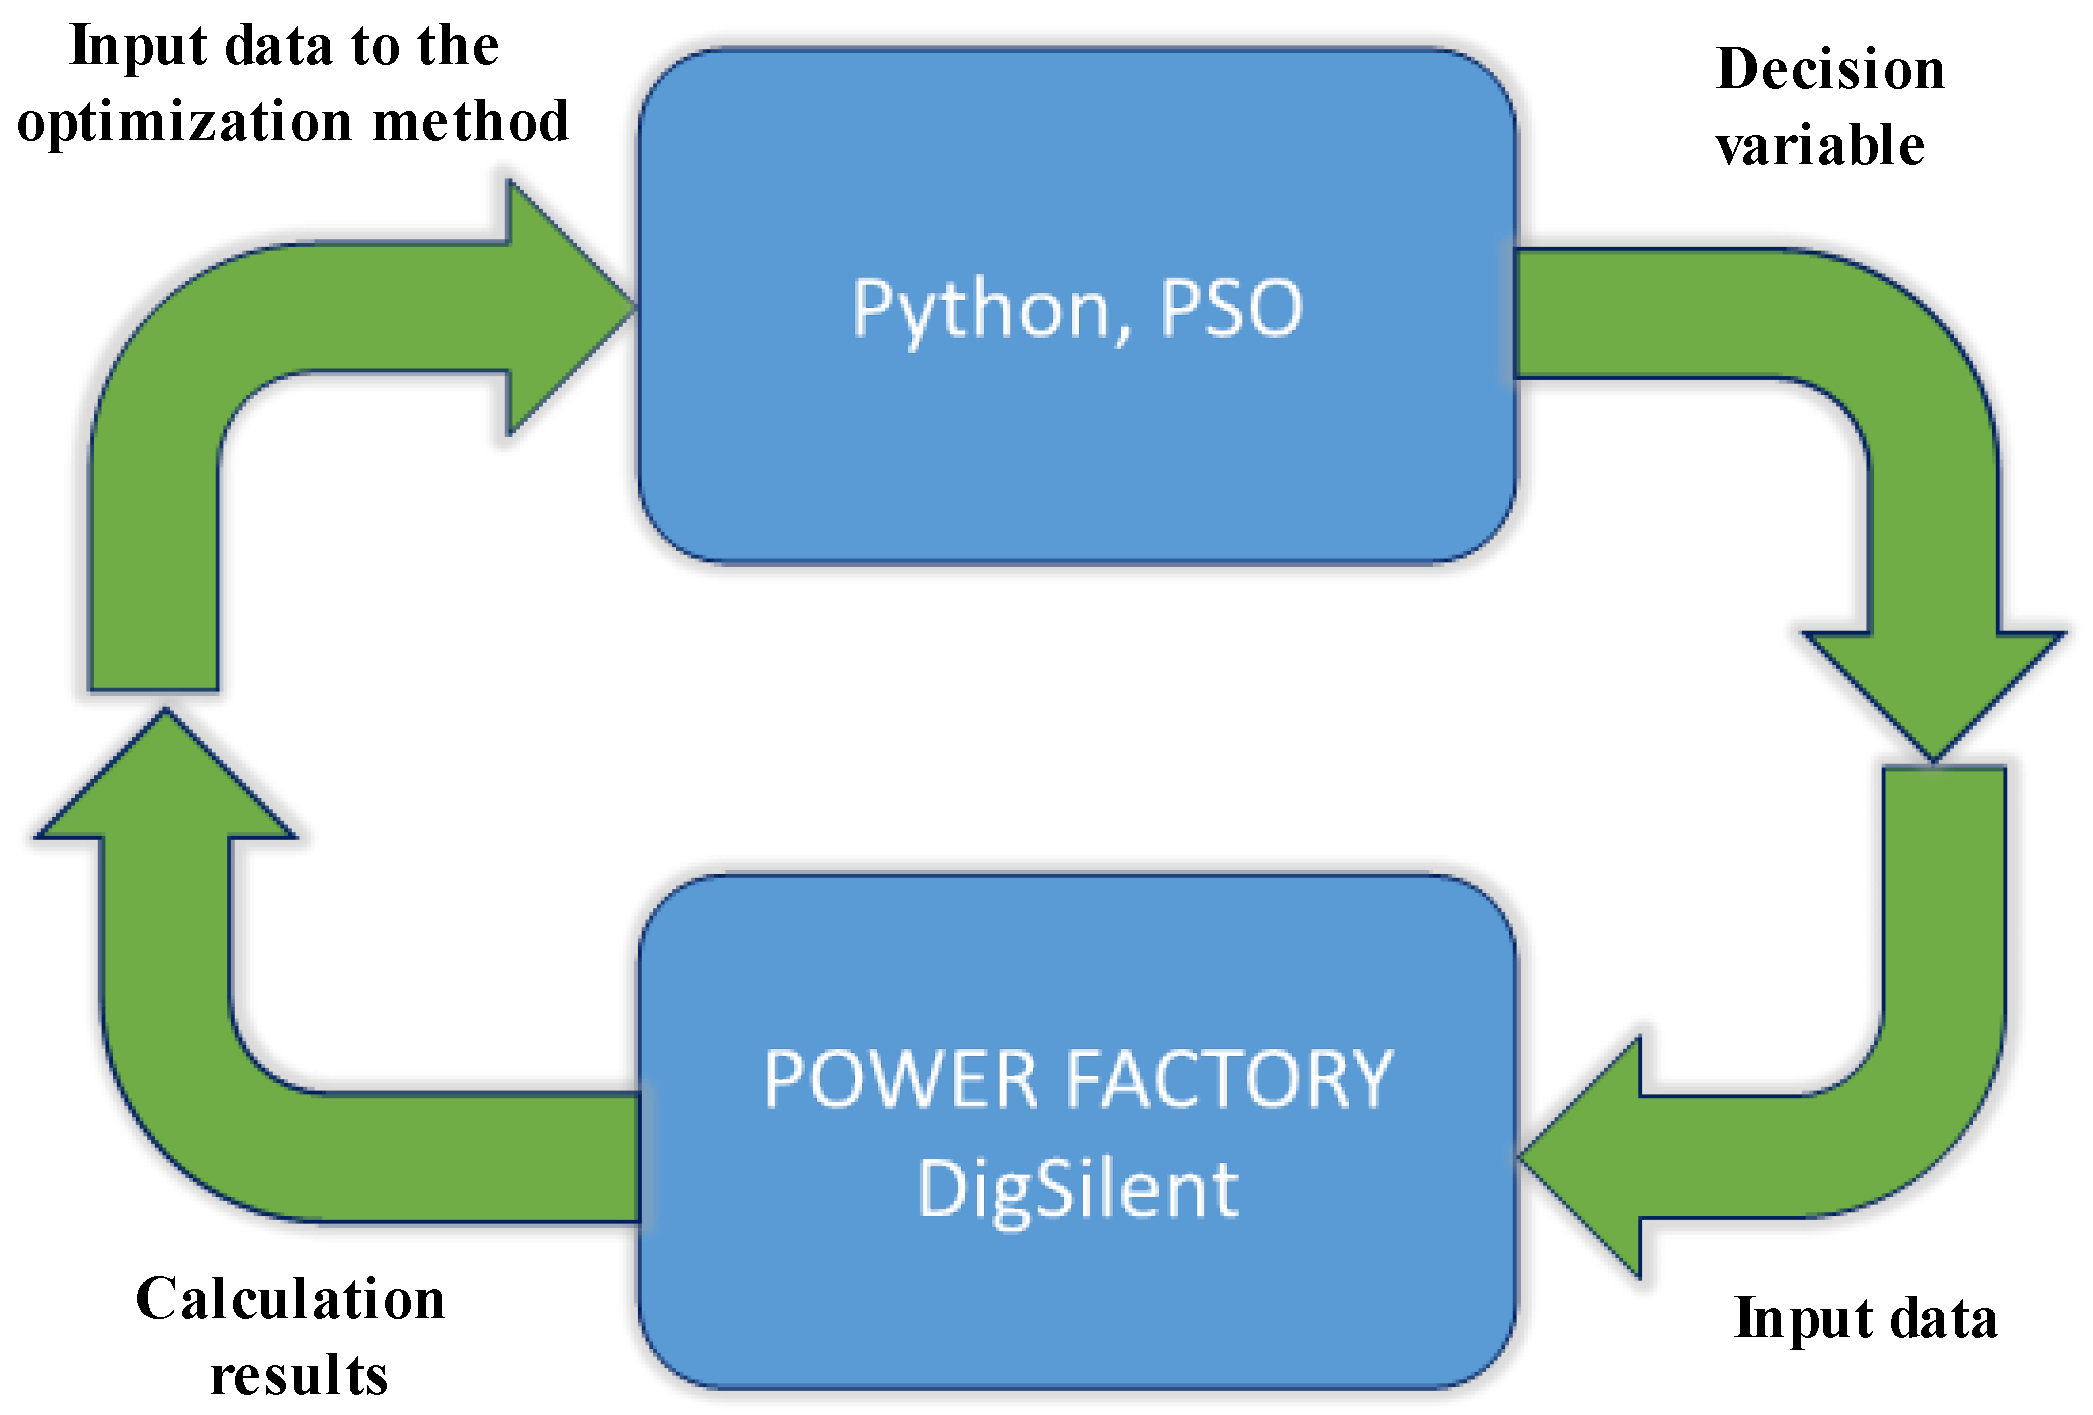
Figure 1. Block diagram of the co-simulation optimization framework for determining optimal APF.
Applsci 15 00469 g001
Figure 2. Flowchart of the algorithm for determining optimal settings of APF.
Applsci 15 00469 g002
Figure 3. Model of test network.
Applsci 15 00469 g003
Figure 4. The algorithm’s results for the selection of the location of (a) the first APF and (b) the second APF.
Applsci 15 00469 g004aApplsci 15 00469 g004b
Figure 5. Total overview of the obtained APF locations.
Applsci 15 00469 g005
Figure 6. The test network state at 00:00 on the characteristic terminals before (a) and after (b) the optimization process.
Applsci 15 00469 g006
Figure 7. THDV values at 00:00 before and after the optimization process: (a) for all buses of the test network; (b) THDV values in phase A on all buses of the test network.
Applsci 15 00469 g007
Figure 8. The test network state at 4:00 a.m. on the characteristic terminal.
Applsci 15 00469 g008
Figure 9. THDV values at 4:00 a.m. at all buses of the test network.
Applsci 15 00469 g009
Figure 10. The test network state at 5:00 p.m. on the characteristic terminals before (a) and after (b) the optimization process.
Applsci 15 00469 g010
Figure 11. THDV values at 5:00 p.m. before and after the optimization process: (a) for all buses of the test network; (b) THDV values in phase B on all buses of the test network.
Applsci 15 00469 g011
Figure 12. The test network state at 2:00 p.m. on the characteristic terminals before (a) and after (b) the optimization process.
Applsci 15 00469 g012
Figure 13. THDV values at 2:00 p.m. before and after the optimization process: (a) for all buses of the test network; (b) THDV values in phase a on all buses of the test network.
Applsci 15 00469 g013
Table 2. Layout of models distributed across the test network.
Model TypeQuantityBus Number
Uncontrollable load modelSingle phase186, 17, 20, 28, 29, 33, 35, 39, 40, 48, 49, 52, 56, 57, 58, 60, 66, 74
Three phase56All others
Controllable load modelSingle phase245, 56
Three phase64, 10, 19, 27, 44, 54
PV system modelSingle phase46, 35, 66, 74
Three phase105, 18, 24, 47, 48, 50, 54, 62, 63, 64
Table 3. Total result overview.
TimePCC Loads
Before
Optimization
Location
(Bus Number)
for First APF
Location
(Bus Number)
for Second APF
PCC Load
After
Optimization
1:00 a.m.63.7412596.80
2:00 a.m.58.2412597.10
3:00 a.m.36.8412585.20
4:00 a.m.30.5412583.50
5:00 a.m.22.2742376.80
6:00 a.m.35.9743986.70
7:00 a.m.63.2743996.60
8:00 a.m.64.8245498.90
9:00 a.m.74.246OL98.50
10:00 a.m.60.3237497.00
11:00 a.m.74.3182297.00
22:00 a.m.70.423OL95.00
13:00 p.m.93.4OLOL93.40
14:00 p.m.85.753OL95.60
15:00 p.m.95.7OLOL95.70
16:00 p.m.92.5OLOL92.50
17:00 p.m.62.6412596.60
18:00 p.m.66.2744896.30
19:00 p.m.95.2OLOL95.20
20:00 p.m.73.555OL96.80
21:00 p.m.68.9412595.30
22:00 p.m.72.1412597.70
23:00 p.m.94.1OLOL94.10
24:00 p.m.69.1412597.80
OL—The network is overloaded and cannot integrate APF.
Disclaimer/Publisher’s Note: The statements, opinions and data contained in all publications are solely those of the individual author(s) and contributor(s) and not of MDPI and/or the editor(s). MDPI and/or the editor(s) disclaim responsibility for any injury to people or property resulting from any ideas, methods, instructions or products referred to in the content.