Abstract
Three-dimensional (3D) printing has become a promising alternative to conventional methods in plastic part production, particularly for customized or low-volume applications such as toys. This study compares toy components produced by Fused Deposition Modeling (FDM) using polylactic acid (PLA) and acrylonitrile butadiene styrene (ABS) filaments and those produced by traditional injection molding using ABS pellets. Unlike in many previous studies based on standardized test samples, a real toy part was evaluated in terms of compressive strength, dimensional accuracy, surface quality, and cost. Experimental results revealed that ABS parts produced by injection molding exhibited the highest compressive strength (3.93 kN), followed by PLA-FDM (2.97 kN) and ABS-FDM (0.95 kN). Similarly, injection-molded parts showed superior surface smoothness and dimensional accuracy. Cost analysis indicated that injection molding is economically viable only when production exceeds 735 pieces, while FDM becomes more attractive for smaller batches due to its low initial cost. A multi-criteria decision-making analysis using the TOPSIS method was conducted to integrate technical and economic factors. Results showed that injection molding is preferable for mass production, whereas PLA-FDM is more suitable for low-quantity, cost-sensitive scenarios.
1. Introduction
The growing accessibility and declining cost of 3D printing have brought noticeable changes to the manufacturing sector, especially in toy production. Compared with traditional plastic injection molding, 3D printing stands out with its flexibility and ease of customization. However, this shift raises a practical question: how do the mechanical properties of toys made by injection molding differ from those produced via Fused Deposition Modeling (FDM)? This question is particularly relevant in industries where product safety, durability, and cost efficiency are critical—such as toy manufacturing. Toys not only are subject to mechanical stress during play but also require dimensional consistency and surface quality due to regulatory and user expectations. While the layered nature of FDM and its manufacturing potential have been widely discussed, a direct comparison with conventional methods in the context of functional toy parts remains limited. This study aims to address that gap by both experimentally evaluating production methods and supporting the findings with a multi-criteria decision-making framework. Studies indicate that 3D printers enable the fabrication of customized products from various materials using Computer-Aided Design (CAD) software, SolidWorks and Autodesk or free design packages such as Blender and Google SketchUp, offering benefits such as reduced costs, increased production speed, and minimized inventory risks [1]. Furthermore, the ability to manufacture complex geometries has introduced significant innovations in the design phase, particularly through the Design for Manufacturing (DFM) approach, which integrates design and production in additive manufacturing. This approach helps in balancing production cost, time, and quality considerations, and provides useful insights for aligning additive manufacturing with Design for Manufacturing (DFM) principles, as discussed in [2].
Research into how 3D printing process parameters influence part properties has garnered significant attention. Previous studies have investigated five critical parameters—layer thickness, part build orientation, raster angle, air gap, and raster width—specifically concerning their effect on dimensional accuracy in FDM processes. Experiments conducted with ABS material on an FDM 1650 machine revealed that while thickness generally exceeded target values, other dimensions such as length, width, and hole diameters tended to be lower. The Gray Taguchi method was successfully employed to optimize these process parameters for improved dimensional accuracy [3]. Furthermore, investigations into the effects of FDM process parameters on mechanical properties have demonstrated that factors like extrusion temperature, layer height, and build orientation significantly influence tensile strength and overall mechanical performance [4]. The current study specifically examines how printing speeds (10, 30, 50, and 70 mm/s) affect the tensile strength of ABS samples produced using FDM technology. As anticipated, the lowest printing speed yielded the highest tensile strength [5]. Separately, the changes in the physical properties of ABS, PETG (Polyethylene Terephthalate Glycol), and PLA polymers during heating and cooling were explored when printed via FDM at varying temperatures (85, 105, and 125 °C). This research concluded that ABS material exhibited the least shape change in response to temperature variations [6].
Polylactic acid (PLA), a widely utilized biopolymer in additive manufacturing, is known for its limited impact strength, which necessitates process optimizations to enhance its mechanical properties. Research has specifically examined the effects of layer height and print bed temperature on PLA’s impact resistance. These studies leveraged advanced characterization techniques such as X-ray diffraction (XRD), polarized optical microscopy (POM), and scanning electron microscopy (SEM). The findings consistently indicated that higher print bed temperatures and optimized layer heights contributed to increased crystallinity and consequently improved impact strength [7]. Beyond mechanical properties, the adhesion characteristics of PLA and ABS on various print bed surfaces have also been evaluated. This research demonstrates that elevated bed temperatures significantly enhance adhesion, particularly when printing on glass substrates [8].
The influence of thermal processing parameters on mechanical performance has been further explored. Investigations into the production of PLA parts revealed that variations in extrusion temperature and bed temperature significantly affected mechanical strength, thermal properties, and overall durability. Thermal analyses, including differential scanning calorimetry (DSC), dynamic mechanical analysis (DMA), and heat deflection temperature (HDT) testing, have shown that higher bed temperatures contribute to enhanced impact resistance and increased heat deflection temperatures [9]. Furthermore, infill density (ID) has been identified as a crucial parameter influencing both microstructure and flexural behavior. Studies employing three-point bending tests (3PBT) have concluded that an 80% infill density provides an optimal balance between strength and durability for PLA parts [10].
Beyond material-specific investigations, research has extensively focused on the mechanical behavior of thermoplastic polymers processed by the Fused Filament Fabrication (FFF) method under varying strain rates. A comparative analysis of PLA, ABS, PETG, PA6, and PP under static tensile loading conditions highlighted variations in strain rate sensitivity; PLA exhibited high sensitivity, while ABS and PP demonstrated lower responses [11]. Further studies have explored bioprinting applications, particularly in tissue engineering and regenerative medicine. The development of artificial skin using gelatin/chitin hydrogel via extrusion-based bioprinting has been investigated, emphasizing the influence of mechanical stress, flow rate, material density, and nozzle geometry on cell viability and structural integrity [12].
The production of high-strength composite materials through FDM has also gained interest, particularly in the fabrication of continuous carbon fiber-reinforced polymers (CCFRPs). Experimental studies on applied pressure during printing have demonstrated significant enhancements in mechanical performance, with tensile and flexural strengths increasing substantially under higher pressure conditions [13]. Similarly, the integration of carbon fibers into ABS matrices has been examined, revealing that increased fiber content improves tensile strength while concurrently reducing toughness and ductility [14]. In another study, a PLA filament and a PLA filament reinforced with 80 wt% 410 L stainless steel powder were manufactured using the melted filament fabrication method. Test specimens were produced with a 3D printer according to CAD designs and at different printing parameters. Tensile strength, impact resistance, and thermal conductivity measurements were conducted. It was found that the addition of steel powder decreased the mechanical strength but increased the thermal conductivity. The significant effects of printing parameters on mechanical properties were revealed by ANOVA analysis [15].
Beyond mechanical performance, the environmental and safety aspects of 3D printing have been scrutinized. The thermal processing of thermoplastics such as ABS, PLA, PET, and nylon at elevated temperatures has been associated with the release of volatile organic compounds (VOCs) and other potentially hazardous emissions. Gas chromatography (GC) analysis of emissions during the printing process identified ABS as a major source of toxicity compared with PLA [16,17]. Energy consumption and environmental impact were measured and compared for both FDM and plastic injection molding (PIM) processes using standard dog bone specimens (ASTM D638 Type IV) made of polylactic acid (PLA), using an in-house Ultimaker S3 FDM 3D printer and a Morgan Press G-125T electric injection molding machine. It was found that approximately 99% of the total energy in FDM was consumed during the printing phase, while injection molding consumed about 38.2% less energy and produced lower carbon emissions compared with FDM [18].
The mechanical and thermal properties of recycled thermoplastics and composites have also been investigated using FDM-based 3D printing methods. Recycled plastic materials, including PLA, ABS, and PET, were processed into filaments using different types of extruders, followed by mechanical tests, including tensile strength evaluations. It was shown that the mechanical performance of recycled materials can be improved by optimizing additives and processing parameters, demonstrating that sustainable plastic recycling can be achieved through the judicious use of FDM technology [19].
Extensive research has been conducted comparing parts produced by injection molding and FDM, particularly regarding their mechanical properties. A study evaluating ABS, nylon 12, and polystyrene materials using both rapid prototyping and injection molding methods assessed properties such as dimensional accuracy, tensile strength, water absorption rate, Shore hardness, and microscopic structure. The findings revealed significant discrepancies between the two manufacturing methods [20]. Moreover, investigations into complex part geometries, such as integrated hinges in polyamide (PA) injection-molded components, demonstrated that weight distribution and mechanical properties are highly dependent on part geometry, sometimes leading to unexpected results [21]. Further comparisons of PLA, ABS, and nylon 6 components produced via FDM and injection molding confirmed that FDM-produced samples generally exhibit lower mechanical properties but higher crystallinity for PLA and nylon 6 [22]. In contrast, studies assessing PLA parts with varying infill densities produced by FDM suggested that 3D-printed samples may, in some cases, surpass injection-molded counterparts in terms of mechanical and thermal properties [23]. Mechanical properties of ABS thermoplastic components produced by Fused Deposition Modeling (FDM) and injection molding have also been comparatively studied. Tensile strength tests were performed on standardized dog-bone-shaped samples with varying cross-sections, printing orientations, layer thicknesses, contour layers, and infill densities [24]. Similarly, the mechanical properties of short carbon fiber-reinforced polyamide 6 (PA6) manufactured by Fused Deposition Modeling (FDM) and Polymer Injection Molding (PIM) were investigated. Tensile, compressive, and flexural tests were performed to evaluate the effects of manufacturing processes on fiber length, microstructure, and mechanical behavior [25].
As 3D printing technology continues to evolve, its influence on manufacturing practices and material properties remains a focal point of research. While additive manufacturing enables greater design flexibility and customization, challenges related to mechanical performance, process optimization, and environmental considerations must be addressed to fully harness its potential in industrial applications. In recent years, the toy industry has increasingly adopted desktop 3D printers for prototyping, customization, and small-batch production. However, most toys are not purely decorative; they are routinely handled, dropped, and subjected to mechanical stress during play. Therefore, it is crucial to evaluate not only the aesthetic aspects of 3D-printed parts but also their mechanical performance, dimensional accuracy, and surface characteristics. Despite the growing use of additive manufacturing in this sector, few studies have focused on the functional performance of actual toy parts, as most existing works are based on standardized test specimens. This study aims to address this critical gap by analyzing the behavior of an actual toy component manufactured using both injection molding and FDM. By combining this with cost analysis and a multi-criteria decision approach utilizing TOPSIS, it aims to offer insights that are both technically sound and economically meaningful.
2. Material and Methods
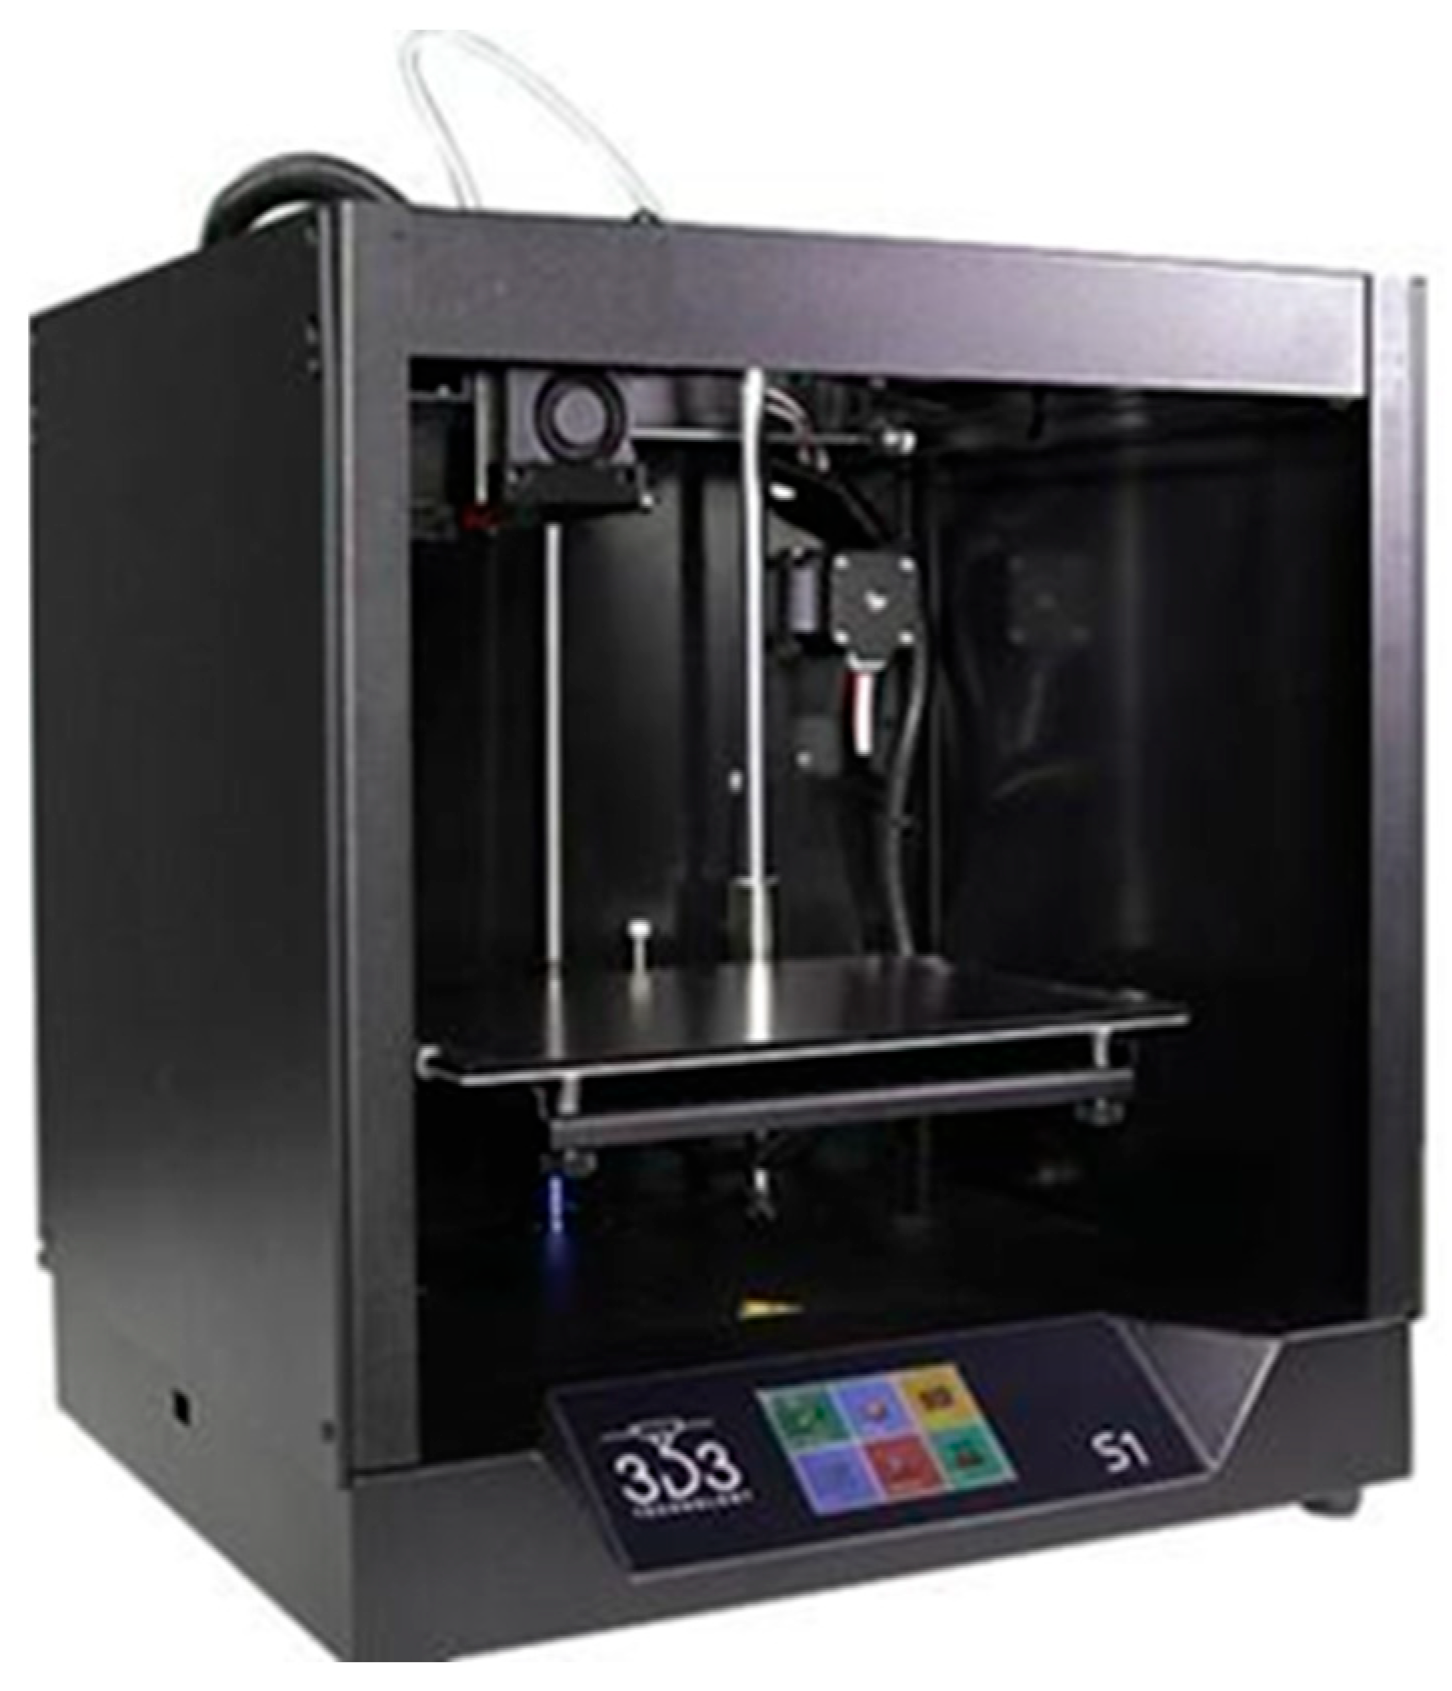
In experimental studies, ABS (acrylonitrile butadiene styrene) was utilized due to its high hardness value, which provides impact resistance. In addition to this feature, ABS both is flexible and exhibits effective insulation properties. The 4 g toy samples were fabricated through two distinct methods: plastic injection and FDM (3D printing). In the former, ABS was used in granular form, while in the latter, it was employed as a filament. The design of the sample is first created in CAD mode in the computer environment, and the designed or ready-made CAD model is converted into G-codes using a slicing program and printed. In this study, the model converted to STL format in the SolidWorks program was converted to G-code using the Simplify3D slicing program. The fabrication of the samples was conducted by employing an ABS filament, which was subsequently transferred to an S1 model 3D printer from 3D3 Technology. The 3D3 S1 is an FDM 3D printer with a build volume of 250 × 210 × 210 mm and a layer resolution of 50 microns. It supports various filaments, including PLA, ABS, PC (polycarbonate), wood, PETG (Polyethylene Terephthalate Glycol), ASA (acrylonitrile styrene acrylate), tough PLA, metal-filled PLA, glass fiber-reinforced PA, carbon fiber-reinforced PA, flex, and semi-flex. The printer has a metal frame and a 0.4 mm interchangeable nozzle. It can print at speeds up to 150 mm/s with a maximum nozzle temperature of 295 °C and a heated bed temperature of 140 °C. The printer weighs 15 kg and uses a 300 W power supply. The 3D printing parameters and the 3D printer model are delineated in Table 1 and Figure 1, respectively. PLA material is considered an alternative to ABS, a by-product of petroleum, due to its vegetable content. Its ease of use in 3D printers has led to its popularity. Consequently, this study will utilize a PLA filament in conjunction with the FDM technique to produce alternative components to those manufactured using an ABS filament. A comparative analysis will be conducted to assess the performance and suitability of the PLA filament. After the toy part was produced on the 3D printer, it was not subjected to any additional processing, such as surface or feature enhancement. It was tested as it came out of the printer.

Table 1.
Printing parameters.
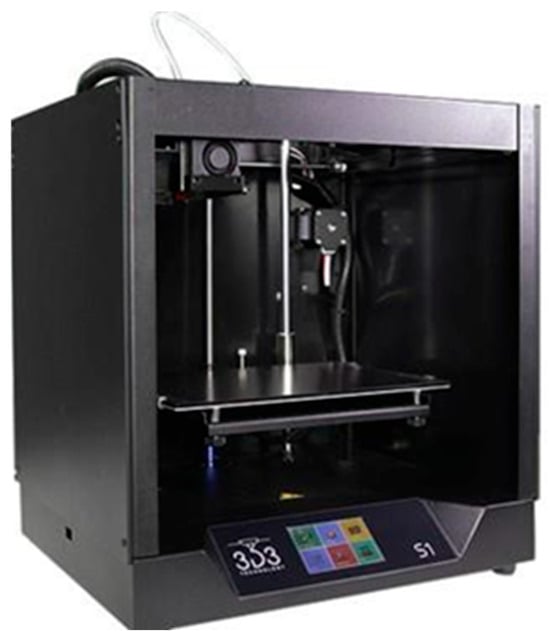
Figure 1.
3D printing device: 3D3 Technology S1 model.
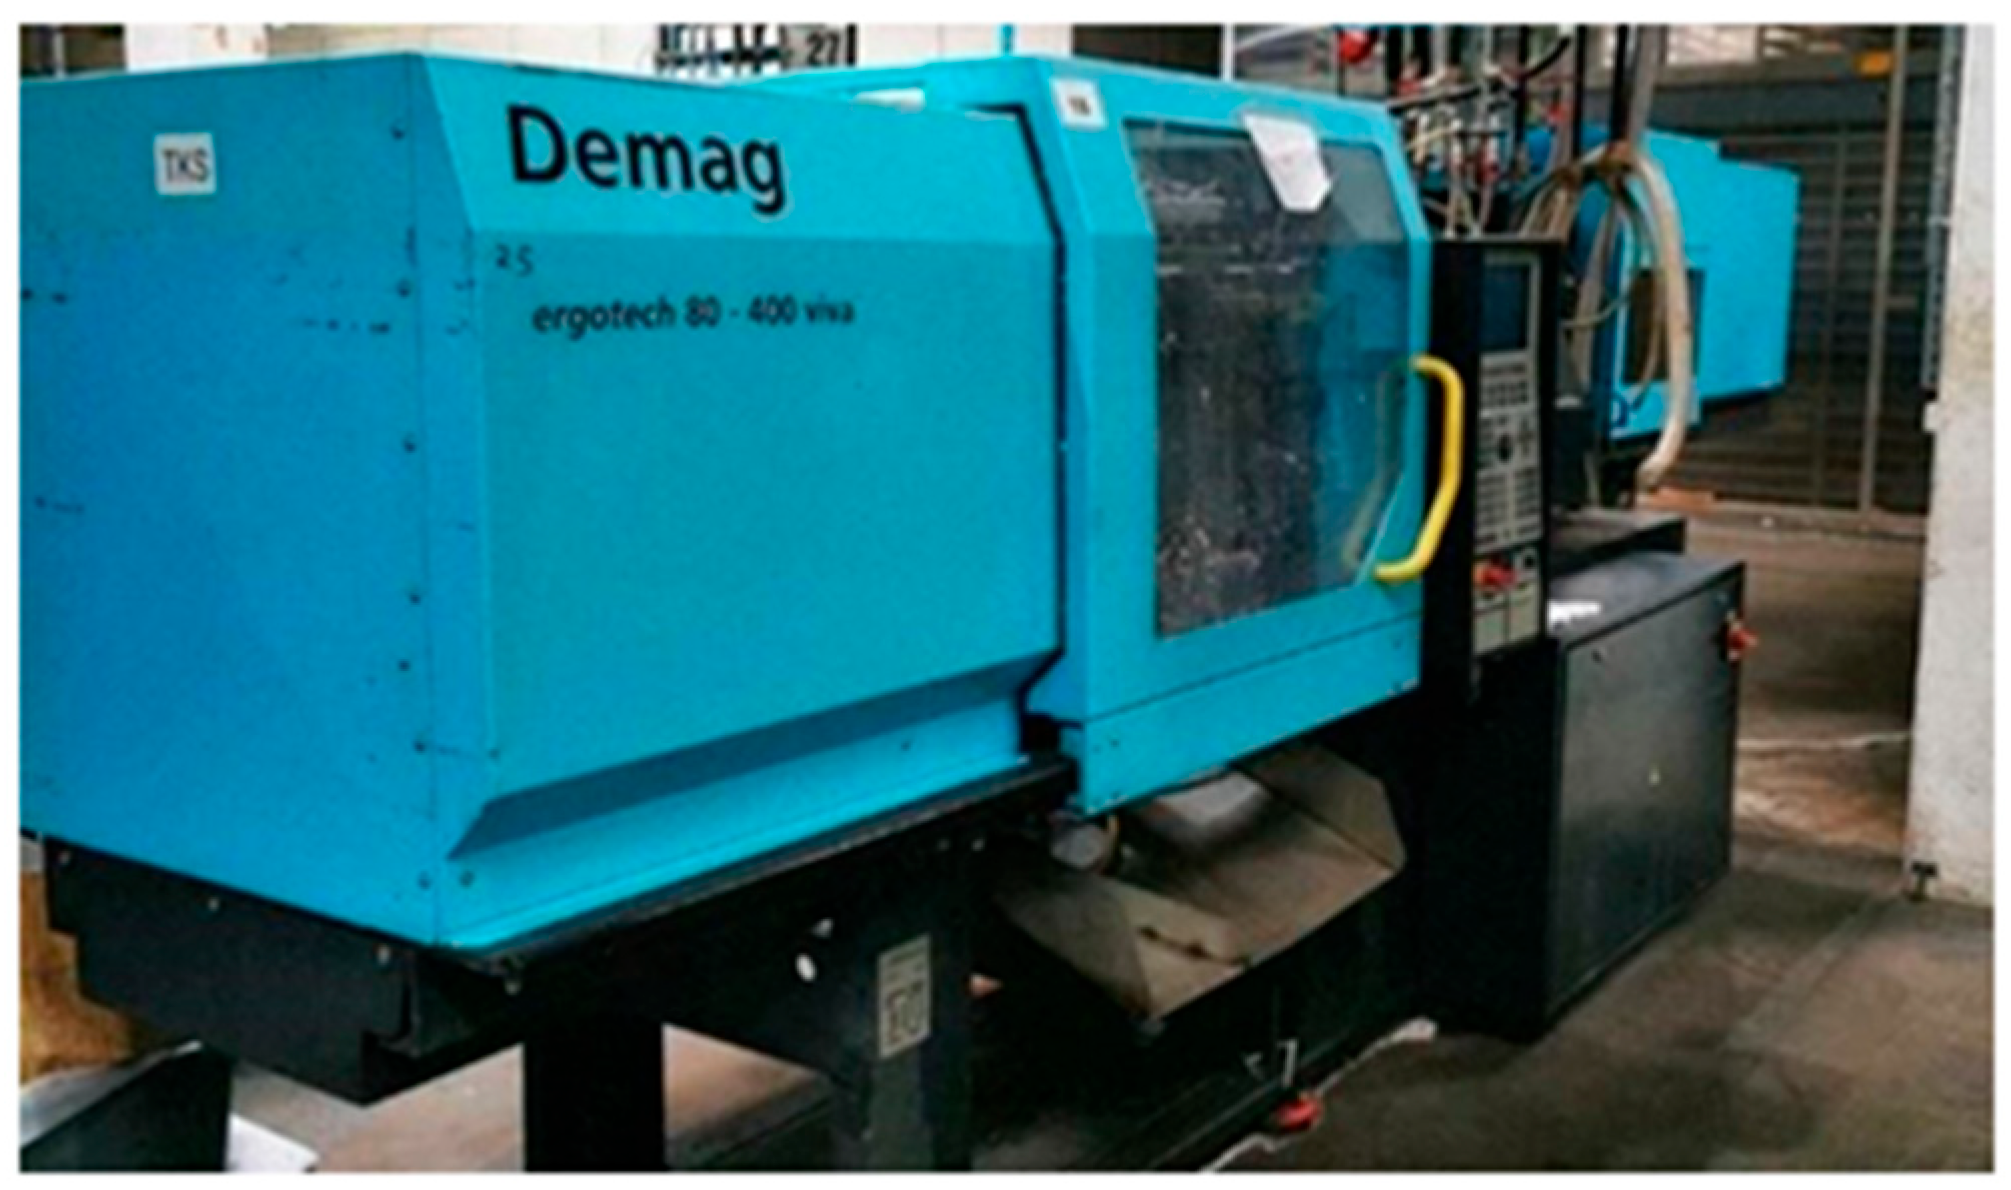
The plastic injection molding process begins with a mold design, which is typically performed using Computer-Aided Design (CAD) software. Once designed, the mold is fabricated and then integrated into an injection molding machine. In this process, granular plastic material is fed into the machine, where it is liquefied through heating and pressure. The molten plastic is then injected into the mold cavity and rapidly cooled to solidify, taking the shape of the desired part. For the purposes of this study, a Demag brand plastic injection machine with a production capacity of 90 tons was utilized, along with an LG brand ABS thermoplastic material, HI121. The Demag Ergotech 80/400 viva, was sourced from Demag, a German manufacturer, features a clamping force of 123 kN and an injection pressure of 210 bar. The injection unit is equipped with a screw diameter of 123 mm and a stroke volume of 123 cm3. The machine’s dimensions, including width, depth, and height, are each 123 mm, and it has a total weight of approximately 3600 kg. The main electrical connection is rated at 400 V and 50 Hz.
The plastic injection parameters are listed in Table 2, and an image of the injection machine is provided in Figure 2.
Table 2.
Injection parameters.

Figure 2.
Plastic injection machine: Demag Ergotech 80/400 viva.
After fabricating the experimental components, their dimensional accuracy was measured using a DEA brand Coordinate Measuring Machine (CMM), manufactured by Hexagon Manufacturing Intelligence in Torino, Italy, specifically the Brown & Sharpe model shown on the left in Figure 3. This dimensional comparison was performed against the 3D solid model. Using the CMM device allowed for the determination of the material’s compliance with specified dimensional and geometric tolerance parameters. The measurement results from the CMM device were calculated by taking the square root of the sum of the squares of the deviations along the X, Y, and Z axes. The values obtained with the CMM device are calculated according to the formula given in Equation (1).
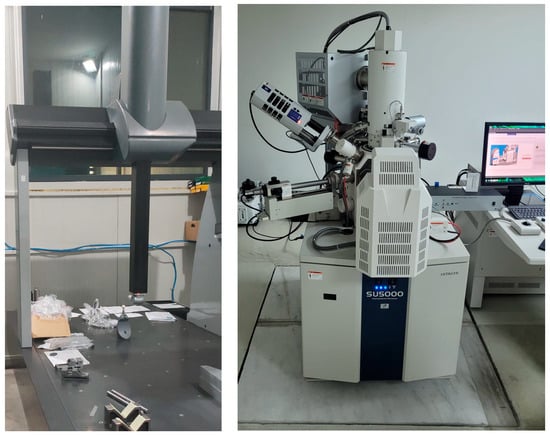
Figure 3.
CMM (on the left) and SEM (on the right) device.
Scanning electron microscopy (SEM) provides high-resolution images by scanning the surfaces of samples with a focused electron beam. The SEM device used for imaging the samples in this study is shown on the right in Figure 3. Since the samples were non-conductive, their outer surfaces were gold-plated using a Leica EM ACE200 device, manufactured in Vienna, Austria. This gold-plating process involves creating argon gas plasma within the device, which detaches gold nanoparticles from a gold disc and coats the sample surface.
To further examine the surface textures of the samples, surface roughness values (Ra) were measured. Surface roughness (Ra) quantifies the average deviation of the surface’s normal vector; smaller deviations indicate a smoother surface. In this study, measurements were taken with reference to nine distinct points on each sample. The Surface Roughness Tester TMR 120 was sourced from TMTeck (China), used for these measurements, along with the nine different measurement reference points, is depicted in Figure 4.
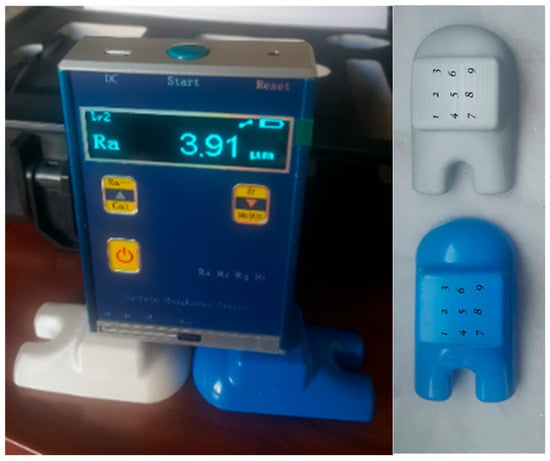
Figure 4.
Surface roughness measuring device and 9 different measurement reference points.
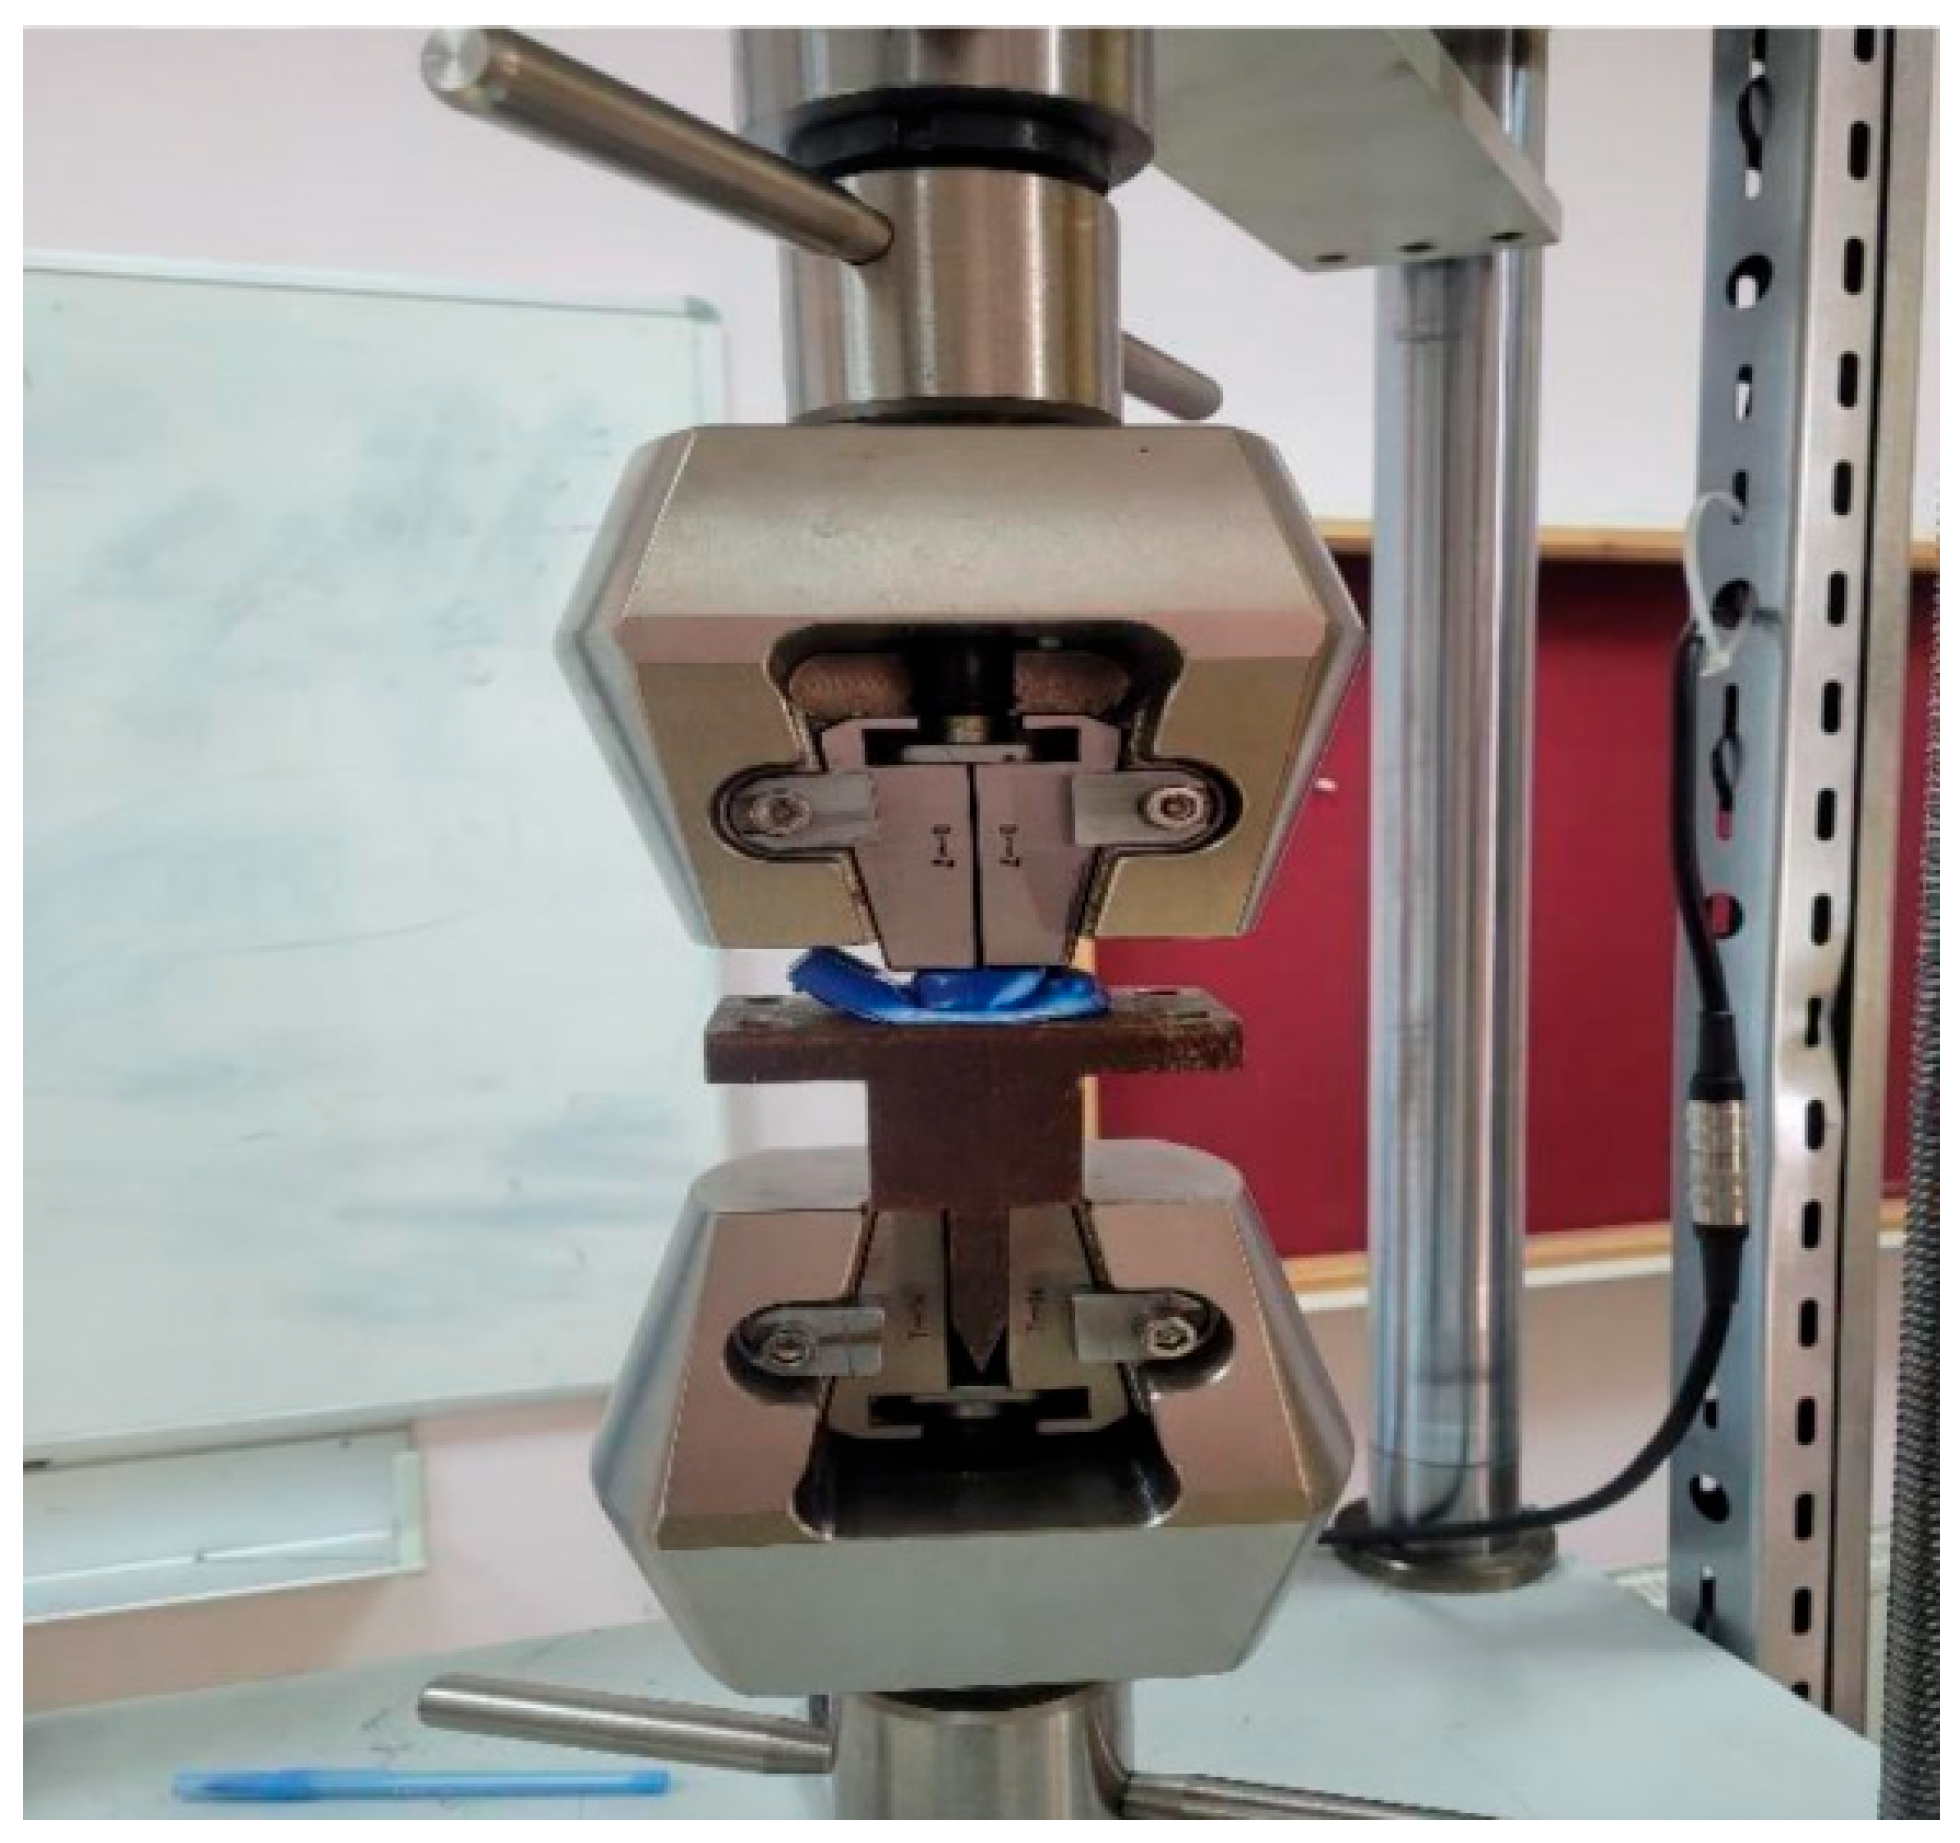
To assess the compressive strength of the samples, a compression test was performed as a key component of the mechanical test series. The compression force is defined as the force that would lead to the fracture of the toy under typical use conditions. This method involves examining the material’s behavior under an applied load to determine its mechanical properties. During the test, the deformation of the samples under the applied force was observed, and the maximum force that could be sustained before failure was determined. A total of nine toy figures were subjected to the compression test, with three figures selected from each of the produced sample groups. The device used for applying the compression force, along with the application methodology, is illustrated in Figure 5.
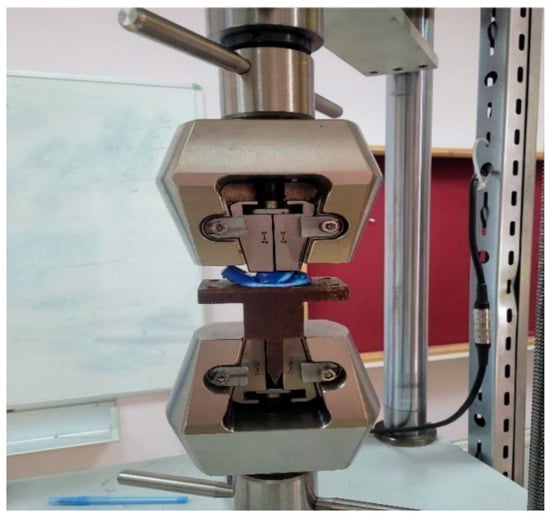
Figure 5.
Compression test.
3. Results and Discussion
In the present study, a toy figure specimen was manufactured using two distinct methods: Fused Deposition Modeling (FDM) and plastic injection molding. We measured the compressive force exerted on the samples to evaluate the resulting changes in their material properties and strength. The accuracy of the production process was investigated by comparing the dimensions of the manufactured toy figures with their 3D CAD model using a Coordinate Measuring Machine (CMM). Additionally, we measured the surface roughness values (Ra) of the materials to assess their surface quality. Finally, the microstructure of the materials was analyzed by capturing high-resolution images of the produced samples using a scanning electron microscope (SEM).
3.1. Compression Tests
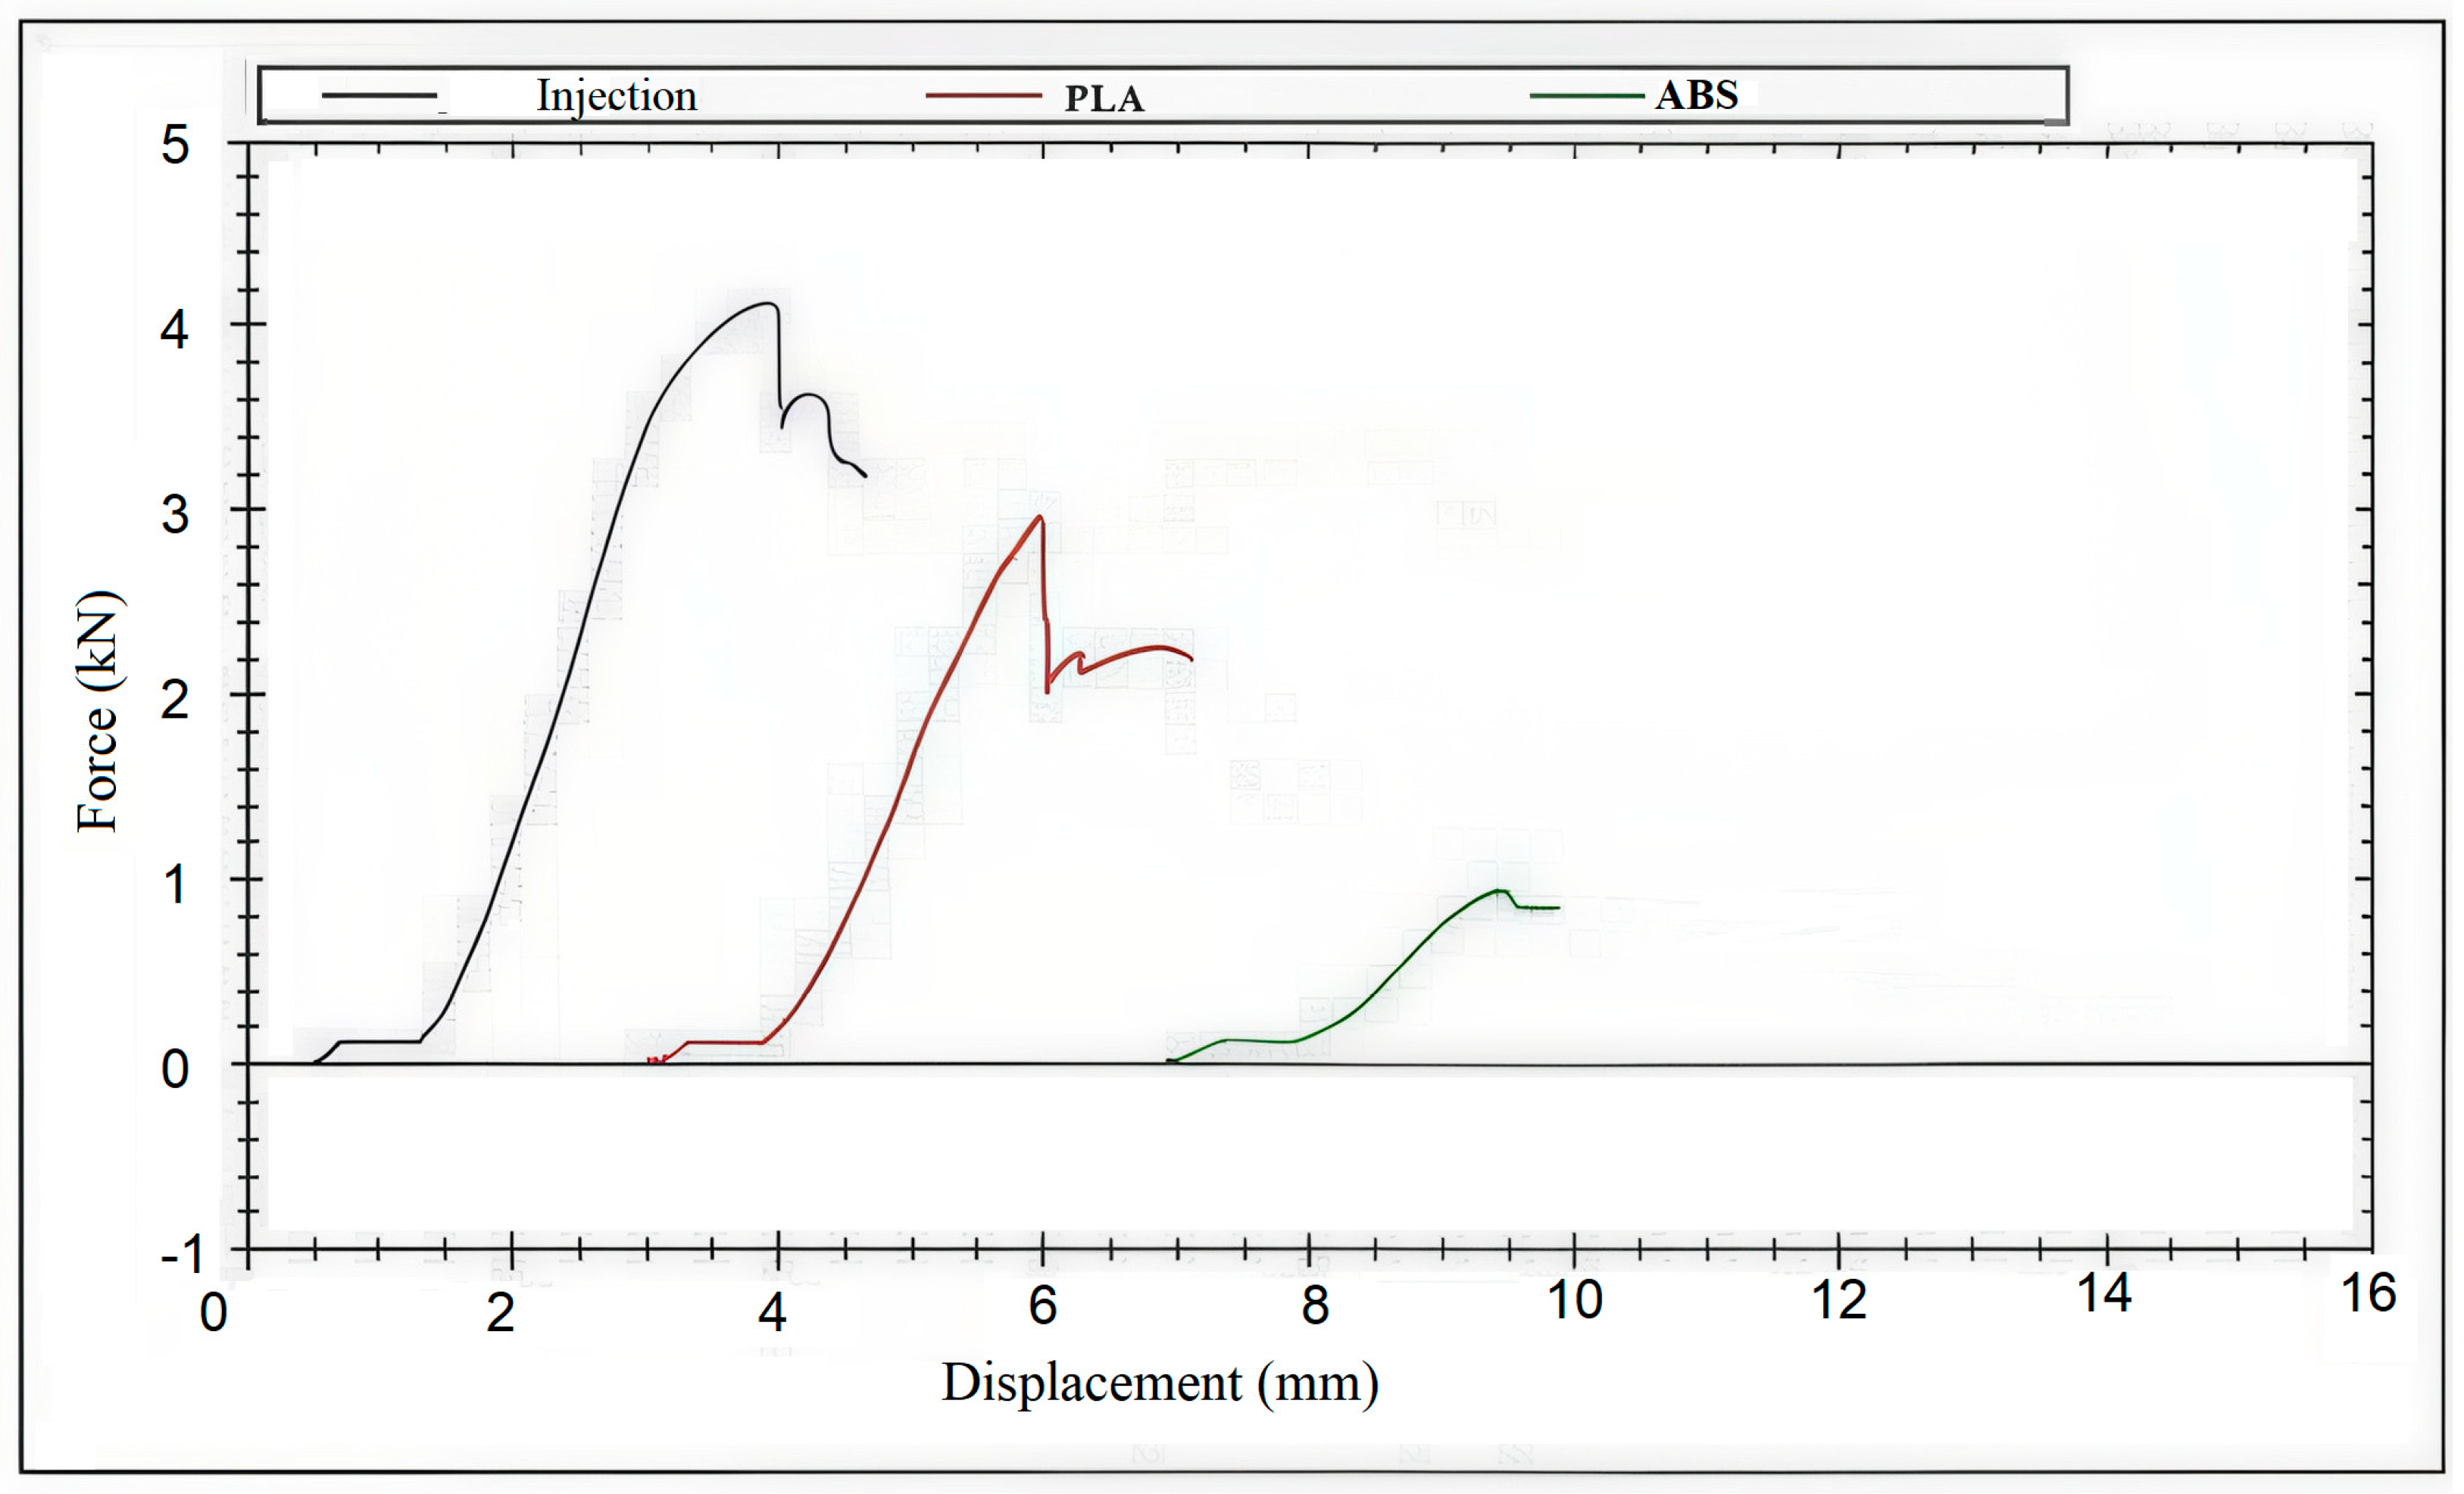
The compression tests revealed significant differences in the load-bearing capacity of the samples. PLA-FDM specimens withstood 2.97 kN, ABS-FDM specimens withstood 0.95 kN, and ABS-Injection molded specimens exhibited the highest resistance, enduring 3.93 kN. The graphical representation of these compression test results is presented in Figure 6. These findings clearly demonstrate that the ABS plastic injection molded samples exhibited the highest resistance to compressive load.
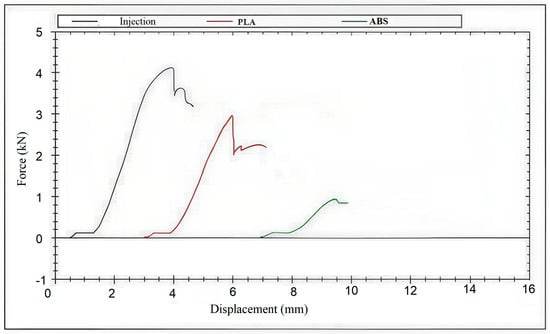
Figure 6.
Compression test results.
The superior strength of injection-molded parts can be attributed to the critical ironing and holding phases within the plastic injection process. These phases, which involve compressing the material within the mold, effectively prevent the formation of internal hollow structures or voids, thereby enhancing the material’s overall strength. We observed a direct correlation: as the presence of hollow structures in the samples decreased, resistance to fracture increased and vice versa. This suggests that the plastic injection molding method promotes ductile behavior under load due to its significantly reduced internal void content.
Conversely, a subsequent examination of the SEM images of the 3D-printed samples revealed a large cavity structure. This phenomenon is hypothesized to result from either an uneven distribution or an inadequate adhesion of the molten polymer during filament extrusion in the FDM process. The study’s findings indicate a direct correlation between material strength and the presence of voids and microstructure irregularities: as these parameters increase, the material’s strength diminishes. The data obtained through scanning electron microscopy (SEM) corroborates the outcomes of previous studies, thereby validating our research approach and providing a robust evidence base for the conclusions drawn.
3.2. CMM Measurements
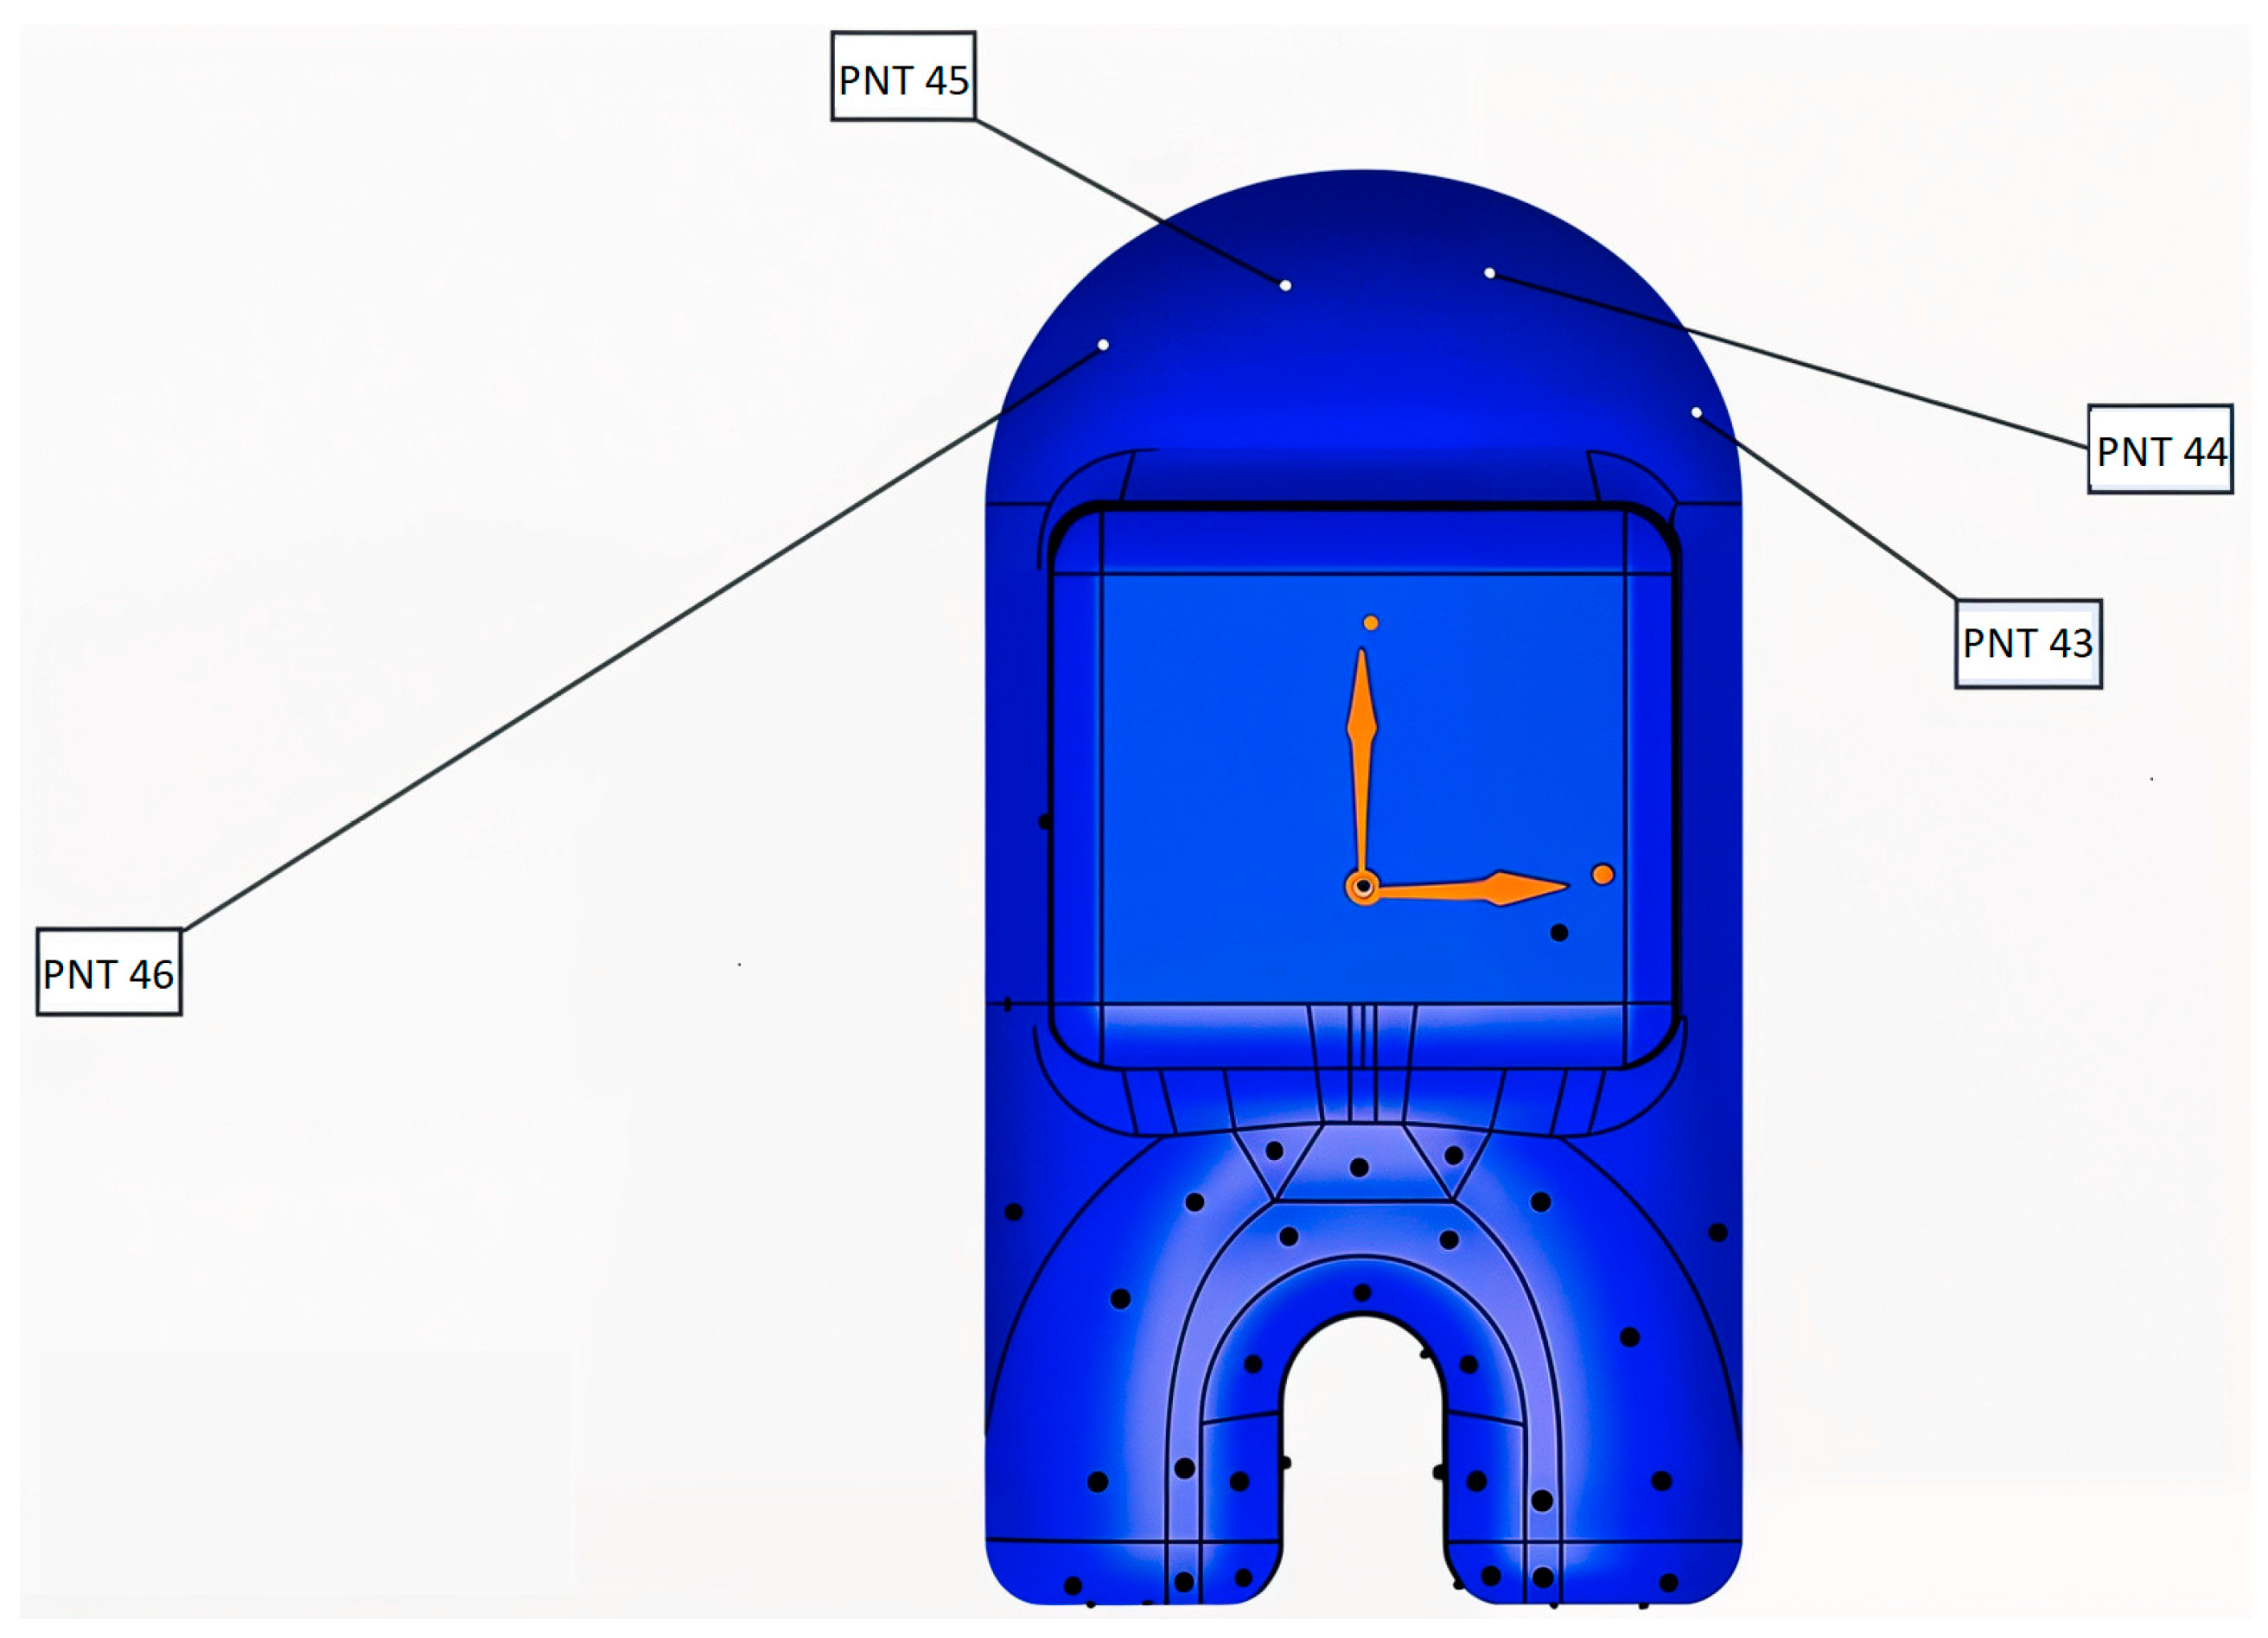
The measurement of the coordinates of the samples was conducted, and the data obtained using the CMM device are given in Table 3. The height of the part is 6 cm, and its width is 3.5 cm. To illustrate an example of the measuring points, PNT43, PNT 44, PNT 45, and PNT 46 are shown in Figure 7.
Table 3.
CMM measurements.

Figure 7.
Illustration of CMM measurement points.
Our findings indicate that the ABS sample produced by plastic injection molding demonstrated dimensional accuracy closest to the 3D model. Only one measurement point for this sample exceeded the accepted tolerance range of ±1 mm. Overall, the plastic injection method yielded results that were consistently closest to the 3D model.
As detailed in Table 3, out-of-tolerance measurements were recorded at four distinct points for the sample produced via ABS 3D printing, whereas only one point was out of tolerance for the ABS plastic injection-molded sample. Specifically, for POINT39, the measurement was considered erroneous across all samples, likely due to a measurement anomaly rather than a manufacturing defect. Excluding this outlier, the largest deviation observed in the injection-molded part was −1.044 mm at POINT39. However, the average deviation across all other points was significantly lower, confirming the overall high dimensional accuracy of injection molding.
An analysis of the reference points POINT38, POINT39, and POINT40 for 3D-printed samples revealed that those produced from an ABS filament exhibited a lower incidence of measurement inaccuracy compared with samples produced from a PLA filament. When comparing samples obtained from injection molding and 3D printing, an average discrepancy of 0.0025 mm was observed in ABS.
Upon evaluating the entire dataset, it is evident that, for applications not requiring extremely tight tolerance ranges, 3D printing can yield results that closely resemble those produced by injection molding. The comparison of CMM device measurements with the solid model measurements in the computer environment revealed significant negative discrepancies at numerous points. The primary cause of this discrepancy is believed to be the material shrinkage that occurs during the solidification process, which is inherent in production methods involving temperature application.
3.3. SEM Images
SEM images were acquired at five distinct scales: 2 mm, 100 µm, 30 µm, and 5 µm. The images were captured using a 10.0 kV accelerating voltage with corresponding magnifications of 29×, 500×, 2000×, and 1000×, respectively. A large-area detector (SE(L)) was utilized to detect secondary electrons, providing detailed surface morphology. The microstructures within the samples were examined in detail and are presented in Figure 8.
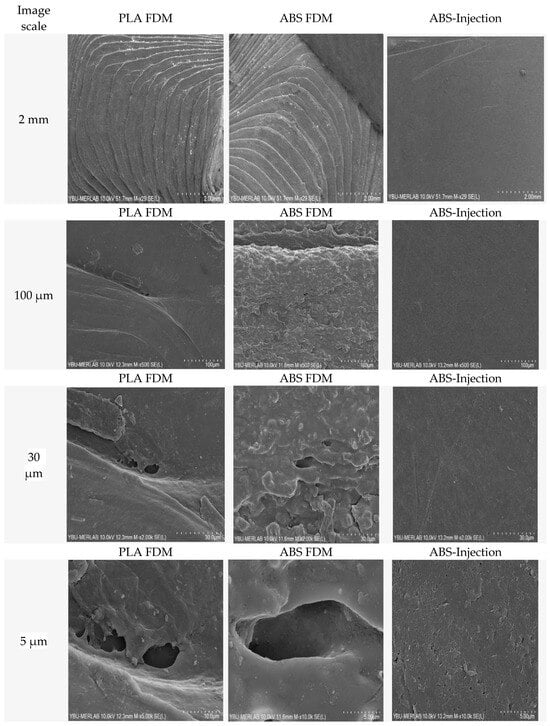
Figure 8.
SEM images of ABS 3D-printed and ABS-Injection-molded parts at different scales.
In the context of injection molding, the polymer exhibits a more fluidic structural behavior, primarily influenced by temperature and pressure. Achieving homogeneous cooling within the mold results in the formation of a smooth surface with minimal void formation during material compression. This phenomenon is clearly discernible in images captured at scales of 2 mm, 100 µm, and 30 µm. At the finer 5 µm scale, the presence of distinct gaps and borders becomes readily apparent. This observation indicates that the polymer is fully compressed, leading to a low surface roughness.
A thorough examination of the 3D-printed parts using the FDM method reveals the presence of layers in 2 mm scale images. A closer inspection of 100 μm scale images reveals layer differences in the dark top, along with fluctuations and gaps in the microstructure. The FDM method involves the non-complete melting of the material, leading to a homogeneous fluid structure. This results in the formation of a porous and heterogeneous surface. The observed heterogeneity and fluctuations are believed to be attributable to the three distinct monomers, namely, acrylonitrile butadiene styrene (ABS), which constitute the polymeric material. It has been established that acrylonitrile contributes to the enhancement of hardness and chemical resistance, while butadiene confers impact resistance and styrene ensures enhanced brightness and ease of machinability.
3.4. Surface Roughness
Our surface roughness measurements indicate that the toy figure samples produced by plastic injection molding consistently exhibit lower Ra values and smoother surfaces compared with the 3D-printed samples. As detailed in Table 4, the ABS sample produced via plastic injection molding demonstrated the smoothest surface, with an Ra value of 0.16. In contrast, the ABS 3D-printed samples had a surface roughness of 1.43 Ra. It is important to note that the toy part was tested in its as-printed condition, without any post-processing or surface enhancement. We hypothesize that the significant difference in surface roughness, even for samples from the same material group, is primarily due to the inherent characteristics of the production methods.
Table 4.
Surface roughness results of samples.
When comparing the FDM-produced samples with the injection-molded design in this study, the PLA 3D-printed samples had a surface roughness of 3.05 Ra. This indicates that PLA exhibits higher surface roughness than ABS FDM samples. A detailed analysis of the SEM images presented in Figure 8 corroborates this finding, revealing that PLA samples exhibit significantly more pronounced internal structure cavities in comparison with ABS.
3.5. Cost Analysis
Our cost analysis revealed that while the plastic injection method using ABS granules offers a lower per-unit cost, it requires substantial initial investment in machinery and molds. In contrast, 3D printing provides a significant cost advantage due to the lower machine cost and the absence of mold expenses. However, the plastic injection method boasts a substantially higher production capacity and faster rate.
The break-even points in this study, which represent the production quantity where total cumulative manufacturing cost equals initial investment (including equipment and tooling), differed significantly. For injection molding, this point is reached at approximately 17,680 units, whereas for 3D printing, it occurs at around 5820 units. These figures indicate the minimum quantity required for the initial capital expenditure to be amortized by the per-part production cost, without reflecting revenue or profit margins.
A recent study indicated that producing at least 735 parts via the injection method results in a comparable production cost when compared with 3D printing. This suggests that once this specific number of toy figures is produced, the mold cost is recovered, leading to profit in subsequent productions. In summary, for a 4 g piece of this size, when demand is less than 735 units and production time is not a critical factor, 3D printing emerges as the more cost-effective option.
3.6. Multi-Criteria Decision Making with TOPSIS
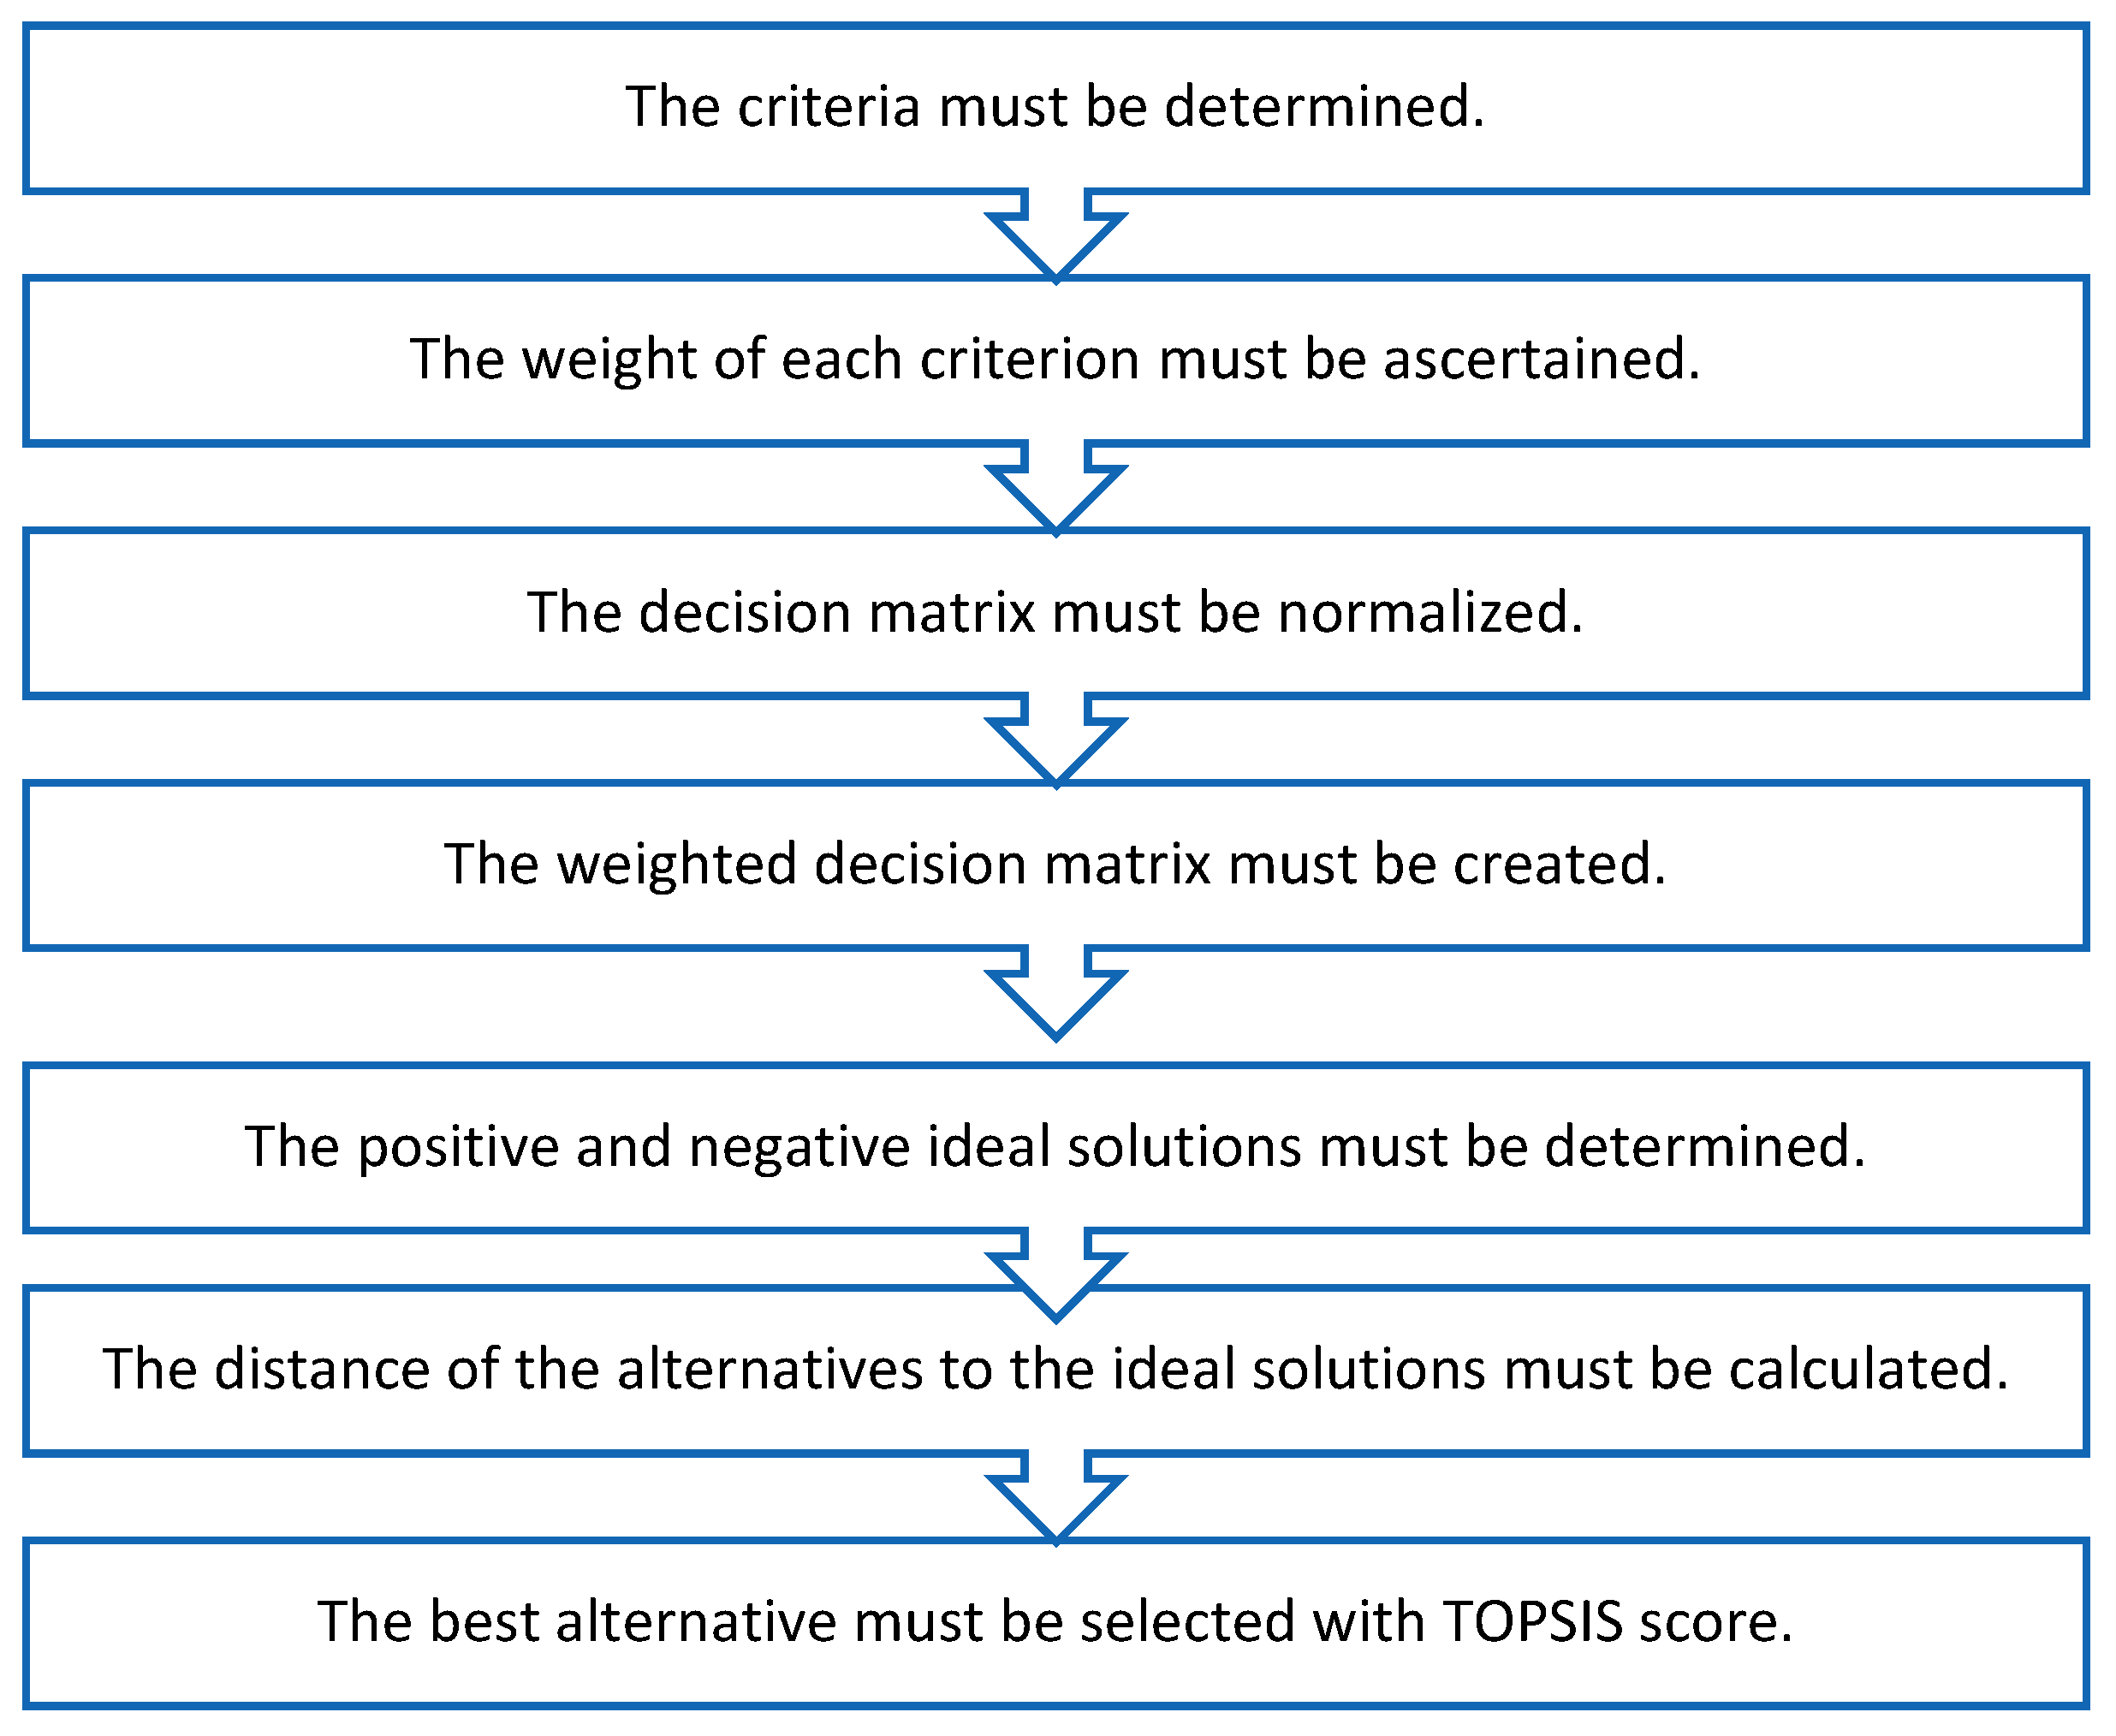
Determining the most suitable production method necessitates considering a multitude of criteria, the results of which are presented above. The initial phase of any multi-criteria decision-making (MCDM) method involves determining the criterion weights. It is crucial to acknowledge that these criterion weights can vary significantly among individuals or stakeholders, leading to different optimal decisions across various scenarios. The objective selection of the most effective production method and material through multi-criteria decision making consists of the following steps, as outlined in Figure 9:
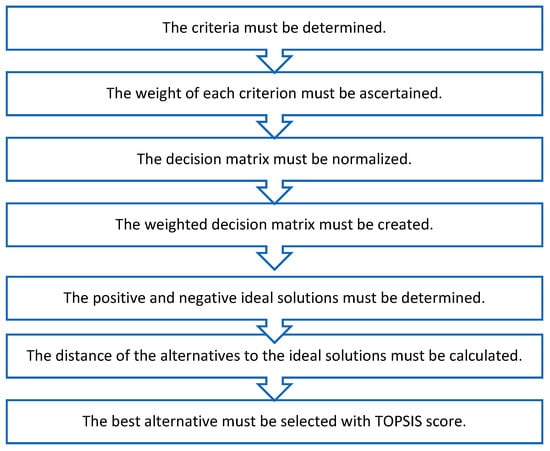
Figure 9.
Multi-criteria decision-making steps.
3.6.1. Criteria Determination
The selection of criteria for decision making is to be informed by the values measured in the experimental study, including compressive strength, surface roughness, dimensional accuracy, and cost.
3.6.2. Weight Determination of Each Criteria
The Analytical Hierarchy Process (AHP) method was employed to ascertain the relative importance of the criteria. Following the determination of the criteria, comparison matrices were generated. The scale presented in Table 5 was utilized to determine the relative importance of the criteria.
Table 5.
Scale comparison table.
The evaluation was conducted in accordance with the established scale comparison criteria, with the most significant criterion being the ability of the toy to withstand compressive forces exerted by both children and adults without breaking. The compressive strength of 1, representing its inherent durability, was identified as the paramount criterion. The cost of the toy was also deemed a crucial factor. While cost is not as consequential as the breakage of the part, it is nevertheless relevant when considering surface roughness and dimensional precision. Given that it is a toy part, surface roughness is not a primary concern; however, it is more significant than dimensional precision. In light of these evaluations, a table of criterion comparison values was created and is presented in Table 6.
Table 6.
Scale comparison criteria values.
First, the comparison matrix, also known as the AHP Matrix, is created in Equation (2).
The values in each column are then summed and given in Equations (3)–(6).
Sum (Column 1): 1 + 1/3 + 1/6 + 1/7 = 1 + 0.333 + 0.167 + 0.143 = 1.643
Sum (Column 2): 3 + 1 + 1/3 + 1/6 = 3 + 1 + 0.333 + 0.167 = 4.5
Sum (Column 3): 6 + 3 + 1 + 1/3 = 6 + 3 + 1 + 0.333 = 10.333
Sum (Column 4): 7 + 6 + 3 + 1 = 17
Then the sum of columns is given Equation (7).
Then the sum of columns = [1.643, 4.5, 10.333, 17].
By dividing each value by the column total, a normalization matrix is created and given in Equation (8).
Criterion weights are calculated by averaging each row and given in Equation (9).
Criterion Weight: [0.567, 0.267, 0.112, 0.054]
Accordingly, the criteria weights are
- Compressive strength: 56.7%;
- Cost: 26.7%;
- Surface roughness: 11.2%;
- Dimensional accuracy: 5.4%.
3.6.3. Formulation of the Decision Matrix (X) and Normalized Decision Matrix (R)
The values obtained following a series of experiments and rigorous testing are enumerated in Table 7.
Table 7.
Results of criteria.
Accordingly, the decision matrix, X, is created and given in Equation (10).
The norm of each column is calculated and given in Equations (11)–(14) below:
- Compressive strength (positive criteria, ↑):
- Surface roughness (negative criteria, ↓):
- Dimensional accuracy (negative criteria, ↓):
- Cost (negative criteria, ↓):
Normalization of the decision matrix (R), dividing by the square root of the sum of the squares of each column, is given in Equations (15) and (16).
3.6.4. Formulation of the Weighted Normalized Decision Matrix (V)
The criterion weight is given in Equation (17).
w = [0.567, 0.112, 0.054, 0.267]
The weighted normalized decision matrix is calculated according to Equations (18) and (19).
The result is given in Equation (20).
3.6.5. Determination of the Positive and Negative Ideal Solutions
Compressive strength is the positive criterion, with greater compressive strength being preferable. In the positive ideal solution given in Equations (21) and (22), the maximum of 0.3357 is utilized in the relevant column of the weighted normalized decision matrix given in Equation (20). As the smaller the other values, the better, these criteria are negative criteria, and the minimum values in the relevant columns are used in the weighted normalized decision matrix given in Equation (20) in the positive ideal solution given in Equations (21) and (22).
As demonstrated in Equations (23) and (24), in the negative ideal solution, the minimum value in the relevant column of the weighted normalized decision matrix (see Equation (20)) for the compressive strength opposite to the positive was taken, while the maximum values were taken for the others.
3.6.6. Determination of the Distances Positive and Negative Ideal Solutions
For each alternative, positive ()
and negative ()
distances are calculated in Equations (25) and (26).
The calculation for PLA-FDM is given in Equations (27) and (28).
The calculation for ABS-FDM is given in Equations (29) and (30).
The calculation for ABS-Inj. is given in Equations (31) and (32).
The results obtained by calculating for the alternatives are given in Table 8.
Table 8.
Distances to positive and negative ideal solutions.
3.6.7. Determination of the Similarity Values and TOPSIS Scores
The similarity coefficient is calculated in Equation (33).
The TOPSIS scores are calculated for different alternatives in Equations (34)–(36).
Likewise, as a result of the operations performed for 100 pieces and 1000 pieces, the following Table 9 was created.
Table 9.
TOPSIS scores of different alternatives.
Table 9 presents the calculated TOPSIS scores and other criteria for each alternative across varying cost values. The analysis reveals that when the cost is TRY 120, the “ABS-Injection” alternative exhibits optimal performance, achieving the maximum TOPSIS score. This outcome signifies that ABS-Injection is superior across multiple criteria, including high compressive strength, low surface roughness, high dimensional accuracy, and low cost.
However, as the cost significantly increases to TRY 1200 and TRY 12,000, the TOPSIS score for the ABS-Injection alternative decreases. This indicates that, at higher cost points, its superior performance in other criteria is unable to counterbalance the increased expense. Conversely, the “PLA-FDM” alternative demonstrates the highest TOPSIS scores when the cost is TRY 1200 and TRY 12,000. This suggests that PLA-FDM offers a more balanced performance and becomes the preferable option when cost escalation is a primary concern.
In conclusion, the ABS-Injection alternative is identified as the optimal choice in scenarios where cost reduction is a priority. Conversely, the PLA-FDM alternative emerges as the more favorable option in situations where cost escalation is a significant factor.
4. Conclusions
This study comprehensively evaluated the performance of toy parts manufactured using both plastic injection molding and Fused Deposition Modeling (FDM), offering valuable insights into their mechanical properties, dimensional accuracy, surface quality, and cost-effectiveness.
Our findings reveal significant differences in compressive strength. ABS parts produced via injection molding demonstrated the highest resistance, enduring 3.93 kN. This was followed by PLA parts printed with FDM at 2.97 kN, and then ABS-FDM parts at 0.95 kN. This superior performance of injection-molded parts is attributed to the inherent molding process, which effectively minimizes internal voids and promotes a denser, stronger structure. Microscopic analysis, particularly through SEM images, corroborated this, clearly showing a greater prevalence of voids and microstructural irregularities in 3D-printed parts, especially in ABS-FDM samples, likely due to incomplete layer bonding during extrusion. While ABS-FDM exhibited lower compressive strength, PLA-FDM performed comparatively better than ABS in the FDM process, suggesting its suitability for toy applications that do not demand high load-bearing capacity.
In terms of dimensional accuracy, injection-molded parts showed the closest adherence to the original CAD model. While 3D-printed parts, particularly those made from PLA, displayed more variation, their average deviation generally remained within acceptable limits for general use, indicating that FDM can produce dimensionally adequate parts for less stringent applications.
Surface roughness measurements further supported these observations. Molded parts consistently exhibited smoother finishes, whereas FDM parts displayed more visible layers and surface irregularities, with PLA prints showing particularly higher roughness values.
From a cost perspective, injection molding becomes economically advantageous at high production volumes due to its lower per-unit cost. However, this method necessitates substantial initial investments in expensive molds and specialized equipment. Conversely, for production quantities below approximately 735 pieces, 3D printing emerges as the more practical and cost-effective option, particularly when lower initial cost, faster setup times, and greater design flexibility are priorities.
Finally, our TOPSIS analysis provided a comprehensive decision-making framework by integrating all evaluated criteria. The results indicate that ABS-Injection molding ranks highest when large-scale, cost-effective production is the primary objective. In contrast, PLA-FDM proves to be the more favorable option in scenarios where low-volume production and limited budget are key concerns.
This study underscores that the optimal manufacturing method for toy parts is highly dependent on specific requirements related to mechanical performance, dimensional precision, surface quality, and most critically, production volume and cost constraints.
In summary, while injection molding remains the superior option for mass production demanding stringent mechanical and dimensional requirements, 3D printing—particularly with PLA—offers a viable alternative for small-batch manufacturing, rapid prototyping, or customized toy production.
Author Contributions
Conceptualization, Ş.D. and A.O.E.; methodology, Ş.D. and A.O.E.; software, Ş.D.; validation, Ş.D. and A.O.E.; formal analysis, Ş.D. and A.O.E.; investigation, Ş.D. and A.O.E.; resources, Ş.D.; data curation, Ş.D. and A.O.E.; writing—original draft preparation, Ş.D. and A.O.E.; writing—review and editing, A.O.E.; visualization, Ş.D.; supervision, A.O.E.; project administration, A.O.E.; funding acquisition, Ş.D. All authors have read and agreed to the published version of the manuscript.
Funding
This research received no external funding.
Data Availability Statement
The original contributions presented in this study are included in the article.
Conflicts of Interest
The authors declare no conflict of interest.
References
- Berman, B. 3-D printing: The new industrial revolution. Bus. Horiz. 2012, 55, 155–162. [Google Scholar] [CrossRef]
- Asadollahi-Yazdi, E.; Gardan, J.; Lafon, P. Integrated design in additive manufacturing based on design for manufacturing. In Proceedings of the ICMEM 2016: International Conference on Mechanical Engineering and Manufacturing, Toronto, ON, Canada; 2016; pp. 1–9. Available online: https://hal.archives-ouvertes.fr/hal-03609587 (accessed on 15 March 2022).
- Sood, A.K.; Ohdar, R.K.; Mahapatra, S.S. Parametric appraisal of fused deposition modelling process using the grey Taguchi method. Proc. Inst. Mech. Eng. Part B J. Eng. Manuf. 2009, 224, 135–145. [Google Scholar] [CrossRef]
- Alafaghani, A.; Qattawi, A.; Alrawi, B.; Guzman, A. Experimental optimization of fused deposition modelling processing parameters: A design-for-manufacturing approach. Procedia Manuf. 2017, 10, 791–803. [Google Scholar] [CrossRef]
- Daly, M.; Tarfaoui, M.; Chihi, M.; Bouraoui, C. FDM technology and the effect of printing parameters on the tensile strength of ABS parts. Int. J. Adv. Manuf. Technol. 2023, 126, 5307–5323. [Google Scholar] [CrossRef] [PubMed]
- Mendenhall, R.; Eslami, B. Experimental investigation on effect of temperature on FDM 3D printing polymers: ABS, PETG, and PLA. Appl. Sci. 2023, 13, 11503. [Google Scholar] [CrossRef]
- Wang, L.; Gramlich, W.M.; Gardner, D.J. Improving the impact strength of Poly(lactic acid) (PLA) in fused layer modeling (FLM). Polymer 2017, 114, 242–248. [Google Scholar] [CrossRef]
- Spoerk, M.; Gonzalez-Gutierrez, J.; Sapkota, J.; Schuschnigg, S.; Holzer, C. Effect of the printing bed temperature on the adhesion of parts produced by fused filament fabrication. Plast. Rubber Compos. 2018, 47, 17–24. [Google Scholar] [CrossRef]
- Benwood, C.; Anstey, A.; Andrzejewski, J.; Misra, M.; Mohanty, A.K. Improving the Impact Strength and Heat Resistance of 3D Printed Models: Structure, Property, and Processing Correlationships during Fused Deposition Modeling (FDM) of Poly(Lactic Acid). ACS Omega 2018, 3, 4400–4411. [Google Scholar] [CrossRef]
- Aloyaydi, B.A.; Sivasankaran, S.; Ammar, H.R. Influence of infill density on microstructure and flexural behavior of 3D printed PLA thermoplastic parts processed by fusion deposition modeling. AIMS Mater. Sci. 2019, 6, 1033–1048. [Google Scholar] [CrossRef]
- Vidakis, N.; Petousis, M.; Velidakis, E.; Liebscher, M.; Mechtcherine, V.; Tzounis, L. On the Strain Rate Sensitivity of Fused Filament Fabrication (FFF) Processed PLA, ABS, PETG, PA6, and PP Thermoplastic Polymers. Polymers 2020, 12, 2924. [Google Scholar] [CrossRef]
- Zhang, B.; Luo, Y.; Ma, L.; Gao, L.; Li, Y.; Xue, Q.; Yang, H.; Cui, Z. 3D bioprinting: An emerging technology full of opportunities and challenges. Bio-Des. Manuf. 2018, 1, 2–13. [Google Scholar] [CrossRef]
- Zhang, J.; Zhou, Z.; Zhang, F.; Tan, Y.; Tu, Y.; Yang, B. Performance of 3D-Printed Continuous-Carbon-Fiber-Reinforced Plastics with Pressure. Materials 2020, 13, 471. [Google Scholar] [CrossRef] [PubMed]
- Sezer, H.K.; Eren, O.; Börklü, H.R.; Özdemir, V. Additive manufacturing of carbon fiber reinforced plastic composites by fused deposition modelling: Effect of fiber content and process parameters on mechanical properties. J. Fac. Eng. Archit. Gazi Univ. 2019, 34, 663–674. [Google Scholar] [CrossRef]
- Er, A.O.; Aydınlı, O.M. Investigation of mechanical and physical properties of PLA and steel-added PLA filament materials used in melted filament manufacturing method. J. Fac. Eng. Archit. Gazi Univ. 2024, 39, 1285–1301. [Google Scholar] [CrossRef]
- Divyathej, M.V.; Varun, M.; Rajeev, P. Analysis of mechanical behavior of 3D printed ABS parts by experiments. Int. J. Sci. Eng. Res. 2016, 7, 116–124. [Google Scholar]
- Wojtyła, S.; Klama, P.; Baran, T. Is 3D printing safe? Analysis of the thermal treatment of thermoplastics: ABS, PLA, PET, and nylon. J. Occup. Environ. Hyg. 2017, 14, D80–D85. [Google Scholar] [CrossRef]
- Enemuoh, E.U.; Menta, V.G.; Abutunis, A.; O’Brien, S.; Kaya, L.I.; Rapinac, J. Energy and eco-impact evaluation of fused deposition modeling and injection molding of polylactic acid. Sustainability 2021, 13, 1875. [Google Scholar] [CrossRef]
- Mishra, V.; Negi, S.; Kar, S. FDM-based additive manufacturing of recycled thermoplastics and associated composites. J. Mater. Cycles Waste Manag. 2023, 25, 758–784. [Google Scholar] [CrossRef]
- Ahlbrandt, J.C. Mechanical Properties of Rapid Manufacturing and Plastic Injection Molding. Master’s Thesis, University of Missouri, Columbia, MO, USA, 2014. [Google Scholar]
- López, A.; Aisa, J.; Martinez, A.; Mercado, D. Injection moulding parameters influence on weight quality of complex parts by means of DOE application: Case study. Measurement 2016, 90, 349–356. [Google Scholar] [CrossRef]
- Makara Lay, M.; Thajudin, N.L.N.; Abdul Hamid, Z.A.; Rusli, A.; Abdullah, M.K.; Shuib, R.K. Comparison of physical and mechanical properties of PLA, ABS and nylon 6 fabricated using fused deposition modeling and injection molding. Compos. Part B Eng. 2019, 176, 107341. [Google Scholar] [CrossRef]
- Komal, U.K.; Kasaudhan, B.K.; Singh, I. Comparative performance analysis of polylactic acid parts fabricated by 3D printing and injection molding. J. Mater. Eng. Perform. 2021, 30, 6522–6528. [Google Scholar] [CrossRef]
- Podsiadły, B.; Skalski, A.; Rozpiórski, W.; Słoma, M. Are We Able to Print Components as Strong as Injection Molded?—Comparing the Properties of 3D Printed and Injection Molded Components Made from ABS Thermoplastic. Appl. Sci. 2021, 11, 6946. [Google Scholar] [CrossRef]
- Verdejo de Toro, E.; Coello Sobrino, J.; Martínez Martínez, A.; Miguel Eguía, V.; Ayllón Pérez, J. Investigation of a short carbon fibre-reinforced polyamide and comparison of two manufacturing processes: Fused deposition modelling (FDM) and polymer injection moulding (PIM). Materials 2020, 13, 672. [Google Scholar] [CrossRef] [PubMed]


Disclaimer/Publisher’s Note: The statements, opinions and data contained in all publications are solely those of the individual author(s) and contributor(s) and not of MDPI and/or the editor(s). MDPI and/or the editor(s) disclaim responsibility for any injury to people or property resulting from any ideas, methods, instructions or products referred to in the content. |
© 2025 by the authors. Licensee MDPI, Basel, Switzerland. This article is an open access article distributed under the terms and conditions of the Creative Commons Attribution (CC BY) license (https://creativecommons.org/licenses/by/4.0/).