Abstract
In pursuit of the Sustainable Development Goals (SDGs)’s objective of eliminating slum cities, the government of Indonesia has initiated a survey-based slum mapping program. Unfortunately, recent observations have highlighted considerable inconsistencies in the mapping process. These inconsistencies can be attributed to various factors, including variations in the expertise of surveyors and the intricacies of the indicators employed to characterize slum conditions. Consequently, reliable data is lacking, which poses a significant barrier to effective monitoring of slum upgrading programs. Remote sensing (RS)-based approaches, particularly those employing deep learning (DL) techniques, have emerged as a highly effective and accurate method for identifying slum areas. However, the reliance on RS alone is likely to encounter challenges in complex urban environments. A substantial body of research has previously identified the merits of integrating land surface data with RS. Therefore, this study seeks to combine remote sensing imagery (RSI) with street view imagery (SVI) for the purpose of slum mapping and compare its accuracy with a field survey conducted in 2024. The city of Bandung is a pertinent case study, as it is facing a considerable increase in population density. These slums collectively encompass approximately one-tenth of Bandung City’s population as of 2020. The present investigation evaluates the mapping results obtained from four distinct deep learning (DL) networks: The first category comprises FCN, which utilizes RSI exclusively, and FCN-DK, which also employs RSI as its sole input. The second category consists of two networks that integrate RSI and SVI, namely FCN and FCN-DK. The findings indicate that the integration of RSI and SVI enhances the precision of slum mapping in Bandung City, particularly when employing the FCN-DK network, achieving an accuracy of 86.25%. The results of the mapping process employing a combination of the FCN-DK network, which utilizes the RSI and SVI, indicate the presence of 2294 light slum points and 29 medium slum points. It should be noted that the outcomes are contingent upon the methodological approach employed, the accessibility of the dataset, and the training data that mirrors the distribution of slums in 2020 and the specific degree of its integration within the FCN network. The FCN-DK model, which integrates RSI and SVI, demonstrates enhanced performance in comparison to the other models examined in this study.
1. Introduction
Bandung, being Indonesia’s most populous city, is the dynamic urban centre and capital of West Java Province, which is located on the western part of Java Island. The city is renowned for its natural beauty, vibrant culture, and economic potential. However, the stark contrast between the rapid urbanization and the presence of slums in this metropolitan city is indicative of a significant socio-economic disparity. A significant proportion of Bandung’s population inhabits slums and squatter settlements, characterized by substandard living conditions and constrained access to fundamental infrastructure and utilities.
The expansion of housing and slums in Bandung City is an inevitable consequence of the city’s rapid population growth. As of 2023, the population of Bandung City comprised 2,569,107 people with a population density of 15,355/km2 [1]. Consequently, the necessity for adequate and secure housing and settlements is also rising, while the capacity of local and central governments to deliver infrastructure and utility facilities has not been able to keep pace. The government’s capacity to prevent and alleviate slum housing and settlements are constrained by the division of authority. According to Regulation of the Minister of Public Works and Housing Number 14/PRT/M/2018 of 2018 on Prevention and Quality Improvement of Slum Housing and Slum Settlements, the authority of the city government extends to slum areas with an area of less than 10 hectares, while those with an area between 10 and 15 hectares come under the jurisdiction of the provincial government. However, slum areas with an area of more than 15 hectares fall under the purview of the central government [2].
The assessment of slum areas in Indonesia, particularly in Bandung City, is predominantly the responsibility of local governments, which categorize these areas into “light slum” and “Medium Slum.” This classification is crucial for understanding the varying degrees of challenges faced by these communities. According to the Regulation of the Minister of Public Works and Housing Number 14/PRT/M/2018, light slums are identified by their substandard housing and infrastructure, which require basic improvements. In contrast, medium slums face more severe issues such as overcrowding and limited access to essential services, necessitating more comprehensive interventions [2].
A comprehensive understanding of slums is imperative for policymakers, researchers, and residents alike, as it facilitates the identification and resolution of the numerous challenges associated with slums. It is evident that there are common features observable in populations that are increasing in number, yet this is not being matched by an adequate supply of housing, land, or poor infrastructure. In many cases, residents often have no access to basic infrastructure and services. The classification of slum areas is delineated by the Regulation Number 14/2018 about the Prevention and Quality Improvement of Slum Housing and Slum Settlements promulgated by the Minister of Public Works and Public Housing. This classification is divided into three categories: light, medium, and heavy. The assessment is based on seven indicators, which are scored as follows: building, environmental, roads, drinking water supply, environmental drainage, wastewater management, waste management, and availability of fire protection. The categorization of slum districts as light, medium or heavy is predicated on infrastructural deficiencies, the gravity of the issue, and the infrastructure’s critical or vulnerable state. The classification of settlements as light slums denote the necessity for repairs to be conducted on basic infrastructure elements that are already in existence but are not adequately maintained. In the case of medium slums, the requirement is for the revitalization of settlements. Finally, in instances classified as heavy slums, the necessity arises for either relocation or reorganization through the intervention of government-sponsored programs.
The challenges confronting slum dwellers are manifold, encompassing housing and infrastructure that are vulnerable to flooding and other environmental hazards, resulting in unstable living conditions. Moreover, there is a paucity of clean water and proper and safe sanitation facilities. In addition, there are gaps in health services, limited educational opportunities, and economic disparities.
Slum mapping methodologies can be classified into three primary categories: survey-based, participatory, and remote sensing (RS)-based approaches [3]. While both survey-based and participatory methods demand significant human resources for effective implementation, RS-based techniques are less resource intensive in terms of fieldwork; however, they necessitate specialized expertise in remote sensing for accurate image interpretation [4]. The advantages of utilizing RS data include the ability to conduct regular updates and the capacity to gather information from aerial perspectives, which are particularly beneficial for areas that are otherwise difficult to access on the ground [5].
In recent years, high-resolution remote sensing technology has seen widespread application in the field of mapping and analyzing changes in land cover, as evidenced by numerous research studies [6]. This land cover change has been identified as a key indicator in the assessment of remote sensing slum mapping techniques, as the previous researchers have extensively explored its potential [3]. A conventional approach that has been employed is visual image interpretation, wherein experts manually delineate slums. While this method has been shown to produce highly accurate slum maps [7], it is inherently time consuming and its accuracy is dependent on the subjective perspectives of the experts involved. Consequently, disparities in boundary identification may emerge among different experts [8]. In instances where official delineations of slum areas are deemed to be obsolete or incompatible with contemporary realities, visual interpretation is frequently utilized as a means to validate boundaries defined by alternative methods.
An alternative to manual delineation is the Automatic Machine Learning (ML) method, which offers a systematic approach to defining slum boundaries using remote sensing imagery (RSI). Within this framework, Object-Based Image Analysis (OBIA) represents a specific subset of ML techniques designed for slum mapping [9]. This process begins with the segmentation of images, wherein adjacent pixels are clustered into ‘objects’ that correspond to significant features within the imagery, such as buildings and vegetation. Each object is characterized by attributes like size and shape, which are instrumental in identifying slum areas through a predefined set of rules [10,11]. However, the formulation of these rule sets poses challenges, as the morphological characteristics of slums can vary significantly both between and within urban areas [12].
It is evident that contemporary deep learning (DL) methodologies have become a prevailing trend within the domain of image classification, encompassing applications in the field of slum mapping. These advanced techniques utilize artificial neural networks to automatically learn features from data, with the potential to improve the accuracy and efficiency of slum identification in comparison to traditional methods. The integration of DL with existing ML approaches, such as Random Forest (RF), enables researchers to enhance the classification of image objects in complex urban landscapes. This combination of methodologies has been demonstrated to enhance the accuracy of slum mapping, while also circumventing the limitations frequently associated with rule-based OBIA techniques. Consequently, this approach provides a more robust solution for urban analysis [9,13].
Remote sensing imagery offers a broad perspective of a region but falls short in conveying intricate details that are essential for a comprehensive understanding of slum environments. It lacks the capacity to reveal specific characteristics such as the materials used in the wall construction, the number of stories in buildings, or the existence of open drainage systems within the community. To acquire this nuanced information, it is essential to conduct ground-level investigations through methods such as field surveys, interviews, focus groups, or by utilizing street view images (SVIs), which capture photographs from the ground perspective. Despite their potential, the application of SVIs in slum identification remains limited, as noted by [14].
Furthermore, the inherent limitations of SVIs must be acknowledged, as they primarily provide localized data or insights along well-traveled streets, thereby failing to generate comprehensive spatial representations of slum areas. For instance, in scenarios where access is restricted to pedestrian pathways, relying solely on SVIs becomes impractical, given that these images are typically captured from vehicles navigating the area. This constraint underscores the necessity for a multifaceted approach to data collection that encompasses various methodologies to accurately map and understand the complexities of slum regions accurately.
Meanwhile, Bandung City, characterized by a confluence of population pressure, economic inequality, inadequate governance of land and housing legality, and its basin geography, harbors a high degree of vulnerability to annual encroachment of slum areas. Bandung City Government has hitherto determined slum areas on a quinquennial basis through the utilization of a gradual field survey method. Nevertheless, given the potential for slum areas to expand on an annual basis, there is a need for more inclusive urban governance. Consequently, this research recommends the periodic and inclusive compilation of spatial data inventories to facilitate the effective targeting of slum upgrading initiatives. This inventory can be conducted using an integrated and regular method with a multi-resolution texture analysis method. This method has been developed to identify slums in remote sensing images [15]. Furthermore, the integration of remote sensing networks and street view imagery (SVI) for slum mapping in Jakarta City has been enhanced by employing deep learning networks, including the VGG method [16]. VGG is a convolutional neural network (CNN) that has become synonymous with its deep architecture, which consists of multiple layers. The efficacy of the system is particularly pronounced in image classification tasks, a phenomenon that can be attributed to its capacity to capture intricate features through the utilization of multiple convolutional layers [16,17]. The efficacy of remote sensing and the incorporation of street view imagery as a tool for mapping slums in Bandung City will be assessed through a comparative analysis with field survey results in several areas of the city in 2024.
The conditions described above were the catalyst for the author’s research on the spatial mapping inventory of potential slum areas in Bandung City with remote sensing and street view imagery and a comparative analysis of the effectiveness of this method as opposed to field surveys.
2. Study Area
As a city that has recently transformed into a metropolitan city, Bandung City covers an area of 167.31 km2 and is bordered by Bandung Regency and West Bandung Regency to the north, Bandung Regency to the east and south, and West Bandung Regency and Cimahi City to the west [18]. Bandung, which is located at an altitude of 700 m above sea level, is a charming city. The highest point of the city is in Ledeng Village, Cidadap Sub-district, with an altitude of 892 m above sea level, while the lowest point is in Rancanumpang Village, Gedebage Sub-district, which has an altitude of 666 m above sea level. As can be seen in Figure 1, the city is divided into 30 sub-districts, which consist of 151 villages. Among them, Gedebage is the largest sub-district, covering an area of 9.58 km2, while Astanaanyar is the smallest sub-district with an area of only 2.89 km2 [1].
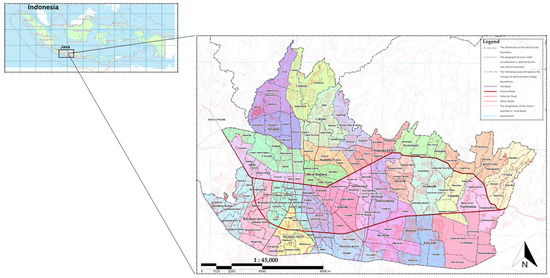
Figure 1.
Administrative map of Bandung City, Indonesia, highlighting urban villages and sub-districts. Reproduced with permission from Government of Bandung City. Document: Urban Slum Prevention and Upgrading Plan; published by the office of the Bandung City housing and settlement area, 2023 [19].
In addition, Bandung City has a unique geographical shape, located in a basin surrounded by mountains and hills. This uniqueness has significant impacts on its climate, urban planning, environment, and development issues. While Bandung has a mild climate and fertile soil, the basin also causes some serious problems. Air pollution is common as it is difficult for the air to escape the basin, and river blockages cause flooding and lead to poor drainage. The city is also exposed to the effects of urban heat and is experiencing an expansion of hillside slums. Therefore, integrated urban planning is urgently needed to prevent the growth of slums in Bandung City, which is fueled by the rapid increase in population density each year. One comprehensive urban planning effort involves mapping slum areas and taking appropriate preventive measures.
3. Materials and Methods
The systematic approach to identifying potential housing and slum areas, along with the integration of the smart city concept, begins with conducting interviews with policymakers and members of the local community. Primary data will be derived from a combination of surveys, remote sensing imagery, street view imagery, and interviews, while secondary data will undergo a further analysis to facilitate the creation of spatial maps.
The resulting spatial mapping is intended to inform the development of slum improvement strategies that align with the larger objectives of establishing a sustainable urban environment in Bandung City. This comprehensive methodology underscores the importance of collaborative input and data-driven analysis to address urban challenges and improve living conditions within the city.
3.1. Datasets
3.1.1. Slum Reference Map
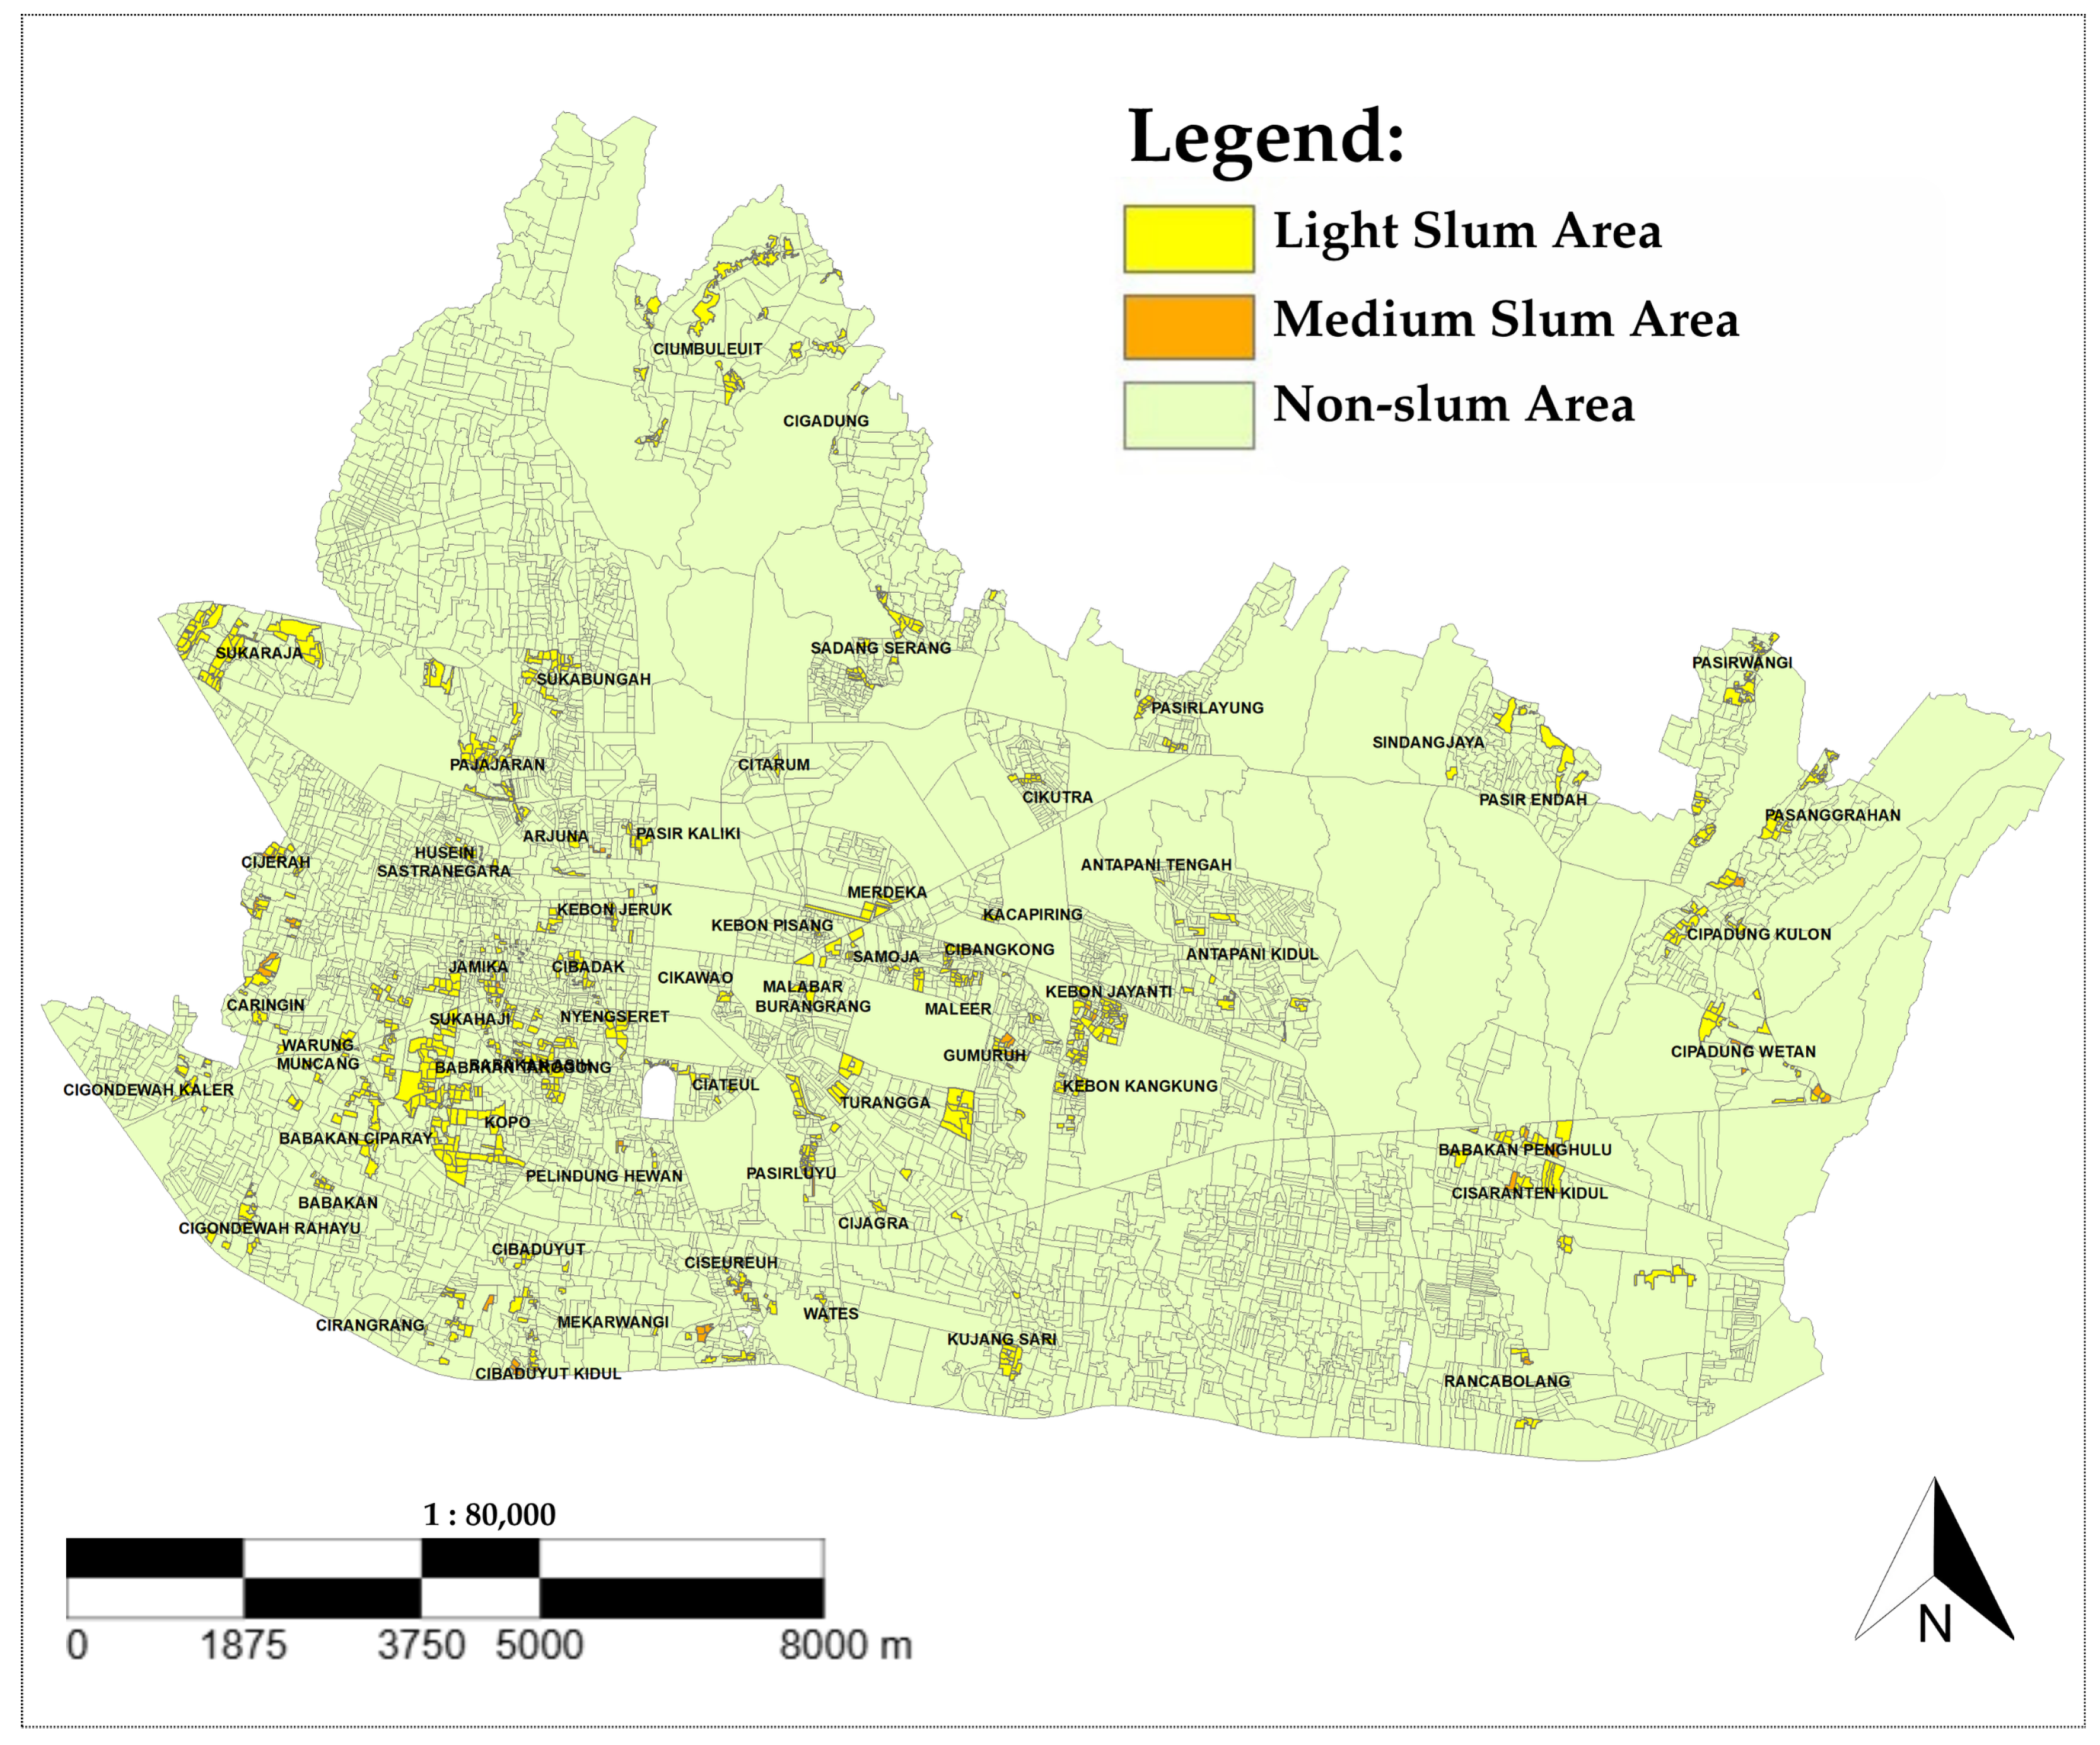
Bandung City Government has undertaken a systematic mapping of areas classified as slum housing and settlements, adhering to the criteria established in the Ministry of Public Works and Public Housing Regulation Number 14 of 2018, which focuses on the prevention and improvement of the quality of slum housing. The Mayor of Bandung’s Decree Number: 648/Kep.1227-DPKP3/2020 delineates specific locations of slum housing, revealing a diverse range of conditions across the city. Notably, light slum areas encompass approximately 474.0809 hectares across 44 urban villages, while medium slum areas account for 17.865 hectares within 19 urban villages. The Sukahaji urban village in the Babakan Ciparay sub-district has been identified as the largest slum area, covering 30.85 hectares, underscoring the persistent challenges that the Bandung City Government must navigate in its efforts to address slum conditions effectively. Additionally, a detailed inventory of slum areas has been compiled and is available as per the Mayor’s Decree.
The 2020 slum mapping data depicted in Figure 2, which is based on Bandung’s mayor’s regulation, is used in the slum classification modeling process. This data consists of two main categories: ‘light slum’ and ‘medium slum.’ Of the available data, 859 sub-districts fall into the ‘light slum’ category, while only 44 fall into the ‘medium slum’ category.
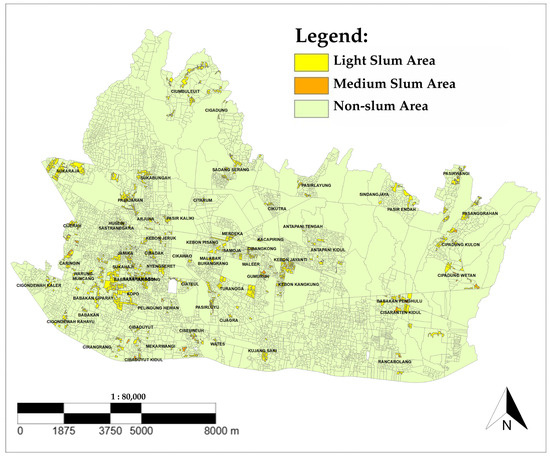
Figure 2.
Official slum reference map of Bandung City (2020), categorizing areas into light and medium slums based on governmental criteria. Reproduced with permission from Government of Bandung City, The Mayor of Bandung’s Decree Number: 648/Kep.1227-DPKP3/2020; published by the office of the Bandung City housing and settlement area, 2020 [20].
In addition, we integrated key slum indicators developed by governmental bodies and academic sources to establish a comprehensive definition of slum areas, along with a corresponding set of indicators. Additionally, the official reference map was adjusted in accordance with this definition, as elaborated in the subsequent Data Preparation Section. This modified map served as a benchmark for evaluating the accuracy of slum maps generated through remote sensing imagery and street view imagery utilizing a deep learning network [16].
3.1.2. Remote Sensing Imagery
Sentinel-2 is a remote sensing satellite system that comprises two satellites, Sentinel-2A and Sentinel-2B, which operate in a synchronized 180-degree orbit. These satellites are equipped with a Multispectral Instrument (MSI), a sophisticated sensor capable of capturing data across 13 spectral bands, spanning the visible, near-infrared, and shortwave infrared regions of the electromagnetic spectrum (European Space Agency, 2023). A significant benefit of the Sentinel-2 system is its impressive spatial resolution, achieving 10 m for the blue, green, and red bands, and 20 m for the near-infrared and shortwave infrared bands [21]. The imagery produced by the Sentinel-2A MSI provides a detailed representation of urban areas, characterized by high pixel resolution that enhances clarity. To maximize the effectiveness of this imagery, a smoothing process is employed, utilizing the original image from the Sentinel-2A MSI. This process is crucial for refining the visual quality of the built-up land observed, as the high pixel values in the Sentinel-2A MSI image facilitate a clearer depiction of urban landscapes.
The classification of slum areas in Bandung City using Sentinel-2A imagery was facilitated by the efficacy of several spectral indices, a consequence of the city’s diverse land cover, which includes vegetation, buildings, and tributaries. The Normalized Difference Built-up Index (NDBI) has been identified as a reliable indicator of residential areas, while the Normalized Difference Vegetation Index (NDVI) has been shown to be a valid metric for assessing vegetation cover, particularly in contexts where vegetation is sparse, as is often the case in slum areas. The Normalized Difference Water Index (NDWI) and the Modified NDWI (MNDWI) have been demonstrated to be significant in the identification of water bodies in proximity to slum areas, with the MNDWI exhibiting superior accuracy in urban contexts. The Enhanced Vegetation Index (EVI) and Soil-Adjusted Vegetation Index (SAVI) have been utilized to differentiate between slum and non-slum areas, with the former being particularly effective in discerning these distinctions based on soil brightness. In conclusion, the Urban Index (UI) is employed to map urban areas and building density. The integration of these indices with machine learning algorithms has the potential to enhance the precision of slum classification, thereby facilitating urban planning initiatives.
3.1.3. Ancillary Data
Supplemental datasets cover the road network, the footprint of buildings, and zoning information, which are available in the shape file format on the official website of the city of Bandung government [22]. It is important to clarify that these datasets were utilized to enhance the reference data rather than serving as direct inputs for the deep learning algorithm employed in the analysis.
The first of these additional datasets pertains to the road network derived from the neighbourhood road database as of 2021. This dataset includes a shape file accompanied by attribute tables that provide detailed information on road length, width, condition, type, and section codes. The insights gained from road condition data are instrumental in identifying suitable locations for SVI downloads and facilitating the slum classification assessment process.
The second dataset focuses on the density of the buildings as described in The Spatial Planning and Detailed Plans of Bandung City [18]. This shape file provides critical information regarding the area of each building, the total number of buildings, and the density expressed in units per square meter. These data are essential to compare the density of the buildings with the official 2020 slum reference map, which has been validated by the West Java Regional Settlement Infrastructure Agency.
The third piece of supporting evidence derives from a survey conducted in 2024, which focused on potential housing and slum areas, adhering to the indicators and procedures established for slum verification as outlined in Indonesian regulations. Specifically, this includes the Regulation of the Minister of Public Works and Public Housing Number 14 of 2018 and the Circular Letter of the Minister of Public Works and Public Housing Number 41 of 2021. The data obtained from this survey were instrumental in refining the slum reference layer, thereby delineating zones characterized by illegal occupancy. Consequently, residential structures within these designated areas often develop informally, contributing to the expansion of larger slum environments.
3.1.4. Street View Imagery
A systematic grid was established to catalog latitude and longitude in meters, facilitating the retrieval of street view imagery (SVI). By employing these geographic coordinates, images were sourced from the Google Street View Static API, capturing visuals in all four cardinal directions: north, south, east, and west. Figure 3 illustrates the SVI acquired from one of the slum regions in Bandung City, as referenced in the official slum map for the year 2025.
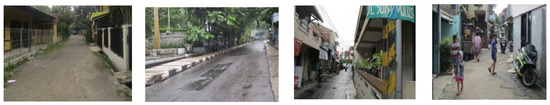
Figure 3.
Example of street view imagery (SVI) captured from a slum area in Bandung City, illustrating ground-level conditions.
Random points were created along the network of minor and branch roads, ensuring a roughly equal distribution between slum and non-slum regions based on the modified slum reference data, utilizing the “random points along line” function in QGIS. To maintain clarity in deep learning classification, points located at the interface of slum and non-slum areas were omitted. This exclusion specifically pertained to points associated with priority slums identified in SVI images, which included slum areas exceeding 10 hectares. These encompassed urban villages such as Sukaraja, Ciumbuleuit, Sukahaji, Pajajaran, Cijerah, Babakan, Babakan Ciparay, Kopo, Pasirwangi, Jamika, Sukabungah, Kebon Jayanti, Sadang Serang, Cibangkong, and Babakan Asih. Ultimately, the dataset comprised 2904 random points for slum areas and 420 for the database of neighborhood roads throughout Bandung City that were developed to prevent the growth of housing and slum areas, as depicted in Figure 3.
The collection of these randomly generated point locations is referred to as Google street view (GSV) locations. In total, 2904 images were acquired for slum areas, while 420 images were obtained for neighborhood roads in Bandung City residential area, although some GSV locations yielded no images. Each SVI was meticulously reviewed for any anomalies, with images that were excessively dark or captured from within buildings being excluded from the dataset. The final compilation thus included 3324 images representing both slum and non-slum areas.
3.2. Methodology
The research workflow is divided into three distinct phases, as illustrated in Figure 4. The initial step involved identifying the slums within the study area, which included refining the slum reference map through the utilization of remote sensing imagery (RSI), street view imagery (SVI), and additional data sources. The next phase focuses on implementation, which includes three main components: experimental model design, data pre-processing, the implementation and mapping of the design of the slum area. Finally, the third phase entails a comparative analysis of the accuracy values derived from various models, including a comparison with the results of the field survey mapping design.
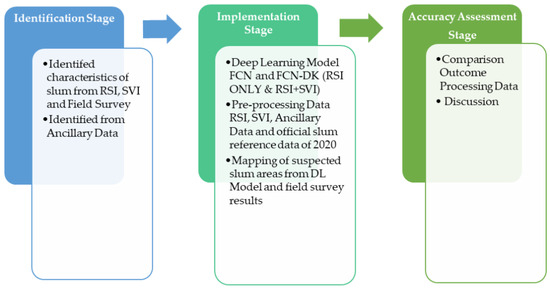
Figure 4.
Methodological workflow for slum mapping, integrating remote sensing, street view imagery, and field surveys.
The present research is constrained by the Bandung City Government’s 2020 designation of slum areas and the 2024 field survey results, due to the limited legal slum area mapping database inventoried by the Bandung City Government.
The chosen deep learning framework is a Fully Convolutional Network (FCN), selected on the basis that it is considered to be appropriate for the available dataset. The FCN framework is capable of processing images of various dimensions, with no limitation to a specific dimension. The primary function of this model is to perform segmentation and generate predictions at the pixel level. This render is highly suitable for the segmentation of urban areas based on the Sentinel imagery [19,20]. Furthermore, the FCN model is distinguished by its comparatively modest parameter count, a feature that stands in contrast to architectures such as fully connected networks. This design choice is intended to guarantee the model’s enhanced efficiency and processing speed.
3.2.1. Identification Stage
The characteristics of slums were delineated through an extensive examination of the existing literature and regulatory frameworks pertaining to slum housing and conditions. This examination encompassed the identification of indicators established by various governmental bodies at global, national (specifically Indonesia), and local (Bandung City) levels, aimed at defining slum characteristics. Furthermore, the academic literature focused on the local context of Bandung City was reviewed to gain insights into the specific definitions of slums as they pertain to the unique attributes of different areas within the city. Additionally, this research incorporated interviews with stakeholders, possessing significant local knowledge which greatly enhanced the understanding of slum characteristics within the Bandung context. Drawing from these findings and the insights gained from local experts, a comprehensive overview of identifiable slum characteristics was developed, utilizing the Remote Sensing Imagery (RSI), Street View Imagery (SVI), and supplementary data. These identified characteristics serve as a foundation to conceptualize the notion of slums for the purposes of this study. The subsequent Table 1 illustrates the transformation of the selected slum characteristics into relevant mapping indicators.

Table 1.
Conversion of slum characteristics into mapping indicators for modifying the 2020 official slum reference map.
3.2.2. Implementation Stage
Data Preparation
The pre-processing of the data involves two distinct phases. Initially, the official slum reference map from 2020 underwent an update based on the slum characteristics outlined in Table 1. This first phase set the groundwork for generating the dataset that would be used for both training and testing in the subsequent phase.
During the initial phase of data pre-processing, it was also noticed that certain areas in the 2020 official slum reference map were not completely comparable with the slum definitions used in this study as the parameters used in this study matched the features available in the remote sensing imagery. The official map included various developed regions, green spaces, high-rise residential buildings, and industrial zones, which were inaccurately classified as slums. This discrepancy likely arises from the temporal difference between the classification input data, which was collected in 2024, and the slum reference data from 2020. Consequently, the 2020 slum reference map was revised according to the specific slum definition and indicators presented in Table 1. As a result, some areas that were previously categorized as slums in the official map were reclassified, while others that displayed slum characteristics as recognized by local experts were designated as an unknown category of slum. The modified slum map formed the basis for creating high-quality training and testing datasets for further analysis, as illustrated in the accompanying Figure 4.
The second phase of data pre-processing was dedicated to preparing the data suitable for deep learning frameworks, particularly the Fully Convolutional Network (FCN). In this phase, the study area was methodically segmented to achieve a balanced representation of the two classes, slum and non-slum, derived from the existing dataset, thereby promoting a diverse dataset. This stage aims to partition the extensive study area in Bandung City into smaller segments, facilitating easier processing while ensuring that a balanced representation of classes. This includes both remote sensing imagery and ground truth data, with a designated number of tiles allocated for training and a separate number reserved for testing the proposed FCN network.
Machine Learning Model
Persello and Stein developed a Fully Convolutional Neural Network with a Dilated Kernel (FCN-DK) specifically for the purpose of slum mapping [23]. Among the various models within this network framework, the Fully Convolutional Network (FCN) has demonstrated a higher level of effectiveness relative to its counterparts. Consequently, the FCN model is employed for the identification of slum areas utilizing remote sensing imagery (RSI) alongside a combination of RSI and street view imagery (SVI). Prior studies have investigated urban land use classification by merging RSI with SVI through the FCN-VGG16 architecture; however, this approach is hindered by significant computational demands when compared to the standard FCN [14]. Therefore, this research focuses exclusively on the implementation of FCN and FCN-DK models.
The FCN-DK architecture employs a dilated convolution method, which effectively broadens the receptive field while simultaneously reducing the number of learnable parameters, thus mitigating the risk of over-fitting [24]. This characteristic makes FCN-DK particularly appealing for applications that require efficient learning from complex datasets. Despite its advantages, the application of FCN-DK in integrating datasets from varying perspectives—specifically, aerial views from RSI and ground-level images from SVI—remains under-explored.
This research gap presents a valuable opportunity to investigate the potential of FCN-DK in synthesizing these distinct types of data for enhanced urban analysis. By leveraging the strengths of both aerial and ground-level imagery, this study aims to contribute to a more nuanced understanding of urban environments, particularly in identifying and analyzing slum areas. The findings could pave the way to more effective urban planning and policymaking, addressing the challenges associated with urbanization and its impact on marginalized communities.
Classification Using Only RSI
The FCN-DK model was trained using randomly selected initial weights and a maximum of 100 epochs. Validation accuracy was monitored using the Early Stopping technique with a patience of 10 epochs. This means that if there was no improvement in validation accuracy over the previous 10 epochs, training would stop. However, the model continued to run for the full 100 epochs, as the validation accuracy did not remain constant for 10 consecutive epochs. Detailed information regarding the network configuration parameters for training the FCN-DK model can be seen in Table 2.
Table 2.
Network configuration parameters for training the FCN-DK model.
To classify urban scenes from street view imagery in Bandung City, a pre-trained CNN model was adapted. The adaptation involved freezing the first five convolutional layers and fine-tuning only the final classification layer. The Early Stopping technique was used to monitor validation accuracy during ten epochs of training. Training a CNN from scratch requires significant time and access to extensive datasets, making pre-training and adaptation a more resource-efficient approach.
Classification Using an Integration of SVI with RSI
In this study, the authors adopt a methodology that merges data obtained from Google street view (GSV) images with remote sensing imagery (RSI) to create a spatially continuous feature map, similar to the work conducted by previous researchers in a different context within Jakarta City [16]. The initial phase involves extracting features from GSV images through a tailored Convolutional Neural Network (CNN). While prior studies have indicated that Principal Component Analysis (PCA) can be advantageous for reducing the dimensionality of the extracted features [16], the authors caution that an overly limited selection of principal components may inadvertently discard valuable information. Thus, it is crucial to carefully determine the appropriate number of principal components, as slum indicators encompass not only road conditions, but also various other factors, including drainage, sanitation, waste management, and fire safety.
Subsequently, new data points were generated in the cardinal directions—north, south, east, and west—surrounding each GSV location, leading to the creation of distinct feature maps. The final step involved integrating these synthesized feature maps with RSI, culminating in a holistic representation of the urban environment. This approach effectively harnesses the detailed insights provided by GSV imagery while capitalizing on the extensive spatial coverage afforded by RSI, thereby yielding significant contributions to urban environmental analysis.
Classification Using Field Survey
In this research, slum classification is conducted using field surveys to identify slums, which involves assessing various indicators such as housing quality, infrastructure, and living conditions. The field survey is based on an existing guideline to evaluate and improve settlements to enhance living standards and prevent further slum development, namely the Minister of Public Works and Housing Regulation Number 14/2018.
The 2024 slum survey yielded 435 points, categorized as ‘light slum’, and 27 points, categorized as ‘medium slum’. The total area encompassed by these points was 248.38 ha, dispersed across 27 sub-districts, 72 urban villages, and 142 areas. Following the survey, the data will undergo a rigorous process of evaluation and validation, with reference to the 2020 slum reference map of Bandung City, to ensure the accuracy and integrity of the results.
3.2.3. Accuracy Evaluation
In this research, the effectiveness of a model was assessed through a range of metrics, including recall, precision, F1 score, intersection over union (IoU), overall accuracy (OA), and the kappa coefficient. However, it was determined that the kappa coefficient and OA were insufficient for accurately measuring model performance in contexts such as image classification and slum mapping [25], primarily due to inherent limitations. Consequently, the investigation prioritized the evaluation of model outcomes through recall, precision, F1 score, and IoU, with accompanying equations provided to illustrate the calculation of these metrics. Furthermore, the accuracy was analyzed for each category of slum identified in the revised slum reference data. The research particularly highlighted the significance of the F1 score and IoU, as the F1 score effectively integrates both precision and recall, while IoU serves as a widely recognized accuracy metric in the realm of computer vision challenges [26].
Note: P: precision, R: recall, : true positive, : false positive, and : false negative.
Integrating spectral indices with deep learning can improve classification accuracy. The effectiveness of the models can be evaluated using metrics like precision, recall, F1 score, and intersection over union (IoU). High precision indicates a strong ability to correctly identify positive classifications, while high recall shows the model’s capacity to detect relevant instances. An acceptable F1 score (above 0.7) and IoU (above 0.5) further validate the model’s performance in accurately classifying slum areas. This combination enhances classification accuracy and aids in urban planning and policy development for slum improvement.
4. Results
The performance metrics for the four slum classification networks utilized in this research are detailed in Table 3. The findings for the various models were tested using Equations (1)–(3), the results of which indicated that a model utilizing solely remote sensing imagery (RSI), specifically the Fully Convolutional Network (FCN), attained an intersection over union (IoU) of 57.28. In contrast, the FCN with Deep Kernel (FCN DK) recorded an IoU of 54.47, while the network that combines both RSI and street view imagery (SVI), referred to as FCN-DK, attained an IoU of 86.01, and the standard FCN reached an IoU of 78.89. Notably, the FCN-DK model, which integrates both types of imagery, demonstrated superior accuracy relative to the FCN alone, achieving the highest F1 score and IoU. This enhancement in performance can be attributed to a 1.83% increase in recall when comparing the FCN-DK to the FCN.
Table 3.
Accuracy metrics (precision, recall, F1 score, IoU) for four experimental setups: FCN (RSI only), FCN-DK (RSI only), FCN (RSI + SVI), FCN-DK (RSI + SVI), and field survey results.
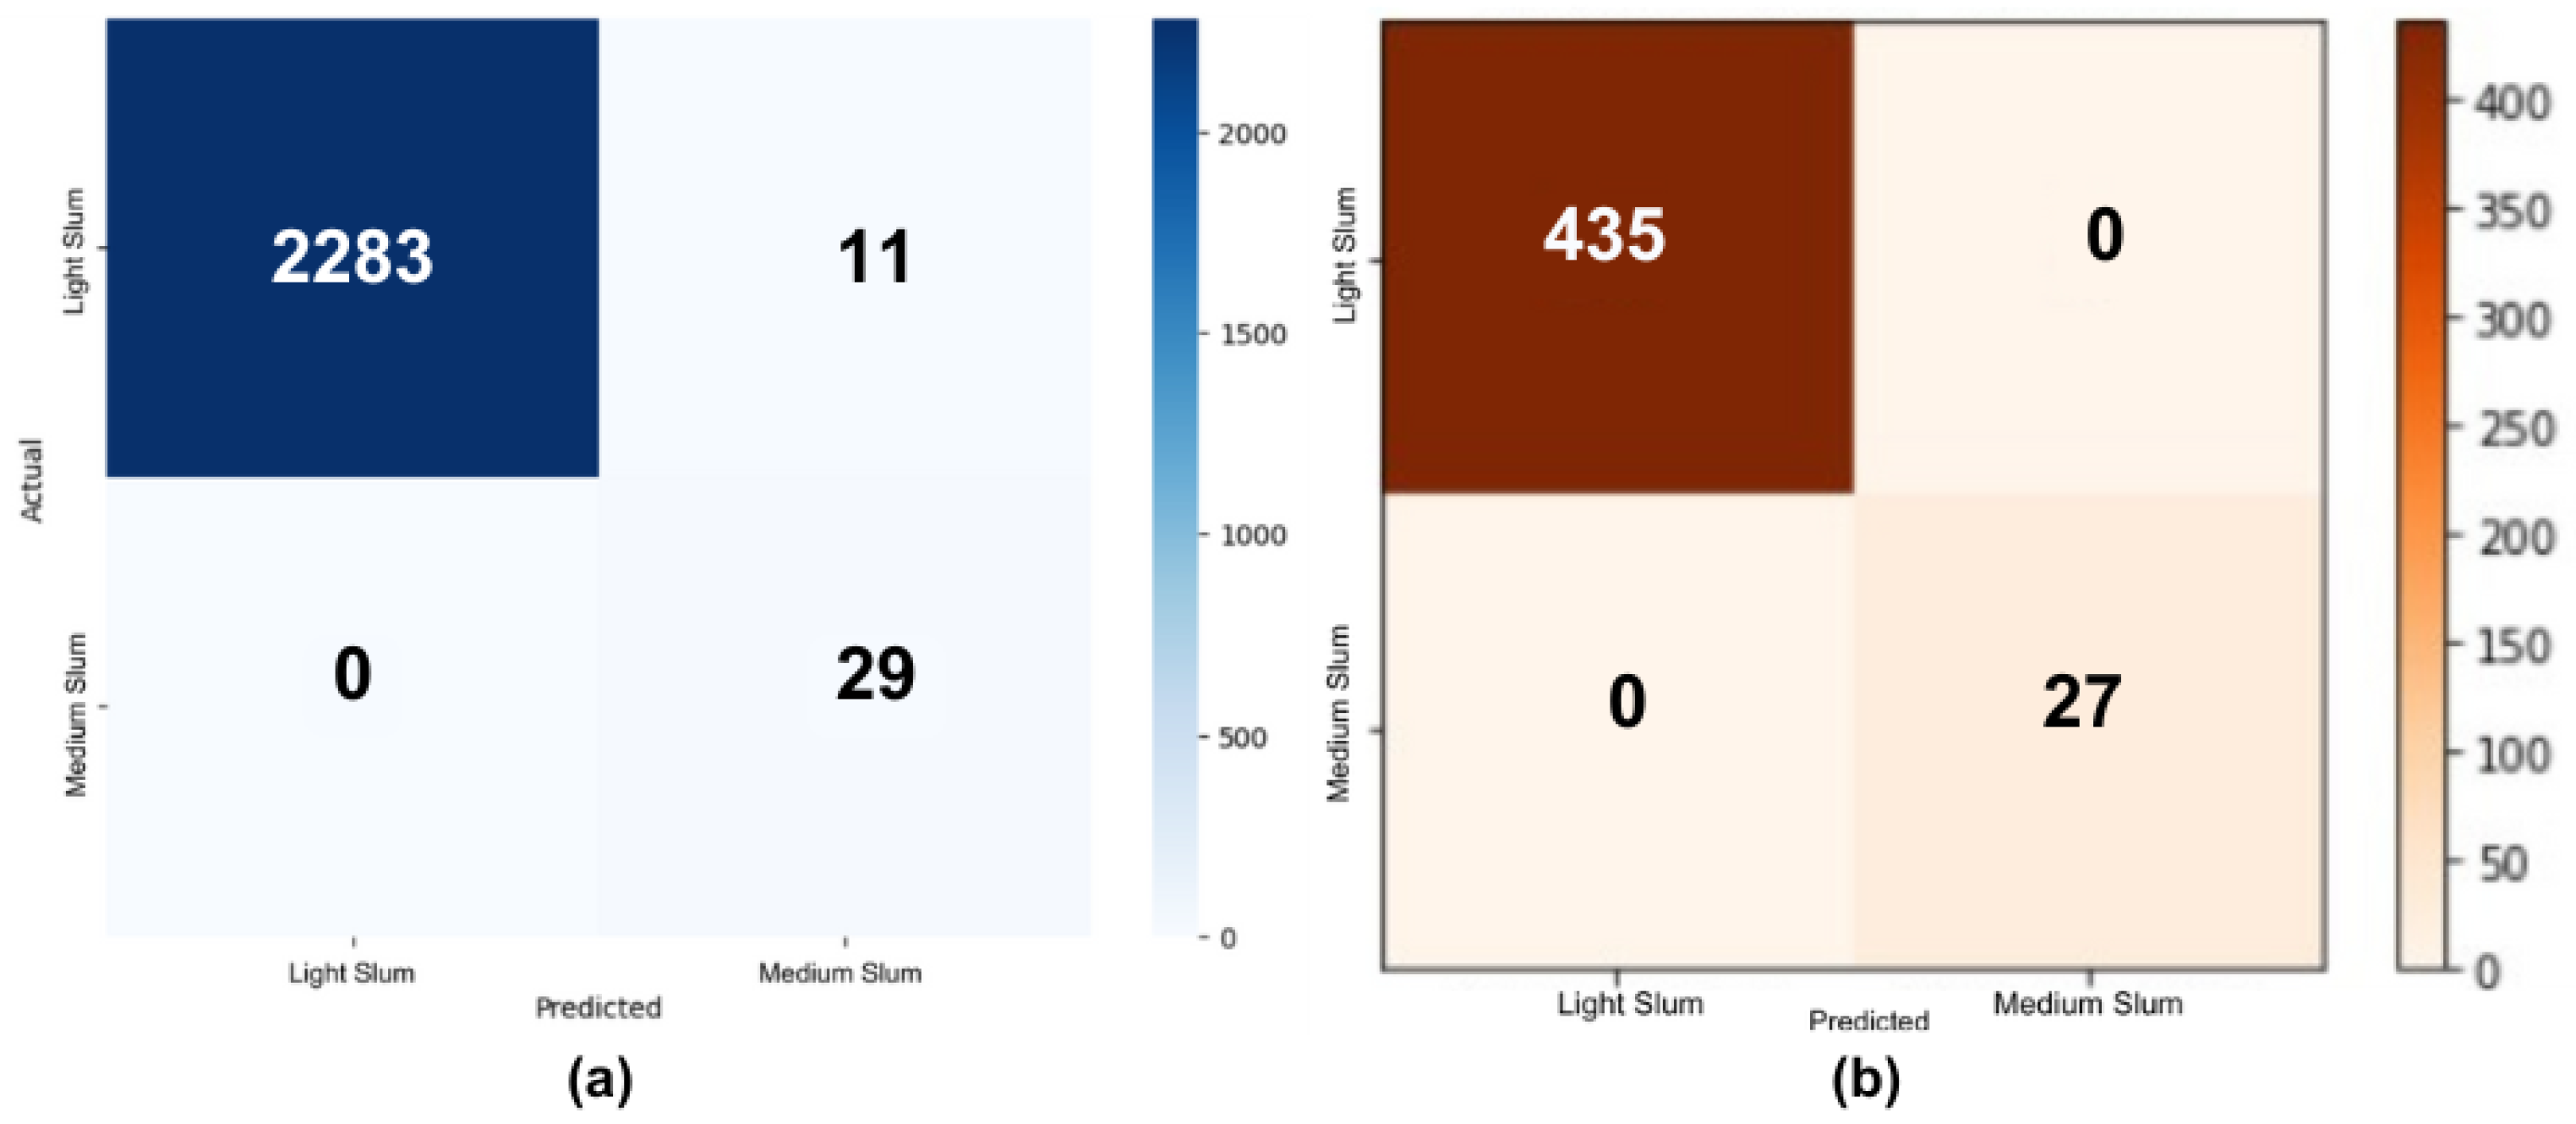
Concurrently, the field survey results were subjected to testing using decision tree modeling. The results of the model evaluation on the 2024 survey data demonstrated outstanding classification performance, attaining perfect accuracy. As demonstrated by the confusion matrix, the 435 samples classified as ‘light slum’ and the 27 samples designated as ‘medium slum’ were accurately identified, with no errors observed in the prediction process. This finding underscores the survey’s high reliability, even when evaluated on unseen data.
A comparison of the confusion matrix of FCN-DK (RSI + SVI) model results with field survey results in Figure 5 reveals that the former processed a substantially larger dataset of 2323 samples in comparison to the 462 samples utilized in the field survey. In the context of slum classification, the FCN-DK model demonstrated a 99.5% accuracy rate by accurately categorising 2283 light slum areas, with a mere 11 misclassifications as medium slum areas. In contrast, the field survey exhibited a perfect classification of all 435 light slum areas, attaining 100% accuracy. For medium slum classification, the FCN-DK model correctly identified 29 medium slum areas with no misclassification, while the field survey identified 27 medium slum areas, also with no misclassification.

Figure 5.
Confusion matrix comparing classification accuracy of (a) FCN-DK (RSI + SVI) and (b) field survey results.
Both methodologies demonstrate impressive efficacy in accurately identifying medium slum areas, achieving a remarkable zero false negatives, meaning that there were no instances where medium slum areas were incorrectly classified as light slum in either approach. This indicates a high level of precision in the classification process. Notably, the FCN-DK model exhibits a slight inclination toward misclassification, which can be interpreted as a conservative approach. This tendency results in a higher likelihood of categorizing certain areas as higher-density slums rather than overlooking genuine slum regions. Such a strategy may prioritize the identification of at-risk populations, ensuring that no significant slum areas are overlooked, even if it leads to some over-classification.
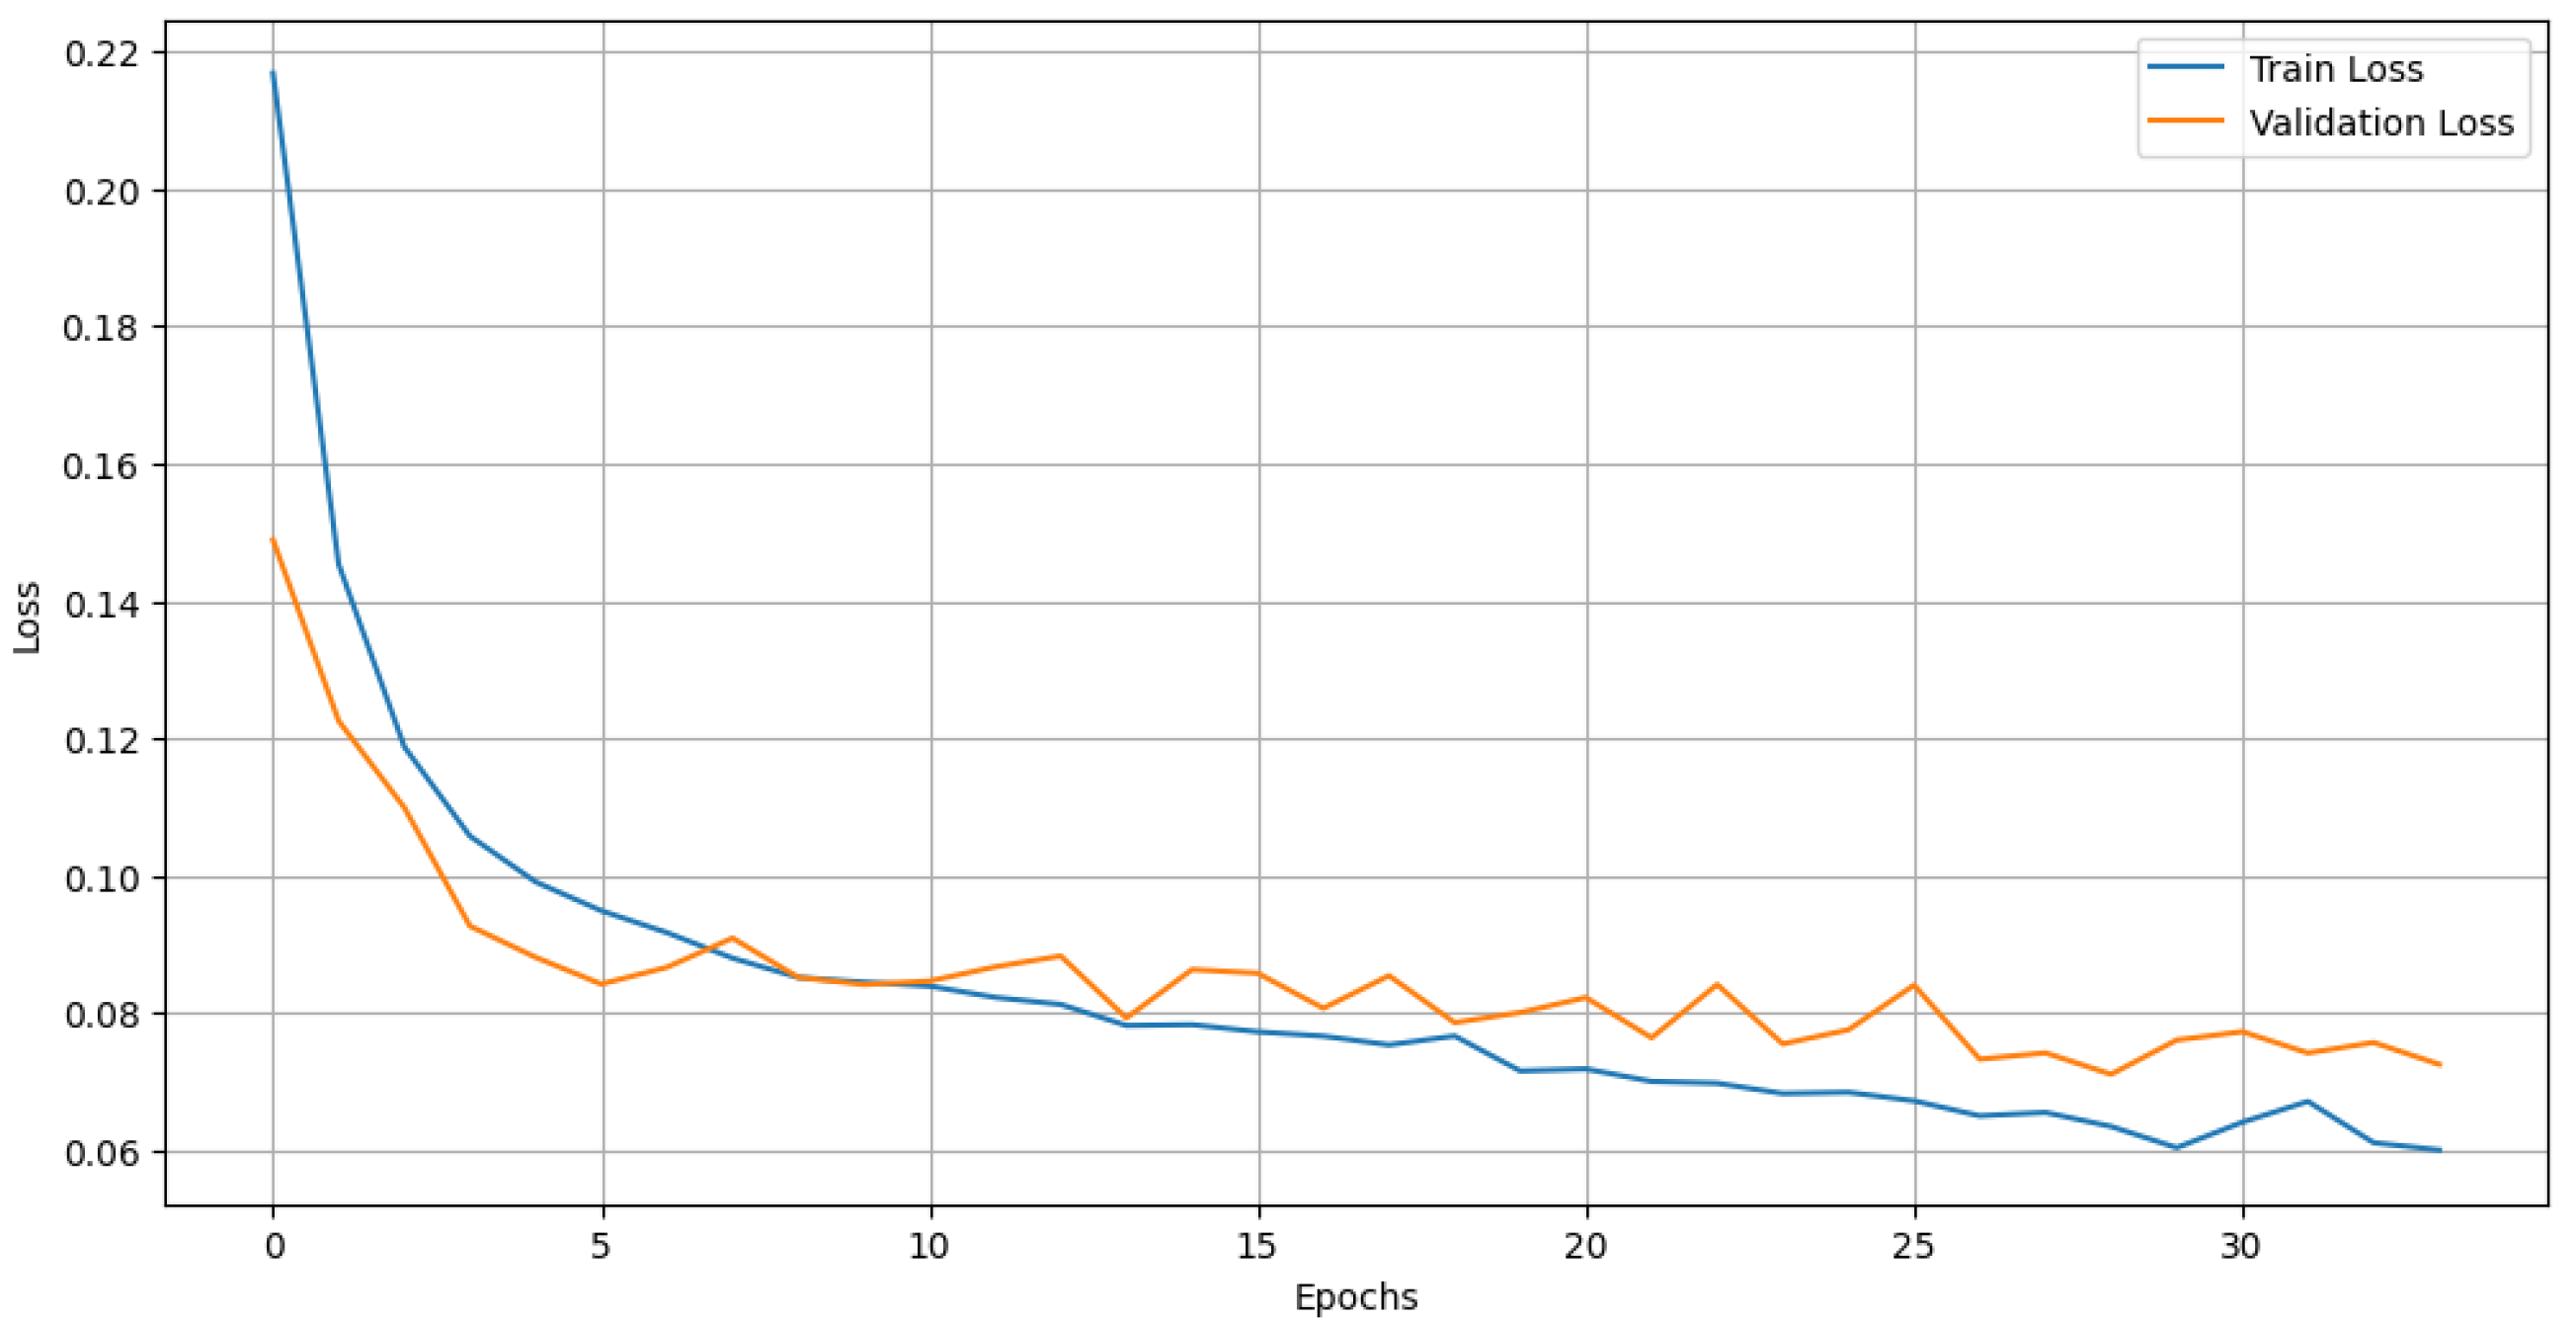
This effective classification performance is further supported by the training and validation loss trends observed in the Fully Convolutional Network (FCN) and Fully Convolutional Network with Dilated Kernels (FCN-DK) model, as illustrated in Figure 6 and Figure 7. In Figure 6, the downward trajectory of both training and validation loss over time signifies that the model is not only learning effectively but also generalizing well to new, unseen data. The initial high training loss, which progressively declines, reflects the model’s capacity to refine its predictions, while the closely aligned validation loss indicates that there are no signs of over-fitting. This strong performance and effective generalization reinforce the model’s capability to accurately classify slum areas, aligning with the earlier assertion of its precision and conservative classification tendencies. As the training process concludes, the stabilization of both losses suggests that the model has reached an optimal performance level, ensuring that significant slum areas are reliably identified.
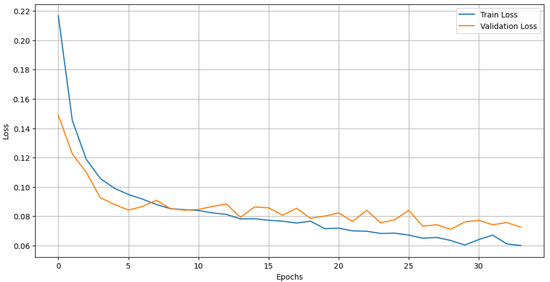
Figure 6.
Training and validation loss curves for the Fully Convolutional Network (FCN) model using only remote sensing imagery (RSI).
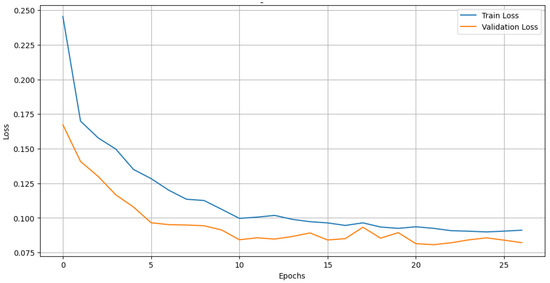
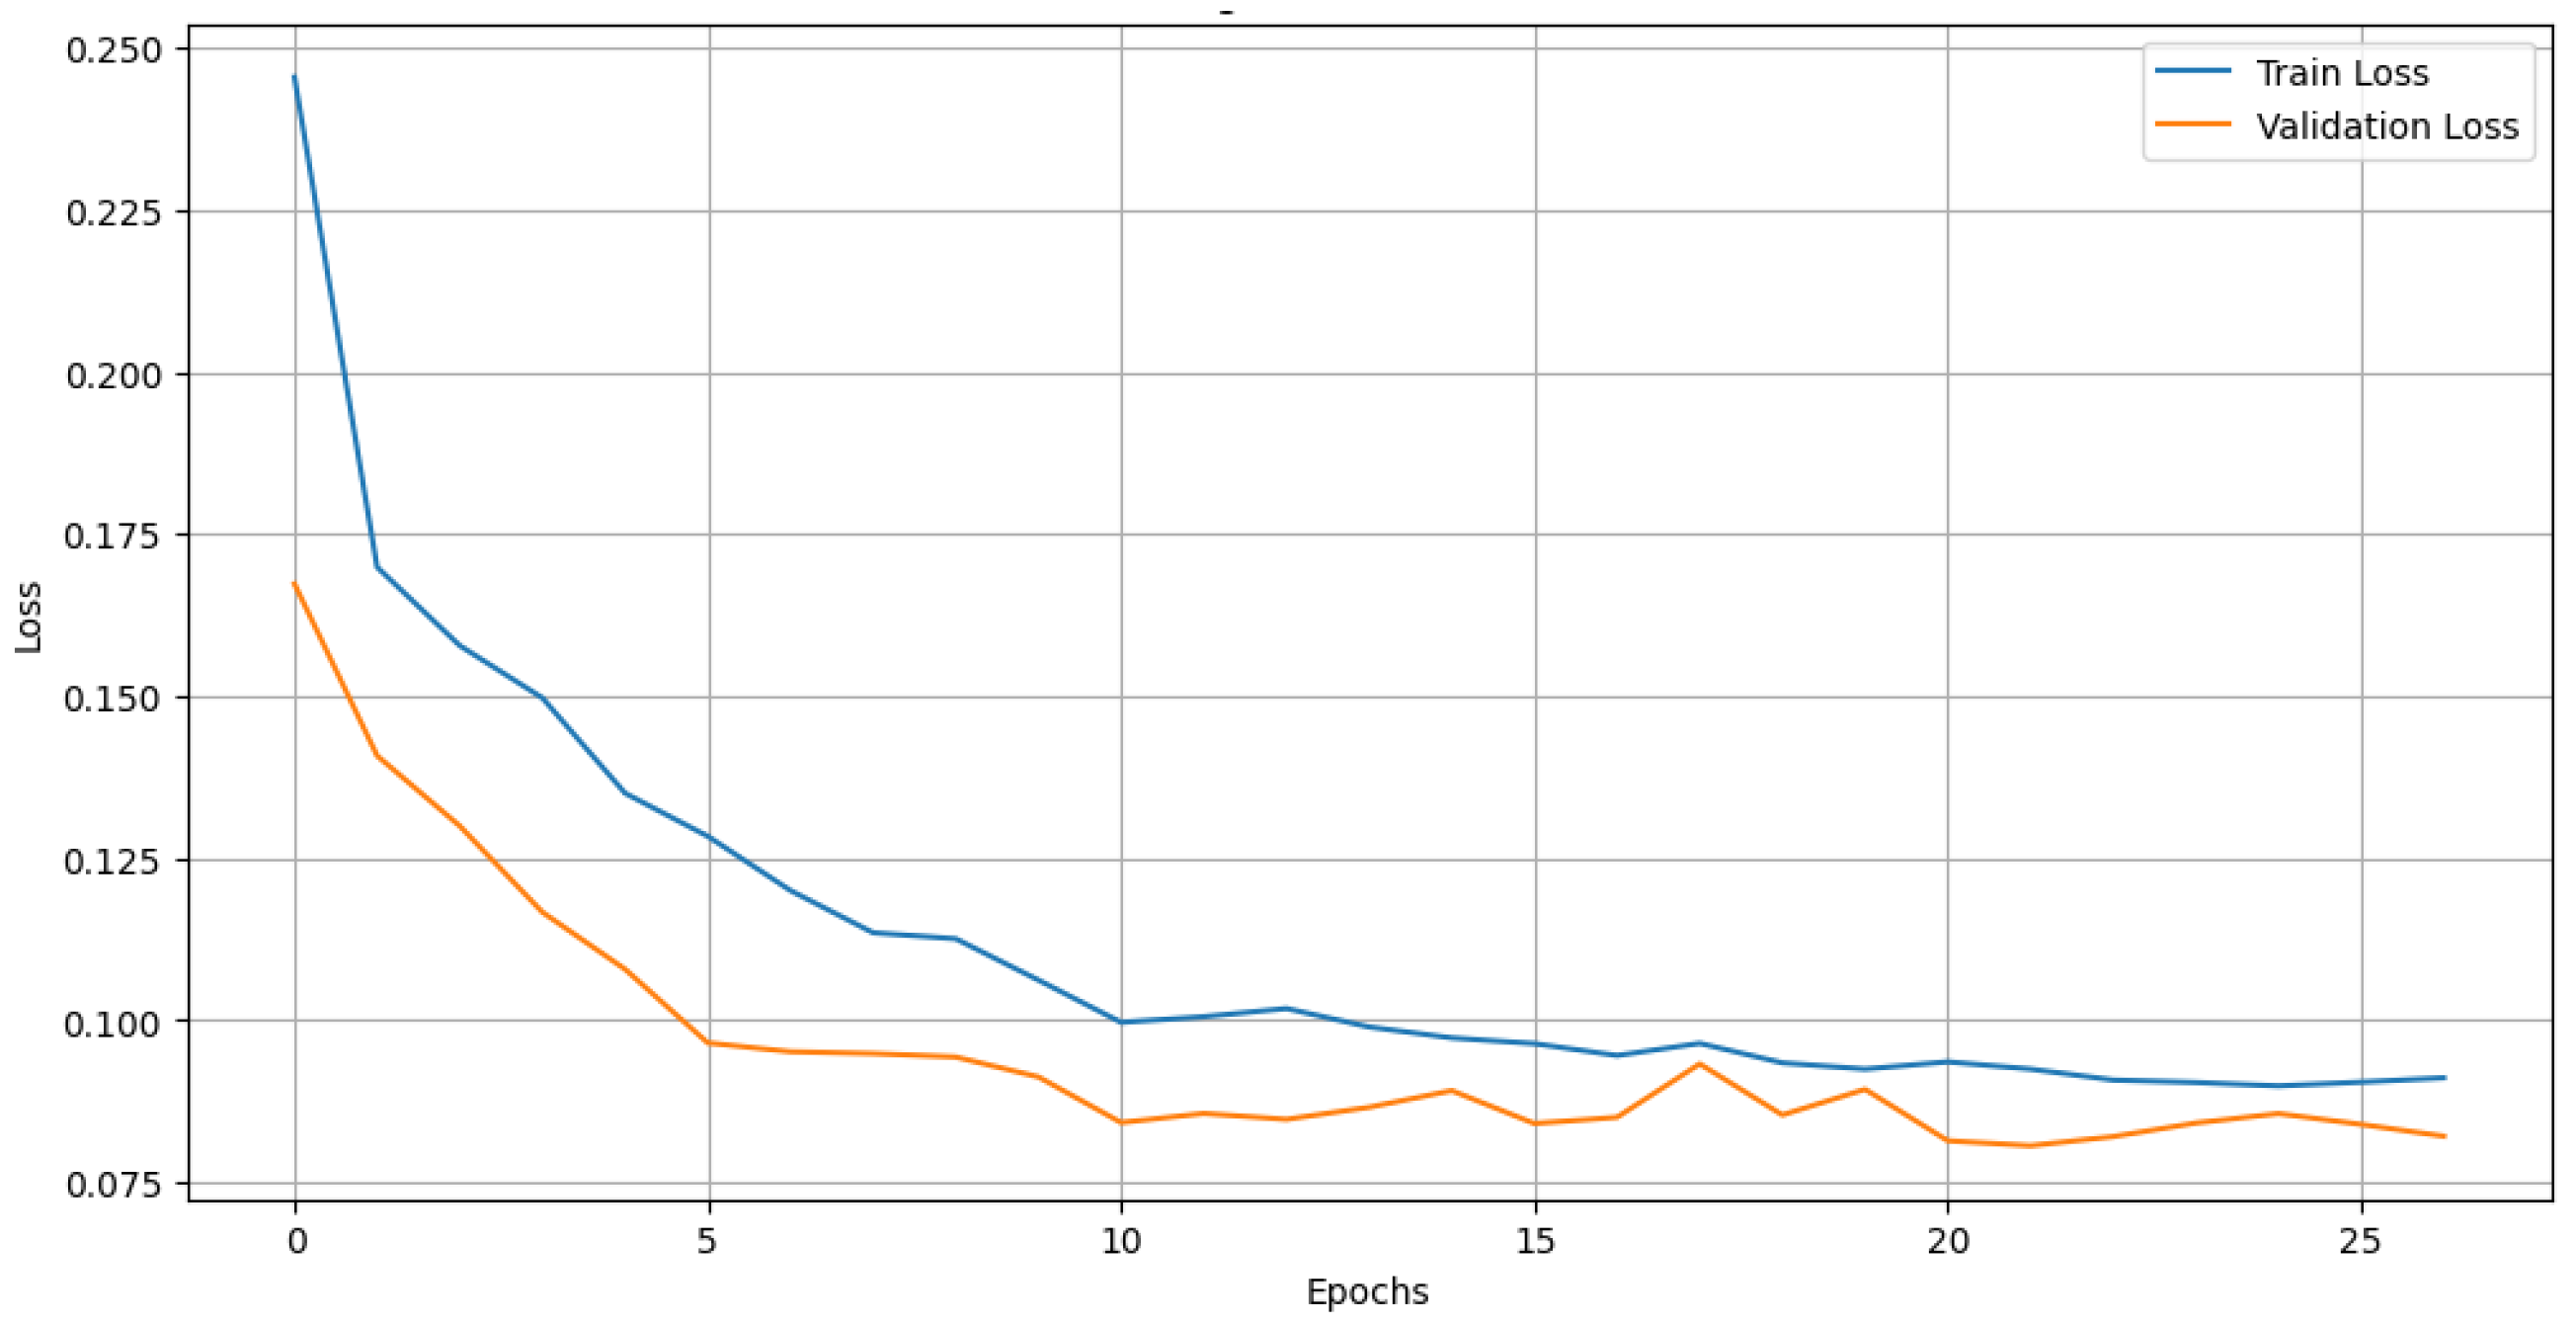
Figure 7.
Training and validation loss curves for the FCN-Dilated Kernel (FCN-DK) model using only remote sensing imagery (RSI).
Meanwhile, Figure 7 depicts the training loss and validation loss associated with a Fully Convolutional Network with Dilated Kernels (FCN-DK) model utilizing remote sensing imagery over the course of 25 training epochs. At the outset, both loss metrics are elevated; however, they experience a significant decline during the initial epochs, signifying successful learning. Although the losses continue to diminish, the rate of decrease slows over time, ultimately reaching a point of stabilization around the tenth epoch. Notably, throughout the training process, the validation loss consistently remains lower than the training loss, indicating effective generalization and the absence of over-fitting. In the later stages of training, both loss values stabilize, suggesting that the model has converged and shows limited capacity for further enhancement. This observation underscores the model’s effective learning capabilities and its strong generalization, potentially influenced by techniques such as regularization or dropout.
The elevated accuracy levels achieved through each methodology led to the depiction of the recognized slum areas on the revised slum reference map, which exclusively included the classifications of ’light slum’ and ’medium slum’ as defined by the local government’s slum area mapping framework. The findings for both the FCN and FCN-DK approaches are detailed in Table 3, while Figure 5 and Figure 8 provide a visual representation of the outcomes produced by these two methods.
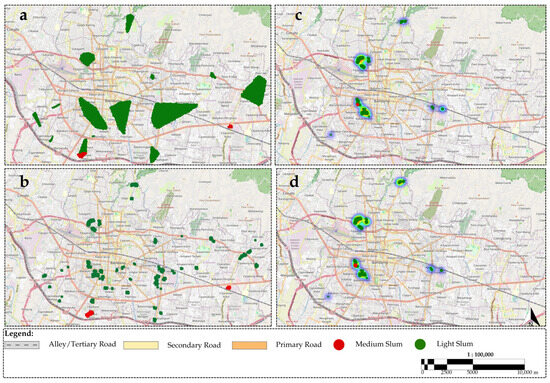
Figure 8.
Slum classification outputs from four model configurations: (a) FCN (RSI only), (b) FCN-DK (RSI only), (c) FCN (RSI + SVI), and (d) FCN-DK (RSI + SVI).
Additional analyzes were performed to investigate how different combinations of input datasets influence the comprehension of deep learning models in the classification of various slum categories. The FCN and FCN-DK models demonstrated comparable performance levels. Subsequently, the prediction outcomes derived from the use of FCN and FCN-DK were categorized into multiple slum classifications, as illustrated in the Figure 9.

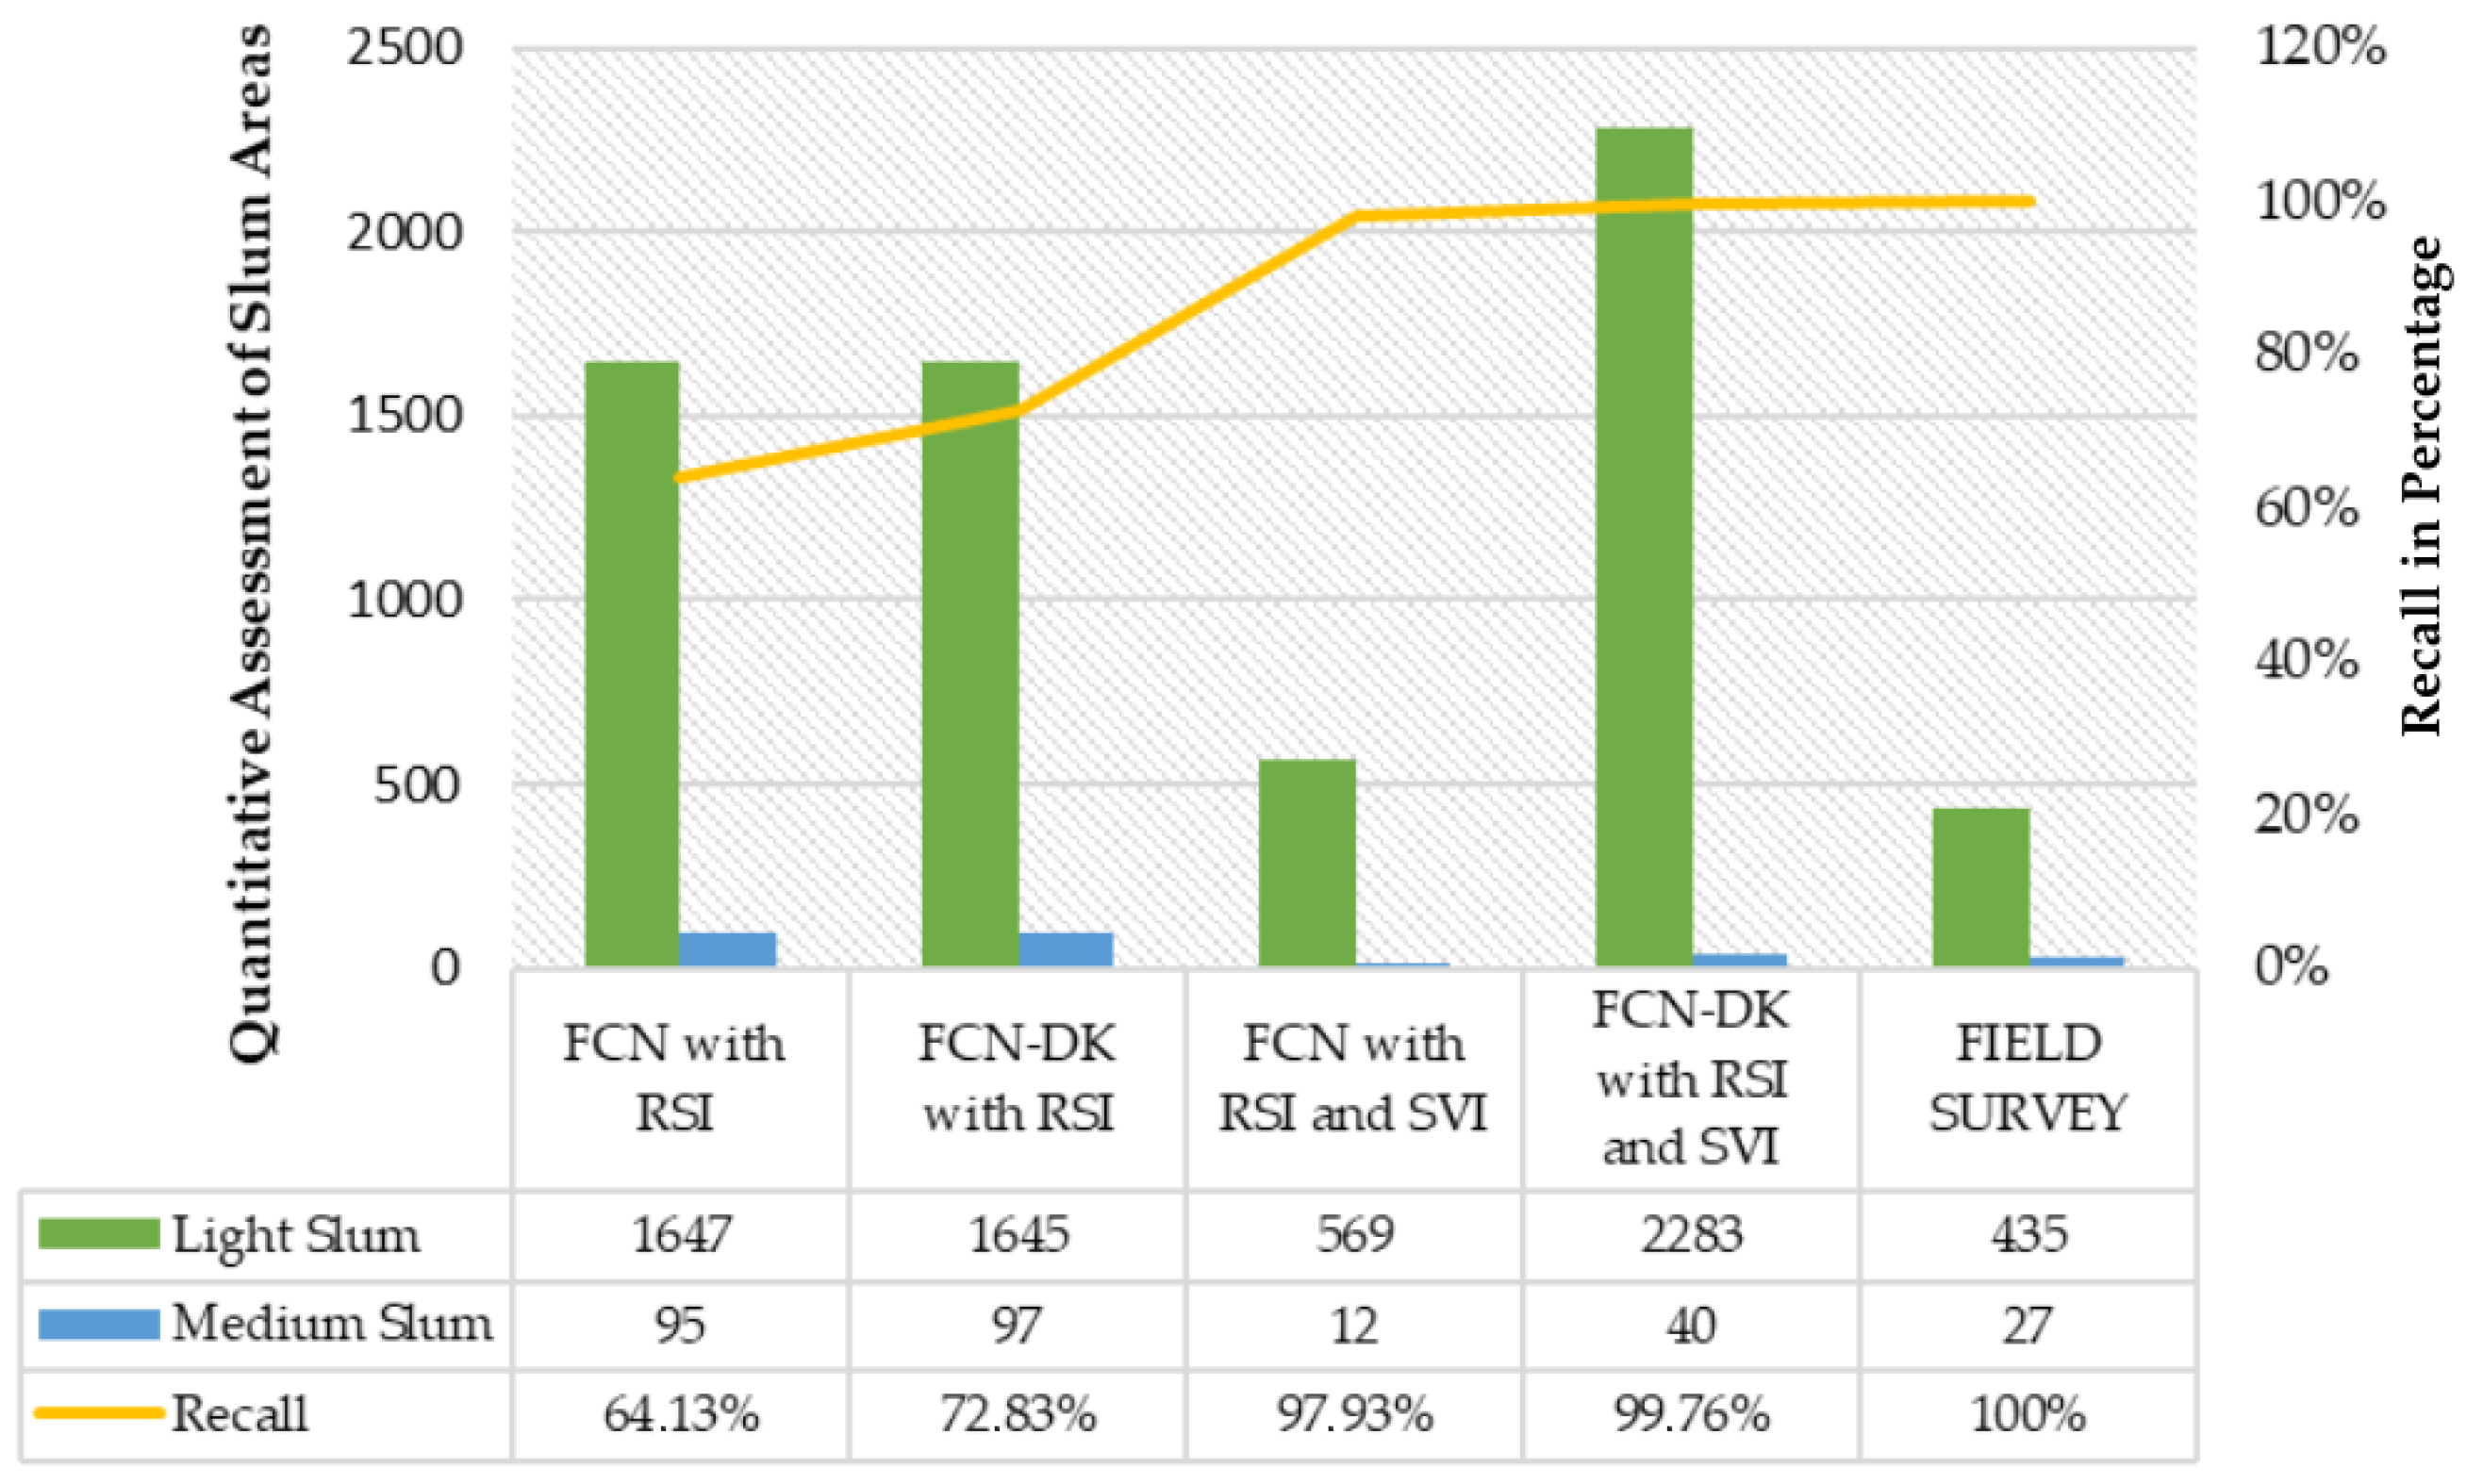
Figure 9.
Comparative performance of FCN and FCN-DK models across slum categories (light and medium) and field survey results.
The comparative performance chart (Figure 9) illustrates the effectiveness of various Fully Convolutional Network (FCN) configurations in detecting slum areas against field survey results. The FCN with remote sensing imagery (RSI) identified 1647 light slum and 55 medium slum areas, achieving a recall rate of 64.13%. The FCN-DK with RSI demonstrated enhanced performance, detecting 1545 light slum and 37 medium slum areas with a recall of 72.83%. The incorporation of street view imagery (SVI) into the RSI framework led to a substantial enhancement in the performance of the FCN model, resulting in the identification of 569 light slum and 12 medium slum areas, with a recall rate of 97.93%. The FCN-DK with both RSI and SVI achieved the highest detection results, identifying 2283 light slum and 40 medium slum areas with a remarkable 99.74% recall, closely aligning with field survey results, which documented 435 light slum and 27 medium slum areas with 100% recall. This progression underscores the efficacy of the FCN-DK architecture in conjunction with both RSI and SVI, demonstrating its capacity to achieve the most precise automated slum detection and efficacious processing of larger geographical areas. However, while the integration of SVI and RSI enhances the precision of slum segmentation, it encounters significant challenges in slum classification due to limitations inherent in the dataset. The 2020 Slum Area Map inadequately delineated severity categories, and although the FCN-DK outperformed in classification accuracy, the FCN showed comparable results for light slum categories.
The FCN with RSI demonstrated the poorest performance, due to its reliance on a solitary, restricted data source (RSI) and a rudimentary model architecture, which collectively proved inadequate for the accurate and comprehensive detection of slum areas. The incorporation of more sophisticated features (e.g., SVI) and the utilization of enhanced architectures (e.g., FCN-DK) has been demonstrated to result in a substantial enhancement in detection performance, as evidenced by the elevated recall rates exhibited by the alternative models.
Nonetheless, the survey results presented in Figure 9 unequivocally demonstrate that irrespective of the efficacy of the FCN-DK model in identifying slums, the optimal approach for doing so is through the implementation of a field survey method. As the field survey method requires greater investment in human resources and time to classify the slum-ness of a larger area, it naturally generates less data than the other methods.
5. Discussion
5.1. Overview of Methodologies
The results of this research imply that the addition of information from SVI can improve the accuracy in slum classification when compared to the exclusive use of RSI. However, the effectiveness of this improvement is highly dependent on the method of integration of SVI into the FCN-DK network as well as the quality and characteristics of the dataset used. A simple combination of RSI and SVI in FCN-DK showed significant improvement compared to using RSI as the only input.
Conversely, the implementation of slum mapping using the field survey method has been demonstrated to be the most reliable and effective approach for classifying the slum level of an area, in comparison to the utilization of RSI and SVI with FCN DK or FCN modeling alone.
The following conclusion is drawn from comparing the results obtained using FCN and FCN-DK, focusing on evaluating the combination of RSI and SVI compared to the use of RSI alone. The findings show that incorporating SVI increases the accuracy of slum mapping in the absence of direct field surveys. As illustrated in Figure 8, the comparison is presented between slum visualization outputs generated by FCN and FCN-DK models separately.
5.2. Comparative Analysis of Slum Classification
The presence of street view and features from remote sensing provide important information regarding land surface, water table, and building density, all of which contribute to a better understanding of slums in urban areas and improve the prediction accuracy of FCN-DK. The yellow circle in Figure 10 indicates that FCN outperforms in locations with SVI. As illustrated in the Figure 10, the locations indicated by yellow circles denote areas in which FCN-DK exhibits superior performance compared to FCN due to the availability of Google street view locations.
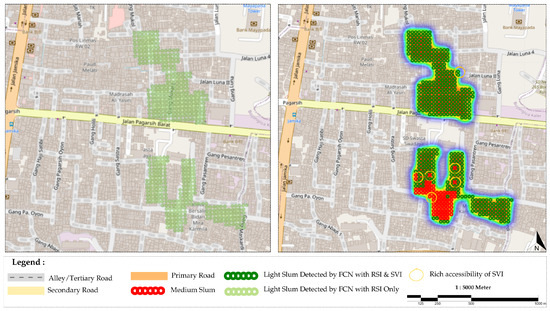
Figure 10.
Spatial comparison of slum detection results between FCN and FCN-DK models, highlighting areas with street view imagery (SVI) coverage.
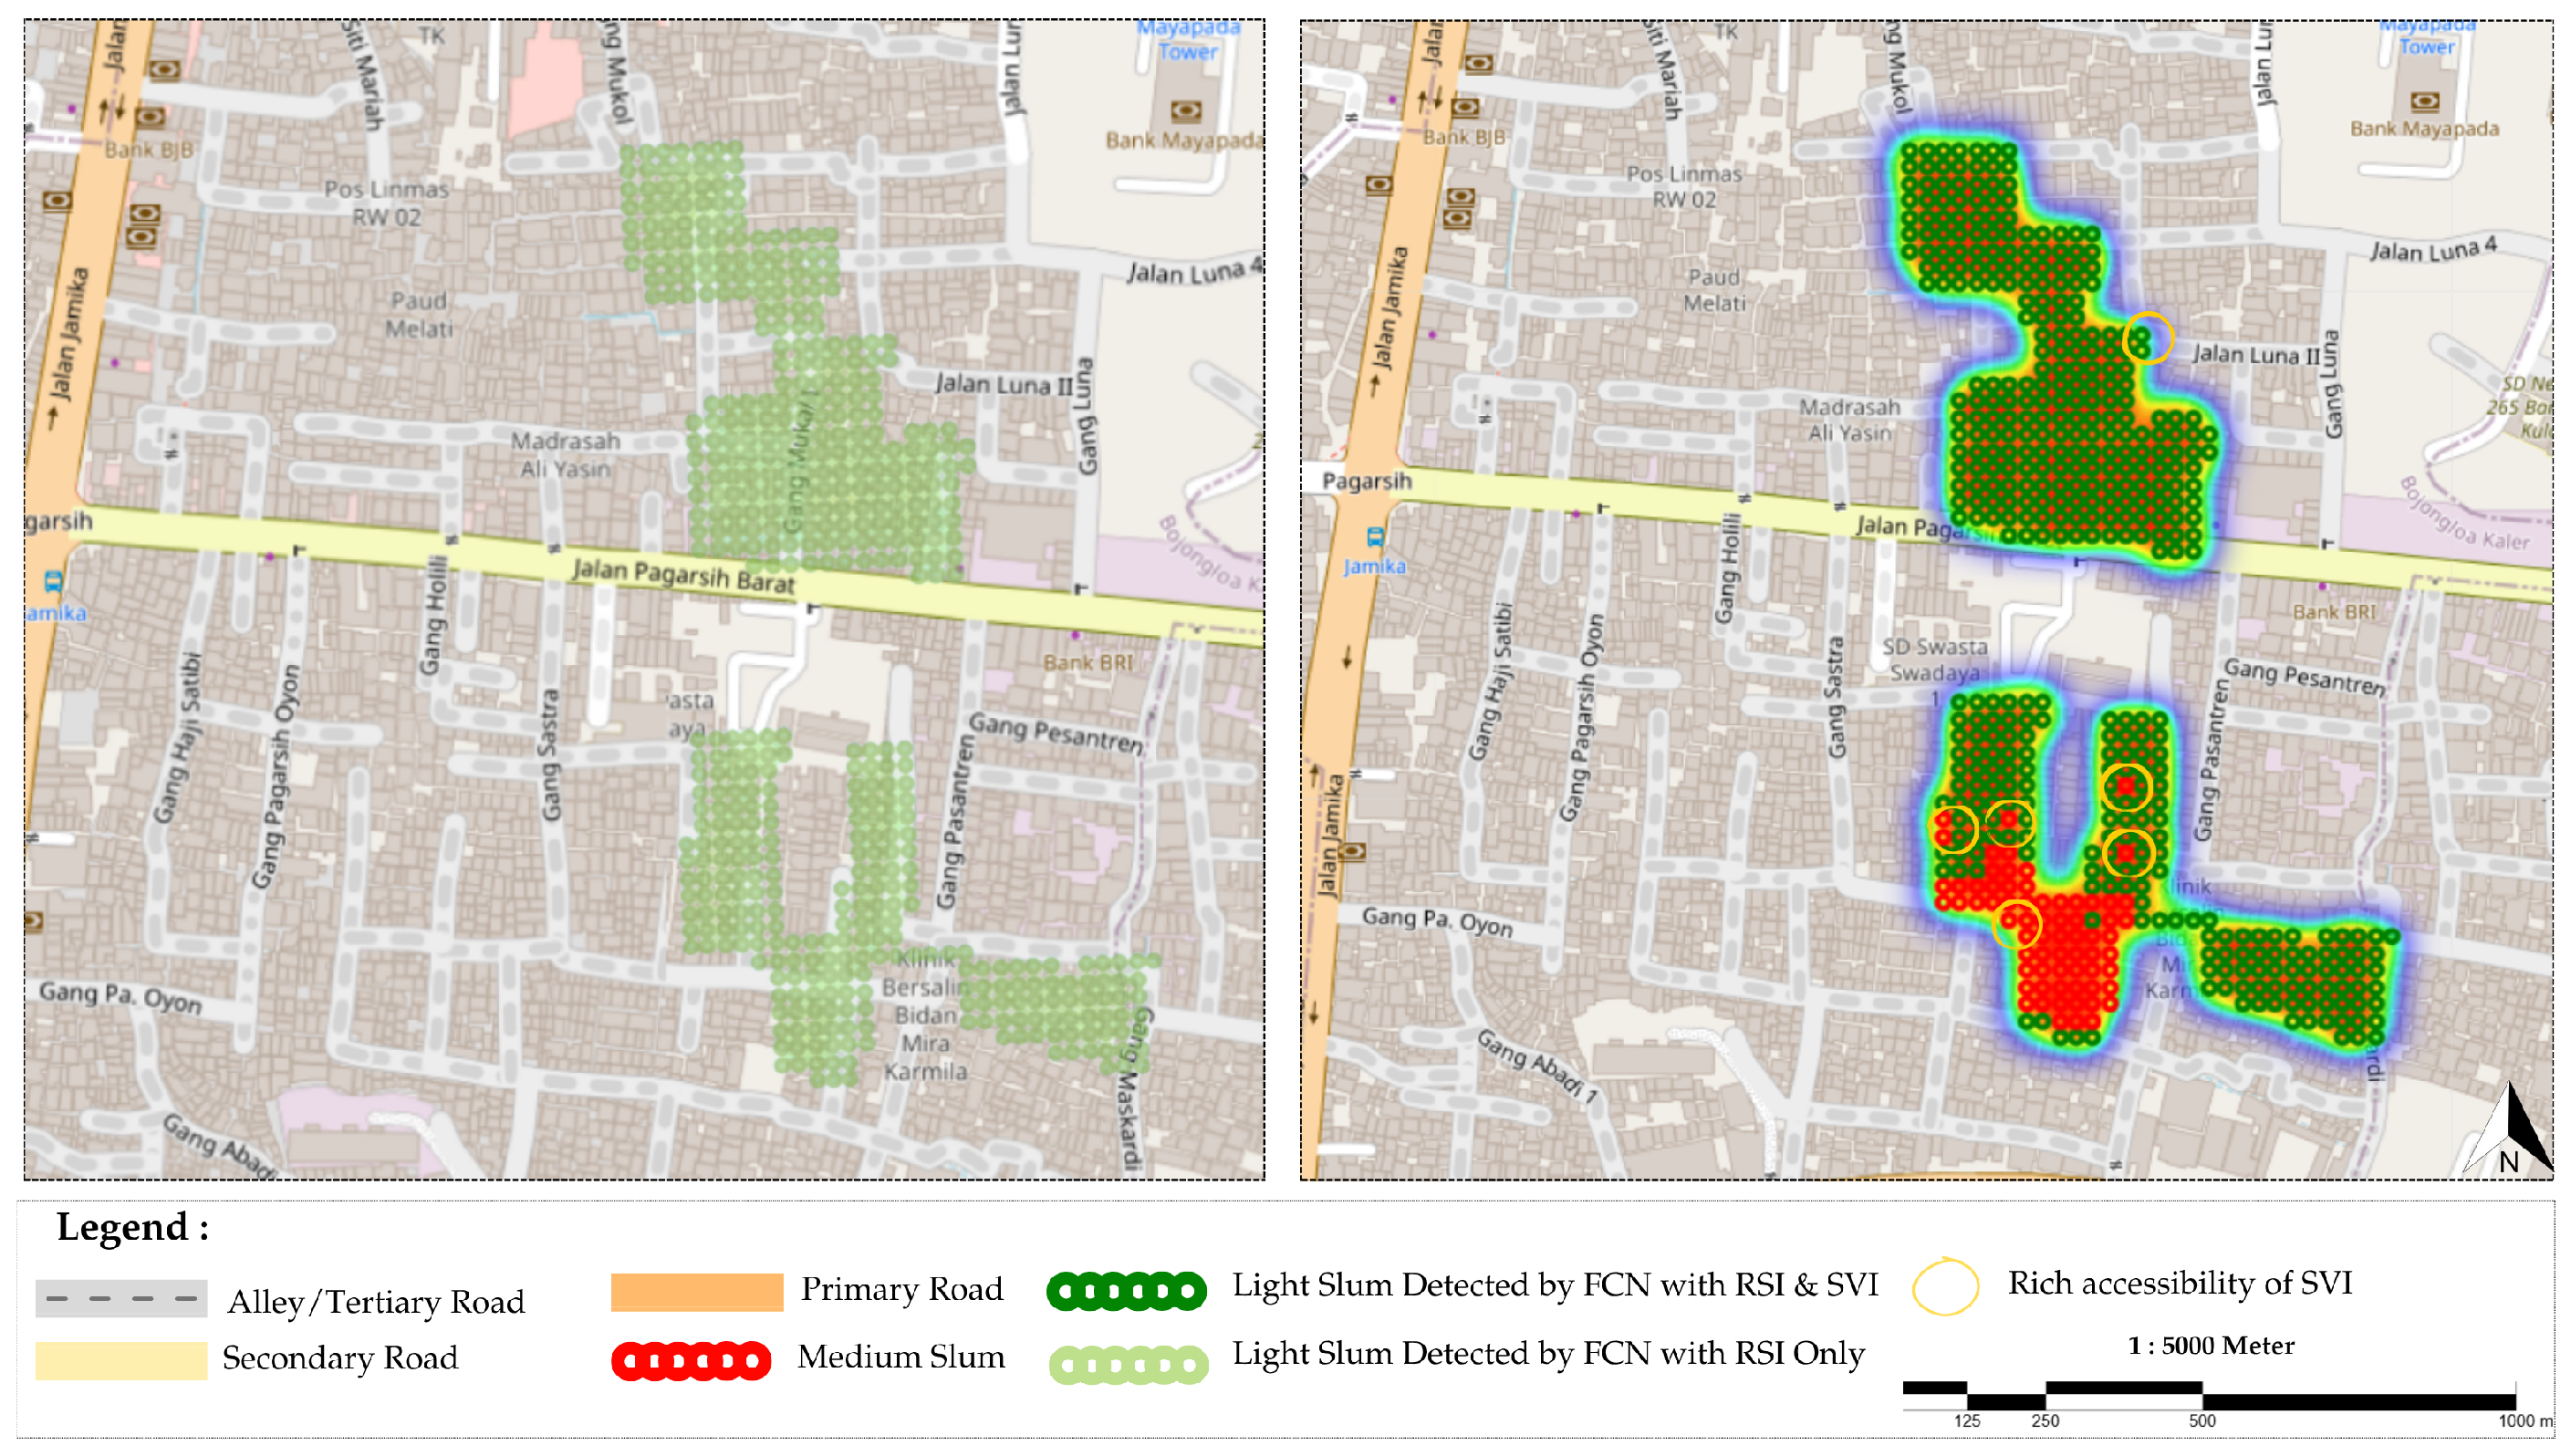
Meanwhile, as demonstrated in Figure 11, the areas highlighted in blue illustrate the regions where the FCN and FCN-DK models exhibit substandard performance, attributed to their restricted access to GSV locations. Conversely, the areas highlighted in yellow show the regions where FCN-DK demonstrates superior performance compared to FCN, due to its enhanced access to GSV locations.
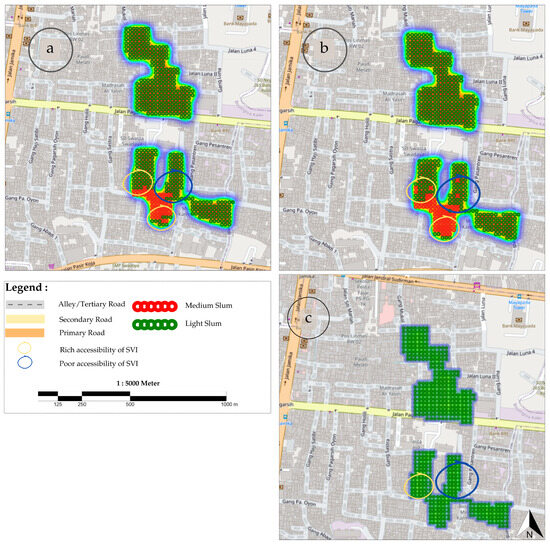
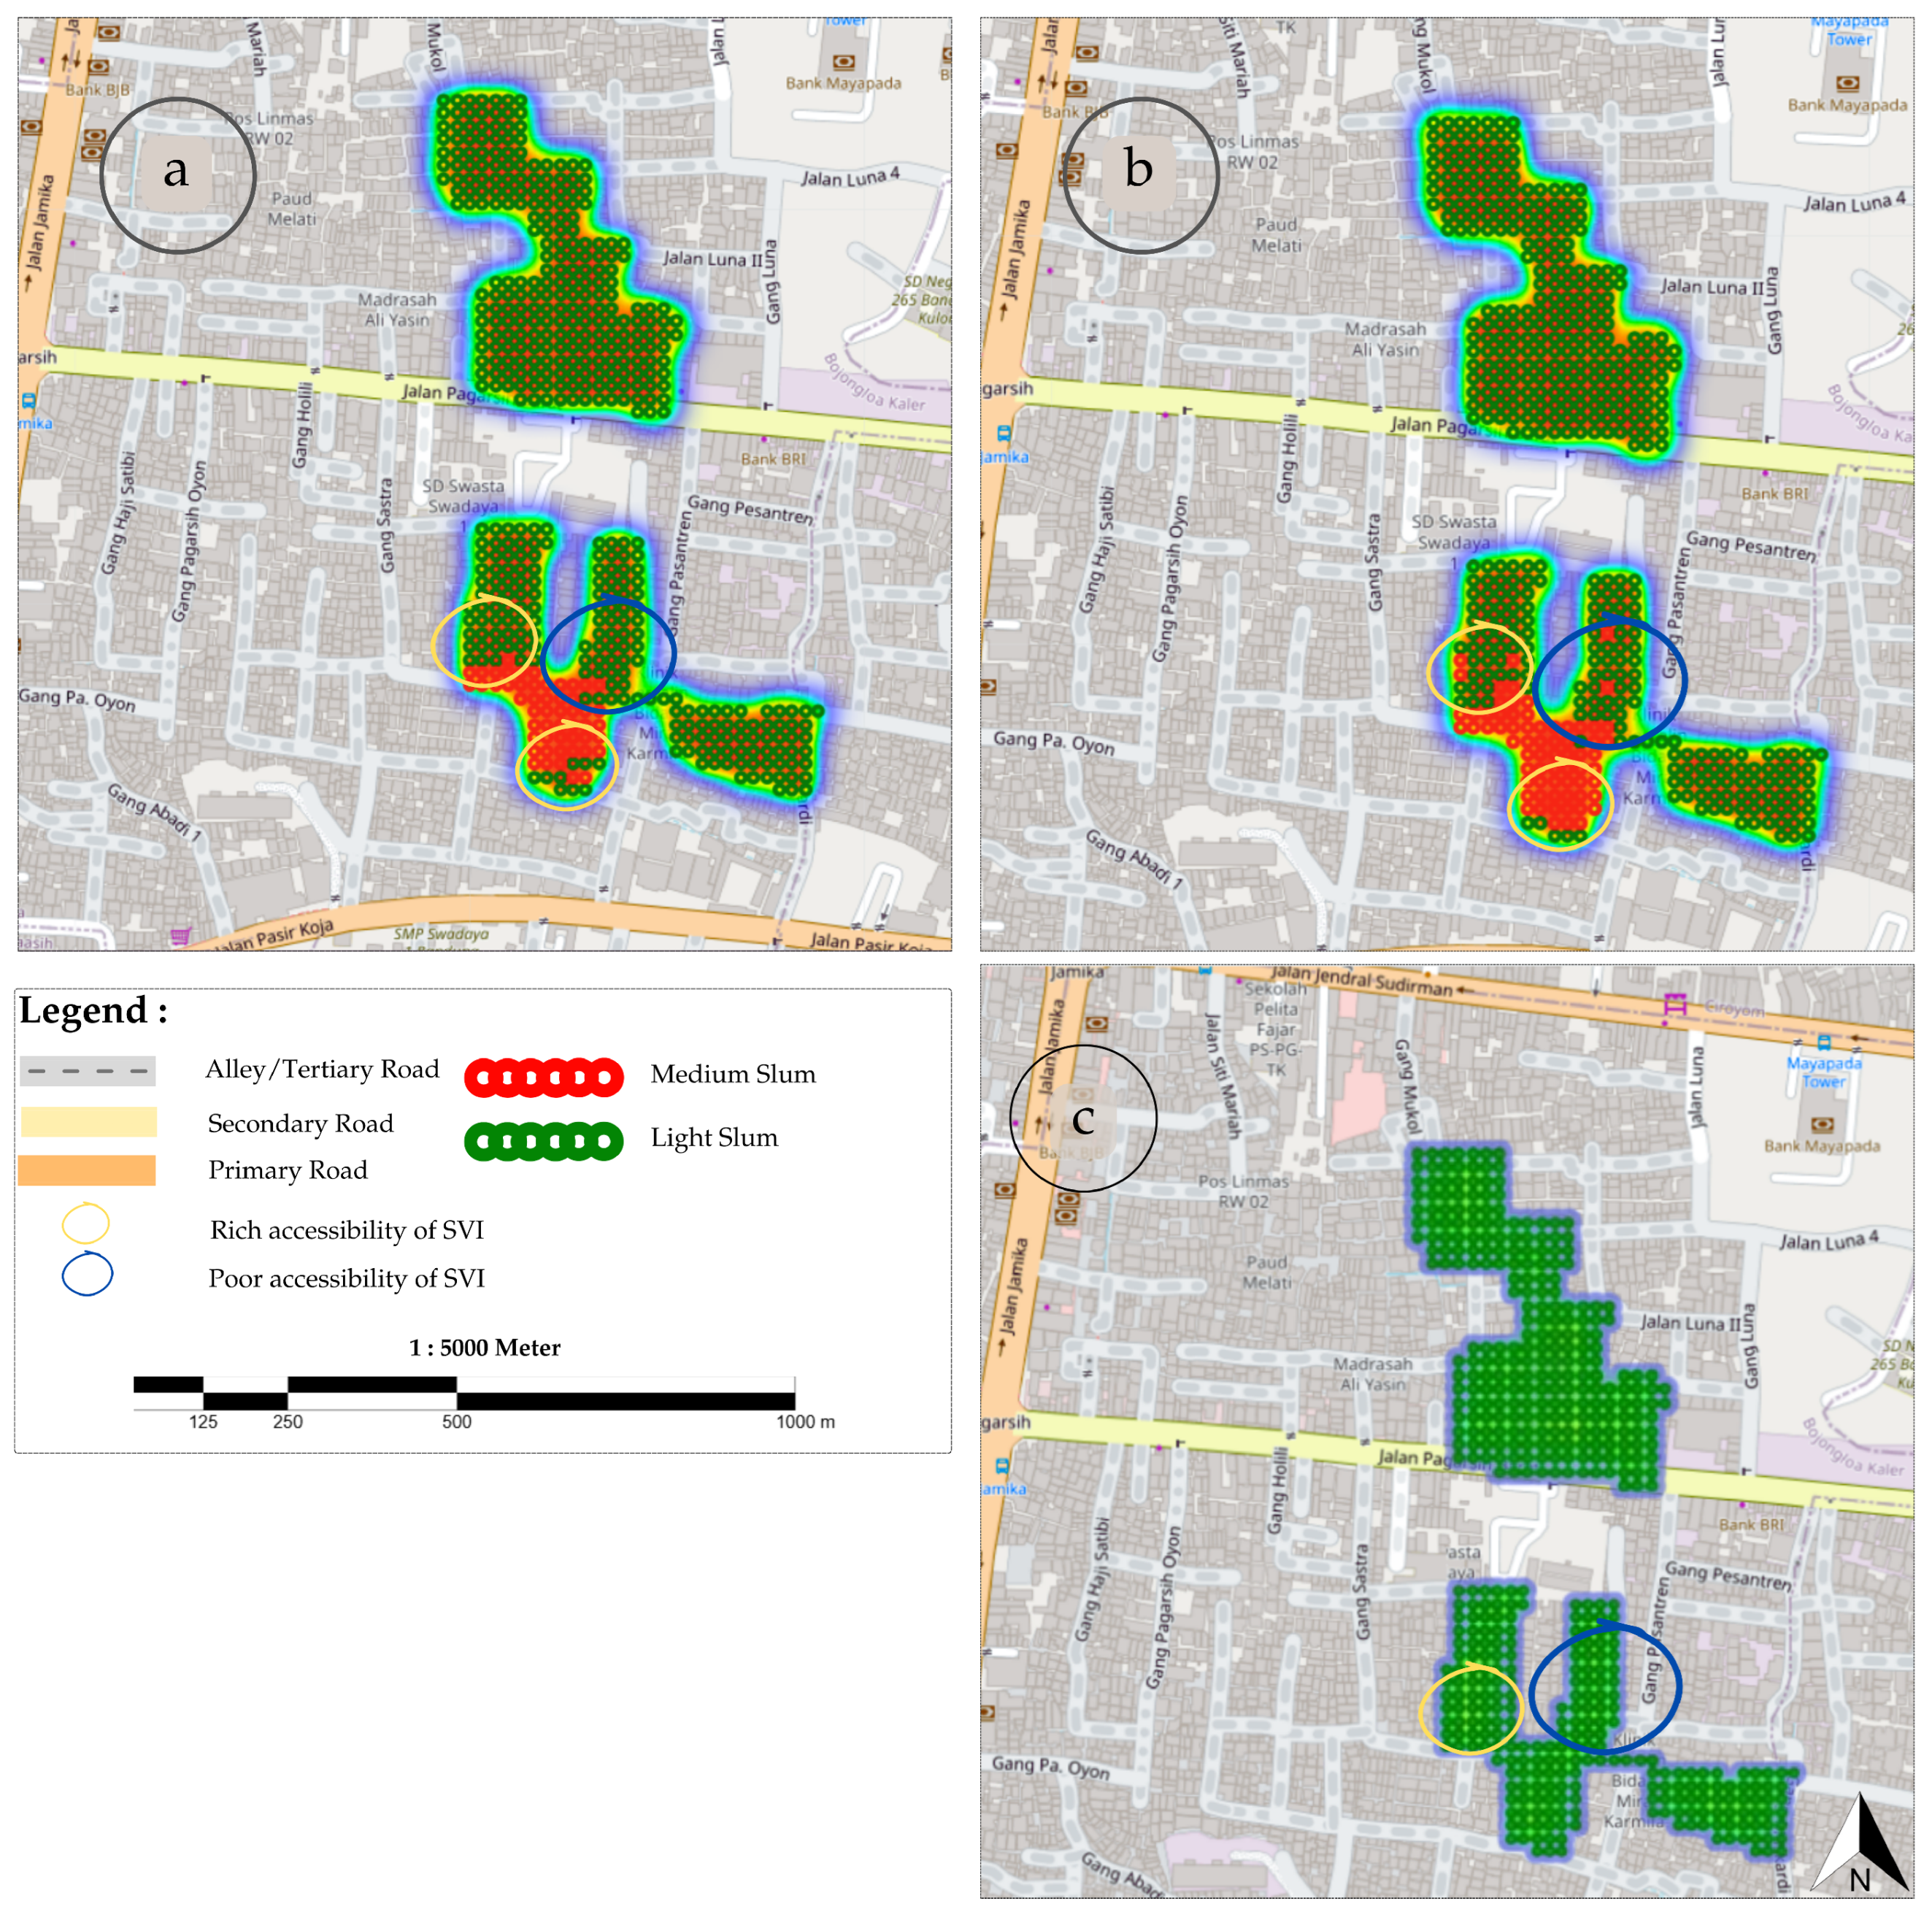
Figure 11.
Discrepancies in slum classification due to limited SVI access, with blue indicating under-performing areas and yellow showing improved accuracy with SVI integration: (a) Slum Detected by FCN-DK with RSI & SVI, (b) Slum Detected by FCN with RSI & SVI, and (c) Slum Detected by FCN-DK with RSI Only.
Figure 11 reveals that the integration of SVI has the potential to improve the identification of various criteria that signify the presence of slum areas. In Figure 11 column c, which is the result of slum mapping using RSI alone, there is a light slum classification in one area, while in columns a and b, it can be seen that the addition of SVI provides more detailed information that causes the model to classify several points as moderate slums in the same area. This indicates that the integration of SVI has the ability to capture the characteristics of slums that may not be detected by RSI, such as the conformity of buildings to prescribed technical standards and the condition of neighbourhood drainage, as well as the quality of nearby roads. In this research, the approach used is a Convolutional Neural Network (CNN), which was chosen for its architectural simplicity in accordance with the characteristics of the available dataset, which consists of only two categories, namely light slums and medium slums. It was confirmed from an interview with the local government that these categories have been determined in Bandung City since 2020 due to various efforts to deal with slums through the KOTAKU (Kota Tanpa Kumuh) Programme from 2018 to 2022.
In comparison to the results of field survey mapping (Figure 12), the classification of slum areas provided by field survey mapping is conservative and subjective, with areas described as ‘mild slums’ not distinguished by severity. Conversely, the FCN-DK model provides a more detailed and automated classification, frequently identifying ‘moderate slum’ conditions in areas that are considered to have light slum characteristics by field surveys. This discrepancy may be attributed to the model’s utilization of high-resolution imagery and street-level views, which facilitate the detection of features such as building density and road conditions that may be overlooked by field surveys due to constraints such as accessibility and subjectivity.
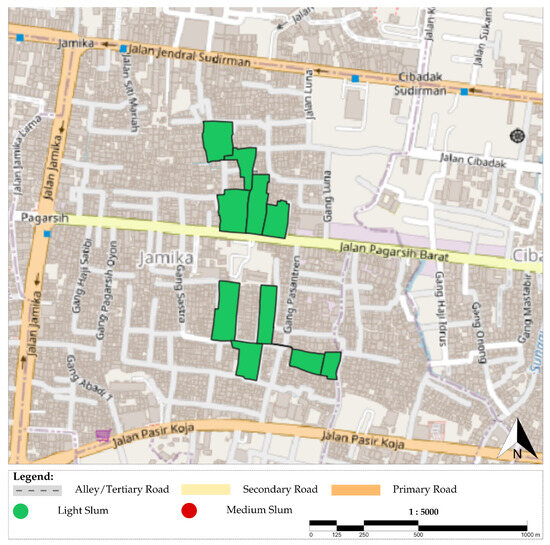
Figure 12.
Spatial distribution of slum areas on field survey results.
5.3. Performance Evaluation
This experiment shows that the complexity of the dataset architecture greatly affects the modeling performance, network selection, and the training process of the latest slum classification. The Places365 VGG16 network is a convolutional neural network (CNN) architecture that has been demonstrated to be highly effective in the classification of images, particularly in the recognition of various environments. However, the complexity of its architecture may not be compatible with simpler datasets, such as the 2020 Bandung City Cumulative Map dataset, which is considered too simple for the capabilities of the VGG16 model. This discrepancy can result in suboptimal classification performance [16]. In addition, the condition of the dataset from the Bandung City Government shows that the distribution of slum areas are uneven, less varied in each area, and does not cover all slum categories (light, medium, and heavy), causing an imbalance when using more complex modeling such as a Visual Geometry Group (VGG). VGG is more appropriate and superior in terms of storing varied data patterns so it can be adapted to improve the ability to recognize slum category variations with a more diverse and balanced dataset [16].
5.4. Future Research Directions
A key area for future research is the optimizing the incorporation of a more diverse and pertinent set of variables or features. Such features may include the socio-economic data of the population, the availability of fundamental infrastructure, and environmental conditions surrounding residential areas. It is hypothesized that these variables have the potential to make a greater contribution in distinguishing the level of slum-ness in a more in-depth and comprehensive manner.
Furthermore, the utilization of more sophisticated classification algorithms, such as XGBoost, Light-GBM, or ensemble stacking, could also be a viable option to explore, as they are adept at handling imbalanced data and high feature complexity with competitive performance. It is recommended that future research explore the application of data balancing methods, such as SMOTE or ADASYN, to address imbalances between classes [27]. For instance, this could help to mitigate the dominance of ‘light slum’ over ‘medium slum’.
A further concern pertains to the paucity of data from the minority category, designated here as the ‘medium slum’. This deficiency may have ramifications for long-term prediction, specifically the potential alteration of its stability, should there be any modification in the future class distribution. Consequently, it is imperative that efforts are made to collect more balanced and representative data in future surveys. It is anticipated that these developments will enhance the reliability and precision of the classification model, thereby ensuring its efficacy in providing decision support for the dynamic conditions of residential areas in Bandung City.
Despite the merging of SVI and RSI showing significant potential in slum classification, further research is needed to optimize this integration. This is particularly due to the lack of direct representation of more detailed slum criteria, such as safe access to drinking water, domestic waste management, waste management, and the availability of fire protection.
5.5. Limitations and Considerations
The coverage of the SVI does not always include all slum areas, as many areas may not be represented in the SVI. This limitation arises because the SVI can only capture information along main roads [14], while small streets or alleys are often omitted or unavailable in Google SVI. This research utilizes IDW interpolation to generate SVI feature maps, so unified images can represent multiple locations. Slum areas are also detected in areas with alleys or small roads whose images are not available in Google SVI, but this is overcome by utilizing the 2021 Bandung City neighborhood road database. Further research could explore more accurate and advanced methods to address this issue of inconsistent coverage. Methods for future research could include techniques that specifically address missing data or additional data, such as street networks and city blocks that are available on OpenStreetMap to spatially improve SVI interpolation [28].
The SVI featured map was prepared by collecting imagery through the Google Application Programming Interface (API), focusing on 15 urban villages with an area of more than 10 Ha. The area selection was based on the authority of the provincial and central governments in accordance with the applicable regulation, namely the Regulation of the Minister of Public Works and Housing Number 14/PRT/M/2018 of 2018 on Prevention and Quality Improvement of Slum Housing and Slum Settlements. The limitation of using the Google API meant that not all SVIs in Bandung City could be accessed. Therefore, programmed data collection focused on priority areas, resulting in 2904 images which were then combined with neighborhood road imagery from the Bandung City Government in 2021 as additional data.
The obtained images and components covered only 33% of the total required SVIs, and the existing SVIs were integrated as layers in FCN-DK. Future research is expected to explore methods to generate feature maps that are able to capture more information from SVIs without being hampered by Google API access limitations. In addition, it is also expected to produce SVIs that are easier to integrate into FCN-DK without requiring many spatial layers [16].
5.6. Implications for Policy and Practice
A comparison with the results of the 2024 field survey, which demonstrated indications of slum area mapping in several locations, suggests that the accuracy achieved through field survey methods is on par with, if not superior to, the use of remote sensing imagery and street view imagery alone. This finding indicates that the combination of the most recent survey results also provides substantial support for the incorporation of more inclusive mapping results prior to the formulation of a slum upgrading policy by the city government. It is evident that utilizing satellite and street view imagery has been advantageous in terms of reducing analysis time and enhancing the extent of the area covered. It is evident that the implementation of the field survey method necessitates a greater investment of time and results in a more circumscribed area of coverage when undertaken over a period of one year.
The findings of this study are expected to encourage district and city administrations to adopt remote sensing imagery (RSI) and street view imagery (SVI) for delineating slum areas, optimizing field survey data collection while saving time and costs. Future research may explore the applicability of FCN and FCN-DK models with RSI and SVI in diverse contexts. By developing a comprehensive overview of identifiable slum characteristics, this study offers insights that can be adapted to local contexts, aiding in the identification and resolution of slum conditions. Engaging stakeholders can enhance tailored interventions, while the application of RSI and SVI in mapping and monitoring can support urban planners and policymakers in improving slum areas, ultimately fostering community resilience and sustainability.
The significance of the classification conceptualization of slum areas cannot be overlooked, as it must be adapted to the local context that exists in each region [28]. In Indonesia, slum classification is determined based on seven criteria, which include building condition, neighborhood road accessibility, drainage system, drinking water supply, domestic waste management, waste management, and availability of fire protection system. In addition, the limitations in terms of social complexity in slums, which are considered to be inhabited by people with lower–middle socio-economic conditions, are also difficult to measure only from satellite imagery. Further research is expected to combine it with population density or poverty level maps to produce a more representative mapping for policymakers. Therefore, the development of a model that is in accordance with the conceptualization of slums based on the local context in Indonesia is crucial in the process of making slum maps.
6. Conclusions
Significant progress has been made in detecting and mapping slums. The resulting data is invaluable to policymakers in designing urban improvement initiatives. However, the physical information obtained from RSI has limitations in describing the overall condition of the urban environment, such as building size, population density, roofing material type, and street network pattern. Moreover, other parameters related to the quality of residential areas, such as the type of building material and drainage system, are crucial for identifying slums, but are difficult to measure using RSI.
To address this shortcoming, street view imagery (SVI) can serve as an effective complement, especially if these two data sources are integrated. In the Bandung City case study, the integration of RSI and SVI data demonstrated better results compared to the use of either data separately. Our experiment also revealed that dataset quality and network architecture play an important role in improving the accuracy of the analysis. The FCN-DK network used in this study showed significant improvement in recall, F1 score, and intersection over union (IoU) metrics. Furthermore, further research is needed to explore more efficient dataset collection and integration methods, as well as to find effective ways to interpolate the SVI classification information into the broader spatial coverage provided by RSI.
Author Contributions
Conceptualization, K.R.S., M.A., M.C.W.A. and I.A.D.; Methodology, M.A.; Software, K.R.S. and M.A.; Validation, M.C.W.A.; Formal analysis, I.A.D.; Investigation, K.R.S.; Resources, I.A.D.; Data curation, K.R.S.; Writing—original draft, K.R.S.; Writing—review & editing, I.A.D.; Supervision, M.A., M.C.W.A. and I.A.D.; Project administration, I.A.D.; Funding acquisition, I.A.D. All authors have read and agreed to the published version of the manuscript.
Funding
This research received no external funding.
Institutional Review Board Statement
Not applicable.
Informed Consent Statement
Not applicable.
Data Availability Statement
The raw data supporting the conclusions of this article will be made available by the authors on request.
Conflicts of Interest
The authors declare no conflicts of interest.
Abbreviations
The following abbreviations are used in this manuscript:
| NDBI | Normalized Difference Built-up Index |
| NDVI | Normalized Difference Vegetation Index |
| NDWI | Normalized Difference Water Index |
| NDMI | Normalized Difference Moisture Index |
| NDBaI | Normalized Difference Bareness Index |
| MNDWI | Modified Normalized Difference Water Index |
| EVI | Enhanced Vegetation Index |
| SAVI | Soil Adjusted Vegetation Index |
| UI | Urban Index |
| FCN | Fully Convolutional Network |
| FCN-DK | Fully Convolutional Neural Network with a Dilated Kernel |
| CNN | Convolutional Neural Network |
| VGG | Visual Geometry Group |
| RSI | Remote Sensing Imagery |
| SVI | Street View Imagery |
| GSV | Google Street View |
References
- Bandung City Population and Civil Registry Office. Population Density in Bandung City by Subdistrict. 2024. Available online: https://bandungkota.bps.go.id/en/statistics-table/2/MjI1MCMy/population-density-in-bandung-city-by-subdistrict.html (accessed on 10 January 2025).
- Ministry of Public Works and Housing of Indonesia. Regulation of the Minister of Public Works and Housing No. 14/PRT/M/2018 of 2018 on Prevention and Quality Improvement of Slum Housing and Slum Settlements. 2018. Available online: https://peraturan.bpk.go.id/Details/104649/permen-pupr-no-14prtm2018-tahun-2018 (accessed on 10 January 2025).
- Mahabir, R.; Croitoru, A.; Crooks, A.T.; Agouris, P.; Stefanidis, A. A critical review of high and very high-resolution remote sensing approaches for detecting and mapping slums: Trends, challenges and emerging opportunities. Urban Sci. 2018, 2, 8. [Google Scholar] [CrossRef]
- Kuffer, M.; Thomson, D.R.; Boo, G.; Mahabir, R.; Grippa, T.; Vanhuysse, S.; Engstrom, R.; Ndugwa, R.; Makau, J.; Darin, E.; et al. The role of earth observation in an integrated deprived area mapping “system” for low-to-middle income countries. Remote Sens. 2020, 12, 982. [Google Scholar] [CrossRef]
- Hofmann, P.; Strobl, J.; Blaschke, T.; Kux, H. Detecting informal settlements from QuickBird data in Rio de Janeiro using an object based approach. In Object-Based Image Analysis: Spatial Concepts for Knowledge-Driven Remote Sensing Applications; Springer: Berlin/Heidelberg, Germany, 2008; pp. 531–553. [Google Scholar]
- Dharmawan, I.A.; Rahadianto, M.A.E.; Henry, E.; Endyana, C.; Aufaristama, M. Application of High-Resolution Remote-Sensing Data for Land Use Land Cover Mapping of University Campus. Sci. World J. 2021, 2021, 5519011. [Google Scholar] [CrossRef] [PubMed]
- Taubenböck, H.; Kraff, N. The physical face of slums: A structural comparison of slums in Mumbai, India, based on remotely sensed data. J. Hous. Built Environ. 2014, 29, 15–38. [Google Scholar] [CrossRef]
- Pratomo, J.; Kuffer, M.; Kohli, D.; Martinez, J. Application of the trajectory error matrix for assessing the temporal transferability of OBIA for slum detection. Eur. J. Remote Sens. 2018, 51, 838–849. [Google Scholar] [CrossRef]
- Kuffer, M.; Pfeffer, K.; Sliuzas, R. Slums from space—15 years of slum mapping using remote sensing. Remote Sens. 2016, 8, 455. [Google Scholar] [CrossRef]
- Blaschke, T.; Hay, G.J.; Kelly, M.; Lang, S.; Hofmann, P.; Addink, E.; Feitosa, R.Q.; Van der Meer, F.; Van der Werff, H.; Van Coillie, F.; et al. Geographic object-based image analysis–towards a new paradigm. ISPRS J. Photogramm. Remote Sens. 2014, 87, 180–191. [Google Scholar] [CrossRef] [PubMed]
- Mahabir, R.; Agouris, P.; Stefanidis, A.; Croitoru, A.; Crooks, A.T. Detecting and mapping slums using open data: A case study in Kenya. Int. J. Digit. Earth 2020, 13, 683–707. [Google Scholar] [CrossRef]
- Kuffer, M.; Wang, J.; Nagenborg, M.; Pfeffer, K.; Kohli, D.; Sliuzas, R.; Persello, C. The scope of earth-observation to improve the consistency of the SDG slum indicator. ISPRS Int. J. Geo-Inf. 2018, 7, 428. [Google Scholar] [CrossRef]
- Mboga, N.; Persello, C.; Bergado, J.R.; Stein, A. Detection of informal settlements from VHR images using convolutional neural networks. Remote Sens. 2017, 9, 1106. [Google Scholar] [CrossRef]
- Cao, R.; Zhu, J.; Tu, W.; Li, Q.; Cao, J.; Liu, B.; Zhang, Q.; Qiu, G. Integrating aerial and street view images for urban land use classification. Remote Sens. 2018, 10, 1553. [Google Scholar] [CrossRef]
- Ansari, R.A.; Buddhiraju, K.M. Textural segmentation of remotely sensed images using multiresolution analysis for slum area identification. Eur. J. Remote Sens. 2019, 52, 74–88. [Google Scholar] [CrossRef]
- Najmi, A.; Gevaert, C.M.; Kohli, D.; Kuffer, M.; Pratomo, J. Integrating remote sensing and street view imagery for mapping slums. ISPRS Int. J. Geo-Inf. 2022, 11, 631. [Google Scholar] [CrossRef]
- Shao, Y.; Cooner, A.J.; Walsh, S.J. Assessing Deep Convolutional Neural Networks and Assisted Machine Perception for Urban Mapping. Remote Sens. 2021, 13, 1523. [Google Scholar] [CrossRef]
- Government of Bandung City. Regional Regulation of Bandung City Number 10 of 2015 Concerning Detailed Spatial Plan and Zoning Regulation of Bandung City 2015–2035. 2015. Available online: https://peraturan.bpk.go.id/Details/202956/perda-kota-bandung-no-10-tahun-2015 (accessed on 8 January 2025).
- Government of Bandung City. Administrative Map of Bandung City, Indonesia, Highlighting Urban Villages and Sub-Districts. 2023. Available online: https://bsm.bandung.go.id/ (accessed on 10 January 2025).
- Government of Bandung City. Official Slum Reference Map of Bandung City (2020), Categorizing Areas into Light and Medium Slums Based on Governmental Criteria. 2020. Available online: https://bsm.bandung.go.id/ (accessed on 10 January 2025).
- Rahmawati, A.; Asy’Ari, R.; Ranti, A.; Prameswari, F.; Ameiliani, T.; Khairunnisa, Z. Mapping of land use change using Sentinel-2 Multi Spectral Instrument (MSI) imagery and Google Earth Engine mapping platform at Dramaga, Bogor Regency, Indonesia. Iop Conf. Ser. Earth Environ. Sci. 2023, 1220, 012024. [Google Scholar] [CrossRef]
- Government of Bandung City. Bandung Smart City. 2024. Available online: https://bsm.bandung.go.id/ (accessed on 10 January 2025).
- Persello, C.; Stein, A. Deep fully convolutional networks for the detection of informal settlements in VHR images. IEEE Geosci. Remote Sens. Lett. 2017, 14, 2325–2329. [Google Scholar] [CrossRef]
- Yu, F.; Koltun, V. Multi-scale context aggregation by dilated convolutions. arXiv 2015, arXiv:1511.07122. [Google Scholar] [CrossRef]
- Hossin, M.; Sulaiman, M.N. A review on evaluation metrics for data classification evaluations. Int. J. Data Min. Knowl. Manag. Process 2015, 5, 1. [Google Scholar] [CrossRef]
- Liu, Q.; Salberg, A.B.; Jenssen, R. A comparison of deep learning architectures for semantic mapping of very high resolution images. In Proceedings of the IGARSS 2018—2018 IEEE International Geoscience and Remote Sensing Symposium, Valencia, Spain, 22–27 July 2018; pp. 6943–6946. [Google Scholar] [CrossRef]
- Yakshit; Kaur, G.; Kaur, V.; Sharma, Y.; Bansal, V. Analyzing various machine learning algorithms with SMOTE and ADASYN for image classification having imbalanced data. In Proceedings of the 2022 IEEE International Conference on Current Development in Engineering and Technology (CCET), Bhopal, India, 23–24 December 2022; pp. 1–7. [Google Scholar] [CrossRef]
- Kohli, D.; Sliuzas, R.; Kerle, N.; Stein, A. An ontology of slums for image-based classification. Comput. Environ. Urban Syst. 2012, 36, 154–163. [Google Scholar] [CrossRef]


Disclaimer/Publisher’s Note: The statements, opinions and data contained in all publications are solely those of the individual author(s) and contributor(s) and not of MDPI and/or the editor(s). MDPI and/or the editor(s) disclaim responsibility for any injury to people or property resulting from any ideas, methods, instructions or products referred to in the content. |
© 2025 by the authors. Licensee MDPI, Basel, Switzerland. This article is an open access article distributed under the terms and conditions of the Creative Commons Attribution (CC BY) license (https://creativecommons.org/licenses/by/4.0/).