Abstract
Electrical sealing covers are widely used in various industrial equipment, where the quality of their metal-painted surfaces directly affects product appearance and long-term reliability. Micro-defects such as pores, particles, scratches, and uneven paint coatings can compromise protective performance during manufacturing. In the rapidly growing new energy vehicle (NEV) industry, battery charging-port sealing covers are critical components, requiring precise defect detection due to exposure to harsh environments, like extreme weather and dust-laden conditions. Even minor defects can lead to water ingress or foreign matter accumulation, affecting vehicle performance and user safety. Conventional manual or rule-based inspection methods are inefficient, and the existing deep learning models struggle with detecting minor and subtle defects. To address these challenges, this study proposes EIM-YOLO, an improved object detection framework for the automated detection of metal-painted surface defects on electrical sealing covers. We propose a novel lightweight convolutional module named C3PUltraConv, which reduces model parameters by 3.1% while improving mAP50 by 1% and recall by 3.2%. The backbone integrates RFAConv for enhanced feature perception, and the neck architecture uses an optimized BiFPN-concat structure with adaptive weight learning for better multi-scale feature fusion. Experimental validation on a real-world industrial dataset collected using industrial cameras shows that EIM-YOLO achieves a precision of 71% (an improvement of 3.4%), with mAP50 reaching 64.8% (a growth of 2.6%), and mAP50–95 improving by 1.2%. Maintaining real-time detection capability, EIM-YOLO significantly outperforms the existing baseline models, offering a more accurate solution for automated quality control in NEV manufacturing.
1. Introduction
In recent years, the quality of electrical sealing covers has directly affected the safety and reliability of new energy vehicles (NEVs), especially during long-term use under complex environmental conditions. Among these components, the charging-port sealing cover is a critical protective part, typically fabricated from aluminum alloy. Various micro-defects may arise during production processes, such as forging, machining, and anti-corrosion treatment, including gas pores, surface particles, scratches, and uneven paint coverage. Though often imperceptible to the naked eye, these defects can lead to water ingress or foreign matter accumulation under harsh weather or dusty conditions, potentially compromising vehicle performance and user safety. Therefore, high-precision and automated defect detection for charging-port sealing covers is significant.
Traditional inspection methods based on manual checks or rule-based algorithms suffer from efficiency, accuracy, and consistency limitations, particularly when dealing with small and inconspicuous defects. Due to their superior feature extraction capabilities, deep learning-based object detection models have gained increasing attention in industrial quality inspection in recent years. Representative approaches include two-stage detectors, such as Faster R-CNN [1], and single-stage detectors, such as RetinaNet [2], SSD series [3], YOLO series [4,5,6,7,8], STFE-Net [9], and DETR [10]. Zhu et al. proposed an enhanced same-scale feature fusion structure based on YOLOv5s, effectively strengthening information propagation between backbone and neck layers. The model significantly improved small defect detection accuracy on complex metal surfaces by integrating a CBAM-based attention mechanism and optimizing anchor generation with K-Means++ [11]. Yu et al. proposed a modified multi-feature fusion network (MFN) for end-to-end metal surface defect detection, significantly improving the model’s ability to extract complex defect features [12].
To address the technical challenges in detecting small and inconspicuous defects on the surface of charging-port covers for new energy vehicles, this paper proposes an improved YOLOv11n-based detection method named EIM-YOLO. A novel C3PUltraConv module is designed to significantly enhance the model’s perception capability and detection accuracy. The RFAConv [13] module is integrated into the backbone network to adjust receptive field weights dynamically. At the same time, the BiFPN-concat [14] mechanism is adopted in the neck structure to reduce redundant information and improve feature extraction. To overcome the limitation of YOLOv11n in detecting tiny and irregular defects, we propose a new loss function called InnerSIoU by combining the advantages of Inner [15] and SIoU [16], replacing the original CIoU [17]. This loss function improves the precision of bounding box localization by adaptively adjusting prediction box sizes and incorporating angle and shape costs. Experimental results demonstrate that InnerSIoU has superior robustness and generalization performance under different IoU thresholds.
In manufacturing new energy vehicles (NEVs), charging-port covers are critical components whose surface quality directly affects product safety and reliability. However, current mainstream detection models, particularly YOLOv11n, still face significant challenges in identifying minor defects on such components, including pores, scratches, and uneven paint coatings. First, YOLOv11n demonstrates limited capability in extracting fine-grained features of small-scale defects, leading to frequently missed or false detections, which compromise quality control accuracy. Second, these defects are typically minor and irregular in shape, making them difficult to detect even under manual visual inspection. In complex industrial backgrounds, subtle anomalies are often overlooked, potentially causing serious safety risks, such as water ingress or dust accumulation at the charging interface. Moreover, defect samples are commonly collected in challenging factory environments characterized by dust contamination, varying illumination, and image blur, further degrading data quality. Therefore, developing a highly accurate and reliable detection algorithm tailored for small-scale surface defects on NEV charging-port covers is essential, aiming to enhance automated inspection capabilities and ensure product quality and user safety.
The primary contributions of this research are structured as follows: Section 1 introduces the background, motivation, and overall methodology of this study, providing a comprehensive overview of the research objectives. Section 2 offers a detailed examination of the EIM-YOLO architecture, including a thorough discussion of its design principles and constituent modules. Section 3 describes the dataset creation process and the data augmentation techniques employed to enhance the model’s diversity and generalization capability. Section 4 presents the experimental setup parameter configurations and provides an in-depth evaluation of the results obtained. Section 5 concludes the paper with a summary of key insights and findings from this research.
2. Materials and Methods
As one of the most recent developments in the YOLO family, YOLOv11n [18] presents considerable improvements in real-time object detection performance, particularly in recognizing small-scale objects within cluttered or complex scenes. To evaluate its effectiveness, the model was trained and tested on a custom dataset comprising images of new energy vehicle (NEV) charging-port covers, where it demonstrated robust and reliable detection capabilities. YOLOv11n formulates the detection task as a regression-based learning problem, incorporating an improved convolutional neural network architecture that enables the simultaneous prediction of object categories and bounding box coordinates in a single forward inference pass [19]. This design effectively balances detection accuracy and computational efficiency, making it well-suited for deployment in practical industrial scenarios.
The selection of YOLOv11n as the foundational model was driven by several key benefits. Initially, it excels in real-time detection, offering rapid inference without compromising on precision, which makes it ideal for online inspection tasks within industrial environments. The training and inference of the model were performed on a high-performance system equipped with an NVIDIA RTX 4090D GPU (NVIDIA Corporation, Santa Clara, CA, USA), an Intel Xeon Platinum 8362 CPU (Intel Corporation, Santa Clara, CA, USA), and industrial cameras (OPT-WZK-C250-Q), lenses (OPT-WZK3528-D), and light sources (OPT-WZK160-W-RF) from OPT Machine Vision Tech Co., Ltd. (Dongguan, Guangdong, China) for capturing high-resolution images of the NEV charging-port covers.
Additionally, the use of lightweight techniques, such as depthwise separable convolution (DWConv) [20], significantly reduces computational overhead and enhances inference efficiency, making it suitable for deployment in resource-limited settings.
Moreover, introducing the C2PSA attention mechanism [21] enhances the model’s focus on critical feature regions, thereby improving localization accuracy and classification performance, features that are particularly beneficial for detecting minor or complex defects. The C3K2 module [22] further optimizes shallow feature extraction, contributing to a better understanding of fundamental features and enhancing surface defect detection capabilities.
Importantly, YOLOv11n has shown strong generalization ability and stability across various industrial detection tasks, confirming its suitability and effectiveness for defect detection in NEV charging-port covers. Consequently, YOLOv11n provides a robust technical foundation for subsequent enhancements.
2.1. Improved YOLOv11n Detection Model
YOLOv11, one of the leading object detection architectures, has been widely adopted for real-time and industrial applications thanks to its efficient design and strong performance across various tasks. However, when applied to defect detection in new energy vehicle (NEV) charging-port covers, YOLOv11 encounters several challenges.
One primary issue is the backbone network’s limited feature extraction capability, which hinders the effective capture of subtle or inconspicuous defects. Additionally, standard convolution operations impose significant computational demands and require a large number of parameters, posing obstacles for deployment in resource-limited environments. Moreover, the commonly used CIoU loss function does not adequately account for contextual information, particularly in complex backgrounds, thereby affecting the accurate localization of critical defect areas.
To address these limitations, this paper introduces an advanced detection framework named EIM-YOLO, which innovates upon the original architecture by improving three primary areas: the backbone network, feature fusion strategy, and loss function. The design of EIM-YOLO is illustrated in Figure 1: the EIM-YOLO model structure diagram. This study presents the design of a customized backbone module, named C3UltraPConv, as a novel alternative to conventional backbone components. Unlike standard modules typically employed in existing architectures, C3UltraPConv incorporates specifically engineered mechanisms to enhance feature learning and improve computational efficiency. The proposed design significantly increases the model’s sensitivity to minor defects while maintaining low resource consumption, thereby supporting its applicability in real-time industrial inspection scenarios. Furthermore, a novel spatial attention mechanism, Receptive-Field Attention Convolution (RFAConv) [23], shifts the focus from conventional spatial features to those based on receptive fields. This adjustment markedly increases the model’s sensitivity to significant regions.
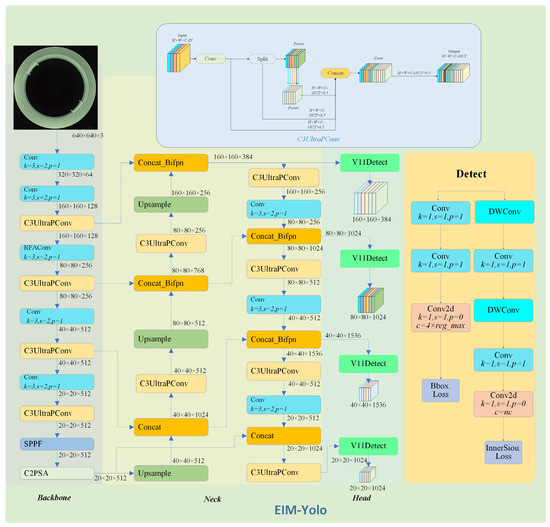
Figure 1.
EIM-YOLO model structure diagram.
Additionally, the framework integrates an enhanced BiFPN-concat [24] structure for refining multi-scale feature integration, thus improving adaptability and precision across various object sizes. To further boost performance, particularly in detecting defects of different dimensions, EIM-YOLO utilizes four specialized detection heads. Each head is optimized to process features corresponding to specific defect sizes, ranging from very small to large, thereby significantly enhancing accuracy and robustness across multiple scales.
Two primary techniques were employed to combine the outputs from the four detection heads into a single, unified detection result. First, Non-Maximum Suppression (NMS) was applied to remove redundant bounding boxes and retain only the most confident detection for each class, eliminating overlapping detections. Then, a weighted averaging fusion strategy was used to combine the bounding boxes, class predictions, and confidence scores from all detection heads, where each head was assigned a weight based on its accuracy.
This fusion ensures that the final detection results are both precise and non-redundant, further improving the overall detection performance. Lastly, a new loss function, InnerSIoU, was introduced to improve localization accuracy. By incorporating angle and shape perception mechanisms, InnerSIoU enhances bounding box regression accuracy, ultimately leading to improved detection of subtle defects within complex industrial settings.
Compared to the original YOLOv11n model, EIM-YOLO incorporates several important architectural improvements. In the backbone, the introduction of the C3UltraPConv and RFAConv modules enhances the extraction of subtle and complex defect features. The neck adopts an optimized BiFPN-concat structure for more efficient multi-scale feature fusion. In the head, EIM-YOLO employs four detection heads with different resolutions, which improves the detection accuracy for targets of varying sizes. Collectively, these innovations substantially improve the overall detection performance of the model in industrial surface defect scenarios.
2.2. C3UltraPConv Model
To enhance the detection accuracy of small-scale and morphologically complex defects while maintaining real-time performance, this paper proposes a novel C3UltraPConv module, designed to replace the original C3K2 module in YOLOv11n. This new module not only inherits the original module’s ability to adaptively adjust detection boxes based on defect size, but also introduces partial convolution (PConv) [25] technology.
Compared to traditional global convolution, PConv processes only the key regions of interest in an image, such as potential defect areas. As shown in Figure 2, three different methods are compared. The first method represents traditional convolution (purple), which processes the entire image evenly. The second method adopts an enhanced convolution approach, where convolution operations are adjusted based on the receptive field, focusing more on key areas. The third method introduces partial convolution (green), which focuses on processing areas of interest, such as potential defect regions, significantly reducing unnecessary computation and improving efficiency. The colored boxes in Figure 2 represent the different processing areas or layers in each method, with each color indicating a different feature extraction process: traditional convolution (purple), depth convolution (blue), and partial convolution (green). This design effectively reduces memory consumption, making it more suitable for real-time detection tasks in industrial environments.
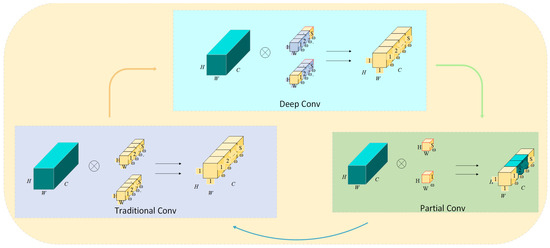
Figure 2.
Partial Conv model structure diagram.
From a structural perspective, the workflow of C3UltraPConv consists of the following steps: First, the input feature map undergoes preliminary processing through a standard convolutional layer. Next, the processed feature map is divided into two branches, which are then fed into separate PConv layers for localized feature extraction (Figure 3). The C3UltraPConv model structure diagram shows that this “local perception” advantage helps reduce redundant computation. Subsequently, the two feature maps are concatenated and passed through another convolutional layer for information fusion, ultimately generating a more refined feature representation.
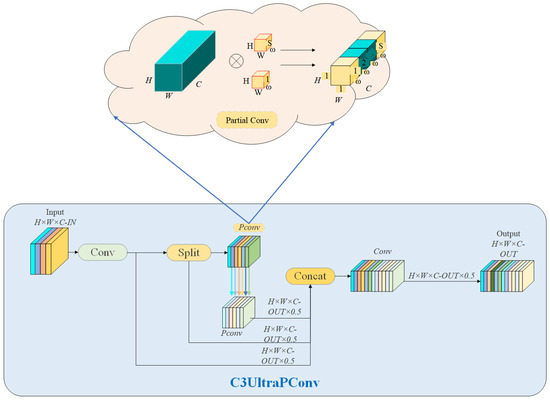
Figure 3.
C3UltraPConv model structure diagram.
This modular architecture improves the model’s capability to detect subtle defects in complex backgrounds and enhances overall inference efficiency without significantly increasing the number of parameters. Experimental results demonstrate the module’s robustness and adaptability when handling small targets and multi-scale defects.
2.3. RFAConv
In the defect detection task for charging-port covers of new energy vehicles, targets often suffer from deformation, occlusion, and interference from complex backgrounds. These challenges necessitate enhanced spatial awareness and greater resilience in the system’s design. To address these issues, this paper integrates the RFAConv module [26] into YOLOv11n, replacing conventional convolution operations. This module dynamically adjusts the weight distribution across different image regions based on input content by leveraging a Receptive-Field Attention Mechanism, thereby improving the system’s focus on critical defect areas.
As illustrated in Figure 4, the RFAConv model structure diagram compares the structural design of traditional convolution (left) with that of RFAConv (right). The latter incorporates an adaptive attention mechanism that tailors convolutional weights to local feature characteristics. This visual contrast highlights how RFAConv overcomes the limitations of parameter sharing by generating location-specific kernel weights, enabling more precise feature modeling.
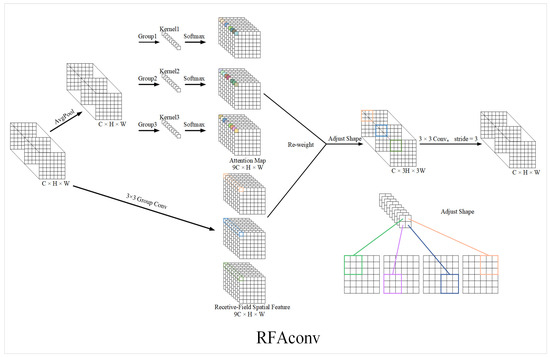
Figure 4.
RFAConv structure diagram.
The core structure of RFAConv consists of two key steps: multi-scale feature extraction and attention-weighted fusion. First, local receptive field features are extracted in parallel using convolution kernels of varying sizes. Subsequently, global information is integrated to generate attention weights, which are applied to features at each scale, enabling adaptive enhancement of key regions. This design significantly improves the model’s adaptability to target deformation and occlusion while strengthening its ability to suppress background interference.
Traditional convolution is limited by parameter-sharing mechanisms, making it challenging to capture local variations effectively. In contrast, RFAConv dynamically adjusts convolution kernel parameters based on the content of different locations, enabling more precise feature modeling. Specifically, the method computes specific attention weights for each receptive field. It combines them with the original convolution kernels to form a personalized convolution operation, thereby effectively alleviating the limitations imposed by parameter sharing.
The RFAConv [23] module introduces an innovative attention mechanism that dynamically enhances feature representation through receptive field-specific weighting. As illustrated in Figure 4, the input feature map X is first processed by global average pooling and a 1 × 1 convolution, followed by SoftMax normalization to generate the global attention map A_rf. In parallel, the input X is also processed by a k × k convolution, normalization, and ReLU activation to extract localized spatial features F_rf. The final output feature F is calculated as follows:
where g1×1 and gk×k denote 1 × 1 and k × k convolution operations, respectively; Norm represents normalization; and ⋅ indicates element-wise multiplication. This process fuses global attention and localized features, adaptively enhancing the model’s ability to focus on key regions, which is beneficial for detecting minor and complex defects. Figure 4 presents the structure and main computational flow of the RFAConv module, illustrating the parallel processing and weighted fusion of feature branches. The diagram emphasizes the functional logic of the module; in actual implementation, it does not increase the dimensionality or physical concatenation of feature tensors.
2.4. Bidirectional Feature Pyramid Network
In object detection, targets of varying scales often display markedly different feature representations within an image. Traditional feature fusion methods, such as FPN and PANet, treat each feature layer’s contribution equally, neglecting the differences in their actual importance during task execution [26]. This constraint limits the efficacy of feature fusion, especially impacting the detection accuracy for small objects.
To address this issue, EIM-YOLO introduces a Bidirectional Feature Pyramid Network (BiFPN) as the core component of its neck architecture, replacing the traditional concatenation operation, as illustrated in Figure 5. In the BIFPN model structure diagram, the BiFPN builds an efficient cross-scale connection structure that enables high-resolution feature maps to incorporate low-level semantic information. At the same time, low-resolution feature maps can fuse high-level, detailed features. This bidirectional design significantly enhances the overall feature expression capability.
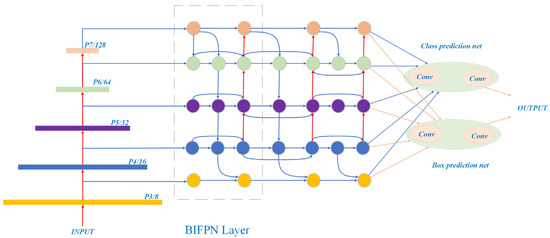
Figure 5.
Structure diagram of the BIFPN model.
Moreover, BiFPN incorporates a learnable weight mechanism that allows the network to adjust the contribution ratio of different scale feature maps during the fusion process, achieving more accurate and adaptive feature integration. This mechanism is especially crucial for identifying minor and structurally complex defects on the charging-port covers of new energy vehicles, helping to improve the model’s sensitivity to subtle features and providing high-quality feature representations for subsequent detection tasks.
2.5. Improvement of the Loss Function
When addressing the detection of inconspicuous samples, the CIOU loss function initially integrated into YOLOv11n exhibits certain limitations, demonstrating only moderate performance and inadequate generalization. This suggests that the model may not meet expectations when identifying subtle or barely visible targets, thereby restricting its efficacy in complex scenarios. The ratio is a dynamic scaling factor used to adjust the size of the bounding box, allowing the model to adapt to varying target sizes. It enables fine-tuned control over the bounding box’s dimensions, with a range between 0.7 and 1.5, where smaller values shrink the bounding box and larger values enlarge it. To justify the chosen value, we conducted a discrete sensitivity analysis over ratio ∈ {0.7, 0.8, 1.0, 1.2, 1.5} under the same training and evaluation protocol; 0.7 delivered the best and most stable precision and mAP50, and we therefore fixed the value at 0.7 throughout this paper. This enhancement allows for precise adjustments to the shape and position of the bounding boxes, which is essential for accurately recognizing and localizing new energy vehicle charging-port covers. The dynamic scaling of prediction box dimensions plays a crucial role in detecting small-scale defects on charging ports, significantly boosting the model’s capability to identify defects of varying sizes. Further optimization of the model’s performance is illustrated in the subsequent equation:
The coordinates of the adjusted bounding boxes, both for b1 and b2, are defined based on the original bounding box dimensions and a scaling factor, known as the ratio. Specifically, represents the x-coordinate at the top-left corner of the adjusted bounding box, while denotes the x-coordinate at the top-right corner. is the width of the original bounding box, which is used to calculate the size scaling of the bounding box. The ratio is a scaling factor that dynamically adjusts the size of the bounding box, allowing it to expand or contract. Similarly, represents the y-coordinate at the top-left corner of the adjusted bounding box, and represents the y-coordinate at the bottom-right corner of the adjusted bounding box.
As shown in Figure 6, the description of Inner-IoU, the same set of calculations applies to the second bounding box b2. In this case, represents the x-coordinate at the top-left corner of the second adjusted bounding box, while denotes the x-coordinate at the top-right corner. Similarly, and represent the y-coordinates at the top-left and bottom-right corners of the second bounding box, respectively. Like b1, is the width of the original bounding box for b2, and the ratio is applied to adjust its size accordingly. The heights, and , of the original bounding boxes are scaled by the ratio in the vertical direction to adjust the bounding boxes’ height, ensuring that both width and height are dynamically scaled according to the ratio.
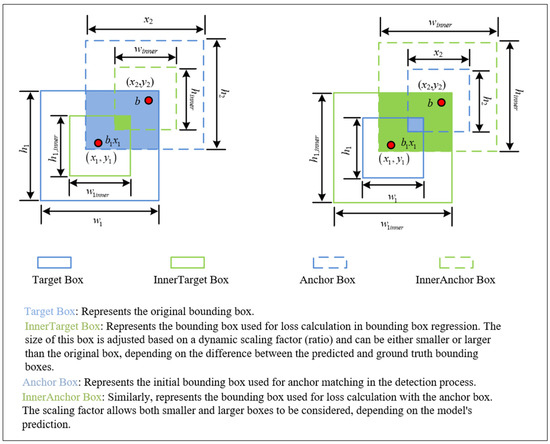
Figure 6.
Description of Inner-IoU.
The model improves localization accuracy by calculating the overlapping region between predicted and ground truth bounding boxes. This approach enhances the detection performance, particularly for small objects. When computing the union area, the method subtracts the intersection from the total area of both boxes. The concept of calculating Intersection over Union (IoU) to optimize model performance has been widely discussed in previous works, such as the method proposed by Zhang et al. for improving IoU-based loss functions in bounding box regression [27]. This is shown in the following equation:
The model evaluates localization accuracy by calculating the distance loss, which measures the horizontal and vertical offsets between the centers of predicted and ground truth bounding boxes. Precise estimation of these offsets contributes to better spatial awareness. To further refine the localization performance, an exponential function is applied to smooth the influence of positional deviations. This enhances the model’s sensitivity to small differences in object positioning, leading to improved detection accuracy.
Such improvements are especially critical in defect detection tasks for new energy vehicle (NEV) charging-port covers, where even slight localization errors can affect the reliability of quality assessments. This is shown in the following equation:
The parameters scx and scy represent the horizontal and vertical deviations (center position differences) between the predicted and ground truth bounding boxes. Similarly, scw and sch represent the width and height deviations, respectively, between the predicted and ground truth bounding boxes.
These parameters measure the deviations (offsets) between the predicted and ground truth bounding boxes in the horizontal (x-axis) and vertical (y-axis) directions, capturing variations in their positions, widths, and heights. These differences help quantify scale variation in the x and y directions, are always positive, and used to penalize positional misalignments between the predicted and actual bounding boxes. The parameter σ, as defined in Equation (11), denotes the sum of squared height and width deviations between the centers of the two bounding boxes.
The exponential function within the distance cost enables the loss function to capture variations in positional information flexibly. sx and sy are used to quantify the width and height differences between the predicted and ground truth bounding boxes, reflecting the relative scale variations in the x and y directions, and are always positive.
In Equation (15), the symbol α represents the angle between the centers of the predicted and ground truth bounding boxes. α is calculated based on the horizontal and vertical distance differences, as well as the relative orientation of the bounding boxes. The angle cost measures the rotational discrepancy between the predicted and actual bounding boxes, helping the model handle variations in object orientation. This is particularly valuable when detecting objects with significant rotational differences across various instances. The inclusion of α in the loss function helps the model fine-tune its predictions, aligning the predicted bounding boxes with the ground truth boxes more accurately by minimizing angular misalignments.
The model utilizes the angle cost to measure the rotational discrepancy between the predicted and actual bounding boxes, aiding the model in handling variations in object orientation. While all bounding boxes in the dataset are axis-aligned, the angle cost remains crucial, especially for detecting objects with significant rotational differences across various instances in real-world scenarios. By including the α term in the loss function, the model minimizes angular misalignments, optimizing bounding box predictions and improving alignment with the ground truth. This mechanism helps the model significantly enhance detection accuracy when dealing with objects that exhibit varying rotations.
The intuition behind the angle cost is that it penalizes the angular deviation between the predicted and ground truth bounding boxes, making the model more sensitive to rotational errors. This encourages the model to align the orientation of predicted boxes more closely with the true boxes, which is especially important for rotated or irregularly shaped objects. As a result, the angle cost improves the model’s robustness to rotational misalignments and enhances detection accuracy in practical scenarios. The shape cost introduces two scaling factors, ωw and ωh, which control the model’s sensitivity to mismatches in width and height, respectively. The shape cost is formulated as follows:
The angle cost penalizes the angular deviation between the predicted and ground truth bounding boxes, enhancing the model’s capability to detect rotated or irregularly shaped objects accurately. Specifically, angle cost is calculated using the normalized offsets (scw, sch) between box centers, as described in Equations (13) and (14). The shape cost, defined in Equation (16), uses scaling factors wω and ωh to assess the width and height discrepancies. This approach effectively captures geometric differences, refining alignment precision, especially when detecting objects of varying sizes and shapes.
Selecting InnerIoU as the loss function enables the model to better adapt to objects of different scales and allows for more precise control over the location and shape of the detected targets. This approach provides a highly efficient, accurate, and practically valuable technical foundation for quality inspection of critical components, significantly enhancing the model’s reliability in real-world industrial detection scenarios. Building upon this, the computation of InnerIoU can be formulated as follows:
The final loss function, LSIoU, combines position, scale, angle, and shape costs to improve bounding box regression. In the loss calculation, distance cost and shape cost are subtracted from the IoU value to maximize the overlap between predicted and ground truth boxes, thereby enhancing localization accuracy. IoU measures the overlap area, while IoUinner refers to the overlap of the inner regions between boxes when the Inner = True configuration is applied, with a scaling factor (ratio = 0.7) to adjust the bounding box size.
3. Dataset Building
In this study, we constructed a comprehensive dataset by collecting images on site from an industrial production line using an OPT industrial camera. Nine-thousand six-hundred and thirty-nine defect annotations were manually labeled, encompassing nine defects: Scratch, Pile of powder, Particle, Mixed powder, Porosity, Deformation, Pinhole, Black spot, and Bottom leakage defect, as illustrated in Figure 7. The dataset comprises 1280 original images. These images are annotated defect-wise, meaning each defect is individually labeled, allowing the model to be trained on each defect type independently and ensuring a clear distinction between defect categories. Additionally, to enhance model performance and robustness, several image augmentation techniques were applied to the dataset, including rotation (90°, 180°, and 270°) to simulate slight rotations and varied object orientations, Gaussian noise injection with two levels of variance (50 and 80) to simulate noise, and brightness adjustments with increases and decreases of 10% and 20%.
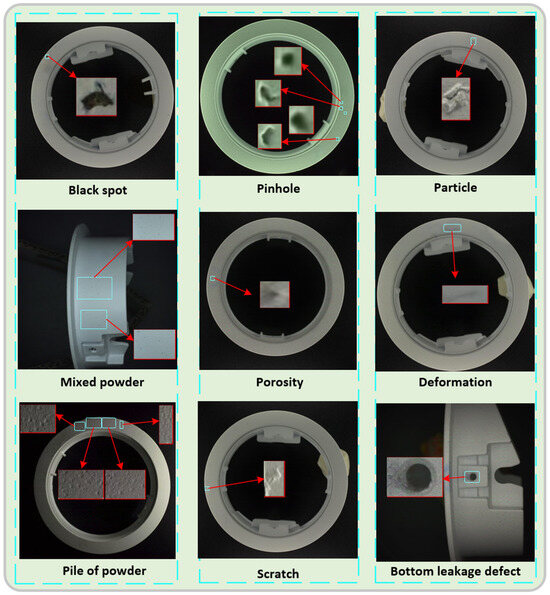
Figure 7.
EIM-YOLO defect-types diagram.
To mitigate the loss of fine details caused by image downscaling, we employed a multi-scale feature extraction approach using four detection heads, each with different feature map resolutions. This enables the model to capture high-level semantic information and fine spatial details, enhancing detection performance for minor and subtle defects [28].
The dataset used in this study consists of images annotated on a per-defect basis, with each defect within an image independently labeled. Nine types of defects were included in the dataset: Scratch (239 images, 9.8%), Pile of powder (243 images, 10.0%), Particle (661 images, 27.1%), Mixed powder (178 images, 7.3%), Porosity (246 images, 10.1%), Deformation (105 images, 4.3%), Pinhole (33 images, 1.3%), Black spot (133 images, 5.5%), and Bottom leakage defect (241 images, 9.9%). Additionally, no images in the dataset were labeled as containing no defects, with all images containing one or more types of defects, which aligns with the dataset’s focus on defect detection in industrial settings.
To ensure a more balanced representation of all classes and support effective model training, we applied data augmentation techniques to underrepresented categories. These techniques included cropping, brightness adjustment, rotation, and Gaussian noise injection [29], as shown in Figure 8 (EIM-YOLO data augmentation structure diagram). The final dataset was divided into a training set comprising 4048 images and a validation set of 1012 images. The validation set was used exclusively for performance evaluation and model generalization testing, ensuring it was not involved in the training process and helping prevent overfitting. The validation set remained independent of the training process, providing a fair evaluation of the model’s performance.
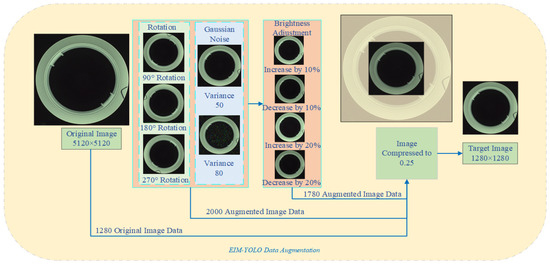
Figure 8.
EIM-YOLO data augmentation structure diagram.
4. Experimental Results and Analysis
In this chapter, we discuss the series of experiments we conducted using a real-world industrial dataset collected on site to evaluate the performance of the proposed EIM-YOLO model. The experiments are structured as follows:
First, we present an ablation study (Section 4.3), where the contributions of each core module—C3UltraPConv, four detection heads, RFAConv, and BiFPN—are individually assessed by removing them and measuring the impact on detection performance. Second, we analyze the impact of different loss functions, with special attention to the proposed InnerSIoU (Section 4.4), and compare their performance across key evaluation metrics. Third, we conduct a comparative analysis with several widely used YOLO-based models (Section 4.5) under the same testing conditions to highlight EIM-YOLO’s advantages in detection accuracy, robustness, and adaptability.
Additionally, we apply baseline models and the improved EIM-YOLO to authentic images from industrial production lines to verify practical applicability.
4.1. Evaluation Indicators
To comprehensively evaluate the model’s performance, we selected several key metrics for assessment, including precision [30], mean average precision (mAP50) [31], recall (R) [32], and the total number of model parameters. These metrics collectively provide a multi-dimensional perspective on the model’s detection accuracy, robustness, and computational efficiency. Among them, precision and recall are calculated based on the number of true positives (TPs), false positives (FPs), and false negatives (FNs), as defined in the following equations:
In addition, several quality metrics are used to evaluate the model’s performance, including precision, mAP50, and mAP50–95. Precision measures the accuracy of predicted positive samples, while recall refers to the true positive rate. APi denotes the average precision (AP) for each class, obtained from the area under the precision–recall curve. The mAP in Equations (22) and (23) represents the mean of all class-specific APs. Specifically, mAP50 in Equation (22) is calculated at an IoU threshold of 0.5, whereas mAP50–95 in Equation (23) evaluates the mean average precision over IoU thresholds from 0.5 to 0.95, providing a stricter assessment of model performance.
The superiority of our method, as discussed in Section 4.2 and Section 4.3, is based on these metrics, which offer a robust and well-accepted framework for evaluating detection performance. The metrics, especially mAP0.5 and mAP50–95, have been widely used in the literature to assess the accuracy of object detection models, particularly when comparing detection methods across different tasks. This ensures that our evaluation is consistent with standard practices and compares the model’s capabilities fairly.
In particular, using mAP metrics across multiple IoU thresholds (0.5 to 0.95) allows for a more comprehensive analysis of detection performance across varying degrees of localization precision. These metrics were selected explicitly because they balance detection accuracy with recall and localization precision, which are critical when evaluating the effectiveness of a model for defect detection in industrial settings.
4.2. Experimental Environment and Parameter Settings
In this study, we performed all experiments on a Linux-based system utilizing the PyTorch 1.8.1 deep learning framework coupled with CUDA 11.3 for efficient GPU acceleration. All input images were resized uniformly to a resolution of 640 × 640 pixels before being fed into the model.
To clarify, all original defect images were initially collected at a resolution of 5120 × 5120 pixels, as shown in Figure 8. These images were resized to 1280 × 1280 pixels to preserve critical details and then downscaled to 640 × 640 pixels to meet the model’s input requirements and ensure efficient computation. This resizing process was designed to strike a balance between computational efficiency and performance.
Each model underwent training for 200 epochs to ensure complete convergence and achieve the final optimized network configuration. The training was conducted on a high-performance system equipped with an NVIDIA RTX 4090D GPU and an Intel Xeon Platinum 8362 CPU, providing the computational power necessary for both training and inference tasks. The detailed hardware configuration of the experimental platform is listed in Table 1. All models and tensor operations were executed on CUDA-enabled devices to maximize the hardware’s capabilities. The training parameters included a dynamically adjusted batch size of 64, a constant learning rate of 0.01, the use of the Adam optimizer that adapts the learning rate during training, and a ratio of 0.7 for adjusting the size of the bounding boxes.

Table 1.
Hardware configuration of the experimental platform.
We initialized the model with pre-trained weights to mitigate overfitting and improve training efficiency. This allowed the model to leverage generalized feature representations, reducing the risk of overfitting on the small dataset. Data augmentation techniques were also applied, including cropping, rotation, brightness adjustment, and noise injection.
The comparison of our method’s performance to existing methods in the literature is based solely on these standard evaluation metrics, including precision, recall, and mAP. The results reflect a robust and quantitative comparison of the performance achieved by our method, highlighting improvements, particularly in terms of small object detection, as measured by the evaluation metrics specified above.
4.3. Optimizing the Module Ablation Experiment
The experimental findings indicate that the gradual introduction of the C3UltraPConv, FourD, BiFPN-Concat, and RFAConv modules, EIM-YOLO, significantly improves multiple key performance indicators while maintaining a lightweight structure.
When only the C3UltraPConv module (EIM-A) is introduced, recall increases from 0.588 in the baseline to 0.620, an improvement of 3.2%. The mAP50 also improves by 1.0%, indicating that this module enhances detection completeness. Subsequently, adding the FourD module in EIM-B increases precision from 0.676 to 0.699, representing a 3.4% improvement, demonstrating its advantage in bounding box prediction accuracy.
The FourD module integrates the outputs of four detection heads in YOLOv11, each operating on features at a different scale. This design enables the model to handle objects of varying sizes more effectively; by aggregating multi-scale predictions, FourD significantly improves mAP and recall for multi-scale detection. In terms of complexity, the modification is confined to the detection head while the backbone and neck remain unchanged, keeping the added parameters and computation controlled. As summarized in Table 2, the total parameter count increases from 2.583 M (YOLOv11n) to 3.25 M (EIM-YOLO). We also initialize with pretrained weights to mitigate overfitting. Under this trade-off, no overfitting is observed on the validation set, and metrics such as precision and mAP improve consistently.
Table 2.
Performance comparison of the ablation experiment. “√” indicates that the module is included; “—” indicates that the module is not used.
Further incorporation of the BiFPN-Concat module to form EIM-C results in recall increasing to 0.626, a 3.8% improvement over the baseline. mAP50 reaches 0.643 (+2.1%) and mAP50–95 reaches 0.357 (+1.6%). These results highlight the module’s multi-scale feature fusion and excellence in detail preservation.
Finally, integrating the RFAConv module to complete the EIM-YOLO model yields optimal performances across all metrics: precision further improves to 0.710 (+3.4%), mAP50 reaches 0.648 (+2.2%), and mAP50–95 increases to 0.353 (+1.8%).
Figure 9 presents a comparative analysis of the defect detection performance across different models. We can observe a progressive enhancement in various metrics by introducing each new module. The figure clearly illustrates how each additional component contributes to improved performance. Furthermore, the results of the ablation study, summarized in Table 2, provide a quantitative assessment of the impact of each module on model performance. These findings offer compelling evidence of the effectiveness and essentiality of each module in achieving superior detection accuracy.
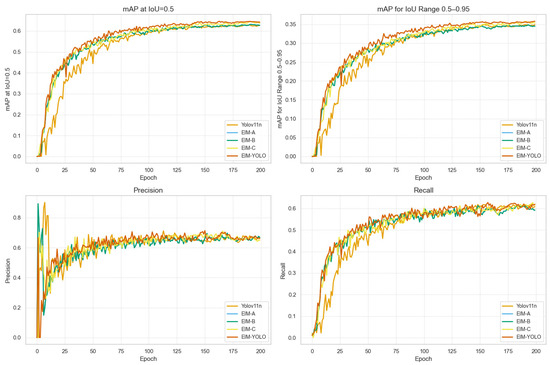
Figure 9.
Comparative analysis of defect detection performance with different integrated modules.
Experimental results demonstrate that integrating different modules yields varying effects on detection performance. Incorporating the C3UltraPConv module improves both mAP50 and recall, with mAP50 increasing from 0.622 to 0.632 and recall rising from 0.588 to 0.620, highlighting enhanced sensitivity to defect samples. Introducing the BiFPN module significantly boosted precision from 0.676 to 0.706, and a moderately increased in recall to 0.593, with mAP50 slightly increasing to 0.625. In contrast, adding the RFAConv module further elevates precision to 0.714, while recall shows a minor improvement to 0.589. However, it is noteworthy that the mAP50 of RFAConv (0.589) is lower than that of the baseline, indicating that RFAConv, when used alone, may primarily enhance precision for detected bounding boxes but does not necessarily improve overall detection accuracy. These findings underscore the complementary strengths of each module and the importance of integrating multiple improvements to achieve balanced and robust detection performance across all evaluation metrics.
In summary, EIM-YOLO effectively enhances detection accuracy and robustness under complex backgrounds and small target scenarios by introducing four core modules sequentially without significantly increasing computational costs. This makes it highly valuable for engineering applications, particularly in high-precision quality inspection tasks, such as defect detection on new energy vehicle charging-port covers.
The plots for precision and recall in Figure 9 show a clear improvement as training progresses. Despite some fluctuations, which may be due to inherent variability during model training, the overall trend demonstrates significant gains in both precision and recall. This improvement is consistent and aligns with the primary goal of our study: enhancing defect detection accuracy. These fluctuations could be attributed to factors such as dataset diversity, model architecture, and hyperparameter settings, but based on our observations, they have not affected the significant performance improvements achieved in this study.
4.4. Loss Function Improvement and Performance Evaluation
In this study, we employ several advanced bounding box regression loss functions to improve detection performance. First, the Complete Intersection over Union (CIoU) Loss improves the traditional IoU by considering not only the overlap area between the predicted and ground truth boxes but also the center distance and aspect ratio. This makes CIoU a more comprehensive bounding box regression metric, speeding up convergence and improving localization accuracy, particularly when the alignment of boxes is inaccurate [33]. Next, the Generalized Intersection over Union (GIoU) Loss extends IoU by introducing a penalty for cases where the predicted and ground truth boxes do not overlap. This extension is especially useful when the predicted and ground truth boxes have little overlap, and it significantly enhances localization accuracy, particularly in complex scenarios [34]. The Distance Intersection over Union (DIoU) Loss further optimizes bounding box regression by minimizing the normalized distance between the centers of the bounding boxes. This approach ensures that the model not only focuses on the overlap area but also the spatial relationship between the boxes, leading to more accurate predictions, particularly when handling large objects or significant box displacement [35]. The SIoU Loss (Scylla IoU) introduces additional geometric constraints, such as angle and shape, increasing the model’s sensitivity to subtle position and shape differences, making it particularly effective in detecting small or irregularly shaped defects [36]. The INTER CIoU Loss enhances CIoU by adding constraints based on the interaction and intersection region analysis between bounding boxes. This version of CIoU is particularly suited for dense or overlapping objects, as it evaluates the interaction between bounding boxes and optimizes the loss based on their intersection region, improving performance when objects are close or overlapping, which is especially common in industrial defect detection [37]. Finally, the proposed InnerSiou loss integrates angle and shape perception into the bounding box regression loss. This further improves detection accuracy for small targets.
The experimental results reveal that the INTER SIoU loss function achieves the highest precision of 0.714, indicating its significant advantage in bounding box prediction accuracy. In terms of mAP50, INTER SIoU reaches 0.648, outperforming all other loss functions and demonstrating its superior detection precision under a high IoU threshold. For mAP50–95, INTER SIoU performs comparably to several other loss functions but still shows the best overall performance when considering all metrics together.
In Table 3, we report the performance improvements achieved by INNER SIoU. The INNER SIoU loss function enhances the model’s sensitivity to small objects, improving detection accuracy, particularly for minor defects. These improvements are reflected in the confusion matrices shown in Figure 10, comparing EIM-YOLO with and without INNER SIoU. Figure 11 further demonstrates the detection results, where the model with INNER SIoU successfully detects small defects, such as porosity and scratches, with improved precision compared to the version without INNER SIoU.
Table 3.
Comparative analysis of loss functions.
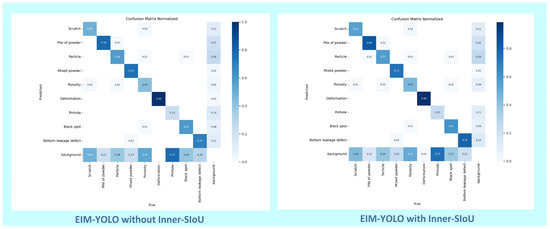
Figure 10.
Confusion matrices for EIM-Yolo with and without the Inner-SIoU loss function.
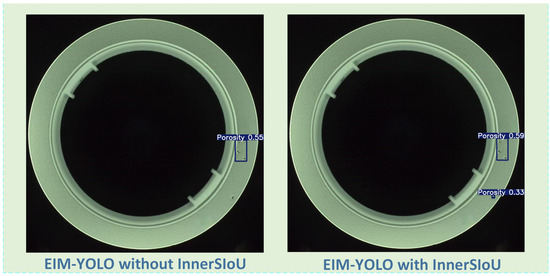
Figure 11.
Detection results of EIM-YOLO with and without INNER SIoU on porosity defects.
To clarify the loss functions used in Table 3, we employed several key loss functions throughout our experiments to optimize the model’s performance. We primarily used IoU-based loss functions such as CIoU, DIoU, and GIoU, as well as innovative terms like angle loss and shape loss. These losses focus on improving the localization accuracy and precision of the predicted bounding boxes, especially for minor or irregular defects. The goal of these loss functions is to enhance the model’s ability to predict bounding boxes with higher accuracy, particularly for small or subtle defects, rather than classifying defects into categories.
Finally, we incorporated angular and shape losses to improve small object detection, particularly when object boundaries are unclear. These losses help the model better align object positioning and shape, enhancing detection accuracy. In summary, EIM-YOLO with the proposed INNER SIoU loss function significantly improves key performance indicators, such as precision and mAP50, making it an efficient, accurate, and valuable solution, particularly for quality control tasks in new energy vehicle charging-port covers.
4.5. Performance Comparison of Different Detection Algorithms
We present confusion matrices based on the validation set to evaluate further the classification capabilities of both the EIM-YOLO and YOLO11n models. Figure 12 shows the normalized confusion matrices for the two models. These matrices illustrate the models’ performance in classifying various defect categories.
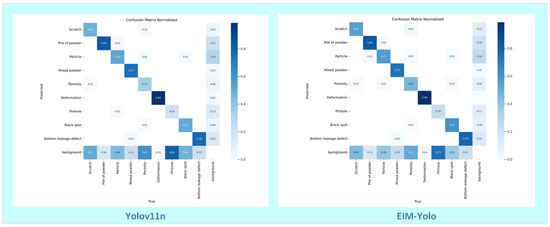
Figure 12.
Comparison of normalized confusion matrices for the YOLO V11n (left) and EIM-YOLO (right) models.
Figure 12 (left) shows the confusion matrix for the YOLOv11n model. While the model performs reasonably well across various defect categories, it exhibits higher misclassification rates, particularly between similar categories like Mixed Powder and Porosity. This suggests that the model may struggle with classifying subtle or fine defects accurately.
Figure 12 (right) shows the confusion matrix for the EIM-YOLO model. Compared to YOLOv11n, EIM-YOLO demonstrates a clear advantage in detecting subtle defects. Its misclassification rates are lower, particularly for defects like Particle and Pinhole, where the model effectively distinguishes between different defect types. However, Pinhole detection still presents some challenges, as its small size and irregular shape can lead to occasional misclassifications, especially in the presence of noise or complex backgrounds. Despite this, EIM-YOLO still achieves better performance on Pinhole defects compared to YOLOv11n. The matrix analysis, along with the experimental results, indicates that EIM-YOLO achieves higher accuracy, especially in detecting small and subtle defects such as Particle and Pinhole, which is crucial for applications in industrial settings.
Overall, the EIM-YOLO model, with its enhanced architecture and improved algorithm, significantly improves classification accuracy, especially when detecting minor or subtle defects, providing a more reliable solution.
4.6. Comparative Analysis of Overall Detection Performance
First, EIM-YOLO shows clear advantages on key performance metrics. The model achieves a recall of 0.63, indicating a marked improvement over other versions in identifying all true defects; mAP50 of 0.648, surpassing all baseline models and demonstrating higher accuracy at a high IoU threshold; and mAP50–95 of 0.358, further confirming robustness and generalization across varying IoU thresholds. Although the parameter count is 3.25 M, slightly higher than some lightweight models, this increase is reasonable and worthwhile given the substantial performance gains; the added capacity yields better feature representation and more precise detection without compromising overall efficiency. In addition, under the current evaluation setting, EIM-YOLO achieves a measured speed of 149 FPS (about 6.7 ms per frame), which meets practical real-time requirements. With a slight decrease in FPS and a moderate increase in GFLOPs, we observe precision 0.714, mAP50 0.648, and mAP50–95 0.353, all higher than YOLOv11n. Overall, this is a controlled trade-off that provides steadier gains in accuracy and mAP without affecting practical use.
Table 4 provides a detailed comparison of defect detection performance across different models. EIM-YOLO consistently outperforms YOLOv8 and YOLOv10 in various metrics. Specifically, Table 4 highlights the performance of EIM-YOLO in identifying typical defects.
Table 4.
Performance comparative results of different models.
As illustrated in Figure 13 (comparative analysis of defect detection performance across different models), in the defect detection task for new energy vehicle charging-port covers, EIM-YOLO demonstrates higher confidence and detection accuracy in identifying typical defects, such as Scratches, Particles, and Porosity, compared to YOLOv8 and YOLOv10. Specifically, YOLOv8 and YOLOv10 exhibit significant missed detections during recognition, with low confidence scores for specific defect categories.
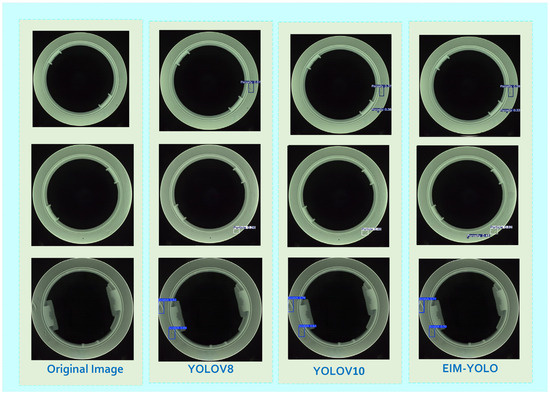
Figure 13.
Comparative analysis of defect detection performance across different models.
For instance, YOLOv8 achieves a confidence score of only 0.28 in detecting Particles, leading to missed detections in practical applications. In contrast, EIM-YOLO improves the confidence score for this defect type to 0.62, effectively reducing the number of missed detections. Moreover, EIM-YOLO successfully detects Porosity defects missed by both YOLOv8 and YOLOv10, achieving a confidence score of 0.46. This validates the EIM-YOLO algorithm’s superior performance in defect detection for new energy vehicle charging-port covers, highlighting its enhanced robustness and practical applicability.
5. Conclusions
This paper proposes an improved YOLOv11n-based defect detection framework, named EIM-YOLO, designed explicitly for the surface defect inspection of charging-port covers in new energy vehicles. To address the challenges posed by small-target defects, complex background interference, and limited data diversity, we introduce several key innovations: First, the lightweight C3UltraPConv module integrates attention mechanisms to enhance feature extraction efficiency and accuracy; Second, the RFAConv module dynamically adjusts receptive field weights to strengthen feature perception in critical defect regions; and Third, the FourD detection head enables adaptive multi-scale prediction, achieving accurate localization and classification, even in complex scenarios. We propose a novel loss function tailored to improve model robustness and performance on imbalanced datasets and subtle defect detection tasks. Experimental results demonstrate significant improvements: EIM-YOLO achieves a precision of 71% (an improvement of 3.4%), with mAP50 reaching 64.8% (an increase of 2.6%) and mAP50–95 improving by 1.2%. These enhancements effectively reduce the risk of missed or false detections, significantly boosting model stability and industrial applicability.
We will expand the dataset with more diverse and representative samples collected under real industrial conditions. Our current data are mainly defect images; next, we will systematically collect more defect-free images across additional stations, viewpoints, and lighting conditions, and report deployment-oriented metrics—image-level false positive rate, spurious boxes per image, and false alarms per 1000 parts. In parallel, we plan to build an integrated system that couples automated data acquisition with online defective-product rejection, which we expect to strengthen generalization and lay the groundwork for intelligent, end-to-end surface defect detection.
Author Contributions
Conceptualization, Z.W.; Methodology, Z.W.; Software, Z.W.; Validation, Z.W.; Formal Analysis, Z.W.; Investigation, Z.W.; Resources, Z.W.; Data Curation, Z.W.; Writing—Original Draft Preparation, Z.W.; Writing—Review and Editing, L.Y.; Visualization, Z.W.; Supervision, L.Y.; Project Administration, L.Y.; Funding Acquisition, L.Y. All authors have read and agreed to the published version of the manuscript.
Funding
This research was funded by the China University Innovation Fund for Industry–Academia–Research Collaboration from the Ministry of Education (Grant No. 2024HY010) and the National Natural Science Foundation of China (Grant No. 51175474).
Institutional Review Board Statement
Not applicable.
Informed Consent Statement
Not applicable.
Data Availability Statement
Datasets are available upon request from the corresponding authors.
Acknowledgments
All authors would like to thank the reviewers for their valuable contributions, which have significantly enhanced the quality of our research. We also extend our heartfelt gratitude to the editors for their meticulous attention and insightful feedback, which have contributed considerably to refining and improving this research. Additionally, we would like to express our sincere appreciation to Yongjian Zhu for his guidance and support in completing this paper.
Conflicts of Interest
The authors declare no conflicts of interest.
References
- Wang, T.; Su, J.; Xu, C.; Zhang, Y. An Intelligent Method for Detecting Surface Defects in Aluminium Profiles Based on the Improved YOLOv5 Algorithm. Electronics 2022, 11, 2304. [Google Scholar] [CrossRef]
- Ma, Z.; Li, Y.; Huang, M.; Huang, Q.; Cheng, J.; Tang, S. A Lightweight Detector Based on Attention Mechanism for Aluminum Strip Surface Defect Detection. Comput. Ind. 2022, 136, 103585. [Google Scholar] [CrossRef]
- Le, H.F.; Zhang, L.J.; Liu, Y.X. Surface Defect Detection of Industrial Parts Based on YOLOv5. IEEE Access 2022, 10, 130784–130794. [Google Scholar] [CrossRef]
- Ma, Y.; Yin, J.; Huang, F.; Li, Q. Surface defect inspection of industrial products with object detection deep networks: A systematic review. Artif. Intell. Rev. 2024, 57, 333. [Google Scholar] [CrossRef]
- Shi, J.; Yang, J.; Zhang, Y. Research on Steel Surface Defect Detection Based on YOLOv5 with Attention Mechanism. Electronics 2022, 11, 3735. [Google Scholar] [CrossRef]
- Diwan, T.; Anirudh, G.; Tembhurne, J.V. Object detection using YOLO: Challenges, architectural successors, datasets and applications. Multimed. Tools Appl. 2023, 82, 9243–9275. [Google Scholar] [CrossRef]
- Bao, W.; Du, X.; Wang, N.; Yuan, M.; Yang, X. A Defect Detection Method Based on BC-YOLO for Transmission Line Components in UAV Remote Sensing Images. Remote Sens. 2022, 14, 5176. [Google Scholar] [CrossRef]
- Hussain, M. YOLO-v1 to YOLO-v8, the Rise of YOLO and Its Complementary Nature toward Digital Manufacturing and Industrial Defect Detection. Machines 2023, 11, 677. [Google Scholar] [CrossRef]
- Zhong, H.; Fu, D.; Xiao, L.; Zhao, F.; Liu, J.; Hu, Y.; Wu, B. STFE-Net: A multi-stage approach to enhance statistical texture feature for defect detection on metal surfaces. Adv. Eng. Inform. 2024, 61, 102437. [Google Scholar] [CrossRef]
- Zhang, L.; Yan, S.-f.; Hong, J.; Xie, Q.; Zhou, F.; Ran, S.-l. An improved defect recognition framework for casting based on DETR algorithm. J. Iron Steel Res. Int. 2023, 30, 949–959. [Google Scholar] [CrossRef]
- Zhu, X.; Liu, J.; Zhou, X.; Qian, S.; Yu, J. Enhanced Feature Fusion Structure of YOLOv5 for Detecting Small Defects on Metal Surfaces. Int. J. Mach. Learn. Cybern. 2023, 14, 2041–2051. [Google Scholar] [CrossRef]
- He, Y.; Song, K.; Meng, Q.; Yan, Y. An End-to-End Steel Surface Defect Detection Approach via Fusing Multiple Hierarchical Features. IEEE Trans. Instrum. Meas. 2020, 69, 1493–1504. [Google Scholar] [CrossRef]
- Wei, H.; Zhao, L.; Li, R.; Zhang, M. RFAConv-CBM-ViT: Enhanced vision transformer for metal surface defect detection. J. Supercomput. 2025, 81, 155. [Google Scholar] [CrossRef]
- Mo, H.; Wei, L. Fine Segmentation of Chinese Character Strokes Based on Coordinate Awareness and Enhanced BiFPN. Sensors 2024, 24, 3480. [Google Scholar] [CrossRef]
- Huang, P.; Tian, S.; Su, Y.; Tan, W.; Dong, Y.; Xu, W. IA-CIOU: An Improved IOU Bounding Box Loss Function for SAR Ship Target Detection Methods. IEEE J. Sel. Top. Appl. Earth Obs. Remote Sens. 2024, 17, 10569–10582. [Google Scholar] [CrossRef]
- Zheng, Z.; Wang, P.; Ren, D.; Liu, W.; Ye, R.; Hu, Q.; Zuo, W. Enhancing Geometric Factors in Model Learning and Inference for Object Detection and Instance Segmentation. IEEE Trans. Cybern. 2022, 52, 8574–8586. [Google Scholar] [CrossRef]
- Khanam, R.; Hussain, M. YOLOv11: An Overview of the Key Architectural Enhancements. arXiv 2024, arXiv:2410.17725. [Google Scholar] [CrossRef]
- Gao, Y.; Gao, L.; Li, X.; Yan, X. A semi-supervised convolutional neural network-based method for steel surface defect recognition. Robot. Comput.-Integr. Manuf. 2020, 61, 101825. [Google Scholar] [CrossRef]
- Shen, K.; Zhou, X.; Liu, Z. MINet: Multiscale Interactive Network for Real-Time Salient Object Detection of Strip Steel Surface Defects. IEEE Trans. Ind. Inform. 2024, 20, 7842–7852. [Google Scholar] [CrossRef]
- He, L.; Zheng, L.; Xiong, J. FMV-YOLO: A Steel Surface Defect Detection Algorithm for Real-World Scenarios. Electronics 2025, 14, 1143. [Google Scholar] [CrossRef]
- Zhao, J.; Miao, S.; Kang, R.; Cao, L.; Zhang, L.; Ren, Y. Insulator Defect Detection Algorithm Based on Improved YOLOv11n. Sensors 2025, 25, 1327. [Google Scholar] [CrossRef]
- Chen, J.; Kao, S.; He, H.; Zhuo, W.; Wen, S.; Lee, C.H.; Chan, S.H.G. Run, Don’t Walk: Chasing Higher FLOPS for Faster Neural Networks. In Proceedings of the IEEE/CVF Conference on Computer Vision and Pattern Recognition, Vancouver, BC, Canada, 17–24 June 2023; pp. 12021–12031. [Google Scholar]
- Zhang, X.; Liu, C.; Yang, D.; Song, T.; Ye, Y.; Li, K.; Song, Y. RFAConv: Innovating Spatial Attention and Standard Convolutional Operation. arXiv 2023, arXiv:2304.03198. [Google Scholar]
- Wang, S.; Xia, X.; Ye, L.; Yang, B. Automatic Detection and Classification of Steel Surface Defect Using Deep Convolutional Neural Networks. Metals 2021, 11, 388. [Google Scholar] [CrossRef]
- Chen, X.; Jiang, Z.; Cheng, H.; Zheng, H.; Du, Y. LF-YOLOv4: A lightweight detection model for enhancing the fusion of image features of surface defects in lithium batteries. Meas. Sci. Technol. 2024, 35, 025005. [Google Scholar] [CrossRef]
- Lv, Z.; Lu, Z.; Xia, K.; Zuo, H.; Jia, X.; Li, H.; Xu, Y. LAACNet: Lightweight adaptive activation convolution network-based defect detection on polished metal surfaces. Eng. Appl. Artif. Intell. 2024, 133, 108482. [Google Scholar] [CrossRef]
- Zhang, H.; Xu, C.; Zhang, S. Inner-IOU: More Effective Intersection over Union Loss with Auxiliary Bounding Box. arXiv 2023, arXiv:2311.02877. [Google Scholar]
- Liu, S.; Huang, D.; Wang, Y. Learning Spatial Fusion for Single-Shot Object Detection. arXiv 2019, arXiv:1911.09516. [Google Scholar] [CrossRef]
- Guo, Z.; Wang, C.; Yang, G.; Huang, Z.; Li, G. MSFT-YOLO: Improved YOLOv5 Based on Transformer for Detecting Defects of Steel Surface. Sensors 2022, 22, 3467. [Google Scholar] [CrossRef] [PubMed]
- Alnaggar, O.A.M.F.; Jagadale, B.N.; Saif, M.A.N.; Ghaleb, O.A.M.; Ahmed, A.A.Q.; Aqlan, H.A.A.; Al-Ariki, H.D.E. Efficient artificial intelligence approaches for medical image processing in healthcare: Comprehensive review, taxonomy, and analysis. Artif. Intell. Rev. 2024, 57, 221. [Google Scholar] [CrossRef]
- Aliyu, Y.; Sarlan, A.; Danyaro, K.U.; Rahman, A.S.B.A.; Abdullahi, M. Sentiment Analysis in Low-Resource Settings: A Comprehensive Review of Approaches, Languages, and Data Sources. IEEE Access 2024, 12, 66883–66909. [Google Scholar] [CrossRef]
- Wang, Y.; Wang, H.; Xin, Z. Efficient Detection Model of Steel Strip Surface Defects Based on YOLO-V7. IEEE Access 2022, 10, 133936–133944. [Google Scholar] [CrossRef]
- Xia, K.; Lv, Z.; Zhou, C.; Gu, G.; Zhao, Z.; Liu, K.; Li, Z. Mixed Receptive Fields Augmented YOLO with Multi-Path Spatial Pyramid Pooling for Steel Surface Defect Detection. Sensors 2023, 23, 5114. [Google Scholar] [CrossRef] [PubMed]
- Zhang, Y.F.; Ren, W.; Zhang, Z.; Jia, Z.; Wang, L.; Tan, T. Focal and Efficient IOU Loss for Accurate Bounding Box Regression. Neurocomputing 2022, 506, 146–157. [Google Scholar] [CrossRef]
- Rezatofighi, H.; Tsoi, N.; Gwak, J.; Sadeghian, A.; Reid, I.; Savarese, S. Generalized Intersection over Union: A Metric and a Loss for Bounding Box Regression. In Proceedings of the IEEE/CVF Conference on Computer Vision and Pattern Recognition, Long Beach, CA, USA, 15–20 June 2019; pp. 658–666. [Google Scholar]
- Zheng, Z.; Wang, P.; Liu, W.; Li, J.; Ye, R.; Ren, D. Distance-IoU Loss: Faster and Better Learning for Bounding Box Regression. In Proceedings of the AAAI Conference on Artificial Intelligence, New York, NY, USA, 7–12 February 2020; Volume 34, pp. 12993–13000. [Google Scholar]
- Gu, Z.; Zhu, K.; You, S. Yolo-ssfs: A Method Combining SPD-Conv/STDL/IM-FPN/SIoU for Outdoor Small Target Vehicle Detection. Electronics 2023, 12, 3744. [Google Scholar] [CrossRef]


Disclaimer/Publisher’s Note: The statements, opinions and data contained in all publications are solely those of the individual author(s) and contributor(s) and not of MDPI and/or the editor(s). MDPI and/or the editor(s) disclaim responsibility for any injury to people or property resulting from any ideas, methods, instructions or products referred to in the content. |
© 2025 by the authors. Licensee MDPI, Basel, Switzerland. This article is an open access article distributed under the terms and conditions of the Creative Commons Attribution (CC BY) license (https://creativecommons.org/licenses/by/4.0/).