Abstract
Cylindrical gears are used extensively due to their significant advantages including high efficiency, high load-bearing capacity, and long lifespan. However, the machining accuracy of cylindrical gears is significantly affected by motion errors and force-induced errors of machine tools. In this study, a motion error model of the machine tools was established based on multi-body system theory and homogeneous coordinate transformation method, quantifying the contributions and variation patterns of 12 key errors in the A and B-axes to workpiece geometric errors. Then, by using the stiffness analytical model and the spatial meshing theory, the influence of the force-induced elastic deformation of the shaft of rolling wheel and the springback of the workpiece tooth flank on the geometric error was revealed. Finally, taking the through rolling of a spur cylindrical gear with a module of 1.75 mm, a pressure angle of 20°, and 46 teeth as an example, the force-induced elastic deformation model of the shaft was verified by the rolling tests. Results show that for 40CrNiMo steel, the total profile deviation, total helix deviation, and single pitch deviation in the X-direction caused by rolling forces are 32.48 μm, 32.13 μm, and 32.13 μm, respectively, with a maximum contact rebound is δc = 28.27 μm. The relative error between theoretical and measured X-direction spindle deformation is 8.26%. This study provides theoretical foundation and experimental support for improving the precision of rolling process.
1. Introduction
Cylindrical gears feature high transmission efficiency, wide applicability, and high load-bearing capacity. Consequently, they are used extensively in industries such as aerospace, automotive, and machine tools. Currently, gear plastic forming technology enables tooth profile formation through metallic plastic flow, which effectively compensates for the low material utilization rate and insufficient tooth flank strength of conventional machining methods. As an advanced near-net-shape technology, the axial rolling process for cylindrical gears features continuous high efficiency and optimized flow lines, which can significantly improve production efficiency and gear wear resistance. However, the presence of errors affects gear machining accuracy, with geometric errors and rolling force-induced errors being particularly critical [1]. Machine tool motion errors cause the actual motion trajectory of the machine’s motion axes to deviate from the ideal trajectory, leading to a deviation in the relative position and orientation between the rolling wheel and the workpiece, which in turn affects the machining accuracy of the tooth flank. The rolling wheel and workpiece spindles undergo elastic deformation due to rolling forces, causing the rolling wheel and workpiece to deviate from their original positions. The uneven contact between the rolling wheel and the workpiece leads to a decrease in tooth flank machining accuracy. Therefore, this paper aims to provide theoretical support for process optimization and error compensation by constructing a machine tool motion error model and a force-induced error model to reveal the effects of these errors on tooth profile accuracy. This is of great significance for promoting the industrial application of high-precision gear manufacturing technology.
In recent years, to improve the accuracy of multi-axis CNC machine tools, researchers have conducted extensive studies on machine tool motion errors. Lin et al. and Chen et al. [2,3] separately used differential transformation theory to build geometric error models for multi-axis machine tools. Fu et al. [4] introduced the Product of Exponentials (POE) method into the geometric error modeling of multi-axis machine tools and verified it on a three-axis vertical machine tool. Wan et al. [5] improved the accuracy of the error model by incorporating kinematic errors into the initial pose deviation based on the POE method. Lin et al. [6] proposed a matrix summation method, departing from the traditional homogeneous transformation matrix approach, to model the geometric errors of a five-axis machine tool. Lin et al. [7] proposed a parameterization modeling method based on Chebyshev polynomials, which can quickly and accurately establish a mathematical model for the geometric errors of machine tool rotary axes. Zhao [8] proposed a geometric error model based on screw theory, and Yang [9] applied this theory to evaluate and predict the machining accuracy of multi-axis computer numerical control (CNC) machine tools. However, compared with the aforementioned methods, multi-body system theory [10,11,12,13] can more intuitively and clearly reflect the physical topological structure of a machine tool, such as “bed-saddle-turntable-spindle”. Combined with the homogeneous transformation matrix (HTM) [14,15], each error parameter in the model directly corresponds to a specific, measurable physical error source, making the model highly interpretable. By using a series of matrix multiplications of homogeneous transformation matrices, multi-body system theory can comprehensively and accurately describe each geometric error source and its non-linear cumulative coupling effects during the motion chain transmission process, ensuring the theoretical completeness and accuracy of the model. By modeling machine tool geometric errors using multi-body system theory and homogeneous coordinate transformation, the model structure and parameters have clear physical meanings, can be used for error prediction throughout the entire workspace, have strong generalization capabilities, and provide a solid theoretical basis for error diagnosis and physical compensation.
However, in the axial rolling process of spur cylindrical gears, the sources, forms, and transmission mechanisms of errors are significantly different from those in the cutting processes mentioned above. Rolling belongs to the category of plastic forming, and its process characteristics determine that the relationship between machine tool motion errors and the final geometric errors of the workpiece is more complex. Therefore, existing theoretical error models established for cutting machine tools cannot be directly applied to the precision analysis of the gear rolling process. To address this, this paper will systematically study the transmission laws of motion errors specific to the unique characteristics of the axial rolling process. The aim is to construct a new model that can accurately describe the mapping relationship between machine tool errors and gear geometric errors in this process, providing a theoretical basis and technical support for achieving high-precision rolled gear manufacturing.
To reveal the formation mechanism of force-induced errors during the machining process, domestic and international scholars have conducted systematic research from various perspectives. In terms of error modeling, researchers often analyze based on machine tool kinematics. For example, Wu Hao [16] and Zhao Binbin et al. [17] used homogeneous coordinate transformation to establish comprehensive error and mapping models for multi-axis milling machines and gear shaving machines, respectively. Guo Zhongzheng [18] constructed a cutter edge trajectory model for hobbing motion characteristics. In terms of analyzing the mechanical properties of the process system, Sun Shouli [19] combined finite element simulation with experiments to construct a stiffness model and an error calculation method that considers tooth springback. Lin et al. and YUE et al. [20,21] discussed stiffness modeling and tool deviation laws for specific conditions such as angular milling.
However, the above studies mainly focus on cutting processes such as milling and hobbing. Axial rolling of spur cylindrical gears, as a precision plastic forming process, has fundamental differences in its mechanical environment, material deformation behavior, and error manifestations compared to cutting processes. Due to the unique plastic forming characteristics of the axial gear rolling process, existing error modeling methods are not directly applicable. In this context, a significant research gap exists in understanding the distinct contributions of the primary error sources. Before a complex coupled model can be developed, it is first essential to systematically isolate and quantify the individual effects of the two dominant error categories: the machine tool’s inherent motion errors and the process-dependent force-induced errors.
Therefore, the core motivation for this study is to address this foundational gap. The practical problem this work solves is the lack of a prioritized understanding of which specific errors most significantly impact the geometric accuracy in axial gear rolling. To answer this, this paper first constructs the topological structure of the rolling machine tool based on multi-body system theory and establishes an analytical model for machine tool motion errors using homogeneous coordinate transformation. Through quantitative analysis, it investigates the influence and contribution of 12 key errors of the A and B axes on the workpiece’s geometric errors, thereby creating a clear sensitivity ranking of motion error sources. Second, to analyze force-induced errors, an analytical model for the multi-directional stiffness of the rolling wheel spindle is established, which forms the basis of a predictive force-induced error model. This is complemented by a mathematical model for workpiece tooth surface springback, developed from spatial meshing principles and elastoplastic mechanics. Finally, the accuracy of the established spindle force-induced error model is verified through axial rolling experiments. Therefore, existing theoretical models cannot be directly adopted, and there is an urgent need to establish a theoretical framework for analyzing force-induced errors that is suitable for the axial rolling process.
Through sensitivity analysis, the influence of the 12 key rotational and translational errors of the A/B axes on the final workpiece geometric accuracy is quantitatively separated and ranked, providing clear guidance for machine tool design optimization and error compensation strategies.
The proposed force-induced error model was validated experimentally. By comparing the processing results of two materials with significantly different mechanical properties (soft lead and high-strength 40CrNiMo steel), the model’s robustness and predictive capability were demonstrated, confirming its effectiveness across a wide process window.
2. Motion Error Modeling of Machine Tool
2.1. Structural Analysis of Machine Tool
This study employs multi-body dynamics theory to analyze the kinematic pairs of the machine tool, with a coordinate transformation approach adopted to simplify the motion relationships between local coordinate systems. The basic structure of the rolling machine tool is illustrated in Figure 1. Based on multi-body system theory, the topological structure of this equipment is derived as shown in Figure 2.
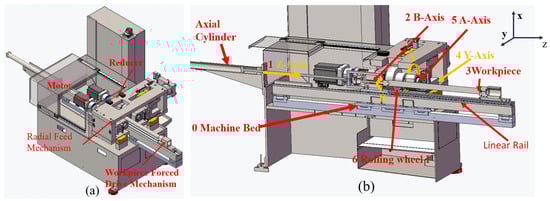
Figure 1.
(a) Schematic diagram of the basic structure of the rolling machine tool. (b) Section view through the Centerline of the rolling machine tool.
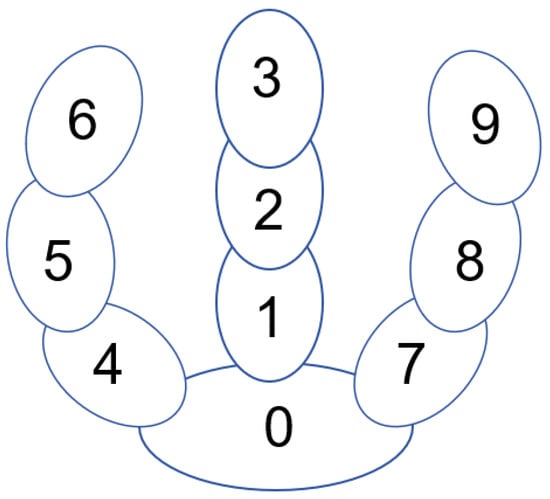
Figure 2.
Topological structure of the rolling machine tool. 0—machine bed; 1—Z-axis; 2—B-axis; 3—workpiece; 4—Y-axis; 5—A-axis; 6—rolling wheel I; 7—Y-axis II; 8—A-axis II; 9—rolling wheel II.
2.2. Poses Coordinate Transformation of Motion Axis Under Ideal Conditions
Based on multi-body system theory, homogeneous coordinate transformation matrices are employed to represent the motion transformation matrices between adjacent typical bodies of the machine tool [22]. The motion transmission relationships between adjacent typical bodies of the machine tool are illustrated in Figure 3. Under error-free conditions, the motion transformation matrices between adjacent bodies can be calculated as follows [23].
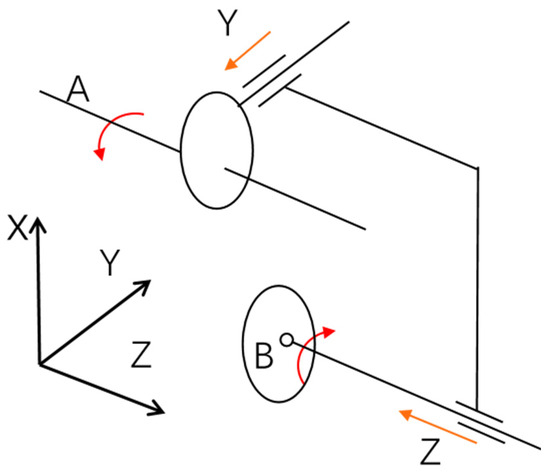
Figure 3.
Schematic diagram of the multi-axis motion relationship of the machine tool. The figure shows linear motions along the Y-axis and Z-axis, as well as the rotational motions of the A-axis and B-axis around the Z-axis, respectively.
Since the rolling wheel is rigidly fixed to the A-axis with no relative motion, the motion transformation matrix from the rolling wheel coordinate system to the A-axis coordinate system is
After the machine tool A-axis rotates by angle , the motion transformation matrix from the A-axis coordinate system to the Y-axis coordinate system is
Following the Y-axis translation by distance y, the motion transformation matrix from the Y-axis coordinate system to the machine bed coordinate system is
After the Z-axis translates by distance z, the motion transformation matrix from the Z-axis coordinate system to the machine bed coordinate system is
Upon the B-axis rotation by angle , the motion transformation matrix from the B-axis coordinate system to the Z-axis coordinate system is
Given that the workpiece is rigidly fixed to the B-axis with no relative motion, the motion transformation matrix from the workpiece coordinate system to the B-axis coordinate system is
Based on the motion transmission relationships of the rolling machine kinematic chain, an error-free mathematical model is established under ideal conditions. The motion transformation matrix from the rolling wheel coordinate system to the workpiece coordinate system is derived as
where , and .
2.3. Motion Errors Model of Machine Tool
The motion errors in rolling machines originate from manufacturing inaccuracies inherent to the machine tool’s moving components. As illustrated in Figure 4, the six-degree-of-freedom (6-DoF) errors exhibit positional dependency, varying with the actual motion positions of the axes. The motion errors for each axis are systematically summarized in Table 1.
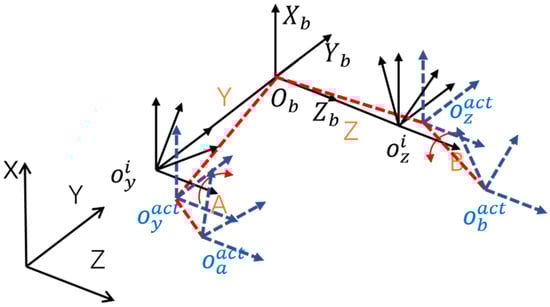
Figure 4.
Schematic diagram of motion errors in the rolling machine.

Table 1.
Motion errors of individual axes in the machine tool.
Motion errors in the rolling machine are generated through specific motion commands that drive the machine tool to perform translational or rotational movements along its axes. Ultimately, due to inherent motion errors, errors occur upon completion of these motion commands. For each motion ais of the gear rolling machine, the single-axis error modeling expressions are formulated as follows:
where denotes the ideal motion transformation matrix and denotes the machine tool motion error matrix.
Considering the motion error of the machine tool, based on the transfer relationship of the machine tool motion chain, the actual coordinate transformation matrix from the rolling wheel coordinate system to the workpiece coordinate system is
For each coordinate transformation matrix on the right-hand side of the equation, the specific derivation procedure is as follows:
where denotes the actual coordinate transformation matrix between the rolling wheel coordinate system and the workpiece coordinate system, denotes the actual coordinate transformation matrix from the rolling wheel reference coordinate system to the A-axis rotational axis coordinate system, denotes to the actual coordinate transformation matrix from the A-axis rotational axis coordinate system to the Y-axis coordinate system, denotes the actual coordinate transformation matrix from the Y-axis coordinate system to the machine bed coordinate system, denotes the actual coordinate transformation matrix from the machine bed coordinate system to the Z-axis coordinate system, denotes the actual coordinate transformation from the Z-axis coordinate system to the B-axis rotational axis coordinate system, and denotes the actual coordinate transformation matrix from the B-axis rotational axis coordinate system to the workpiece reference coordinate system.
where T denotes the translation matrix and R denotes the rotation matrix.
Since the products of second-order and higher error terms have negligible effects on the computational accuracy of machine tool motion errors, these higher-order terms can be neglected in the calculation of . Taking the Y-axis motion errors as an example:
where .
By neglecting second-order and higher error terms and defining , (where i = x, y, z), substituting the aforementioned Y-axis motion errors into the governing equations and simplifying, the Y-axis motion errors are derived as
Similarly, the motion errors of the B-axis are derived as
The motion errors of the A-axis are derived as
The motion errors of the Z-axis are derived as
This completes the motion error modeling of each axis of the rolling machine tool. The 24 machine tool motion error terms and the 4 motion instruction matrices , , , and in Formulas (17)–(20) are obtained by substituting the 24 machine tool motion error values and the motion amount into Formulas (28)–(31).
3. Force-Induced Error Modeling of Machine Tool
3.1. Spindle Stiffness Modeling in Multiple Directions
Taking the calculation of Y-direction stiffness as an example, the schematic diagram of the main shaft of the rolling wheel and the structure of the rolling wheel is shown in Figure 5. The stiffness of this part is determined by calculating the maximum deflection of the main shaft from its governing equation.
where : Maximum deflection due to Y-direction loading; : Applied rolling force in the Y-direction; is the vertical distance from the rolling contact point to the upper fixed support, is the vertical distance to the lower fixed support, signifies the span between fixed supports, corresponds to the elastic modulus of the spindle material, and I designates the cross-sectional moment of inertia of the spindle.
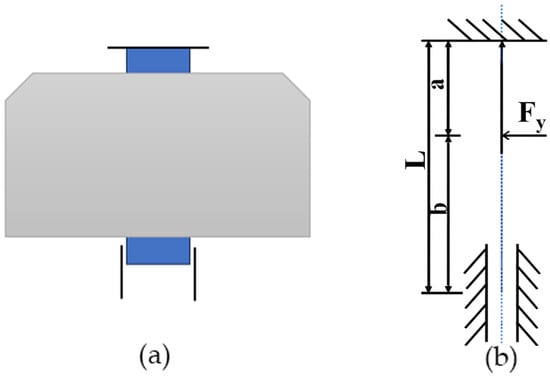
Figure 5.
(a) Structural schematic of the roll spindle and roll; (b) Force diagram of the main shaft in the Y-axis.
The bending stiffness of the spindle under Y-direction loading is expressed as
When subjected to Y-direction rolling forces, the spindle deflection angle is illustrated in Figure 6 and can be computationally determined using the beam bending model.
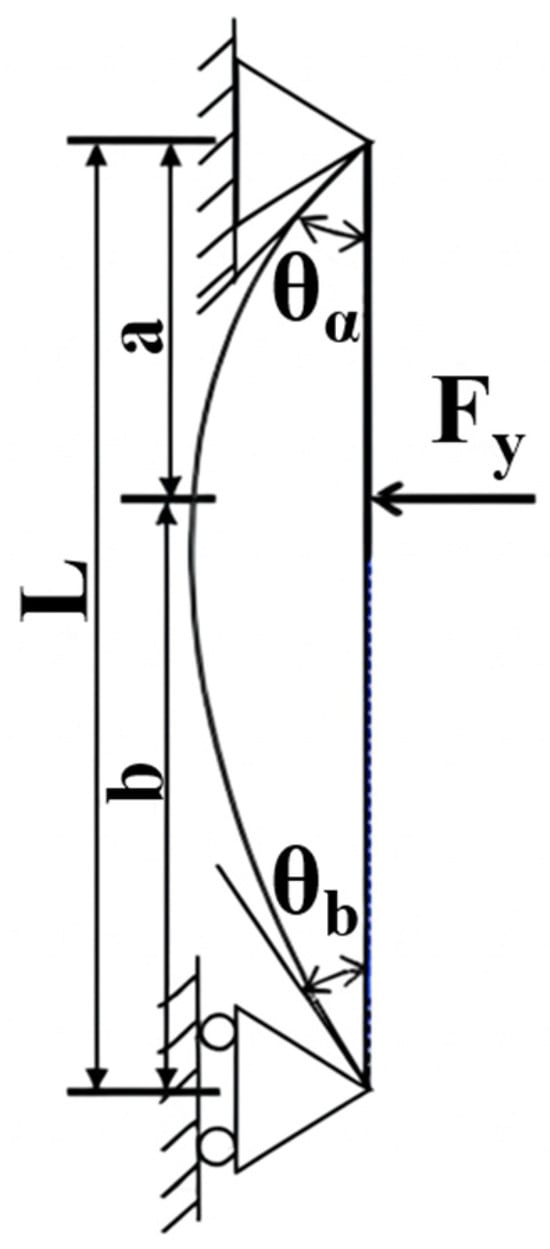
Figure 6.
Free-body diagram of the spindle.
The spindle offset distance is expressed as
Consequently, when subjected to Y-direction rolling forces, the spindle’s positional error along the Y-axis can be expressed as
When analyzing X-direction stiffness, the structural schematic of the rolling wheel spindle assembly is depicted in Figure 7. The spindle experiences both bending and torsional deformations along the X-axis, necessitating decomposition of the net stiffness into two components: bending stiffness and torsional stiffness.
where : Maximum deflection due to X-direction loading; : Applied rolling force in the X-direction; : Eccentricity from the load application point to the shear center; : Shear modulus of the spindle material; : Spindle diameter
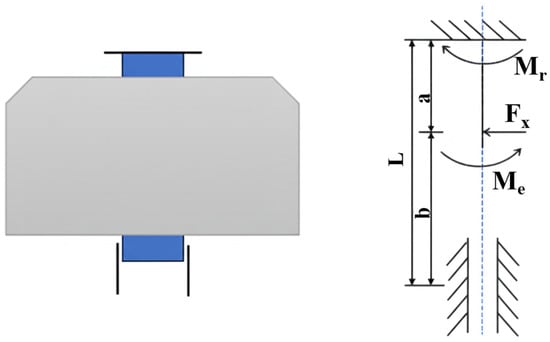
Figure 7.
Schematic diagram of the rolling spindle structure and X-direction force distribution.
The bending stiffness of the spindle under X-direction loading is expressed as
The torsional stiffness is expressed as
The displacement of the spindle along the X-axis is expressed as
Consequently, the force-induced error of the spindle under an X-directional force disturbance can be expressed as
3.2. Force-Induced Error Modeling of Spindle
According to the axial rolling spatial coordinate system of the rolling wheel, the coordinate transformation between coordinate system S3 and coordinate system S1 is
where denotes the transformation matrix from the rolling wheel body-fixed coordinate system to the workpiece body-fixed coordinate system.
According to the principle of spatial meshing, the meshing equation between the finishing section of the rolling wheel and the workpiece at the contact point is
where denotes the relative velocity between the rolling wheel and workpiece, and is the tooth flank normal vector.
The tooth flank equation of the workpiece in the rolling wheel body-fixed coordinate system S3 is expressed as
where , , denote coordinate points on the rolling wheel tooth flank.
By combining Equations (43) and (45), the tooth flank equation in the workpiece coordinate system S1 is expressed as
Force-induced deformation errors cause positional deviations between the rolling wheel and workpiece during processing. Accounting for these deviations, the transformation matrix from the actual rolling wheel coordinate system to the actual workpiece coordinate system is expressed as :
where denotes the positional error matrix.
By combining Equations (43), (46) and (47), the tooth flank equation, which incorporates the force-induced deformation error, is given as
3.3. Tooth Flank Springback Modeling
In addition to inducing spindle displacement, the rolling force also generates contact deformation on the gear tooth flank through the normal force acting at the meshing point. When the actual meshing contact between the finishing segment of rolling wheel and workpiece is considered, the meshing force inevitably leads to elastic deformation of the gear teeth, thereby altering the tooth flank geometry. To investigate the elastic deformation of the tooth flank, it is assumed that the contact deformation occurs along the normal direction at the contact point. The calculation of the elastic deformation is confined to the direction of the contact line, as shown in Figure 8. For finite-length elastic contact, the contact deformation can be calculated as [24]
where : Length of contact line (mm); : Radius of curvature at contact points for rolling wheel and workpiece, respectively (mm); : Poisson’s ratios of rolling wheel/workpiece; : Equivalent elastic modulus (Pa); : Elastic moduli of rolling wheel and workpiece, respectively (Pa); : Normal contact force (N).
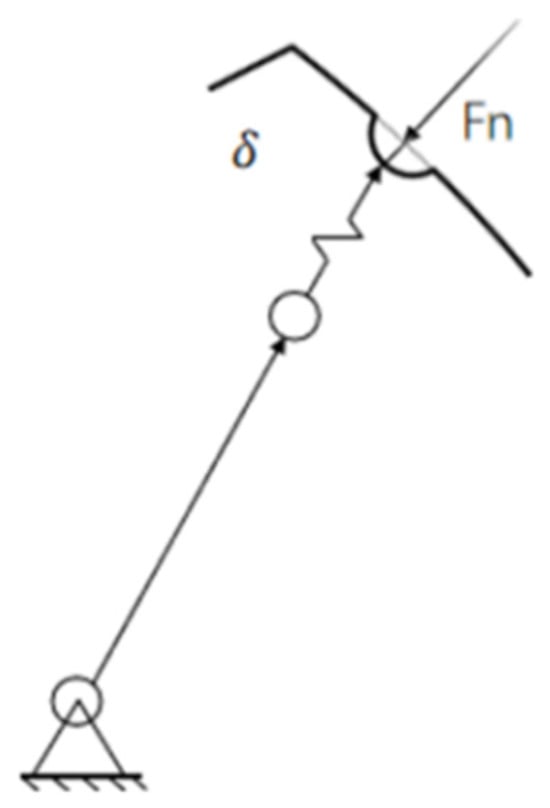
Figure 8.
Elastic deformation of tooth profile.
With increasing normal contact deformation, the gear surface transitions from fully elastic to elastoplastic deformation. The CEB (Chang-Etsion-Bogy) model defines the critical relative deformation for asperity plastic flow initiation [25]:
where : Mean contact stress coefficient, ; : Material contact hardness, (Pa); : Yield strength of gear material (Pa).
When <, elastic contact occurs on the gear surface. When > , elastoplastic contact occurs on the gear surface. Then the contact rebound amount of is
4. Simulation Analysis of Various Errors in Gear Through Rolling Process
4.1. Influence of Motion Errors of Machine Tool on Workpiece Geometric Errors
The roll-forming process can be categorized into forming and finishing stages. To investigate the influence of machine tool motion errors on workpiece geometric errors, this study focuses on the finishing stage. In axial gear rolling, the assessment of workpiece quality necessitates the analysis of geometric error, including total profile deviation, total helix deviation, and single pitch deviation, which are quantified through comparative modeling of actual and theoretical tooth flanks. Given the functional significance of involute profiles in gear meshing, the analysis is confined to this region. Based on the principle of roller involute formation, the rolling wheel tooth profile is established in a Cartesian coordinate system and can be expressed as Equation (52):
where is the base circle radius of the rolling wheel, is the sum of pressure angles and the unfolding angles, and , , and denote the coordinates in the X-, Y-, and Z-direction of the roller tooth profile, respectively.
According to the principle of gear meshing, the theoretical tooth profile equation of the workpiece gear generated by the theoretical tooth profile envelope of the rolling wheel is calculated as [26]:
where is the unfolding angle, a is the center distance between the rolling wheel and the workpiece, and , , and denote the coordinates in the X-direction, Y-direction, and Z-direction of the workpiece tooth profile, respectively.
The involute tooth flank of the workpiece is illustrated in Figure 9. During the machining process, it is necessary to investigate the effects of machine tool motion errors on profile deviation, pitch deviation, and helix deviation. The specific methods are as follows:
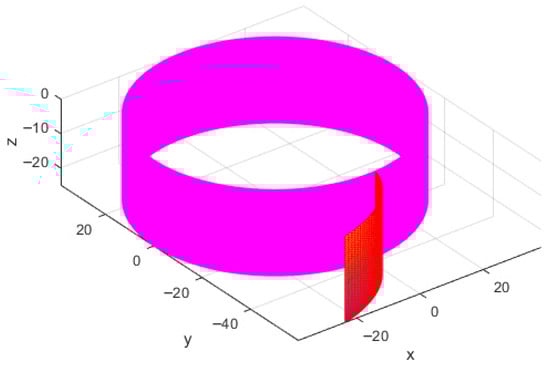
Figure 9.
Standard tooth flank model.
- Profile Deviation: The total profile deviation is calculated by comparing the actual profiles with the theoretical profiles in the normal section. It is defined as the sum of the absolute values of the maximum positive deviations and the maximum negative deviations within the effective working region.
- Helix Deviation: The total helix deviation is the maximum offset between the actual helices and the designed helices, measured in the tangent direction of the base circle on the gear end face. It is calculated as the maximum offset across the entire tooth width.
- Pitch Deviation: The single pitch deviation is determined by measuring the difference between actual and theoretical pitches of adjacent teeth along the circumference of the pitch circle. This value is calculated on a concentric circle located at the mid-height of the tooth profile in the transverse plane.
To quantify the aforementioned geometric errors, the normal deviation between the theoretical and actual tooth flanks must be determined. In the computational process, a reference point N on the theoretical tooth flank is selected, with coordinates N(). Its corresponding point N′ in the normal-direction on the actual tooth flank is then identified, with coordinates N′(). The normal deviation is calculated as follows [27]:
where is the normal deviation; and represent the position vectors of points N and N′, respectively; denotes the unit normal vector at point N on the tooth flank.
To systematically reveal the transmission patterns of machine tool motion errors, this section conducts an independent simulation analysis of the 12 key geometric errors of the A and B motion axes. Given that the motion errors of the rolling machine tool are mostly time-varying and difficult to measure directly, this study assumes each error to be a constant value and amplifies its effects to simplify the analysis and more clearly reveal its mapping relationships [28].
First, this study analyzed the translational positioning errors of the A and B axes, assuming each error component—, , , , , and —to be 1 mm. The simulation results shown in Figure 10 and Figure 11: The error causes the error tooth flank to be located outside the ideal tooth flank, while the error causes it to be located inside. Despite their opposite effects on flank position, their influence patterns on profile deviation are similar: the absolute value of the deviation gradually increases from the tooth tip to the tooth root in both cases. Both ) and cause the error tooth flank to be located inside the ideal tooth flank, and the absolute value of the profile deviation gradually decreases from the tooth tip to the tooth root. The simulation clearly indicates that the translational positioning errors of the A and B axes along the Z-axis, and , do not affect the workpiece’s profile deviation, helix deviation, or pitch deviation, resulting in a deviation of 0. For all translational errors, the resulting helix deviation remains constant along the tooth width.
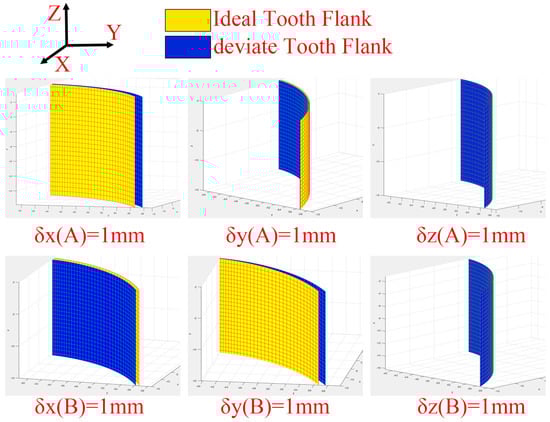
Figure 10.
Error Surface Plots of Varying Translational Positioning Errors Generated via MATLAB R2023a.
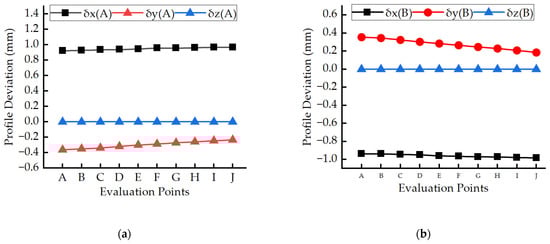
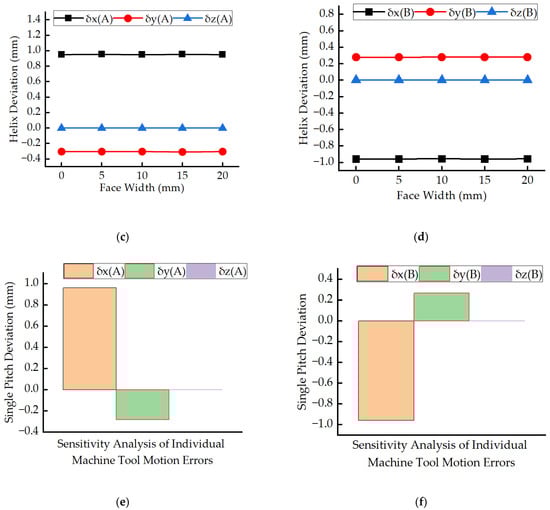
Figure 11.
Comparative analysis of workpiece geometric errors induced by translational positioning errors of the A and B axes. (a,c,e) Profile\Helix\single pitch Deviation Comparison Caused by A-axis Translational Positioning Errors. (b,d,f) Profile\Helix\single pitch Deviation Comparison Caused by B-axis Translational Positioning Errors.
The specific deviation data is shown in Table 2.
Table 2.
Summary of geometric deviations caused by translational positioning errors of A and B axes.
The contribution degree of each error component to total deviations is calculated through dimensionless normalization and relative weighting:
where denotes the contribution degree of the X-direction machine tool motion error component to the total deviation, while , , and represent the sensitivity coefficients of error components along the X-, Y-, and Z-axes, respectively.
The influence of translational positioning errors of axes A and B on gear deviations is summarized in the following Table 3:
Table 3.
Contribution of translational positioning errors of A and B axes to workpiece geometric deviations.
An analysis of the table clearly shows that among all translational positioning errors along the A and B axes, the positioning errors in the X-direction, and are the dominant error sources that most significantly impact the geometric accuracy of the workpiece.
Analogously, this study analyzed the angular errors of the A and B axes, assuming that each error component, , , , , , and , is 1°. The effects of the angular errors are more complex and exhibit the following characteristics:
As shown in Figure 12 and Figure 13, ① Tooth flank position relationship: All angular errors of the A axis cause the error tooth flank to be located inside the ideal tooth flank, while all angular errors of the B axis cause it to be located outside the ideal tooth flank. ② Tooth flank deviation mode: The tooth flank deviation modes caused by each angular error are different. For example, the deviation caused by decreases from the tooth tip to the tooth root and then increases, while the deviation caused by is monotonically increasing. Errors such as and show more complex non-linear change patterns, such as “first decreasing then increasing then decreasing again” or “first increasing then decreasing”. ③ Helical Line Deviation Mode: The helical line deviation caused by the angular errors of the A and B axes along the X and Y directions gradually increases along the tooth width, while the helical line deviation caused by the angular errors of the A and B axes along the direction remains constant.
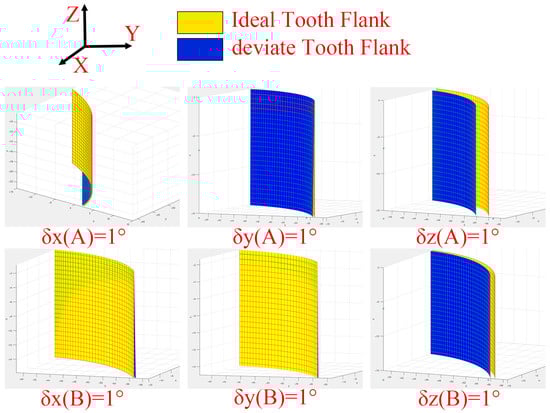
Figure 12.
Error surface plots of varying rotational errors generated via MATLAB.

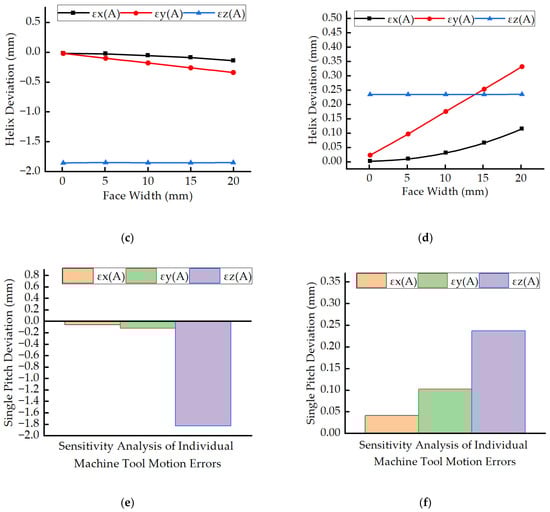
Figure 13.
Comparative analysis of workpiece geometric errors induced by rotational errors of the A and B axes. (a,c,e) Profile\Helix\single pitch deviation comparison caused by A-axis translational positioning errors. (b,d,f) Profile\Helix\single pitch deviation comparison caused by B-axis translational positioning errors.
The influence of rotational errors of axes A and B on gear deviations is summarized in the following Table 4:
Table 4.
Summary of geometric deviations caused by rotational errors of A and B axes.
The influence of rotational errors of axes A and B on gear deviations is summarized in the following Table 5:
Table 5.
Contribution of rotational errors of A and B axes to workpiece geometric deviations.
Through a deep analysis of the simulation data, it can be concluded that: among all the angular errors of the A axis, the rotational error about the Z axis, , plays an absolutely dominant role in affecting the geometric error of the workpiece; while among the angular errors of the B axis, contributes the most to the tooth flank and pitch deviation, and has the greatest impact on the helical line deviation.
Given that linear motion errors along the Y and Z axes can be effectively compensated through backlash correction or closed-loop control in CNC systems, while rotational errors of the A and B axes involve dynamic deviations that more difficult to correct, this study disregards linear motion errors of the Y and Z axes.
4.2. Influence of Force-Induced Errors on Workpiece Geometric Error
To reveal the influence patterns of force-induced errors, this study selected lead (Pb) and 40CrNiMo high-strength steel as representative materials for theoretical calculations. In this analysis, the process system deformation caused by rolling forces in the X and Y directions was equivalently modeled as micro-displacement and micro-angular errors of the rolling wheel spindle. Based on rolling forces calculated via the finite element method, this study quantified the positional changes in the rolling wheel spindle: when rolling lead, the maximum displacement was 0.37 μm in the Y-direction and 5.45 μm in the X-direction, with a maximum angular error of 0.497°; when rolling 40CrNiMo steel, the maximum displacement was 2.328 μm in the Y-direction and 34.3 μm in the X-direction, with a maximum angular error of 0.458°. Subsequently, these maximum error values were substituted into the tooth flank equation that incorporates force-induced deformation errors. By comparing the resulting flank with the standard tooth flank, the influence patterns of these deformations on the workpiece’s geometric errors were determined, as illustrated in Figure 14, Figure 15 and Figure 16.
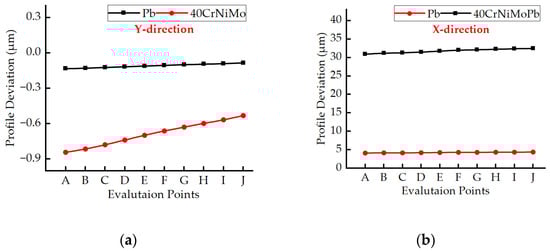
Figure 14.
Profile helix deviation diagram of lead and 40CrNiMo steel tooth flank under Y and X direction force. (a) Y-direction, (b) X-direction.
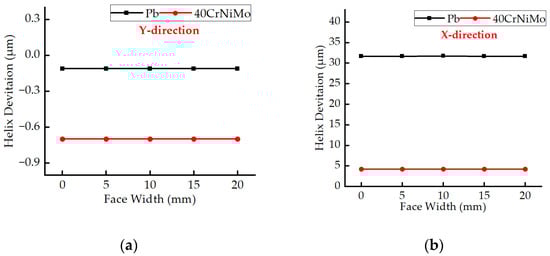
Figure 15.
Helix pitch deviation diagram of lead and 40CrNiMo steel tooth flank under Y-direction force. (a) Y-direction, (b) X-direction.
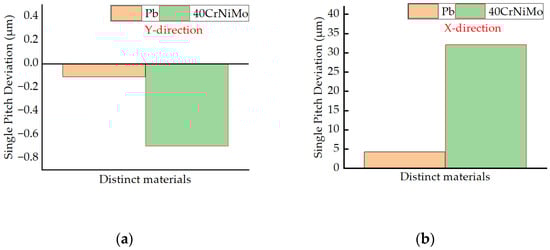
Figure 16.
Single pitch deviation diagram of lead and 40CrNiMo steel tooth flank under X-direction force. (a) Y-direction, (b) X-direction.
From the figures, it can be observed that for aluminum, the total pitch deviation caused by rolling force in the x-direction is 4.39 μm, and the total helix deviation is 4.3 μm, with a single-pitch deviation of 4.3 μm. In the y-direction, the total pitch deviation caused by rolling interference is 0.13 μm, and the total helix deviation is 0.11 μm, with a single-pitch deviation of 0.11 μm.
For 40CrNiMo, the total pitch deviation in the x-direction caused by rolling force is 0.84 μm, the total helix deviation is 0.7 μm, and the single-pitch deviation is 0.7 μm. In the y-direction, the total pitch deviation is 3.248 μm, the total helix deviation is 3.13 μm, and the single-pitch deviation is 2.13 μm.
It can be seen from the figures that the more accurate the axial rolling motion control, the more consistent the surface morphology of the error profile. The theoretical predictions agree well with the 3D measurement results of the error surface, verifying the accuracy of the proposed error transmission chain model. The error cloud diagrams show that under high system stiffness, the error surface is more significantly influenced by the small angular error in the spindle’s z-direction. In contrast, under low system stiffness, the error surface is more susceptible to displacement errors in the x and y directions.
Therefore, when rolling 40CrNiMo material, it is crucial to consider the influence of rolling force variations on system errors during process parameter selection. The results indicate that spindle displacement errors in the x and y directions have a significant impact on the machining accuracy of 40CrNiMo, especially the position deviations caused by rolling force fluctuations. As a high-strength alloy steel, 40CrNiMo exhibits pronounced work hardening, leading to drastic changes in system loading during rolling and increased sensitivity to error.
In practical production, under conditions of limited system stiffness, increasing system rigidity or reducing load fluctuations can effectively mitigate error effects. Additionally, rolling-direction errors can significantly affect the distribution of tooth surface morphology, thereby influencing tooth profile accuracy. Since the spindle angular error remains relatively small during rolling, the deformation caused by it is negligible and can thus be disregarded in the analysis of roller and spindle deformation.
When analyzing the workpiece spindle, the workpiece is subjected to forces from dual rolling wheels. Since the forces from the two rolling wheels are equal in magnitude and opposite in direction [29], they are able to cancel out the deformation of the workpiece shaft. Therefore, the workpiece shaft remains essentially constant, and issues such as the stiffness and deformation of this part are not discussed in this paper.
During the rolling process, when the workpiece enters the finishing section of the rolling wheel, part of it remains in the forming phase. Therefore, the forces acting on this section can be neglected in the analysis, and only the tooth flank springback when the workpiece fully enters the finishing stage and during the final exit stage needs to be considered. Based on the finite element analysis results in Section 4, after the workpiece enters the finishing stage, variations in rolling force and contact line length with feeding lead to different amounts of deformation. This study employs the finite element method to analyze the deformation generated during the rolling process, and the results are shown in Table 6. Meanwhile, the variation pattern of contact springback with feeding time during the rolling feed process of the rolling wheel is obtained, as shown in Figure 17.
Table 6.
Variation in contact springback with time.
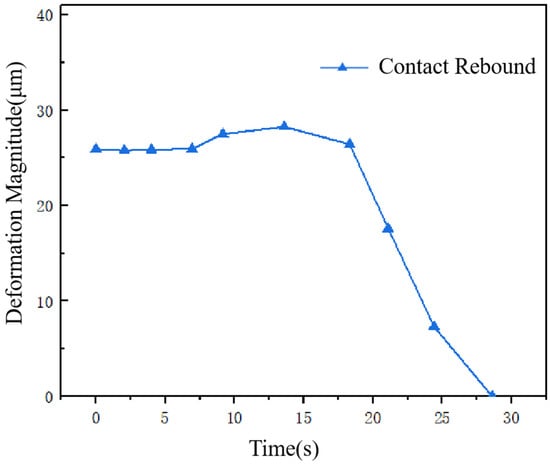
Figure 17.
Variation in contact springback on the tooth profile with time.
As shown in Table 6, both the rolling force and the contact line length gradually decrease with workpiece feeding. Figure 17 indicates that the contact deformation amount deformation increases initially and then decreases during the feeding process, with the maximum contact springback being . The springback causes changes in gear geometric error. Therefore, by calculating the springback, the rolling process can be optimized to continuously enhance gear accuracy and meet market demands.
5. Experimental Verification
5.1. Experimental Materials
In this axial gear rolling forming experiment, lead (Pb) was selected as the workpiece material after comprehensive consideration of its physical properties, cost-effectiveness, and the experimental objectives. Its primary advantages are as follows:
Lead’s most critical characteristic is its excellent plasticity. Under immense rolling forces, lead undergoes plastic flow smoothly and accurately fills the tooth profile of the rolling wheel, thereby producing a geometrically complete gear preform, which ensures a high success rate for the forming experiments.
As a low-cost and readily available metal, lead allows for effective control of the experimental budget, enabling more extensive repetitive tests to be conducted within limited funds to acquire sufficient data. Furthermore, lead is easily recycled, aligning with both economic and environmental requirements.
Although the mechanical properties of lead differ significantly from those of actual gear steels, it can effectively simulate the fundamental mechanical behaviors of the rolling process, such as material flow and stress distribution. Therefore, conducting preliminary tests with lead helps to initially validate theoretical models and optimize process parameters under low-cost conditions. This provides a valuable reference and reduces the risk of failure for the subsequent final validation using high-cost, high-strength industrial steels.
Lead is soft and easy to process with subsequent procedures such as cutting and grinding. This greatly facilitates the dimensional measurement and performance analysis of the formed workpiece, thereby improving overall experimental efficiency.
5.2. Testing and Inspection
Due to the complexity of gear axial rolling with rolling wheels, the rolling forming experiments in this chapter were carried out on a self-developed machine tool by our research group. The experimental equipment is shown in Figure 18. Before testing, workpieces, rolling wheels, and fixtures were prepared, key rolling parameters were adjusted, and input into the electronic control system of the rolling machine. After installing the workpiece, the center distance between the rolling wheel and workpiece and the phase of the rolling wheel were calibrated. The controller was used to control the synchronized rotation of the rolling wheels process the workpiece. To ensure the quality and performance of the formed gear, several key parameters were meticulously set. The feed speed was set to 0.7 mm/s, based on a comprehensive evaluation of the machine tool’s dynamic response and the material’s rheological behavior, ensuring stable material flow while maintaining production efficiency. The rolling wheel speed was set to 1.05 rad/s, determined by the rolling principles and the performance of the machine’s transmission system to prevent workpiece overheating and maintain rolling efficiency. The center distance was theoretically calculated as 152.25 mm according to gear meshing principles and was precisely adjusted during installation using a high-precision micrometer, limiting the final error to within ±0.01 mm to ensure tooth profile accuracy. Additionally, the rolling wheel phase was precisely controlled by adjusting the installation positions of the dual rolling wheels, ensuring uniform pressure application and guaranteeing the consistency of the tooth profile and pitch.
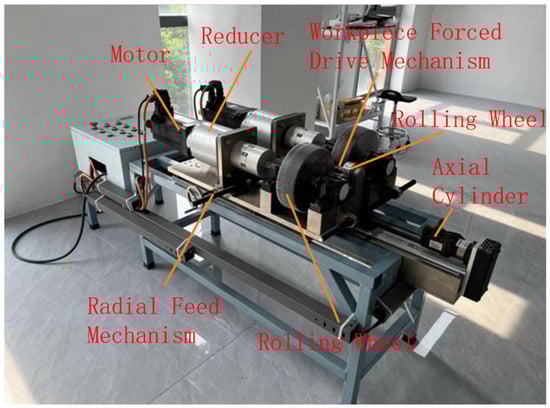
Figure 18.
Rolling Test Platform.
Combing the research content of this paper, the equipment performed rolling processing using the described axial rolling method. The rolling process is illustrated in Figure 19a, and the resulting gear is shown in Figure 19b. The main parameters during processing are listed in Table 7.
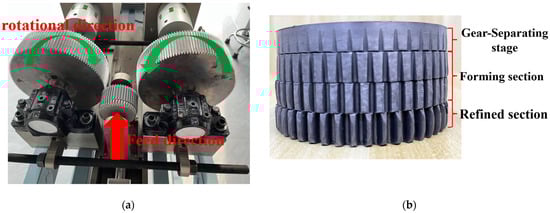
Figure 19.
Gear Forming Photos. (a) Working during rolling process. (b) Formed gear after processing.
Table 7.
Parameters of rolling wheel and workpiece gear.
5.3. Test of Force-Induced Deformation for Rolling Spindle
5.3.1. Method for Obtaining Experimental Results
To accurately validate the effectiveness of the theoretical model for force-induced error, this study designed a two-phase measurement plan aimed at precisely isolating the rolling wheel spindle deformation caused purely by rolling forces from the complex total error. The specific experimental procedure is as follows.
First, a high-precision digital dial indicator was installed on a fixed component of the machine tool, with its probe in contact with the surface of the rolling wheel spindle to be measured in the X-direction, as shown in Figure 20.
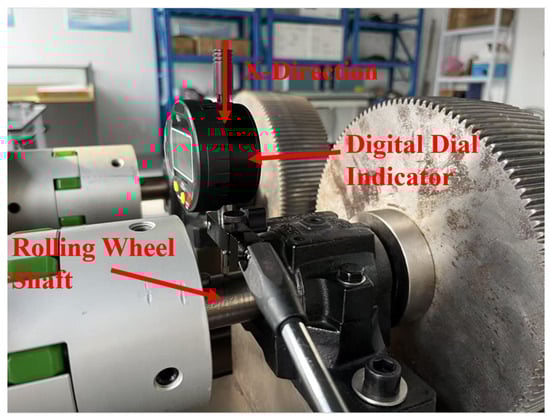
Figure 20.
Placement Position of the Digital Dial Indicator.
- 1.
- Phase 1: No-Load Test
To quantify the comprehensive spindle runout caused by the machine tool’s inherent pose errors and motion errors. The machine tool was run through a complete machining program under “no-load” conditions, meaning without a workpiece installed and without any rolling force applied. The spindle’s X-direction displacement was recorded in real-time by the dial indicator. As shown by the “Phase 1” in Figure 21, this curve represents the machine’s own baseline error, with a peak value of approximately 3.0 μm.
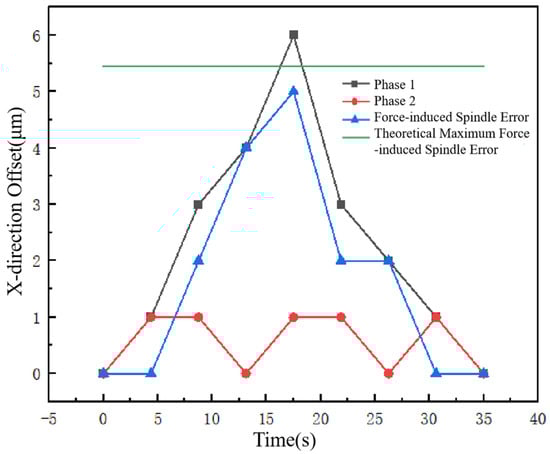
Figure 21.
Spindle deformation in X-direction.
- 2.
- Phase 2: Load Test
To measure the total spindle displacement under the influence of actual rolling forces, which includes all error sources. A lead workpiece was installed, and the exact same rolling program as in Phase 1 was executed. During this phase, the spindle was subjected to significant rolling forces while in motion. The total displacement was recorded in real-time. As shown by the “Phase 2” in Figure 21, this curve represents the total error under load conditions, reaching a peak value of 6.0 μm.
- 3.
- Isolation and Determination of Force-Induced Error:
The total error under load is a linear superposition of the baseline error and the force-induced error. Therefore, by subtracting the baseline error data (from Phase 1) from the total error data (from Phase 2), the deformation caused purely by the rolling force can be accurately isolated. As shown by the “Spindle Force-Induced Error” in Figure 21, this curve represents the experimentally measured X-direction spindle displacement caused solely by the rolling force. The figure indicates that the maximum experimentally measured force-induced error is approximately 5.0 μm.
Explanation of Experimental Limitations: It was observed during the experiment that the rolling force in the Y-direction was relatively small, resulting in a force-induced error of a magnitude too low to be reliably detected in real-time by the dial indicator. Therefore, this experiment focused exclusively on measuring and validating the more significant force-induced error in the X-direction.
5.3.2. Calculation and Analysis of Measurement Error
In this study, the evaluation of “measurement error” does not refer to the instrumental accuracy of the measurement device itself, but rather to the validation of the theoretical model’s accuracy by comparing the “experimentally measured value” with the “theoretically calculated value”. The specific analysis is as follows:
- 1.
- Data Comparison:
Experimentally Measured Value: In Figure 21, the maximum force-induced error isolated from the two-phase experiment was 5.0 μm. According to the force-induced error model established in this paper (Section 3), the theoretical maximum spindle displacement in the X-direction when rolling lead is 5.45 μm.
- 2.
- Relative Error Calculation:
The relative error between the theoretical and experimental values was calculated using the following formula:
Relative Error = |(Theoretical Value − Experimental Value)/Theoretical Value| × 100%
Relative Error = |(5.45 μm − 5.0 μm)/5.45 μm| × 100% ≈ 8.26%
- 3.
- Error Analysis and Conclusion:
As shown in Figure 21, the theoretical maximum spindle displacement is slightly higher than the experimentally measured value. This is primarily because the experimental platform was retrofitted from existing equipment, and due to budget constraints, its overall accuracy and stiffness are somewhat lower than the ideal conditions assumed in the theoretical model.
Despite this discrepancy, a relative error of 8.26% is well within an acceptable range for engineering applications. This sufficiently demonstrates that the force-induced error model established in this study possesses good accuracy and predictive capability, and can be applied to guide production practices.
6. Conclusions
This paper systematically investigated the transmission and influence of machine tool motion errors and force-induced errors during the axial rolling of cylindrical gears. The main achievements are as follows:
First, based on multi-body system theory, an analytical model for the rolling machine tool’s motion errors was established. Through simulation, the effects of 12 key errors of the A and B motion axes were comprehensively analyzed. The results indicate that among all translational positioning errors, those in the X-direction, and , exhibit the most significant impact on workpiece geometric errors. For rotational errors of the A-axis, was identified as the dominant error source, contributing over 90.75% to the total profile deviation. Regarding the B-axis rotational errors, their influence varies by deviation type: contributes 59.3% to the total profile deviation, contributes 48.8% to the total helix deviation, and contributes 62.3% to the single pitch deviation.
Second, addressing force-induced errors, a mathematical model was established by integrating an analytical stiffness model of the rolling wheel spindle with spatial meshing theory to simulate force-induced errors and tooth flank springback. The simulations yielded distinct results for different materials. For high-strength 40CrNiMo steel, the total profile deviation in the x-direction from rolling forces was 32.48 μm, with a total helix deviation of 32.13 μm and a maximum contact springback of 28.27 μm. For lead, the corresponding total profile deviation was significantly lower at 4.39 μm.
Finally, the theoretical models were validated through experiments on a forming test platform. A comparison between the theoretical and measured values for the rolling wheel spindle deformation in the X-direction revealed a relative error of 8.26%, confirming the accuracy and applicability of the established force-induced error model.
6.1. Limitations
First, the model in this paper focuses on quasi-static errors and does not include dynamic effects, such as machine tool vibration and thermal expansion caused by long-term processing. These factors may affect the final accuracy in actual production. Second, although the tooth flank springback model uses validated material parameters, it is based on an idealized contact mechanics model and does not account for complex factors such as material work hardening and the effect of temperature on mechanical properties. Finally, the transferability of the developed model to machine tools with different structures or gears with different geometric parameters still requires further experimental validation.
6.2. Future Work
(1) Validate the transferability of this modeling framework to different machine configurations and gear geometries, thereby enhancing its general applicability. (2) Construct a multi-source error coupling model. More error sources, such as rolling wheel manufacturing errors and thermal errors, will be taken into consideration. The coupling relationships between various motion error terms will be further investigated to establish a more comprehensive and high-fidelity error prediction model. (3) Expand the force-induced error model. The effects of material work hardening and temperature-dependent changes in mechanical properties will be incorporated into the analysis to improve the model’s predictive accuracy across a wider process window. (4) Develop an active error compensation system. The integrated error model developed will be implemented in a real-time control system to predict errors and perform online compensation, thereby advancing the process modeling research toward direct industrial application and ultimately achieving higher-precision gear rolling.
Author Contributions
Conceptualization, Z.M., Y.Z. and Z.W.; methodology, Z.M.; validation, Z.W., Y.Z. and Q.H.; formal analysis, Z.M. and Y.Z.; investigation, Y.Z. and Q.H.; resources, Z.M.; data curation, Z.M. and Z.W.; writing—original draft preparation, Z.W. and Y.Z.; writing—review and editing, Z.M., Y.Z. and Z.W.; visualization, Z.M. and Z.W.; supervision, Z.M. and W.Y.; project administration, Z.M., Q.H. and W.Y.; funding acquisition, Z.M. All authors have read and agreed to the published version of the manuscript.
Funding
This project is supported by the National Natural Science. Foundation of China (No. 52205401), Shanxi Province Science. Foundation for Youths (No. 201901D211292), Award Grants for Outstanding Doctors Working in Shanxi Province (No. 20202036), and Taiyuan University of Science and Technology Scientific Research Initial Founding (TYUST SRIF) (No. 20192022).
Data Availability Statement
Original data are presented herein; inquiries may be directed to the author via email.
Conflicts of Interest
The remaining authors declare that the research was conducted in the absence of any commercial or financial relationships that could be construed as a potential conflict of interest.
Abbreviations
| Symbol | Definition | unit |
| Homogeneous coordinate transformation matrix from body j to body i | ||
| T, R | Translation matrix and Rotation matrix, respectively | |
| α, β | Ideal rotation angles of A-axis and B-axis, respectively | ° |
| y, z | Ideal translation distances along Y-axis and Z-axis, respectively | mm |
| Translational positioning errors of the A-axis | mm | |
| Rotational errors of the A-axis | ° | |
| Translational positioning errors of the B-axis | mm | |
| Rotational errors of the B-axis | ° | |
| Positional error matrix for force-induced deformation | ||
| Applied rolling force in the X and Y directions, respectively | N | |
| E | Elastic modulus of the spindle material | GPa |
| G | Shear modulus of the spindle material | GPa |
| I | Cross-sectional moment of inertia of the spindle | m4 |
| Bending stiffness of the spindle in Y and X directions, respectively | N/m | |
| Torsional stiffness of the spindle | Nm/rad | |
| Maximum deflection of the spindle due to Y and X direction loading | mm | |
| a, b, L | Vertical distances and span between spindle fixed supports | mm |
| e | Eccentricity from load application point to shear center | mm |
| Spindle deflection angle | ° | |
| Contact deformation along the normal direction | ||
| Critical relative deformation for the start of plastic flow | ||
| Contact rebound amount | ||
| Normal contact force | N | |
| l | Length of the contact line | mm |
| Radius of curvature at contact points for rolling wheel and workpiece | mm | |
| Poisson’s ratios of rolling wheel and workpiece materials | ||
| Equivalent elastic modulus | Pa | |
| H | Material contact hardness | Pa |
| k | Mean contact stress coefficient | |
| Yield strength of the gear material | MPa | |
| Base circle radius of the rolling wheel | mm | |
| a | Center distance between the rolling wheel and the workpiece | mm |
| Sum of pressure angles and unfolding angles | ° | |
| Unfolding angle | ° | |
| Position vectors defining the tooth flank equations | ||
| x, y, z | Coordinates on the tooth profile | mm |
| Normal deviation between theoretical and actual tooth flanks | mm | |
| Unit normal vector at a point on the theoretical tooth flank | ||
| Contribution degree and sensitivity coefficient of an error component |
References
- Ramesh, R.; Mannan, M.A.; Poo, A.N. Error compensation in machine tools—A review: Part I: Geometric, cutting-force induced and fixture-dependent errors. Int. J. Mach. Tools Manuf. 2000, 40, 1235–1256. [Google Scholar] [CrossRef]
- Lin, J.; Li, Z. Geometric Error Modeling for CNC Machine Tools Using Differential Transformation. In Proceedings of the 2019 IEEE 3rd Advanced Information Management, Communicates, Electronic and Automation Control Conference (IMCEC), Chongqing, China, 11–13 October 2019; IEEE: New York, NY, USA, 2019. [Google Scholar]
- Chen, J.; Lin, S.; He, B. Geometric error compensation for multi-axis CNC machines based on differential transformation. Int. J. Adv. Manuf. Technol. 2014, 71, 635–642. [Google Scholar] [CrossRef]
- Fu, G.; Fu, J.; Xu, Y.; Chen, Z. Product of exponential model for geometric error integration of multi-axis machine tools. Int. J. Adv. Manuf. Technol. 2014, 71, 1653–1667. [Google Scholar] [CrossRef]
- Wan, H.; Chen, S.; Zheng, T.; Jiang, D.; Zhang, C.; Yang, G. Piecewise modeling and compensation of geometric errors in five-axis machine tools by local product of exponentials formula. Int. J. Adv. Manuf. Technol. 2022, 121, 2987–3004. [Google Scholar] [CrossRef]
- Lin, Y.; Shen, Y. Modelling of five-axis machine tool metrology models using the matrix summation approach. Int. J. Adv. Manuf. Technol. 2003, 21, 243–248. [Google Scholar] [CrossRef]
- Lin, J.; Zhang, Y.; Zhang, X.; Li, W.; Lin, W. Parametric modeling of geometric errors for CNC machine tools based on Chebyshev polynomial. In Proceedings of the 2018 IEEE 3rd Advanced Information Technology, Electronic and Automation Control Conference (IAEAC), Chongqing, China, 12–14 October 2018; IEEE: New York, NY, USA, 2018. [Google Scholar]
- Zhao, Y.; Li, T.; Tang, X. Geometric error modeling of machine tools based on screw theory. Procedia Eng. 2011, 24, 845–849. [Google Scholar] [CrossRef]
- Yang, B.; Zhang, G.; Ran, Y.; Yu, H. Kinematic modeling and machining precision analysis of multi-axis CNC machine tools based on screw theory. Mech. Mach. Theory 2019, 140, 538–552. [Google Scholar] [CrossRef]
- Zhou, T.; Yinghua, L.; Jie, J.; Junchao, Z. A method of sensitivity analysis and precision prediction for geometric errors of five-axis machine tools based on multi-body system theory. Int. J. Adv. Manuf. Technol. 2022, 123, 3497–3512. [Google Scholar] [CrossRef]
- Hu, Z.Y. Research on Multi-Source Error Modeling and Compensation Method for Large-Scale Hobbing Machine Based on Differential Kinematics. Ph.D. Dissertation, Chongqing University, Chongqing, China, 2022. [Google Scholar]
- Huang, M.X.; Niu, X.H.; Niu, J.Q.; Gao, Y.R.; Wang, X.D.; Zhu, H.M. Analysis and modeling of geometric errors in three—Axis computer numerical control machine tools. J. Tianjin Univ. Technol. 2024, 40, 22–29. [Google Scholar]
- Wang, Z.R. Research on Geometric Accuracy Distribution of Vertical Machining Centers Based on Weighted Response Surface Method. Master’s Thesis, Chongqing University, Chongqing, China, 2020. [Google Scholar]
- Fan, J.; Liu, S.; Wu, J.; Pan, R.; Sun, K.; Li, Z. A machining error prediction model for five-axis machine tools based on multi-body system theory and homogeneous transformation matrices. J. Braz. Soc. Mech. Sci. Eng. 2025, 47, 411. [Google Scholar] [CrossRef]
- Li, T.J.; Li, J.G.; Wang, H.; Ding, X.H.; Lin, Z.J. Research on Accuracy Calibration of High-precision Machine Tools Based on Equivalent Kinematic Errors. J. Mech. Eng. 2025, 1–9. Available online: https://link.cnki.net/urlid/11.2187.TH.20250210.1526.002 (accessed on 10 February 2025).
- Wu, H.; Yang, J.G.; Zhang, H.T.; Guo, Q.J. Cutting Force Induced Error Synthesis Modeling of a 3-Axis CNC Milling Machine. China Mech. Eng. 2008, 15, 1908–1911. [Google Scholar]
- Zhao, B.B.; Chen, F.X.; Hong, R.J. Analysis of Influence of Spindle Deformation on Machining Accuracy in Power Skiving. Modul. Mach. Tool Autom. Manuf. Tech. 2022, 6, 62–66+71. [Google Scholar]
- Guo, Z.Z. Research on Error Modeling and Compensation of Cutting Force-Induced Error and Thermal-Induced Error in CNC Gear Hobbing Machine. Master’s Thesis, Chongqing University, Chongqing, China, 2022. [Google Scholar]
- Sun, S.L. Research on Multi-Source Error Modeling and Compensation Method for CNC Hobbing Process. Ph.D. Dissertation, Chongqing University, Chongqing, China, 2018. [Google Scholar]
- Lin, J.; Ye, C.; Yang, J.; Zhao, H.; Ding, H.; Luo, M. Contour error-based optimization of the end effector pose of a 6 degree-of-freedom serial robot in milling operation. Robot. Comput. Integr. Manuf. 2022, 73, 102257. [Google Scholar] [CrossRef]
- Yue, C.; Liu, X.; Ding, Y.; Liang, S.Y. Off-line error compensation in corner milling process. J. Eng. Manuf. 2018, 232, 1172–1181. [Google Scholar] [CrossRef]
- Li, H.W. Research on Geometric Error Modeling, Measurement and Compensation Techniques for Three-Axis CNC Machine Tools. Ph.D. Dissertation, Huazhong University of Science and Technology, Wuhan, China, 2023. [Google Scholar]
- Li, M. Sensitivity Analysis and Compensation Research of Geometric Errors of the Large-Sized Hobbing Machine Tool. Master’s Thesis, Chongqing University, Chongqing, China, 2022. [Google Scholar]
- Chen, F.X.; Hong, R.J. Analysis of the influence of force—Induced gear deformation on machining accuracy of power skiving. Manuf. Technol. Mach. Tool 2020, 12, 116–121. [Google Scholar]
- Chang, W.R.; Etsion, I.; Bogy, D.B. An elastic-Plastic model for the contact of rough surfaces. J. Tribol. 1987, 109, 257–263. [Google Scholar] [CrossRef]
- Liu, Z.T. Research on Thermal Error Modeling and Compensation of High-Speed Dry-Cutting CNC Gear Hobbing Machine. Master’s Thesis, Chongqing University, Chongqing, China, 2018. [Google Scholar]
- Tan, Y.X.; Peng, X.L. The Influence and Correction for Face Gear Accuracy with Machine Tool Geometric Location. Manuf. Autom. 2024, 46, 101–108. [Google Scholar]
- Dai, H. Research on Error Mapping and Mechanism of Error Generation for Large-Sized Gear Profile Grinding Machine. Master’s Thesis, Chongqing University, Chongqing, China, 2017. [Google Scholar]
- Yang, Y. Principles of Metal Plastic Processing; Chemical Industry Press: Beijing, China, 2016; Volume 3, pp. 154–196. [Google Scholar]


Disclaimer/Publisher’s Note: The statements, opinions and data contained in all publications are solely those of the individual author(s) and contributor(s) and not of MDPI and/or the editor(s). MDPI and/or the editor(s) disclaim responsibility for any injury to people or property resulting from any ideas, methods, instructions or products referred to in the content. |
© 2025 by the authors. Licensee MDPI, Basel, Switzerland. This article is an open access article distributed under the terms and conditions of the Creative Commons Attribution (CC BY) license (https://creativecommons.org/licenses/by/4.0/).