Article

Optimization of Parameters in Multi-Spot Projection Welding of Thin Aluminized Steel Sheets

by
Alexandru Vladut Oprea
1,
Robert Catalin Ciocoiu
2,
George Constantin
3,
Carmen Catalina Rusu
4,5 and
Ionelia Voiculescu
1,5,*
1
Quality Engineering and Industrial Technology Department, Industrial Engineering and Robotics Faculty, National University of Science and Technology Politehnica Bucharest, 313, Splaiul Independentei, 060042 Bucharest, Romania
2
Materials Science Department, Material Science and Engineering Faculty, National University of Science and Technology Politehnica Bucharest, 313, Splaiul Independentei, 060042 Bucharest, Romania
3
Robots and Production Systems Department, Industrial Engineering and Robotics Faculty, National University of Science and Technology Politehnica Bucharest, 313, Splaiul Independentei, 060042 Bucharest, Romania
4
Manufacturing Engineering Department, Faculty of Engineering, “Dunarea de Jos” University of Galati, 47 Domneasca St., 800008 Galati, Romania
5
Centre for Advanced Research in Welding (SUDAV), Faculty of Engineering, “Dunarea de Jos” University of Galati, 47 Domneasca St., 800008 Galati, Romania
*
Author to whom correspondence should be addressed.
Appl. Sci. 2025, 15(19), 10530; https://doi.org/10.3390/app151910530
Submission received: 13 August 2025 / Revised: 19 September 2025 / Accepted: 25 September 2025 / Published: 29 September 2025
(This article belongs to the Topic Welding Experiment and Simulation)

Abstract

Welding is a technological variant of the electric resistance spot-welding process in which the machined protrusion on the surface is heated and rapidly deformed, and the small molten zone formed at the interface is then forged to form the weld spot. The paper analyses the effects of projection welding parameter values for thin, low-carbon aluminized steel sheets. Two sets of 16 welded samples having three or five protrusions were performed and analyzed using the Taguchi method. The microstructural aspects were analyzed in cross sections made through the welded points, highlighting the expulsion or accumulated effects of the Al-Si alloy protective layer and the formation of intermetallic compounds. To estimate the effect of welding parameters, the samples were subjected to tensile strength tests, and the fracture mode was evaluated. It was found that the values of the breaking forces were close for the two types of samples analyzed, for identical values of the welding regime parameters, but the elongation at break was double in the case of samples with five protrusions. The breaking force increased from 10.9 kN for samples with three protrusions to 11.4 kN for samples with five protrusions, for the same values of welding parameters.

1. Introduction

Electric resistance welding is a process widely used in industrial processes for the joining of thin metal components [1]. This process can also be applied to joining components of different thicknesses or parts made of different materials, such as brass, aluminum and steel [2,3,4]. In the joining process by “reduced-scale hot forging”, it is necessary to ensure the precise control of the current, force and welding time values to obtain the desired strength and quality of the weld [5,6]. The projection welding process is derived from electric resistance spot welding, the difference being the concentration of the current lines on some protrusions machined on the surface of one of the components [7,8]. This method is effective for materials that have sufficient resistance to deformation and simultaneous heating, such as steel [9]. The protrusions have the role of increasing the local current density, which allows welding using lower current values. In addition, in spot welding, the electrode tips require mechanical resharpening after 3000 welded spots, while in projection welding the electrode surface is flat and the service life is much longer [10,11,12,13]. Unlike spot welding, the projection welding process has no thickness limitations of at least one of the components, the positioning of the joint areas being established by the designer to ensure the functional role of the assembly. Other advantages of the method are lower effects of deformation and overheating, smaller amounts of spatter ejected from the molten core and the total consumption of electricity required for welding lower than that of spot welding, which brings economic advantages after implementation of the welding system [14,15,16].
Depending on the thickness and type of materials to be welded, the welding time can vary from a few milliseconds to 1 s (50/60 cycles). In projection welding, the dimensions of the protrusions are chosen according to the thickness of the thinner component, the mechanical properties of materials and the required value of the breaking resistance of the welds. Regarding the design of the protrusion, its wall thickness must be at least 70% of the thickness of the welded component, to ensure a proper deformation behavior during welding [17,18]. Polyakov et al. [9] found that the strength of projection welded joints was provided by a common annular zone resulting from the contact of the two components, which began to form during the current supply.
To maintain uniform heating conditions, the pressing force of the electrode must be gradually increased. High-pressure values cause a decrease in electrical resistance but also an increase in the width of the welded spot, with fewer gaps in the fusion zone. However, excessively high-pressure values can cause the massive expulsion of the molten metal from the welded point and the formation of an unsightly imprint [19]. For welding technology to be accepted, the fracture must occur outside the welded point (in the base material), and the fracture force values must be at least 75% of the tensile strength of the base material [20].
The desired diameter of the molten core depends on the correct adjustment of the intensity of the welding current as a function of time. The cross section of the weld point is a measure of the quality of the joint, directly influencing the value of the breaking force [21,22]. Research on low-carbon steels has shown that adequate weld spot breaking strength values can be obtained by simultaneously making several small diameter spots [14,23]. If the time is short, the diameter of the core is too small, and if the time is long, the amount of molten metal increases and is projected outside the working area, with the consequence of decreasing the joint strength [24,25,26,27].
A basic condition in projection welding is the ability to quickly break or remove the oxide or coating layer from the surface of the parts, to ensure good mechanical contact and implicitly correct electrical contact between the two base materials [28,29]. Because aluminizing steel is a relatively simple method of producing oxidation-resistant coatings, in industrial applications there are often coated components that need to be joined. Al-coatings often have irregular surfaces and superficial porosity, but always without developing cracks [30]. The presence of the protective layer affects the contact resistance of aluminized materials. In addition, during the forging of the molten core, the Al-Si alloy layer is expelled towards the edges of the welded area with the formation of unsightly accumulations with high hardness [31]. Ji et al. [32] studied the effects of two types of metal coatings, namely Al-Si and Zn, on the geometry of weld spots in a hot-rolled boron alloy steel. They found that the welding current reached the optimum density much faster for the Al-Si layer than for the Zn coating. In addition, embrittlement due to liquid zinc limits the weldability of steels and influences the mechanical resistance of welds. Saha et al. [33] found that the heat generated during resistance welding at the interface between the steel and the Al-Si layer was large enough to form a molten core with the appropriate diameter.
Continuous improvements in the aluminizing process have expanded the possible applications of steel components coated with thin layers of Al or Al-Si alloys. Such semi-finished products are often found in the manufacture of components for the automotive industry or in the production of baking molds for the food industry. Since many aluminized steel components are welded, it is important to know the phenomena occurring in the molten core area that affects the strength characteristics of the joints. Currently, few references in specialized literature have addressed this issue. The paper studied the effect of the process parameters during multi-point projection welding on the tensile strength of the joints performed between components made of aluminized steel, with three and five protrusions, respectively. The geometry of the welded areas for different values of the welding parameters, the distribution and concentration of chemical elements in the interface, the expulsion of the molten metal and the formation of intermetallic compounds at the edge of the welded point were analyzed.
The Taguchi method was used to optimize the values of the welding process parameters. The results obtained with the ANOVA method for the S/N ratio with a single response of the maximum breaking force and the minimum breaking displacement showed that pressure was the factor with the highest contribution to the maximum breaking force and breaking displacement, which significantly influenced the mechanical characteristic of the weld. It was observed that by increasing the number of protrusions from three to five, there was an increase in the joint breaking force value from 10.9 to 11.4 kN, using the same values of welding parameters.

2. Materials and Methods

2.1. Materials

The welded parts used in the study were made of laminated aluminized low-carbon steel, with thicknesses of 0.8 and 1.2 mm. The samples’ thickness was chosen from a practical application encountered in the manufacture of baking molds in the food industry. The steel trademark is DX52D, with the quality certificate emitted by Bamesa SA, according to DIN 50049 [34]. The mechanical properties resulting from the material certificate are a Rp0.2min of 161 MPa, Rm of 176 MPa and elongation (A50) of 7%. The superficial layer obtained by aluminization procedure (average thickness of 20 µm) contains some elements such as (wt.%) 0.5Si; 0.7Fe; 0.1Ti; 0.9–1.5 Mn; 0.2Zn; 0.1Zr; and 0.3Mg, as shown by the certificate of chemical analysis No. 0021591553, provided by the ThyssenKrupp company.

2.2. Methods

2.2.1. Welding Process

A TECNA Series 8005D electric resistance welding machine was used for welding (maximum welding power 200 kVA, maximum welding current for steel 28 kVA). For the experimental program, pairs of electrodes made of Cu-Cr-Zr alloy (high-strength age-hardened material 2.1293-CW106C for manufacturing spot electrodes), having a flat face and a working surface of 25 mm × 25 mm, were used. For the first experiment set (16 pairs of samples), three protrusions were made simultaneously on the steel sheets with a 1.2 mm thickness, using a punch and a steel tool mold (Figure 1a). For these types of samples, the distance between the protrusions’ axes was approximately 10 mm. Then, using another mold and a punch having five pins, a second set of 16 pairs of samples having five protrusions have been made, having between axes distances of 13 mm (Figure 1b).
The protrusions were formed using a 2000 kN pneumatic press (WC67Y, Shanghai, China) in approximately 1.5 to 1.6 s per operation. To limit the movement and deformation of the components during welding and to ensure good alignment, a simple device was designed and adapted to the shape and dimensions of the samples (Figure 2).
The length of the welded parts and the overlapping length was established according to the EN 1993-1-3 [35] and EN 1993-1-3 Standards [36]. For the analysis of the welded areas, samples were cut using the IsoMet 4000 precision cutting machine (Buehler, Düsseldorf, Germany).
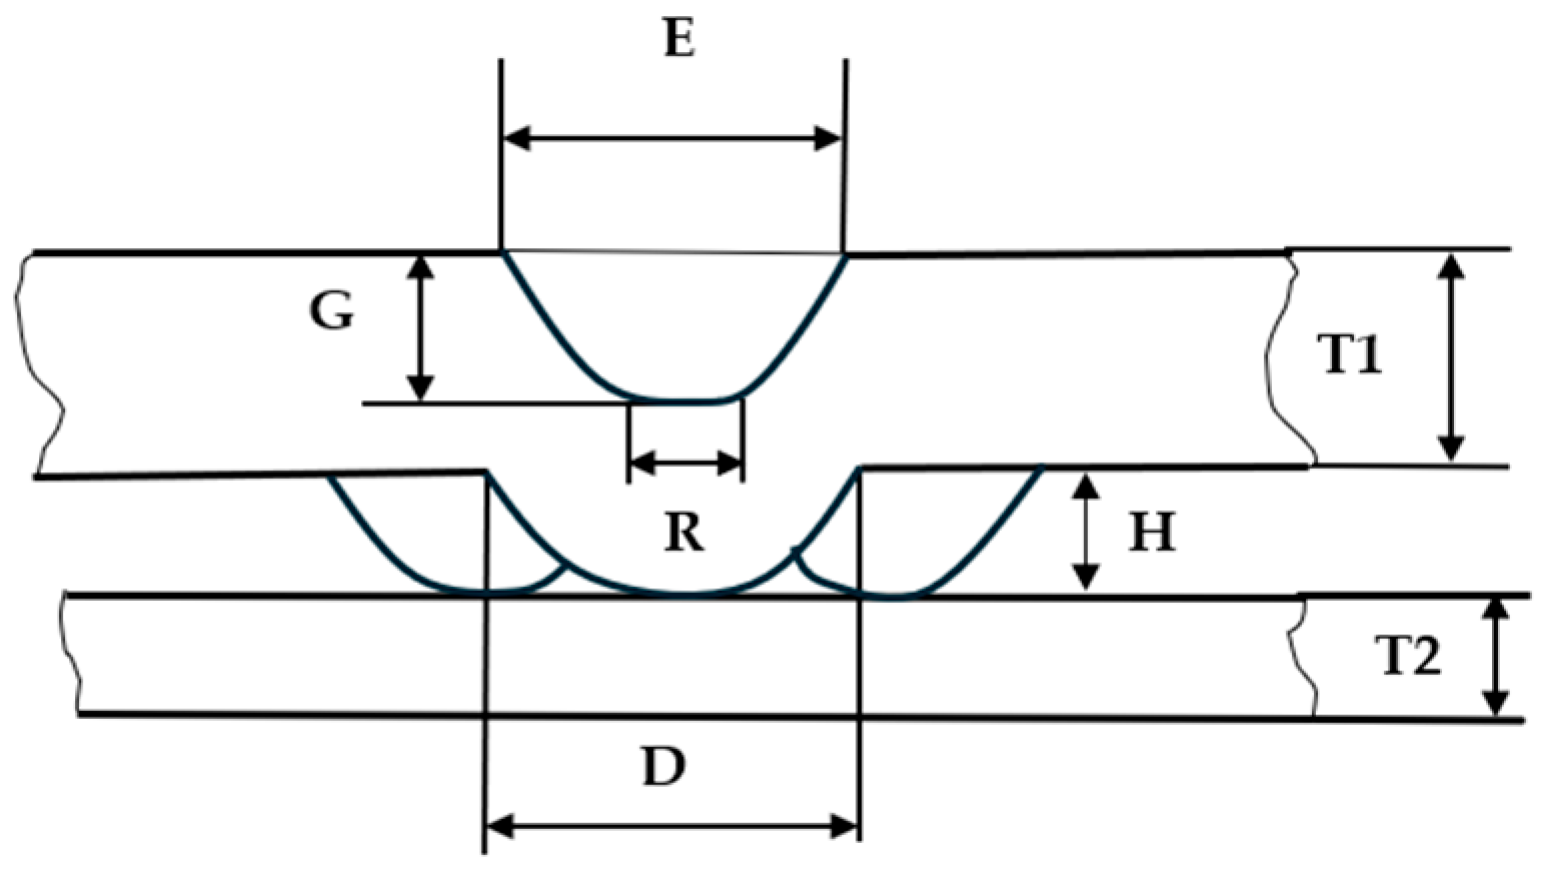
For welding, samples with thickness S1 (1.2 mm) with protrusions were superimposed on plain samples with thickness S2 (0.8 mm, without protrusions), oriented towards the interface between them (Figure 3). The dimensions of the protrusions according to the scheme (Figure 3) are presented in Table 1.

2.2.2. ANOVA and Taguchi-Based Design of Experiments (DoE)

The Taguchi method falls within the field of optimization and is based on establishing several factors that influence a product or a process, determining their best values and allowing the achievement of the established objective [37,38]. Analysis of Variance (ANOVA), a statistical method used to analyze the influence of different welding processes parameters on the quality of the weld, was used. By employing this method, the parameters that significantly influence weld geometry or mechanical and metallurgical characteristics—such as strength, hardness and fracture mode—have been evaluated. By analyzing the variance in the data, ANOVA allows us to identify the most influential parameters and to optimize of the welding process [39,40,41,42]. The welding experimental plan was established using an orthogonal Taguchi matrix L’16, having 16 experimental determinations (Table 2).
The number of parameters that influence the projection welding process is P = 3, each having four levels L of welding values (L = 4). The welding parameters have different effects on the weld spot diameter, the expansion of HAZ (heat-affected zone), the depth and diameter of the indentation and the level of material thickness reduction in the weld zone. When setting the welding parameters values, recommendations from the specialized literature and results obtained in previous experimental programs were considered. A hydraulic dynamometer with insulated support was used to calibrate the value of the welding pressure, and the Miyaki MM-315B device (AMADA WELD TECH Europe, with the precision measurement of ±0.1 A) was used to measure the current values during projection welding. The electrode pressure for carbon steel (soft regime) is recommended to be in the range of 7 to 12 daN/mm2, while the pressing force F should be in the range of 60 to 300 daN [25,26,27]. The response parameters considered in the research plan are the following: the tensile strength, expressed by the maximum breaking force of the welded joint Fb (kN); the displacement during breaking Db (mm) and the breaking mode (failure mode). A parameter that considers the structure of the welding joint is the number of protrusions N, having values of 3 and 5. Thus, the experimental plan was designed with the same parameter values, both for N = 3 and for N = 5 (Table 3).
The range of welding power values used in the research was between 17.7 and 20.5 kVA; the welding time values ranged from 4 to 7 ms and the pressure values applied to the electrodes ranged from 2.8 to 5 bars. The results obtained for the detailed experimental plan are presented in Table 4 and Table 5.
If the pressing force value is too high, the protrusion flattens quickly before the weld spot is formed. If the welding power and welding time are too high, it results in excessive heating and rapid melting, which can cause excessive deformation or perforation of the sample [12,20,43,44]. A reduction in current density decreases the amount of locally concentrated heat, resulting in a molten core with an insufficient section to provide the required shear strength.

2.2.3. Coating Microstructure

The surfaces of the steel plates were examined, as well as the aspect, adhesion and thickness of the Al alloy protective layer. The steel surface was examined to highlight the continuity of the protective Al-Si alloy layer outside the welded area. Microstructural analysis was performed by optical microscopy, using an inverted metallurgical microscope (Olympus GX 51, Tokyo, Japan) equipped with specialized software for image processing (AnalySis) and a scanning electron microscope (Inspect S, FEI, Eindhoven, The Netherlands) equipped with a Z2e EDAX AMETEC sensor for chemical micro-composition analyses made on small areas. Cross sections were performed through the welded points to examine the microstructure of the welded area and to measure the microhardness in the weld and the heat-affected zone. The cut surfaces were hot embedded in phenolic resin then subjected to sanding operations using abrasive paper (grits from 200 to 2400) and then polishing with alpha alumina powder in suspension, with grains from 3 to 0.1 μm. To highlight the microstructural characteristics (phases, imperfections of the welded interface, estimation of diffusion effects) the polished surfaces were washed, dried and etched using Nital reagent (2% nitric acid in 98 ethyl alcohol) and an immersion time of 10 to 12 s, at ambient temperature.
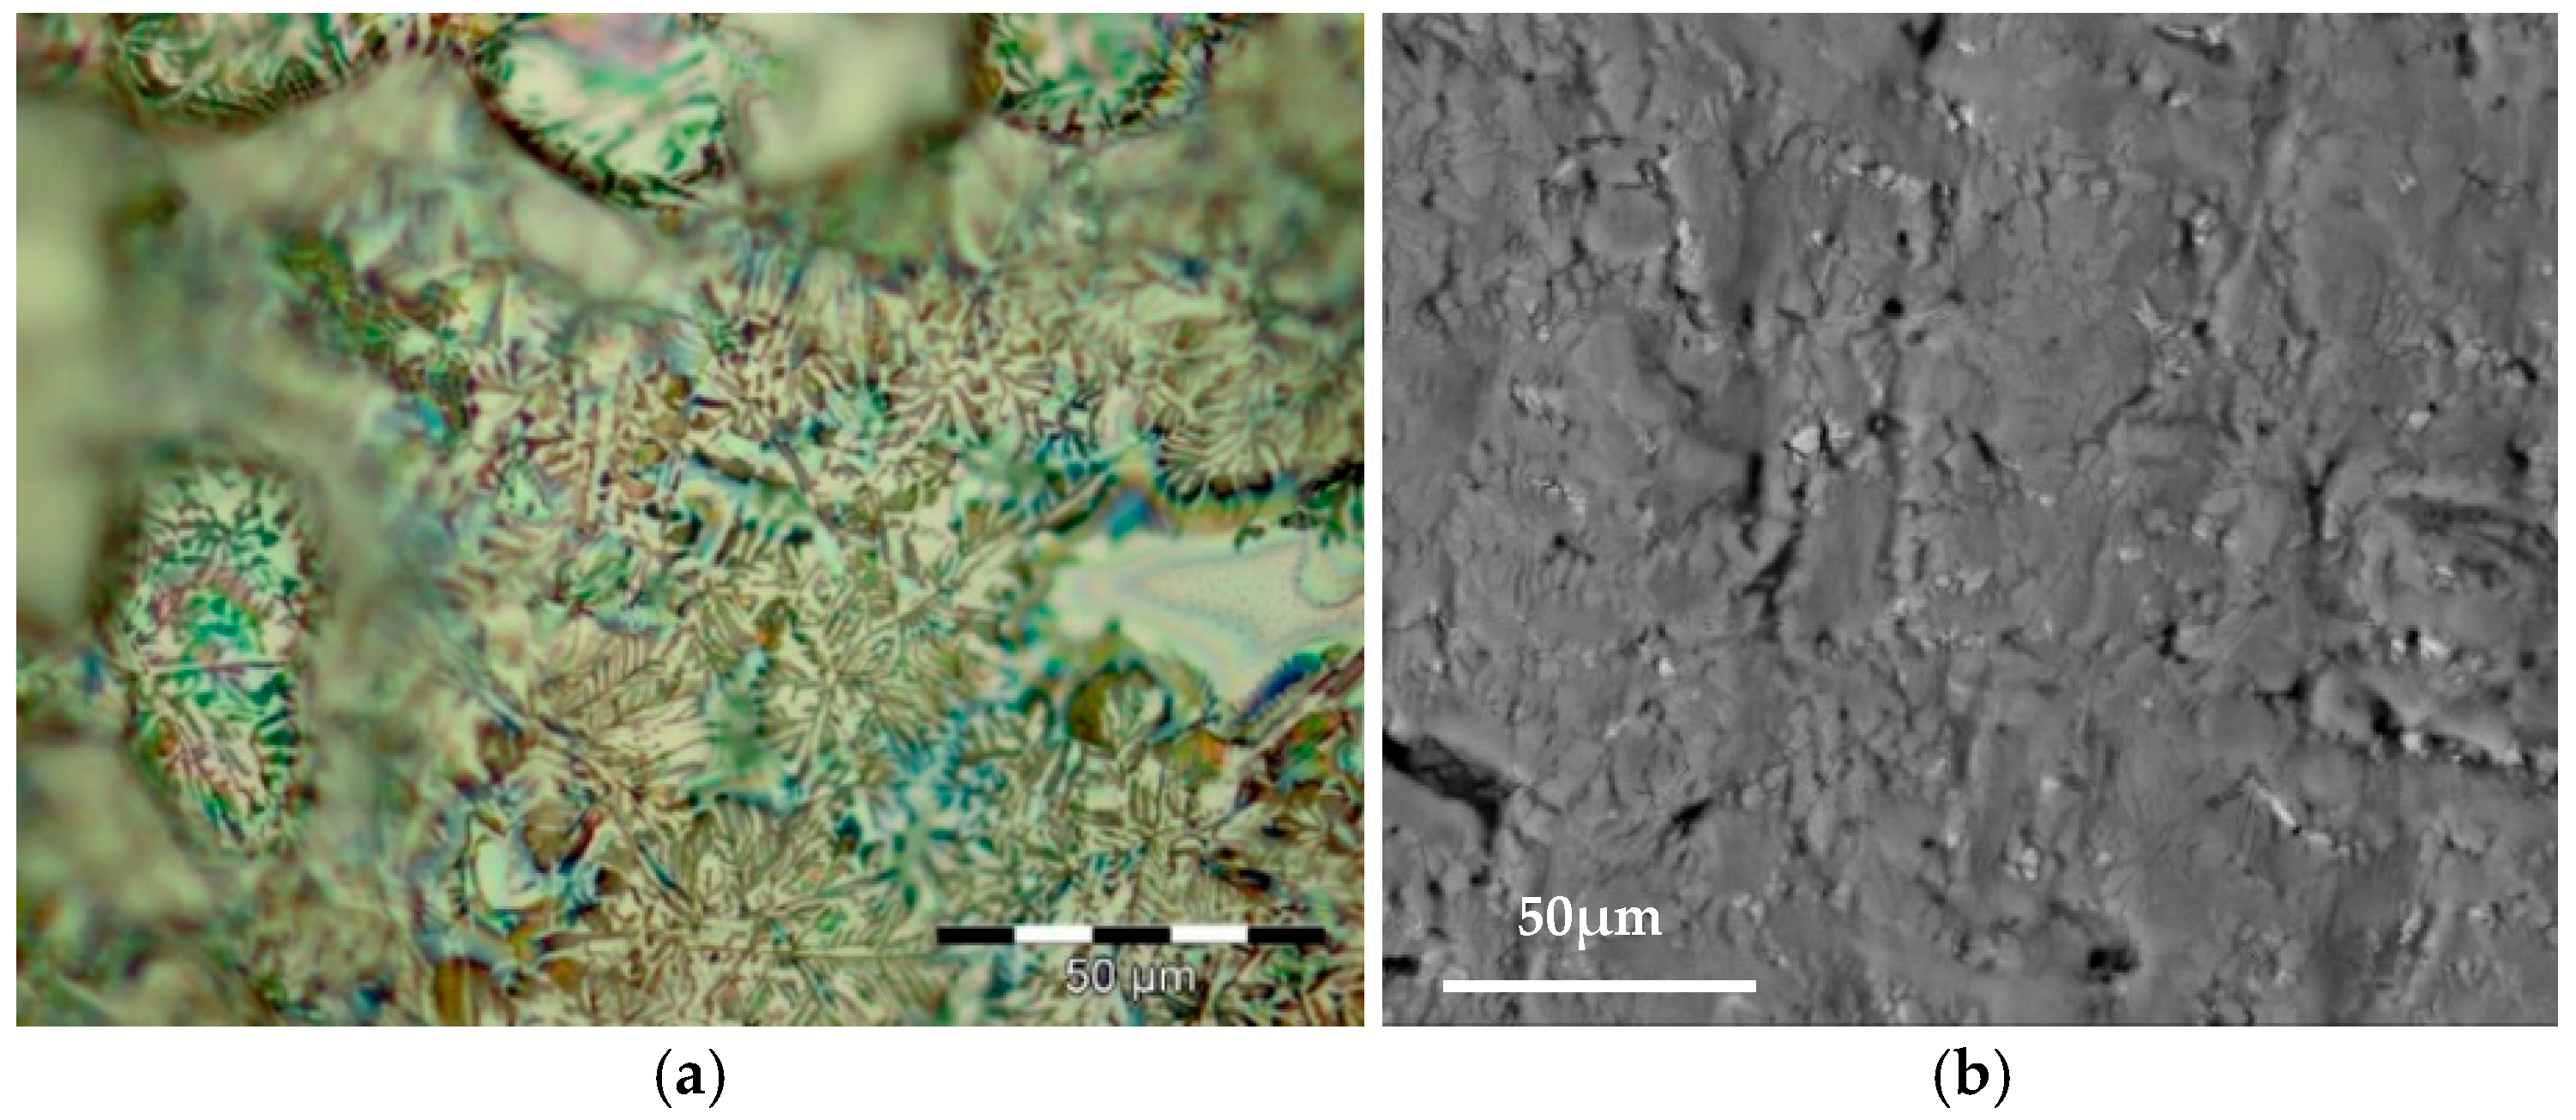
Optical and SEM analysis performed on the surface of the aluminized sheet indicated a quasi-uniform dendritic aspect of the aluminum layer, without cracks or exfoliation (Figure 4a,b).
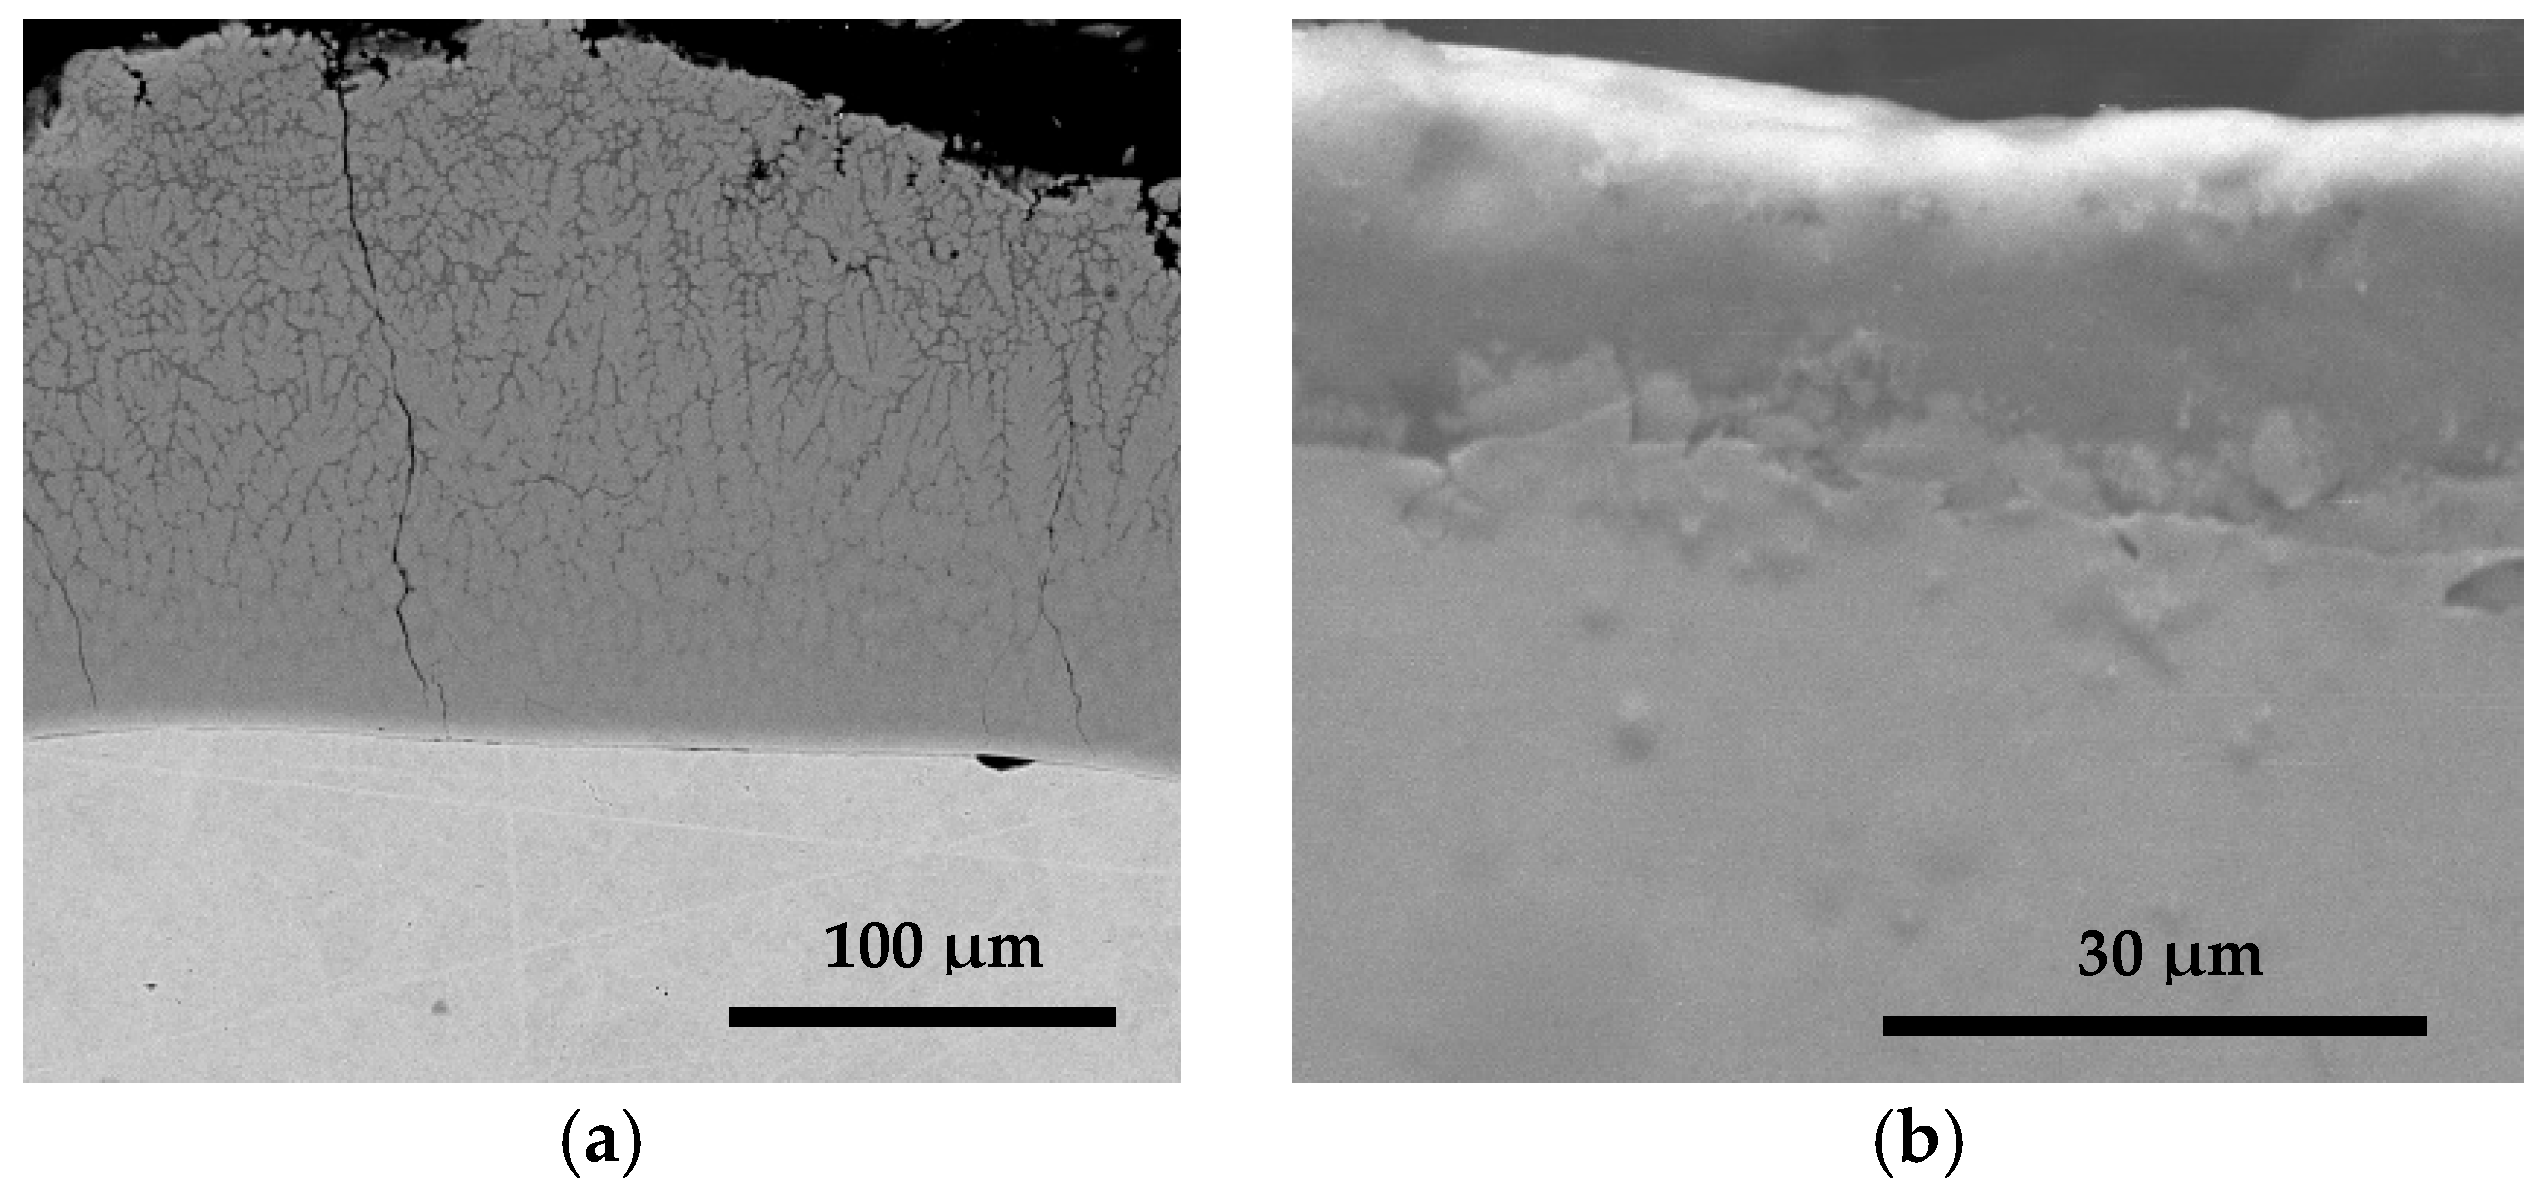
SEM analyses of the Al-Si alloy protective layer indicated an average thickness of 30 μm that was sufficiently compact, having a dendritic microstructure (Al-Si), a continuous interface and good adhesion to the steel substrate (Figure 5a). The EDS analysis of the chemical composition carried out on the cross section revealed, in the aluminized layer, the presence of aluminum as the majority element (over 88 wt.% Al), together with oxygen from aluminum oxide O (7.90 wt.%), Si (2.90 wt.%) and Fe (1.20 wt.%) (Figure 5b).
The distribution of chemical elements across the coating layer is well highlighted in Figure 6.

2.2.4. Tensile Tests

The shear strength of the welded specimens was determined with the “w + b” tensile/compression testing machine (Walter + Bai AG, Löhningen, Switzerland). The dimensions of the welded specimens for this test were 40 mm wide and 150 mm long, with an overlap of 65 mm and total length of 230 mm. Following welding, tensile tests were conducted. The displacement at breaking was measured, and the failure was examined. The samples were visually examined to assess the configuration of the welded points, highlighting the effects of overheating or oxidation of the surfaces, insufficient melting or the material deformation (Figure 7). As can be seen in Figure 7, for both types of samples (with 3 or 5 protrusions), the fracture occurred in the base material.
In sample V/2, shearing of a weld point is observed before the fracture occurred in the base material. The graphical representation of the stress–strain curves for the welded samples is shown cumulatively in Figure 8a for 3 protrusions, and in Figure 8b for 5 protrusions.

2.2.5. Microhardness

The measuring of microhardness was carried out with the Shimadzu HMV 2T microhardness tester (Tokyo, Japan) under the following working conditions: temperature at +25 °C (reference temperature of +23 ± 5 °C) and humidity of 55%. The measurements were performed on the cross section of the welded samples, applying the indentation load of 0.2 N and the indentation time of 10 s. The average hardness of the base material was 156 HV0.2 (variation coefficient, Vc of 1.48). The aluminized layer had an average hardness of 861 HV0.2 (Vc of 0.87), and the weld fusion line measured 188 HV0.2 (Vc of 1.97). In the heat-affected zone, the hardness was 158 HV0.2 (Vc of 1.91).

3. Results and Discussion

3.1. Weld Microstructure

The welding regime parameters values have great influence on the microstructural aspects and chemical element distribution [43,44,45,46]. In addition, these values influence the final geometry of the melted area and the diameter of the welded spot or the surface aspect (oxidation, protection layer removing or cracking). After welding, samples characterized by the best or the worst tensile test results were selected to perform microstructure analyses on the spot welds. In the aluminized layer, interdendritic cracks developed in sample III/2 (for the welding power of 19 kVA), as result of rapid heating, expansions and contractions between the base material (carbon steel) and coating material (Al-Si), due to the different mechanical properties (Figure 9a). Micro-cracks were not identified on the aluminized layer in sample III/16, where the welding power was decreased to 17.7 kVA (Figure 9b).
The chemical composition variation on either side of the welded interface is due to mutual diffusion of elements during the welding process. At the interface between the aluminized layer and the base material, the chemical composition contains 1.11–1.22 wt.% Al, 0.94–1.06 wt.% Si, 96.29–96.44 wt.% Fe, 1–1.05 wt.% Co and 0.35–0.54 wt.% Mn (Figure 5a). Near the interface with the substrate, the chemical composition of sample III/2 contains about 44.36 wt.% Al, 6.66 wt.% Si, 7.37 wt.% O and 45.25 wt.% Fe (Figure 5b). From different measurements performed on the samples III/2 and III/16, the results showed that iron had a wide variation in concentration from over 96 wt.% in the steel plate to about 65 wt.% in the coating layer, at about 20 μm distance from the welding interface. The other chemical elements (Al, Si, Mn, Co) had similar values to those determined on the non-welded part (see Figure 6).
The geometric aspect of the welded spot area was studied by optical microscopy using the AnalySis program. As can be seen from the images in Figure 10, changing the values of the welding regime parameters causes notable differences in the aspect (formation of a deformation crater with contoured edges or a point with a flat and aesthetic appearance), size and breaking strength of the welded point. If the welding power value is between 19 kVA and 20.5 kVA, at the same pressure value of 3.4 bar and a welding time of 7 ms, the diameter of the welded spot takes values between 2.6 mm to 3.5 mm.
For the lowest values of pressure (2.8 bar), average welding time (5 ms) and average welding power (19 kVA), the spot-welding interface is quite continuous, except for some small isolated, randomly distributed pores, and some areas with a lack of adhesion on the peripheral annular area (Sample III.2, Figure 10a). In this case, the spot diameter is 2.8 mm and the shear breaking force value is 10.723 kN.
Increasing the pressure to 5 bar and maintaining the same power value (19 kVA), with a slight increase in time to 6 ms, led to the flattening of the welded area, obtaining a more pleasant appearance of the weld, without the aspect of the annular crater; the weld spot diameter is 3.5 mm and the breaking force value increases to 10.805 kN (Figure 10b). Although a substantial increase in breaking strength is not obtained, the aspect of the weld becomes important especially when working in different potentially corrosive environments and variable temperatures.
By changing the welding pressure to 5 bar and the welding time to 7 ms but reducing the power to 17.7 kVA, an increase in the breaking force value to 10.901 kN was obtained (Figure 10c). For the same values of the welding regime (sample V/2), when welding with five protrusions, the aspect of the welded point is quite similar, but the value of the breaking force is only 8.8854 kN. In this case, the diameter of a welded spot is smaller (only 1.88 mm), and accumulations of compounds are visible at the end of the annular area, coming from the Al-Si alloy protective layer (Figure 11).
The chemical composition results from the EDS analysis performed on the accumulated compounds is presented in Figure 12.
The micro-chemical composition analyses performed with the EDS method indicate the formation of complex compounds. The chemical composition of the compounds accumulated at the welded interface indicates the formation of the Fe-Al2 and Fe-Al compounds, which are found in the Fe-Al binary phase diagram [47]. Studies carried out on Fe-Al powder mixtures have highlighted the formation of intermetallic compounds starting at 600 °C, by the diffusion of aluminum into the iron grains, because aluminum atoms have higher mobility and easily penetrate the boundaries of iron grains [48]. Fe-Al2 solidifies from the melt at approximately 1165 °C, a temperature that can be reached and exceeded in the molten core of the weld. Although the melting and cooling times of the molten zone are very short, the metal pressing during the welding process causes the expulsion and accumulation of these compounds towards the ends of the welded joint. Fe-Al2 is a brittle compound, representing a source of crack initiation, and its accumulation at the periphery of the welded spot area causes a reduction in the strength of the joint.
Increasing the value of pressure to 5 bar and time to 7 ms and reducing the welding power to 17.7 kVA (sample V/16), allows for the highest breaking force value of 11.406 kN to be obtained (Figure 10d). Similarly, the accumulation of products resulting from the detachment of the protective layer can be observed, located at the periphery of the annular area of the welded point. The advantage of low-power welded samples is the beautiful appearance of the welded points, without a visible imprint in the protrusion area and with a protective layer unaffected by the welding process.

3.2. Tensile Test Behavior

As can be easily seen from the stress–strain diagrams (Figure 8), the values of the maximum breaking forces are grouped and have close values, for most of the samples. Furthermore, as a rule, the breaking deformation in the case of samples welded with five protrusions is approximately double compared with samples with three protrusions, for the same values of the welding regime parameters. Among all the samples welded with three protrusions, the most unfavorable combination of welding parameter values was obtained for sample III/1, where the rupture occurred at only 8.58 kN, and the deformation at rupture was the lowest (1.53 mm). Additionally, among the samples welded with five protrusions, the most favorable situation was recorded for sample V/16, where the rupture force reached the highest value among all the welded samples (11.40 kN).
According to AWS/ANSI/AISI [35,36] standards, the size of the welded spot (d) that provides the necessary tensile strength must meet the following conditions:
ds = 4t0.5
where t is the base material thickness. The tensile breaking force can be estimated with the following relationship:
F T   =   2.7 t d f u / γ M
In Equation (2), fu is the tensile strength, and γM is the yield strength of the material. In the case of the material analyzed in the paper, the mechanical characteristics of the base material (aluminized steel) are a fu of 176 MPa and γM of 161 MPa.
According to Equation (2), for a single spot weld with a diameter of 4 mm and a steel sheet with a thickness of 1.2 mm, the value of the breaking force should be as follows:
F T =   2.7 1.2   ×   4   ·   161 176 = 5.65   k N
If the sheet is 0.8 mm thick and the diameter of the welded spot is 4 mm, the value of the breaking force becomes the following:
F T   =   2.7 0.8   ×   4   ·   161 176 = 4.62   k N
For the welded joint between the two sheets having thicknesses of 1.2 mm and 0.8 mm, respectively, the approximate breaking force is considered for the sheet with the lowest thickness, i.e., a value of 4.62 kN. For three welded points, the overall breaking force value should be 3 × 4.62 = 13.86 kN. In the case of samples welded with five points, the total breaking force value should be 5 × 4.62 = 23.10 kN. However, the breaking force value in this case does not reach the calculated maximum value, because not all welded points contribute to the load simultaneously. At the same time, the diameter of a welding spot does not reach 4 mm.
Consequently, the use of five simultaneously welded points has no immediate benefits in terms of the maximum breaking force value. Although it is not possible to measure the diameter of the welded spot with maximum accuracy, because pressing on the protrusion during welding causes its deformation and sliding of the material (it does not form a clearly defined edge that can be measured), the range of values for the diameter of the welded spot with three protrusions can be considered to be 4.08 to 4.48 mm (Δd = 0.40 mm) and for five protrusions, to be 2.61 to 3.09 mm (Δd = 0.48 mm). These values correlate with the actual values of breaking forces recorded during mechanical tensile tests (Table 4 and Table 5).

3.3. Relation Between Welding Energy and Tensile Tests

To analyze the amount of heat generated by the Joule–Lenz effect in the weld point area, which depends on the thermal conductivity, the electrical resistance of the metal as well as the time for the current to pass through the joint, the following relationship can be used:
Q = I2RT = PT
where Q is the thermal energy, I—welding current, R—electrical resistance, T—the current flows time, and P—welding power.
Using Equation (5), the values of the energy used in welding were calculated for all samples in the experimental program, both with three protrusions and five protrusions (Table 6). The energy available to melt the interfaces of the welded point was lower in the case of samples with five protrusions, because its effective value was divided by a larger number of points. Table 6 shows that high values of breaking forces (over 10.9 kN) can be obtained even if lower power values (17.7 kVA) are used, for example, in samples III/6, III/11 and III/16. This fact was compensated for by the choice of higher values of welding time (of 5, 6 or 7 ms). The most advantageous in terms of energy consumed during welding is sample III/6, which recorded only 88.6 J, compared with sample III/6 which consumed 123.9 J. With just two exceptions, the values of the breaking forces of the samples with five protrusions were below those recorded for the samples with three protrusions. This aspect is generated by the dissipation of the current streamlines at five different points, which determined the formation of points with a smaller area, which yielded more easily. The advantage in this case was the assumption of the stresses by the neighboring points, which determined a higher value of the total deformation at break.

3.4. Taguchi and ANOVA Optimization of Projection Welding Process Parameters for Maximizing Weld Mechanical Performance

3.4.1. Taguchi Method

The two output parameters taken into consideration for the Taguchi analysis are the maximum breaking force and the displacement at break, as the failure mode is always in the base material, for the two cases using three and five protrusions.
The signal-to-noise ratio (S/N ratio) was analyzed using Minitab 17 software, for the maximum breaking force, wherein a higher S/N ratio indicates a better weld quality characteristic (“larger is better”). The Taguchi method “larger is better” signal-to-noise (S/N) ratio is calculated using Equation (6):
S / N = 10 · log 1 n i = 0 n 1 y i 2
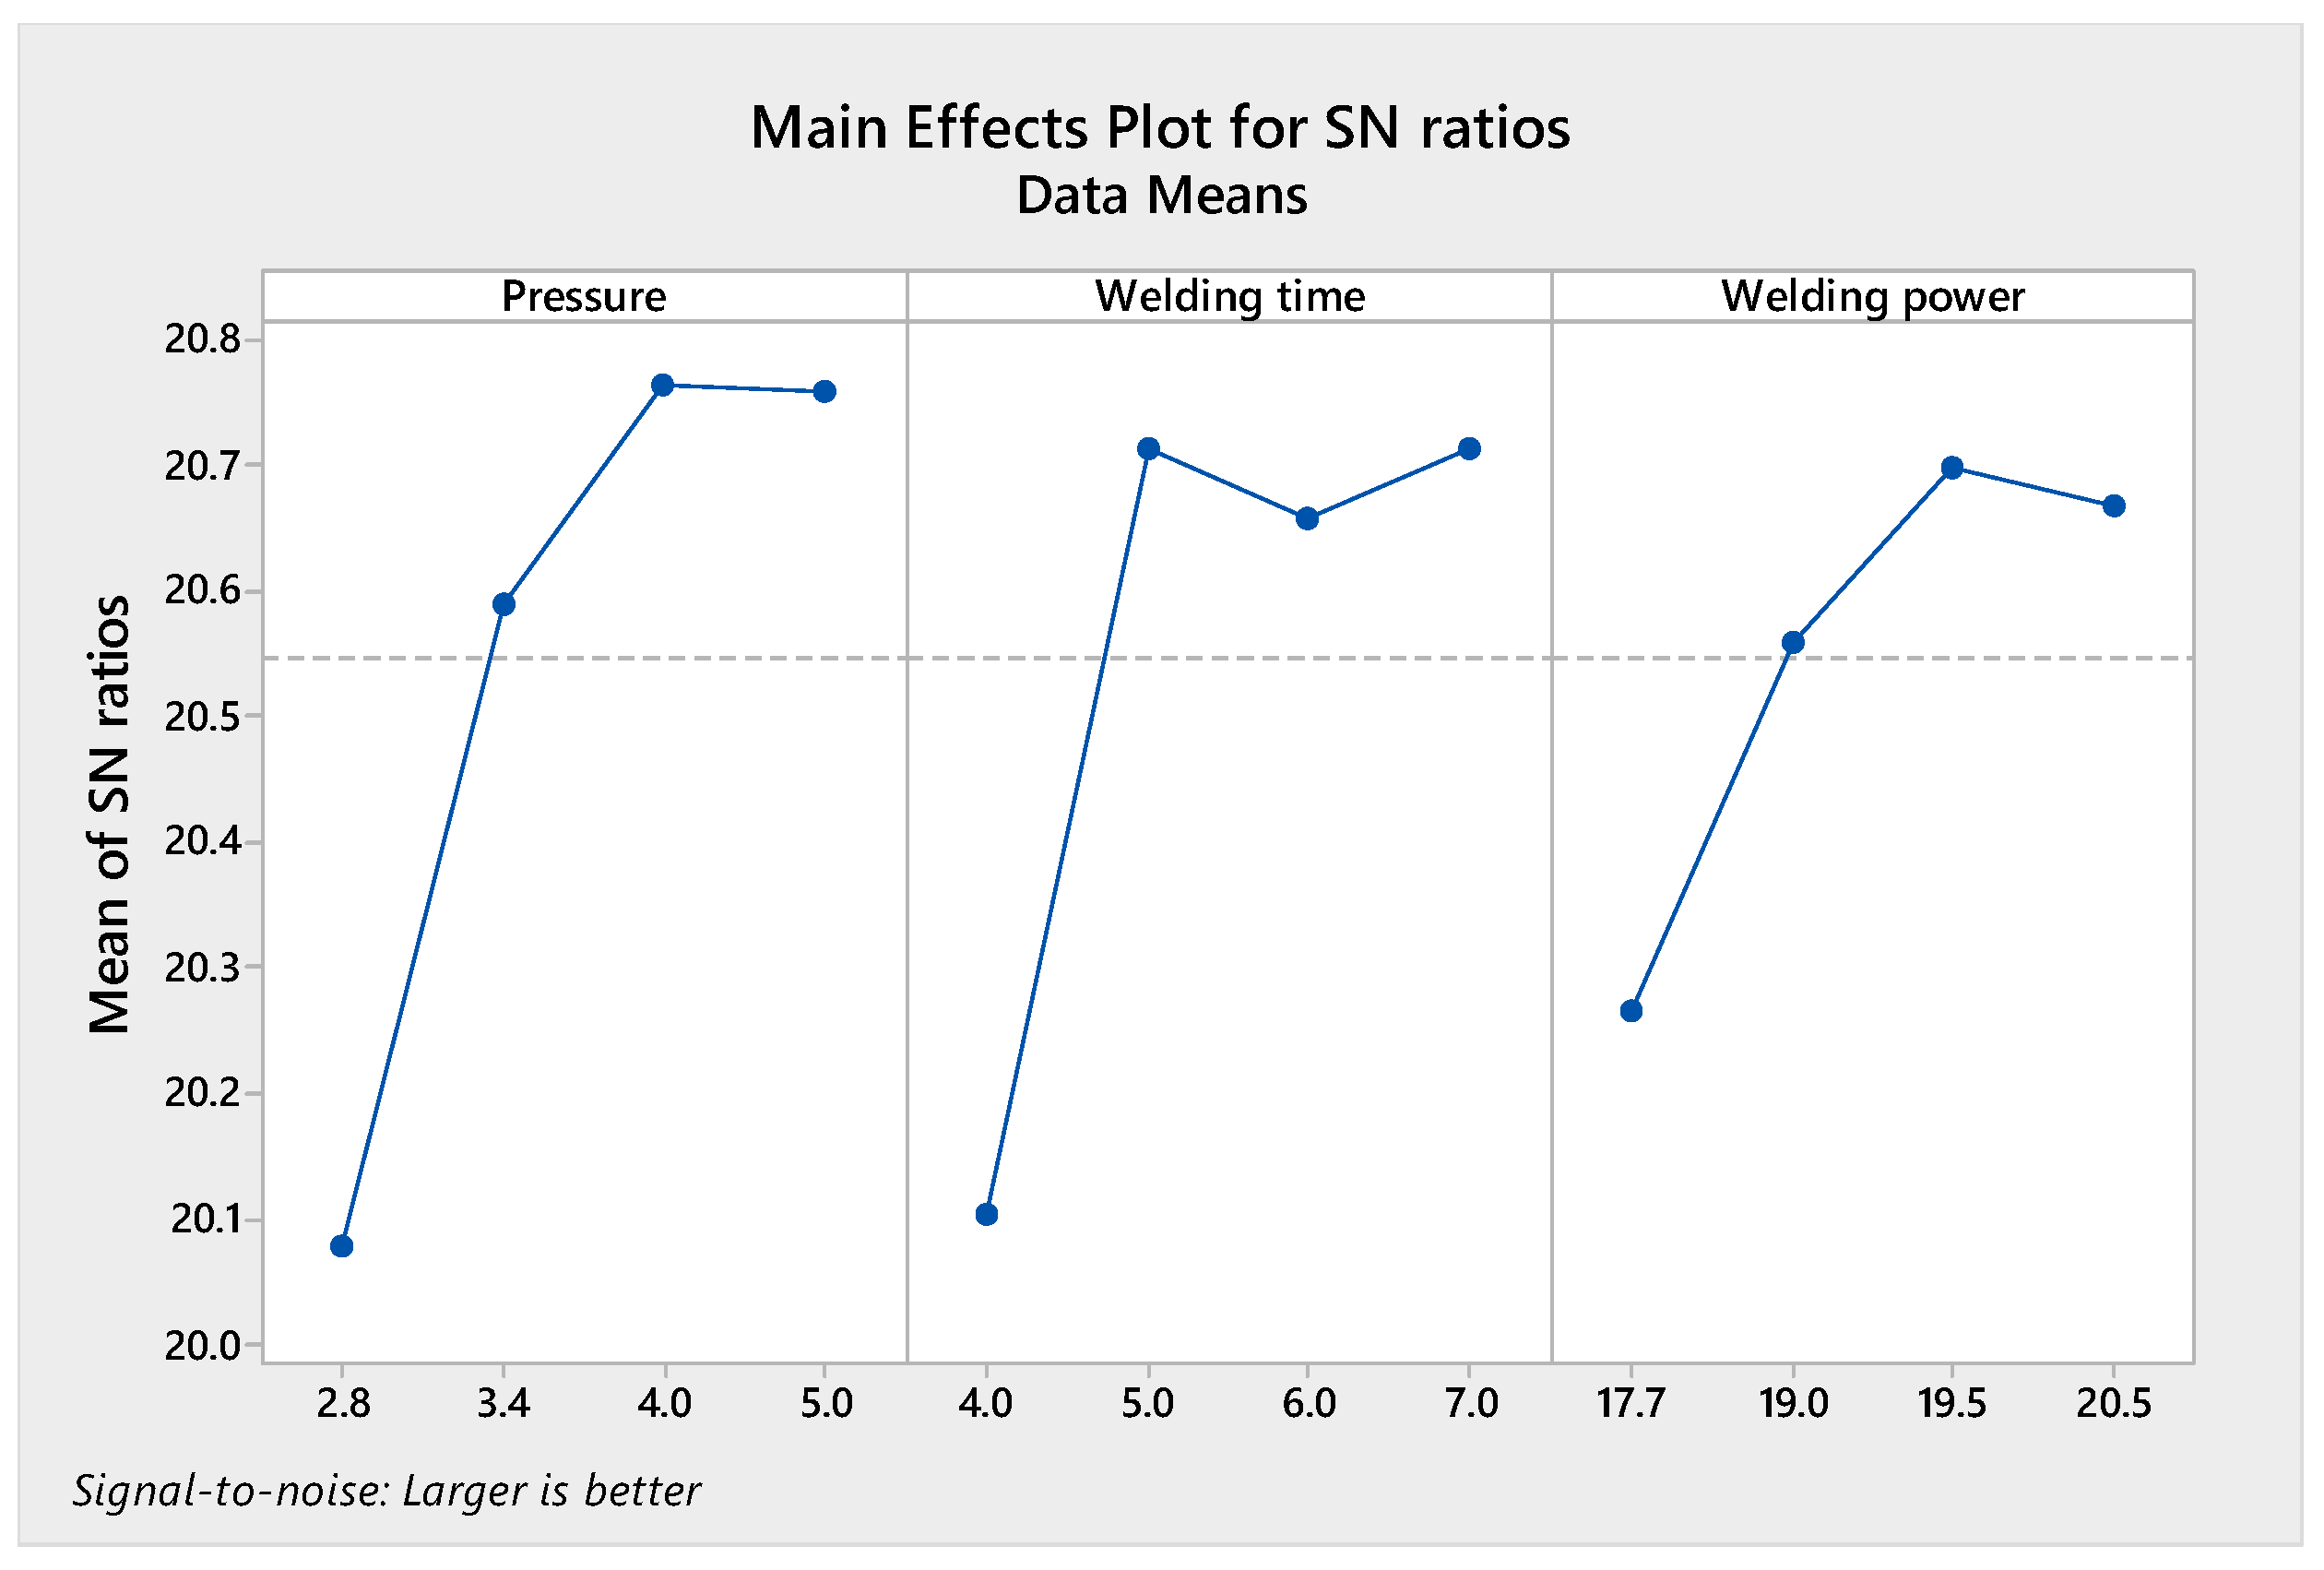
The main effect plots (Figure 13) show that the optimum condition for obtaining the maximum breaking force, for the case of three protrusions, is using pressure P = 4 bar, welding time t = 5 s, and welding power Wp = 19.5 kVA.
Analyzing the response table for the S/N ratios for the maximum breaking force using three protrusions, as presented in Table 7, the main influential parameter for the maximum breaking force is the applied pressure with a Delta of 0.69. This indicates that variations in pressure significantly affect the maximum breaking force. The Delta value indicates the difference between the highest and lowest S/N ratios for each projection welding process parameter, while a larger Delta indicates a greater influence on the response. Figure 14 shows that the optimum condition for obtaining the maximum breaking force, for the case of five protrusions, is using pressure P = 5 bar, welding time t = 7 s and the welding power Wp = 17.7 kVA.
As indicated by the response values for S/N ratios for the maximum breaking force using five protrusions (Table 8), the main influential parameters for the maximum breaking force are the applied pressure and the welding time, with a Delta of 0.59.
The signal-to-noise ratio (S/N ratio) was analyzed using Minitab 17 software, for the displacement at breaking, wherein a lower S/N ratio indicates a better weld quality characteristic (“smaller is better”). The Taguchi method “smaller is better” signal-to-noise (S/N) ratio is calculated using Equation (7):
S / N = 10 · log 1 n i = 0 n y i 2
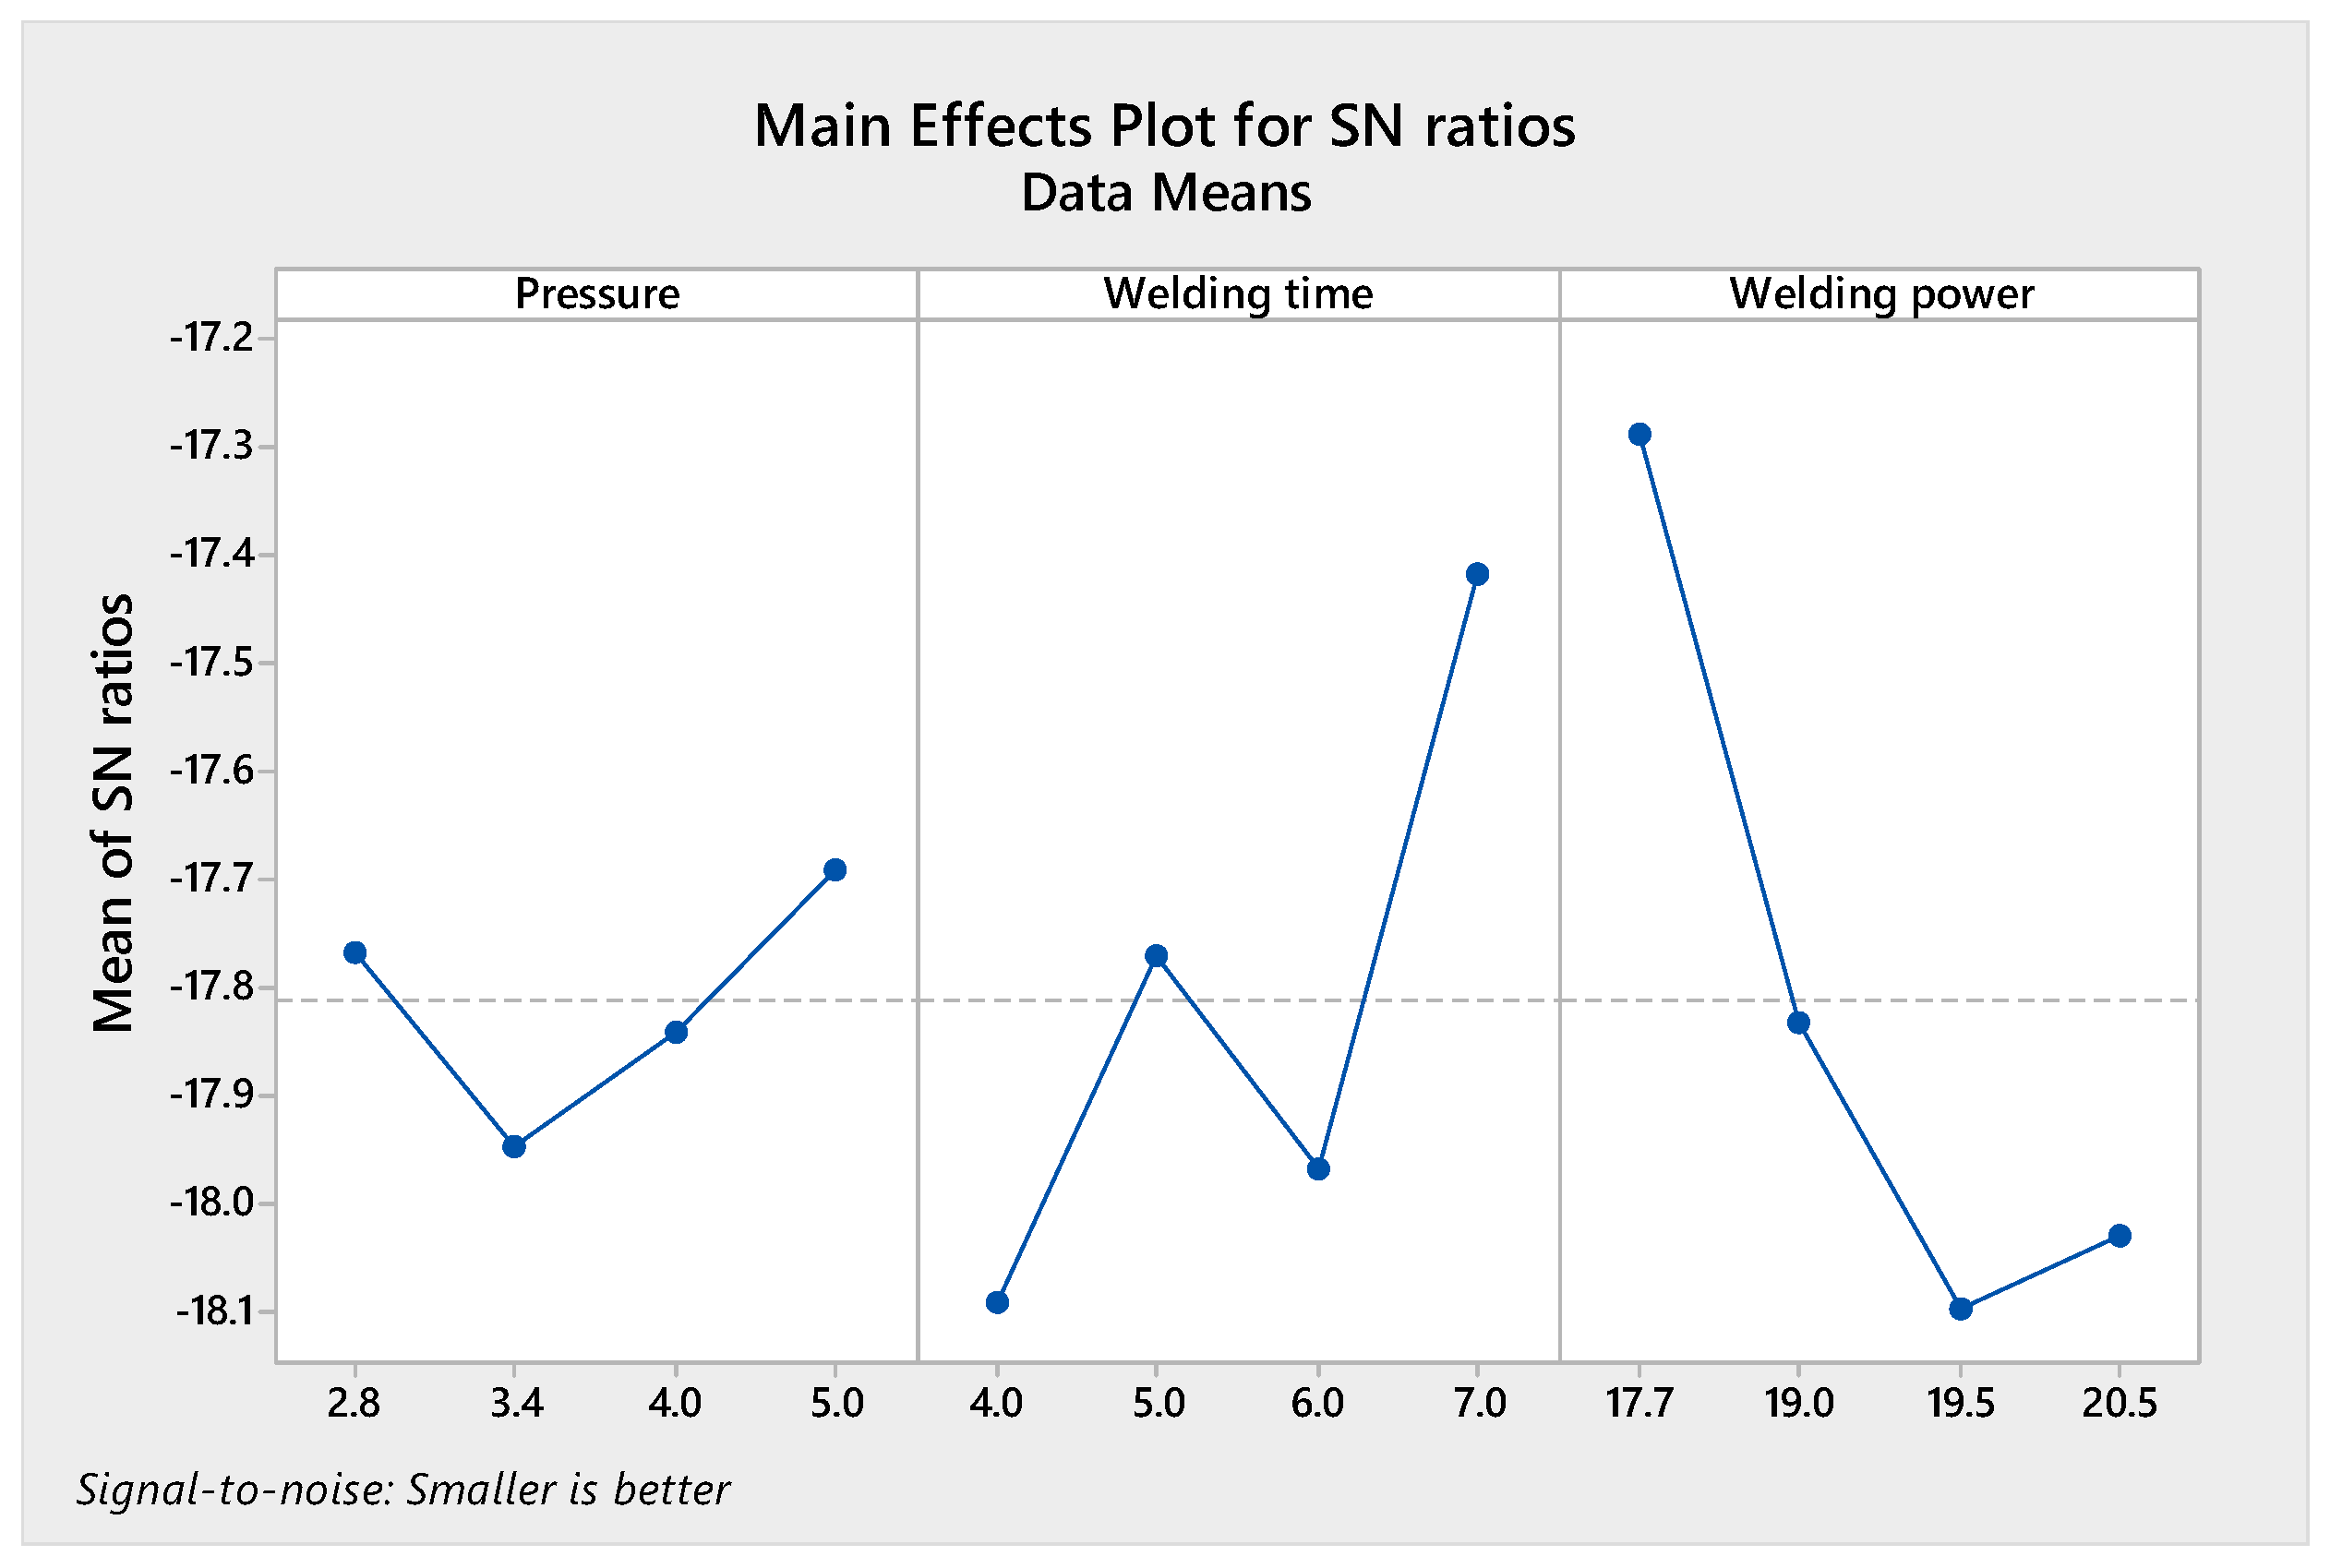
The main effect plots (Figure 15) show that the optimum condition for obtaining the minimum displacement at break for three protrusions is using pressure P = 4 bar, welding time t = 6 s and the welding power Wp = 19.0 kVA. The main effect plots (Figure 16) show that the optimum condition for obtaining the minimum displacement at break for five protrusions is using a pressure value of 5 bar, welding time of 7 s and the welding power of 17.7 kVA.
The Taguchi analysis conducted is critical for the validation of the optimized parameters, to confirm the reliability of the results. Microstructural analysis can be considered essential validation, by linking the results obtained in the Taguchi optimization connected to the metallurgical phenomena.

3.4.2. Analysis of Variance (ANOVA)

The ANOVA analysis of welding parameters can reveal important information about the statistical relevance and effects of each parameter on the resulting weld’s characteristics. In addition, it can determine the contribution of each welding process parameter’s impact on the overall variation in mechanical properties, helping to identify which parameters have the greatest impact. The statistical software MINITAB 17 was used to determine the ANOVA results for the maximum breaking force and for the displacement at breaking. In addition, a statistical test that compares variances, the F-test, was used to determine which welding factor had a significant effect on the performance of the weld. When the F-value is larger, the factor has a significant effect on the weld performance. The results of ANOVA for the single-response S/N ratio of the maximum breaking force and the displacement at breaking for the case of three protrusions are shown in Table 9 and for the case of five protrusions are shown in Table 10.
For three protrusions, the pressure has the highest contribution of about 31.46% for the maximum breaking force and with 61.29% contribution for the displacement at break. The other parameters have a smaller contribution. In conclusion, pressure is the most significant factor that impacts the maximum breaking force and for the displacement at break. In the case of five protrusions, the pressure has the highest contribution (27.42%) for maximum breaking force, being the most significant factor that impacts the weld’s mechanical characteristic. For displacement at break, the most significant factor is the welding power (28.89%).

4. Conclusions

The main conclusions drawn from the research carried out are the following:
The average breaking force was lower in the set of samples welded with five protrusions compared with the samples welded with three protrusions, but the total deformation at break was higher, which denotes a more pronounced plastic behavior of the base material when the stress is distributed over several welded points, a situation that can be beneficial especially in the case of cyclic stresses. As the value of the breaking force increases, the value of the displacement at break decreases.
The welded area microstructure analysis highlights that a good correlation between the values of current, time and welding pressure is compulsory. Thus, if the pressure is too low, the brittle compounds that form because of the reactions between the surface layer (Al-Si alloy) and iron are localized on the midline of the joint and substantially reduce the tensile strength. For the analyzed cases, increasing the pressure from 2.8 to 5 bar allowed for the reduction in the current values to obtain a good joint strength from 20.5 to 17.7 kVA. Increasing pressure allows the brittle compounds to be ejected into the periphery of the weld area, increasing their strength.
For equal values of power, time and pressing force, the energy supplied to the set of points in contact during welding is approximately 70.8 J, which determines the maximum value of the breaking force of 8.5851 N for the three-protrusion sample and of 9.1656 N for the five-protrusion sample. In this sense, the optimal variant is the five-protrusion sample, since the energy taken from the electrical supply system is minimal.
The comparative analysis of all results qualifies the first position for sample V/16 (Fb = 11.406 kN, Db = 6.1885 mm), welded using a pressing pressure of 5 bar, a welding time of 7 ms and a welding power of 17.7 kVA. The electrical energy taken power supply system in this case was 123.9 J. For the same values of the welding regime parameters, in the case of samples with three protrusions, the breaking force value of 10.901 kN was obtained, i.e., very close to the value recorded for the sample with five protrusions.
In projection welding, the optimal pair of values is selected based on the primary criterion for joint evaluation—namely the maximum value of the breaking force—together with the highest energy efficiency, expressed as the minimum energy consumption during welding. Based on maximum breaking force value, the best results were obtained for the welded sample V/16 (with five protrusions), followed by sample III/11 (with three protrusions). Of these, the most economical option is sample III/11, in which the welding power had the lowest value among those analyzed, and the welding time and electrode pressure had values of 6 ms and 4 bar, respectively.
The results obtained with the ANOVA method for the S/N ratio with a single response of the maximum breaking force and the minimum breaking displacement for the case of three protrusions indicate that pressure is the factor with the highest contribution (31.46%) for the maximum breaking force. This significantly influences the displacement at break, with a contribution of 61.29%. Since the other parameters have a smaller contribution, it can be stated that pressure is the most significant factor influencing the maximum breaking force and the displacement at break.
For the case of five protrusions, the pressure is the factor with the highest contribution (27.42%) for the maximum breaking force value, which significantly influences the mechanical characteristics of the weld. Conversely, for the displacement at break, the most significant factor is the welding power (28.89%).

Author Contributions

Conceptualization, A.V.O. and I.V.; methodology, G.C.; software, C.C.R.; validation, I.V. and G.C.; formal analysis, C.C.R.; investigation, A.V.O. and R.C.C.; resources, I.V. and G.C.; data curation, R.C.C. and C.C.R.; writing—original draft preparation, A.V.O. and C.C.R.; writing—review and editing, I.V.; visualization, G.C.; supervision, I.V.; project administration, I.V. All authors have read and agreed to the published version of the manuscript.

Funding

This research was funded by Romanian National Program for Research in the framework of the Project No. 24Sol(T24)/2024 (Digital fighter).

Informed Consent Statement

Not applicable.

Data Availability Statement

The original contributions presented in this study are included in the article. Further inquiries can be directed at the corresponding author.

Conflicts of Interest

The authors declare no conflicts of interest.

References

  1. Aslanlar, S.; Ogur, A.; Ozsarac, U.; Ilhan, E. Welding time effect on mechanical properties of automotive sheets in electrical resistance spot welding. Mater. Des. 2008, 29, 1427–1431. [Google Scholar] [CrossRef]
  2. Saha, D.C.; Park, Y.-D. A Review on Al-Al/Al-Steel Resistance Spot Welding Technologies for Light Weight Vehicles. J. Weld. Join. 2011, 29, 397–402. [Google Scholar]
  3. Zhang, W.H.; Qiu, X.M.; Sun, D.Q.; Han, L.J. Effects of resistance spot welding parameters on microstructures and mechanical properties of dissimilar material joints of galvanized high strength steel and aluminum alloy. Sci. Technol. Weld. Join. 2011, 16, 153–161. [Google Scholar] [CrossRef]
  4. Taufiqurrahman, I.; Ahmad, A.; Mustapha, M.; Lenggo Ginta, T.; Ady Farizan Haryoko, L.; Ahmed Shozib, I. The Effect of Welding Current and Electrode Force on the Heat Input, Weld Diameter, and Physical and Mechanical Properties of SS316L/Ti6Al4V Dissimilar Resistance Spot Welding with Aluminum Interlayer. Materials 2021, 14, 1129. [Google Scholar] [CrossRef]
  5. Chen, L.; Zhang, Y.; Xue, X.; Wang, B.; Yang, J.; Zhang, Z.; Tyrer, N.; Barber, G.C. Investigation on shearing strength of resistance spot-welded joints of dissimilar steel plates with varying welding current and time. J. Mat. Res. Technol. 2022, 16, 1021–1028. [Google Scholar]
  6. Pasau, K.; Salam, N.; Aminy, A.Y.; Hayat, A. Effect of Welding Time Variation in Resistance Spot Welding on Mechanical Properties of Dissimilar Joints on Mild Steel and AISI 304 Stainless Steel. J. Phys. Conf. Ser. 2024, 2739, 012044. [Google Scholar]
  7. Pouranvari, M.; Marashi, P. Critical review of automotive steels spot welding: Process, structure and properties. Sci. Technol. Weld. Join. 2013, 18, 361–403. [Google Scholar] [CrossRef]
  8. Summerville, C.; Compston, P.; Doolan, M. A comparison of resistance spot weld quality assessment techniques. Procedia Manuf. 2019, 29, 305–312. [Google Scholar] [CrossRef]
  9. Polyakov, A.Y.; Furmanov, S.M.; Bendik, T.I.; Kurlenkov, A.M. Development of an energy-saving method of resistance projection welding of multilayer welded structures. Weld. Intern. 2017, 31, 868–873. [Google Scholar]
  10. Paliakou, A.Y.; Kulikau, V.P.; Stsiapanau, A.A. Resistance Projection Welding of Sheet Metal Without Formation of a Mutual Melting Zone in The Form of a Cast Nugget. Adv. Eng. Res. 2019, 188, 264–270. [Google Scholar]
  11. Zhao, D.; Wang, Y.; Zhang, P.; Liang, D. Modeling and Experimental Research on Resistance Spot Welded Joints for Dual-Phase Steel. Materials 2019, 12, 1108. [Google Scholar] [CrossRef] [PubMed]
  12. Sun, X. Modeling of Projection Welding Processes Using Coupled Finite Element Analyses. Weld. Res. Supp. 2000, 79, 245-s–251-s. [Google Scholar]
  13. Voiculescu, I.; Geanta, V.; Vasile, I.M.; Stefănoiu, R.; Iacob, M. Research Regarding the Obtaining of the Electrode for Spot Welding. Metal. Int. 2013, 18, 52–55. [Google Scholar]
  14. Huang, H.-Y.; Tseng, K.-H. Process Parameters in Resistance Projection Welding for Optical Transmission Device Package. J. Mat. Eng. Perform. 2011, 20, 244–249. [Google Scholar] [CrossRef]
  15. Han, G.Y.; Ha, S.; Marimuthu, K.P.; Murugan, S.P.; Park, Y.; Lee, H. Shape optimization of square weld nut in projection welding. Int. J. Adv. Manuf. Tech. 2021, 113, 1–14. [Google Scholar] [CrossRef]
  16. Kumar, N.; Minda Ramakrishnan, S.; Panchapakesan, K.; Subramaniam, D.; Dowson, M.; Das, A. Utilizing a novel multi-electrode approach for improving micro-resistance spot welding productivity for electric-mobility battery interconnects. Sci. Technol. Weld. Join. 2023, 28, 643–652. [Google Scholar]
  17. Kuntz, M. Modeling projection welding of fasteners to advanced high-strength steel (AHSS) sheet using finite element method. In Proceedings of the Sheet Metal Welding Conference XII, Livonia, MI, USA, 10–12 May 2006; Conference Proceedings. AWS Detroit Section: Detroit, MI, USA, 2006. [Google Scholar]
  18. Mikno, Z. Projection Welding with Pneumatic and Servomechanical Electrode Operating Force Systems. Weld. Res. 2016, 95, 286–299. [Google Scholar]
  19. Bohr, J.C.; Brafford, W.H.; Daumeyer, G.J., III; Kelly, B.G.; Kelly, D.P.; Kimchi, M.; Zhang, H. Chapter 2, Projection welding. In AWS Welding Handbook, 9th ed.; AWS (American Welding Society): Doral, NW, USA, 2007; Volume 3, Part 2, pp. 55–65. [Google Scholar]
  20. Raut, M.; Achwal, V. Optimization of Spot-Welding Process Parameters for Maximum Tensile Strength. Int. J. Mech. Eng. Rob. Res. 2014, 3, 506–517. [Google Scholar]
  21. Aslanlar, S. The effect of nucleus size on mechanical properties in electrical resistance spot welding of sheets used in automotive industry. Mater. Des. 2006, 27, 125–131. [Google Scholar] [CrossRef]
  22. Mikno, Z.; Kowieski, S.; Pilarczyk, A. Projection Welding of Nuts with Full Projections with Use of Electromechanical Operating Force System. Biul. Inst. Spaw. 2019, 63, 7–15. [Google Scholar] [CrossRef]
  23. Oprea, A.V.; Vasile, I.M.; Voiculescu, I.; Ciocoiu, R.C. The Multipoint Relief Projection Study. PriMera Sci. Eng. 2023, 3, 33–39. [Google Scholar] [CrossRef]
  24. Choi, I.; Kim, Y.D.; Park, Y.-D. Study on coating melting behavior on weld growth mechanism for Al-Si coated hot-stamped boron steels in resistance spot welding. Korean J. Met. Mater. 2014, 52, 931–941. [Google Scholar]
  25. Mathiszik, C.; Johannes Koal, J.; Zschetzsche, J.; Füssel, U.; Schmale, H.C. Study on precise weld diameter validations by comparing destructive testing methods in resistance spot welding. Weld. World 2024, 68, 1825–1835. [Google Scholar] [CrossRef]
  26. Hamedi, M.; Atashparva, M. A review of electrical contact resistance modelling in resistance spot welding. Weld. World 2017, 61, 269–290. [Google Scholar] [CrossRef]
  27. Mikno, Z. Analysis of projection welding in relation to the non-parallelism of electrodes. Int. J. Adv. Manuf. Technol. 2024, 135, 2087–2095. [Google Scholar] [CrossRef]
  28. Pouranvari, M.; Abedi, A.; Marashi, P.; Goodarzi, M. Effect of expulsion on peak load and energy absorption of low carbon steel resistance spot welds. Sci. Technol. Weld. Join. 2008, 13, 39–43. [Google Scholar] [CrossRef]
  29. Kim, J.; Jun, H.; Cheon, J.; Kim, Y.; Ji, C. Effect of the melting behaviour of the coating layer on weldability in the bolt projection resistance welding of Al-Si coated hot-stamped boron steel. J. Weld. Join 2020, 38, 33–40. [Google Scholar] [CrossRef]
  30. Bangukira, I.M. Aluminizing of Plain Carbon Steel—Effect of Temperature on Coating and Alloy Phase Morphology at Constant Holding Time. Master’s Thesis, Norwegian University of Science and Technology, Trondheim, Norway, 2012. [Google Scholar]
  31. Voiculescu, I.; Oprea, A.V.; Vasile, I.M. Case Study About Resistance Projection Welding of Aluminized Steel Parts. Ann. “Dunarea De Jos” Univ. Galati. Fasc XII Weld. Equip. Technol. 2021, 32, 23–29. [Google Scholar]
  32. Ji, C.-W.; Jo, I.; Lee, H.; Choi, I.-D.; Do Kim, Y.; Park, Y.-D. Effects of surface coating on weld growth of resistance spot-welded hot-stamped boron steels. J. Mech. Sci. Technol. 2014, 28, 4761–4769. [Google Scholar] [CrossRef]
  33. Saha, D.; Ji, C.; Park, Y. Coating behavior and nugget formation during resistance welding of hot forming steels. Sci. Technol. Weld. Join. 2015, 20, 708–720. [Google Scholar] [CrossRef]
  34. DIN 50049:1992-04; Metallic Products; Types of Inspection Documents; Products; German Version of EN 10204:1991. German Institute for Standardization: Berlin, Germany, 1992.
  35. EN ISO 6892-1; Metallic Materials—Tensile Testing. Part 1: Method of Test At Room Temperature. CEN: Brussels, Belgium, 2009.
  36. EN 1993-1-3; Eurocode 3: Design of Steel Structures. Part 1–3: General Rules. Supplementary Rules for Cold-Formed Thin Gauge Members and Sheeting. CEN: Brussels, Belgium, 2006.
  37. Karna, S.K.; Sahai, R. An Overview on Taguchi Method. Int. J. Eng. Math. Sci. 2012, 1, 1–7. [Google Scholar]
  38. Sherepenko, O.; Kazemi, O.; Rosemann, P.; Wilke, M.; Halle, T.; Jüttner, S. Transient Softening at the Fusion Boundary of Resistance Spot Welds: A Phase Field Simulation and Experimental Investigations for Al-Si-coated 22MnB5. Metals 2019, 10, 10. [Google Scholar] [CrossRef]
  39. Gajbhiye, A.M.; Sonawane, P.R.; Karle, A.H.; Campli, S. Optimization of welding parameters for En8D and SAE1018 materials by Taguchi. Int. J. Interact. Des. Manuf. 2024, 18, 7511–7520. [Google Scholar] [CrossRef]
  40. Nakowong, K.; Sillapasa, K. Optimized Parameter for Butt Joint in Friction Stir Welding of Semi-Solid Aluminum Alloy 5083 Using Taguchi Technique. J. Manuf. Mater. Process. 2021, 5, 88. [Google Scholar] [CrossRef]
  41. Nobrega, G.; Souza, M.S.; Rodríguez-Martín, M.; Rodríguez-Gonzálvez, P.; Ribeiro, J. Parametric Optimization of the GMAW Welding Process in Thin Thickness of Austenitic Stainless Steel by Taguchi Method. Appl. Sci. 2021, 11, 8742. [Google Scholar] [CrossRef]
  42. Rojas, H.; Vargas, Z.; Valdez, S.; Serrano, M.; del Pozo, A.; Alcántara, M. Taguchi, Grey Relational Analysis, and ANOVA Optimization of TIG Welding Parameters to Maximize Mechanical Performance of Al-6061 T6 Alloy. J. Manuf. Mater. Process. 2024, 8, 246. [Google Scholar] [CrossRef]
  43. Costa, H.R.M.; Dias, J.S.; Aguiar, R.A.A.; Lima, R.A.A.; Lopes, D.M.M. The effect of process parameters on the lifetime of copper electrodes used in spot welding of interstitial free steel sheets. Ann. “Dunarea De Jos” Univ. Galati. Fasc XII Weld. Equip. Technol. 2016, 27, 55–61. [Google Scholar]
  44. Khan, M.I.; Kuntz, M.L.; Biro, E.; Zhou, Y. Microstructure and mechanical properties of resistance spot welded advanced high strength steels. Mater. Trans. 2008, 49, 1629–1637. [Google Scholar] [CrossRef]
  45. AWS D1.1/D1.1M:2002; American Welding Society (AWS) Committee on Structural Welding. Structural Welding Code—Steel. American Welding Society: Miami, FL, USA, 2002.
  46. Welding, Brazing and Soldering; Olson, D.L., Siewert, T.A., Liu, S., Edwards, G.R., Eds.; ASM International: Almere, The Netherlands, 1993; Volume 6. [Google Scholar]
  47. Sina, H.; Corneliusson, J.; Turba, K.K.; Iyengar, S. A study on the formation of iron aluminide (FeAl) from elemental powders. J. Alloys Compd. 2015, 636, 261–269. [Google Scholar]
  48. Wang, X.; Wood, J.V.; Sui, Y.; Lu, H. Formation of intermetallic compound in iron aluminum alloys. J. Shanghai Univ. Engl. Ed. 1998, 2, 305–310. [Google Scholar] [CrossRef]
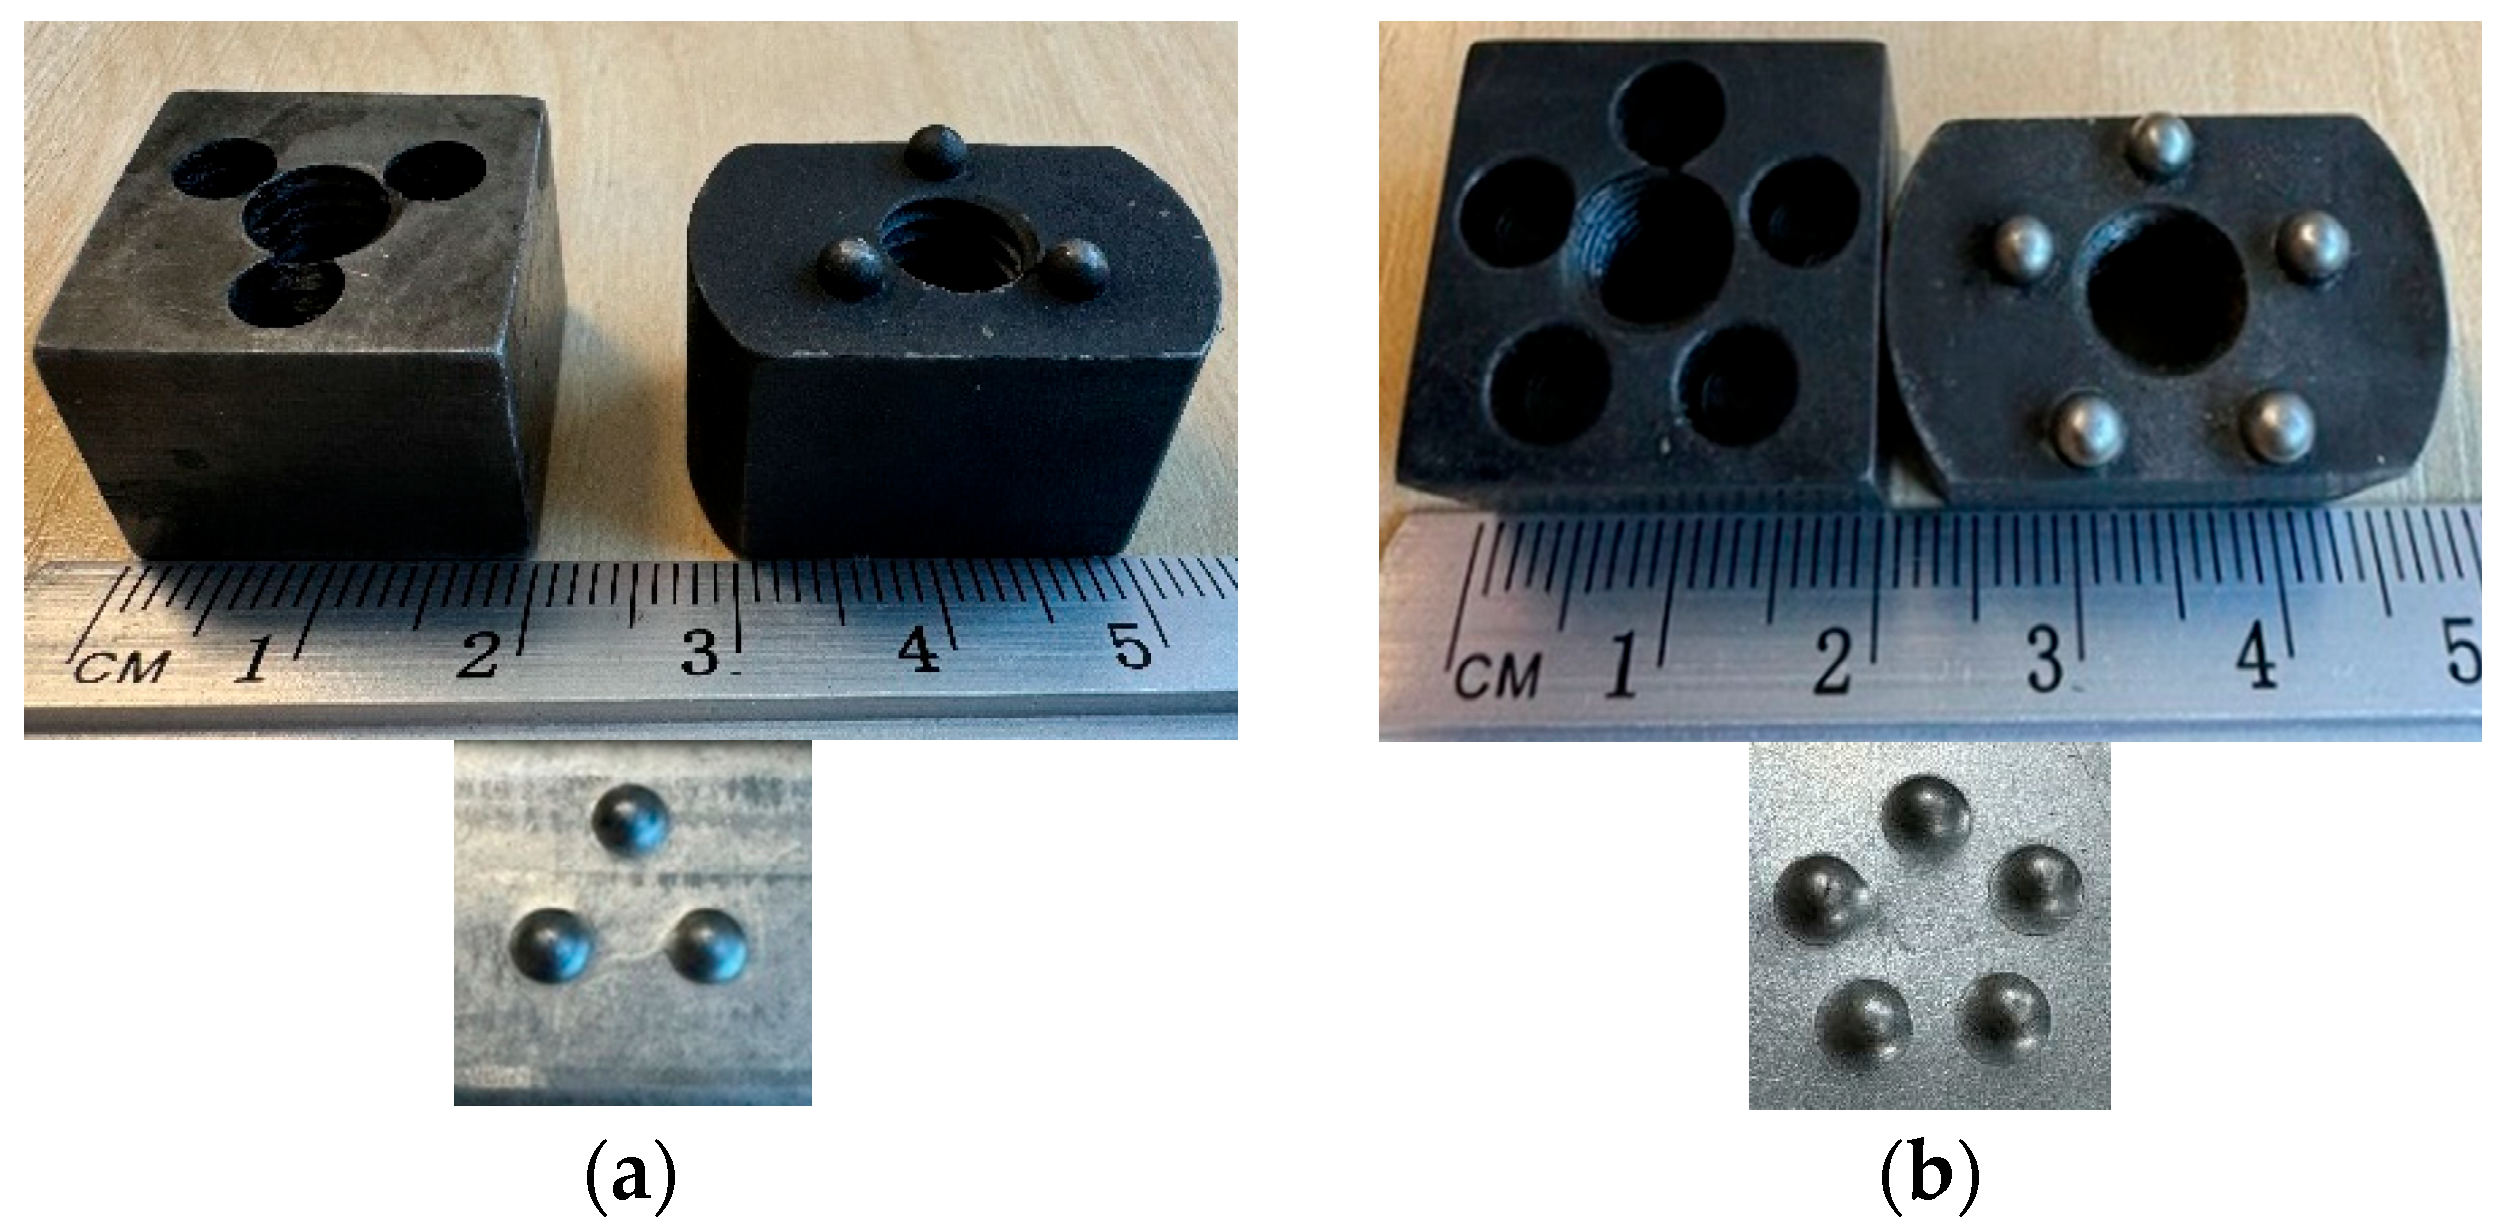
Figure 1. The molds/punches and samples with 3 (a) and 5 protrusions (b).
Applsci 15 10530 g001
Figure 2. The device that was designed for holding samples during welding: (a) 3 protrusions; (b) 5 protrusions.
Applsci 15 10530 g002
Figure 3. Schematic of sample assembly for projection welding.
Applsci 15 10530 g003
Figure 4. Aspect of aluminized sample’s surface: (a) optical; (b) SEM image.
Applsci 15 10530 g004
Figure 5. Aspect of cross section through the aluminized layer interface with steel substrate: (a) dendritic microstructure of aluminized layer (Al-Si); (b) EDS spot location at different distances from the interface (IF) with the substrate (Spot 1 and Spot 2 on the Al-Si layer, Spot 3 on the interface with the steel substrate); (c) chemical elements quantitative EDS analyze.
Applsci 15 10530 g005
Figure 6. Element profile plot through the interface between the coating layer and steel substrate for sample III/2: (a) distribution of chemical elements through the covering layer (Al-Si) and steel substrate; (b) individual distribution of main elements (Al, Si, Mn, Fe, Co) along the crossing line through the interface.
Applsci 15 10530 g006
Figure 7. The breaking mode: (a) sample III/16; (b) sample V/2.
Applsci 15 10530 g007
Figure 8. The stress–strain diagrams for multi-point weld samples: (a) 3 protrusions; (b) 5 protrusions.
Applsci 15 10530 g008
Figure 9. Aspect of Al-Si layer coating layer in cross section: (a) cracks developed during welding in III/2 sample; (b) aluminized layer cracks-free (sample III/16).
Applsci 15 10530 g009
Figure 10. Cross-section aspects of some projection welds ((a,b) optical and (c,d) SEM): (a) sample III/2; (b) sample III/16; (c) sample V/2; (d) sample V/16.
Applsci 15 10530 g010
Figure 11. Compound accumulation in the weld interface (sample V/2): (a) compounds accumulated on the weld line; (b) chemical element spectrum for EDS Spot 1, located on the accumulated compounds.
Applsci 15 10530 g011
Figure 12. Quantitative results for EDS chemical analysis performed on accumulated compounds.
Applsci 15 10530 g012
Figure 13. Main effects plot for S/N ratios for the maximum breaking force using 3 protrusions.
Applsci 15 10530 g013
Figure 14. Main effects plot for S/N ratios for the maximum breaking force using 5 protrusions.
Applsci 15 10530 g014
Figure 15. Main effects plot for S/N ratios for the minimum displacement at break using 3 protrusions.
Applsci 15 10530 g015
Figure 16. Main effects plot for S/N ratios for the minimum displacement at break using 5 protrusions.
Applsci 15 10530 g016
Table 1. Protrusions’ shape and size * [mm].
ProtrusionsT1T2GDHRE
31.20.81.124.141.521.33.22
51.20.8 1.835.661.732.44.13
* Deviation limit ± 0.01 mm.
Table 2. Influencing factors in the electric resistance projection welding.
ParameterSymbol
(Units)
Levels
1234
Welding powerWp (kVA)17.71919.520.5
Welding timet (ms)4567
Electrode pressureP (bar)2.83.445
Table 3. Taguchi-based design of experiments (DoE) for the projection welding.
Test No.Welding Power
Wp (kVA)
Welding Time
t (ms)
Electrode Pressure
P (Bar)
1 (17.7)1 (4)1 (2.8)
2 (19)2 (5)2 (3.4)
3 (19.5)3 (6)3 (4)
4 (20.5)4 (7)4 (5)
1111
2122
3133
4144
5212
6221
7234
8243
9313
10324
11331
12342
13414
14423
15432
16441
Table 4. Detailed DoE plan for projection welding using 3 protrusions.
Test No. Welding ParametersResponse Parameters
Pressure P
(Bar)
Welding Time t
(ms)
Welding Power Wp
(kVA)
Maximum Breaking Force Fb
(kN)
Displacement at Break Db
(mm)
Failure Mode
12.8417.78.58511.5323Base material
22.8519.010.7232.9071Base material
32.8619.510.5352.7287Base material
42.8720.510.6802.4025Base material
53.4419.010.2022.8863Base material
63.4517.710.9413.0220Base material
73.4620.510.7722.9455Base material
83.4719.510.9043.0986Base material
94419.510.9243.3854Base material
104520.510.7823.2990Base material
114617.711.0333.1994Base material
124719.010.9443.0800Base material
135420.510.9643.1621Base material
145519.510.9843.3373Base material
155619.010.8053.1982Base material
165717.710.9013.2650Base material
Table 5. Detailed DoE plan for projection welding using 5 protrusions.
Test No. Welding ParametersResponse Parameters
Pressure P
(Bar)
Welding Time
t
(ms)
Welding Power, Wp
(kVA)
Maximum Breaking Force
Fb
(kN)
Displacement
at Break
Db
(mm)
Failure Mode
12.8417.79.16567.9475Base material
22.8519.08.88547.2448Base material
32.8619.59.1567.7450Base material
42.8720.59.23858.0252Base material
53.4419.09.18578.1314Base material
63.4517.79.10327.4998Base material
73.4620.59.01747.9234Base material
83.4719.59.18578.0537Base material
94419.59.09337.9519Base material
104520.59.16927.8556Base material
114617.78.9917.7833Base material
124719.09.23197.6202Base material
135420.59.33758.0887Base material
145519.59.27158.3984Base material
155619.09.1568.2200Base material
165717.711.4066.1885Base material
Table 6. Calculated energy values are consumed during multi-point projection welding.
No.Welding ParametersBreaking Force, kN
Pressure P
(Bar)
Time
T
(ms)
Power P
(kVA)
Thermal Energy
Q
(J)
3 Protrusions5 Protrusions
12.8417.770.8 min8.5851 min9.1656
22.85199510.7238.8854 min
32.8619.511710.5359.156
42.8720.5143.5 max10.6809.2385
53.44197610.2029.1857
63.4517.788.510.9419.1032
73.4620.512310.7729.0174
83.4719.5136.510.9049.1857
94419.57810.9249.0933
104520.5102.510.7829.1692
114617.7106.211.033 max8.991
12471913310.9449.2319
135420.58210.9649.3375
145519.597.510.9849.2715
15561911410.8059.156
165717.7123.910.90111.406 max
Table 7. Response table for S/N ratios for maximum breaking force using 3 protrusions.
LevelPressure
(Bar)
Welding Time
(s)
Welding Power
(kVA)
120.0820.1020.26
220.5920.7120.56
320.7620.6620.70
420.7620.7120.67
Delta0.690.610.43
Rank123
Table 8. Response table for S/N ratios for maximum breaking force using 5 protrusions.
LevelPressure
(Bar)
Welding Time
(s)
Welding Power
(kVA)
119.1919.2719.66
219.2019.1919.19
319.2019.1619.25
419.7819.7619.27
Delta0.590.590.47
Rank213
Table 9. Analysis of variance for the maximum breaking force and for the displacement at breaking for 3 protrusions.
SourceDoFAdj SSAdj MSF-Valuep-ValueContribution,
(%)
Maximum breaking force (MBF)Pressure31.65650.55221.930.22731.46
Welding time31.33970.44661.560.29425.44
Welding power30.55020.18320.640.61710.45
Error61.71960.2866----
Total155.2660------
Displacement at break (DB)Pressure31.92100.64036.740.02461.29
Welding time30.33540.11181.180.39410.70
Welding power30.30780.10261.080.4269.82
Error60.57000.0950----
Total153.1342------
Table 10. Analysis of variance for the maximum breaking force and for the displacement at breaking for 5 protrusions.
SourceDoFAdj SSAdj MSF-Valuep-ValueContribution
(%)
Maximum breaking force (MBF)Pressure31.36390.45461.730.26127.42
Welding time31.24980.41661.580.28925.12
Welding power30.78050.26020.990.45915.69
Error61.58060.2634----
Total154.9747------
Displacement at break (DB)Pressure30.078030.026010.080.9701.98
Welding time30.706790.235600.700.58517.96
Welding power31.137210.379071.130.40928.89
Error62.013840.33564----
Total153.93588------
Disclaimer/Publisher’s Note: The statements, opinions and data contained in all publications are solely those of the individual author(s) and contributor(s) and not of MDPI and/or the editor(s). MDPI and/or the editor(s) disclaim responsibility for any injury to people or property resulting from any ideas, methods, instructions or products referred to in the content.