
Research and Application of Foam Filling Material in Soft Rock Roadways

Abstract
1. Introduction
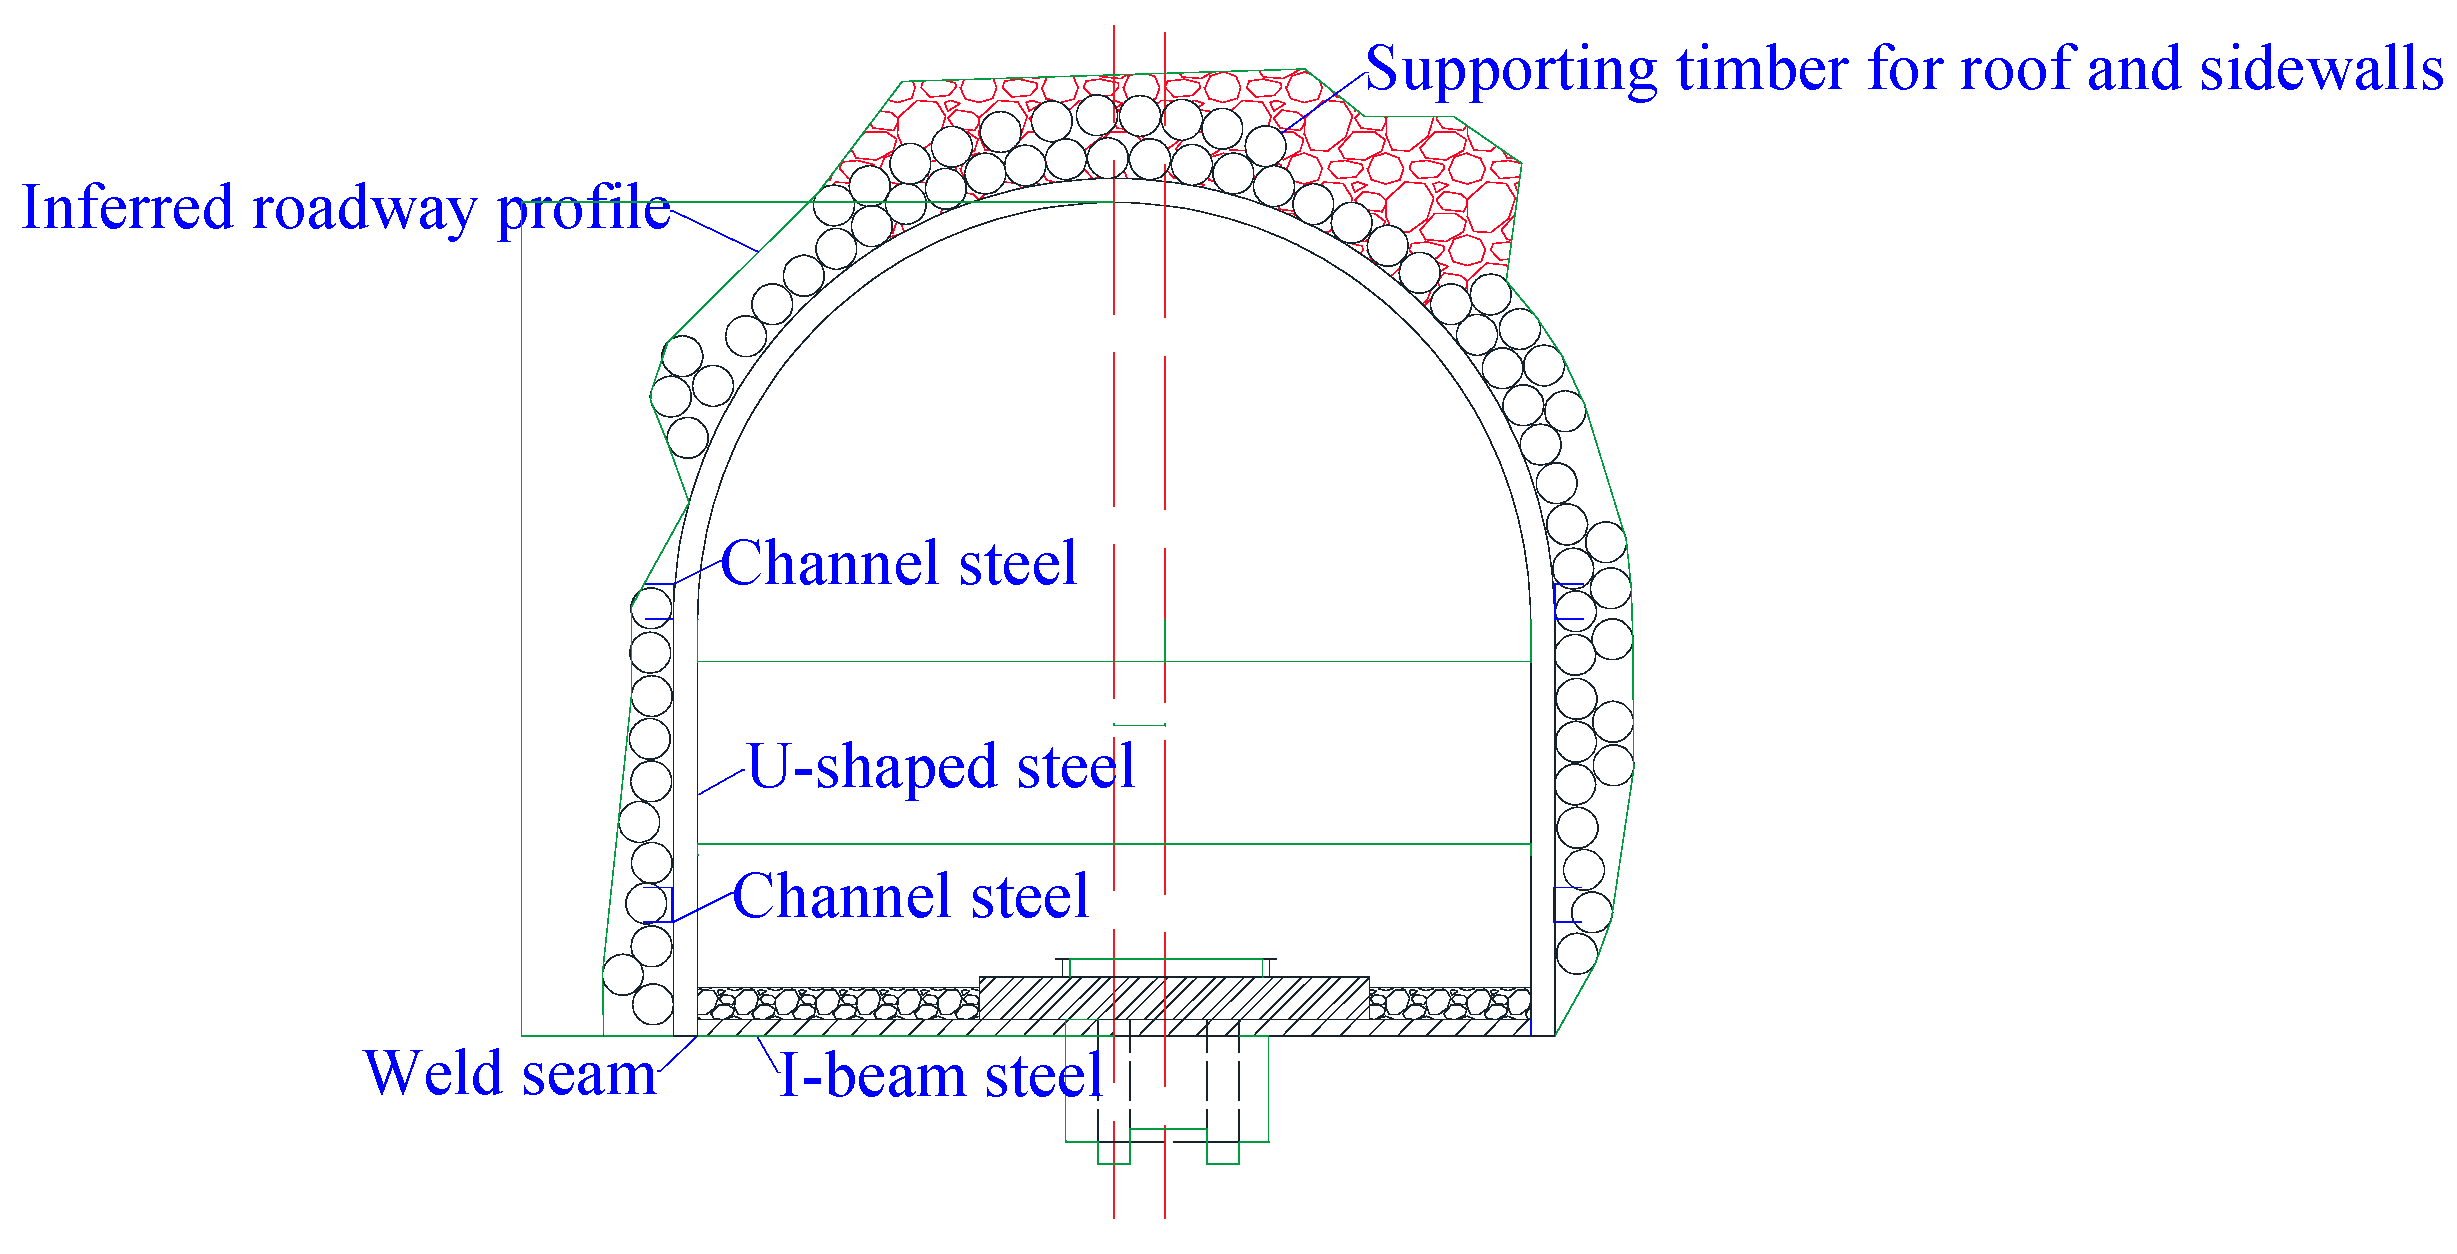
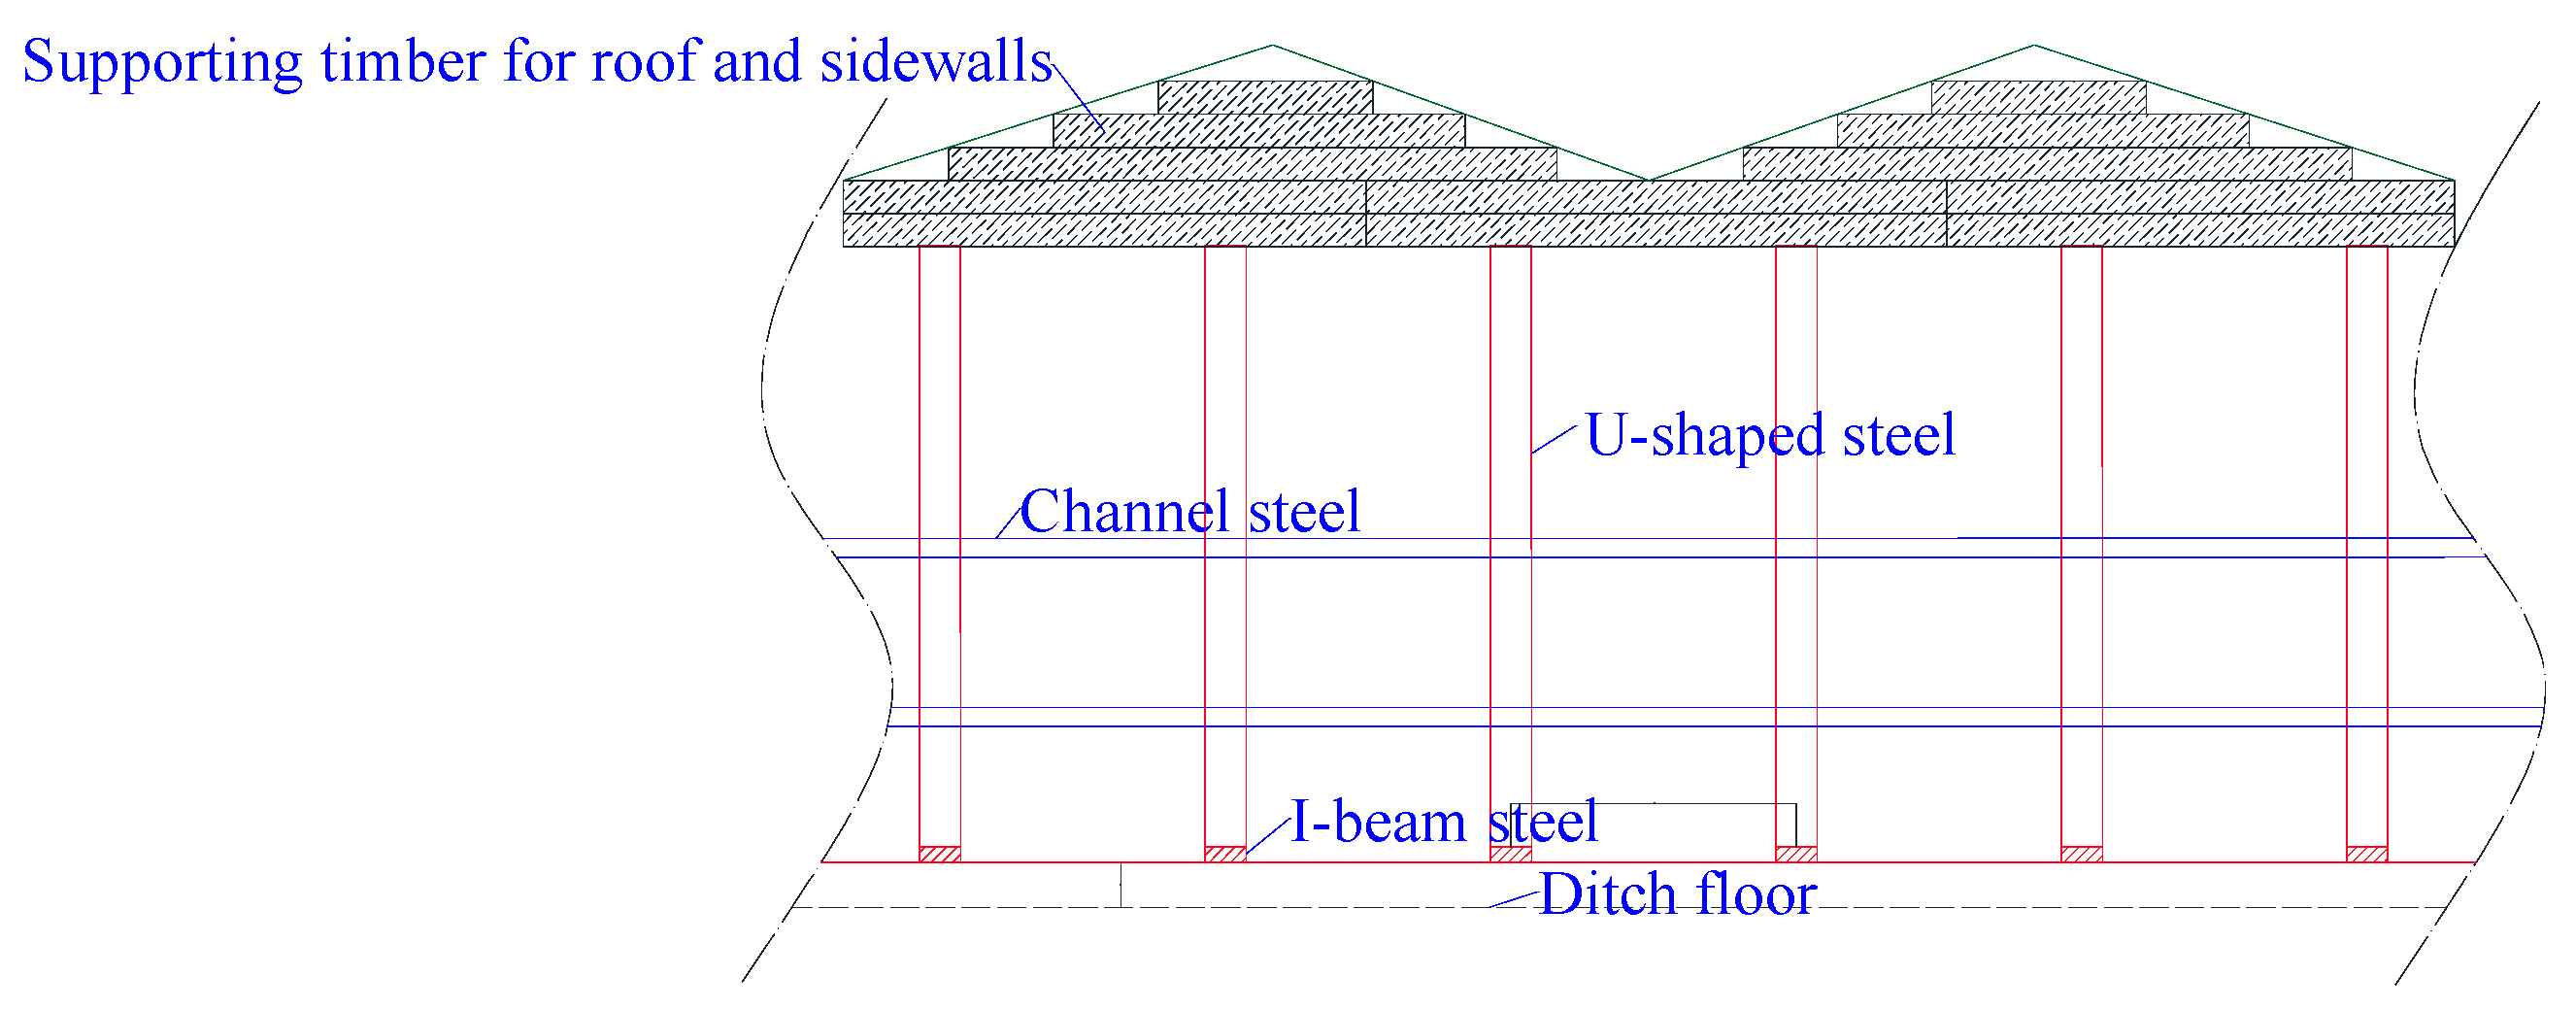
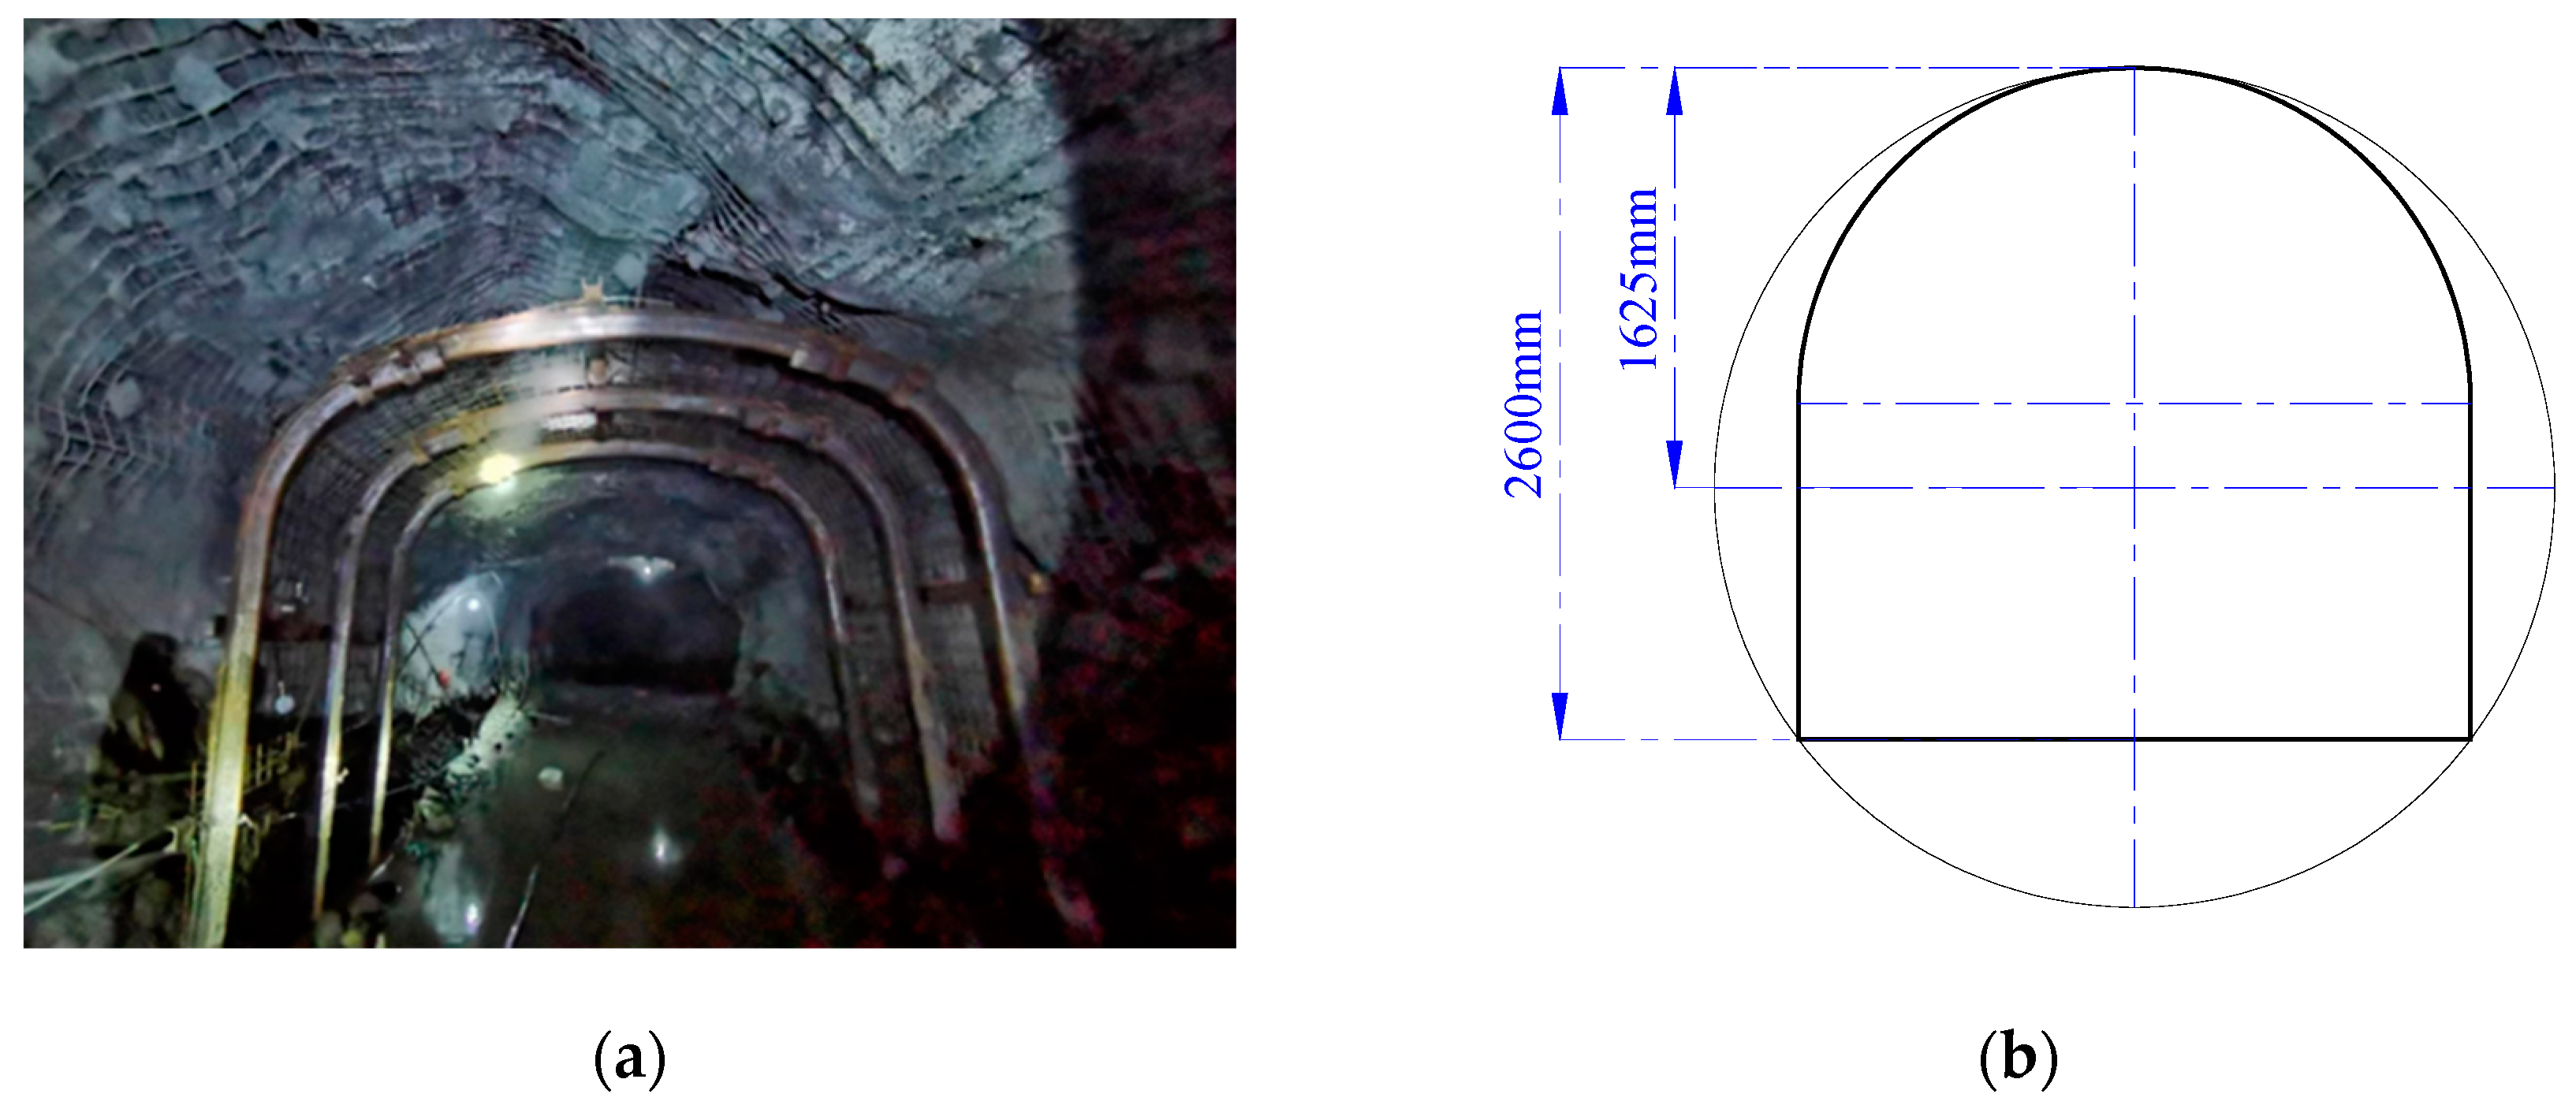
2. Project Overview
3. Analysis of Roof Falls Mechanism in Soft Rock Roadways
3.1. Basic Species of Plastic Zone of Roadway-Surrounding Rock
- Circular plastic zone: under the condition of bidirectional isobaric stress, the boundary of the plastic zone appears circular.
- Oval plastic zone: The oval plastic zone under non-isobaric conditions is illustrated in Figure 5. In this case, the maximum radius of the plastic zone boundary is on the vertical axis, while the minimum radius is on the horizontal axis.
- 3.
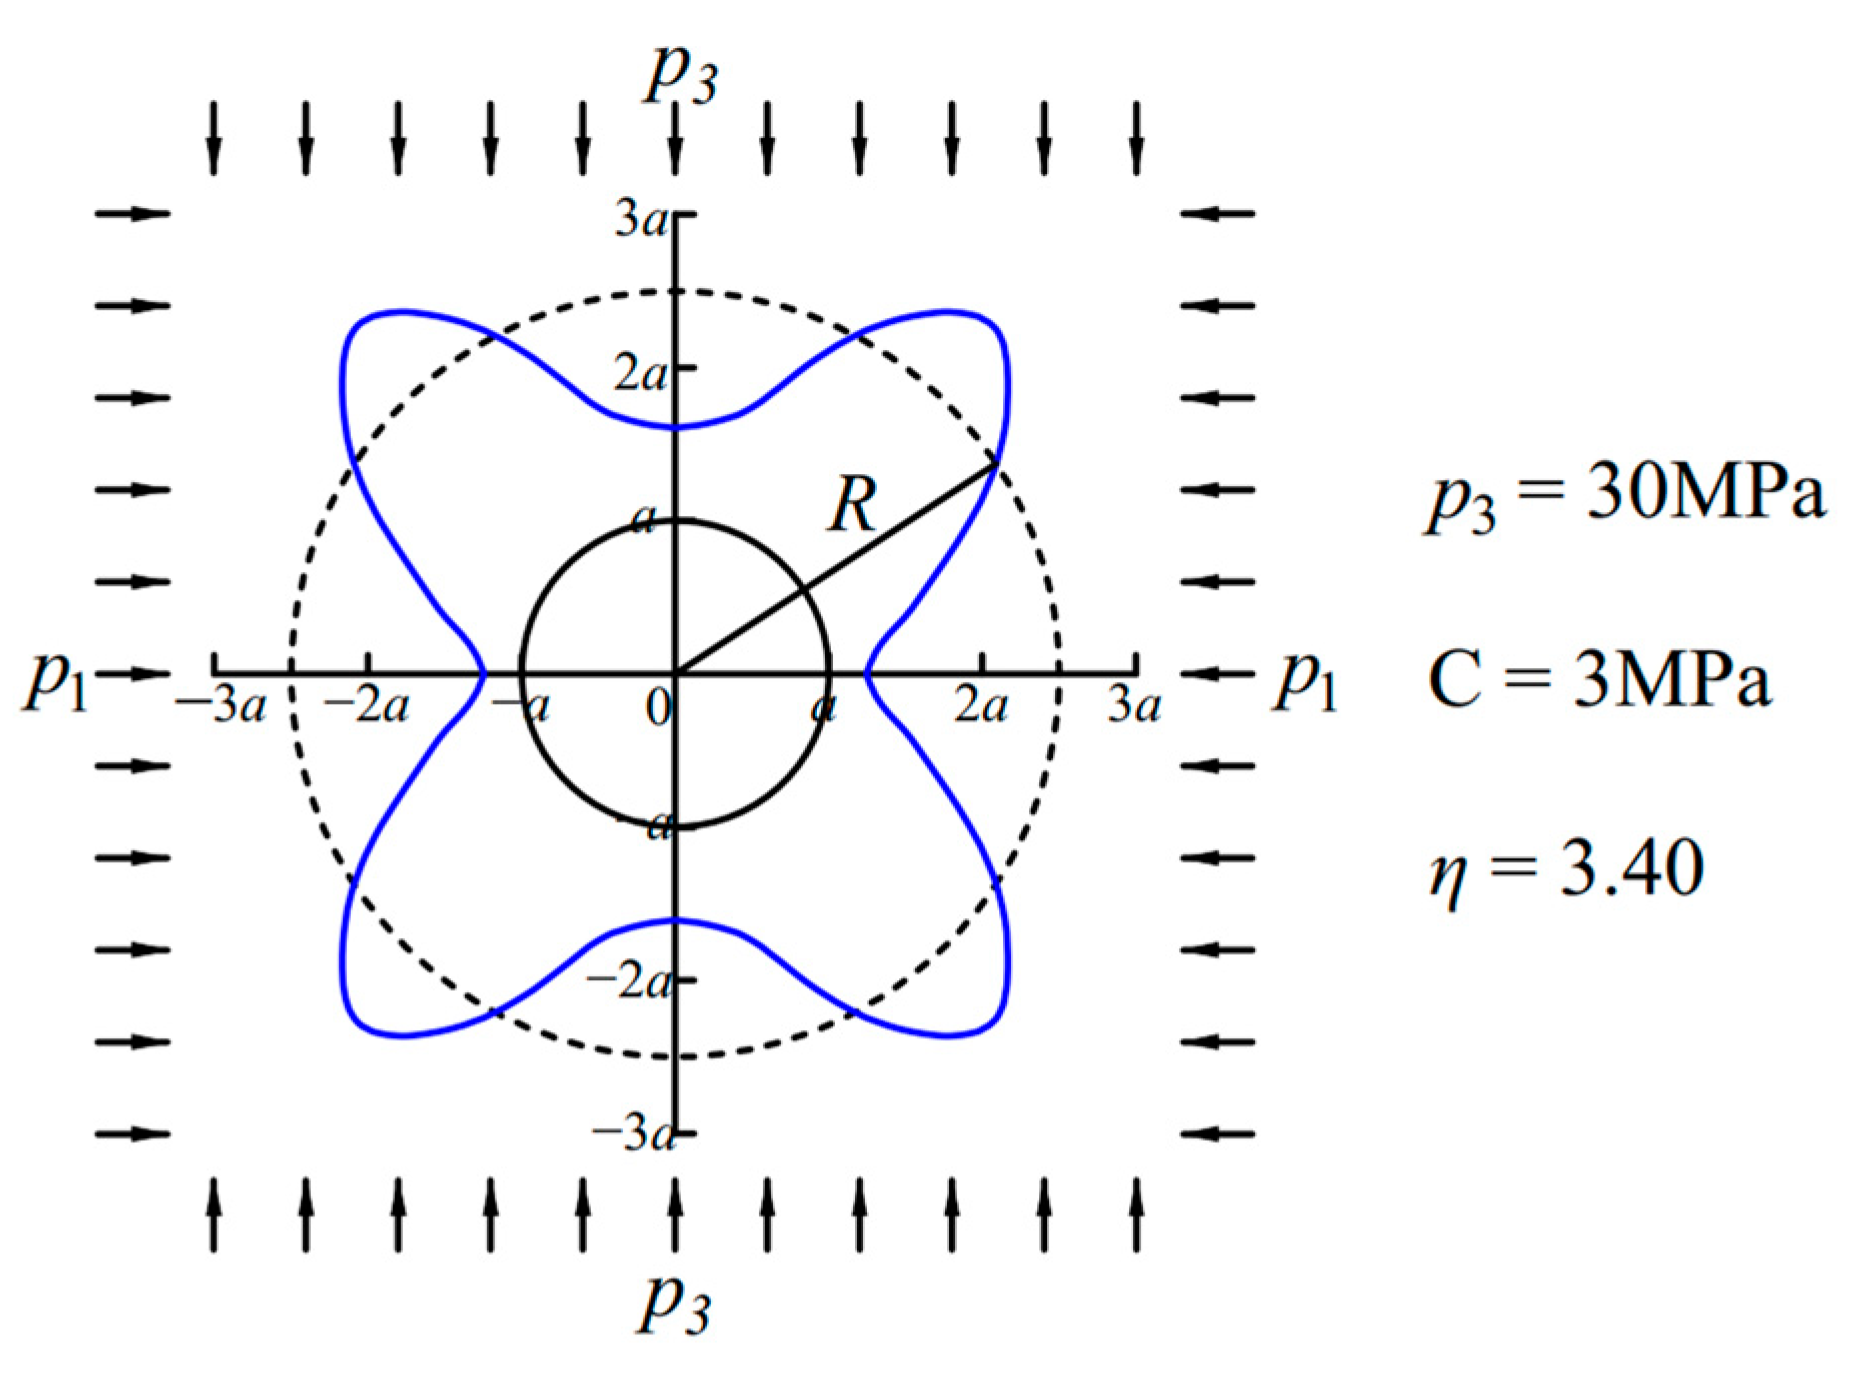
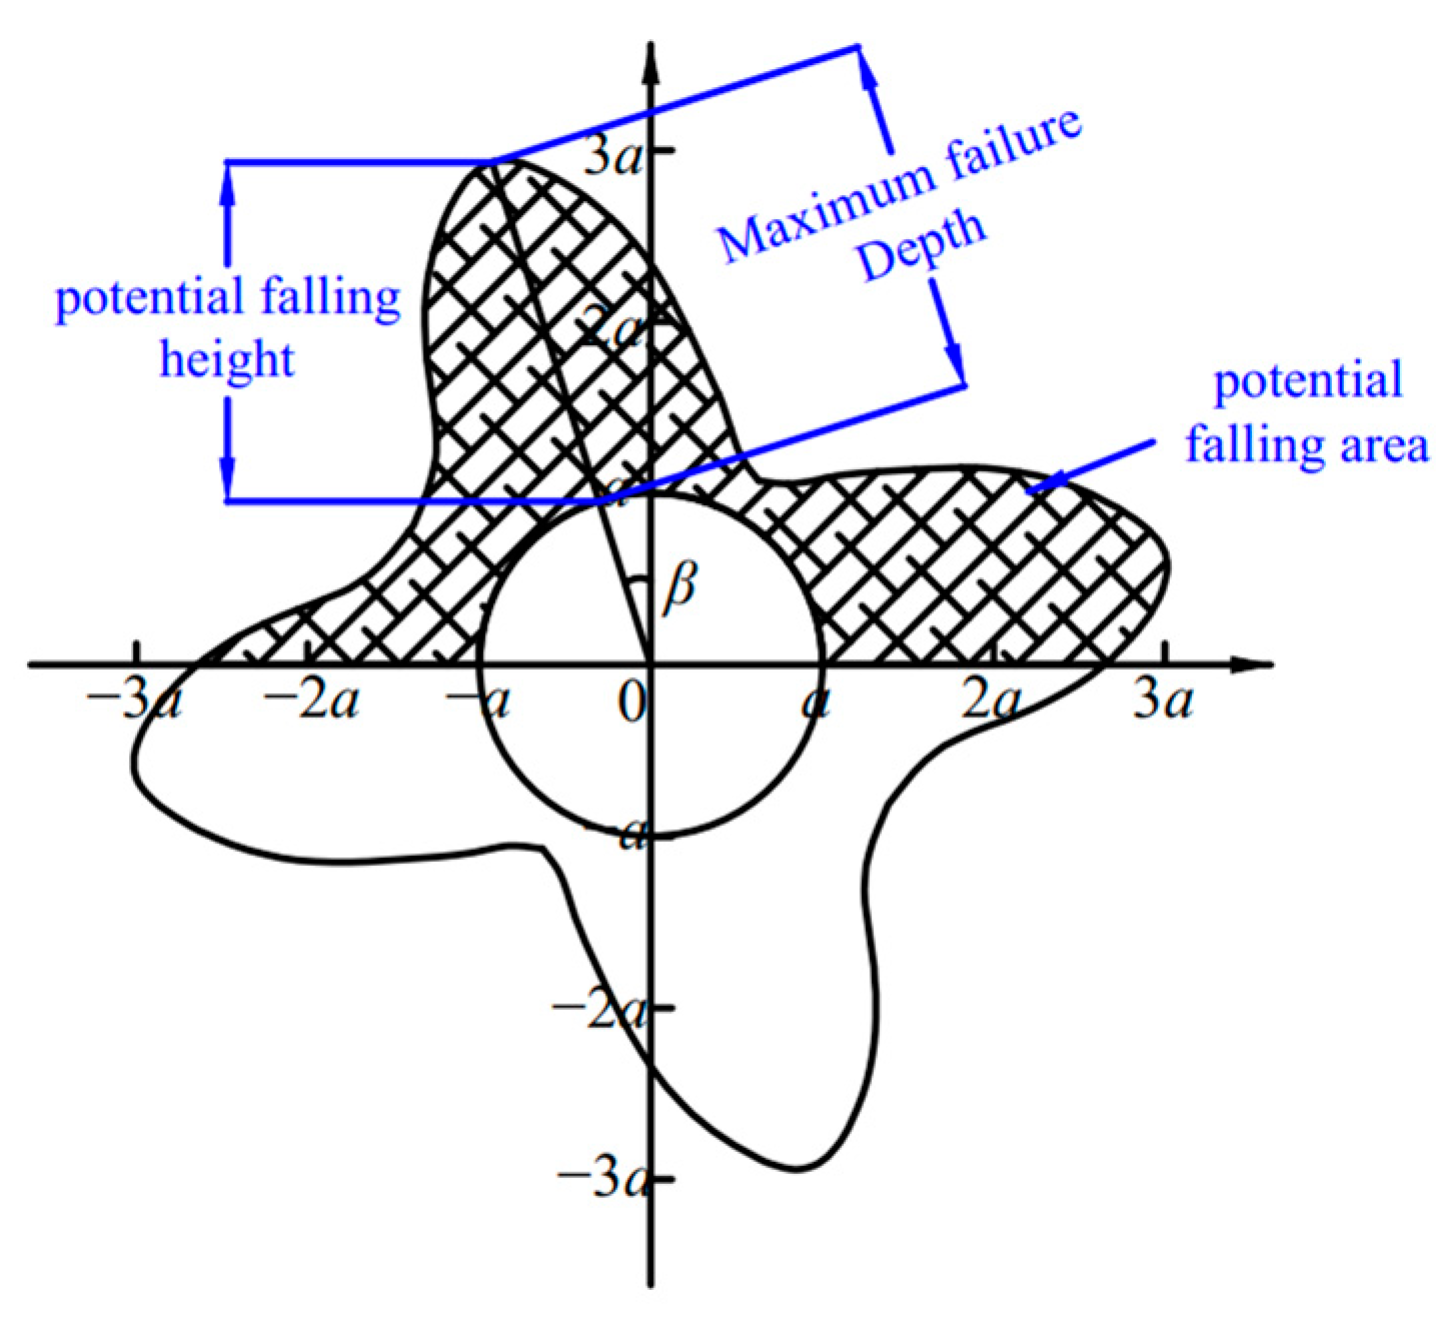
- Butterfly plastic zone: The butterfly plastic zone under non-isobaric conditions is shown in Figure 6, where the minimum radius of the plastic zone boundary is located on the horizontal axis, while the maximum radius is distributed across four quadrants. These boundary outlines take on a butterfly-like shape, with dips along the axes and prominent features in the quadrants.
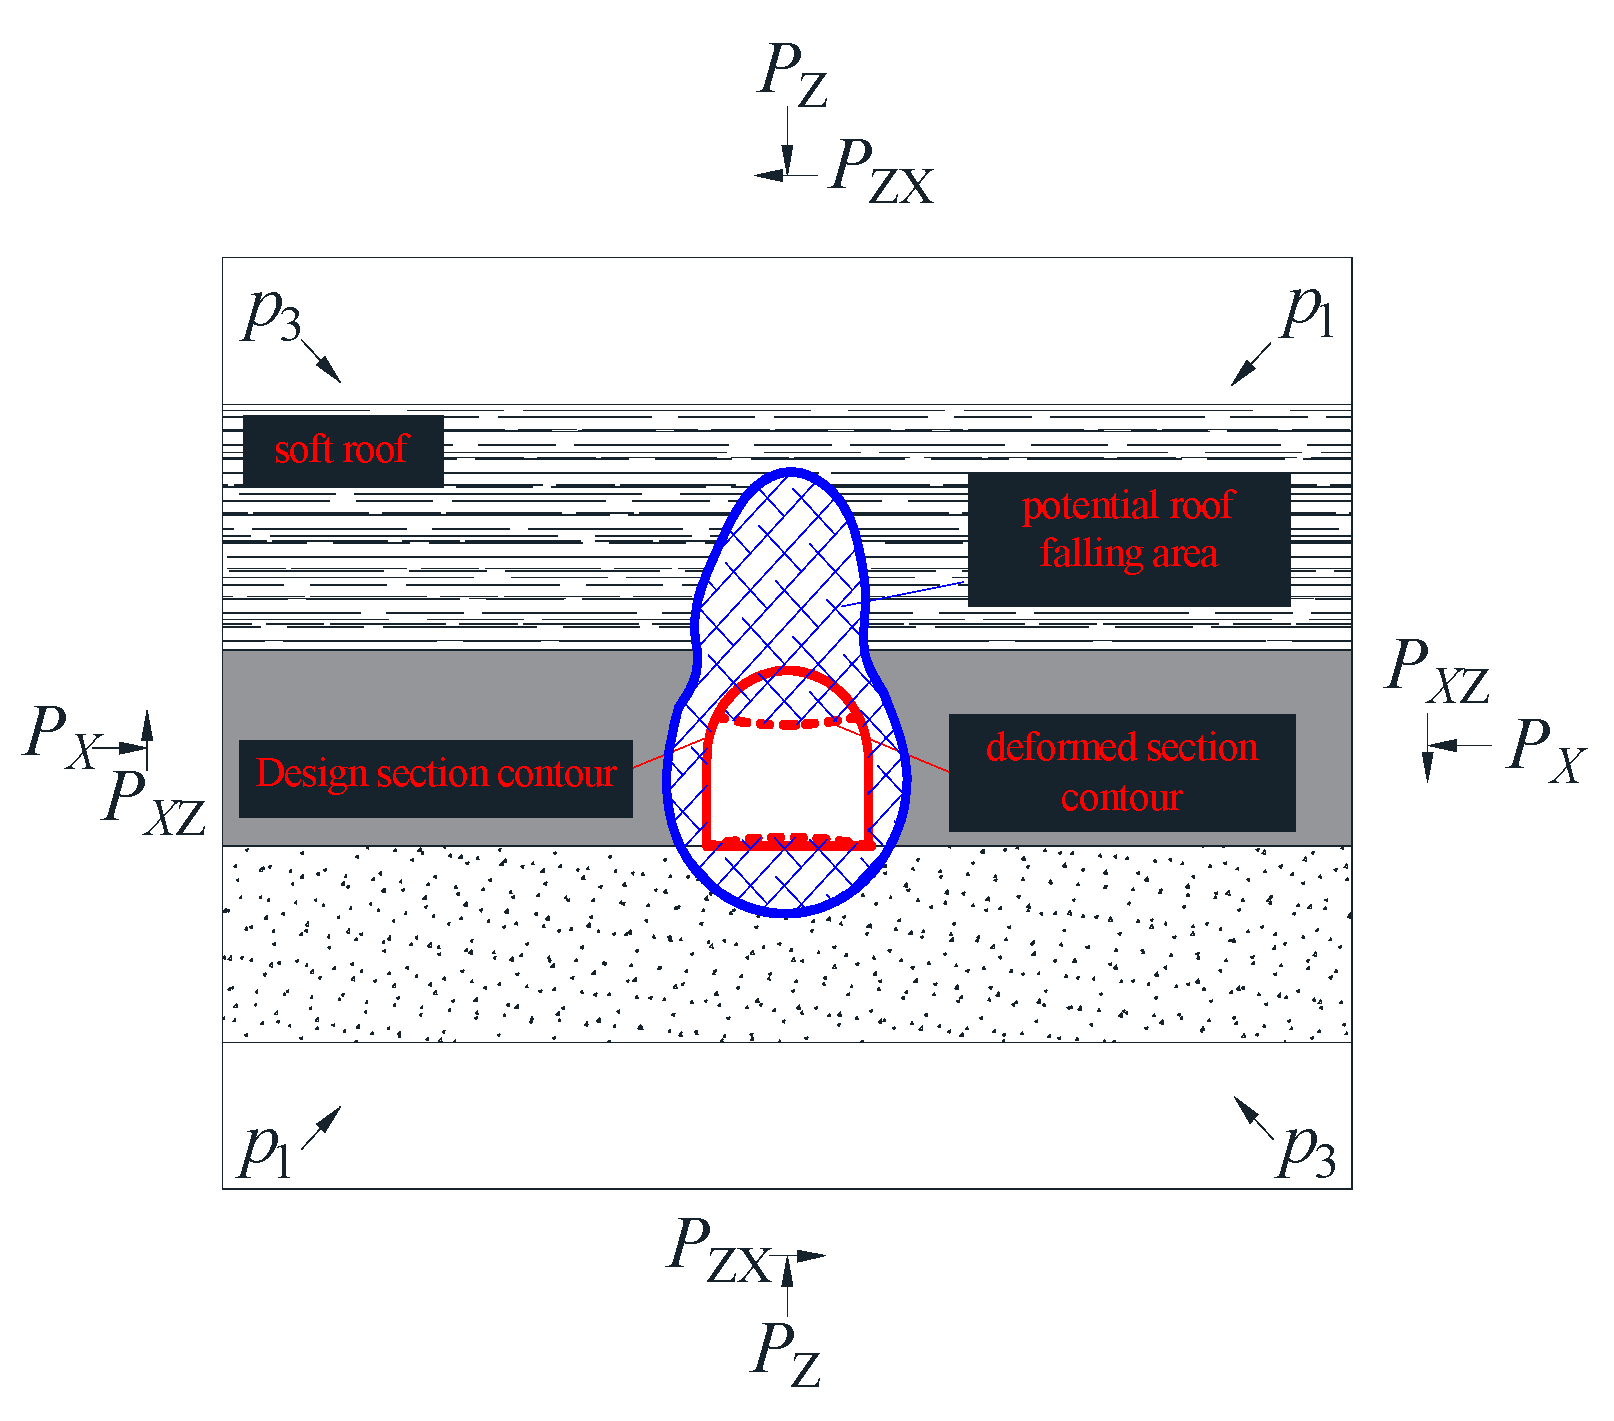
3.2. Roof Falls Mechanism of Butterfly Plastic Zone of Roadway-Surrounding Rock
4. Foam Filling Material Performance Index Test
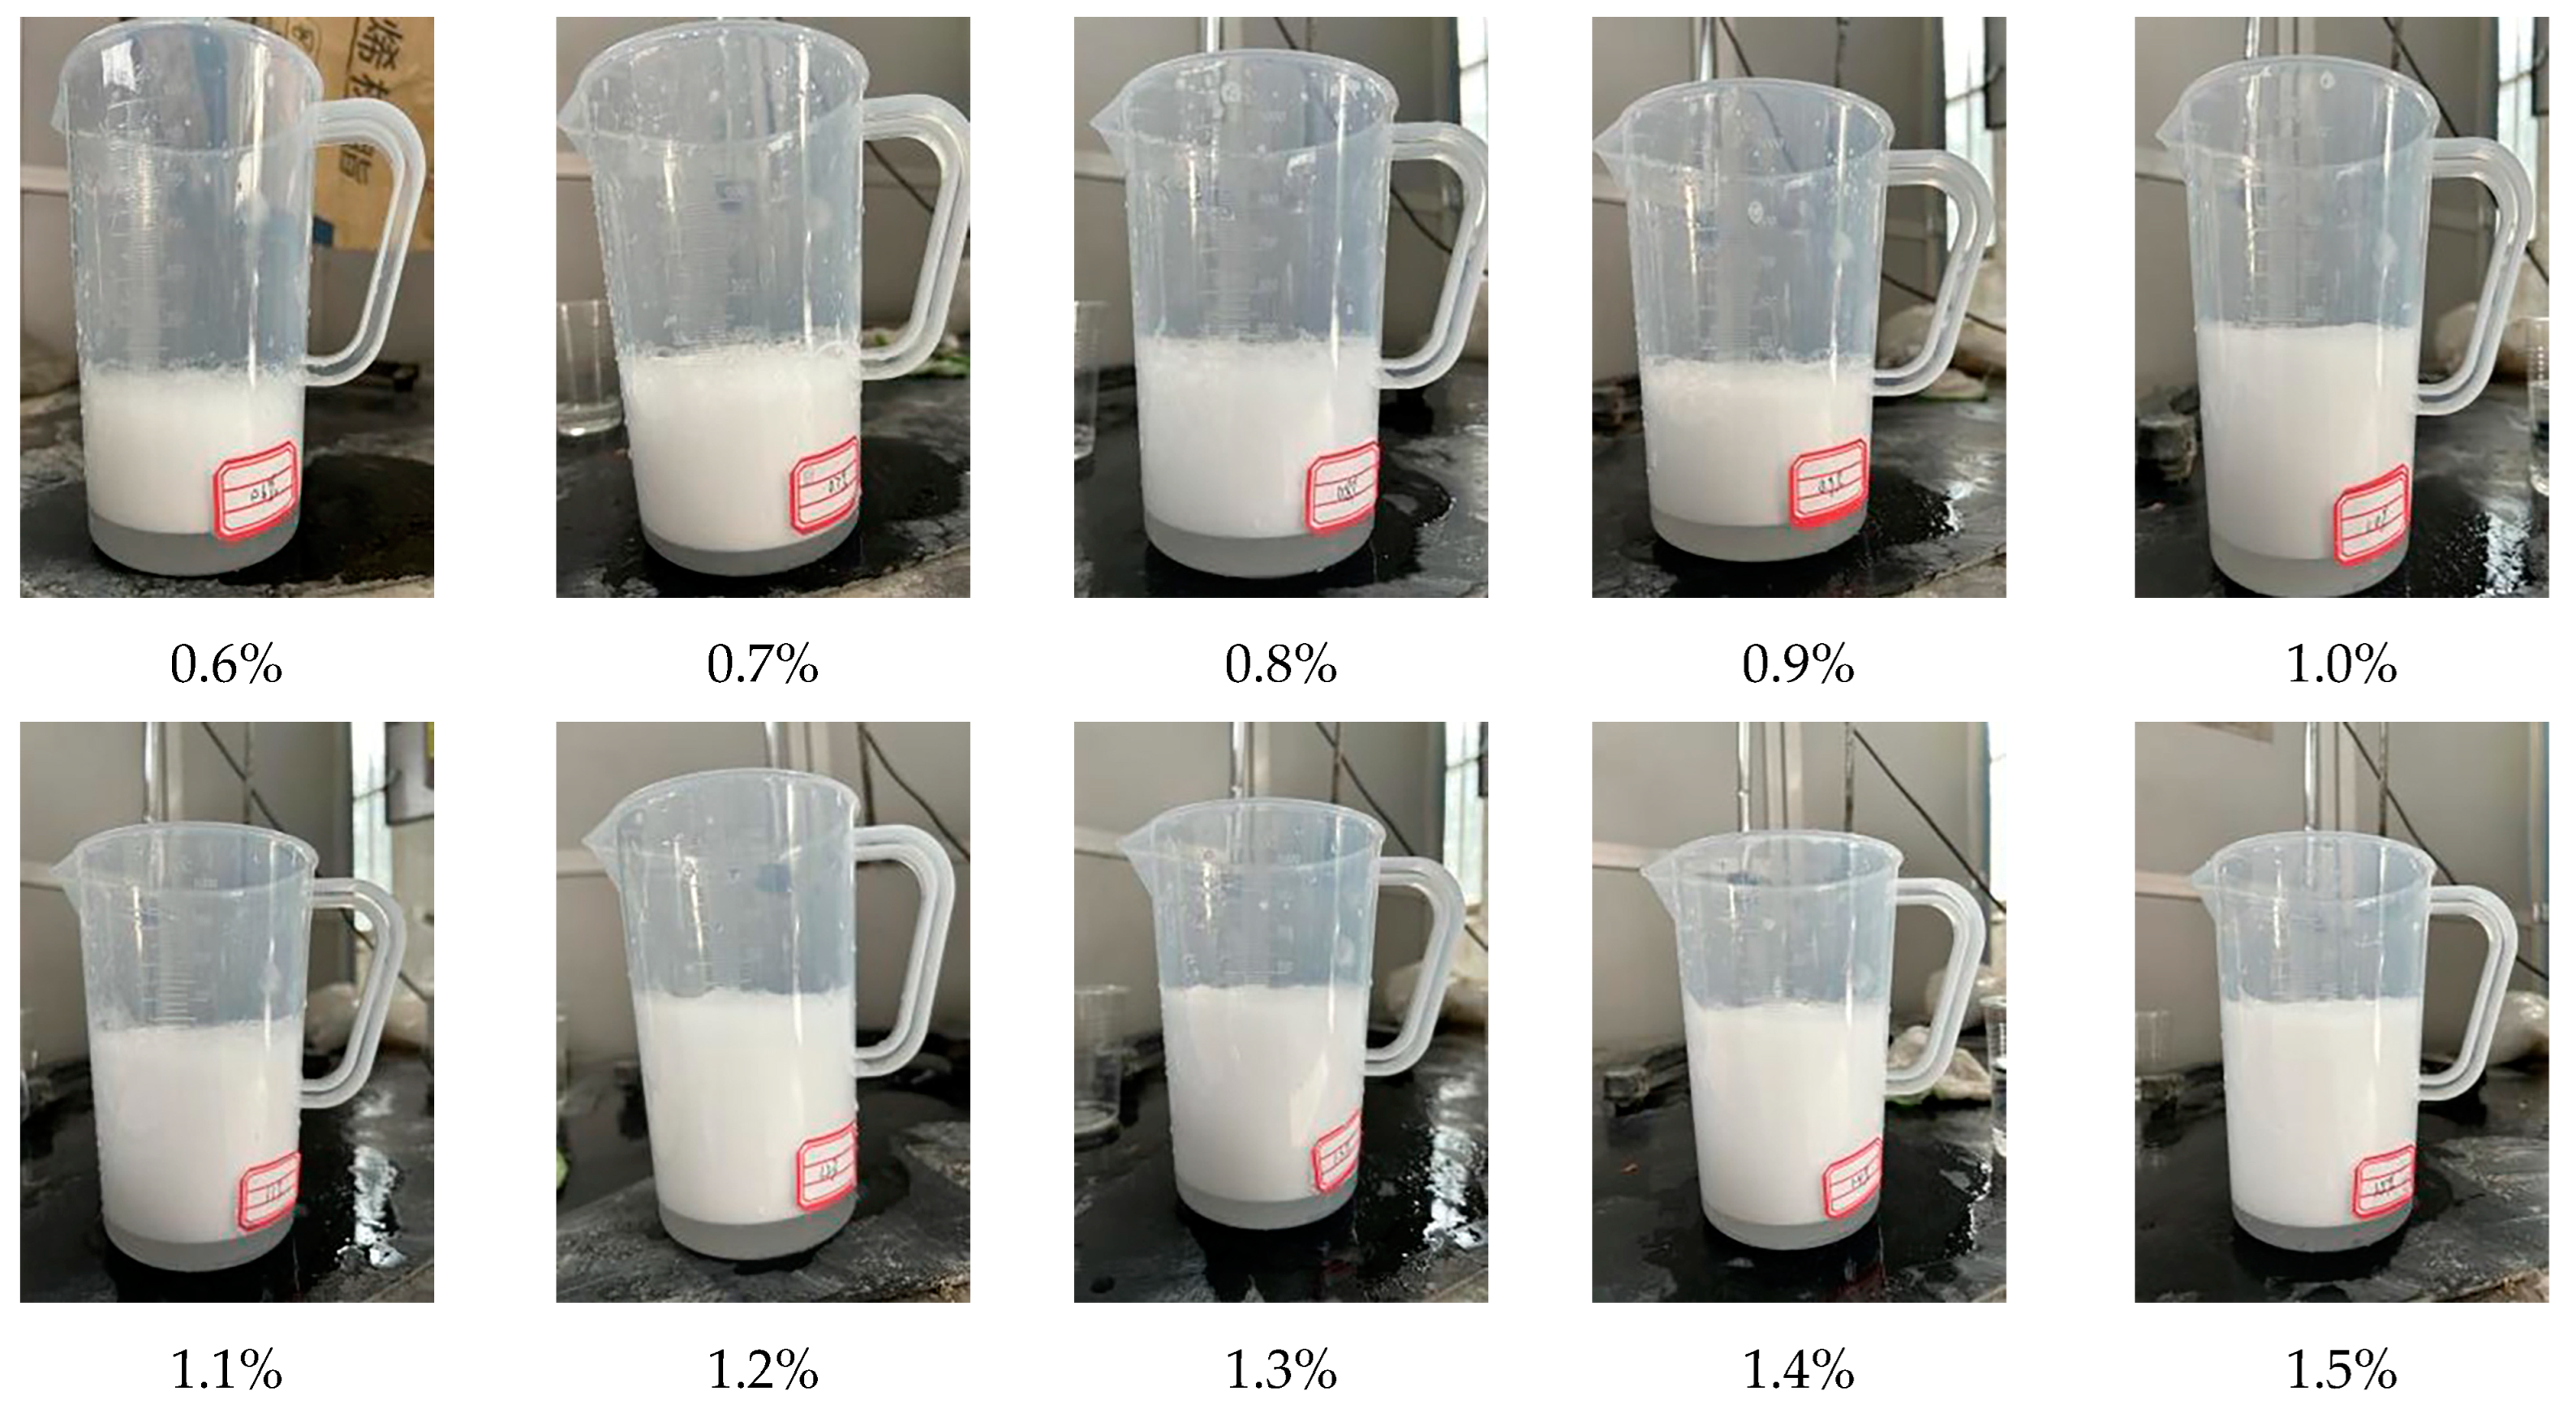
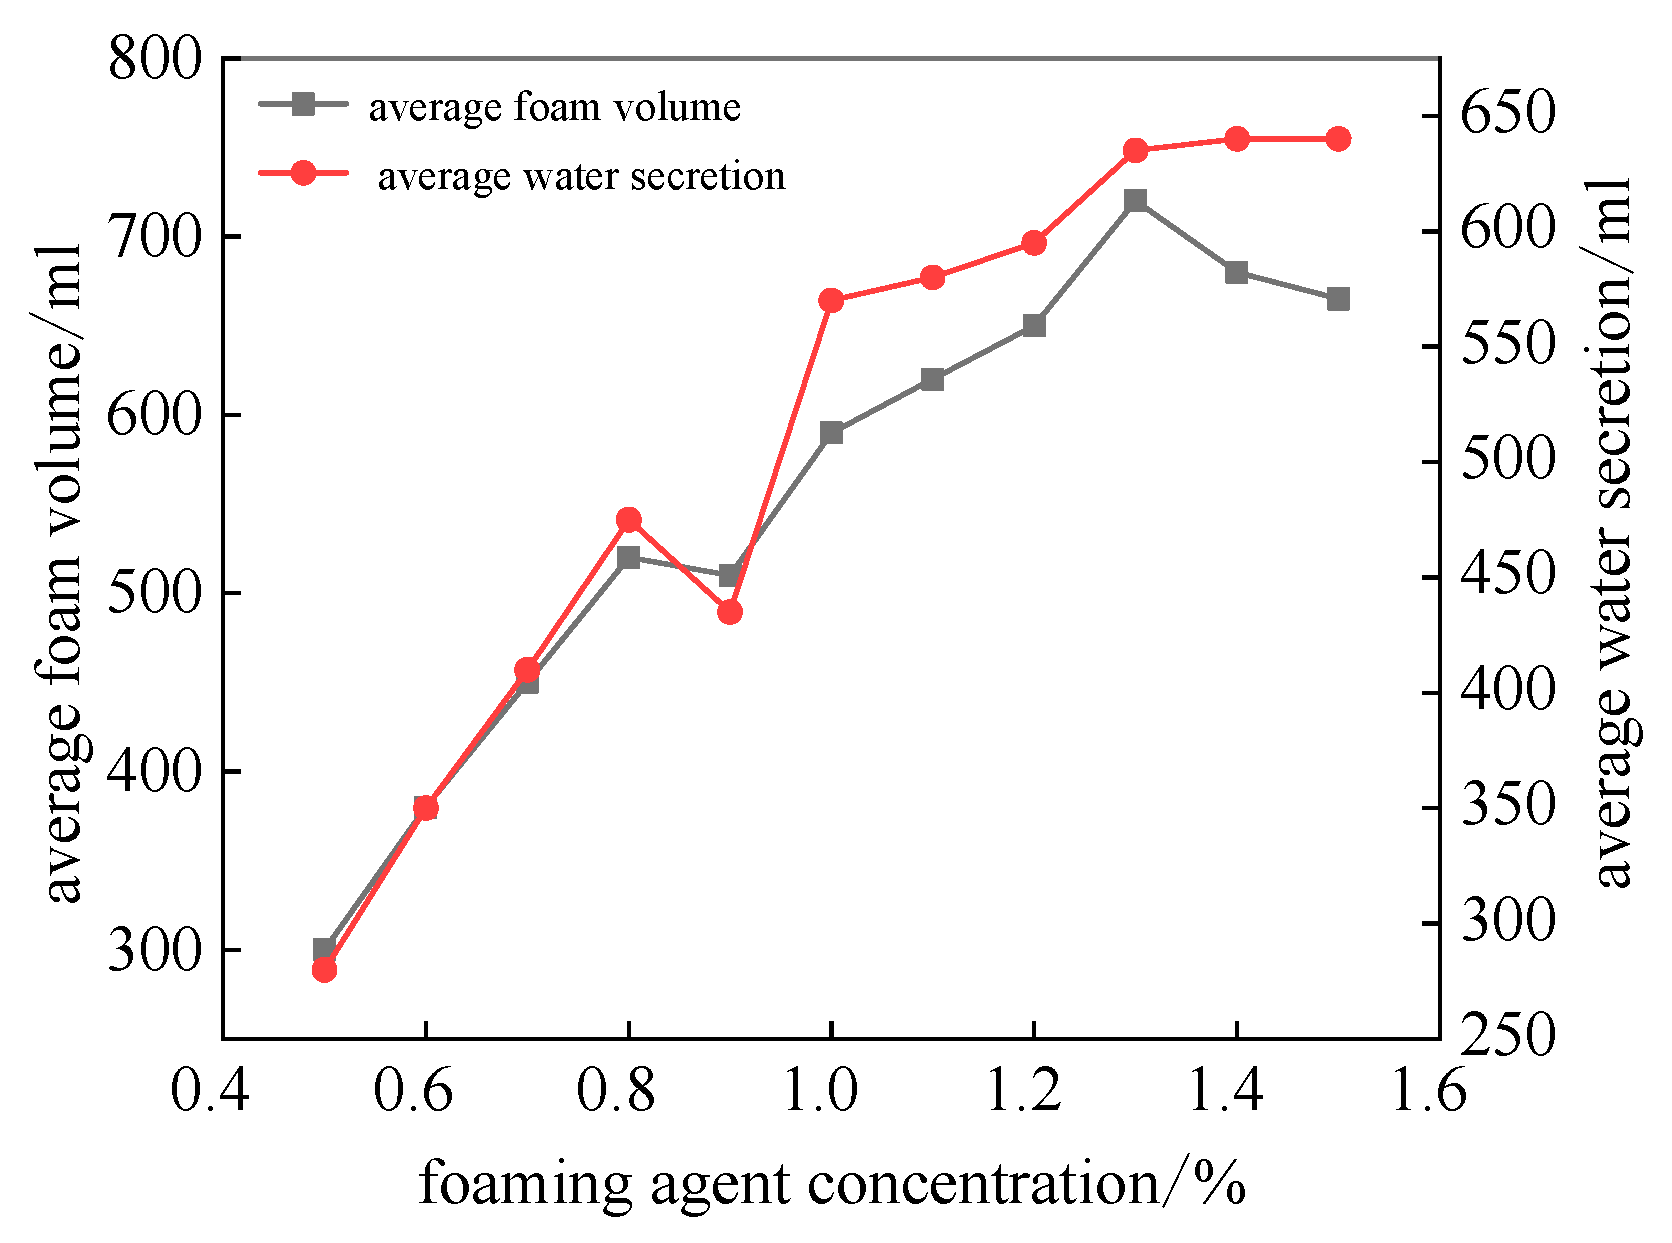
4.1. Determination of Material Foam
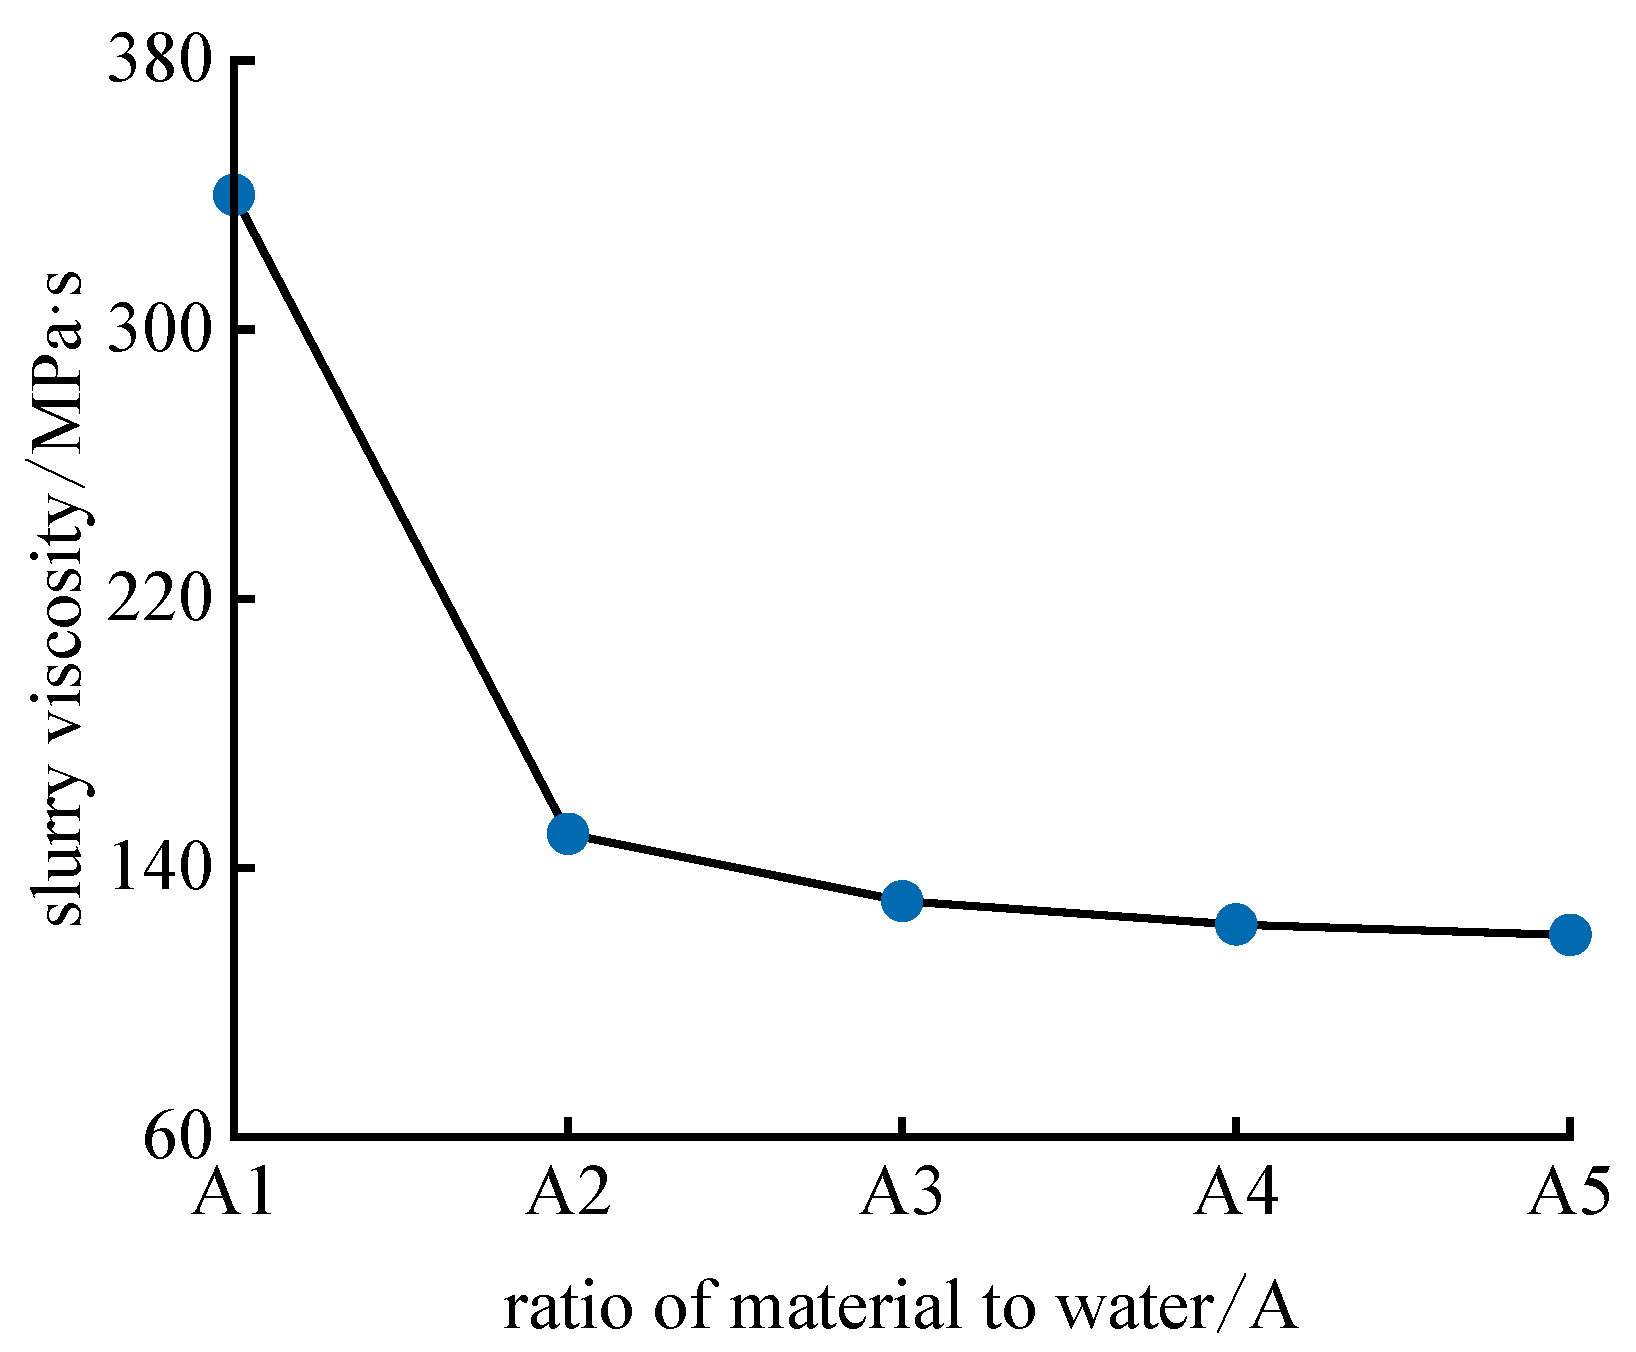
4.2. Material Slurry Viscosity Test
4.3. Material Setting Time Test
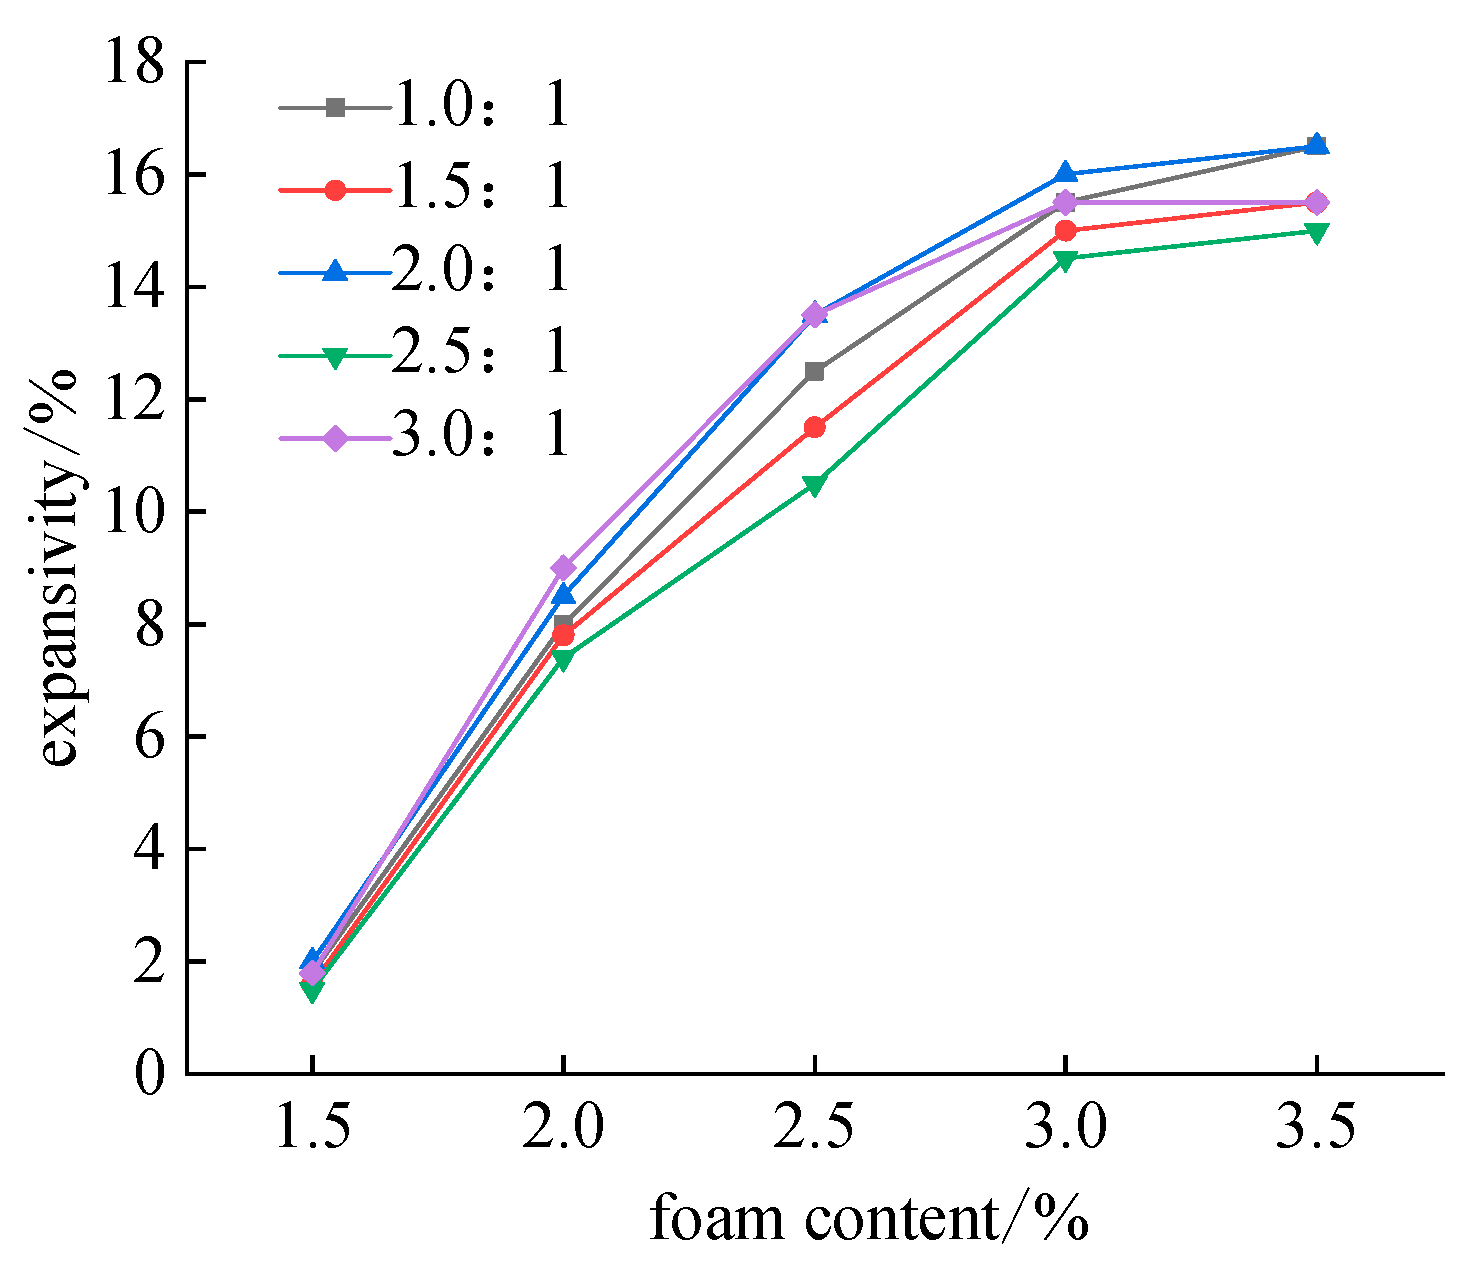
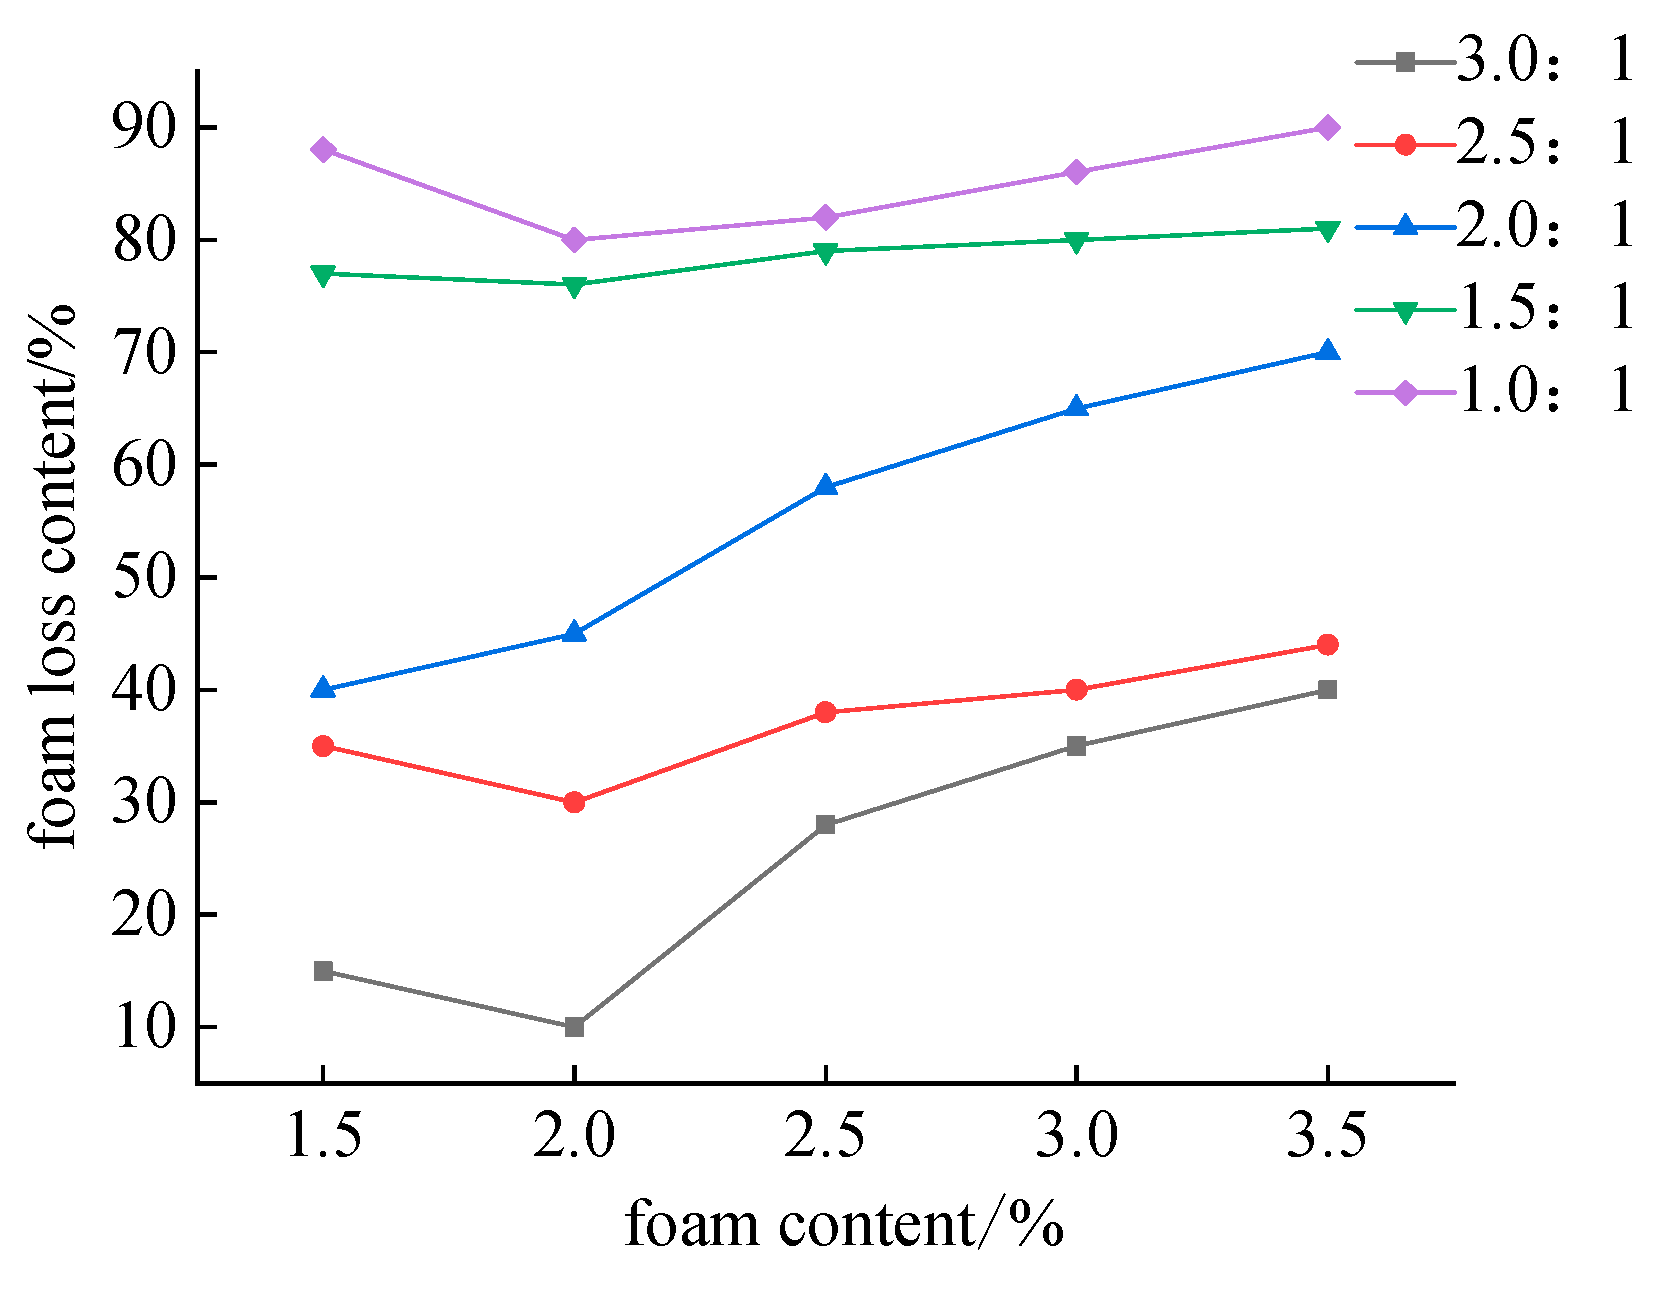
4.4. Material Swellability and Foam Loss Percentage Test
4.5. Mechanical Strength Test of Materials
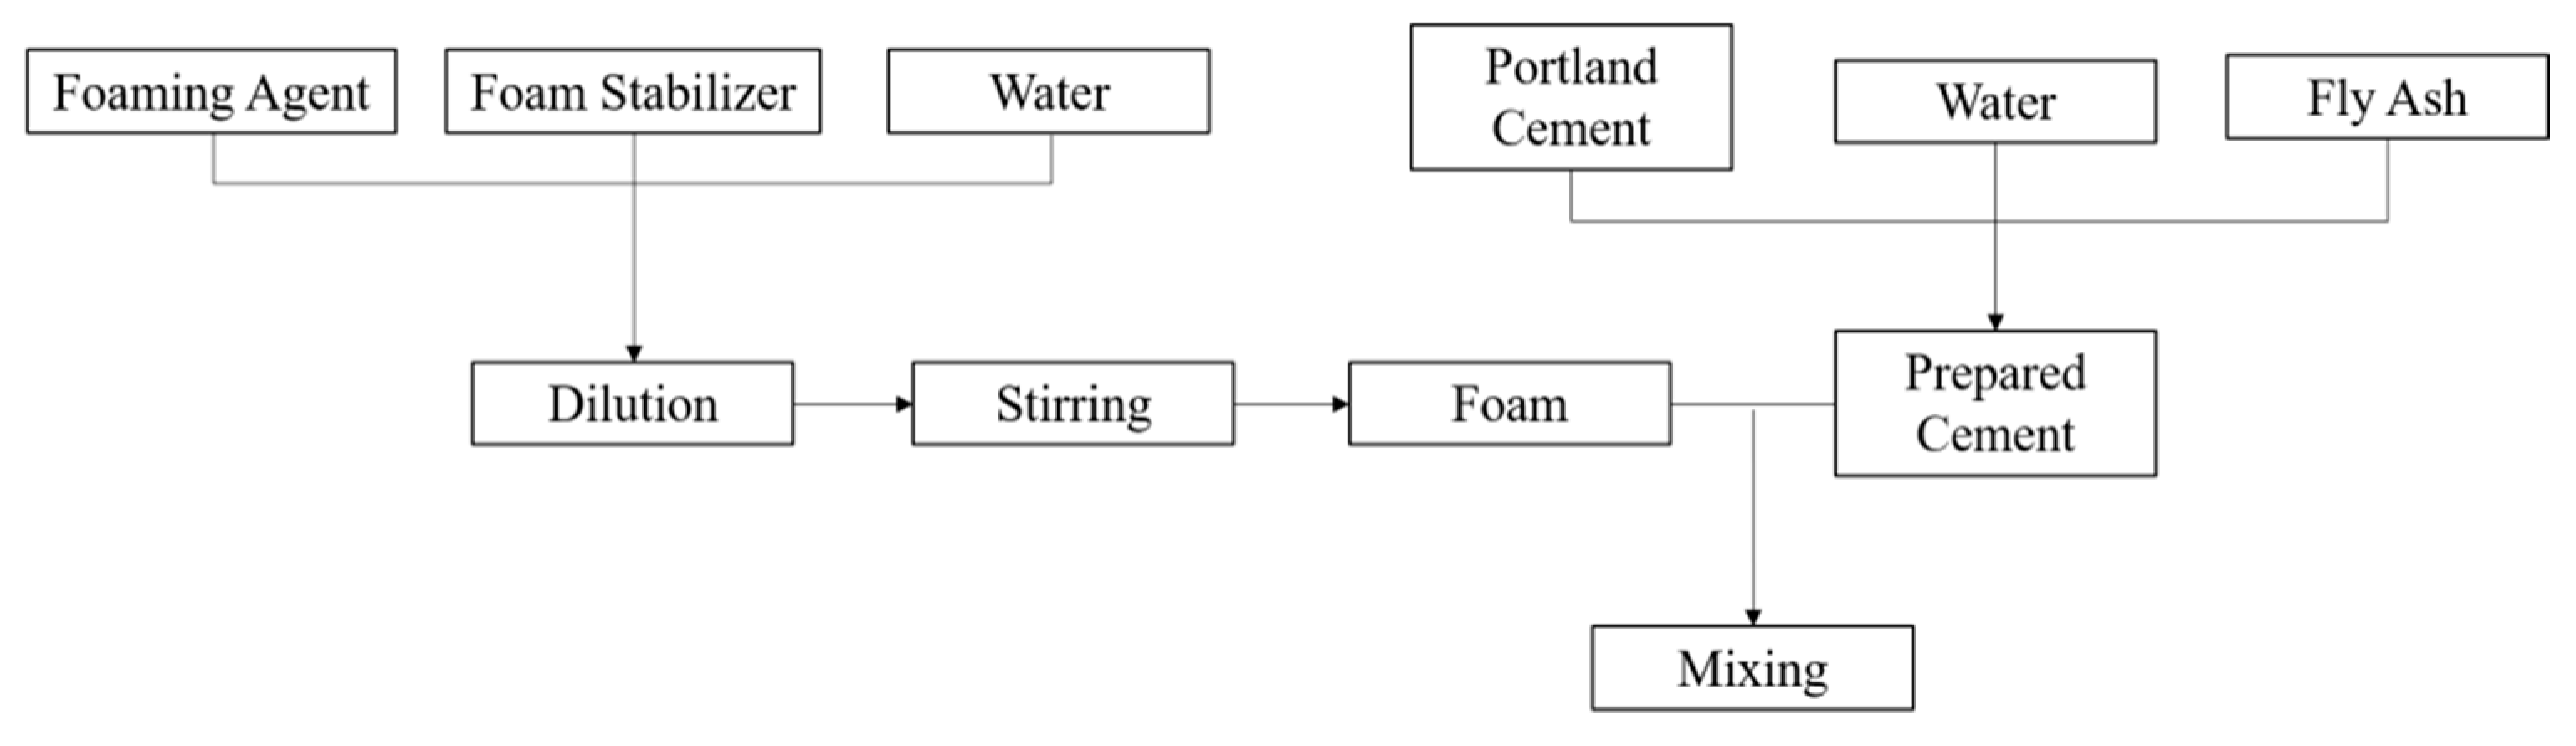
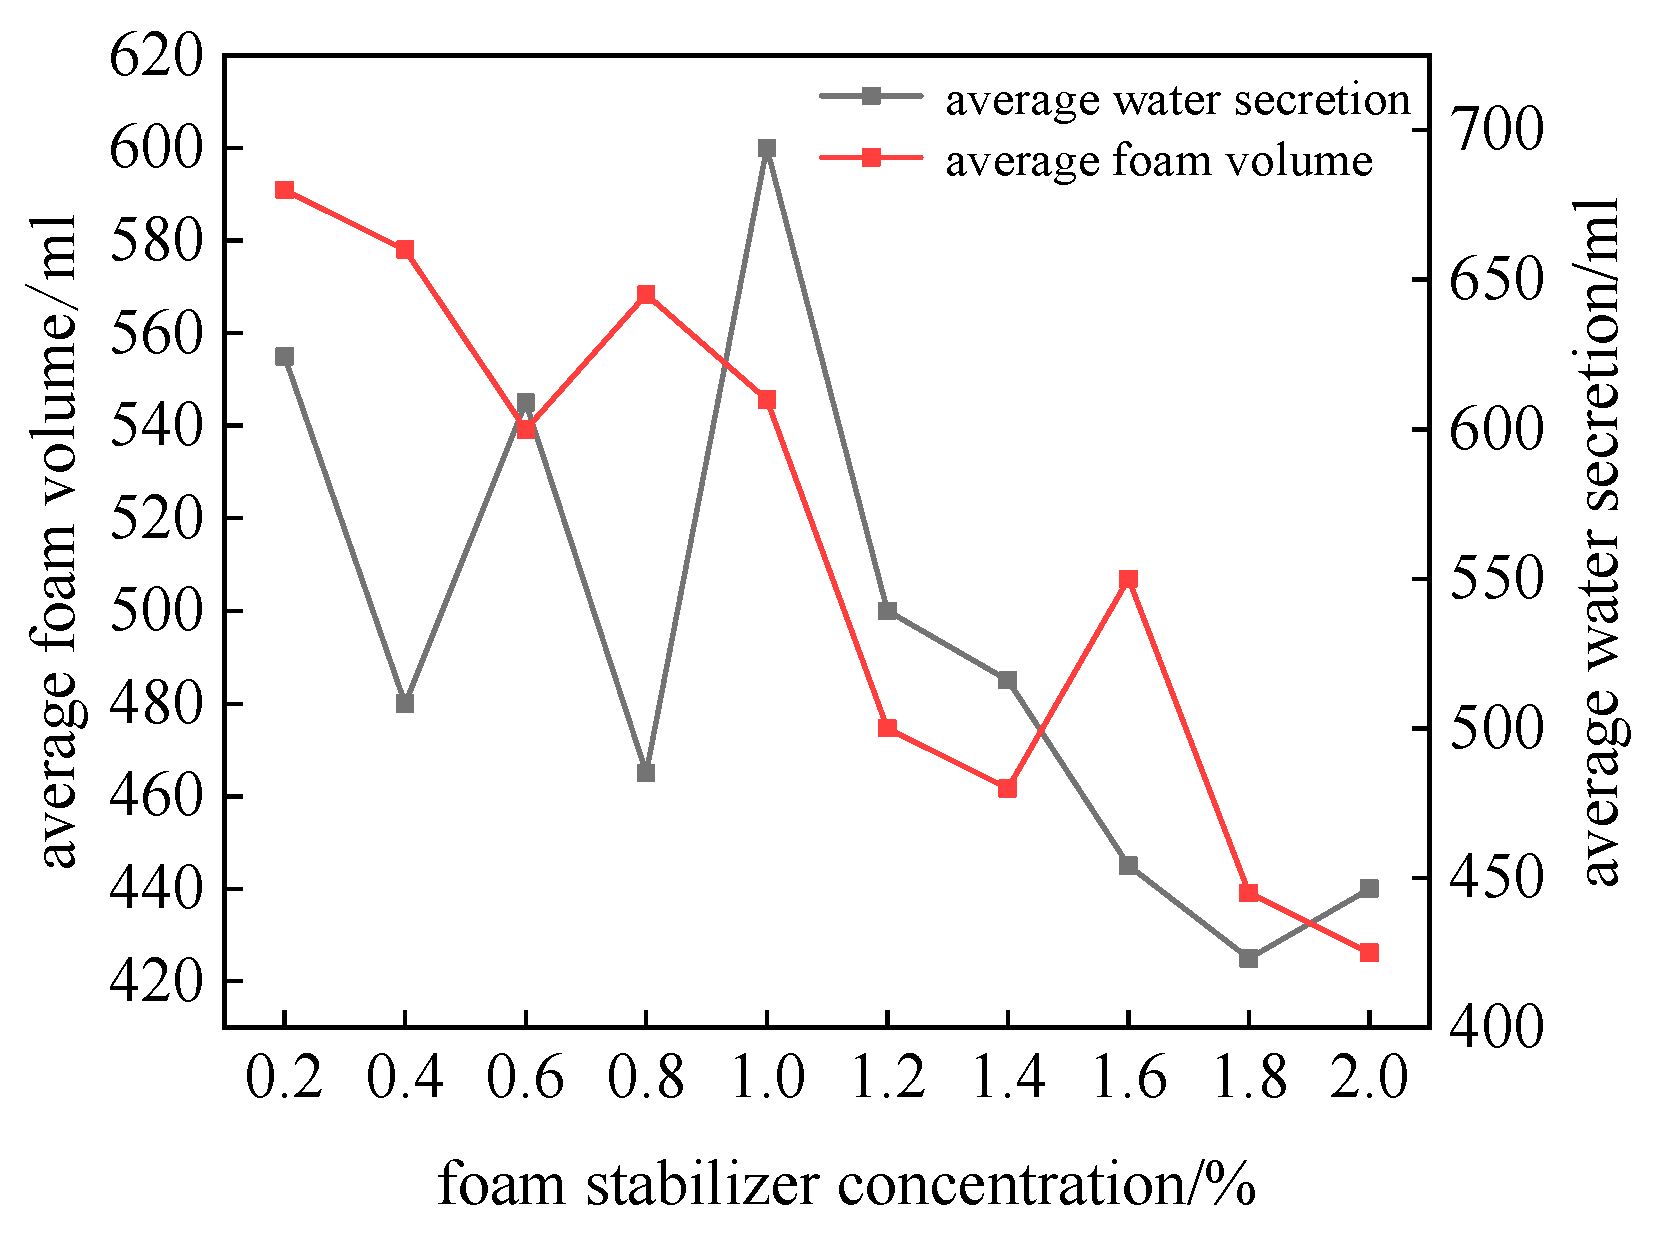
5. Preparation of Filling Material and Determination of Foam Stabilizer Concentration
6. Bag-Filling Scheme and Field Application
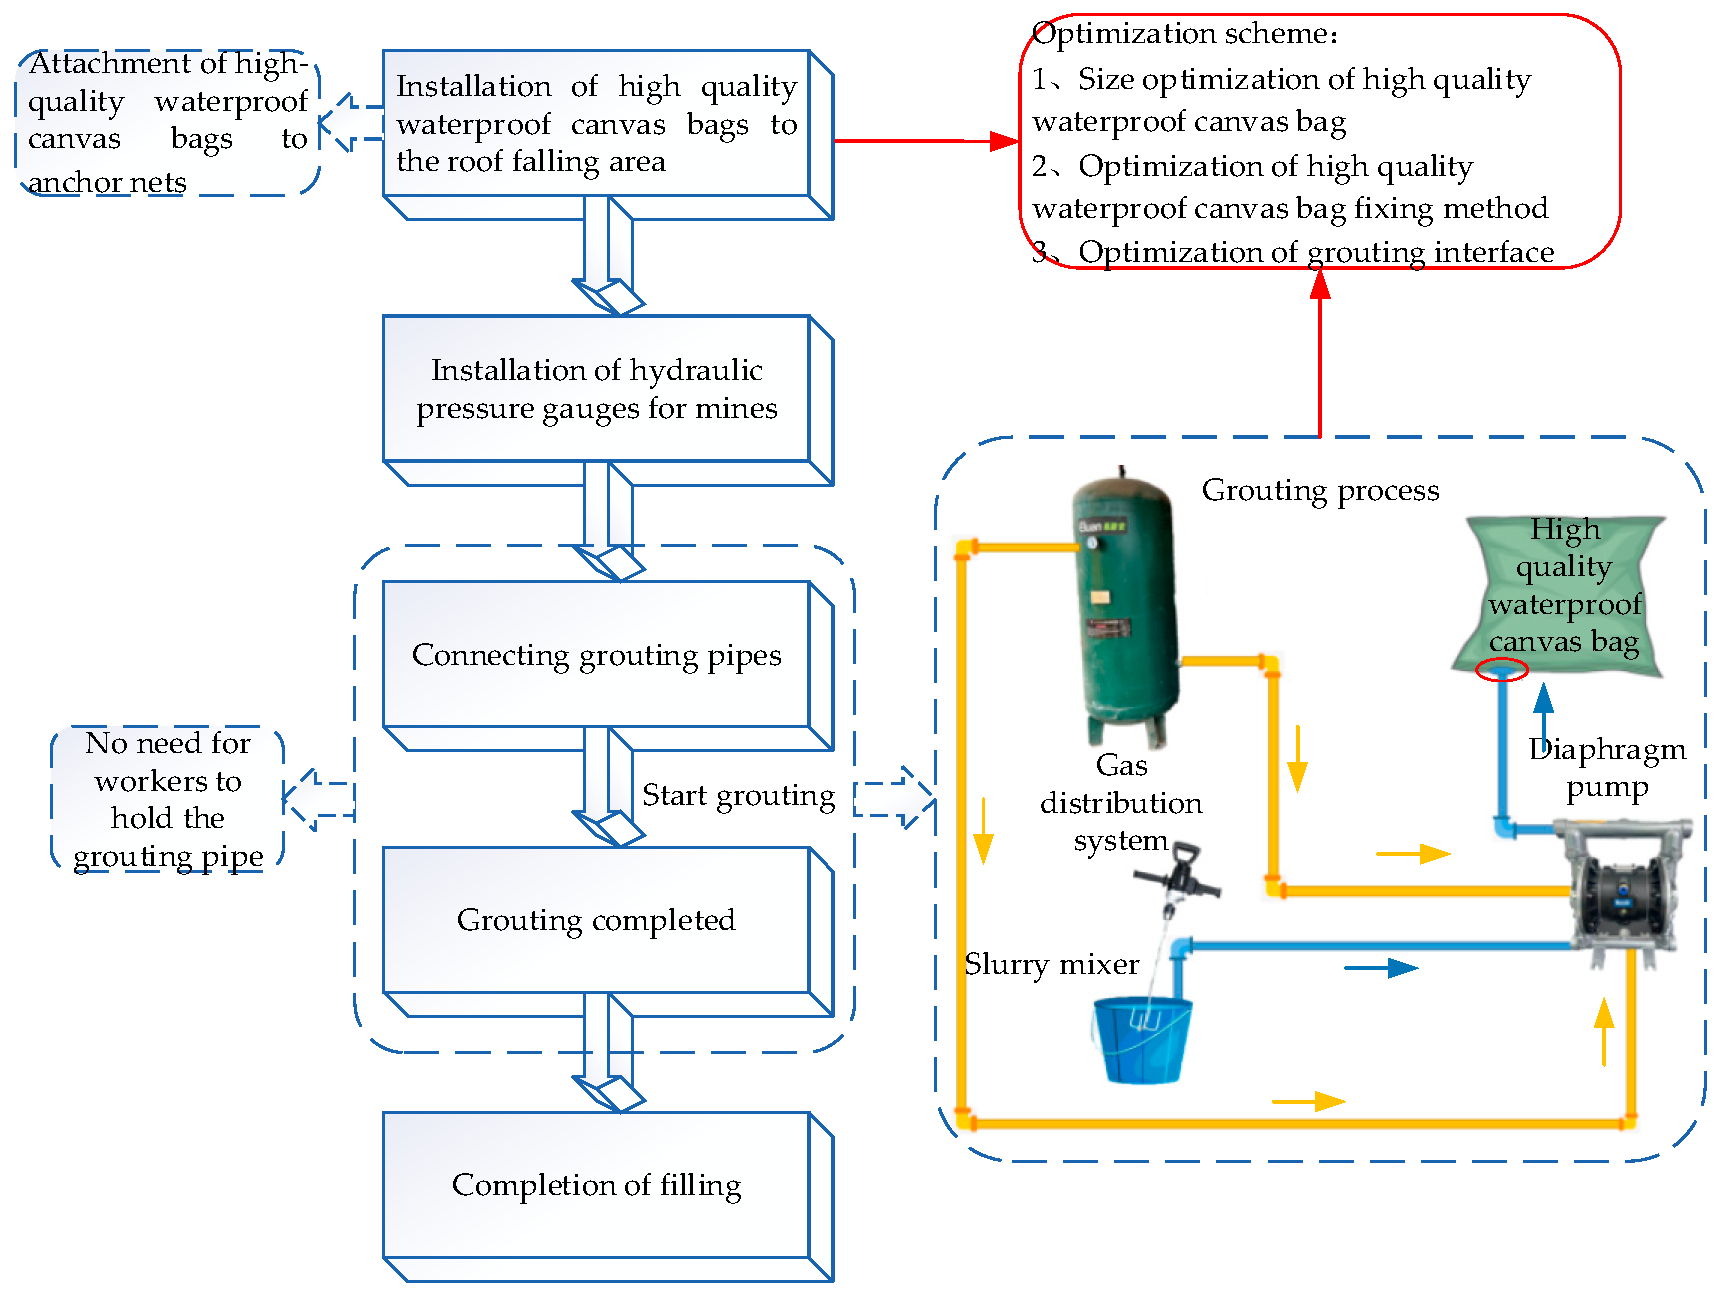
6.1. Bag-Filling Scheme
- Install a high-quality waterproof canvas bag in the roof falls area: The high-quality waterproof canvas bag is made of tear-resistant, high-strength cloth. The material is soft, has a longer service life, and provides strong waterproof capabilities, effectively preventing slurry seepage.
- Install the mine hydraulic pressure gauge in the specified position: this paper selects the YH-45-type mine hydraulic pressure gauge and the pointer MCZ rock bolt (cable anchor) dynamometer as the monitoring instruments for rock pressure in mines.
- Connect the grouting pipe and start grouting: the grouting process is continuously optimized through laboratory tests, with the final grouting process illustrated in Figure 18.
- After grouting is completed, check the sealing of the grouting bag.
- Complete the filling.
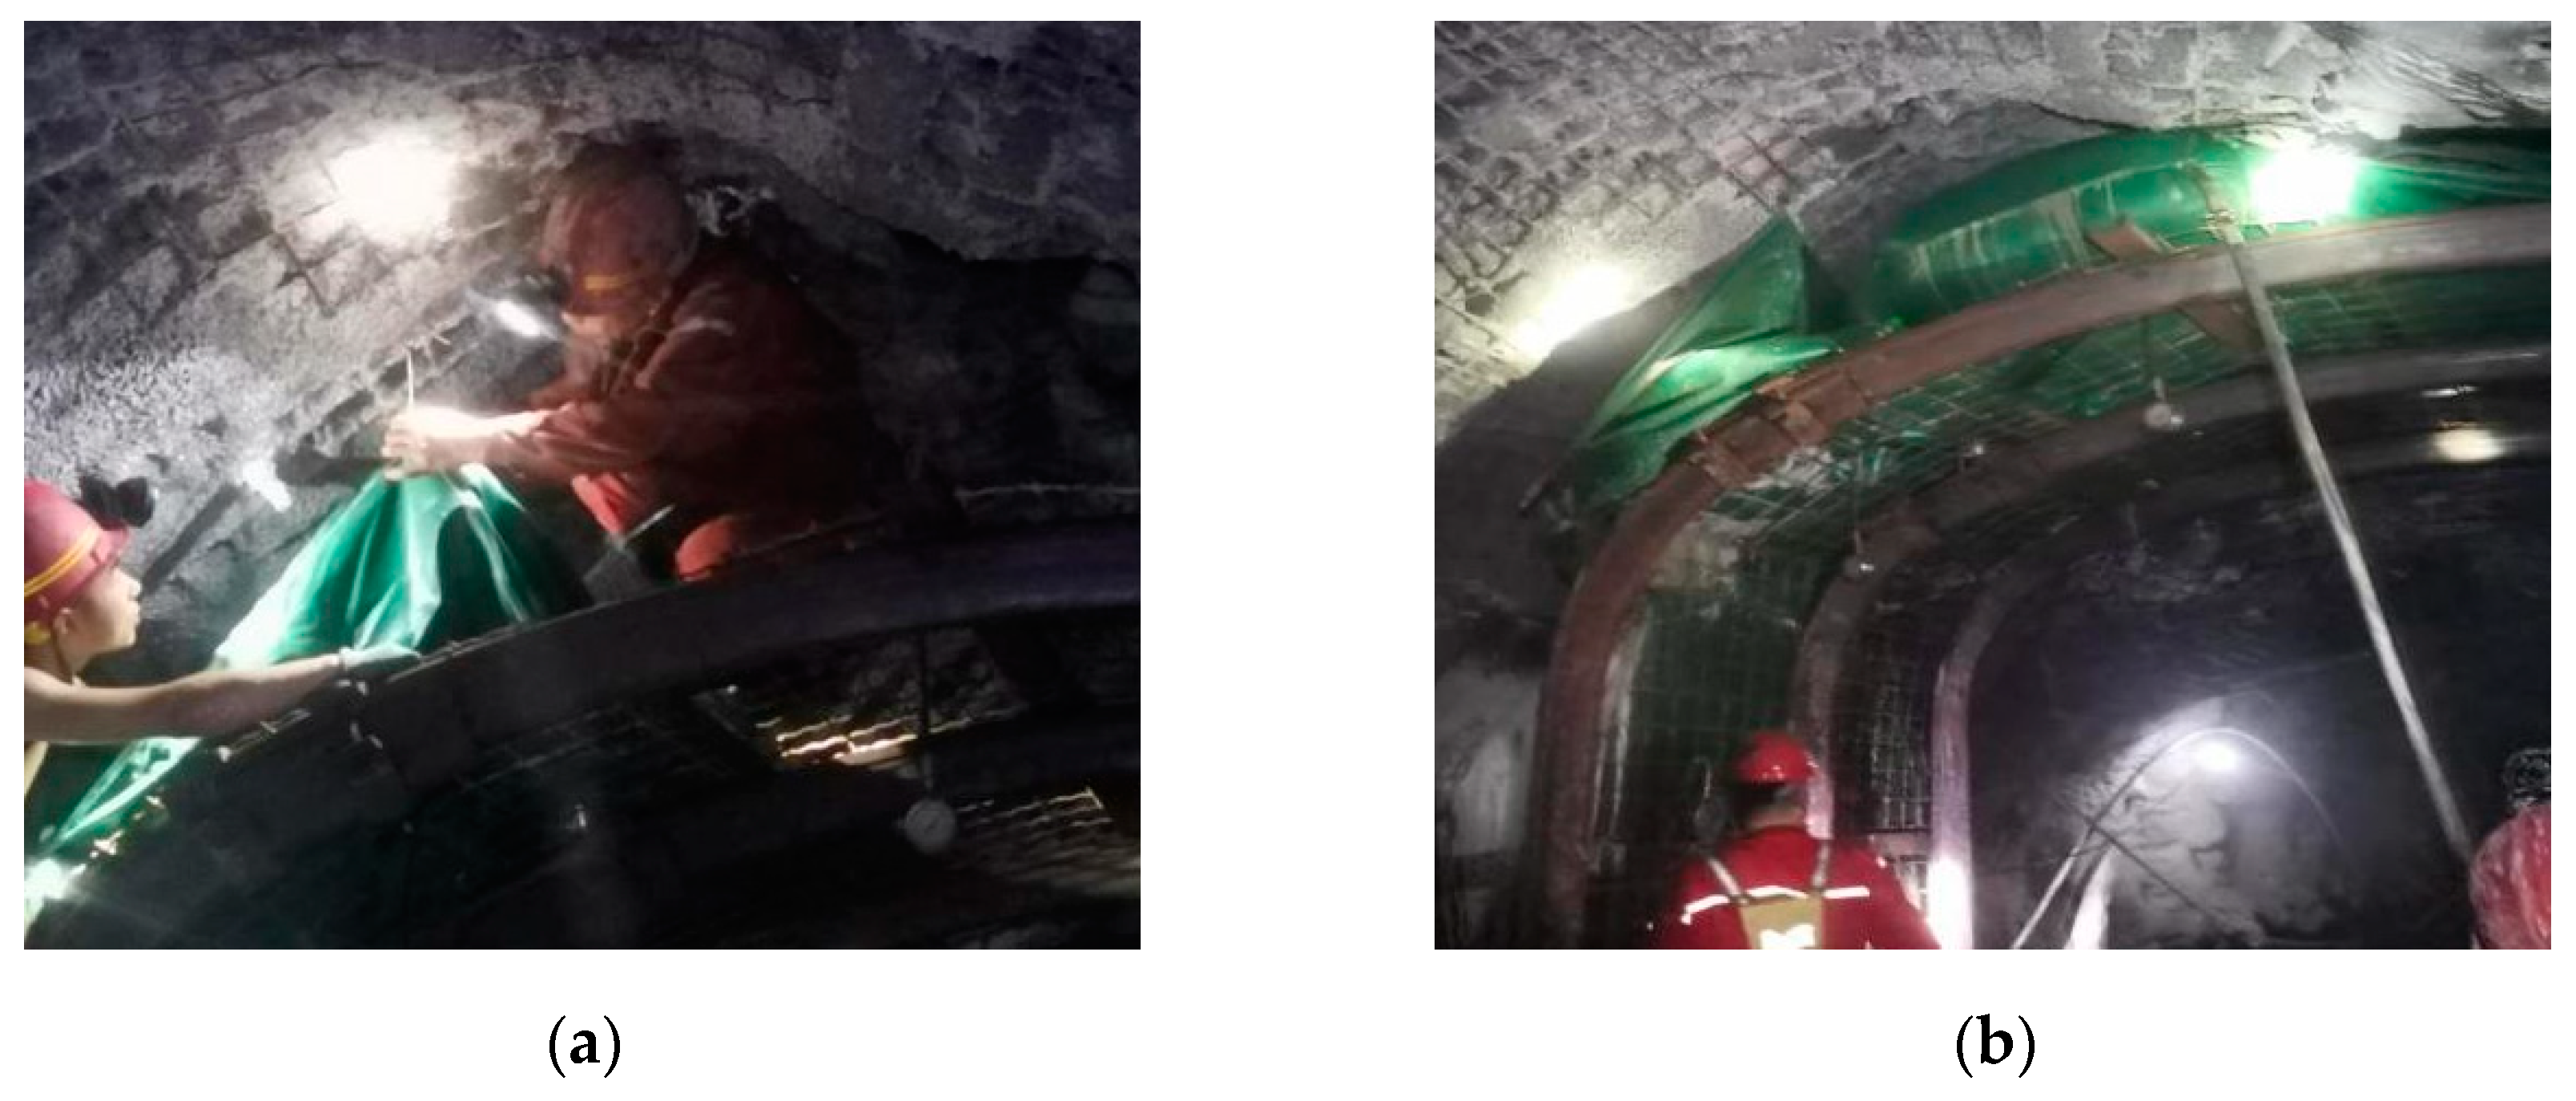
6.2. Field Application Effect
7. Conclusions
- In the soft rock roadway of Songxian Shanjin, due to its relatively low physical and mechanical properties, the natural fractures in the rock may collapse during the blasting and mining process. The existing timber fill support methods cannot meet the required support strength. The self-developed foam material overcomes the problems of timber fill not being able to fully contact the roof, as well as the issues of wooden structures being prone to corrosion and strength reduction, effectively preventing roof collapse accidents.
- When the solid–water ratio of the foaming material exceeds the A3 level, the change in slurry viscosity is minimal, occurring at a ratio of 1:2. During the actual filling process, the mixed slurry requires a flow time of about 15 min, meaning the initial setting time of the material should exceed this duration, leading to a minimum water–solid ratio of 2.5:1. When seeking to incorporate more foam, maintaining a water–solid ratio between 2.5:1 and 3.0:1 results in a foam loss percentage of less than 44%. The final strength of the foaming material with water–solid ratio of 1.5:1 and 1:1 increases by approximately 47.7% compared to the strength at 1 day. Additionally, when the concentration of the foam stabilizer is at 1.0%, it reaches a peak effectiveness, indicating that this concentration is optimal. Based on practical requirements, a ratio of 1:3 for portland cement to water was selected, with a foam stabilizer concentration of 1%. This ensures sufficient flow time while meeting the strength requirements for filling support.
- Using high-quality waterproof canvas bags and self-developed foaming materials, a new bag-filling process was proposed. The filling cost was reduced from 800 CNY/m3 to 545 CNY/m3, a decrease of approximately 32%. The required workforce was reduced from 4 workers to 2, cutting labor costs by 50%. It is estimated that annual support costs can be reduced by about CNY 300,000. The bag-filling scheme was used to fill and reinforce the roof falls area in the roadway. This improved the support strength of the filling material, fundamentally eliminating the conditions for fire hazards and reducing the likelihood of secondary collapse accidents. Roof displacement was monitored continuously for three months, showing no significant subsidence. This effectively ensured the safety of the roadway roof surrounding rock.
Author Contributions
Funding
Institutional Review Board Statement
Informed Consent Statement
Data Availability Statement
Conflicts of Interest
References
- Meng, X.; Li, K.; Liu, F. Study on coal mine safety risk pre-control based on three-levels nested management mode. China Saf. Sci. J. 2013, 23, 102–107. [Google Scholar]
- Jia, H.S.; Pan, K.; Li, D.F.; Liu, S.W.; Lv, X.L.; Fang, Z.Z.; Jin, M. Roof fall mechanism and control method of roof with weak interlayer in mining roadway. J. China Univ. Min. Technol. 2022, 51, 67–76+89. [Google Scholar]
- Chen, H.; Wang, M.; Yan, F.; Qi, C. Theoretical model for evolution of plastic zone of rock mass around deep tunnels and its comparison with in-situ observation. Chin. J. Geotech. Eng. 2022, 44, 1855–1863. [Google Scholar]
- Dowon, P.; Michalowski, R.L. Tunnel roof stability in soft rock with tension cutoff. In Proceedings of the GeoShanghai 2018 International Conference: Tunnelling and Underground Construction, Shanghai, China, 27–30 May 2018. [Google Scholar]
- He, M.C.; Xu, N.X.; Yao, A.J.; Wang, J.C. Theory of SCSTKP in Soft Rock Roadway. J. China Univ. Min. Technol. 2000, 10, 107–111. [Google Scholar]
- Su, Y.H.; He, M.C.; Gao, Q. Application of Rosenblueth method in evaluating stability reliability of anchor-shotcrete net support system for soft-fractrue surrounding rock. Chin. J. Geotech. Eng. 2004, 26, 378–382. [Google Scholar]
- Paraskevi, Y.-M.; Sofianos, A.I. Μulti-jointed stratified hard rock roof analysis and design. Int. J. Rock Mech. Min. Sci. 2018, 106, 96–108. [Google Scholar]
- Rami, A.; Walton, G.; Sinha, S. Understanding roof deformation mechanics and parametric sensitivities of coal mine entries using the discrete element method. Int. J. Min. Sci. Technol. 2020, 30, 123–129. [Google Scholar]
- Oleksandr, K.; Krykovska, V.; Skipochka, S. Interaction of rock-bolt supports while weak rock reinforcing by means of injection rock bolts. Min. Miner. Depos. 2021, 15, 8–14. [Google Scholar]
- Frenelus, W.; Peng, H.; Zhang, J. Seepage Actions and Their Consequences on the Support Scheme of Deep-Buried Tunnels Constructed in Soft Rock Strata. Infrastructures 2024, 9, 13. [Google Scholar] [CrossRef]
- Eren, K.; Demir, S. Use of Rock Mass Rating (RMR) values for Support Designs of Tunnels excavated in Soft Rocks without Squeezing Problem. GeoScience Eng. 2019, 65, 1–17. [Google Scholar]
- Ivan, S.; Sakhno, S.; Skyrda, A.; Popova, O. Numerical modeling of controlling a floor heave of coal mine roadways with a method of reinforcing in wet soft rock. Geofluids 2022, 2022, 3855799. [Google Scholar]
- Qin, D.; Wang, X.; Zhang, D.; Chen, X. Study on Surrounding Rock-Bearing Structure and Ass ociated Control Mechanism of Deep Soft Rock Roadway Under Dynamic Pressure. Sustainability 2019, 11, 1892. [Google Scholar] [CrossRef]
- Hao, J.; Li, X.; Song, Y.; Zhang, P.; Liu, H. Analysis of mining roadway with large deformation of broken soft coal and research on supporting technology: A casestudy in Xin an coal mine, China. Eng. Fail. Anal. 2021, 130, 115–163. [Google Scholar] [CrossRef]
- Kang, H. Critical circle theory of roadway enclosure. Mech. Eng. 1997, 1, 35–37. [Google Scholar]
- Gou, P.; Hou, C. Stability analysis of the roof of extraction opening supported with bolts. J. China Coal Soc. 1999, 24, 466–470. [Google Scholar]
- Liu, H.; Wu, X.; Hao, Z.; Gu, X. Evolution law and stability control of plastic zones of retainedentry of working face with double roadways layout. J. Min. Saf. Eng. 2017, 34, 689–697. [Google Scholar]
- Ma, N.J.; Zhang, W.L.; Li, J.; Lian, X.; Ren, J. Analysis and evaluation of essential factors for rock burst mechanism. J. Min. Sci. Technol. 2021, 6, 651–658. [Google Scholar]
- Lee, Y.; Yim, J.; Hong, S.; Min, K.B. Application of artificial neural network for determining elastic constants of a transversely isotropic rock from a single-orientation core. Int. J. Rock Mech. Min. Sci. 2022, 160, 105277. [Google Scholar] [CrossRef]
- Savvides, A.A.; Antoniou, A.A.; Papadopoulos, L.; Monia, A.; Kofina, K. An estimation of clayey-oriented rock mass material properties, sited in Koropi, Athens, Greece, through feed-forward neural networks. Geotechnics 2023, 3, 975–988. [Google Scholar] [CrossRef]
- Yuyang, W.; Yong, L.; Chen, W.; Lianchang, H.; Guanghai, L. Mechanics of Bottom Bulge and Control Technology in Deep Mine Soft Rock Roadway. Chin. J. Undergr. Space Eng. 2021, 17, 411–418. [Google Scholar]
- Hongjian, L.; Wuchuan, P.; Weichen, Q. Study on softening constitutive model of diatomaceous soft rock based on strain space. Rock Soil Mech. 2006, 27, 1861–1866. [Google Scholar]
- Bing, C.; Yaohui, Z.; Yin, Y. Application of New Inorganic Foam Material in Top coal Caving Region Filling. Saf. Coal Mines 2016, 47, 124–127. [Google Scholar]
- GB/T 1346-2011; Test Methods for Water Requirement of Normal Consistency, Setting Time and Soundness of the Portland Cement. Chinese Standard: Beijing, China, 2011.


| Chemical Composition | CaO | SiO2 | Fe2O | Al2O3 | MgO | Na2O |
|---|---|---|---|---|---|---|
| content | 50–70 | 15–30 | 2–4 | 4–6 | 0.006–0.01 | 0.5–1 |
| Density | Strength Level | Setting Time/min | Rupture Strength | Compressive Strength | |||
|---|---|---|---|---|---|---|---|
| Initial Setting | Final Setting | 3 d | 28 d | 3 d | 28 d | ||
| 3.11 | 42.5 | 97 | 160 | 4.9 | 8.1 | 26.1 | 42.8 |
| Water–Solid Ratio | Foam Content/%(C) | Initial Setting Time/min | Final Setting Time/min |
|---|---|---|---|
| 1:1 | 1.5 | 6 | 14 |
| 2 | 7 | 15 | |
| 2.5 | 8 | 18 | |
| 3 | 9 | 18 | |
| 3.5 | 9 | 19 | |
| 1.5:1 | 1.5 | 10 | 16 |
| 2 | 10 | 18 | |
| 2.5 | 11 | 20 | |
| 3 | 11 | 22 | |
| 2:1 | 1.5 | 12 | 19 |
| 2 | 12 | 20 | |
| 2.5 | 14 | 22 | |
| 3 | 16 | 24 | |
| 3.5 | 16 | 25 | |
| 2.5:1 | 1.5 | 28 | 32 |
| 2 | 29 | 34 | |
| 2.5 | 31 | 37 | |
| 3 | 32 | 40 | |
| 3.5 | 33 | 40 | |
| 3:1 | 1.5 | 37 | 53 |
| 2 | 38 | 55 | |
| 2.5 | 42 | 57 | |
| 3 | 44 | 58 | |
| 3.5 | 47 | 60 |
| Water–Solid Ratio | Foam Content/wt%(C) | Uniaxial Compressive Strength/MPa | ||
|---|---|---|---|---|
| 1 d | 7 d | 28 d | ||
| 1:1 | 1.5 | 3.28 | 4.28 | 4.98 |
| 2 | 2.77 | 4.11 | 4.81 | |
| 2.5 | 2.46 | 4.04 | 4.78 | |
| 3 | 1.92 | 3.92 | 4.56 | |
| 3.5 | 1.78 | 3.72 | 4.49 | |
| 1.5:1 | 1.5 | 1.88 | 2.98 | 3.89 |
| 2 | 1.78 | 2.72 | 3.42 | |
| 2.5 | 1.63 | 2.36 | 3.19 | |
| 3 | 1.59 | 2.38 | 2.99 | |
| 3.5 | 1.52 | 2.21 | 2.84 | |
| 2:1 | 1.5 | 1.56 | 1.83 | 2.09 |
| 2 | 1.37 | 1.78 | 1.99 | |
| 2.5 | 1.25 | 1.36 | 1.86 | |
| 3 | 1.19 | 1.27 | 1.76 | |
| 3.5 | 1.09 | 1.19 | 1.49 | |
| 2.5:1 | 1.5 | 1.29 | 1.59 | 1.89 |
| 2 | 1.18 | 1.49 | 1.62 | |
| 2.5 | 1.09 | 1.36 | 1.44 | |
| 3 | 0.98 | 1.29 | 1.23 | |
| 3.5 | 0.87 | 1.14 | 1.02 | |
| Labor Cost | Economic Cost | ||||
|---|---|---|---|---|---|
| Materials | Unit Price | Filling Cost | |||
| Log pack | 4 people | Pit timber | 800 CNY/m3 | 800 CNY/m3 | |
| Material filling | 2 people | Foam filling material | 2000 CNY/t | 500 CNY/m3 | 545 CNY/m3 |
| High-quality waterproof canvas bag | 300 CNY/per piece | 45 CNY/m3 | |||
Disclaimer/Publisher’s Note: The statements, opinions and data contained in all publications are solely those of the individual author(s) and contributor(s) and not of MDPI and/or the editor(s). MDPI and/or the editor(s) disclaim responsibility for any injury to people or property resulting from any ideas, methods, instructions or products referred to in the content. |
© 2025 by the authors. Licensee MDPI, Basel, Switzerland. This article is an open access article distributed under the terms and conditions of the Creative Commons Attribution (CC BY) license (https://creativecommons.org/licenses/by/4.0/).
Share and Cite
Li, C.; Nan, H.; Zhang, W. Research and Application of Foam Filling Material in Soft Rock Roadways. Appl. Sci. 2025, 15, 520. https://doi.org/10.3390/app15020520
Li C, Nan H, Zhang W. Research and Application of Foam Filling Material in Soft Rock Roadways. Applied Sciences. 2025; 15(2):520. https://doi.org/10.3390/app15020520
Chicago/Turabian StyleLi, Changyu, Hua Nan, and Wenzhou Zhang. 2025. "Research and Application of Foam Filling Material in Soft Rock Roadways" Applied Sciences 15, no. 2: 520. https://doi.org/10.3390/app15020520
APA StyleLi, C., Nan, H., & Zhang, W. (2025). Research and Application of Foam Filling Material in Soft Rock Roadways. Applied Sciences, 15(2), 520. https://doi.org/10.3390/app15020520