Article

The Effectiveness of Unimodal and Multimodal Warnings on Drivers’ Response Time: A Meta-Analysis

1
Department of Psychology, Tsinghua University, Beijing 100084, China
2
School of Psychology, Northwest Normal University, Lanzhou 730070, China
3
School of Psychology, Nanjing Normal University, Nanjing 210024, China
4
Department of Special Education, College of Education, The University of Texas at Austin, Austin, TX 78712, USA
*
Author to whom correspondence should be addressed.
These authors contributed equally to this work.
Appl. Sci. 2025, 15(2), 527; https://doi.org/10.3390/app15020527
Submission received: 20 December 2022 / Revised: 6 February 2023 / Accepted: 8 February 2023 / Published: 8 January 2025
(This article belongs to the Special Issue Ergonomics and Human Factors in Transportation Systems)

Abstract

:
Driving warning systems are of great help in notifying emergencies. Based on the results of former studies as well as the multisensory integration effect (MIE), the current meta-analysis investigated the effectiveness of utilizing unimodal (i.e., auditory, visual, and tactile) and multimodal (i.e., bimodal and trimodal) driving warning systems in drivers’ response time. Sixty eligible articles representing 308 individual studies were included in this meta-analysis. The results showed: First, both auditory warnings (pooled Hedges’ g = 0.98, 95% CI: 0.34 to 1.61, p < 0.01) and tactile warnings (pooled Hedges’ g = 0.77, 95% CI: 0.22 to 1.32, p < 0.01) were found to reduce the response time significantly compared to no warning, but visual warnings did not produce significant benefit; Second, tactile warnings outperformed the visual warnings (pooled Hedges’ g = 0.74, 95% CI: 0.11 to 1.37, p < 0.05); Third, auditory-tactile bimodal warnings surpassed unimodal warnings (p < 0.05); Fourth, drivers’ response time under trimodal warning conditions were shorter than that under bimodal warning conditions but not in a significant level. Overall, the results support multisensory redundant signal effect hypothesis in multimodal conditions. Current study provides a quantitative understanding of the effectiveness of driving warnings and could contribute to the design of related technologies.

1. Introduction

1.1. The Traffic Hazards

Traffic accidents cause approximately 1.3 million global deaths and a 3% gross domestic product (GDP) loss in most countries each year [1], indicating the cruciality of road safety research in accident prevention and reducing economic losses worldwide. With human error being one of the major causes of traffic accidents [2], the use of driving warning systems has become an indispensable part of advanced driver-assistance systems (ADAS) in preventing road accidents. These driving warning systems alert drivers upon detection of risky situations, such as driver fatigue, tailgating, or other potential incoming risks when driving, aiming to warn drivers ahead of time to prevent possible accidents. In particularly, these systems are mainly developed to improve driving safety by the initiation of warnings signals via the visual, auditory, and tactile sensory modalities; including automatic emergency braking, adaptive cruise control, blind spot warnings, and forward collision warnings, etc. [3,4,5].

1.2. Unimodal Warning Systems

New in-vehicle technologies are constantly developing, especially in driving warning systems. As early as 1992, Horowitz and Dingus discussed about the human factors that had to be taken into consideration when designing warning systems [6]. Many researchers have later conducted plenty of experiments to explore the best unimodal or multimodal (including bimodal and trimodal) sensory modality for delivering warning signals to drivers [7,8,9,10].
Among the three main unimodal warning systems, unimodal visual, auditory, and tactile warning systems each has their own benefits and drawbacks when it comes to their effectiveness in alerting drivers. Visual warnings contain concrete and directional information, making it easier for drivers to determine the direction of a specific upcoming situation (e.g., a pedestrian stepping off the pavement). However, since the premise of visual information processing is seeing the signal, drivers might fail to see a visual warning signal if it is presented outside of their visual fields. Even if the signals are presented in a potentially noticeable location, being in a complex driving environment would possibly induce drivers’ visual overload [11], which further hinders driving safety. Additionally, inattentional blindness, or “looked-but-failed-to-see-errors”, might occur if the driver is intently focused on the road, resulting in poor sensation and perception of the visual warning signals [12,13,14].
Auditory warnings contain useful information (e.g., notification of steering wheel control and brake request) without taking up drivers’ visual resources; yet, two shortcomings of auditory warnings have been recognized. First, inattentional deafness is likely to occur under high workload conditions, in which drivers listen but fail to perceive auditory information [15,16]. Second, noises in the driving environment, such as background music or the sound of the radio, would impair the efficacy of auditory warnings [17].
As for tactile warnings, signals are delivered to drivers through direct body contact. The mediums of tactile information transmission include but not limited to steering wheel, dashboard, seat belt, seat, pedal, as well as drivers’ clothes and wearable devices [18]. By adjusting the vibrating location, intensity, and size of the contact area, drivers are believed to be sufficiently informed by the tactile warnings with useful information [19,20,21]. Yet, the turbulence caused by driving on a rough road and the thickness of drivers’ clothing are common exogenous factors which could reduce the effectiveness of tactile warnings [22].

1.3. Multimodal Warning Systems and Related Theories

The discussion on the characteristics and effectiveness of each unimodal warnings has always been a major debate. Nevertheless, the development of multisensory warning systems has enlightened another conversation on understanding the relationship between the effectiveness of warning signals and the number of applied sensory modalities within the system.
In the field of neuroscience and ergonomics, researchers found that individuals tend to respond faster to a signal that is presented through multiple sensory modalities rather than one sensory modality; this facilitatory effect on response time is called the multisensory integration effect (MIE), also known as multisensory enhancement ([23,24,25,26]). Many driving-related research showed that drivers’ response time to warning signals improves as the number of applied modalities increases in the driving warning system, as suggested by the MIE. Specifically, Politis and colleagues (2017), and Yun and Yang (2020) both found multimodal warning showed better performance in response time than unimodal warnings, with visual-only warning considered as the worst in driving take-over request situations [10,27]. However, some studies suggested that the comparisons between the two did not showed substantial evidence in supporting the benefits of multimodal warnings relative to unimodal warnings. [28,29]. Particularly, Yoon and colleagues (2019) found that there was no significant difference in drivers’ response time between multimodal and unimodal warnings (except for visual warning); despite that the response time showed a decreasing trend as the number of modalities increases [29]. These thus raised the ambiguity that whether MIE is robust enough in improving the effectiveness of driving warning systems, and what the relationship is between MIE and the number of applied modalities.
To solve this ambiguity, a meta-analysis is necessary to integrate the findings on the relationship between the observed response time and the number of applied warning modalities. The current study also raised two interpretations detailed below to illustrate this relationship and tried to provide a more concrete understanding of MIE with driving as the exemplar.

1.3.1. Redundant Signal Effect

According to the redundant signal effect (RSE), a facilitatory effect can be found when it comes to humans’ perception and reaction to multiple signals as compared to one signal [30]. The RSE can be represented by two models: the coactivation model and the race model [31]. The coactivation model believes that information from multiple sensory modalities merges into a single criterion before being further processed by the brain; whereas the race model holds the opinion that information would not be interfered with by one another, but elicit motivation to each modality to give rise to the facilitatory effect. With the development of neuroscience, researchers found that even though the information processing of the individual sensory modality lies within different brain regions, multisensory information processing appears to execute in the independent superior colliculus region [32,33]. This suggested that information processing from multiple sensory modalities is mostly in line with the coactivation model.
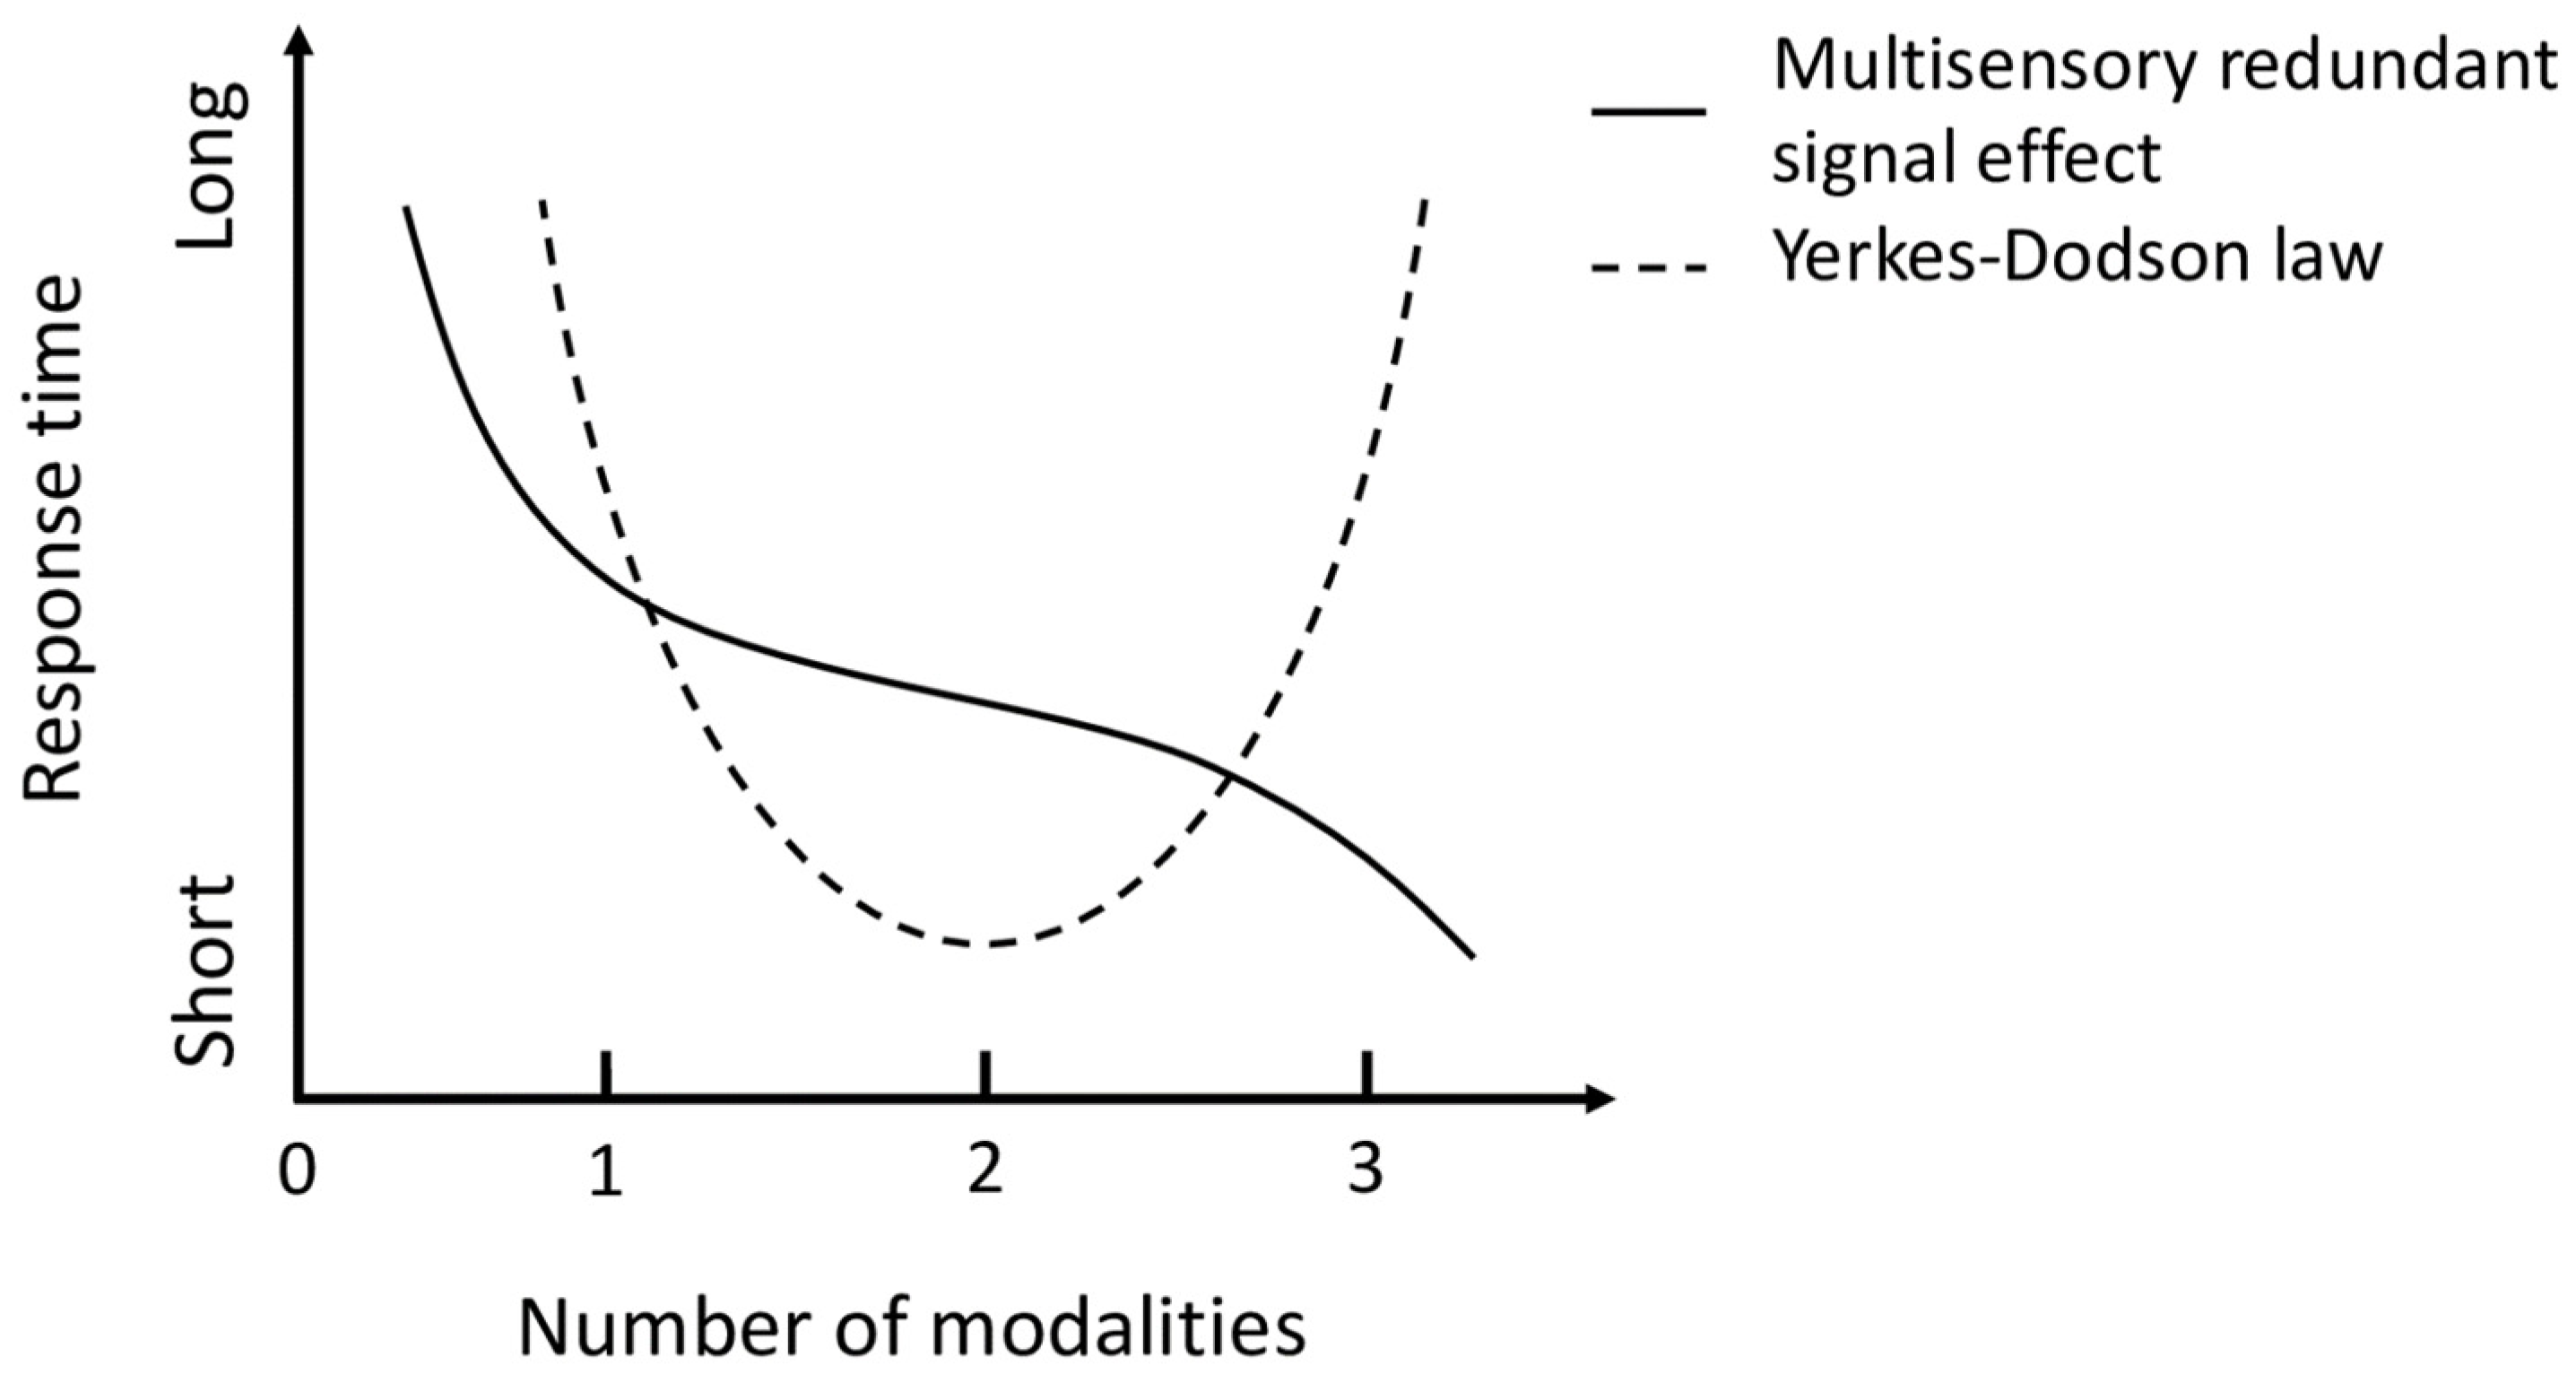
From the perspective of multisensory redundant signal effect (RSE), the multisensory integration effect (MIE) allows multimodal driving warning systems to elicit quicker information processing in drivers’ brains [26,34,35], reducing drivers’ response time in avoiding potential risks (see left panel of Figure 1). Moreover, the use of multimodal driving warning systems provide drivers with supplementary information if one modality fails to carry its function [36], assisting them with additional support from other modalities.

1.3.2. Yerkes-Dodson Law

While it is commonly believed that multimodal warnings can better facilitate drivers’ response time as compared to unimodal warnings [37], some studies have discovered that shorter response time was found in bimodal warning conditions rather than trimodal warning conditions [29]. These findings are similar to the relationship between performance and arousal level as illustrated by the Yerkes-Dodson law (YDL). Researchers have proven that both individuals’ arousal level as well as task difficulty influence individuals’ task performance; when the task is neither too simple nor too difficult, the best performance is found when individuals’ arousal is at a medium level [38]. Thus, the multisensory integration effect (MIE) could potentially peak only when the optimal number of applied modalities is used, similar to the trend as YDL suggested (see right panel Figure 1).

1.4. Central Research Questions

As the above, the type of sensory modality and the number of applied sensory modalities in a driving warning system are two major factors influencing drivers’ response to a warning signal. In addition, whether applying more modalities in a driving warning system actually brings more benefits to drivers remains uncertain. The current study aimed to explore and compare the effectiveness of driving warning systems in a holistic perspective using meta-analysis. To fill these knowledge gaps, the current study asked three layers of research questions to reveal the impact of unimodal and multimodal warnings on driver’s response time.
Question 1: Does each of the three unimodal warning systems (i.e., visual, auditory, and tactile warning systems) facilitates drivers’ response time in a significant level compared to no warning condition?
Although most studies proved that equipping a warning system would always bring benefits in improving driving safety, some studies indicated that drivers’ response time under an unimodal warning condition was even longer than the no warning condition [7,39]. It is therefore crucial for us to get a better understanding of the basics before proceeding to further analyses.
Question 2: Which unimodal warning improves drivers’ response time to the best degree?
With the pros and cons of unimodal visual, auditory, and tactile warning systems as mentioned above, it would be valuable to better conclude the modality that can best facilitate drivers’ response time. According to Ferrier [40], the information processing of visual, auditory, and tactile signals occurs in different brain regions. Moreover, Ho, Reed, and Spence (2007) believed that nonvisual sensory modalities are better for information processing due to the possible occurrences of poor visibility of the visual signal [36]; also, the processing of tactile information has fewer chances of getting interference as compared to auditory and visual information. Hence, it was hypothesized that the tactile might be the best sensory modality for delivering warning signals, where tactile resources are least consumed in a driving scenario and are less likely to be interfered by other factors.
Question 3: How robust in the multisensory integration effect (MIE), and what is the relationship between MIE and the number of applied modalities in a driving warning system?
As mentioned above, although MIE has been commonly acknowledged when comparing multimodal warnings with unimodal warnings [23,24,25,26], several research findings still suggested contradicting evidences that showed a longer response time in the application of multimodal warnings in comparison to unimodal warnings [28,41]. Furthermore, with both longer and shorter response time being observed in the trimodal warning condition relative to bimodal condition, it is unclear whether the effectiveness of trimodal warnings exceeds bimodal warnings significantly [8,29]. Therefore, the relationship between MIE and the number of applied modalities could potentially show a trend as suggested by either the multisensory RSE, where drivers’ response time is negatively correlated with the number of modalities applied in a driving warning system; or as conveyed by YDL, where a medium-level (i.e., bimodal) warning would best facilitate drivers’ performance (i.e., response time). With the fact that multisensory information can facilitate information processing in human brains, the current study hypothesized that multimodal driving warning system can better facilities drivers’ response time in comparison to unimodal warnings, and it is more possible for MIE to show a trend as described by multisensory RSE (i.e., response time decreases as the number of applied modalities increased) (see Figure 2).
Given the pros and cons of each unimodal and multimodal warning systems, as well as the contradictory results of the effect under each kind of warnings on drivers’ response time, a meta-analysis was utilized to integrate the statistical results of former studies for two major important motivations: Theoretically, the relative warning benefits of unimodal and multimodal warnings can contribute to the understanding of multisensory RSE [25]; practically, the statistical results can guide the technical design of the current driving warning systems and future take-over requests of autonomous vehicles [42,43]. To evaluate drivers’ performance, drivers’ task response time was used as the dependent variable in the meta-analysis, and the types and numbers of sensory modality of warning systems were used as the independent variables.

2. Method

To systematically analyze the effectiveness of unimodal and multimodal (including bimodal and trimodal) driving warning systems, the current meta-analysis integrated results from previous independent research, increasing the sample size and reliability of the findings to further explore which type or combination of warning systems is the most effective in reducing drivers’ response time.

2.1. Search Strategy and Selection Criteria

A three-step process was utilized to identify studies that explored the relationship between different types of driving warning systems. Firstly, a keyword search was performed for articles retrieval, and the search time span was from 1990 to 2021. The chosen databases for the retrieval process included the Web of Science, ProQuest Dissertations and Theses, Institute of Electrical and Electronics Engineers (IEEE), and PsycInfo databases, for which the keyword “(Warn* OR alert* OR cue* OR FCW*) AND (driv*) AND IF (visual OR audi* OR tactile OR haptic)” was used. Through manual search, additional journals and conference proceedings, technical reports, thesis and dissertations on Human Factors, Human Computer Interaction, Ergonomics, Accident Analysis & Prevention were also considered. Secondly, to further ensure a greater inclusion of research studies, a keyword search on Chinese articles was also performed with the use of “visual” (“视觉”), “tactile” (“触觉”), “auditory” (“听觉”), “Warn* or alert or cue” (“预警” or “警告”or “警示” or “线索” or “提示”), and “driv*” (“驾驶” or “驾驶人” or “驾驶员” or “司机”) as keywords. The search of Chinese articles was performed in the Wanfang and CNKI databases.
The initial search retrieved 9661 articles. To guarantee the quality of research prior to the data extraction and final analysis, a set of selection criteria was defined. The inclusion criteria consisted of the following: (1) The literature should be an empirical research but not a literature review; (2) The field of study should be driving-related, either conducted under a simulated or on-road driving setting; (3) The study should be compared under the same research environment; (4) The dependent variables should at least include response time, which can also be noted as reaction time; (5) The results of the study should report the relevant indicators of Cohen’s d or Hedges’ g for calculating the effect size, and the results should be reported in the forms of mean and standard deviation or standard error of the mean, t-test between two groups [44], or F test between two groups [45]. During the selection process, duplicated studies were first removed, followed by a review on the title and abstract regarding the relevance of the articles. Then a complete review on each article was conducted to finalize the set of included articles.
The authors carefully scrutinized 711 identical articles using the above-mentioned specified criteria. After eliminating 651 irrelevant articles, a total of 60 articles (308 studies) were included in the final meta-analysis (see Figure 3). Table 1 summarizes the driving tasks descriptions and simulation fidelity of the included publications. These tasks include the classic car following task, lane change task, take-over request task, etc. As is shown in Table 1, the included driving tasks cover most of the commonly used driving tasks, which demonstrates a wide coverage of publications and research methodologies.

2.2. Data Extraction

Data extraction included accurately obtaining the title, author(s), year of publication, sample size, age and gender of the participants, presenting location of the warning signals, type of driving setting (on-road/driving simulation), as well as the result data of drivers’ task response time. For those 10 articles (out of the initial 9661 articles) with incomplete data for meta-analysis, emails and phone calls were made to contact authors in an effort to make all eligible papers included in the meta-analysis as much as possible. We only received 2 replies saying that the original data cannot be found. Thus, no data included in the current study were collected through emails or phone calls. To estimate and control this potential file drawer problem, we conducted the Failsafe N estimates (as shown in Table 2 Column of “Failsafe-N estimates”). The results shown in Table 2 suggest that there do not appear to be susceptible to publication bias. As per Table 2, many of the estimates in the current meta-analysis study are quite robust. For instances, especially for those rows which contain either * or ** with statistical significance, at least 211 additional null-effect studies would be required to nullify the reported statistically significant differences in response time between warning modalities. Thus, the chances of the findings in current study to be falsified is confidently unlikely as a result of the 10 publications who failed to respond to our requests for data. The conclusion of low risk of file drawer problem is because of (1). The large number of Failsafe N estimates in Table 2; (2). 10 articles only constitute a merely small portion (0.10%) of the initial 9661 articles; (3). We made tremendous efforts to search the literature database, successfully find a large number of 60 articles with coverage of technical reports, conference proceedings and journal articles.

2.3. Statistical Analysis Strategies

Cohen’s d [90], a common format of standardized mean difference (SMD), is used as the summary indicator when processing continuous result data; however, this conclusive method showed a slight deviation in small-scale studies. Therefore, the effect size of the current meta-analysis was measured using Hedges’ g, which is adjusted for small-sample size bias and visualized using the forest plot [91,92,93]. A value of 0.2, 0.5, 0.8 of Cohen’s d and Hedges’ g represents a small, medium, and large effect size respectively [94]. Weighted random-effects meta regression models and forest plots were generated using the ROBUMETA package in R [95].
We accounted for statistical dependencies in studies that reported multiple effect sizes from the same sample using Hedges, Tipton, and Johnson’s random effects robust standard error estimate technique [96]. The random-effects robust variance estimation (RVE) methodology is used to attribute the statistical interdependence of various effect sizes from the same sample. By modifying the study standard errors to account for correlations across effect sizes from the same sample, RVE is able to accommodate clustered data. For the calculation of the inter-study sampling variance estimate, the RVE requires an estimate of the mean correlation (ρ) between all pairs of effect sizes inside a cluster. Following the calculation of the average weighted effect size, a forest plot was drawn to provide the summary effect from the random-effects model, as well as the effect sizes extracted from each individual study, displaying the full distribution of effect sizes that made up the average weighted effect size.
The presence and amount of heterogeneity among effect sizes were investigated using the I2 and τ2 statistics. I2 is the percentage of effect size variation caused by non-sampling errors; and τ2 is the between-study variance, which is utilized to conduct random effects analysis. This methodology was proposed by Higgins to overcome the shortcoming of the Q test (sensitive to the number of studies) [97].
Furthermore, since it was expected that the body of literatures described in the current investigation was incidental to a distribution of effects with significant between-studies variance rather than no variability, a random-effects model was chosen over a fixed-effects model [98,99].

2.4. Publication Bias

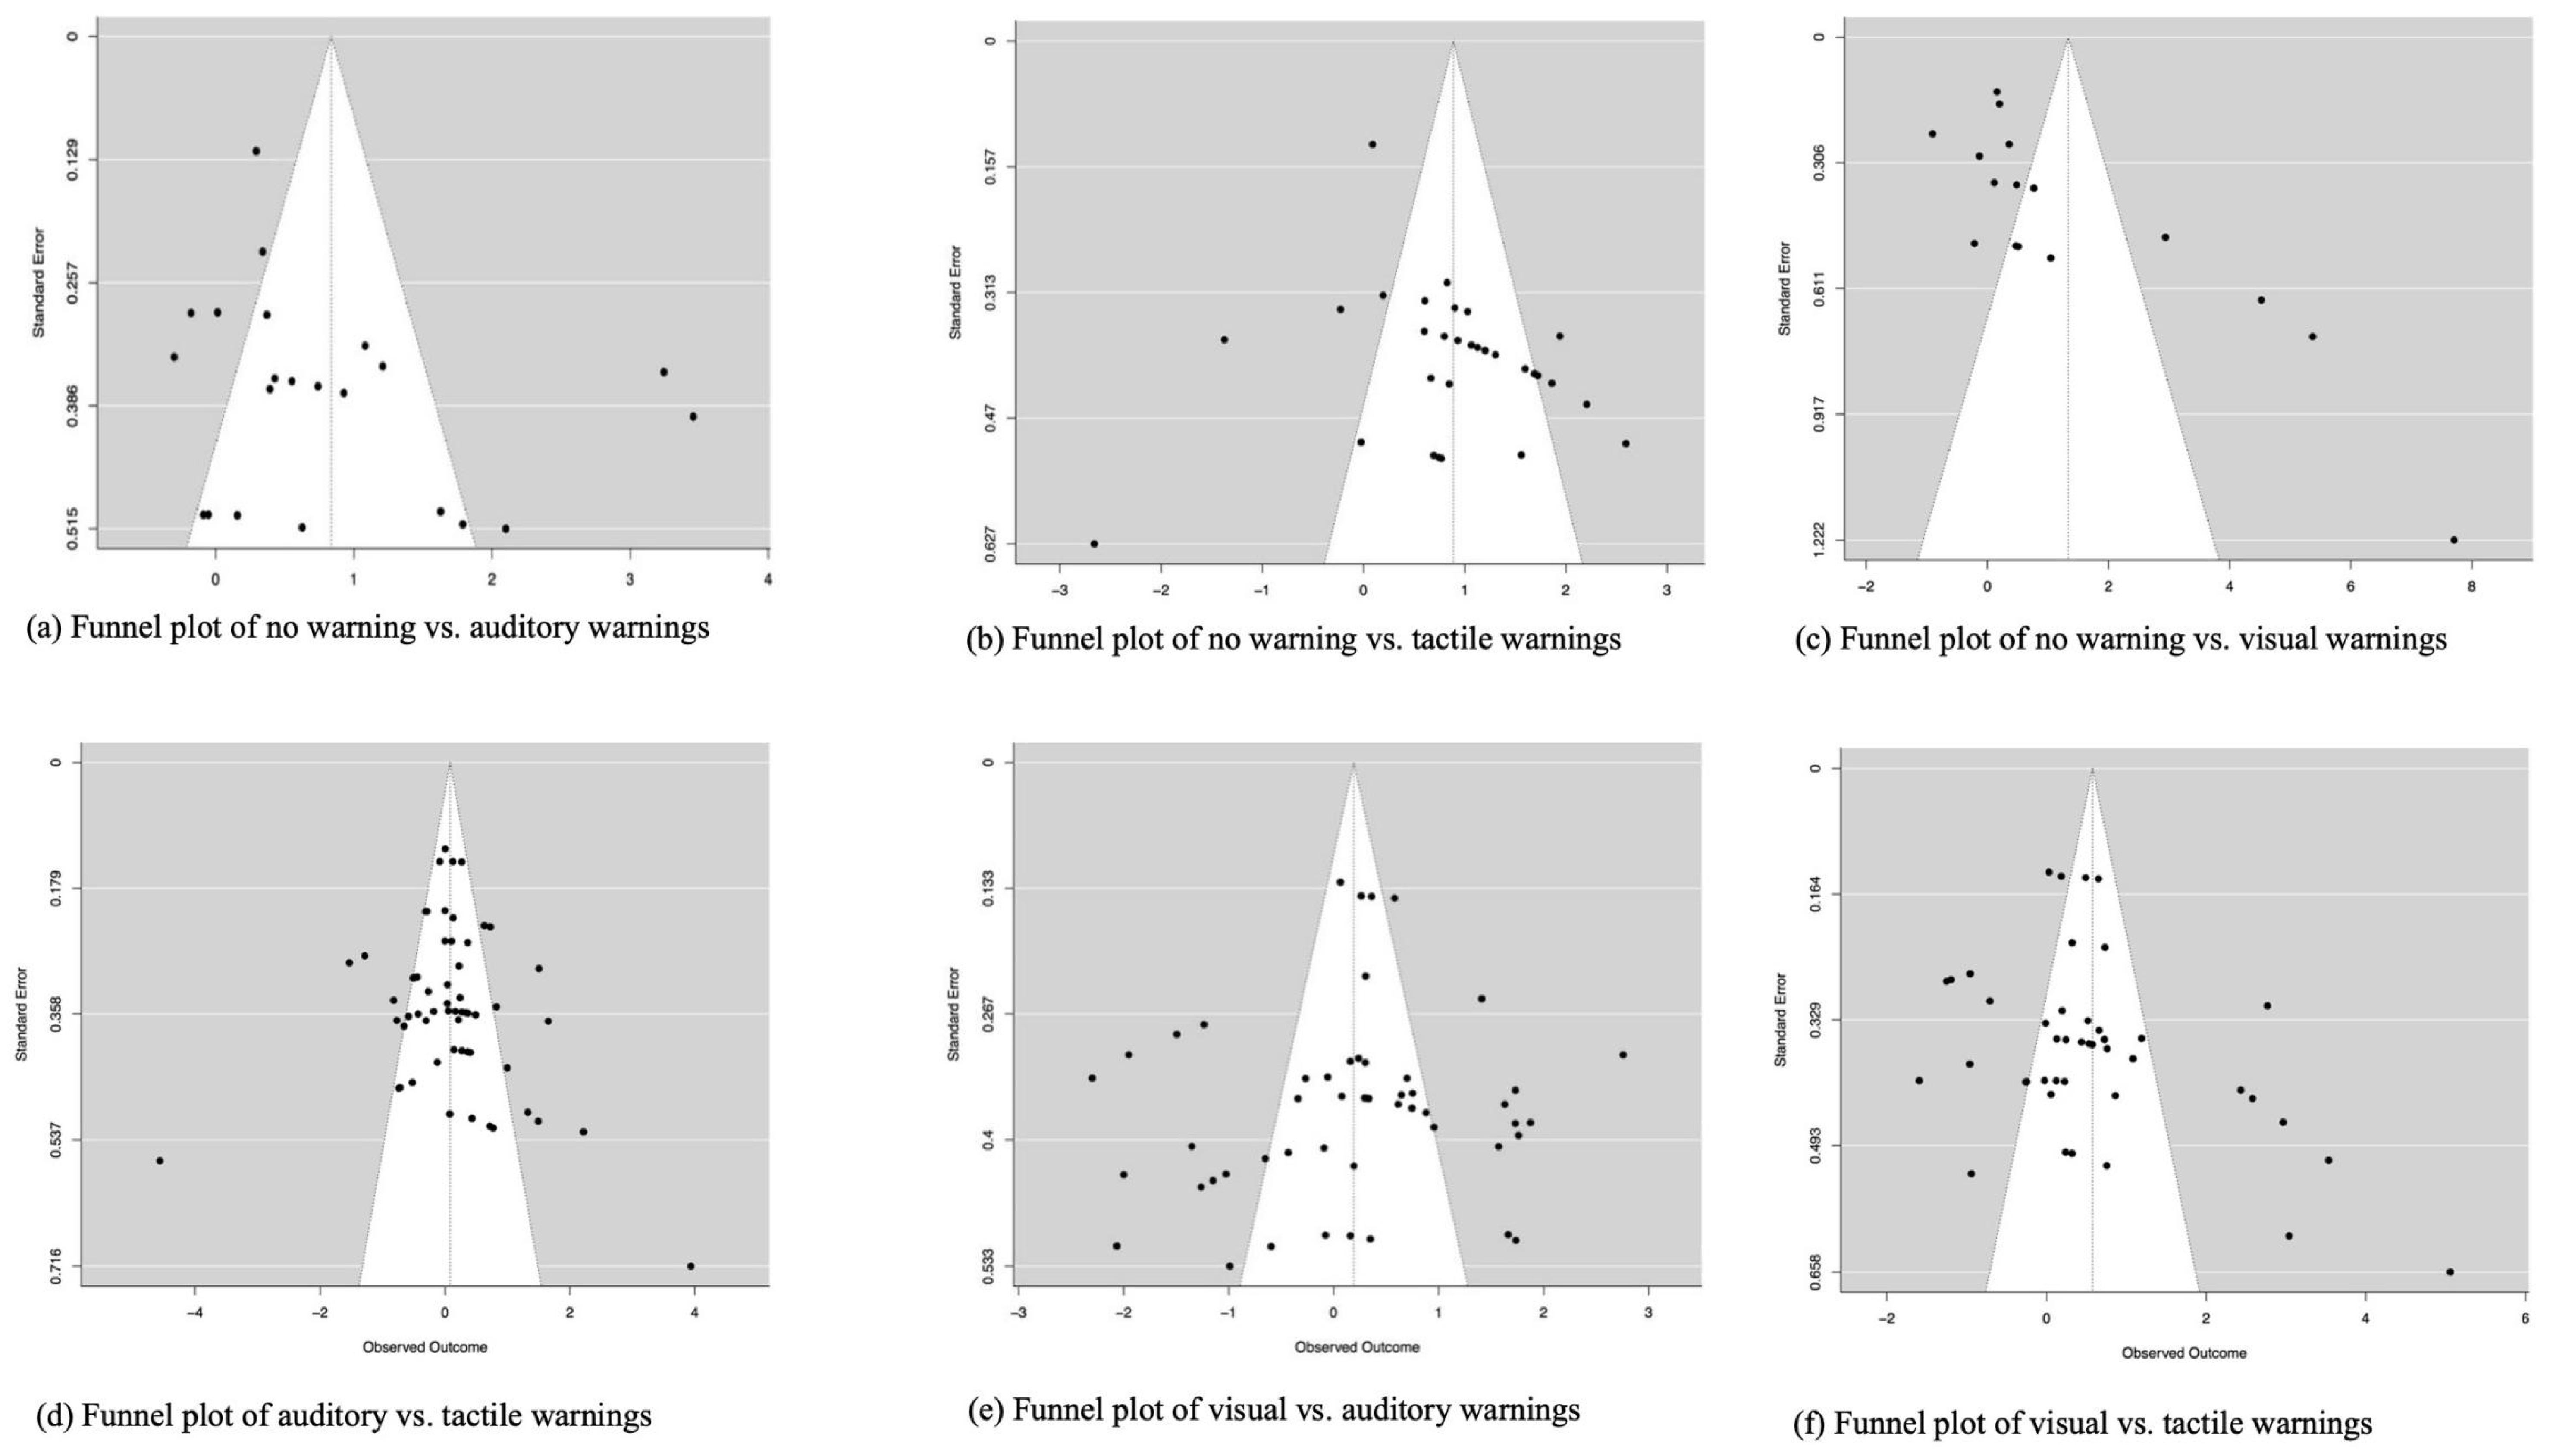
This study used an inverted funnel plot and Egger’s test to present the publication bias [100,101]. Studies distributed symmetrically inside the funnel plot indicates less chance of publication bias. Funnel plots were drawn through Metafor package for R as there was no funnel plot function dependency with ROBUMETA. Funnel plots did not reveal any obvious asymmetrical patterns, while the results of Egger’s test were significant only for the pairs between no-warning versus auditory condition and auditory condition versus tactile condition. The results of these two pairs had no significant changes after excluding the outlier. Taken together, the Egger’s test and funnel plots suggested that there was little influence of publication bias in the data and thus the original dataset was used in all reported analyses. Moreover, sensitivity analyses showed that the findings were robust across different reasonable estimates of ρ.

3. Results

3.1. Effectiveness of Unimodal Warnings

The effectiveness of auditory, tactile, and visual warnings was examined with three individual analyses, where group 1 indicated no-warning condition and group 2 indicated warning condition in each analysis respectively. Consequently, a positive Hedges’ g suggested that the presentation of the warning led to a shorter response time and vice versa. Forest plots of the observed outcomes of these individual studies and the estimated average outcome were generated.
As shown in Figure 4a and Figure 4b, auditory and tactile warnings were found to reduce the response time significantly, with a pooled Hedges’ g of 0.98 (95% CI: 0.34 to 1.61, p < 0.01) and 0.77 (95% CI: 0.22 to 1.32, p < 0.01), respectively. However, the difference between no-warning and visual warning condition did not reach significance (see Figure 4c), with a pooled Hedges’ g of 0.83 (95% CI: −0.50 to 2.16, p = 0.19). Analyses of publication bias are shown in Figure 5a–c.

3.2. Comparisons Between Unimodal Warnings

To compare the effectiveness of auditory, tactile, and visual warnings, three pairwise comparisons were conducted. Visual warning condition was set as group 1 in both comparisons with tactile or auditory warning condition; and auditory warning condition was set as group 1 when comparing with tactile warning condition. A positive Hedges’ g suggested that the response time of group 2 was shorter than group 1. The results implied that the tactile warning outperformed the visual warning (see Figure 6c; pooled Hedges’ g = 0.74, 95% CI: 0.11 to 1.37, p < 0.05), however, no differences were found in the other two pairs. The pooled Hedges’ g of auditory vs. tactile warning condition and visual vs. auditory warning condition were 0.11 (95% CI: −0.40 to 0.61, p = 0.67) and 0.42 (95% CI: −0.12 to 0.97, p = 0.12), respectively (see Figure 6a and Figure 6b). Analyses of publication bias are shown in Figure 5d–f.

3.3. Comparisons Between Unimodal and Multimodal Warnings

3.3.1. Unimodal Versus Bimodal Warnings

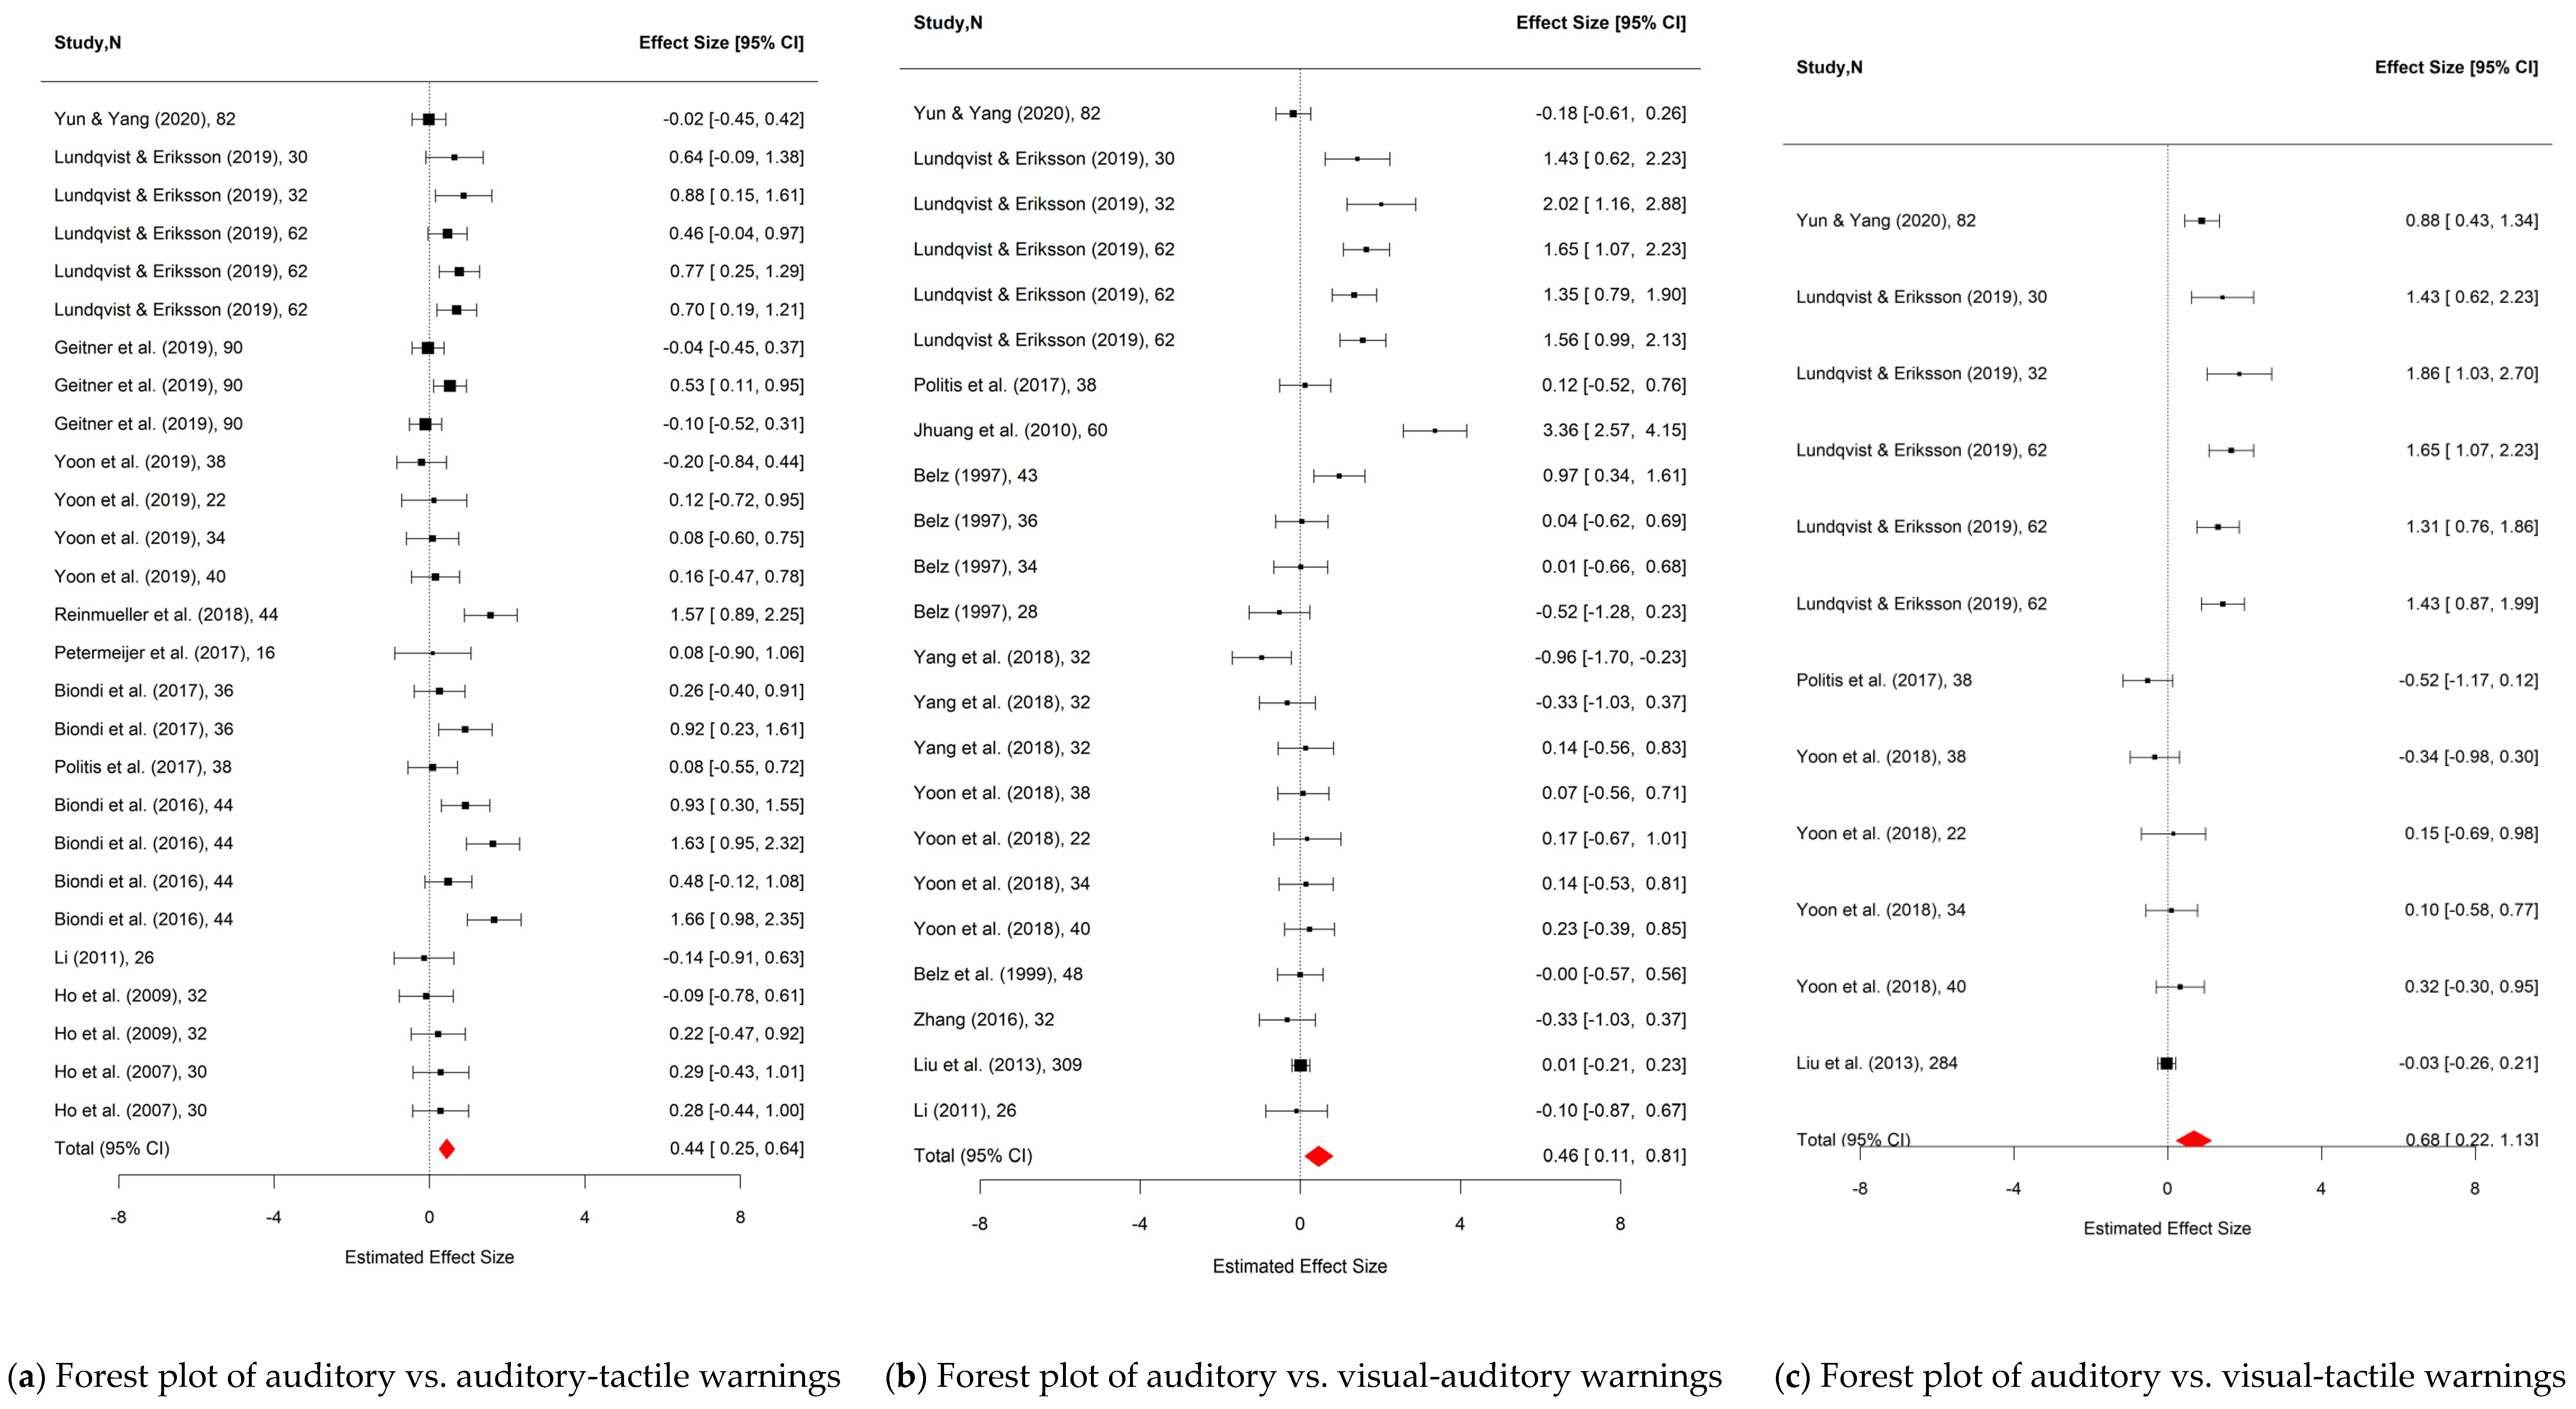
As the previous results showed, only auditory and tactile warning conditions significantly improved drivers’ performance as compared to the no warning condition; therefore, the current meta-analysis included only the auditory and tactile warning conditions as the representative samples of unimodal warnings for the comparison between unimodal and bimodal warnings. A total of six analyses were conducted, and unimodal warning conditions were set as group 1. Results of the two comparisons (i.e., auditory vs. auditory-tactile, and tactile vs. auditory-tactile) indicated that the response time was significantly shorter in bimodal warning conditions than unimodal conditions (see Figure 7a–c). Pooled Hedges’ g and 95% CI of the six comparisons are presented in Table 2. The results of the publication bias are shown in the funnel plots in Figure 8a–f.

3.3.2. Bimodal Versus Trimodal Warnings

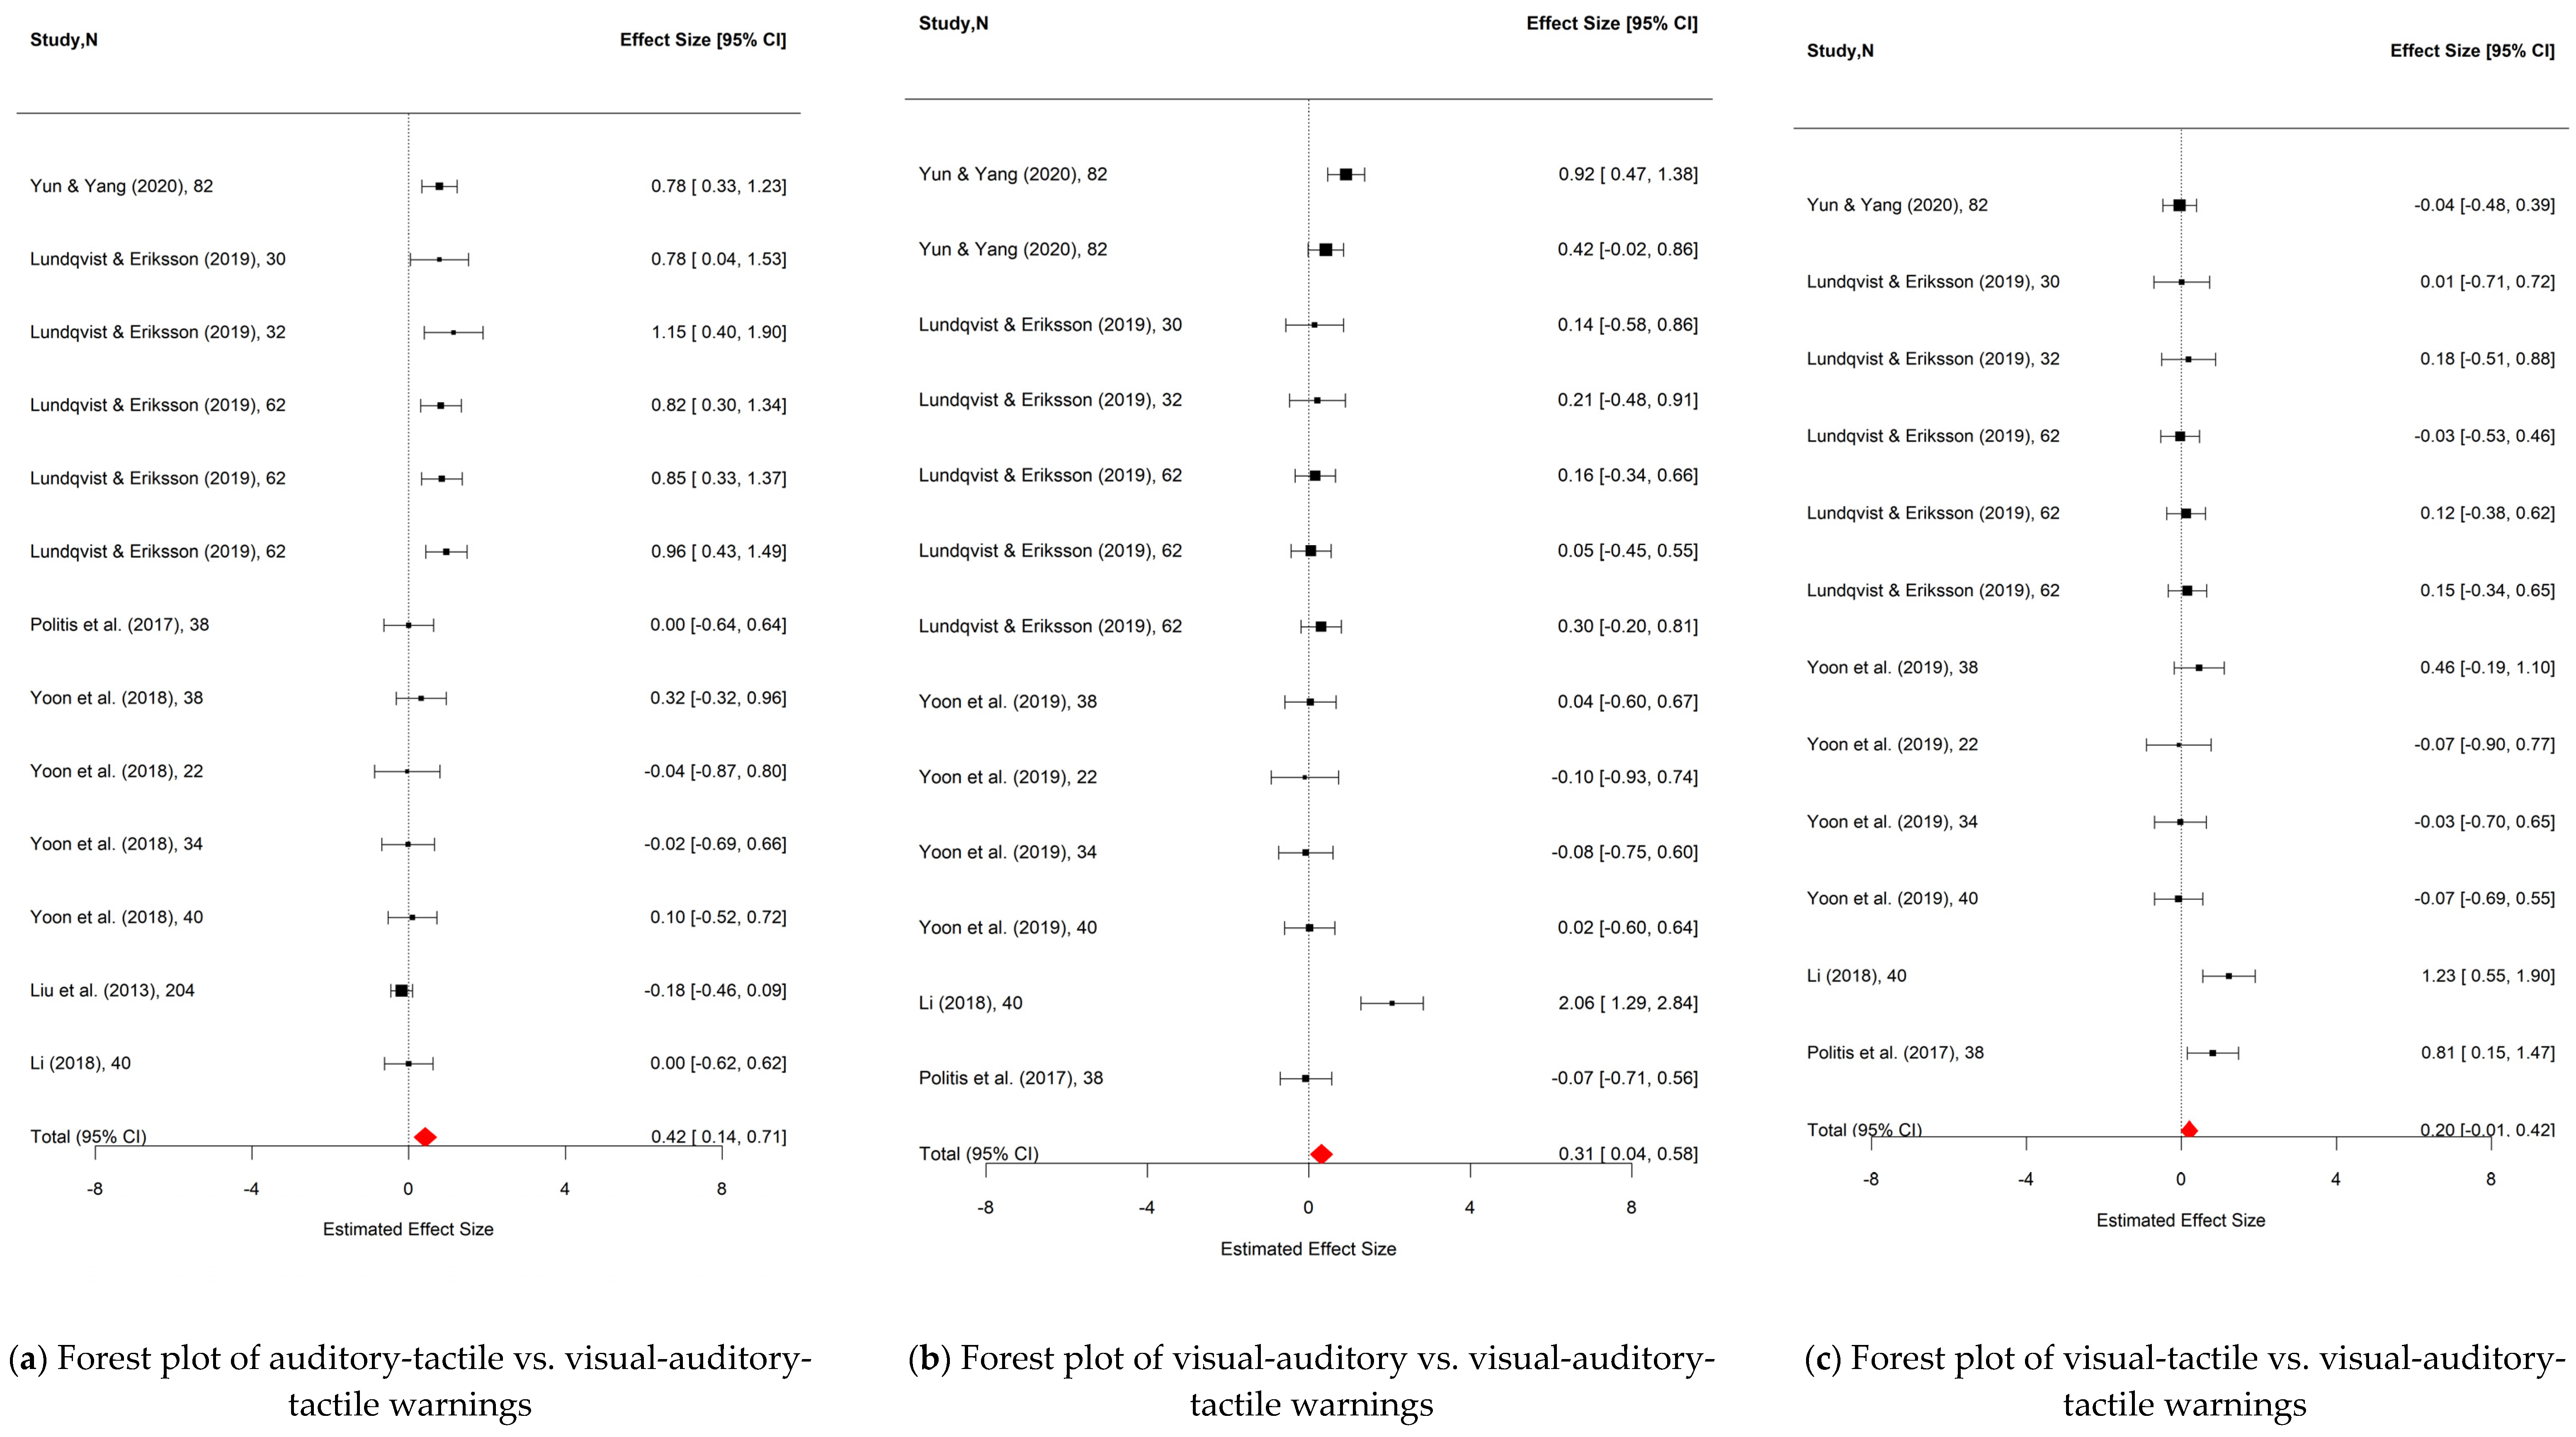
As for the comparisons between bimodal and trimodal warnings, bimodal warning conditions were set as group 1. No significant differences were observed in all three comparisons between the bimodal and trimodal warnings (see Figure 9a–c). The pooled Hedges’ g was 0.54 (95% CI: −0.49 to 1.57, p = 0.22) when visual-auditory warnings met visual-auditory-tactile warnings. As for the two other pairs of comparison, visual-tactile vs. visual-auditory-tactile warnings and auditory-tactile vs. visual-auditory-tactile warnings, the pooled Hedges’ g were 0.40 (95% CI: −0.29 to 1.00, p = 0.18) and 0.26 (95% CI: −0.25 to 0.77, p = 0.25), respectively. Although from a statistical point of view, trimodal warnings did not significantly outperform bimodal warnings, it could be concluded from the forest plots that the response time under trimodal warning conditions were slightly shorter than bimodal warning conditions. Analyses of publication bias are shown in Figure 8–i.
Figure 4. Forest plots of no warning vs. unimodal warning conditions.
Applsci 15 00527 g004
Figure 5. Forest plots of comparisons between unimodal warnings.
Applsci 15 00527 g005
Figure 6. Funnel plots of all analyses among no-warning and unimodal warning conditions.
Applsci 15 00527 g006
Figure 7. Forest plots of unimodal warning vs. bimodal warning conditions.
Applsci 15 00527 g007
Figure 8. Funnel plots of all analyses among unimodal and multimodal warning conditions.
Applsci 15 00527 g008aApplsci 15 00527 g008b
Figure 9. Forest plots of bimodal warning vs. trimodal warning conditions.
Applsci 15 00527 g009

4. Discussion

To understand the effectiveness of unimodal warnings, individual comparisons between no warning with the three unimodal warnings (i.e., visual, auditory, and tactile) were conducted. Current study then examined whether each unimodal warnings differed significantly in enhancing drivers’ performance by comparing the unimodal warnings against one another. Lastly, various analyses for comparing the effect between unimodal, bimodal, and trimodal warning conditions were conducted.
To summarize this meta-analysis (See Table 2 for overview), first, two unimodal warnings (auditory and tactile) are better than no warning; Second, two combinations of bimodal warnings are better than unimodal warnings, that is, auditory-tactile bimodal warning better than auditory warning, auditory-tactile bimodal warning better than tactile warning; Third, trimodal warnings are only numerically better, but not significantly different from bimodal warnings. These three major findings collectively speak to the multisensory integration effect (MIE). The effect of multisensory integration was observed as a positive trend for the response time reduction and the number of applied modalities in driving warning systems. In addition, a side story in addition to the theory-driven pairwise comparisons and hypothesis testing, tactile unimodal warning is also better than visual unimodal warning.

4.1. The Benefit of Unimodal Warnings

Each individual unimodal warning condition (i.e., visual, auditory, and tactile) was compared with the no-warning condition respectively to determine whether it facilitates drivers’ response time in a significant level. The results showed that the implementation of auditory or tactile driving warning systems could significantly reduce drivers’ response time. However, visual warnings failed to reduce drivers’ response time substantially. Driving is a visually demanding task which requires more than just the visual acuity, contrast sensitivity, and visual field of an individual [102]. With no competition for drivers’ limited visual resources, auditory and tactile warnings appear to be more effective in reducing drivers’ response time because of a lower level of interference [36].
As revealed from our results, the effectiveness of the visual warning system is below expectation, making it crucial for us to understand the rationale behind such observation. One of the important visual abilities is visual attention [102], which can be interfered with by many other factors [20,103]. With drivers often being uncertain as to when and where a critical situation would appear, they are required to constantly focus and adapt to the rapidly changing visual world. This extended visual concentration or focus can lead to visual fatigue. If the visual warning is presented while drivers are experiencing visual fatigue, visual attention overload may occur [104], thus reducing the effectiveness of visual warning systems. Another possible explanation is that, whenever drivers experience a divided attention or visual fatigue, they could end up experiencing inattentional blindness, resulting in the failure to notice a readily visible yet unexpected visual stimulus, such as looked-but-failed-to-see-errors [105]. These stimuli not only include the objects and events in the driving scene, but also the visual warning signals that are added to the visual field. Even when the drivers’ eyes are fixated on the road or potential danger, the effect of inattentional blindness can still disrupt their visual processing, in which drivers detect the potential risk or visual warning signals but fail to perceive and react to it [14].
In sum, our meta-analysis demonstrated that the incorporation of auditory and tactile warnings could benefit drivers’ performance in comparison to no warning; yet the effect of visual warnings was insignificant potentially due to factors such as visual fatigue and inattentional blindness.

4.2. Tactile Warnings as the Best Potential Unimodal Warnings

To investigate which unimodal warning system facilitates drivers’ response time to the best degree, comparisons between visual, auditory and tactile warnings were conducted. The results verified our hypothesis, in which among the three unimodal warnings, tactile warnings can best facilitate drivers’ task performance.
Further comparison between auditory and visual warnings showed that there was no significant difference between these two warning conditions. Noting that auditory warnings require a higher level of cognitive demand [106,107] which is limited during the driving process. As proposed by previous researchers, auditory stimuli in the driving environment (e.g., mobile phone prompts, conversations, music etc.) would occupy auditory attention resources, leading to cognitive overload similar to the visual attention overload [16,80]; therefore impairing the effectiveness of the auditory warnings. Besides the fact that a high cognitive level is needed for auditory information processing, the nature of the auditory warning itself is also a factor to be considered. Wiese and Lee pointed out that adjusting parameters such as the frequency of sound helps strengthening individuals’ ability to respond [108]. Nevertheless, tactile warnings can hardly be interfered with during its execution as the information in the driving environment is mostly auditory or visual [75]. Overall, the current results showed that tactile warnings have more advantages over auditory warnings and visual warnings in facilitating drivers’ response time, allowing tactile warning systems to potentially be the best unimodal warning system.

4.3. MIE of Driving Warnings Reveals a Positive Trend with the Number of Modalities

The relationship between MIE and the number of applied modalities in a driving warning system was explored by comparing unimodal, bimodal, and trimodal warnings against each other. Results from the comparisons between unimodal and bimodal warnings showed that auditory-tactile bimodal warnings outperformed unimodal warnings. Furthermore, comparisons between bimodal and trimodal warnings revealed a non-significant shorter response time under trimodal warning conditions.

4.3.1. Comparisons Between Unimodal and Bimodal Warnings

Upon comparing the auditory-tactile bimodal warnings with auditory warnings and tactile warnings respectively, a significantly shorter drivers’ response time under the bimodal warning condition was observed, supporting the hypotheses based on the multisensory RSE. The current observation supported MIE and guides us to further analyze the extent of the facilitatory effect of multisensory integration on drivers’ performance.
However, when visual-auditory and visual-tactile bimodal warnings were used to compare with the unimodal warnings (i.e., auditory or tactile warnings), the expected MIE was not found. The potential cause to this outcome might go back to the nature of visual warnings. With the visual field constantly filled with changes and stimuli, bimodal warning conditions with visual modality do not appear to be as effective as auditory-tactile bimodal warnings. As observed in the currently obtainable data, it was concluded that only auditory-tactile bimodal warning systems could benefit drivers in a higher degree than unimodal warning systems.

4.3.2. Comparisons Between Bimodal and Trimodal Warnings

Comparisons between bimodal and trimodal warning conditions were conducted to expand our investigation of MIE on drivers. The results indicated a non-significant shorter response time in trimodal warning conditions, supporting the multisensory RSE hypothesis. It appeared that drivers’ response time was negatively correlated with the number of applied modalities in a driving warning system, but the extent to MIE declined with the increasing number of modalities. This observation can be explained by the potential effect of cognitive overload. Although MIE does not necessarily require drivers’ full attention to the stimuli, knowing that multiple warnings are presented to the drivers during the experimental conditions, drivers are consciously aware of the warning signals. Thus, having drivers to focus on multiple warnings might cause dysfunctional attentional resource allocation due to cognitive overload [109]. Similar observations were found in [8], where they investigated the effect of bimodal and trimodal warning conditions on younger and older drivers. Their results showed that trimodal warnings effectively shorten younger drivers’ response time, but simple unimodal (visual) warnings generated the best outcome for older drivers. Older adults are often experiencing cognitive decline [110,111], causing them to have a smaller cognitive capacity. With that said, older adults would also have a higher chance of cognitive overload, reducing MIE of trimodal warning systems.
In addition, with more and more sensory modalities exposing in the urban environment, including but not limited to unwanted noises, performance impairments can be resulted due to sensory overload [112]. The effect of sensory overload can on one hand, lead to perceptual distortion of sensory stimuli; and on the other hand, cause disorganizing and potentially psychotogenic effects [113,114]. How sensory overload would impact MIE of warning systems is yet to be determined.

4.3.3. MIE in Driving Warning Systems

The current study compared the effectiveness of utilizing unimodal and multimodal driving warning systems and explored the facilitatory effect of multisensory integration on drivers’ response time. In general, it is clear that MIE can be observed in the implication of multimodal driving warning systems as illustrated by the multisensory RSE hypothesis, where the implication of auditory-tactile bimodal warnings was found to facilitate drivers’ response time to the best extent; also, drivers’ response time under trimodal warning conditions was shorter than that under bimodal warning conditions, but not in a significant level. The reason why trimodal warnings were unable to provide a guaranteed MIE may be the potential influence by cognitive or sensory overload, or potentially ceiling effect of warning benefits.
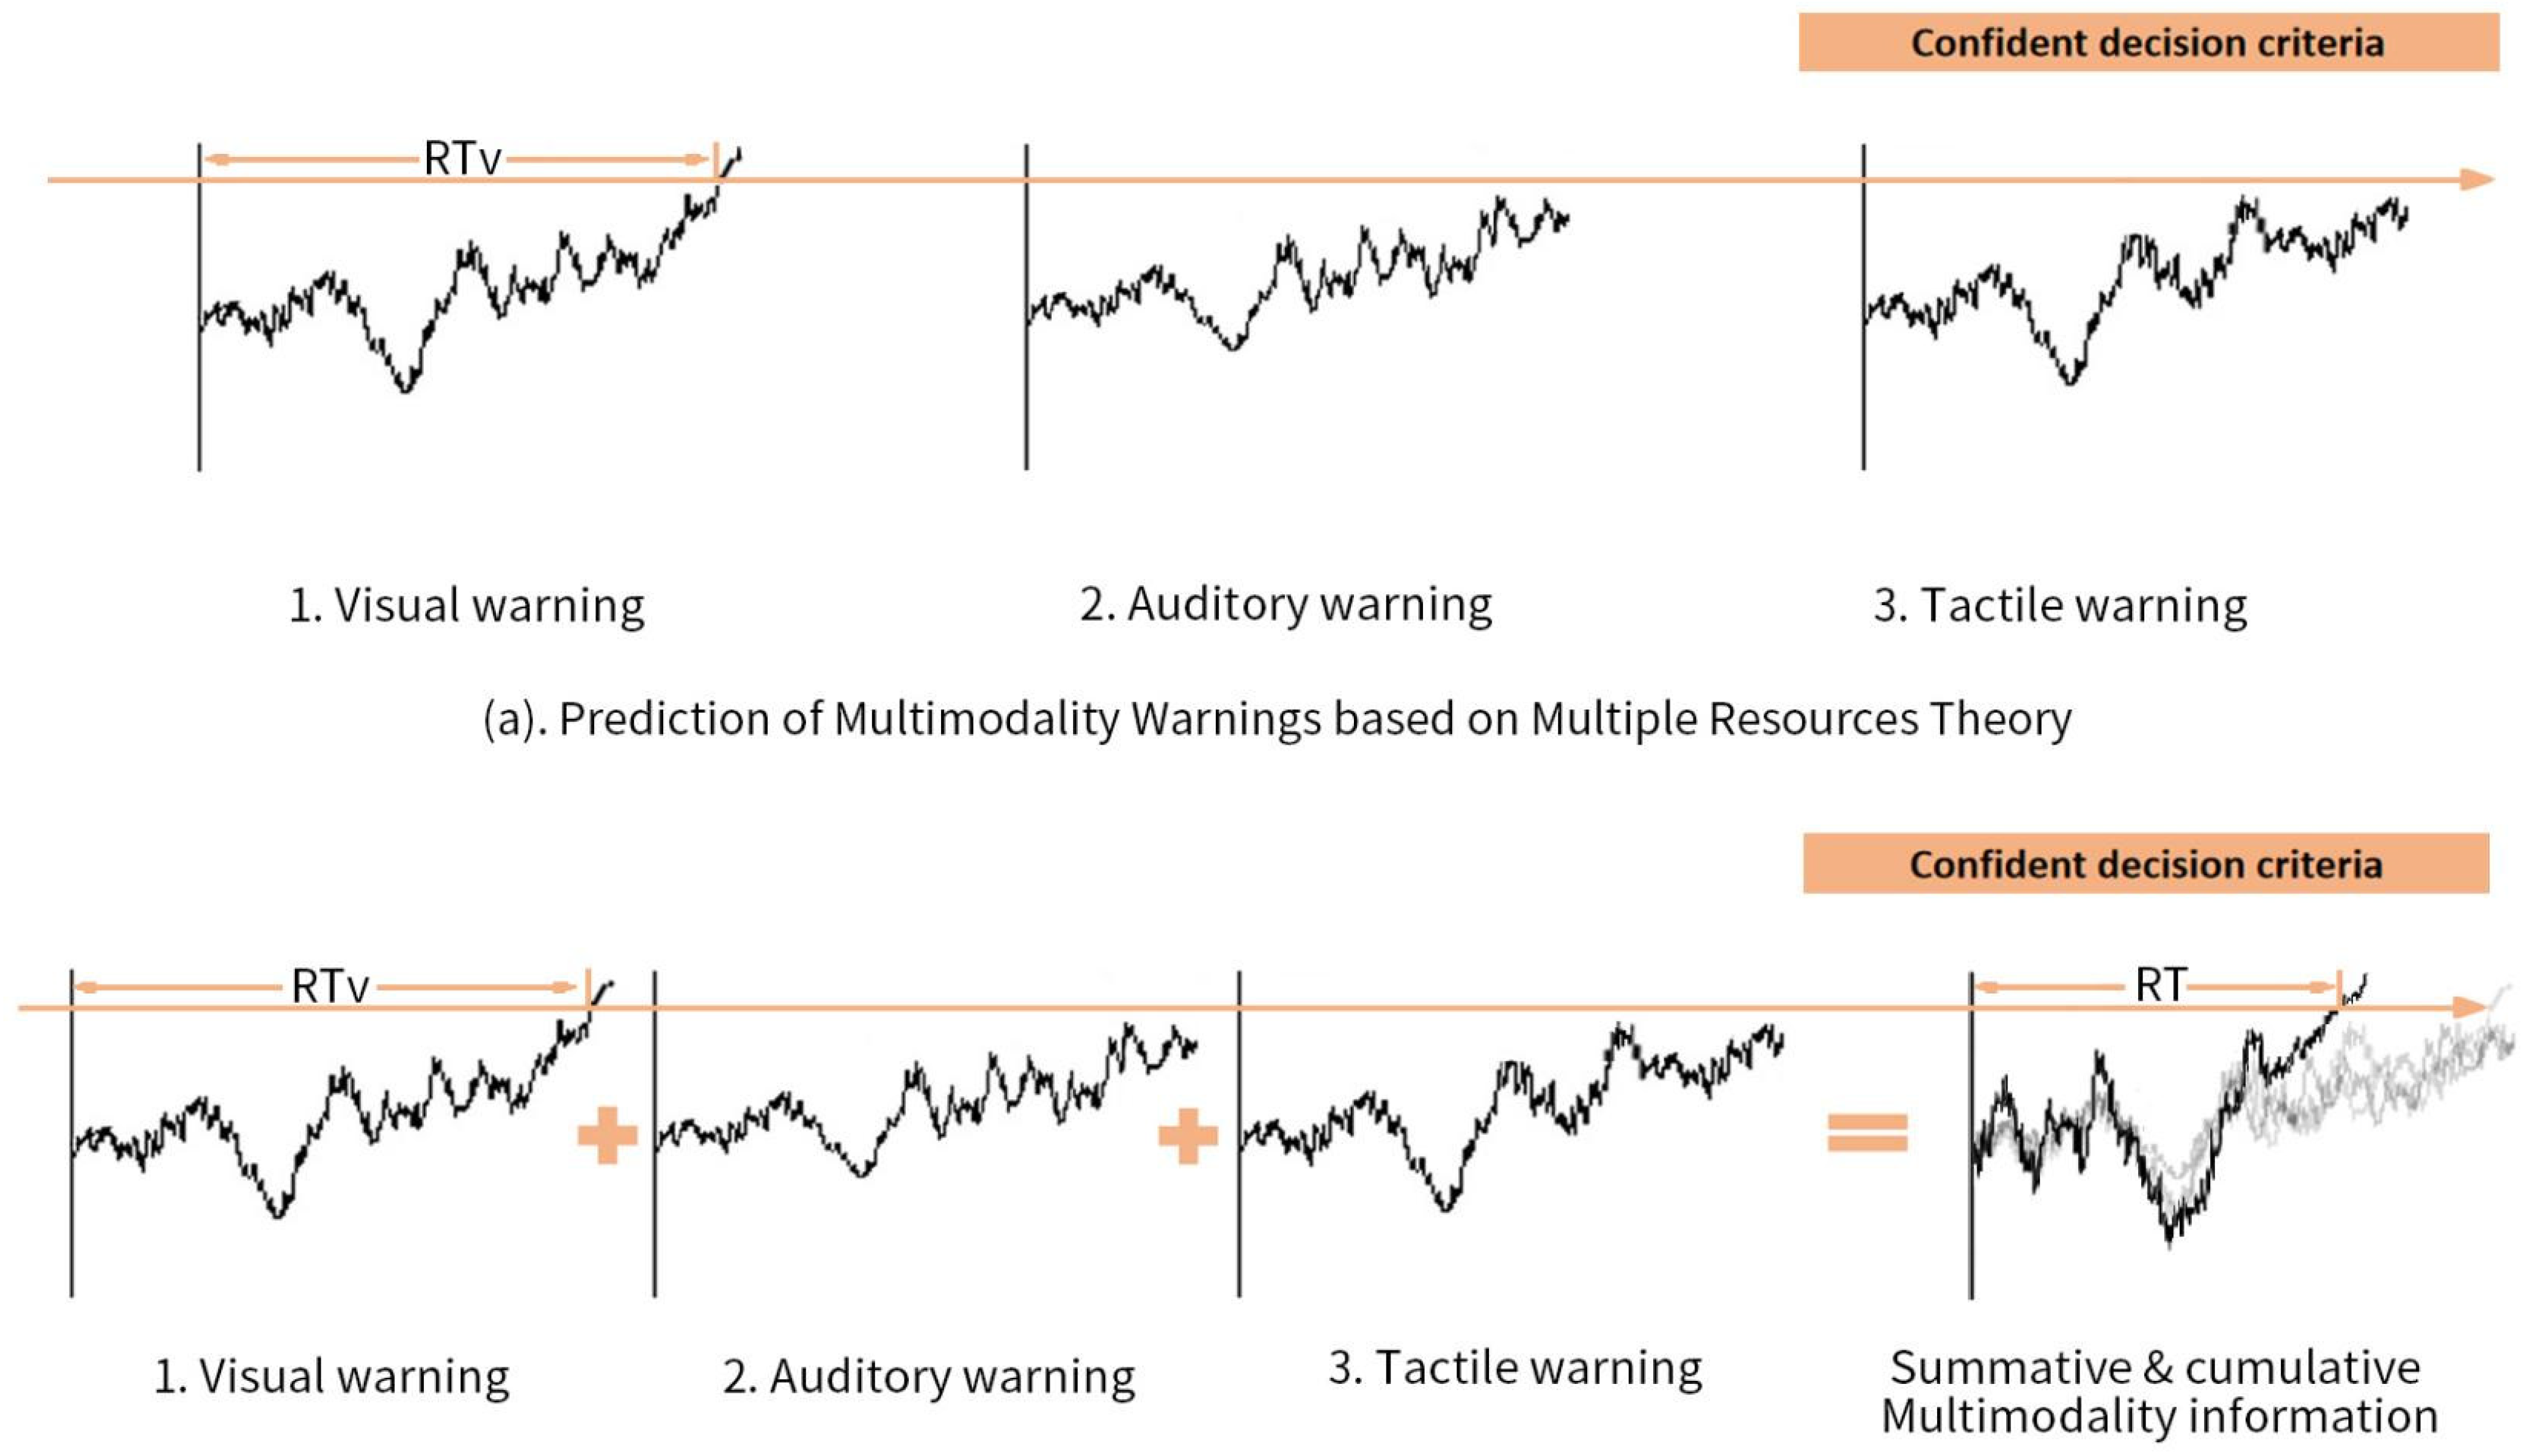
What’s the attentional mechanism that allow bimodal warnings generate significantly quicker response time than unimodal warning, and trimodal warnings generate slightly quicker response time than bimodal warnings? If the sensory modalities (such as visual, auditory, tactile modalities) are independently processed according to the assumption of Multiple Resources Theory [115], the response time in multimodality warning conditions should not be quicker than the quickest unimodal warning condition. To generate quicker response time in multimodality warning conditions, multimodality information should be summarized from time to time and accumulated as cognitive processing proceeds. Thus, multimodality attention should not be independent, but linked together with information exchanged and combined. This theory is called Attentional Co-Racing Theory, which can explain and allow the multimodality warnings to generate quicker response time than unimodal warning (Figure 10).

4.4. Implications

Through quantitative statistical research, the current meta-analysis study first revealed tactile warnings to potentially be the best unimodal warnings, and auditory-tactile bimodal warnings can better optimize drivers’ performance than unimodal warnings. These findings can be implemented not only in the driving field, but also industries such as aviation and construction to increase operation safety. Moreover, based on the research findings that trimodal warnings had no significant facilitatory effect as compared to bimodal warnings on drivers’ response time, the current study proves that there might be a ceiling effect on MIE due to cognitive overload, which provides theoretical research insights for neuroscientists.

4.5. Limitations and Future Studies

The current study has its limitations. Firstly, while this study included 60 articles with 308 studies that was sufficient for conducting a meta-analysis, the number was still too limited for conducting a moderator analysis. It is therefore highly recommended that future research conducts a moderator analysis when the number of accumulated publications in this area becomes abundant, which would enable us to further understand the effect of unimodal warnings. For instance, the location for presenting visual warnings, the volume-level of auditory warnings, and the vibration intensity of tactile warnings are some of the potential influencing factors of the effectiveness of driving warning systems. Secondly, the five basic senses include visual, auditory, tactile, gustatory, and olfactory. The current study fails to consider the latter two sensory modalities as they are not commonly utilized in the design of driving warning systems [73]. Lastly, due to the possible occurrence of sensory overload in the real world, future studies are also advised to explore whether the effects of each of the multimodal warning systems differs when being utilized in the real world in comparison to the simulated driving environment.

5. Conclusions

In sum, the current meta-analysis investigated the effectiveness of utilizing unimodal and multimodal driving warning systems to explore the extent of improvement in response time using different types of sensory modalities. Theoretically, the current study further explored the effect of multisensory integration in driving-related research with related effect and theory, which proved that MIE exists as response time reduction has a positive trend with the number of applied modalities in a driving warning system. Practically, the main findings have provided additional support for the implementation of driving warning systems as follows: (a) auditory and tactile unimodal warning systems indeed improved drivers’ response time; (b) tactile warnings were found to be the most effective unimodal warnings; (c) only auditory-tactile bimodal warnings could benefit drivers in a higher degree than unimodal warnings; (d) non-significant shorter response time was found under trimodal warning conditions than bimodal warning conditions.

Author Contributions

Conceptualization, P.P.; Methodology, A.T.H.C. and C.-P.H.; Investigation, D.H.; Writing—original draft, A.Z. and K.-H.M.; Writing—review & editing, J.H. All authors have read and agreed to the published version of the manuscript.

Funding

This project is sponsored by the National Key R&D Program of China (2022YFB4500600) and the National Natural Science Foundation of China (Grant No. T2192931).

Institutional Review Board Statement

The study is a meta-analysis without any types of study participants, thus was waived from IRB requirements.

Informed Consent Statement

Not applicable.

Data Availability Statement

Data will be available upon requests for established principal investigators for academic purposes with introduction of academic achievements and research purposes.

Conflicts of Interest

The authors declare that they have no conflict of interest.

References

  1. World Health Organization. Road Traffic Injuries. 2022. Available online: https://www.who.int/news-room/fact-sheets/detail/road-traffic-injuries (accessed on 6 February 2023).
  2. National Highway Traffic Safety Administration. 2020 Fatality Data Show Increased Traffic Fatalities during Pandemic. 2021. Available online: https://www.nhtsa.gov/press-releases/2020-fatality-data-show-increased-traffic-fatalities-during-pandemic (accessed on 6 February 2023).
  3. Edmonds, E. AAA Recommends Common Naming for ADAS Technology. Newsroom. 2019. Available online: https://newsroom.aaa.com/2019/01/common-naming-for-adas-technology (accessed on 6 February 2023).
  4. Hegeman, G.; Brookhuis, K.; Hoogendoorn, K. Opportunities of advanced driver assistance systems towards overtaking. Eur. J. Transp. Infrastruct. Res. 2005, 5, 281–296. [Google Scholar] [CrossRef]
  5. Van der Heijden, R.; van Wees, K. Introducing advanced driver assistance systems: Some legal issues. Eur. J. Transp. Infrastruct. Res. 2001, 1, 1–18. [Google Scholar] [CrossRef]
  6. Horowitz, A.D.; Dingus, T.A. Warning signal design: A key human factors issue in an in-vehicle front-to-rear-end collision warning system. In Proceedings of the Human Factors Society Annual Meeting; Sage CA: Atlanta, GA, USA, 1992; Volume 36, pp. 1011–1013. [Google Scholar] [CrossRef]
  7. Gaspar, J.G.; Brown, T.L. Matters of state: Examining the effectiveness of lane departure warnings as a function of driver distraction. Transp. Res. Part F Traffic Psychol. Behav. 2020, 71, 1–7. [Google Scholar] [CrossRef]
  8. Lundqvist, L.-M.; Eriksson, L. Age, cognitive load, and multimodal effects on driver response to directional warning. Appl. Ergon. 2019, 76, 147–154. [Google Scholar] [CrossRef] [PubMed]
  9. Scott, J.J.; Gray, R. A comparison of tactile, visual, and auditory warnings for rear-end collision prevention in simulated driving. Hum. Factors 2008, 50, 264–275. [Google Scholar] [CrossRef] [PubMed]
  10. Yun, H.; Yang, J.H. Multimodal warning design for take-over request in conditionally automated driving. Eur. Transp. Res. Rev. 2020, 12, 34. [Google Scholar] [CrossRef]
  11. Spence, C.; Ho, C. Tactile and multisensory spatial warning signals for drivers. IEEE Trans. Haptics 2008, 1, 121–129. [Google Scholar] [CrossRef] [PubMed]
  12. Mack, A.; Rock, I. Inattentional Blindness; MIT Press: Cambridge, MA, USA, 1998. [Google Scholar]
  13. Rock, I.; Linnett, C.M.; Grant, P.; Mack, A. Perception without attention: Results of a new method. Cogn. Psychol. 1992, 24, 502–534. [Google Scholar] [CrossRef]
  14. Simons, D.J.; Chabris, C.F. Gorillas in our midst: Sustained inattentional blindness for dynamic events. Perception 1999, 28, 1059–1074. [Google Scholar] [CrossRef] [PubMed]
  15. Macdonald JS, P.; Lavie, N. Visual perceptual load induces inattentional deafness. Atten. Percept. Psychophys. 2011, 73, 1780–1789. [Google Scholar] [CrossRef] [PubMed]
  16. Scheer, M.; Buelthoff, H.H.; Chuang, L.L. Auditory task irrelevance: A basis for inattentional deafness. Hum. Factors 2018, 60, 428–440. [Google Scholar] [CrossRef]
  17. Sabic, E.; Chen, J.; MacDonald, J.A. Toward a better understanding of in-vehicle auditory warnings and background noise. Hum. Factors 2021, 63, 312–335. [Google Scholar] [CrossRef] [PubMed]
  18. Gaffary, Y.; Lecuyer, Y. The use of haptic and tactile information in the car to improve driving safety: A review of current technologies. Front. ICT 2018, 5, 5. [Google Scholar] [CrossRef]
  19. Biral, F.; Da Lio, M.; Lot, R.; Sartori, R. An intelligent curve warning system for powered two wheel vehicles. Eur. Transp. Res. Rev. 2010, 3, 147–156. [Google Scholar] [CrossRef]
  20. Lee, J.D.; Hoffman, J.D.; Hayes, E. Collision warning design to mitigate driver distraction. In Proceedings of the SIGCHI Conference on Human Factors in Computing Systems; ACM Press: New York, NY, USA, 2004; pp. 65–72. [Google Scholar] [CrossRef]
  21. Zhu, A.; Choi, A.; Ma, K.X.; Cao, S.; Yao, H.; Wu, J.; He, J. A tactile toolkit and driving simulation platform to evaluate the effectiveness of collision warning systems for drivers. J. Vis. Exp. 2020, 166, 61408. [Google Scholar] [CrossRef]
  22. Meng, F.; Spence, C. Tactile warning signals for in-vehicle systems. Accid. Anal. Prev. 2015, 75, 333–346. [Google Scholar] [CrossRef] [PubMed]
  23. Diederich, A.; Colonius, H. Bimodal and trimodal multisensory enhancement: Effects of stimulus onset and intensity on reaction time. Atten. Percept. Psychophys. 2004, 66, 1388–1404. [Google Scholar] [CrossRef] [PubMed]
  24. Hughes, H.C.; Reuter-Lorenz, P.A.; Nozawa, G.; RFendrich, R. Visual-auditory interactions in sensorimotor processing: Saccades versus manual responses. J. Exp. Psychol. Hum. Percept. Perform. 1994, 20, 131–153. [Google Scholar] [CrossRef] [PubMed]
  25. Lunn, J.; Sjoblom, A.; Ward, J.; Soto-Faraco, S.; Forster, S. Multisensory enhancement of attention depends on whether you are already paying attention. Cognition 2019, 187, 38–49. [Google Scholar] [CrossRef] [PubMed]
  26. Pannunzi, M.; Perez-Bellido, A.; Pereda-Banos, A.; Lopez-Moliner, J.; Deco, G.; Soto-Faraco, S. Deconstructing multisensory enhancement in detection. J. Neurophysiol. 2015, 113, 1800–1818. [Google Scholar] [CrossRef] [PubMed]
  27. Politis, I.; Brewster, S.; Pollick, F. Using multimodal displays to signify critical handovers of control to distracted autonomous car drivers. Int. J. Mob. Hum. Comput. Interact. 2017, 9, 1–16. [Google Scholar] [CrossRef]
  28. Yang, Z.; Shi, J.L.; Zhang, Y.; Wang, D.M.; Li, H.T.; Wu, C.X.; Zhang, Y.Q.; Wan, J.Y. Head-up display graphic warning system facilitates simulated driving performance. Int. J. Hum.–Comput. Interact. 2019, 35, 796–803. [Google Scholar] [CrossRef]
  29. Yoon, S.H.; Kim, Y.W.; Ji, Y.G. The effects of takeover request modalities on highly automated car control transitions. Accid. Anal. Prev. 2019, 123, 150–158. [Google Scholar] [CrossRef]
  30. Kinchla, R.A. Detecting target elements in multielement arrays: A confusability model. Atten. Percept. Psychophys. 1974, 15, 149–158. [Google Scholar] [CrossRef]
  31. Miller, J. Statistical facilitation and the redundant signals effect: What are race and coactivation models? Atten. Percept. Psychophys. 2016, 78, 516–519. [Google Scholar] [CrossRef] [PubMed]
  32. Meredith, M.A.; Stein, B.E. Visual, auditory, and somatosensory convergence on cells in superior colliculus results in multisensory integration. J. Neurophysiol. 1986, 56, 640–662. [Google Scholar] [CrossRef] [PubMed]
  33. Stein, B.E.; Meredith, M.A. The Merging of the Senses; MIT Press: Cambridge, MA, USA, 1993. [Google Scholar]
  34. Marks, L.E. Multimodal perception. In Perceptual Coding; Carterette, E.C., Friedman, M.P., Eds.; Academic Press. Inc.: New York, NY, USA, 1978; pp. 321–339. [Google Scholar] [CrossRef]
  35. Peiffer, A.M.; Mozolic, A.M.; Hugenschmidt, C.E.; Laurienti, P.J. Age-related multisensory enhancement in a simple audiovisual detection task. Neuro Rep. 2007, 18, 1077–1081. [Google Scholar] [CrossRef] [PubMed]
  36. Ho, C.; Reed, N.; Spence, N. Multisensory in-car warning signals for collision avoidance. Hum. Factors 2007, 49, 1107–1114. [Google Scholar] [CrossRef]
  37. Jeong, H.; Green, P. Forward Collision Warning Modality and Content: A Summary of Human Factors Experiments; Technical Report UMTRI-2012-35; University of Michigan Transportation Research Institute: Ann Arbor, Michigan, 2012; Available online: https://deepblue.lib.umich.edu/bitstream/handle/2027.42/134038/103247.pdf (accessed on 6 February 2023).
  38. Yerkes, R.M.; Dodson, J.D. The relation of strength of stimulus to rapidity of habit-formation. J. Comp. Neurol. Psychol. 1908, 18, 459–482. [Google Scholar] [CrossRef]
  39. Belz, S.M.; Robinson, G.S.; Casali, J.G. A new class of auditory warning signals for complex systems: Auditory icons. Hum. Factors 1999, 41, 608–618. [Google Scholar] [CrossRef] [PubMed]
  40. Ferrier, D. The Functions of the Brain; Smith, Elder, and Company: London, UK, 1886. [Google Scholar]
  41. Geitner, C.; Biondi, F.; Skrypchuk, L.; Jennings, L.; Birrell, S. The comparison of auditory, tactile, and multimodal warnings for the effective communication of unexpected events during an automated driving scenario. Transp. Res. Part F Traffic Psychol. Behav. 2019, 65, 23–33. [Google Scholar] [CrossRef]
  42. Atwood, J.R.; Guo, F.; Blanco, M. Evaluate driver response to active warning system in level-2 automated vehicles. Accid. Anal. Prev. 2019, 128, 132–138. [Google Scholar] [CrossRef] [PubMed]
  43. Zeeb, K.; Buchner, A.; Schrauf, M. Is take-over time all that matters? The impact of visual-cognitive load on driver take-over quality after conditionally automated driving. Accid. Anal. Prev. 2016, 92, 230–239. [Google Scholar] [CrossRef] [PubMed]
  44. Thalheimer, W.; Cook, S. How to calculate effect sizes from published research: A simplified methodology. Work.-Learn. Res. 2002, 1, 1–9. [Google Scholar]
  45. Cohen, J. A power primer. Psychol. Bull. 1992, 112, 155–159. [Google Scholar] [CrossRef] [PubMed]
  46. Brown, S.B. Effects of Haptic and Auditory Warnings on Driver Intersection Behavior and Perception. Ph.D. Thesis, Virginia Polytechnic Institute and State University, Blacksburg, VA, USA, 2005. [Google Scholar]
  47. Reinmueller, K.; Koehler, L.; Steinhauser, M. Adaptive warning signals adjusted to driver passenger conversation: Impact of system awareness on behavioral adaptations. Transp. Res. Part F Traffic Psychol. Behav. 2018, 58, 242–252. [Google Scholar] [CrossRef]
  48. Ruscio, D.; Ciceri, M.R.; Biassoni, F. How does a collision warning system shape driver’s brake response time? The influence of expectancy and automation complacency on real-life emergency braking. Accid. Anal. Prev. 2015, 77, 72–81. [Google Scholar] [CrossRef]
  49. Ho, C.; Gray, R.; Spence, C. Reorienting driver attention with dynamic tactile cues. IEEE Trans. Haptics 2013, 7, 86–94. [Google Scholar] [CrossRef] [PubMed]
  50. Lylykangas, J.; Surakka, V.; Salminen, K.; Farooq, A.; Raisamo, R. Responses to visual, tactile and visual–tactile forward collision warnings while gaze on and off the road. Transp. Res. Part F Traffic Psychol. Behav. 2016, 40, 68–77. [Google Scholar] [CrossRef]
  51. Wu, X.; Boyle, L.N.; Marshall, D.; O’Brien, W. The effectiveness of auditory forward collision warning alerts. Transp. Res. Part F Traffic Psychol. Behav. 2018, 59, 164–178. [Google Scholar] [CrossRef]
  52. Zhang, Y. Study on the Influence of Head-up Display Graphic Warning Display Methods on Simulated Driving. Master’s Thesis, Zhejiang Sci-Tech University, Hangzhou, China, 2017. [Google Scholar]
  53. Ahtamad, M.; Gray, R.; Ho, C.; Reed, N.; Spence, C. Informative collision warnings: Effect of modality and driver age. In Proceedings of the Eighth International Driving Symposium on Human Factors in Driver Assessment, Training and Vehicle Design, Salt Lake City, UT, USA, 22–25 June 2015; University of Iowa: Iowa City, IA, USA, 2015; Volume 8. [Google Scholar]
  54. Ahtamad, M.; Spence, C.; Ho, C.; Gray, R. Warning drivers about impending collisions using vibrotactile flow. IEEE Trans. Haptics 2015, 9, 134–141. [Google Scholar] [CrossRef] [PubMed]
  55. Aksan, N.; Sager, L.; Hacker, S.; Marini, R.; Dawson, J.; Anderson, S.; Rizzo, M. Forward collision warning: Clues to optimal timing of advisory warnings. SAE Int. J. Transp. Saf. 2016, 4, 107–112. [Google Scholar] [CrossRef]
  56. Fitch, G.M.; Hankey, J.M.; Kleiner, B.M.; Dingus, T.A. Driver comprehension of multiple haptic seat alerts intended for use in an integrated collision avoidance system. Transp. Res. Part F Traffic Psychol. Behav. 2011, 14, 278–290. [Google Scholar] [CrossRef]
  57. Gray, R.; Ho, C.; Spence, C. A comparison of different informative vibrotactile forward collision warnings: Does the warning need to be linked to the collision event? PLoS ONE 2014, 9, e87070. [Google Scholar] [CrossRef] [PubMed]
  58. Ho, C.; Reed, N.; Spence, C. Assessing the effectiveness of “intuitive” vibrotactile warning signals in preventing front-to-rear-end collisions in a driving simulator. Accid. Anal. Prev. 2006, 38, 988–996. [Google Scholar] [CrossRef] [PubMed]
  59. Lewis, B.A.; Eisert, J.L.; Baldwin, C.L. Validation of essential acoustic parameters for highly urgent in-vehicle collision warnings. Hum. Factors 2018, 60, 248–261. [Google Scholar] [CrossRef] [PubMed]
  60. Li, J.Z. Study on the Stress Response of Drivers under Different Warning Methods. Master’s Thesis, South China University of Technology, Guangzhou, China, 2018. [Google Scholar]
  61. Meng, F.; Gray, R.; Ho, C.; Ahtamad, M.; Spence, C. Dynamic vibrotactile signals for forward collision avoidance warning systems. Hum. Factors 2015, 57, 329–346. [Google Scholar] [CrossRef] [PubMed]
  62. Mohebbi, R.; Gray, R.; Tan, H.Z. Driver reaction time to tactile and auditory rear-end collision warnings while talking on a cell phone. Hum. Factors 2009, 51, 102–110. [Google Scholar] [CrossRef] [PubMed]
  63. Jhuang, J.W.; Liu, Y.C.; Ou, Y.K. A comparison study of five in-vehicle warning information displays with or without spatial compatibility. In Proceedings of the 2010 IEEE International Conference on Industrial Engineering and Engineering Management, Macao, China, 7–10 December 2010; pp. 827–831. [Google Scholar]
  64. Li, J.W. Research on Driver Fatigue State and Adaptive Warning Method of Traffic Environment. Ph.D. Thesis, Tsinghua University, Beijing, China, 2011. [Google Scholar]
  65. Liu, Y.J.; Jin, L.S.; Zheng, Y.; Li, Y.J. Research on methods of warning trigger for vehicle active safety warning system. Automot. Technol. 2013, 3, 33–37. [Google Scholar]
  66. Shi, J.L. Research on the Effectiveness of Head-up-Displays Warning System Based on User Research and Simulated Driving. Master’s Thesis, Zhejiang Sci-Tech University, Hangzhou, China, 2020. [Google Scholar]
  67. Schwarz, F.; Fastenmeier, W. Augmented reality warnings in vehicles: Effects of modality and specificity on effectiveness. Accid. Anal. Prev. 2017, 101, 55–66. [Google Scholar] [CrossRef]
  68. Xue, Q.W. Characteristics of Driver Rear-End Collision Avoidance Behavior and Effectiveness of Different Warning Methods Based on Driving Simulation. Ph.D. Thesis, Beijing Jiaotong University, Beijing, China, 2019. [Google Scholar]
  69. Zhang, Y.; Yan, X.; Li, X.; Wu, J. Changes of drivers’ visual performances when approaching a signalized intersection under different collision avoidance warning conditions. Transp. Res. Part F Traffic Psychol. Behav. 2019, 65, 584–597. [Google Scholar] [CrossRef]
  70. Belz, S.M. A Simulator-Based Investigation of Visual, Auditory, and Mixed-Modality Display of Vehicle Dynamic State Information to Commercial Motor Vehicle Operators. Ph.D. Thesis, Virginia Polytechnic Institute and State University, Blacksburg, VA, USA, 1997. [Google Scholar]
  71. Girbes, V.; Armesto, L.; Dols, J.; Tornero, J. An active safety system for low-speed bus braking assistance. IEEE Trans. Intell. Transp. Syst. 2016, 18, 377–387. [Google Scholar] [CrossRef]
  72. McKeown, D.; Isherwood, S.; Conway, G. Auditory displays as occasion setters. Hum. Factors 2010, 52, 54–62. [Google Scholar] [CrossRef] [PubMed]
  73. Yan, X.; Xue, Q.; Ma, L.; Xu, Y. Driving-simulator-based test on the effectiveness of auditory red-light running vehicle warning system based on time-to-collision sensor. Sensors 2014, 14, 3631–3651. [Google Scholar] [CrossRef]
  74. Biondi, F.; Strayer, D.L.; Rossi, R.; Gastaldi, M.; Mulatti, C. Advanced driver assistance systems: Using multimodal redundant warnings to enhance road safety. Appl. Ergon. 2017, 58, 238–244. [Google Scholar] [CrossRef]
  75. Murata, A.; Kuroda, T.; Karwowski, W. Effects of auditory and tactile warning on response to visual hazards under a noisy environment. Appl. Ergon. 2017, 60, 58–67. [Google Scholar] [CrossRef] [PubMed]
  76. Lin, C.T.; Huang, T.Y.; Liang, W.C.; Chiu, T.T.; Chao, C.F.; Hsu, S.H.; Ko, L.W. Assessing effectiveness of various auditory warning signals in maintaining drivers’ attention in virtual reality-based driving environments. Percept. Mot. Ski. 2009, 108, 825–835. [Google Scholar] [CrossRef] [PubMed]
  77. Petermeijer, S.; Bazilinskyy, P.; Bengler, K.; De Winter, J. Take-over again: Investigating multimodal and directional TORs to get the driver back into the loop. Appl. Ergon. 2017, 62, 204–215. [Google Scholar] [CrossRef] [PubMed]
  78. Becker, M. Effects of Looming Auditory FCW on Brake Reaction Time under Conditions of Distraction. Master’s Thesis, Arizona State University, Tempe, Arizona, 2016. [Google Scholar]
  79. Murata, A.; Doi, T.; Karwowski, W. Enhanced performance for in-vehicle display placed around back mirror by means of tactile warning. Transp. Res. Part F Traffic Psychol. Behav. 2018, 58, 605–618. [Google Scholar] [CrossRef]
  80. Cao, Y.; Van Der Sluis, F.; Theune, M.; op den Akker, R.; Nijholt, A. Evaluating informative auditory and tactile cues for in-vehicle information systems. In Proceedings of the 2nd International Conference on Automotive User Interfaces and Interactive Vehicular Applications, Pittsburgh, PA, USA, 11–12 November 2010; ACM Press: New York, NY, USA, 2010; pp. 102–109. [Google Scholar]
  81. Halabi, O.; Bahameish, M.A.; Al-Naimi, L.T.; Al-Kaabi, A.K. Response times for auditory and vibrotactile directional cues in different immersive displays. Int. J. Hum.–Comput. Interact. 2019, 35, 1578–1585. [Google Scholar] [CrossRef]
  82. Petermeijer, S.; Doubek, F.; De Winter, J. Driver response times to auditory, visual, and tactile take-over requests: A simulator study with 101 participants. In Proceedings of the 2017 IEEE International Conference on Systems, Man, and Cybernetics (SMC), Banff, AB, Canada, 5–8 October 2017; pp. 1505–1510. [Google Scholar]
  83. Pitts, B.J.; Sarter, N. What you don’t notice can harm you: Age-related differences in detecting concurrent visual, auditory, and tactile cues. Hum. Factors 2018, 60, 445–464. [Google Scholar] [CrossRef] [PubMed]
  84. Straughn, S.M.; Gray, R.; Tan, H.Z. To go or not to go: Stimulus-response compatibility for tactile and auditory pedestrian collision warnings. IEEE Trans. Haptics 2009, 2, 111–117. [Google Scholar] [CrossRef]
  85. Navarro, J.; Mars, F.; Forzy, J.F.; El-Jaafari, M.; Hoc, J.M. Objective and subjective evaluation of motor priming and warning systems applied to lateral control assistance. Accid. Anal. Prev. 2010, 42, 904–912. [Google Scholar] [CrossRef]
  86. Wu, Y.W. Research on Key Technologies of Lane Departure Assistance Driving under Human-Machine Collaboration. Ph.D. Thesis, Hunan University, Changsha, China, 2013. [Google Scholar]
  87. Ho, C.; Spence, C. Using peripersonal warning signals to orient a driver’s gaze. Hum. Factors 2009, 51, 539–556. [Google Scholar] [CrossRef] [PubMed]
  88. Biondi, F.; Leo, M.; Gastaldi, M.; Rossi, R.; Mulatti, C. How to drive drivers nuts: Effect of auditory, vibrotactile, and multimodal warnings on perceived urgency, annoyance, and acceptability. Transp. Res. Rec. 2017, 2663, 34–39. [Google Scholar] [CrossRef]
  89. Ho, C.; Santangelo, V.; Spence, C. Multisensory warning signals: When spatial correspondence matters. Exp. Brain Res. 2009, 195, 261–272. [Google Scholar] [CrossRef] [PubMed]
  90. Cohen, J. Statistical Power Analysis for the Behavioral Sciences, 2nd ed.; Lawrence Erlbaum Associates: New York, NY, USA, 1988. [Google Scholar]
  91. Cumming, G.; Fidler, F.; Kalinowski, P.; Lai, P. The statistical recommendations of the American Psychological Association Publication Manual: Effect sizes, confidence intervals, and meta-analysis. Aust. J. Psychol. 2012, 64, 138–146. [Google Scholar] [CrossRef]
  92. Hedges, L.V. Distribution theory for Glass’s estimator of effect size and related estimators. J. Educ. Stat. 1981, 6, 107–128. [Google Scholar] [CrossRef]
  93. Lakens, D. Calculating and reporting effect sizes to facilitate cumulative science: A practical primer for t-tests and ANOVAs. Front. Psychol. 2016, 4, 863. [Google Scholar] [CrossRef] [PubMed]
  94. Glen, S. Hedges’ g: Definition, Formula. Statistics How To. 2016. Available online: https://www.statisticshowto.com/hedges-g/ (accessed on 6 February 2023).
  95. Hedberg, E. ROBUMETA: Stata Module to Perform Robust Variance Estimation in Meta-Regression with Dependent Effect Size Estimates. Statistical Software Components, Boston College Department of Economics. 2011. Available online: https://ideas.repec.org/c/boc/bocode/s457219.html (accessed on 6 February 2023).
  96. Hedges, L.V.; Tipton, E.; Johnson, M.C. Robust variance estimation in meta-regression with dependent effect size estimates. Res. Synth. Methods 2010, 1, 39–65. [Google Scholar] [CrossRef] [PubMed]
  97. Higgins, J.P.; Thompson, S.G. Quantifying heterogeneity in a meta-analysis. Stat. Med. 2002, 21, 1539–1558. [Google Scholar] [CrossRef] [PubMed]
  98. Erbeli, F.; Peng, P.; Rice, M. No evidence of creative benefit accompanying dyslexia: A meta-analysis. J. Learn. Disabil. 2022, 55, 242–253. [Google Scholar] [CrossRef] [PubMed]
  99. Lipsey, M.W.; Wilson, D.B. Practical Meta-Analysis; Sage Publications, Inc.: Thousand Oaks, CA, USA, 2001. [Google Scholar]
  100. Egger, M.; Davey Smith, G.; Schneider, M.; Minder, C. Bias in meta-analysis detected by a simple, graphical test. BMJ 1997, 315, 315–629. [Google Scholar] [CrossRef] [PubMed]
  101. Sterne, J.A.; Egger, M. Regression methods to detect publication and other bias in meta-analysis. In Publication Bias in Meta-Analysis; Rothstein, H.R., Sutton, A.J., Borenstein, M., Eds.; John Wiley & Sons, Inc.: Hoboken, NJ, USA, 2006. [Google Scholar] [CrossRef]
  102. Owsley, C.; McGwin, G., Jr. Vision and driving. Vis. Res. 2010, 50, 2348–2361. [Google Scholar] [CrossRef] [PubMed]
  103. National Highway Traffic Safety Administration. Human factors design guidance for driver-vehicle interfaces; No. DOT HS 812 360; National Highway Traffic Safety Administration: 2016. Available online: https://www.nhtsa.gov/sites/nhtsa.gov/files/documents/812360_humanfactorsdesignguidance.pdf (accessed on 6 February 2023).
  104. Hirst, S.; Graham, R. The format and presentation of collision warnings. In Ergonomics and Safety of Intelligent Driver Interfaces; CRC Press: Boca Raton, FL, USA, 2020; pp. 203–219. [Google Scholar]
  105. Herslund, M.B.; Jørgensen, N.O. Looked-but-failed-to-see-errors in traffic. Accid. Anal. Prev. 2003, 35, 885–891. [Google Scholar] [CrossRef]
  106. Alain, C.; Izenberg, A. Effects of attentional load on auditory scene analysis. J. Cogn. Neurosci. 2003, 15, 1063–1073. [Google Scholar] [CrossRef] [PubMed]
  107. Murphy, S.; Fraenkel, N.; Dalton, P. Perceptual load does not modulate auditory distractor processing. Cognition 2013, 129, 345–355. [Google Scholar] [CrossRef] [PubMed]
  108. Wiese, E.E.; Lee, J.D. Auditory alerts for in-vehicle information systems: The effects of temporal conflict and sound parameters on driver attitudes and performance. Ergonomics 2004, 47, 965–986. [Google Scholar] [CrossRef] [PubMed]
  109. Ruscio, D.; Bos, A.J.; Ciceri, M.R. Distraction or cognitive overload? Using modulations of the autonomic nervous system to discriminate the possible negative effects of advanced assistance system. Accid. Anal. Prev. 2017, 103, 105–111. [Google Scholar] [CrossRef] [PubMed]
  110. Boyle, P.A.; Yu, L.; Wilson, R.S.; Leurgans, S.E.; Schneider, J.A.; Bennett, D.A. Person-specific contribution of neuropathologies to cognitive loss in old age. Ann. Neurol. 2018, 83, 74–83. [Google Scholar] [CrossRef] [PubMed]
  111. Howieson, D.B.; Camicioli, R.; Quinn, J.; Silbert, L.C.; Care, B.; Moore, M.M.; Dame, A.; Sexton, G.; Kaye, J.A. Natural history of cognitive decline in the old old. Neurology 2003, 60, 1489–1494. [Google Scholar] [CrossRef] [PubMed]
  112. Lipowski, Z.J. Sensory and information inputs overload: Behavioral effects. Compr. Psychiatry 1975, 16, 199–221. [Google Scholar] [CrossRef] [PubMed]
  113. Scheydt, S.; Müller Staub, M.; Frauenfelder, F.; Nielsen, G.H.; Behrens, J.; Needham, I. Sensory overload: A concept analysis. Int. J. Ment. Health Nurs. 2017, 26, 110–120. [Google Scholar] [CrossRef] [PubMed]
  114. Wickens, C.D. Multiple resources and performance prediction. Theor. Issues Ergon. Sci. 2002, 3, 159–177. [Google Scholar] [CrossRef]
  115. Okazaki, S.; Haramaki, T.; Nishino, H. A safe driving support method using olfactory stimuli. Adv. Intell. Syst. Comput. 2018, 772, 958–967. [Google Scholar] [CrossRef]
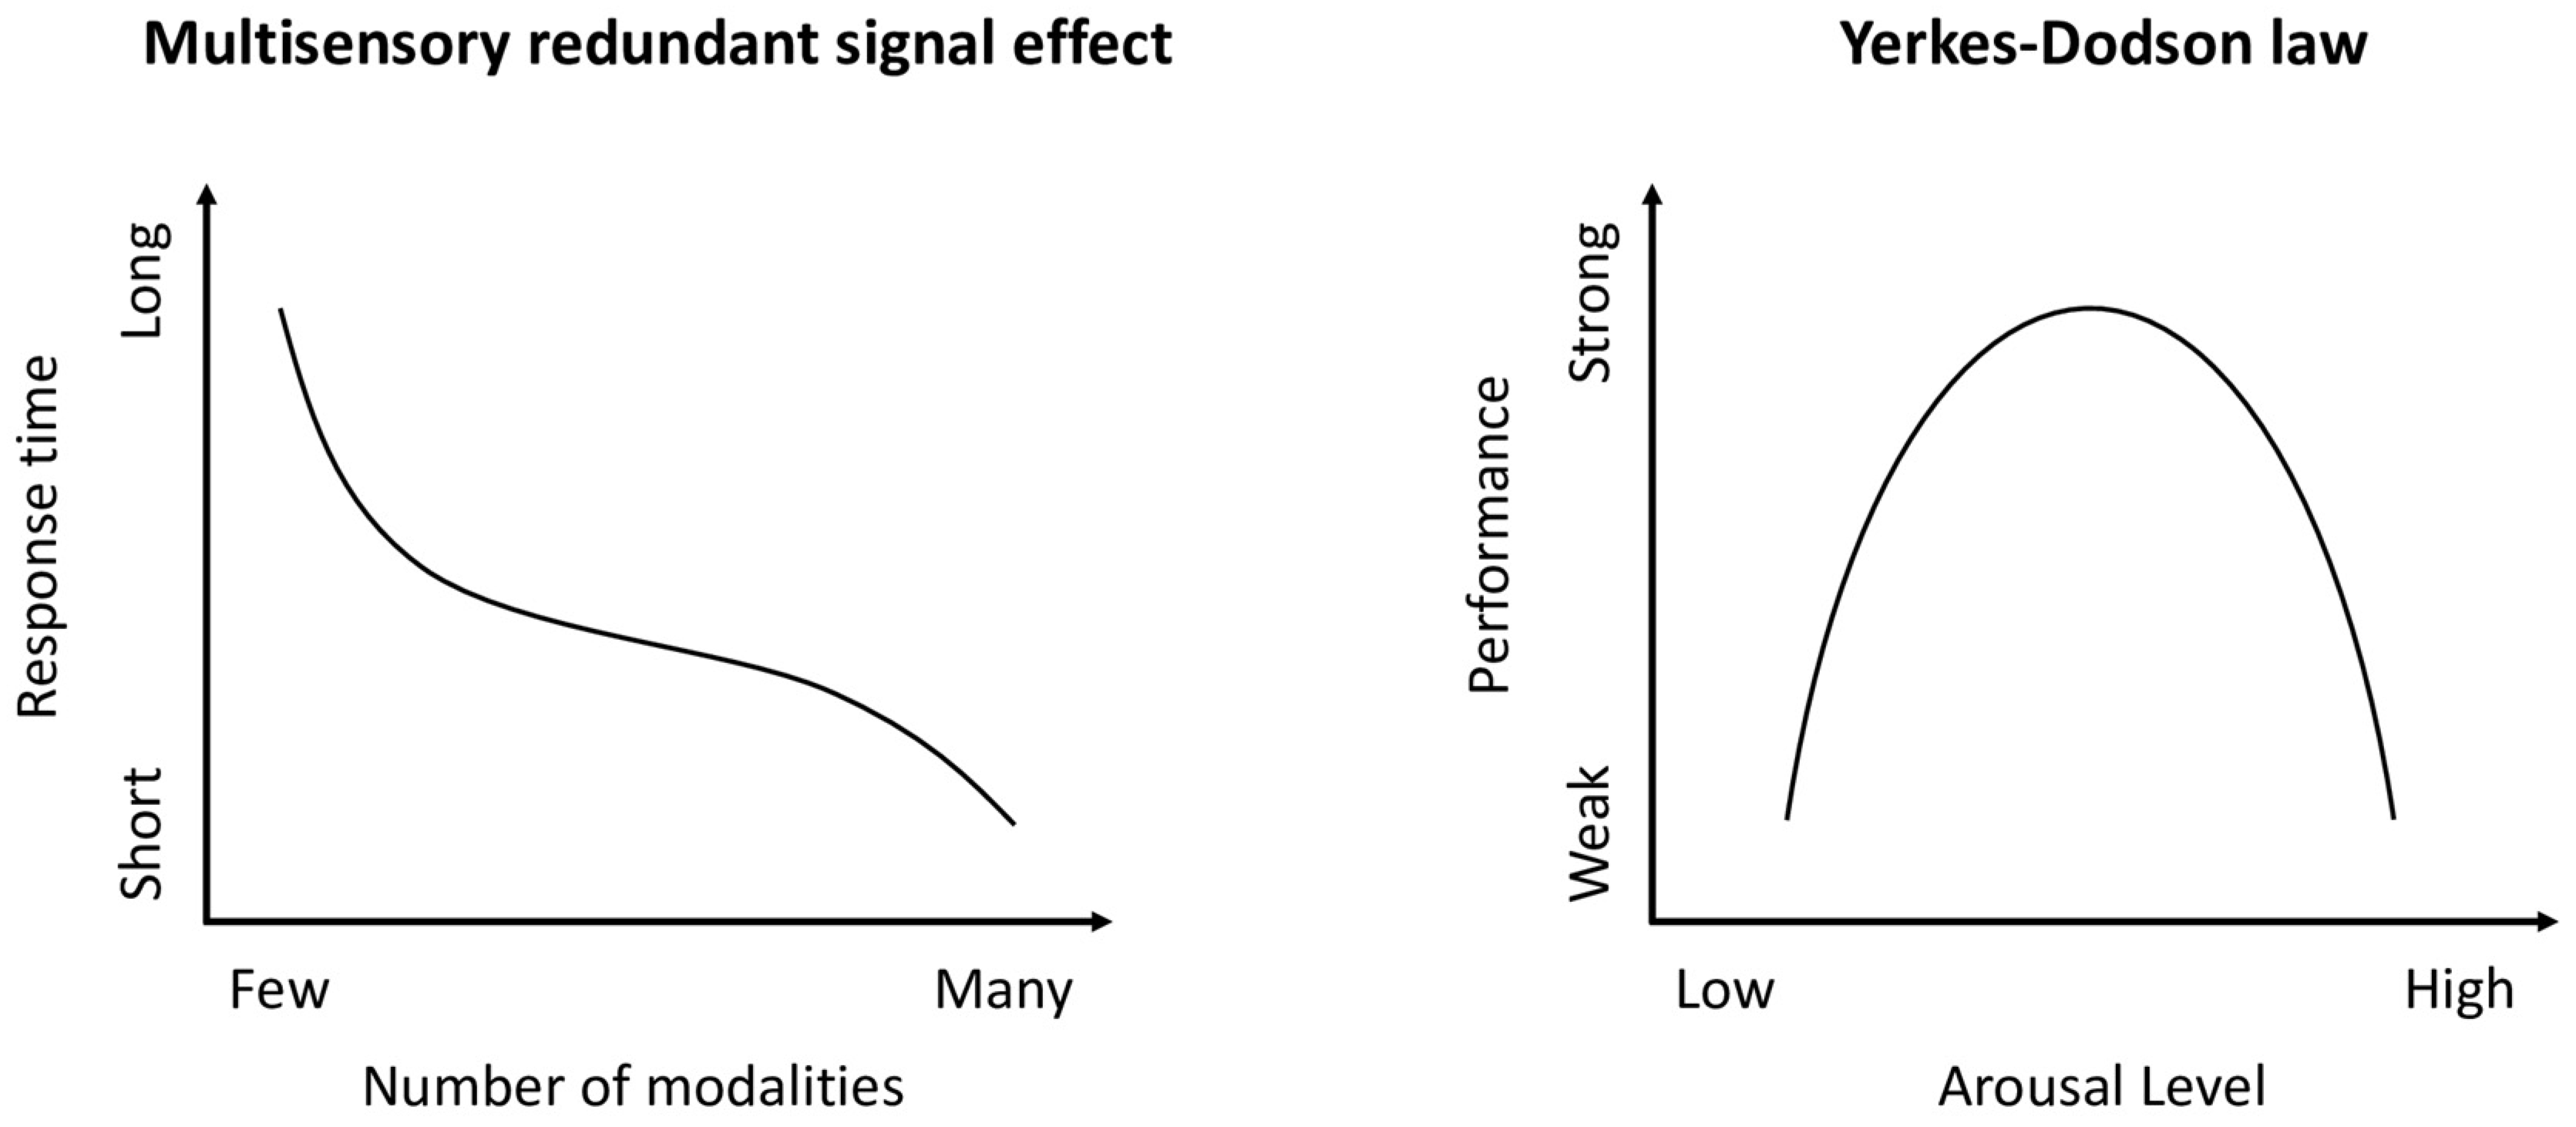
Figure 1. Illustration of multisensory Redundant Signal Effect (RSE) and Yerkes-Dodson Law (YDL).
Applsci 15 00527 g001
Figure 2. Potential relationship between drivers’ response time and number of applied modalities in a driving warning system.
Applsci 15 00527 g002
Figure 3. Article inclusion process.
Applsci 15 00527 g003
Figure 10. Prediction of response time with multimodality warnings based on the Multiple Resources Theory and Attentional Co-Racing Theory.
Applsci 15 00527 g010
Table 1. Overview of Driving Tasks Descriptions and Simulation Fidelity for Included Publications.
Driving Task DescriptionsSimulation
Fidelity
Reference
Driving task with potential collision eventsReal carBrown (2005) [46]
Driving task with a stimulus-response task Real carReinmueller et al. (2018) [47]; Ruscio et al. (2015) [48]
Driving and braking taskSimulatorGeitner et al. (2019) [41]; Ho et al. (2014) [49]; Lylykangas et al. (2016) [50]; Lylykangas et al. (2016) [50]; Wu et al. (2018) [51]; Zhang(2017) [52]
Car followingSimulatorAhtamad et al. (2015) [53]; Ahtamad et al. (2016) [54]; Aksan et al. (2016) [55]; Fitch et al. (2011) [56]; Gaspar & Brown (2020) [7]; Gray et al. (2014) [57]; Ho et al. (2006) [58]; Lewis et al. (2018) [59]; Li (2018) [60]; Meng et al. (2015) [61]; Mohebbi et al. (2009) [62]; Scott & Gray (2008) [9]; Zhu et al. (2020) [21]
Driving task with a stimulus-response taskSimulatorJhuang et al. (2010) [63]; Li (2011) [64]; Liu et al.(2013) [65]; Politis et al. (2017) [27]; Shi (2020) [66]; Schwarz & Fastenmeier (2017) [67]; Xue (2019) [68]; Zhang et al. (2019) [69];
Driving task with potential collision eventsSimulatorBelz (1997) [70]; Belz et al. (1999) [39]; Girbes et al. (2016) [71]; McKeown et al. (2010) [72]; Yan et al. (2014) [73]
Braking task with lead car deceleration eventsSimulatorBiondi et al. (2017) [74]
Lane and speed keeping while reacting to warnings or hazardsSimulatorLundqvist & Eriksson (2019) [8]; Murata et al. (2017) [75]
Lane keepingSimulatorLin et al. (2009) [76]; Yang et al. (2019) [28]
Take-over request taskSimulatorPetermeijer et al. (2017) [77]; Yoon et al. (2019) [29]
Car following task with a secondary texting taskSimulatorBecker (2016) [78]
Driving task with a secondary task to detect warning signalsSimulatorMurata et al. (2018) [79]
Cue identification tasks with perceptional & cognitive load SimulatorCao et al. (2010) [80]
Lane change taskSimulatorHalabi et al. (2019) [81]; Petermeijer et al. (2017) [82]; Pitts & Sarter (2018) [83]; Straughn et al. (2009) [84]; Yun & Yang (2020) [10];
Steering taskSimulatorNavarro et al. (2010) [85]; Wu (2013) [86]
Head-turning responseSimulatorHo & Spence (2009) [87]
Surrogate driving tasks (e.g., speeded discrimination)Surrogate tasksBiondi et al. (2017) [88]; Ho et al. (2006) [60]; Ho et al. (2007) [36]; Ho et al. (2009) [89]
Table 2. Pooled Hedges’ g and 95% CI of Pairwise Comparisons of Warning Modalities.
Comparison CategoryPairwise ComparisonPooled Hedges’ g (95% CI)τ2 (Tau.sq)Failsafe-N Estimates
Unimodal vs. control conditionVisual vs. control0.83 (−0.50, 2.16)0.85440
Auditory vs. control0.98 ** (0.34, 1.61)0.88344
Tactile vs. control0.77 ** (0.22, 1.32)0.72518
Unimodal vs. unimodalVisual vs. tactile0.74 * (0.11, 1.37)0.92468
Auditory vs. tactile0.11 (−0.40, 0.61)0.7164
Visual vs. auditory0.42 (−0.12, 0.97)1.18141
Unimodal vs. bimodalAuditory vs. auditory-tactile0.38 * (0.04, 0.72)0.20211
Tactile vs. auditory-tactile0.46 * (0.10, 0.82)0.21268
Auditory vs. visual-auditory0.37 (−0.34, 1.08)0.64189
Tactile vs. visual-auditory0.39 (−0.22, 1.00)0.22144
Auditory vs. visual-tactile0.38 (−0.60, 1.36)0.44149
Tactile vs. visual-tactile0.36 (−0.04, 0.76)0.12153
Bimodal vs. trimodalvisual-auditory vs. visual-auditory-tactile 0.54 (−0.49, 1.57)0.4867
visual-tactile vs. visual-auditory-tactile0.40 (−0.29, 1.00)0.2141
auditory-tactile vs. visual-auditory-tactile 0.26 (−0.25, 0.77)0.1295
Note. A single asterisk * represents significance at p < 0.05; Double asterisks ** represent significance at p < 0.01.
Disclaimer/Publisher’s Note: The statements, opinions and data contained in all publications are solely those of the individual author(s) and contributor(s) and not of MDPI and/or the editor(s). MDPI and/or the editor(s) disclaim responsibility for any injury to people or property resulting from any ideas, methods, instructions or products referred to in the content.