Article

Fall Detection Based on Continuous Wave Radar Sensor Using Binarized Neural Networks

1
School of Electronics and Information Engineering, Korea Aerospace University, Goyang 10540, Republic of Korea
2
Department of Smart Air Mobility, Korea Aerospace University, Goyang 10540, Republic of Korea
3
Department of Electrical Engineering, Sejong University, Seoul 05006, Republic of Korea
4
Department of Convergence Engineering of Intelligent Drone, Sejong University, Seoul 05006, Republic of Korea
*
Author to whom correspondence should be addressed.
Appl. Sci. 2025, 15(2), 546; https://doi.org/10.3390/app15020546
Submission received: 22 November 2024 / Revised: 24 December 2024 / Accepted: 7 January 2025 / Published: 8 January 2025

Abstract

:
Accidents caused by falls among the elderly have become a significant social issue, making fall detection systems increasingly needed. Fall detection systems such as internet of things (IoT) devices must be affordable and compact because they must be installed in various locations around the house, such as bedrooms, living rooms, and bathrooms. In this study, we propose a lightweight fall detection method using a continuous-wave (CW) radar sensor and a binarized neural network (BNN) to meet these requirements. We used a CW radar sensor, which is more affordable than other types of radar sensors, and employed a BNN with binarized features and parameters to reduce memory usage and make the system lighter. The proposed method distinguishes movements using micro-Doppler signatures, and spectrogram is binarized as an input to the BNN. The proposed method achieved 93.1% accuracy in binary classification of five fall actions and six non-fall actions. The memory requirements for storing parameters were reduced to 11.9 KB, representing a reduction of up to 99.9% compared with previous studies.

1. Introduction

Owing to the recent decrease in birth rates and the increase in single and divorced households, the number of elderly people living alone is increasing. Elderly people living alone spend a lot of time by themselves, which can be very dangerous as they may be unable to receive immediate help if an accident occurs. Falls are serious accidents, especially among the elderly, and can lead to severe injury or even death. Therefore, systems that can quickly detect and respond to falls among elderly people in home environments are becoming increasingly important.
In recent years, active research has been conducted on fall detection systems using various sensors such as wearable sensors, camera sensors and radar sensors, and machine-learning algorithms. However, wearable sensors require regular battery charging, and are limited in detecting falls in situations where the sensor must be temporarily removed such as in wet environments, like a bathroom or swimming pool [1,2,3]. Camera sensors present a challenge in terms of detectability in dark environments, and significant concerns about privacy invasion arise [4,5,6]. Radar sensors are gaining increasing attention in fall-detection research because they are less affected by external environmental conditions. Radar sensors primarily used for fall detection include continuous-wave (CW) radar [7,8,9,10,11,12,13], frequency-modulated continuous-wave (FMCW) radar [14,15,16,17], and ultrawideband (UWB) radar [18,19,20,21,22]. Data acquired from radar sensors are used in machine-learning and deep-learning algorithms to detect falls.
In [7], six features—such as mean and variance—were extracted from the acquired data and input into a cubic support vector machine (SVM), achieving 100% accuracy in detecting falls. In [8], the frequency distribution trajectory (FDT) generated from movements was input into a hidden Markov model (HMM) to classify three fall and four non-fall actions with 95% accuracy. In [9], machine-learning algorithms such as SVM and random forest (RF) were connected in three stages, achieving 93.24% accuracy in detecting falls. In [10], a Kalman filter was used to extract features, and k-nearest neighbors (KNN) was employed to detect falls with 92.85% accuracy. Ref. [14] proposes the dynamic range-Doppler trajectory (DRDT) method. In this method, points with a high radar cross section (RCS) are extracted from the range-Doppler map of multiple frames. These points are then represented in a three-dimensional range-Doppler frame. Four types of features were extracted from the generated DRDT map, and KNN was used to detect falls. In [15], 29 features were extracted from the point cloud data acquired using two FMCW radars, and an RF classifier was used to detect falls with 92.2% accuracy. However, when using machine-learning algorithms instead of deep-learning algorithms, features must be manually extracted, and the accuracy varies depending on the features used.
In [11], a method was proposed to detect falls by inputting both thresholds and spectrograms generated from raw data, into a multistage system. This system consists of thresholding, a preliminary screening network (PSN), and a constraint reconstruction-based fall detector (CRFD). In [12], a short-time Fourier transform (STFT) was applied to the received signal generating a time-frequency spectrogram, that was converted to a grayscale image and input into a CNN to detect falls. In [16], a line kernel convolutional neural network (LKCNN) was proposed to process the received data directly without preprocessing. Additionally, a data sample generation method that utilizes multiple receiving channels and small pulse repetition times (PRT) was proposed to generate numerous samples. In [17], range-angle reflection heat maps were obtained using two fast Fourier transforms (FFTs) and then merged into one. After removing the spatial redundancy using the radar low dimension embedding (RLDE) algorithm, the data were input into an RNN for detection. In [18], the range bins corresponding to fast time in the raw data were summed to obtain time-series data for a slow time, which were then input into a deep convolutional neural network to detect falls. In [19], a method was proposed to detect falls by converting a spectrogram into a binary scale. A binary image was generated through k-means clustering, median filtering, and a morphological opening operation. The resulting image was input into a deep convolutional neural network, achieving 98.37% precision and 97.82% specificity in distinguishing between falls and non-falls. In [20], a time-frequency image was generated using the STFT operation and input into a CNN-based Capsule Network, achieving 94.22% accuracy, 95.66% precision, 93.99% sensitivity, and 94.55% specificity. In [21], FFT and singular value decomposition (SVD) filtering were used to extract frequency-domain and time-domain feature images. An adaptive channel selection algorithm was then proposed to distinguish activity from background. This output was then input into a deep convolutional neural network to classify three types of fall actions. In [13,22], a Convolutional Long Short-Term Memory Model was used to extract spatial and temporal features for fall detection. However, these deep-learning algorithms have large model sizes and many parameters that require a significant amount of memory. This can be a limitation in terms of size and cost of fall detection systems that need to be installed throughout the home in the form of IoT devices.
To solve these problems, we propose a lightweight fall detection method that utilizes a CW radar sensor and a BNN. Unlike other types of radar, CW radar does not compress pulses or modulate frequencies when generating transmission waves, making it cheaper. BNN has the same structure as CNN, but unlike CNN, where features and parameters are multi-bit floating-point, it uses +1 and −1. Since CNN uses multi-bit floating-point, it requires considerable memory to store features and parameters. On the other hand, BNN only uses +1 and −1, so it can express data as 1 bit, simplifying the computation process and reducing memory usage. In addition, when implemented as a very-large-scale integrated circuit (VLSI), matrix multiplication, which corresponds to the operations of the convolutional and fully-connected layers that compose the CNN-based architecture, can be parallelized to reduce the inference time. Therefore, both methods are suitable for fall detection systems in home environments that require lightweight solutions.
The remainder of this paper is organized as follows: Section 2 describes the experimental environment for measuring data and dataset. Section 3 explains the structure of the proposed method. Section 4 evaluates the performance of the proposed method and verifies its utility through a comparison with previous studies. Finally, Section 5 presents the conclusions of this study.

2. Experimental Setup and Measurement

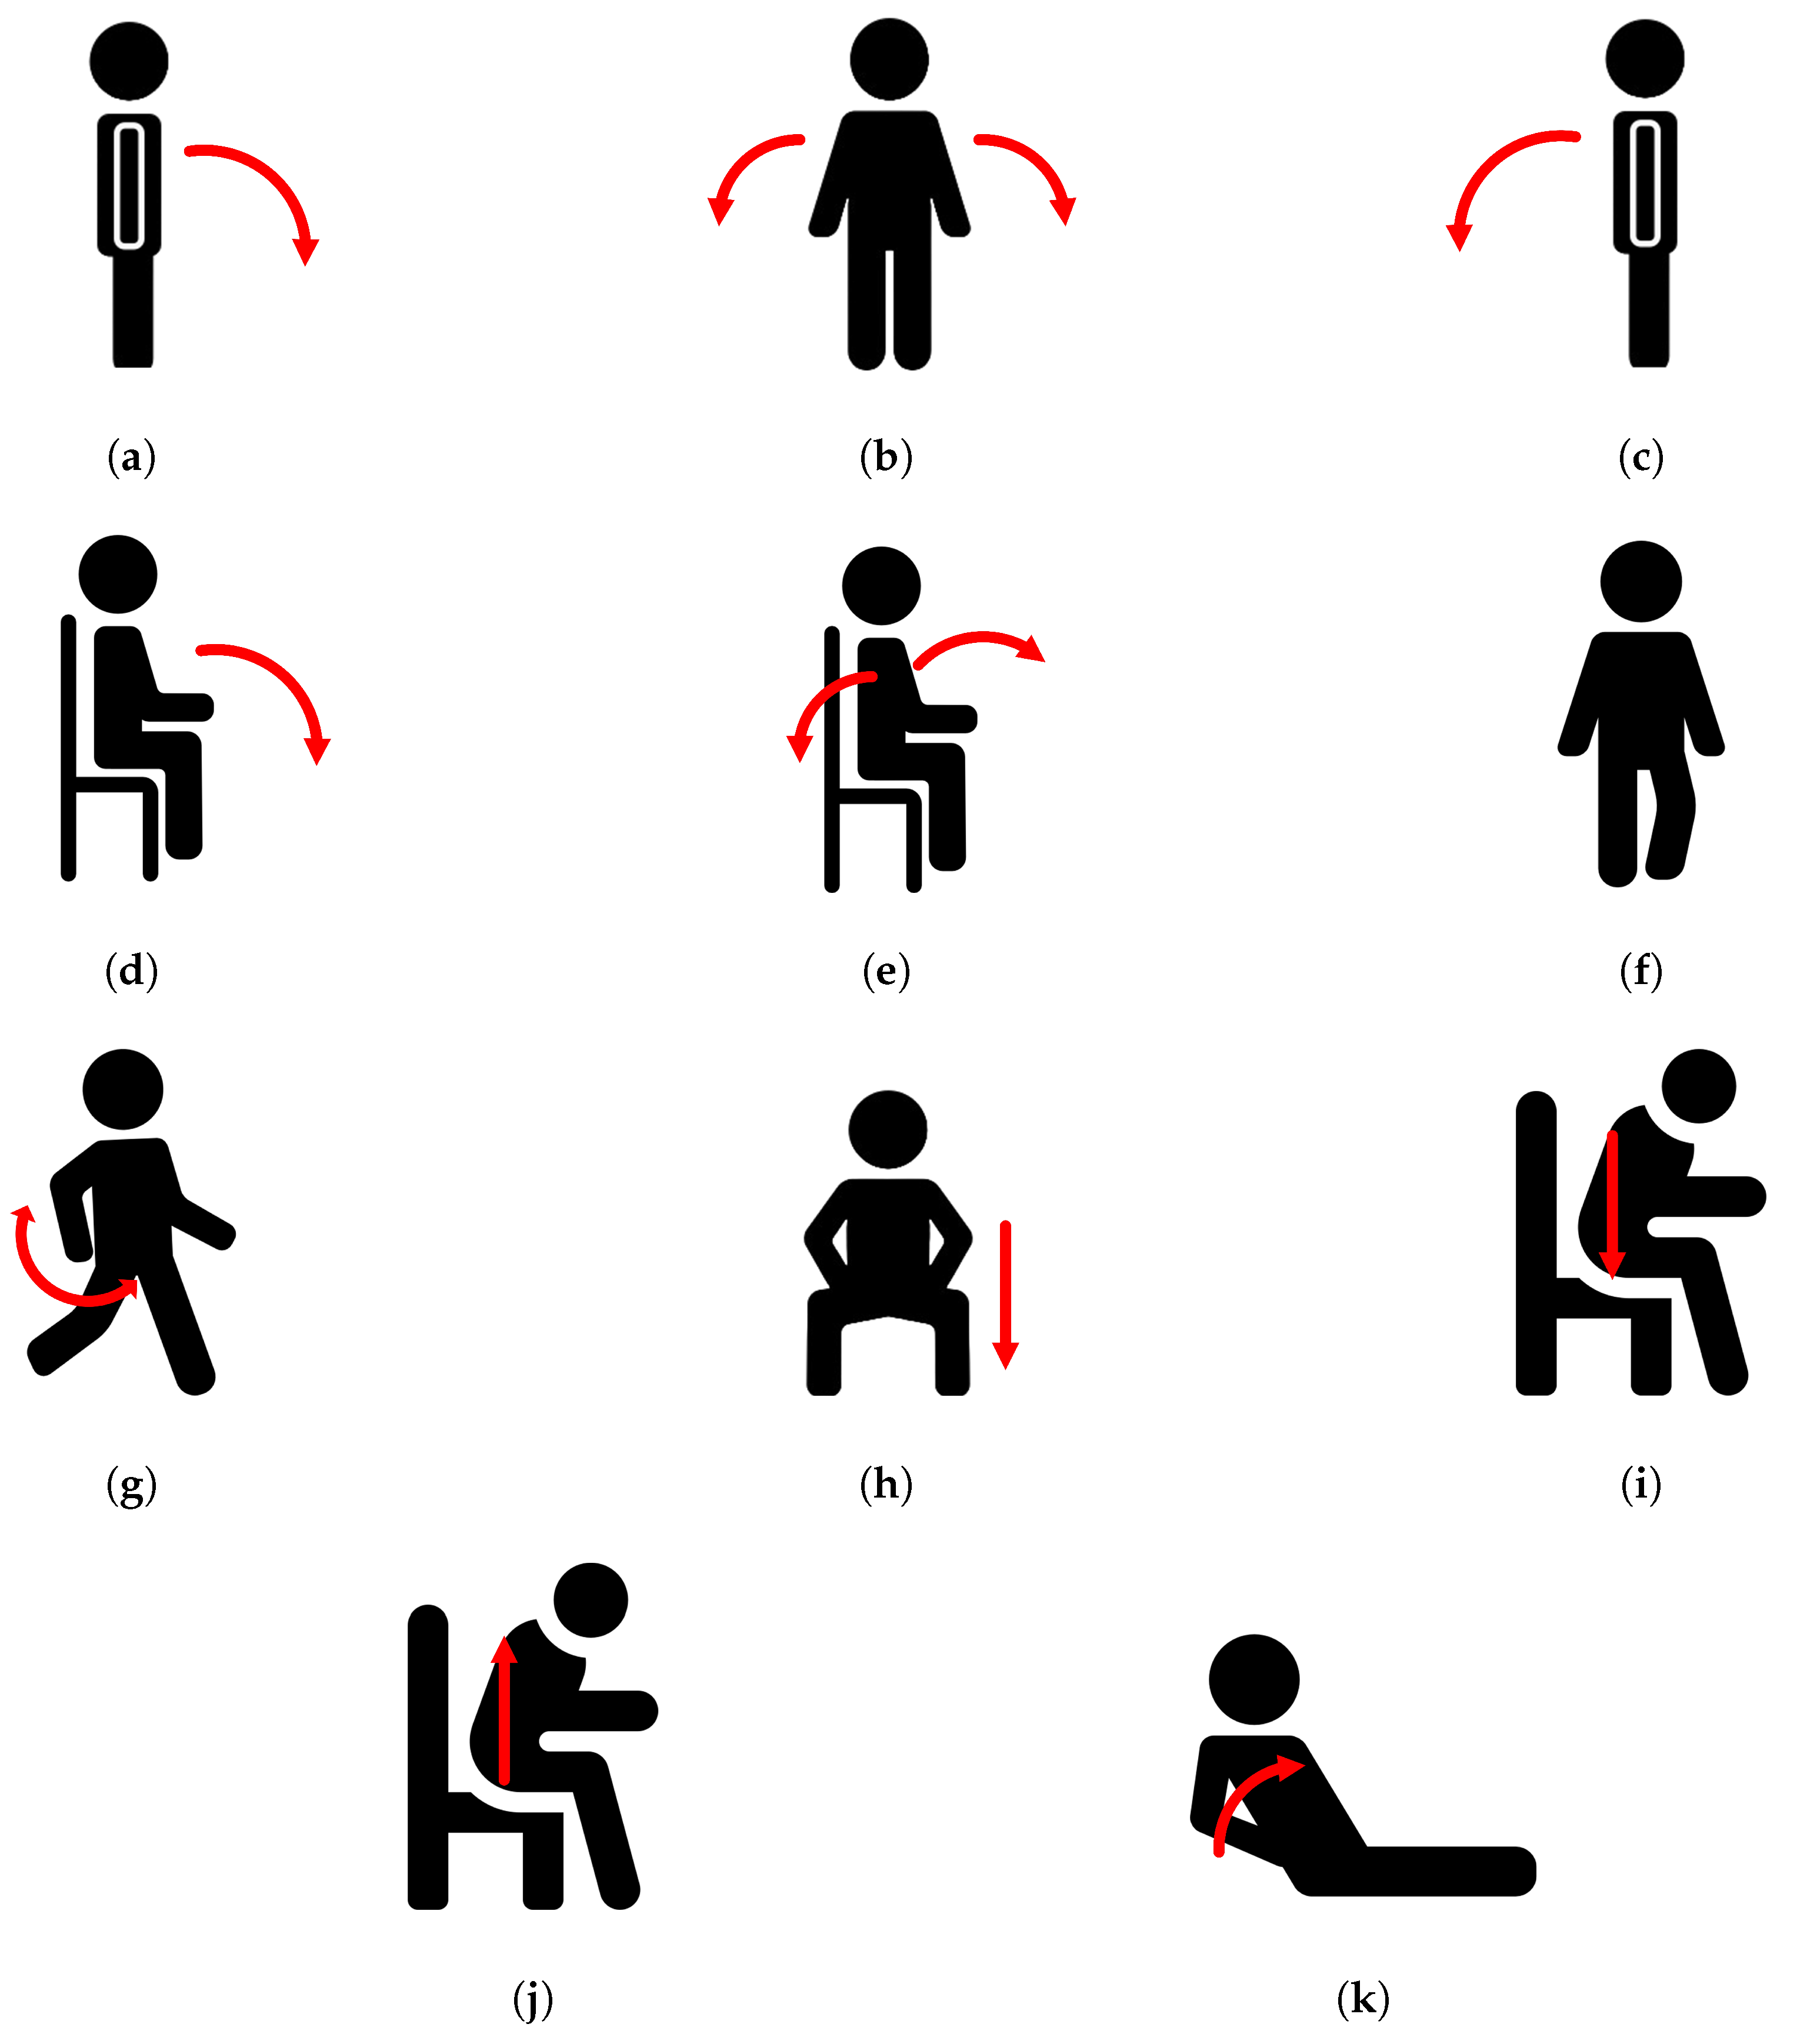
Data measurements were performed with 24 GHz CW radar from Infineon’s Sense2GoL Development Kit [23]. The detailed specifications of the radar are listed in Table 1. The radar sensor and experimental environment are shown in Figure 1. The size of the experimental environment is 3 × 2.5 m2. The radar was positioned 1.3 m above the ground. Further, because only micro-Doppler signatures were used, the distance between the radar and the participants was flexible. The distance was set between 1 and 4 m to account for the indoor environment while remaining within the radar’s maximum measurement range. Additionally, lighting conditions were adjusted to simulate both daytime and nighttime scenarios, and the indoor temperature was varied by opening or closing the window. Five male and female participants with varying heights, weights, and ages participated in the experiment. The Doppler effect, which measures the speed of radar, varies depending on the direction of motion of the target relative to the radar. However, as falls can occur in any direction, we configured the actions in various directions and measured data at different speeds, even within the same action. For example, when standing, a fall can occur in any direction. To account for this, the cases of 0° (forward), ±90° (left/right), and 180° (backward) were selected based on the radar’s line of sight. Conversely, when sitting on a chair or sofa, only the cases of 0° (forward) and ±90° (left/right) were considered, taking the backrest into account. Examples of the actions are shown in Figure 2. There were five fall actions, labeled (a)–(e), and six non-fall actions, labeled (f)–(k).
The results are summarized in Table 2. The total number of data points was 2192, with 1017 and 1175 representing fall and non-fall data, respectively. For (b), there were 306 data points, with 153 for falling to the left and the remaining 153 for falling to the right. Similarly, for (e), out of 270 data points, 135 fell to the left, and the remaining 135 fell to the right.

3. Proposed Method

3.1. Overview

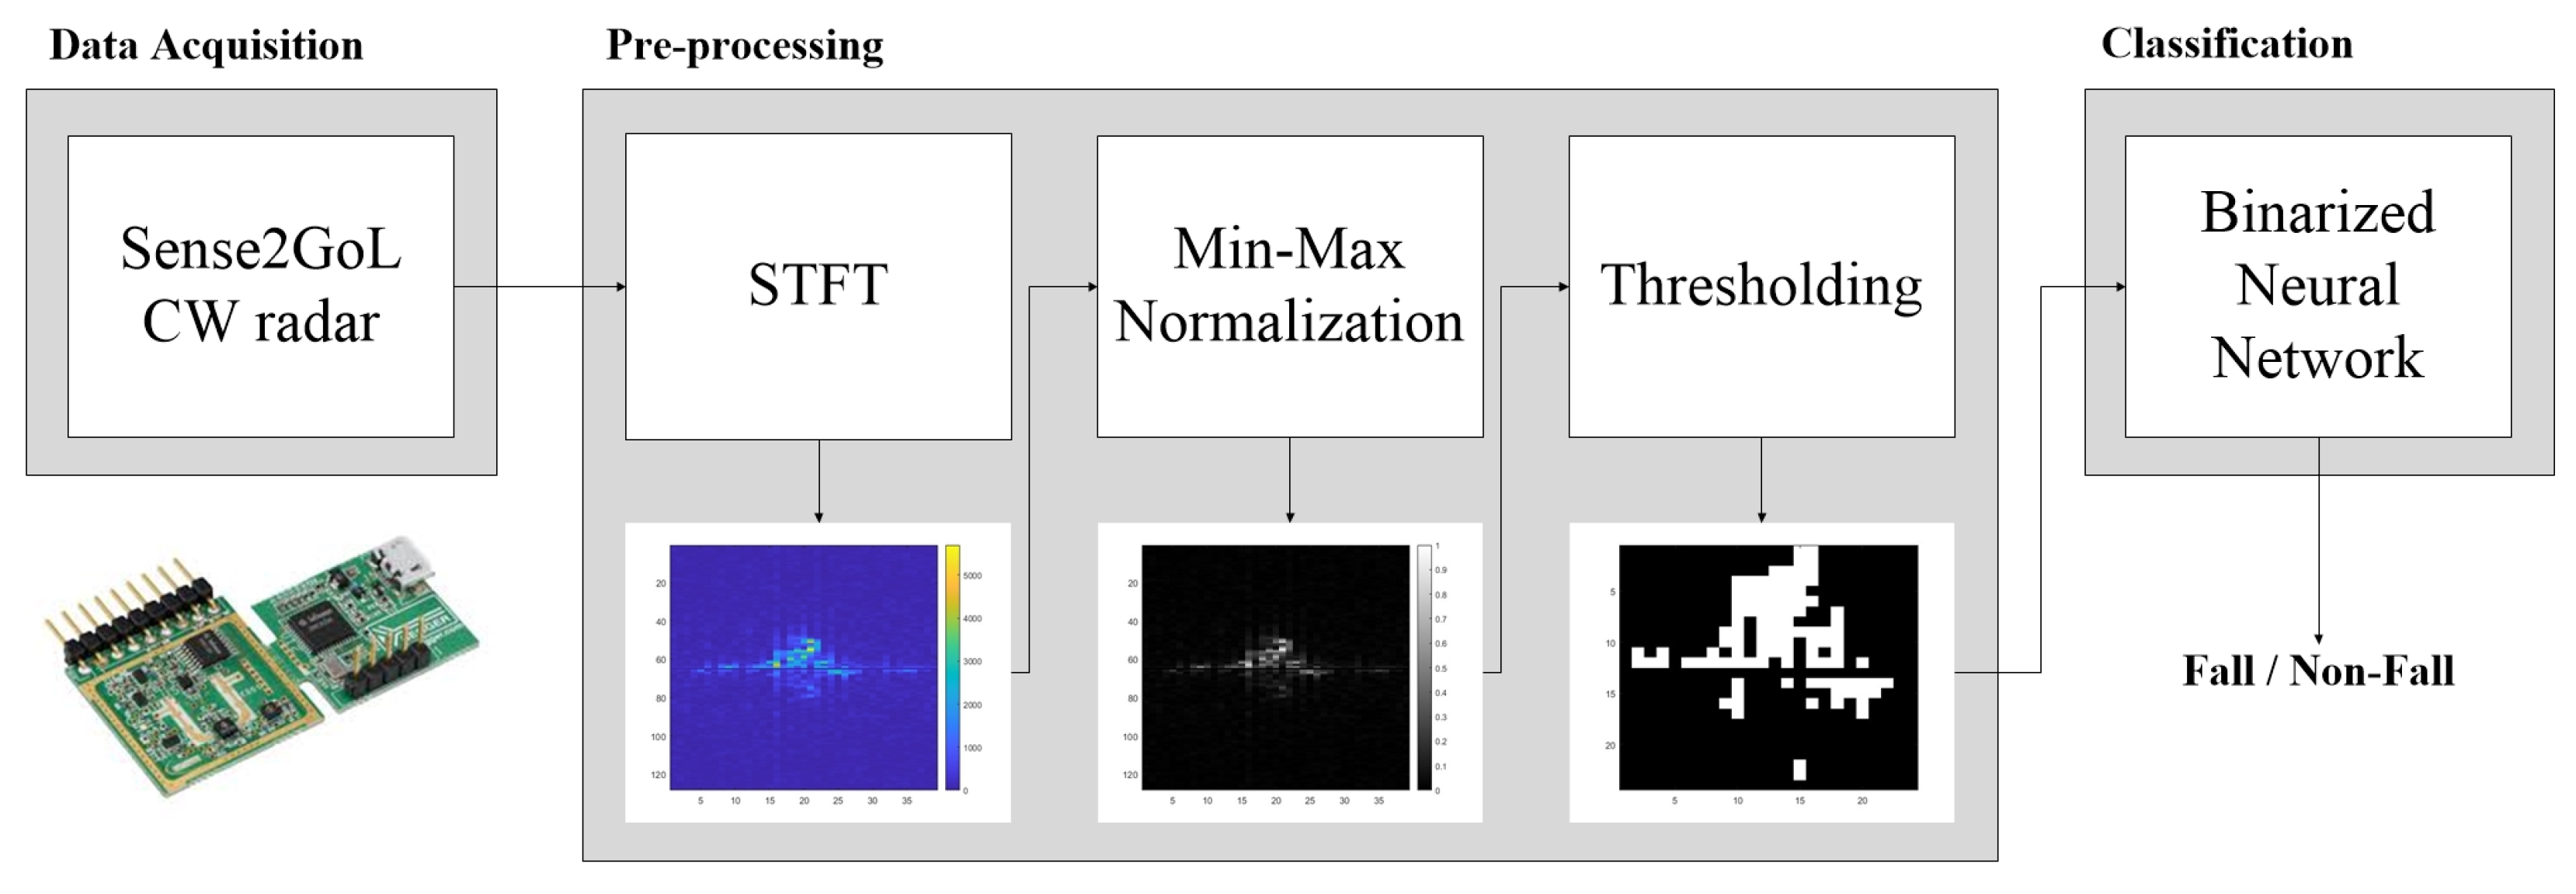
Figure 3 shows the overall structure of the proposed method. In the first step, the data acquired from the CW radar were preprocessed to generate a spectrogram that represented the micro-Doppler signature caused by human movement. The preprocessing consisted of STFT, min-max normalization, and thresholding. In the second step, the generated spectrogram was input into the BNN to detect falls. During this process, features were extracted and classified through the convolution layer (CL) and fully connected layer (FCL).

3.2. Pre-Processing

3.2.1. Short-Time Fourier Transform

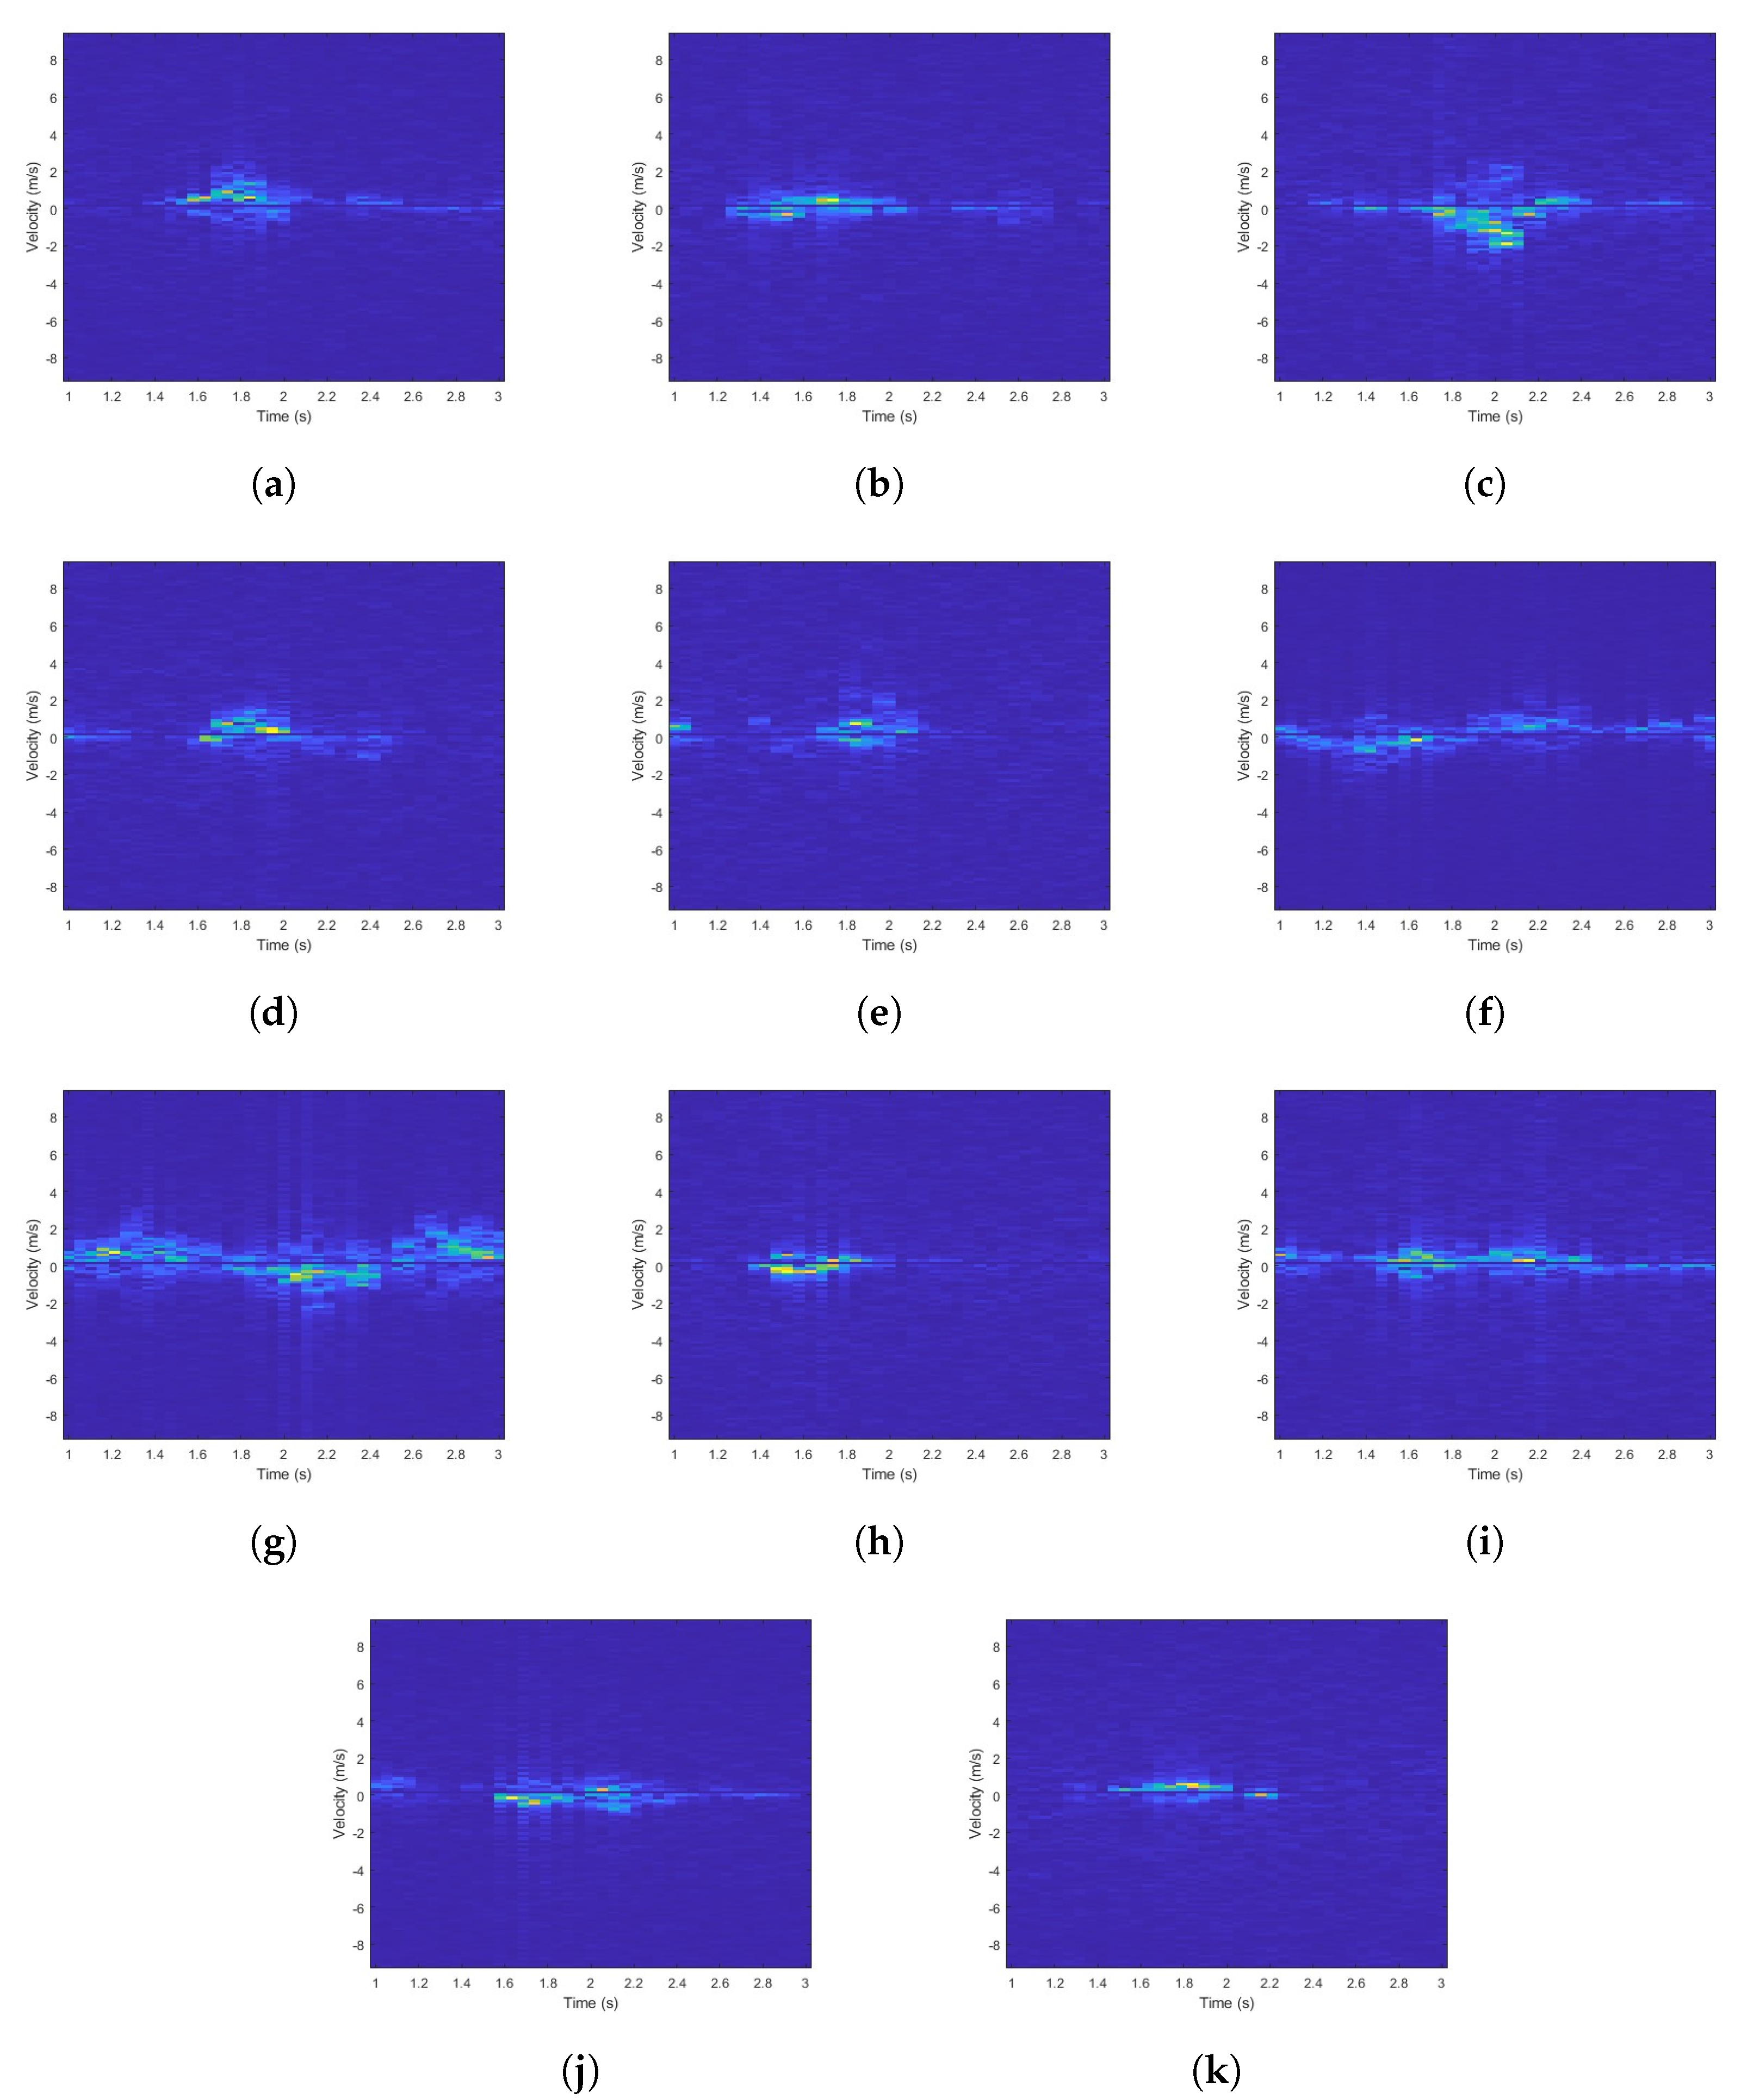
When a target moves, the received and transmitted radar signals have different frequencies, which is known as the Doppler effect. The difference between the two frequencies is referred to as the Doppler frequency. If vibration or rotational movement is added to a moving object, an additional Doppler effect, called the micro-Doppler effect, occurs. FFT is a signal processing method that converts a signal from the time domain to the frequency domain. Because FFT is applied to the entire signal, it cannot detect the micro-Doppler signature, which is a subtle signal over short periods of time. Therefore, STFT, which divides the entire signal into intervals and performs FFT operations, was used. The calculation process is shown in Equation (1). Since STFT performs FFT on segmented signals, it provides time information and allows the signal to be represented as a spectrogram in the time-frequency domain. To perform STFT, three parameters must be determined: The first is the window size, which is the length of the signal on which the FFT is to be performed. The second is the window overlap ratio, which determines how much the windows overlap to perform the STFT. The third is the FFT point. The STFT parameters used in the proposed method were a window size of 128, window overlap ratio of 50%, and 128 FFT points. Examples of the spectrograms for actions (a)–(k) are shown in Figure 4.
X m , w = n = x n w n m e i w n

3.2.2. Min–Max Normalization

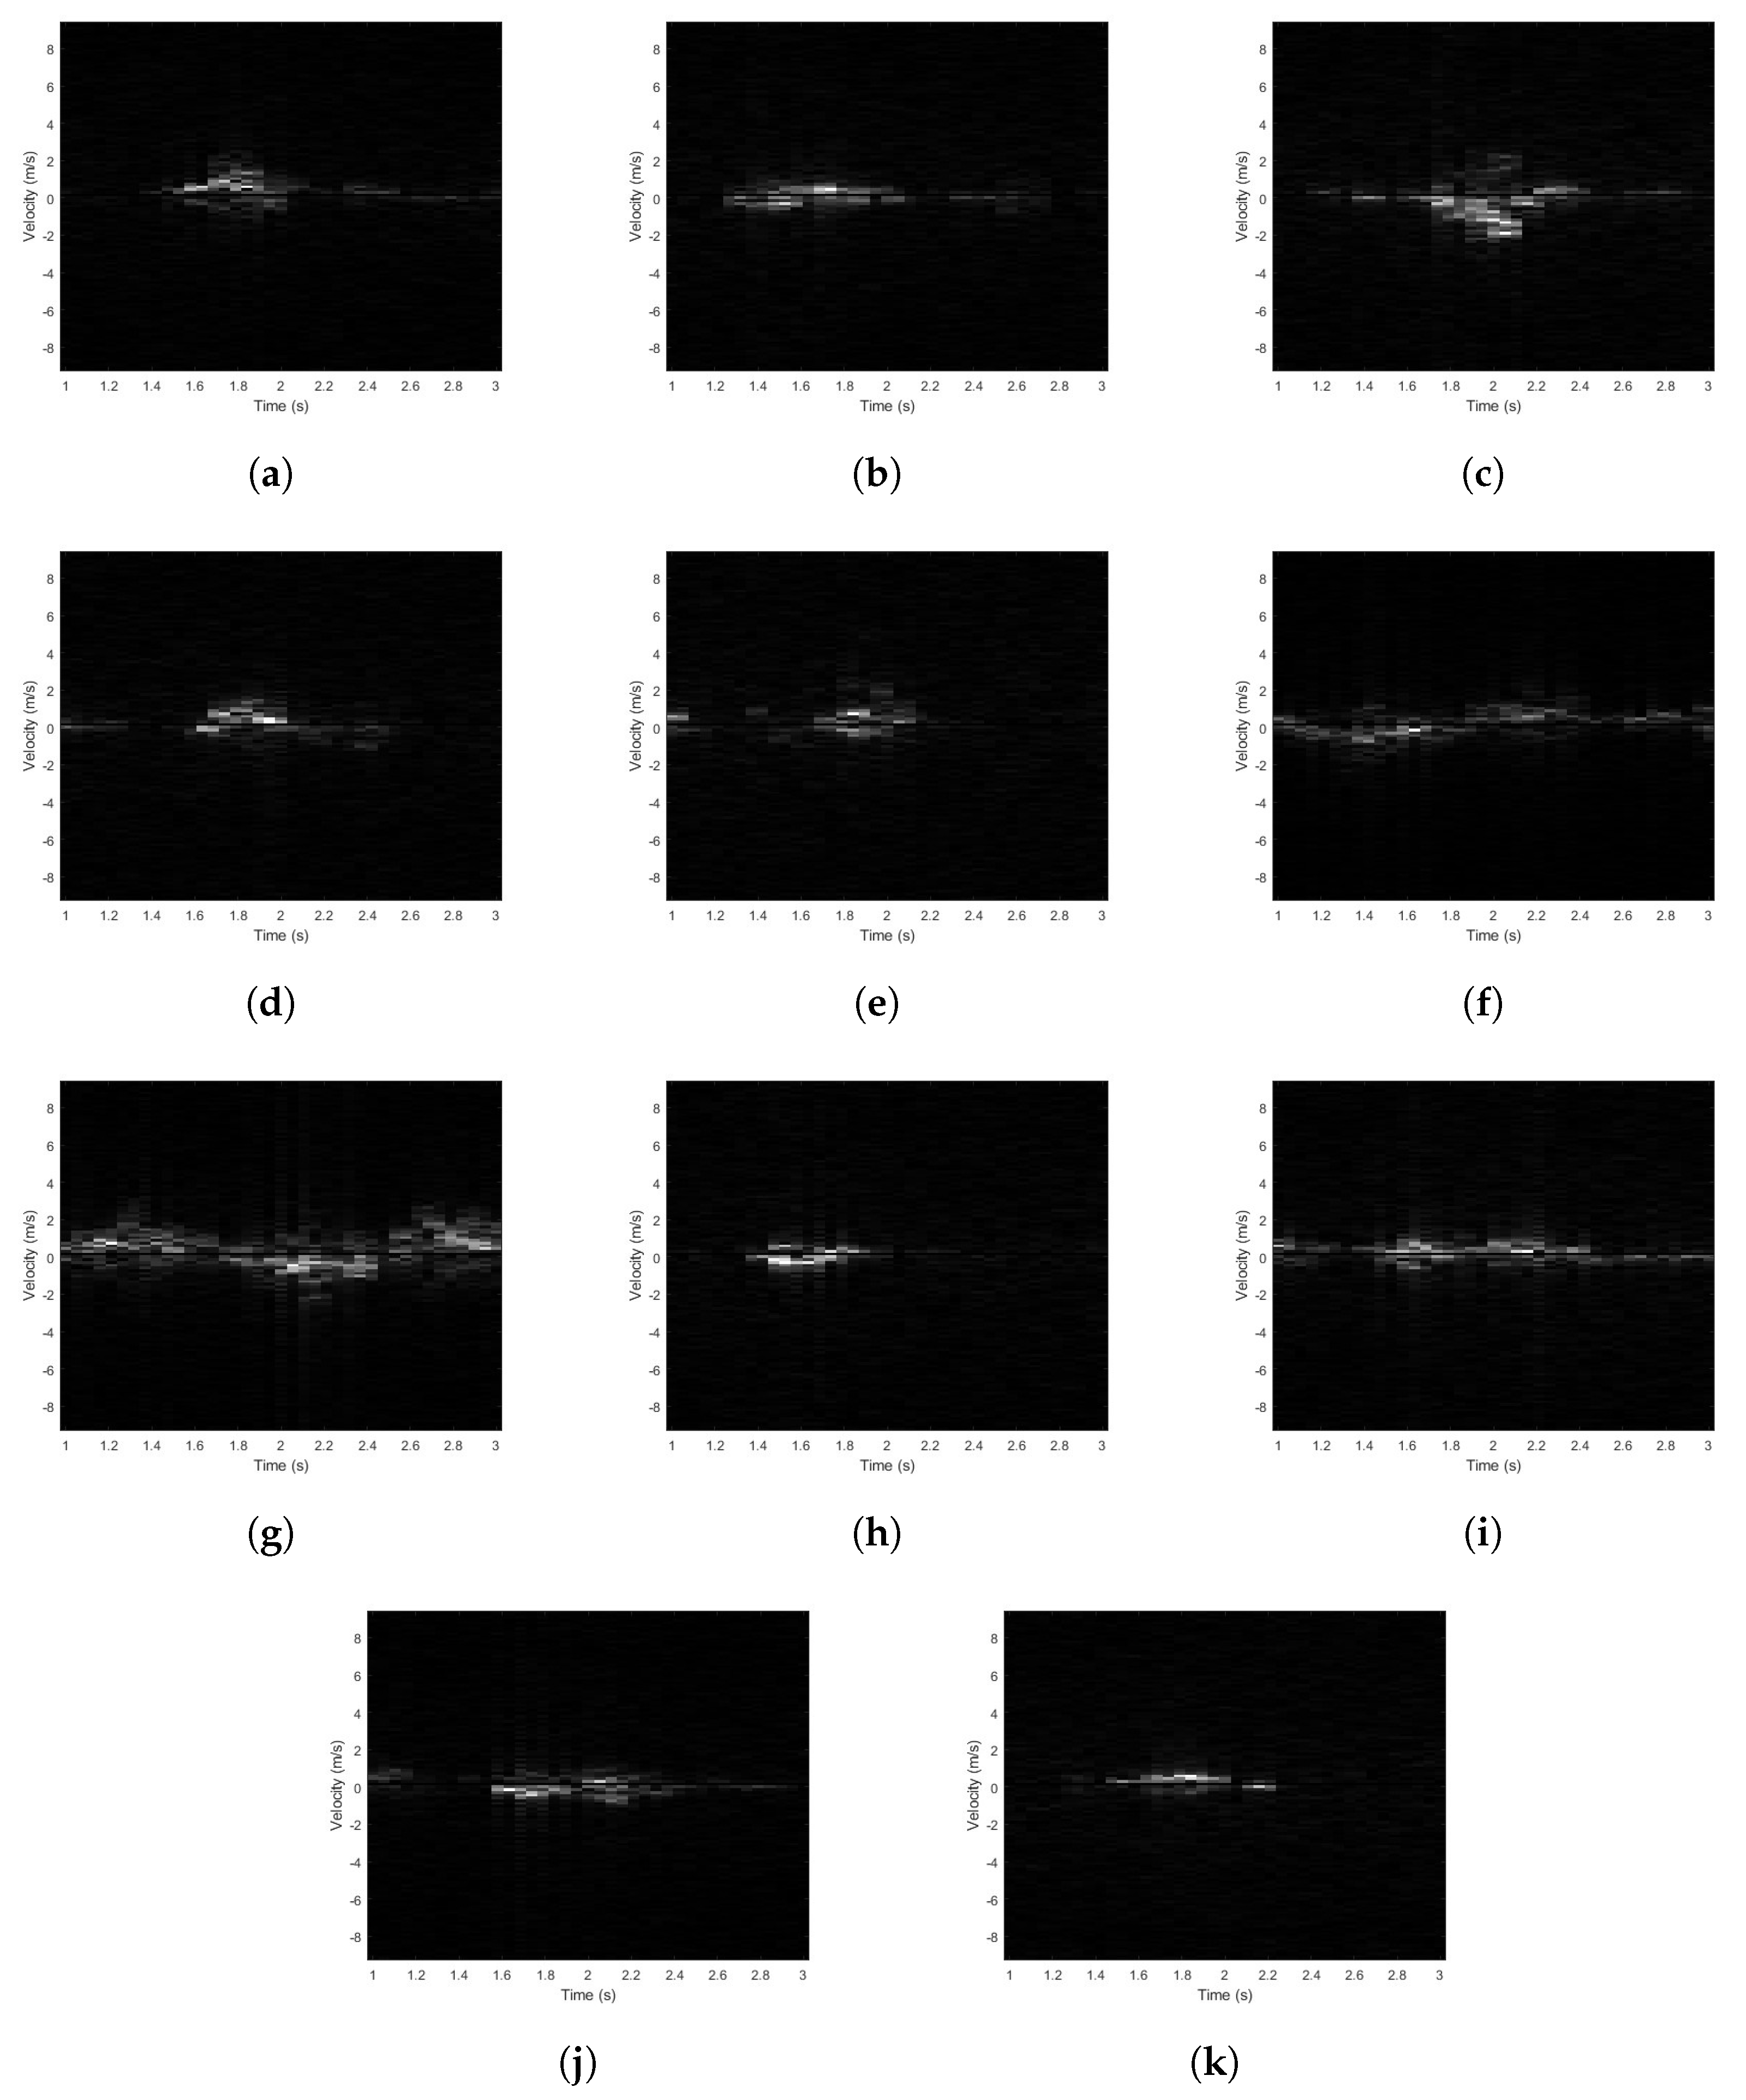
Next, min-max normalization was performed. This process adjusts all pixel values within the spectrogram to a range between 0 and 1, as shown in Equation (2). Because fall detection uses the distribution of micro-Doppler signatures as a feature, signal intensity is not important. Therefore, there is no limit restricting the signal intensity to all actions within the same range. Additionally, it allows the system to process signals from various actions using the same algorithm, thereby contributing to a lightweight system design. In Equation (2), x represents the pixel value before normalization, Xmin refers to the minimum value among all the pixels in the spectrogram, and Xmax refers to the maximum value among all the pixels. Examples of normalized spectrograms are shown in Figure 5.
x s c a l e d = x X m i n X m a x X m i n

3.2.3. Thresholding

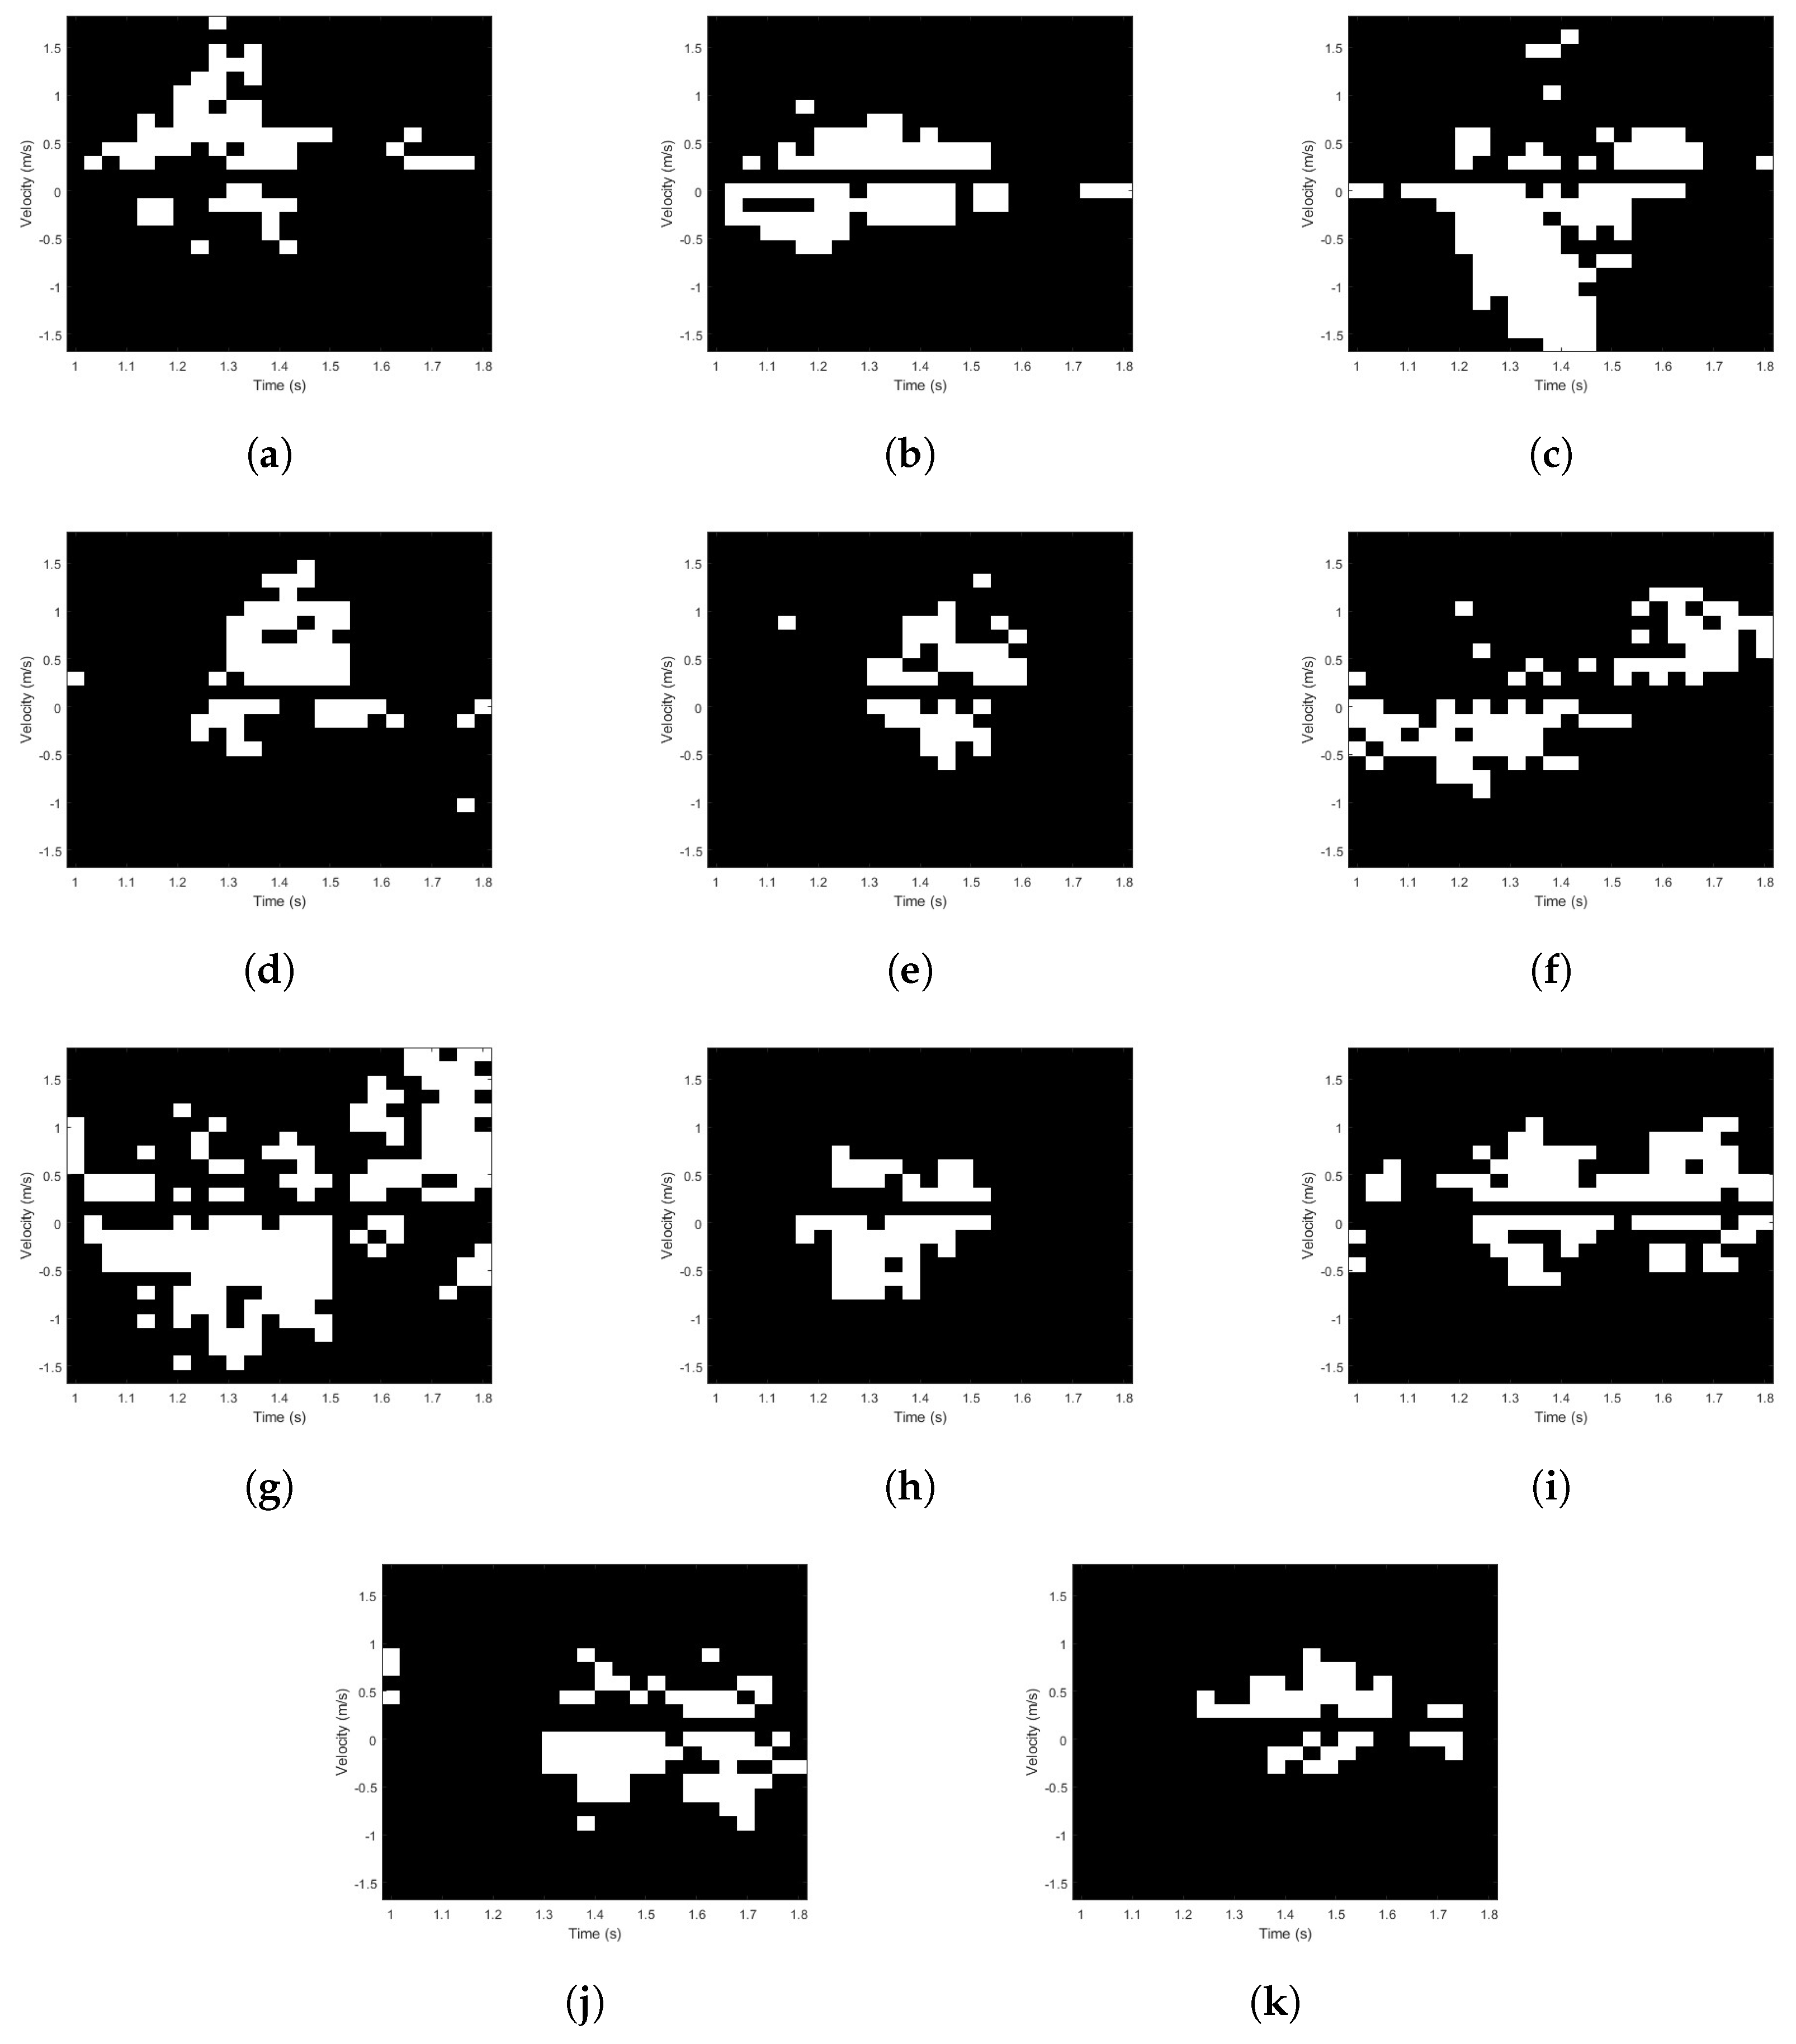
The normalized spectrogram is binarized through thresholding. A threshold value of 0.15 was used, where pixels smaller than the threshold were converted to −1 and the larger the threshold to 1. Since noise typically has a lower signal intensity than the target signal, this process can help remove noise. The threshold value to minimize noise was determined experimentally while preserving the micro-Doppler signatures. Table 3 shows the results of the experiments conducted to select the threshold value. Setting this threshold to 0.15 yields the highest accuracy. The region of interest (ROI) was extracted from the spectrogram with an input size of the network, 24 × 24. Because the spectrogram is composed of −1 and 1, the part with the largest sum of signals is the ROI, which contains the most signals. Examples of the binarized spectrograms are presented in Figure 6.

3.3. Network

This section details the experiment for selecting the network used in the classifier and explains the network structure in detail. The network was based on a convolutional neural network (CNN). The network was selected through experiments by changing the number of convolutional layers, fully connected layers, output channels, and the presence or absence of pooling layers. Approximately 80% of the data was used for training, and the remaining 20% for testing. The cross-entropy function and Adam optimizer were used for training. The epoch and batch sizes were set to 200 and 32, respectively. The learning rates were set to 0.005, 0.001, 0.0005, 0.0001, 0.00005, and 0.00001 when the epochs were 0, 60, 100, 120, 140, and 160, respectively. NVIDIA GeForce RTX 2080 Ti GPU was used for training, requiring 1.5 s per epoch. Table 4 shows the detailed structure of the network used in the experiments, as well as the number of parameters and the accuracy of each network.
Figure 7 shows the number of network parameters and accuracy trend. The experimental results showed that as the number of parameters increased, the accuracy increased and then converged. Network 5 performs much better than Networks 1–4 and slightly worse than Networks 7–9. However, Network 5 has much fewer parameters compared to the accuracy difference with networks 7–9. Therefore, this network is best suited for lightweight applications. The detailed structure of the proposed network is shown in Figure 8. The number of channels in the three convolution layers were 32, 64, and 128, and the kernel sizes were 5, 3, and 3. Batch normalization and max-pooling layers were applied after all convolution layers. A hard hyperbolic tangent was used as the activation function.

4. Experiment Results and Discussion

In this section, we analyze the results of the experiment and compare its performance with those of previous studies. Table 5 presents the confusion matrix for the test results for the proposed network. Four performance metrics were obtained from the confusion matrix. The performance metrics used are shown in Equations (3)–(6). For the 452 data point experiment, the numbers of true positives (TP), false negatives (FN), false positives (FP), and true negatives (TN) were 193, 14, 17, and 228, respectively. Thus, the proposed method achieved a precision of 93.2%, a recall of 91.9%, an F1-score of 92.5, and an accuracy of 93.1%.
P r e c i s i o n = T P T P + F P
R e c a l l = T P T P + F N
F 1 s c o r e = 2 × P r e c i s i o n × R e c a l l P r e c i s i o n + R e c a l l
A c c u r a c y = T P + T N T P + T N + F P + F N
Table 6 compares the performance of the proposed method with those of previous studies. Ref. [12] and the proposed method have almost similar performance with an accuracy difference of 0.3. However, our method has 2.75 times more actions and requires approximately 93% less memory. Ref. [16] has a 2.1% higher accuracy than the proposed method but has 36% fewer actions and requires approximately 91.9 times more memory. In addition, the cost of the overall system increases significantly owing to the use of FMCW radar. Compared with [18], the proposed method shows a higher accuracy, has 2.2 times more actions, and requires 99.4% less memory. Compared to [19], the proposed method is 2.7% less accurate and has 2.2 times more actions and requires approximately 99.9% less memory.

5. Conclusions

This study proposes a lightweight fall detection method that uses CW radar and a BNN. We preprocessed the radar-acquired data to generate a spectrogram representing the micro-Doppler signature of human motion and used a deep-learning algorithm to classify it for fall detection. However, the many parameters of deep-learning algorithms and the resulting high memory requirements pose significant limitations for fall detection systems in home environments. To resolve this issue, a BNN was used to implement a lightweight fall detection method. The proposed method has a lower or similar overall performance compared with previous studies; however, it has a larger number of distinguishable motions and significantly reduced memory usage, making it more suitable for home-based fall detection systems. The proposed method achieved an accuracy of 93.1%, which is up to 2% lower than that in previous studies. However, it can distinguish up to 2.75 times more actions and uses up to 99.9% less memory (11.9 KB), confirming its suitability for home fall detection systems where light weight is essential.
In future work, we plan to implement the BNN on a VLSI to reduce power consumption and shorten the inference time, thereby developing a more advanced lightweight fall detection system.

Author Contributions

H.C. designed and implemented the proposed fall detection system, collected radar data, performed the experiment and evaluation, and wrote the paper. S.K. evaluated the proposed fall detection system and revised this manuscript. Y.S. evaluated the proposed fall detection system and revised this manuscript. S.L. evaluated the proposed fall detection system and revised this manuscript. Y.J. conceived of and led the research, analyzed the experimental results, and wrote the paper. All authors read and agreed to the published version of the manuscript.

Funding

This work was supported by the MSIT (Ministry of Science and ICT), Korea, under the ITRC (Information Technology Research Center) support program (RS-2024-00438007) and the MOTIE (Ministry of Trade, Industry, and Energy), Korea, under the Technology Innovation Program (RS-2024-00433615); the CAD tools were supported by IDEC.

Institutional Review Board Statement

Not applicable.

Informed Consent Statement

Not applicable.

Data Availability Statement

Data are contained within the article.

Conflicts of Interest

The authors declare no conflict of interest.

References

  1. Wang, C.; Lu, W.; Narayanan, M.R.; Chang, D.C.W.; Lord, S.R.; Redmond, S.J.; Lovell, N.H. Low-power fall detector using triaxial accelerometry and barometric pressure sensing. IEEE Trans. Ind. Inform. 2016, 12, 2302–2311. [Google Scholar] [CrossRef]
  2. Saadeh, W.; Butt, S.A.; Altaf, M.A.B. A Patient-Specific Single Sensor IoT-Based Wearable Fall Prediction and Detection System. IEEE Trans. Neural Syst. Rehabil. Eng. 2019, 27, 995–1003. [Google Scholar] [CrossRef]
  3. Lee, J.-S.; Tseng, H.-H. Development of an enhanced threshold-based fall detection system using smartphones with built-in accelerometers. IEEE Sens. J. 2019, 19, 8293–8302. [Google Scholar] [CrossRef]
  4. Harrou, F.; Zerrouki, N.; Sun, Y.; Houacine, A. An integrated vision-based approach for efficient human fall detection in a home environment. IEEE Access 2019, 7, 114966–114974. [Google Scholar] [CrossRef]
  5. Kamel, A.; Sheng, B.; Yang, P.; Li, P.; Shen, R.; Feng, D.D. Deep convolutional neural networks for human action recognition using depth maps and postures. IEEE Trans. Syst. Man Cybern. Syst. 2018, 49, 1806–1819. [Google Scholar] [CrossRef]
  6. Yu, M.; Rhuma, A.; Naqvi, S.M.; Wang, L.; Chambers, J. A posture recognition-based fall detection system for monitoring an elderly person in a smart home environment. IEEE Trans. Inf. Technol. Biomed. 2012, 16, 1274–1286. [Google Scholar] [CrossRef] [PubMed]
  7. Chelli, A.; Pätzold, M. A Machine Learning Approach for Fall Detection Based on the Instantaneous Doppler Frequency. IEEE Access 2019, 7, 166173–166189. [Google Scholar] [CrossRef]
  8. Shiba, K.; Kaburagi, T.; Kurihara, Y. Fall detection utilizing frequency distribution trajectory by microwave Doppler sensor. IEEE Sens. J. 2017, 17, 7561–7568. [Google Scholar] [CrossRef]
  9. Tewari, R.C.; Sharma, S.; Routray, A.; Maiti, J. Effective fall detection and post-fall breath rate tracking using a low-cost CW Doppler radar sensor. IEEE Sens. J. 2023, 164, 107315. [Google Scholar] [CrossRef]
  10. Tewari, R.C.; Routray, A.; Maiti, J. Enhanced Robustness in Low-Cost Doppler Radar Based Fall Detection System via Kalman Filter Tracking and Transition Activity Analysis. In Proceedings of the 2023 IEEE 20th India Council International Conference (INDICON), Hyderabad, India, 14–17 December 2023. [Google Scholar]
  11. Lu, J.; Ye, W.-B. Design of a Multistage Radar-Based Human Fall Detection System. IEEE Sens. J. 2022, 22, 13177–13187. [Google Scholar] [CrossRef]
  12. Yoshino, H.; Moshnyaga, V.G.; Hashimoto, K.J.I. Fall Detection on a single Doppler Radar Sensor by using Convolutional Neural Networks. In Proceedings of the 2019 IEEE International Conference on Systems, Man and Cybernetics (SMC), Bari, Italy, 6–9 October 2019; pp. 171–1724. [Google Scholar]
  13. Li, Z.; Du, J.; Zhu, B.; Greenwald, S.E.; Xu, L.; Yao, Y.; Bao, N. Doppler Radar Sensor-Based Fall Detection Using a Convolutional Bidirectional Long Short-Term Memory Model. Sensors 2024, 24, 5365. [Google Scholar] [CrossRef] [PubMed]
  14. Ding, C.; Zou, Y.; Sun, L.; Hong, H.; Zhu, X.; Li, C. Fall detection with multi-domain features by a portable FMCW radar. In Proceedings of the 2019 IEEE MTT-S International Wireless Symposium (IWS), Guangzhou, China, 19–22 May 2019. [Google Scholar]
  15. Rezaei, A.; Mascheroni, A.; Stevens, M.C.; Argha, R.; Papandrea, M.; Puiatti, A.; Lovell, N.H. Unobtrusive Human Fall Detection System Using mmWave Radar and Data Driven Methods. IEEE Sens. J. 2023, 23, 7968–7976. [Google Scholar] [CrossRef]
  16. Wang, B.; Guo, L.; Zhang, H.; Guo, Y.-X. A Millimetre-Wave Radar-Based Fall Detection Method Using Line Kernel Convolutional Neural Network. IEEE Sens. J. 2020, 20, 13364–13370. [Google Scholar] [CrossRef]
  17. Sun, Y.; Hang, R.; Li, Z.; Jin, M.; Xu, K. Privacy-Preserving Fall Detection with Deep Learning on mmWave Radar Signal. In Proceedings of the 2019 IEEE Visual Communications and Image Processing (VCIP), Sydney, Australia, 1–4 December 2019. [Google Scholar]
  18. Sadreazami, H.; Bolic, M.; Rajan, S. Fall detection using standoff radar-based sensing and deep convolutional neural network. IEEE Trans. Circuits Syst. II Express Briefs 2020, 67, 197–201. [Google Scholar] [CrossRef]
  19. Sadreazami, H.; Bolic, M.; Rajan, S. Contactless Fall Detection Using Time-Frequency Analysis and Convolutional Neural Networks. IEEE Trans. Ind. Inform. 2021, 17, 6842–6851. [Google Scholar] [CrossRef]
  20. Sadreazami, H.; Bolic, M.; Rajan, S. CapsFall: Fall detection using ultra-wideband radar and capsule network. IEEE Access 2019, 7, 55336–55343. [Google Scholar] [CrossRef]
  21. Wang, P.; Li, Q.; Yin, P.; Wang, Z.; Ling, Y.; Gravina, R.; Li, Y. A convolution neural network approach for fall detection based on adaptive channel selection of UWB radar signals. Neural Comput. Appl. 2023, 35, 15967–15980. [Google Scholar] [CrossRef]
  22. Ma, L.; Liu, M.; Wang, N.; Wang, L.; Yang, Y.; Wang, H. Room-level fall detection based on ultra-wideband (UWB) monostatic radar and convolutional long short-term memory (LSTM). Sensors 2020, 20, 1105. [Google Scholar] [CrossRef] [PubMed]
  23. Infineon: DEMO SENSE2GOL. Available online: https://www.infineon.com/cms/en/product/evaluation-boards/demo-sense2gol/ (accessed on 12 September 2024).
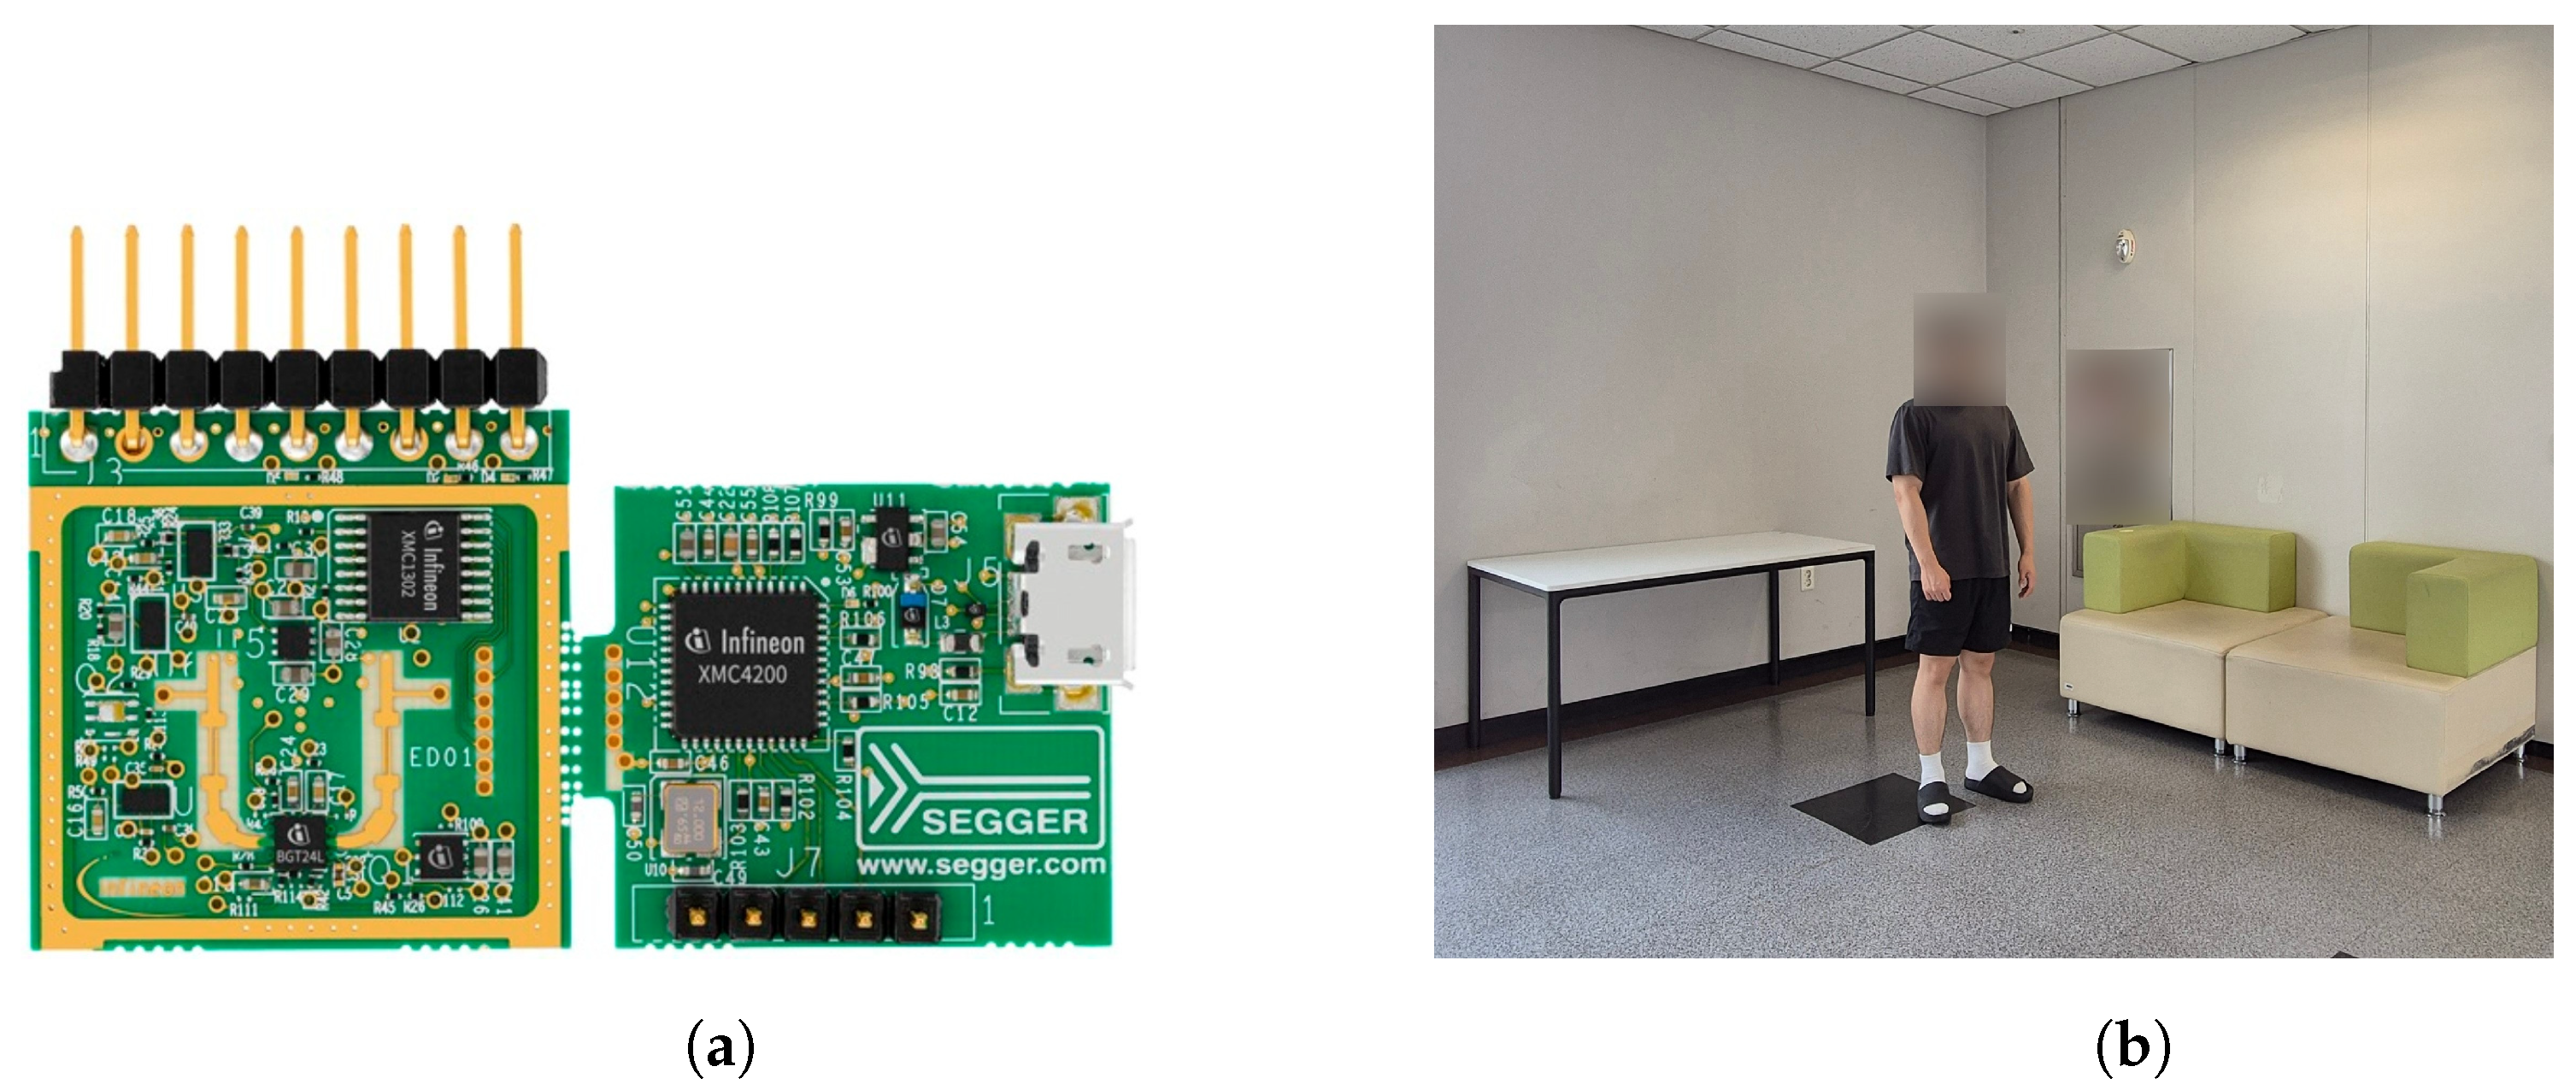
Figure 1. Radar sensor used and experimental environment: (a) radar sensor; (b) experimental environment.
Applsci 15 00546 g001
Figure 2. Examples of actions: (a) standing and then falling forward; (b) standing and then falling to the left/right; (c) standing and then falling backward; (d) sitting and then falling forward; (e) sitting and then falling to the left/right; (f) walking slowly without moving arms; (g) walking quickly whiles winging arms; (h) squatting; (i) sitting on a chair; (j) standing up from sitting on a chair; (k) lying down and then lifting the upper body. Arrows indicate the direction of movement of the upper body or arm.
Applsci 15 00546 g002
Figure 3. Architecture of the proposed method.
Applsci 15 00546 g003
Figure 4. Examples of the spectrograms for action (ak). The colors in the spectrograms represent the signal strength and are expressed using Matlab’s Parula colormap.
Applsci 15 00546 g004
Figure 5. Examples of the normalized spectrograms for action (ak).
Applsci 15 00546 g005
Figure 6. Examples of the binarized spectrograms for action (ak).
Applsci 15 00546 g006
Figure 7. Number of parameters and accuracy of networks.
Applsci 15 00546 g007
Figure 8. Structure of the proposed network.
Applsci 15 00546 g008
Table 1. Radar specifications.
ParametersValue
Frequency24.125 GHz
Minimum speed0.5 km/h
Maximum speed30 km/h
Maximum distance15 m
Horizontal −3 dB beamwidth80°
Elevation −3 dB beamwidth29°
Table 2. Number of data.
ClassActionNo. of Data
Fall(a) standing and then falling forward153
(b) standing and then falling to the left/right306
(c) standing and then falling backward153
(d) sitting and then falling forward135
(e) sitting and then falling to the left/right270
Non-Fall(f) walking slowly without moving arms145
(g) walking quickly while swinging arms145
(h) squatting265
(i) sitting on a chair190
(j) standing up from sitting on a chair190
(k) lying down and then lifting the upper body240
Table 3. Results of threshold selection experiment.
Threshold0.10.1250.150.1750.2
Accuracy (%)91.892.093.192.492.2
Table 4. Results of network configuration experiments.
NetworkNo. of Output ChannelsNo. of Par 1Acc 2 (%)
CL1 CL2 CL3 CL4 FCL1 FCL2
13264--2-21,47284.1
26464--16255,16888.9
3646464-16276,80091.6
43264128-2-93,66492.4
53264128-32297,63293.1
664128128-2-223,68092.2
7128128128-2-299,13693.1
864128256-642387,77693.8
93264128256642454,62493.8
1 Parameters; 2 Accuracy.
Table 5. Confusion matrix of experimental results.
Predicted Label
FallNon-Fall
True label Fall19314
Non-Fall17228
Table 6. Comparison with previous studies.
[12][16][18][19]This Work
SensorCWFMCWUWBUWBCW
Fall actions24335
Non-fall actions23226
NetworkCNNLKCNN 1CNNCNNBNN
Memory usage (MB)0.1761.1032.028282.7430.012
Accuracy (%)93.495.292.795.893.1
1 Line Kernel convolutional neural network.
Disclaimer/Publisher’s Note: The statements, opinions and data contained in all publications are solely those of the individual author(s) and contributor(s) and not of MDPI and/or the editor(s). MDPI and/or the editor(s) disclaim responsibility for any injury to people or property resulting from any ideas, methods, instructions or products referred to in the content.