Abstract
To investigate the influencing factors of the shear failure behavior of rock joints, especially the shear instability characteristics, direct shear tests were performed on marble joints with various grain sizes under different constant normal loads (CNLs). The experimental results show that the grain size and CNL have significant effects on the shear mechanical properties of rock joints. The peak shear strength (τp), peak shear displacement (up), post-peak modulus (S), and stress drop (Δτ) of rock joints all increase first and then decrease with the increase in grain size, but they increase with the increase in CNL. The mineral composition and microstructure also have a certain influence on the shear mechanical properties of rock joints. In addition, the post-peak soften modulus (Sp) was proposed to describe the shear instability characteristics of rock joints, and its relationship with grain size and CNL was established. The mechanical model of the shear instability of rock joints was established, and the shear instability criterion of rock joints was proposed based on the stiffness criterion and the proposed post-peak soften modulus (Sp). This paper further reveals the shear instability mechanism of rock joints, which can provide a reference for the stability analysis of jointed rockmass.
1. Introduction
Engineering rockmass is cut by many discontinuities of different sizes and orientations, which affect the stability of engineering rockmass to a great extent. Rock engineering disasters such as rockburst, roof fall, and pillar failure are closely related to the deformation and unstable sliding of discontinuities [1,2,3,4,5]. Therefore, many efforts have been made to study the shear failure properties and influencing factors of rock joints.
The influencing factors of the shear failure properties of rock joints can be summarized as intrinsic and extrinsic influencing factors [6]. The intrinsic influencing factors mainly include JRC (determined by the grain size) and the mechanical properties of jointed rockmass (determined by the mineral composition and microstructure). Zhang et al. [7] conducted direct shear tests on artificial joint specimens with different inclination angles and found that the inclination angle had a positive correlation with the strength of rock joints, and the shear failure mode changes as the inclination angle increases. Meng et al. [8] studied the shear failure behavior of two kinds of granite joints and found that the peak shear strength and post-peak characteristics were significantly different. Joint B with a higher peak shear strength is related to the rougher joint surface, which is associated with a larger mineral grain size [9], while joint A, with a more violent post-peak failure intensity, is due to a smaller mineral grain size, compact structure, and fewer inherent cracks [10,11], which favor a greater energy build-up in asperities. Wang et al. [12] studied the effect of joint roughness on shear strength and permeability through the numerical simulation method and found that rougher joints exhibit higher shear strength and the long-term suppression of permeability.
The extrinsic influencing factors mainly include stress condition (e.g., shear rate and normal load), engineering disturbance, infill, and groundwater [13,14,15,16]. Direct shear tests under various normal stresses were conducted to investigate the shear failure behavior of rock joints [17], and violent post-peak stress drops and stick-slip phenomenon occurred when normal stress was greater than 5 MPa and 10 MPa, respectively. Moreover, the shear rate also has a significant effect on the stick-slip behavior of rock joints [18,19], and experimental results show that the stick-slip phenomenon gradually disappears with an increasing loading rate. Li, Gong [2] conducted direct shear tests on ice-filled rock joints to study the influence of ice-layer thicknesses on the shear failure behavior of rock joints and found that the cohesive strength of ice-filled joints evolves exponentially with increasing ice-layer thickness. In order to study the influence of engineering disturbances, shear test apparatus that can apply dynamic shear load was developed to study the influence of dynamic shear load on the shear failure behavior of rock joints [20]. Moreover, the influence of the dynamic change in the normal load on the shear failure behavior of rock joints has also been studied [21], and dynamic disturbances accelerate the fracture process of rock joints and promote the weakening effect of shear fracture.
In summary, previous studies have paid more attention to the conventional shear behavior of rock joints, such as the shear strength, seepage characteristics, and wear mechanism of the rock joint surface. However, the shear instability mechanism of the rock joint and its influencing factors have not been studied extensively. Shear instability (or unstable shear failure) refers to a shear failure of rock discontinuities in a sudden and violent manner [22,23,24]. In addition, the influencing factors (e.g., grain size and normal load) that affect the shear instability of rock joints have been relatively unexplored. Current research lacks a quantitative description of shear instability and influencing factors, and a shear instability model and criterion of rock joints should be proposed to quantitatively characterize the post-peak failure intensity and the influence of grain size and normal load on shear instability.
In this study, we carried out experimental and theoretical analysis of the shear instability characteristics of jointed marble specimens with various grain sizes. The aim of this paper is to give a short introduction to the relationship between unstable shear property and its intrinsic influencing factors (such as mineral composition, rock texture, and grain size) and extrinsic factors (such as constant normal load of rock joints). First, the experimental system, scheme, and results are introduced in Section 2. Second, the effects of grain size and normal load on the shear mechanical properties, especially the shear instability characteristics of rock joints, are analyzed in Section 3. Third, the mechanical model of the shear instability of rock joints is established, and the experimental results of the shear instability behavior are verified in Section 4.
2. Laboratory Tests and Results
2.1. Experimental System
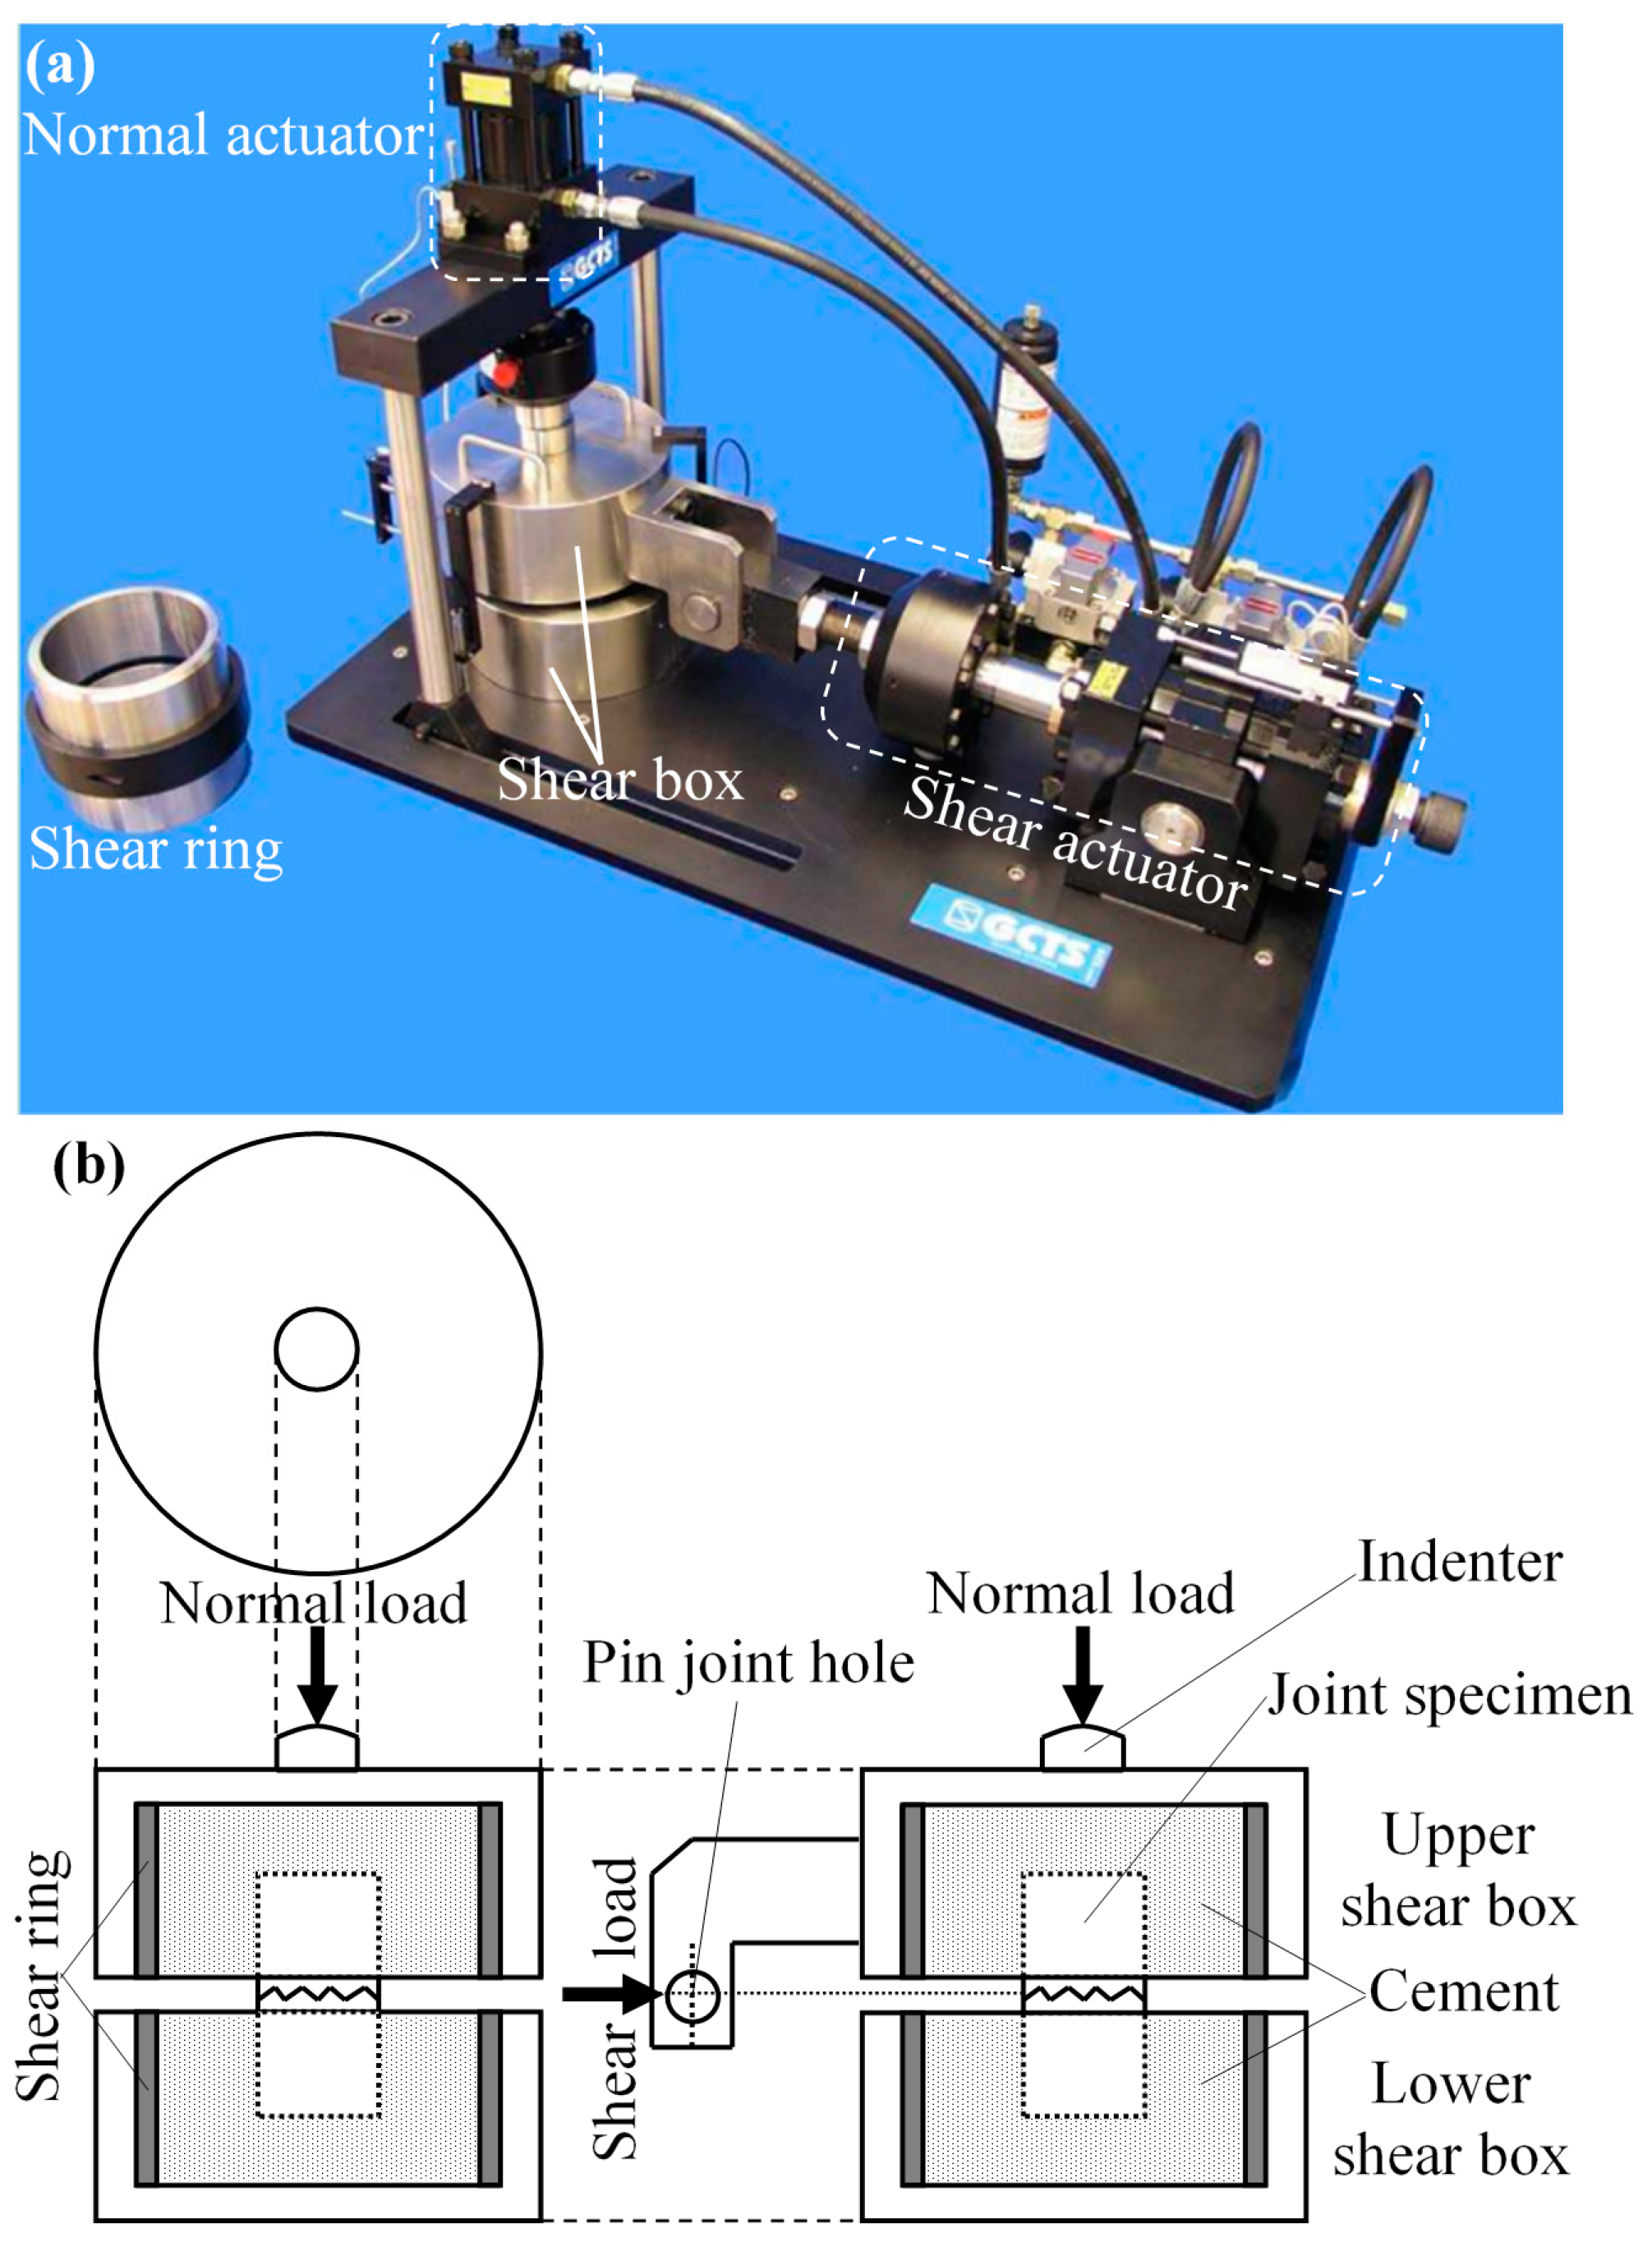
Figure 1 shows the rock direct shear test system (RDS-200) designed by Geotechnical Consulting and Testing Systems (GCTS), which was used for conducting rock joint direct shear tests in this study. As shown in Figure 1a, RDS-200 automatically controls shear and normal load by the electro-hydraulic servo system. The shear and normal load capacities of this system were 10 t and 5 t, and the shear and normal strokes were 25 mm. Figure 1b illustrates the three-view drawing of shear boxes. The joint specimen was fixed at the center of shear boxes so that the joint was exposed in the middle for the direct shear test. The lower shear box was fixed, and a horizontal force induced by the movement of the shear actuator was applied to the upper shear box. The normal force induced by the movement of the normal actuator was applied on the joint surface through the upper shear box. It should be noted that the special quick-setting cement had a UCS of 80 MPa and Young’s modulus of 30 GPa, and the influence of the deformation of encapsulating material on the measurement accuracy was so slight (less than 1% in this paper) during the direct shear test that it could be ignored.
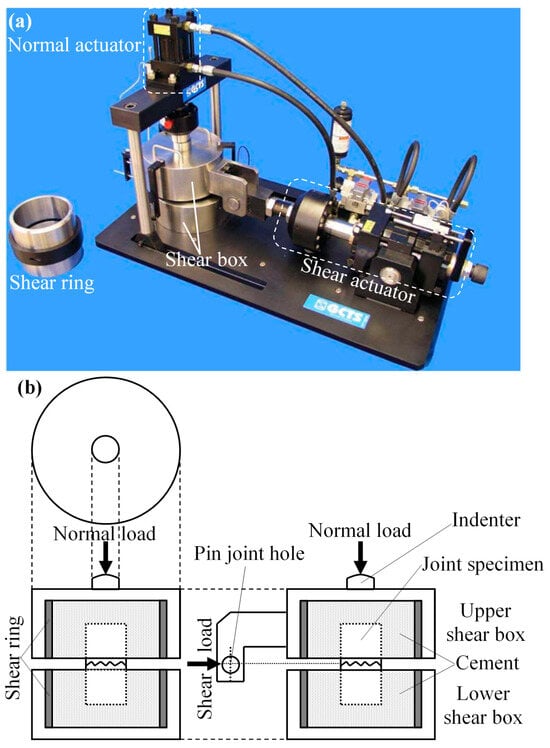
Figure 1.
RDS-200 direct shear test system of GCTS. (a) Direct shear test apparatus; (b) three-view drawing of shear boxes.
2.2. Sample Preparation
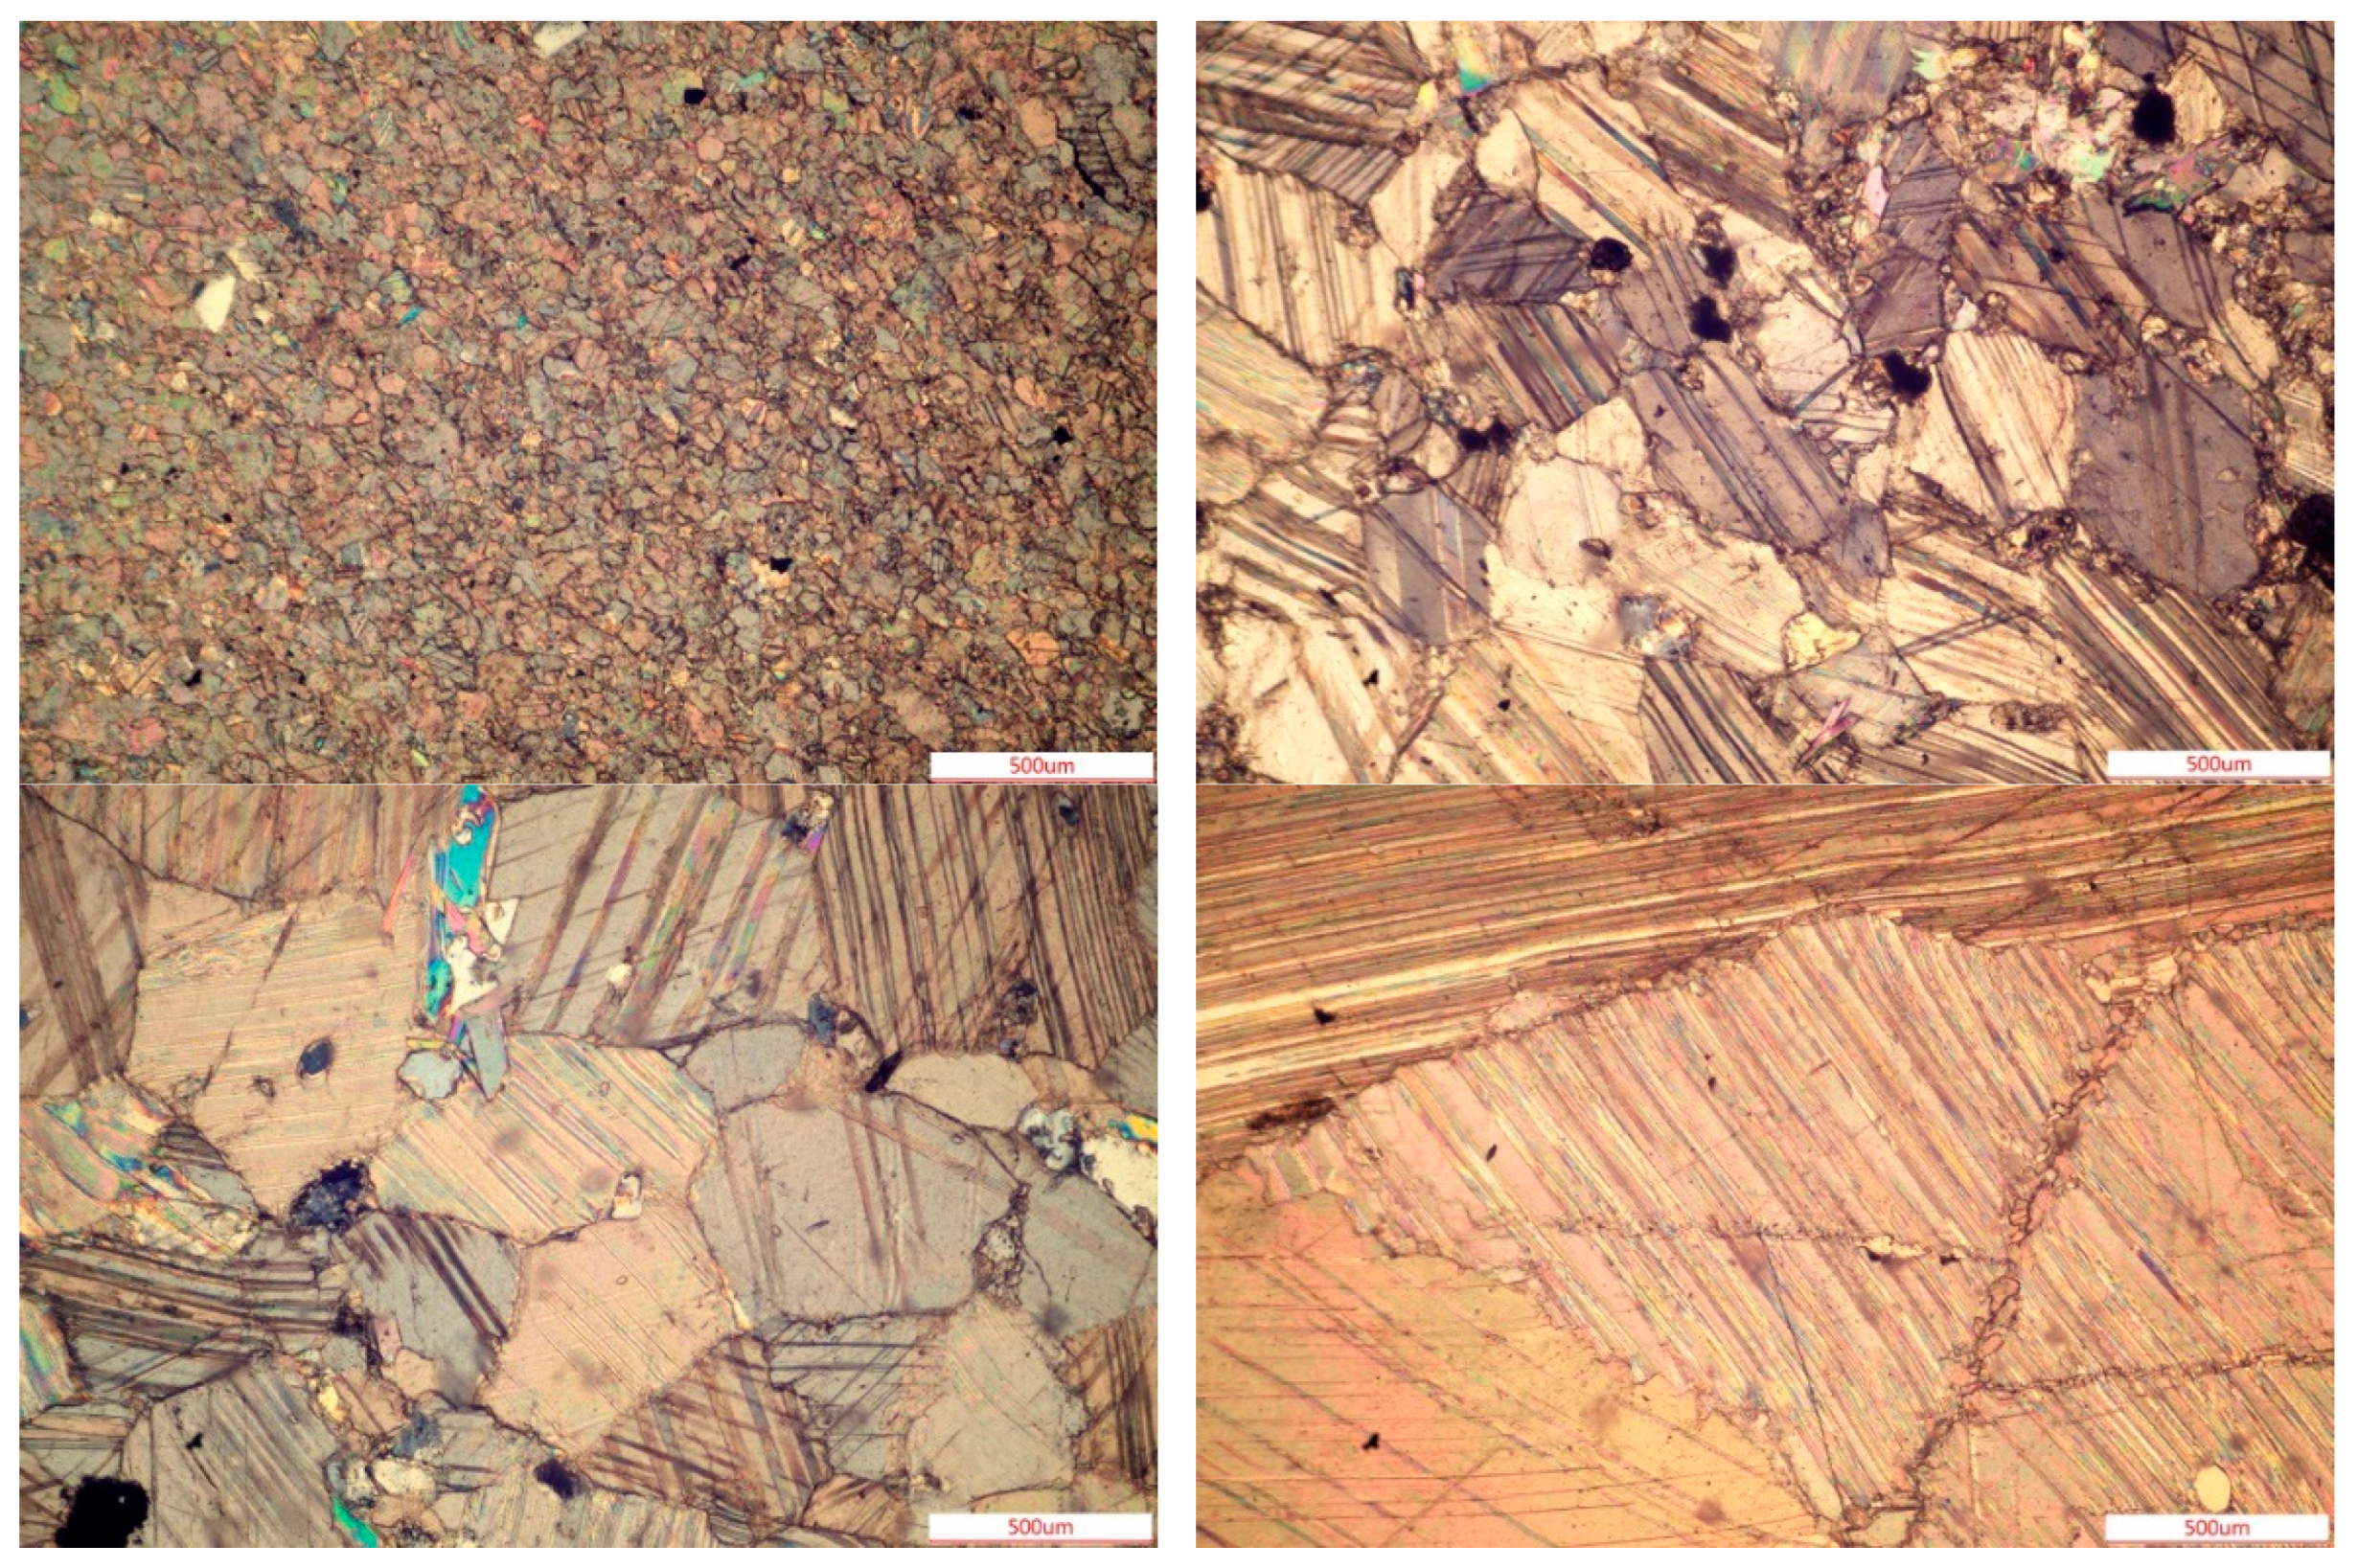
Marble is a typical metamorphic rock with obvious brittle–ductile transformation characteristics, and its strength and deformation characteristics change with mineral composition and microstructure [25]. The marble used in this study comes from Nanyang City, Henan Province, China. The mineralogical and textural characteristics of the marble specimens were studied by optical microscopy, as shown in Figure 2. According to the smoothness of the granular plane and the color variation in the grain under the cross-polarized light, the major mineral composition, such as the proportion of dolomite (Dol), calcite (Cal), and epidote (Ep), was determined and is listed in Table 1. The marble specimens are divided into four groups according to their grain size: group A (powder-grained 0.05~0.25 mm), group B (fine-grained 0.25~0.5 mm), group C (medium-grained 0.5~1.0 mm), and group D (coarse-grained 1.0~2.0 mm), respectively. The average grain size of each group is shown in Table 1.
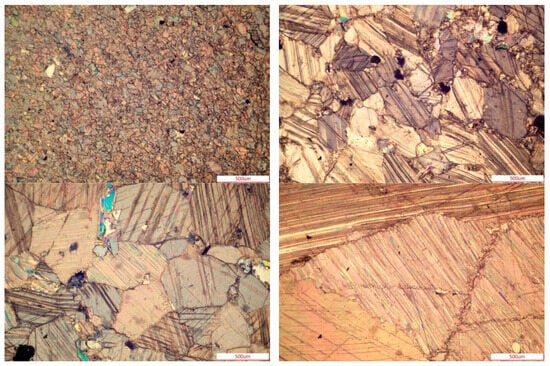
Figure 2.
Microscopic pictures of thin sections of marble specimens under cross-polarized light.

Table 1.
Mineral composition of the rocks tested.
The mechanical properties of the four groups of marble specimens are listed in Table 2. The uniaxial compressive strength (UCS) and elastic modulus (Es) were obtained through uniaxial compression tests. The cohesion (c), internal friction angle (φ), and Poisson’s ratio (ν) were obtained through triaxial compression tests. The tensile strength (σt) was obtained through Brazilian-split tests. The P-wave velocity (Vp) was obtained by using the ultrasonic measurement apparatus.

Table 2.
Basic parameters of marble specimens.
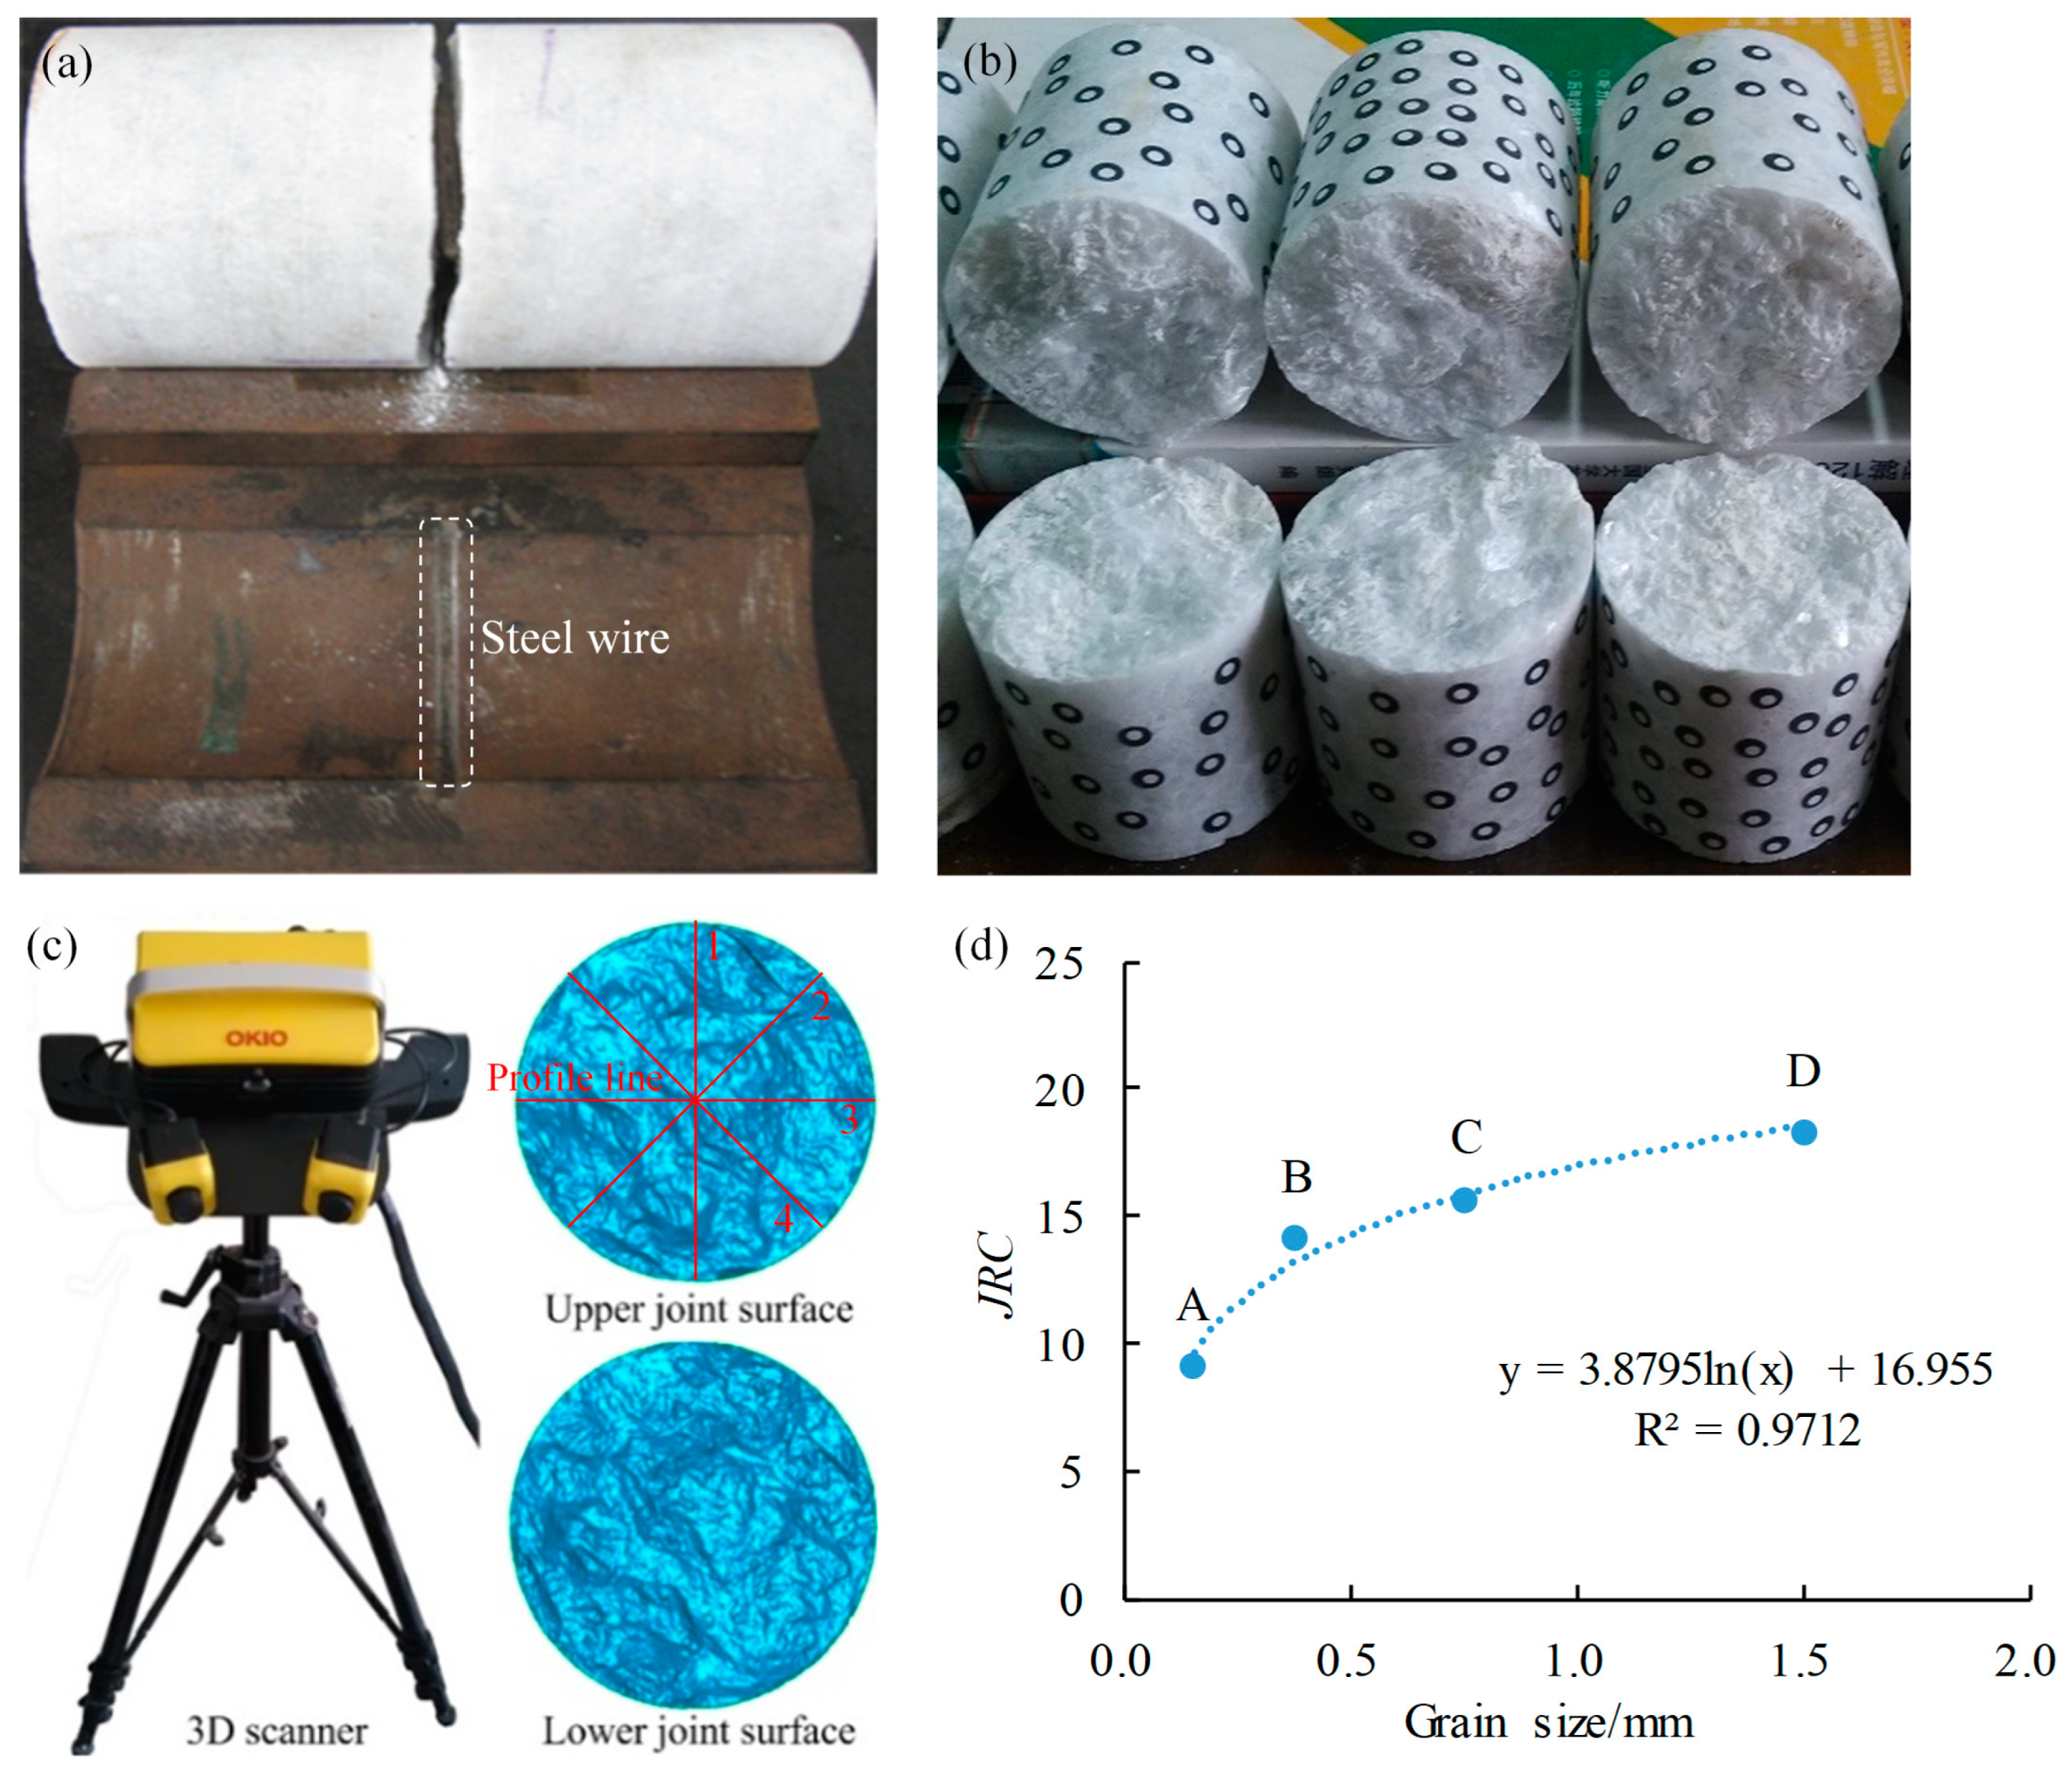
A self-made split tool was used to create tensile fractures (or the artificial rock joint) based on the Brazilian-split method [26], as shown in Figure 3a,b. The 3D morphology of the rock joint surface was obtained using the 3D morphology scan and analysis system, as shown in Figure 3c. The global error control module is included to control the scanning accuracy of the surface morphology, with an average accuracy of 0.02~0.03 mm. In order to reduce the error, the JRC values of four profile lines (1, 2, 3, 4), which mutually form an angle of 45 degrees between each two adjacent lines, were measured to obtain their average value with a sampling interval of 0.5 mm. Thus, the average joint roughness coefficient (JRC) of the marble joints of different groups can be calculated, as shown in Table 2. In addition, the rock joint surface obtained by the Brazilian-splitting method is random, and the larger the grain size is, the rougher the joint surface is. A previous study has shown that the grain size has a good correlation with JRC [8,9], which was verified in Figure 3d, where JRC increases logarithmically with the increase in grain size.
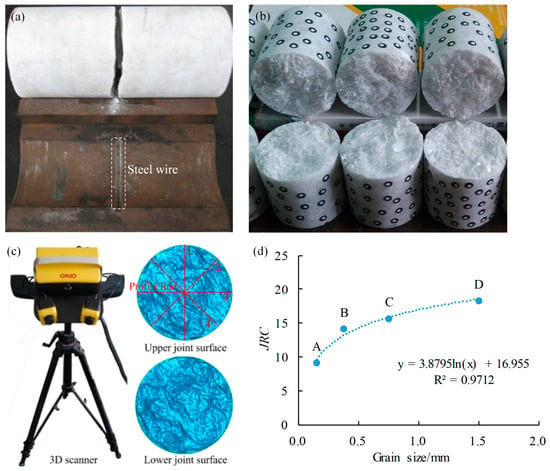
Figure 3.
Artificial rock joint and its relationship between grain size and JRC. (a) Split tool, (b) Tensile fractures, (c) 3D morphology scan and analysis system, (d) Relationship between JRC and grain size.
2.3. Experimental Scheme and Results
The influencing factors of the shear failure properties of rock joints can be summarized as intrinsic influencing factors (e.g., grain size) and extrinsic influencing factors (e.g., CNL). The grain size is associated with JRC [9], which in turn affects the shear failure properties of rock joints, and the CNL mainly affects the peak shear strength and shear instability characteristics of rock joints. Therefore, the experimental scheme was designed based on the above two influencing factors, as shown in Table 3. According to the longitudinal arrangement in Table 3, direct shear tests were conducted on artificial rock joints with various average grain sizes (0.15 mm, 0.375 mm, 0.75 mm, and 1.5 mm). According to the transverse arrangement in Table 3, direct shear tests were conducted on artificial rock joints under different CNLs (5 kN, 10 kN, 15 kN, 20 kN, 25 kN, and 30 kN). The shear rate and final shear displacement were 1 mm/min and 10 mm, respectively. It should be clarified that the chosen ranges for grain size and normal load were selected according to the division of common rock engineering and mining depth of underground mines in real-world situations.

Table 3.
Experimental scheme for influencing factors of shear failure behavior of rock joints.
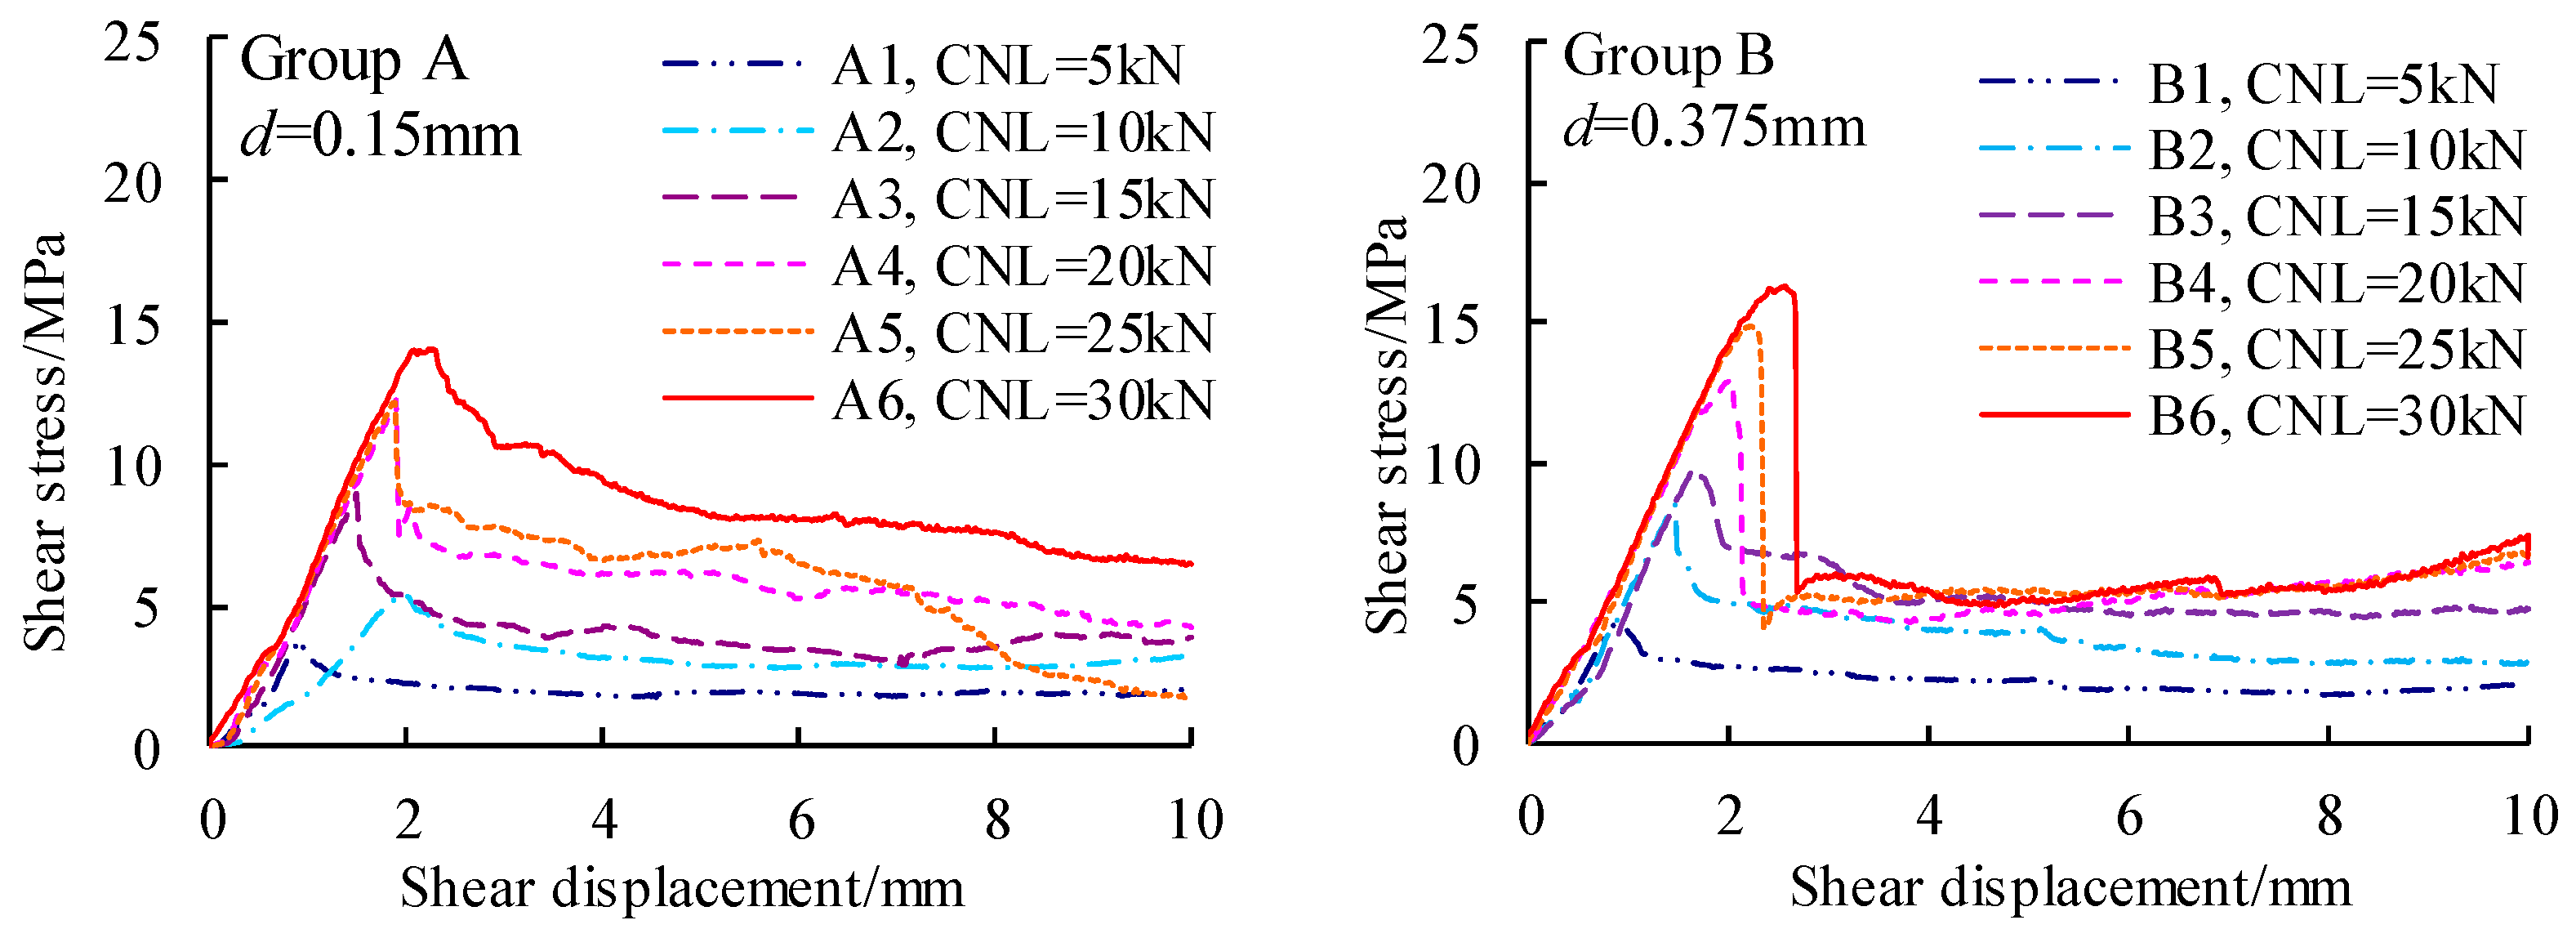
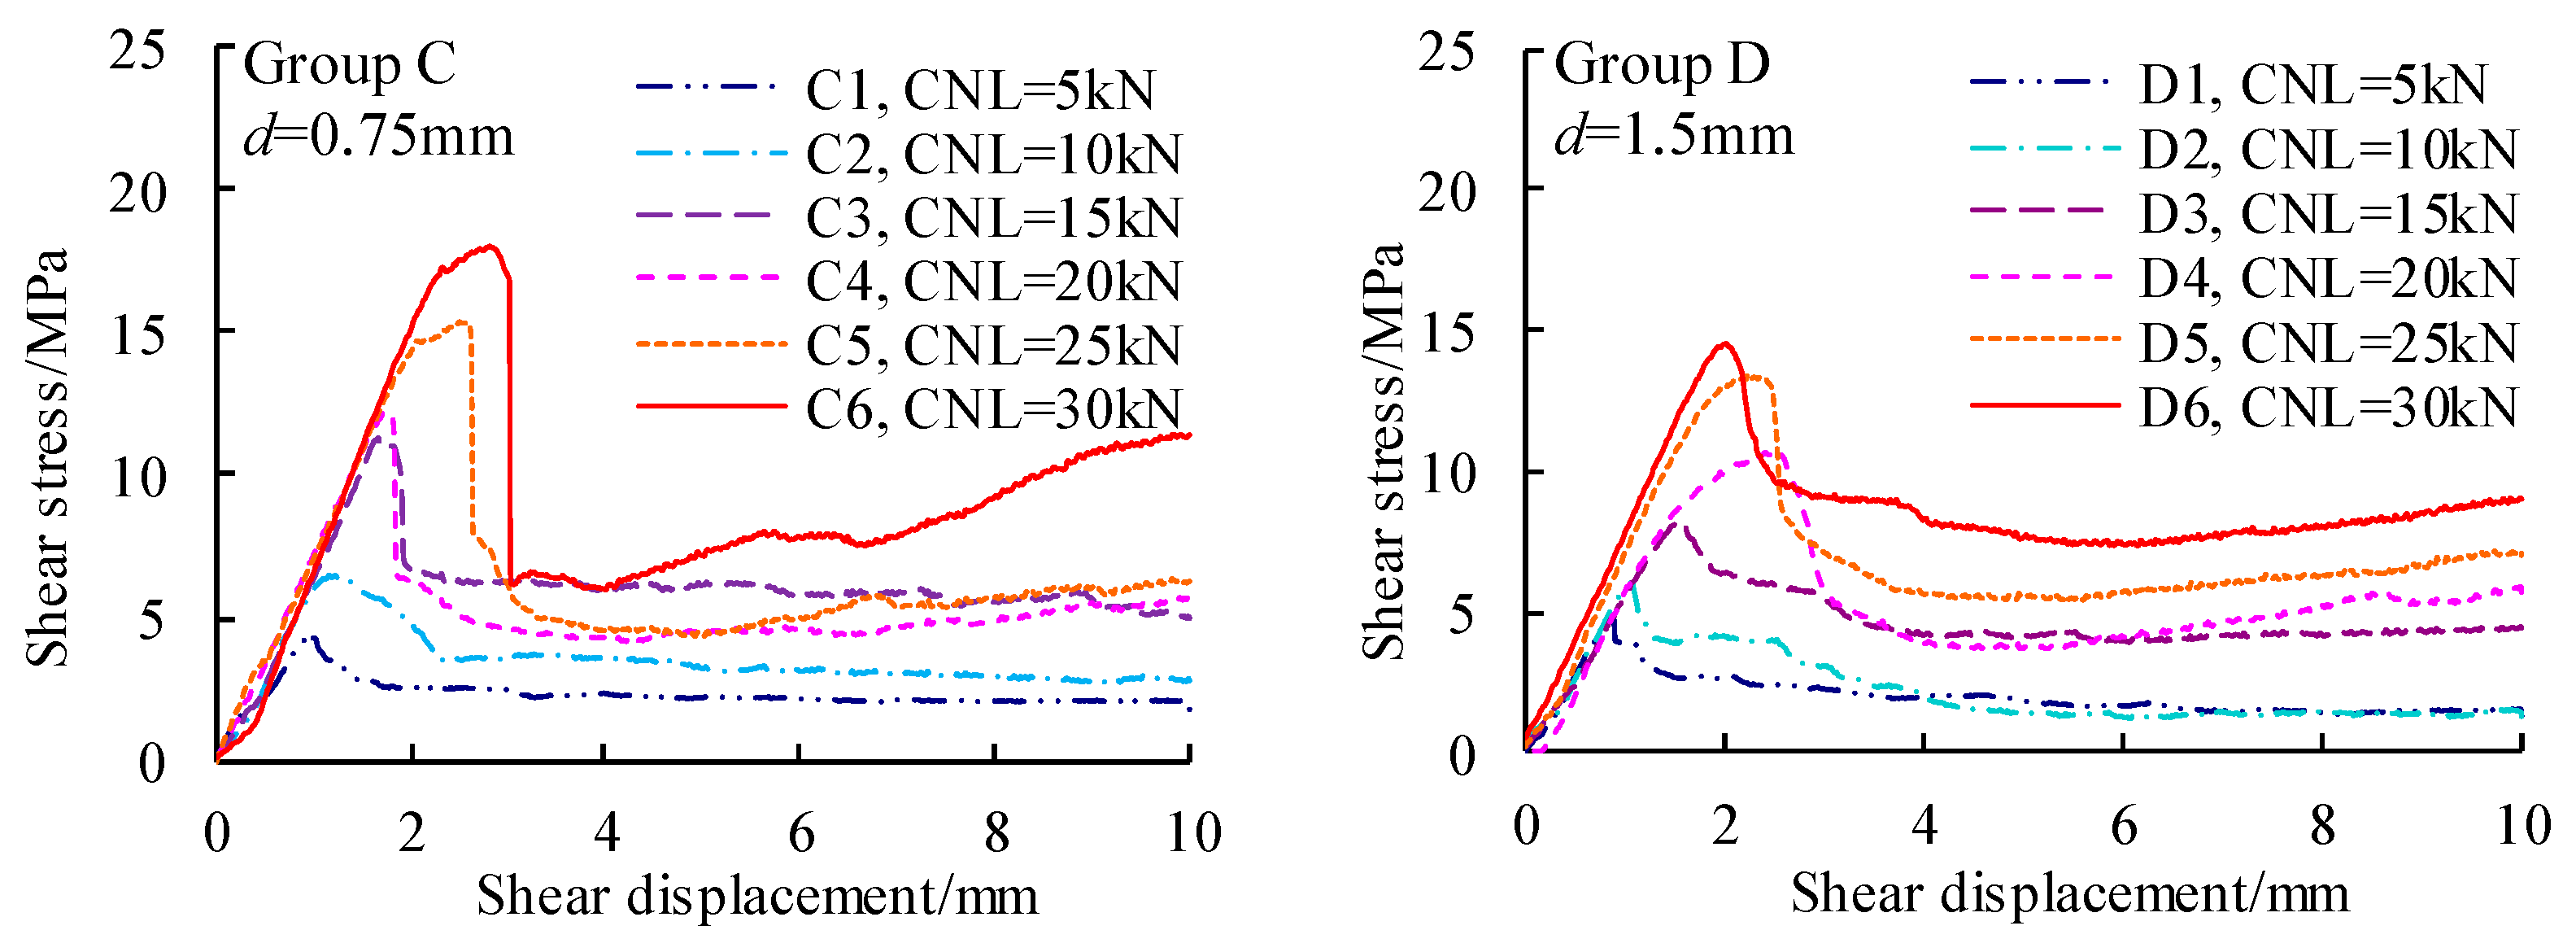
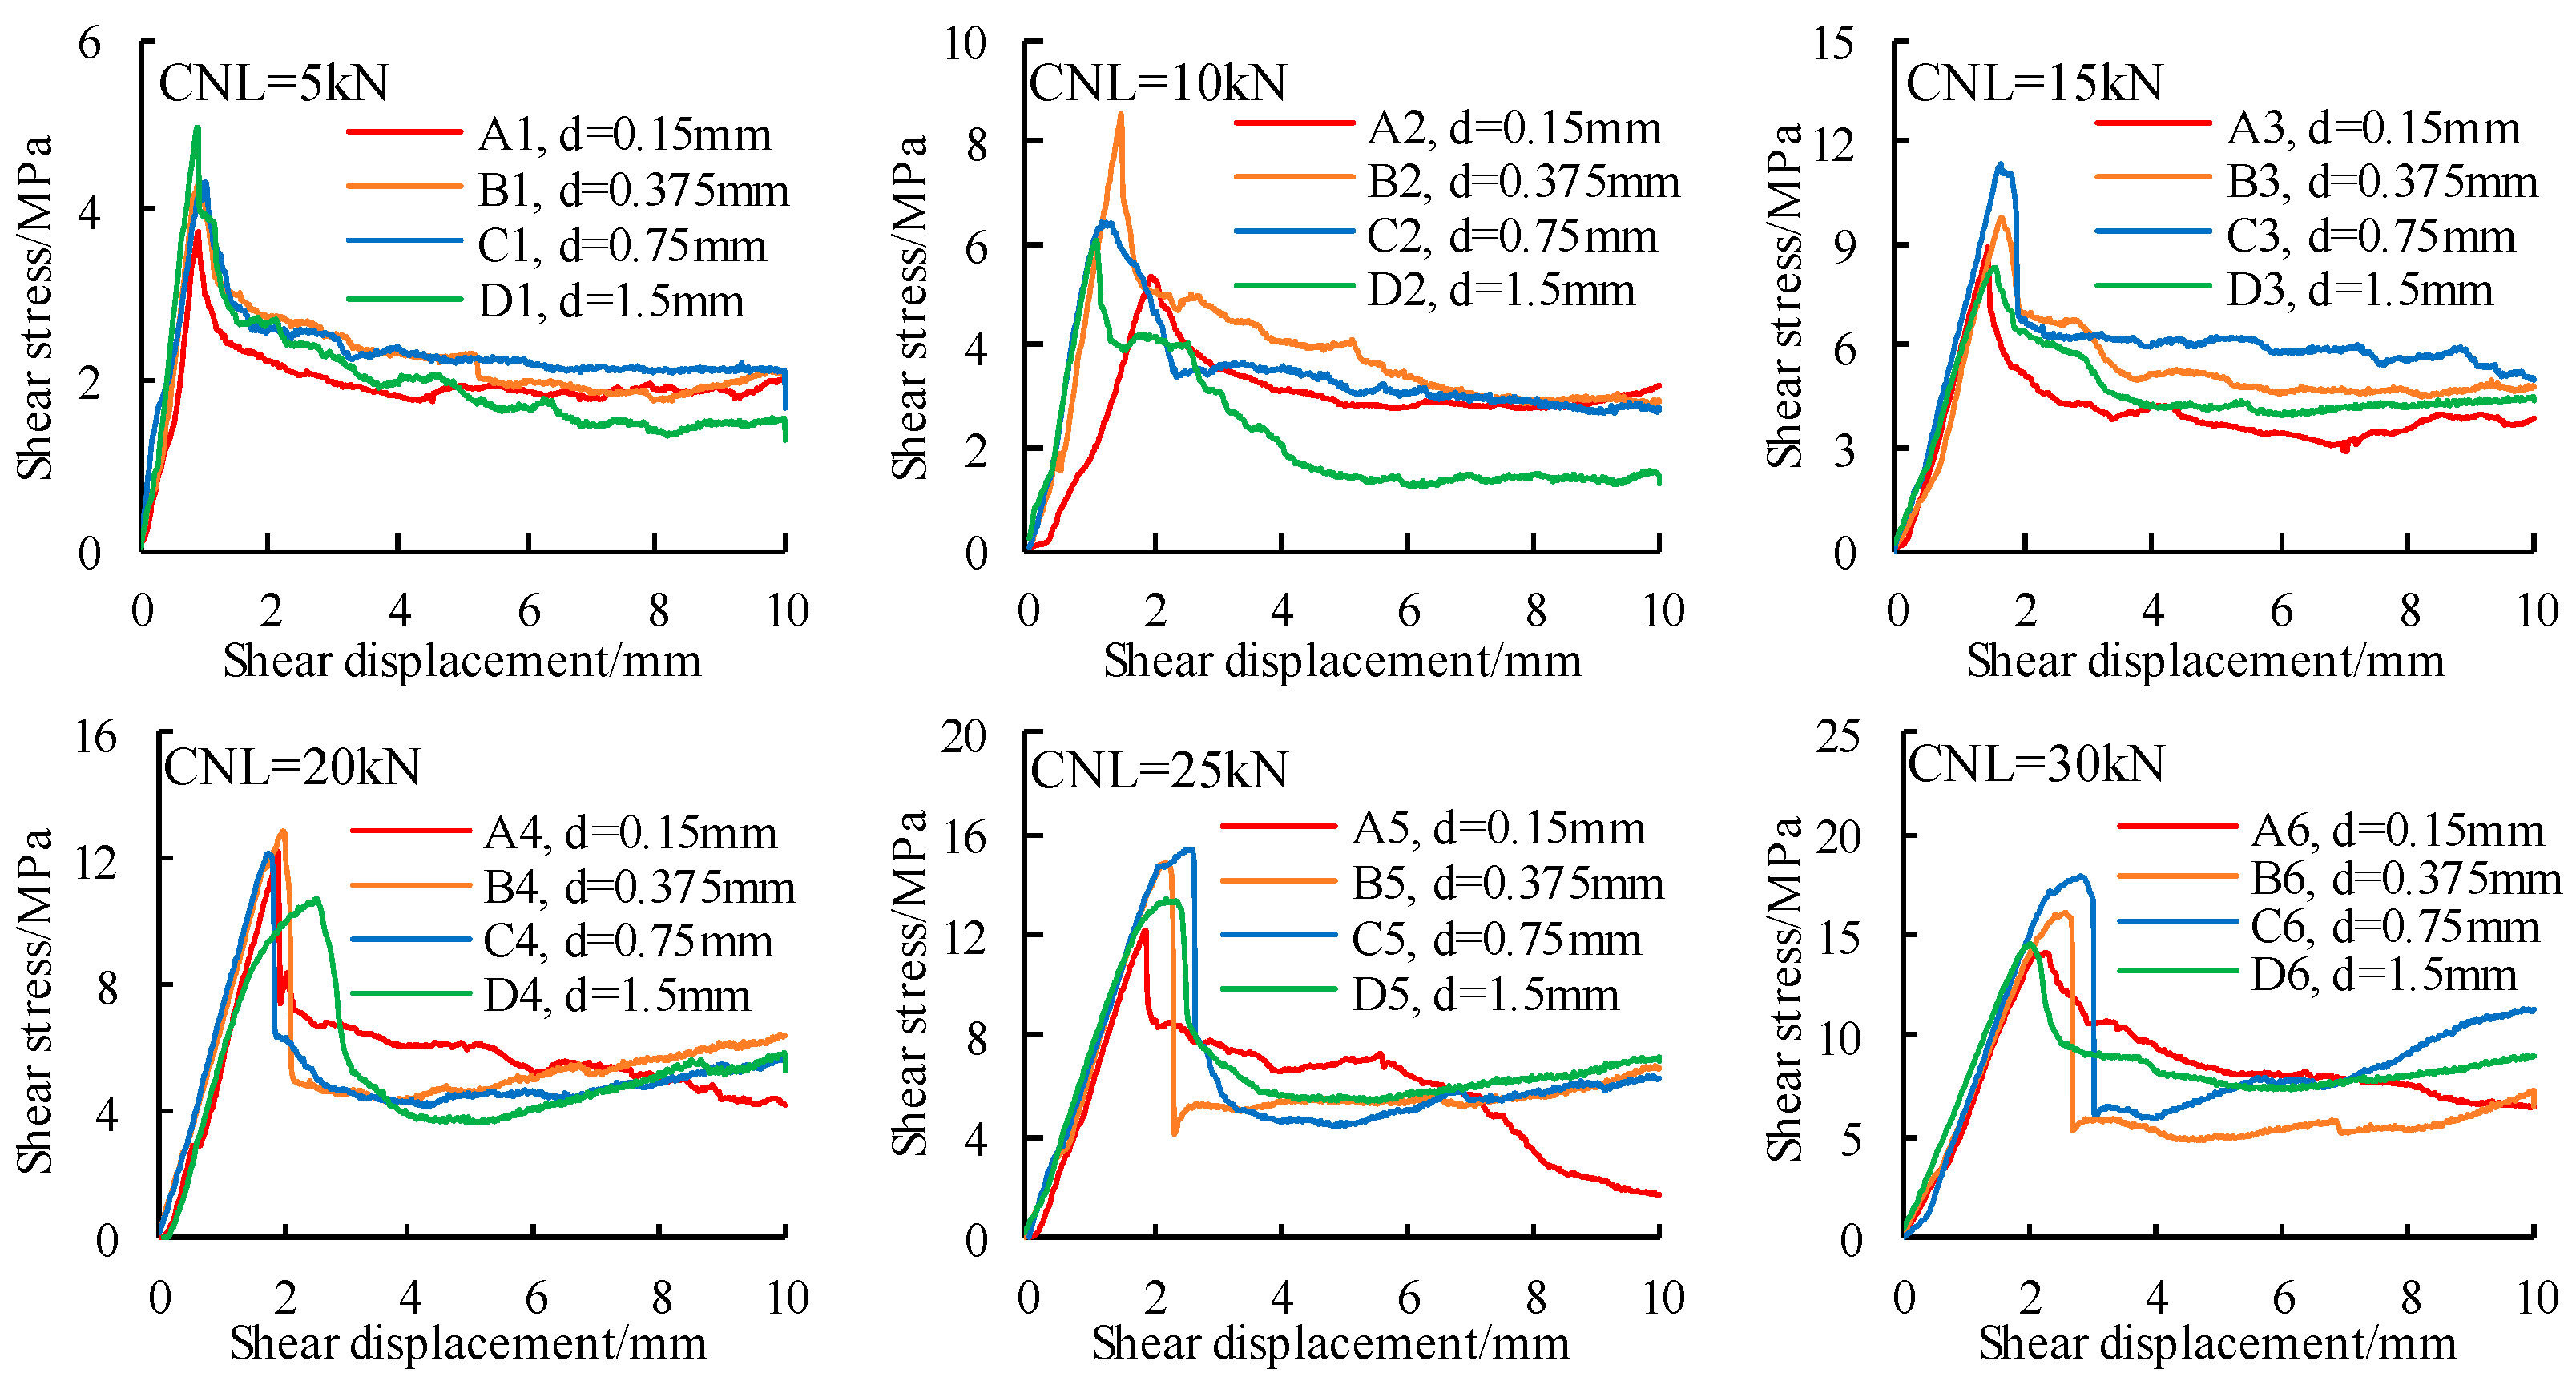
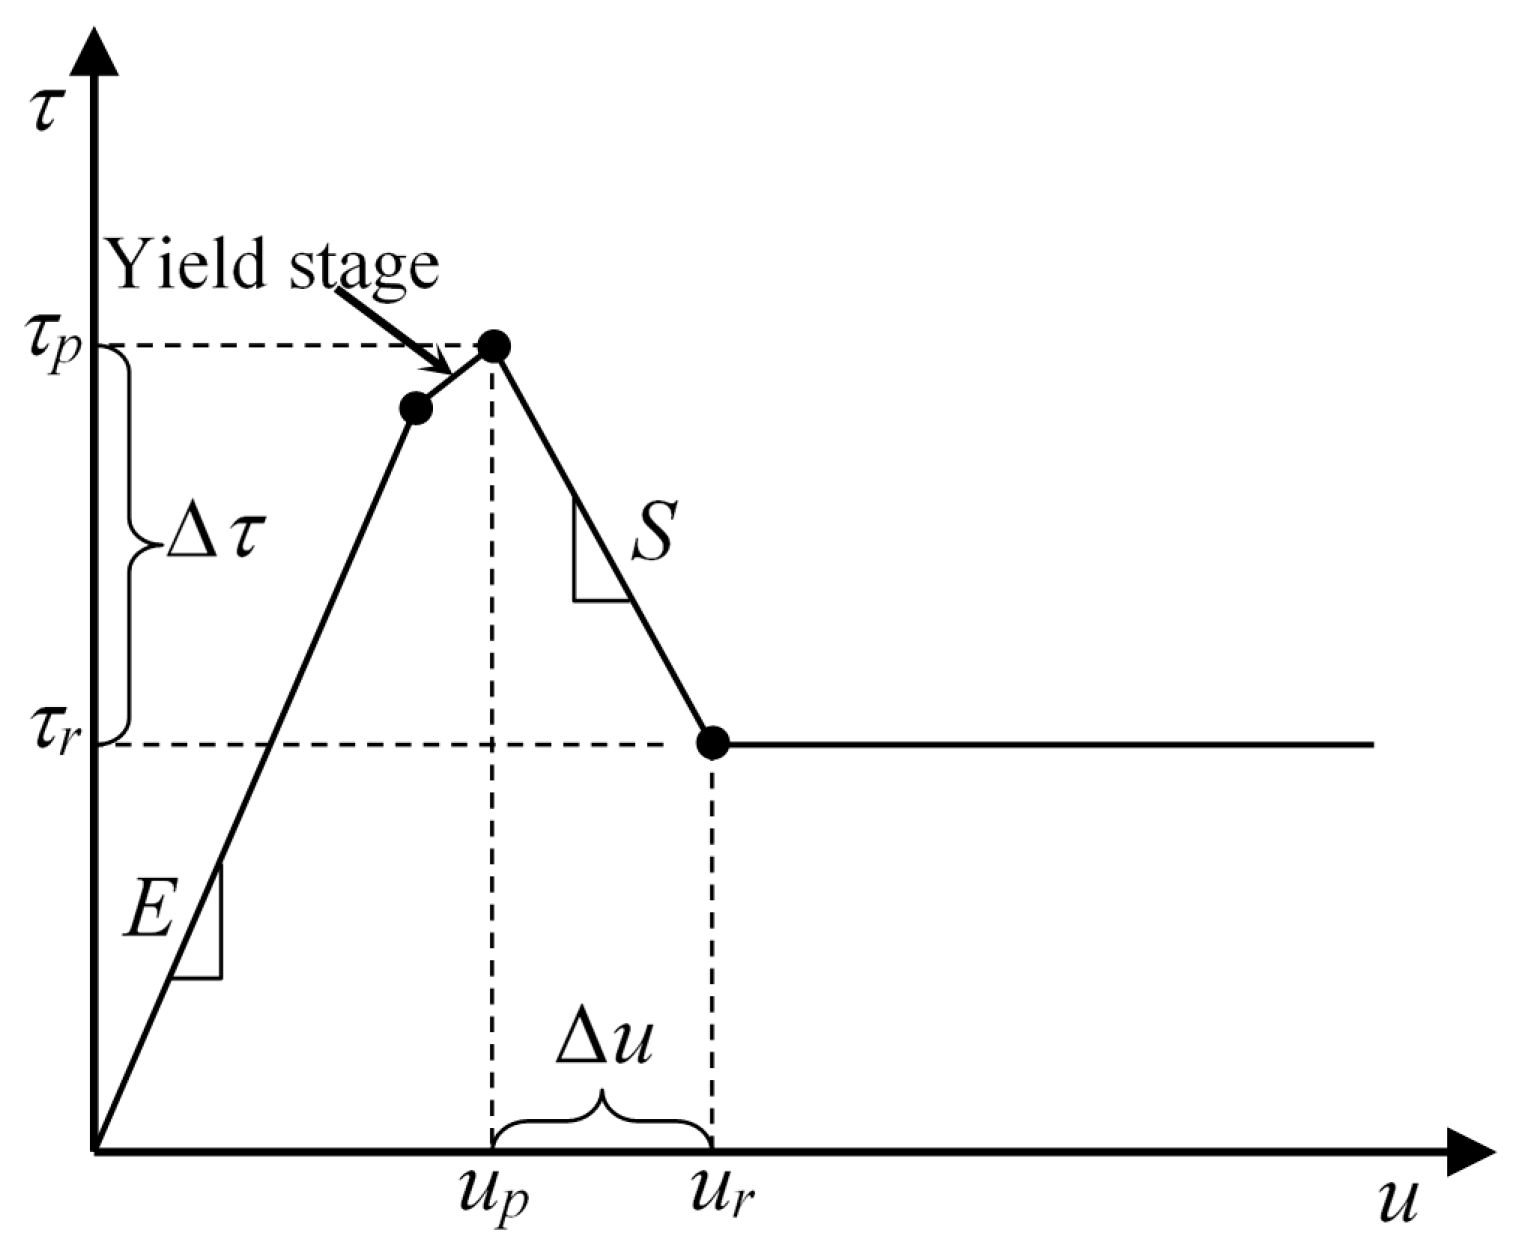
The experimental results are shown in Figure 4 and Figure 5 according to the influencing factors (e.g., grain size and CNL). Figure 4 shows the shear stress–displacement curves of marble joints under different CNLs, while Figure 5 shows the shear stress–displacement curves of marble joints with various grain sizes. The shear stress–displacement curves of the marble joints can be summarized as the model curve in Figure 6, where τp is the peak shear strength, up is the peak shear displacement, S is the post-peak modulus, Δτ is the stress drop, Δu is the displacement jump, τr is the residual shear strength, up is the residual shear displacement, E is the shear modulus, and u is the shear displacement. In addition, it can be seen from the experimental results that both the normal load (CNL) and the grain size (d) have an important influence on the shear mechanical properties of rock joints, such as peak shear strength (τp), peak shear displacement (up), post-peak modulus (S), stress drop (Δτ), and residual shear strength (τr). However, the comparison between Figure 4 and Figure 5 shows that the influence of CNL on the shear mechanical properties of joints is more obvious than that of grain size. In summary, (1) the pre-peak yield stage becomes more obvious with the increase in CNL and grain size. (2) Marble joints of different groups generally experience a violent post-peak stress drop when CNL is higher than 15 kN. (3) Group B and C were more prone to experiencing violent post-peak stress drop. (4) The yield stage of group A was not obvious, and the post-peak curves of groups A and D decreased more gently than those of groups B and C.
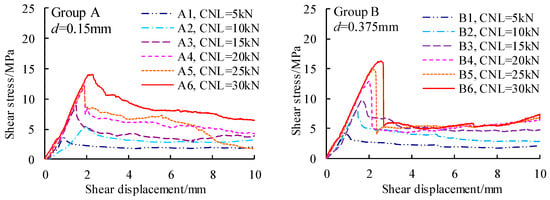
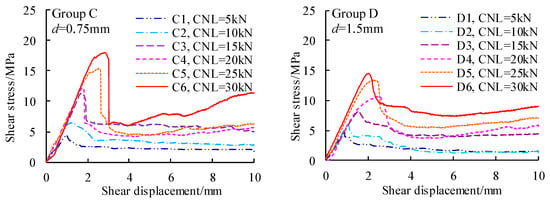
Figure 4.
Comparison of shear stress–displacement curves under different normal loads (CNLs).
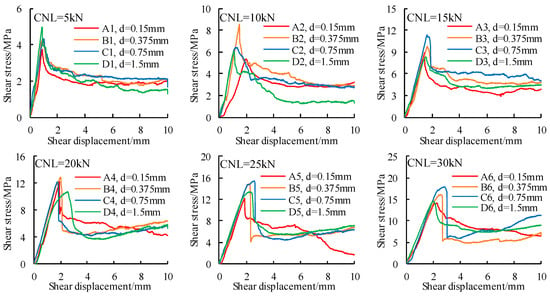
Figure 5.
Comparison of shear stress–displacement curves with various grain sizes (d).
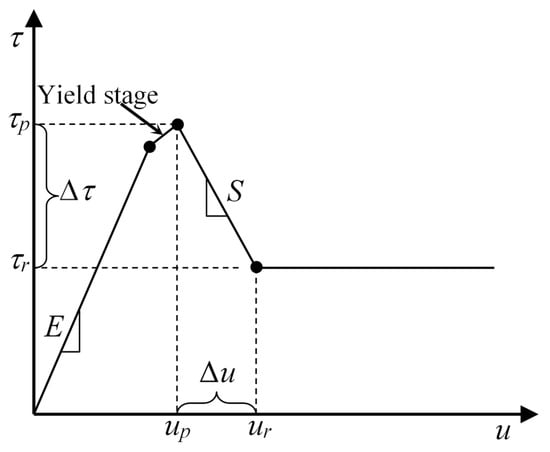
Figure 6.
Model curve for shear stress vs. shear displacement.
3. Analysis of Experimental Results
3.1. Influencing Factor of Grain Size (d)
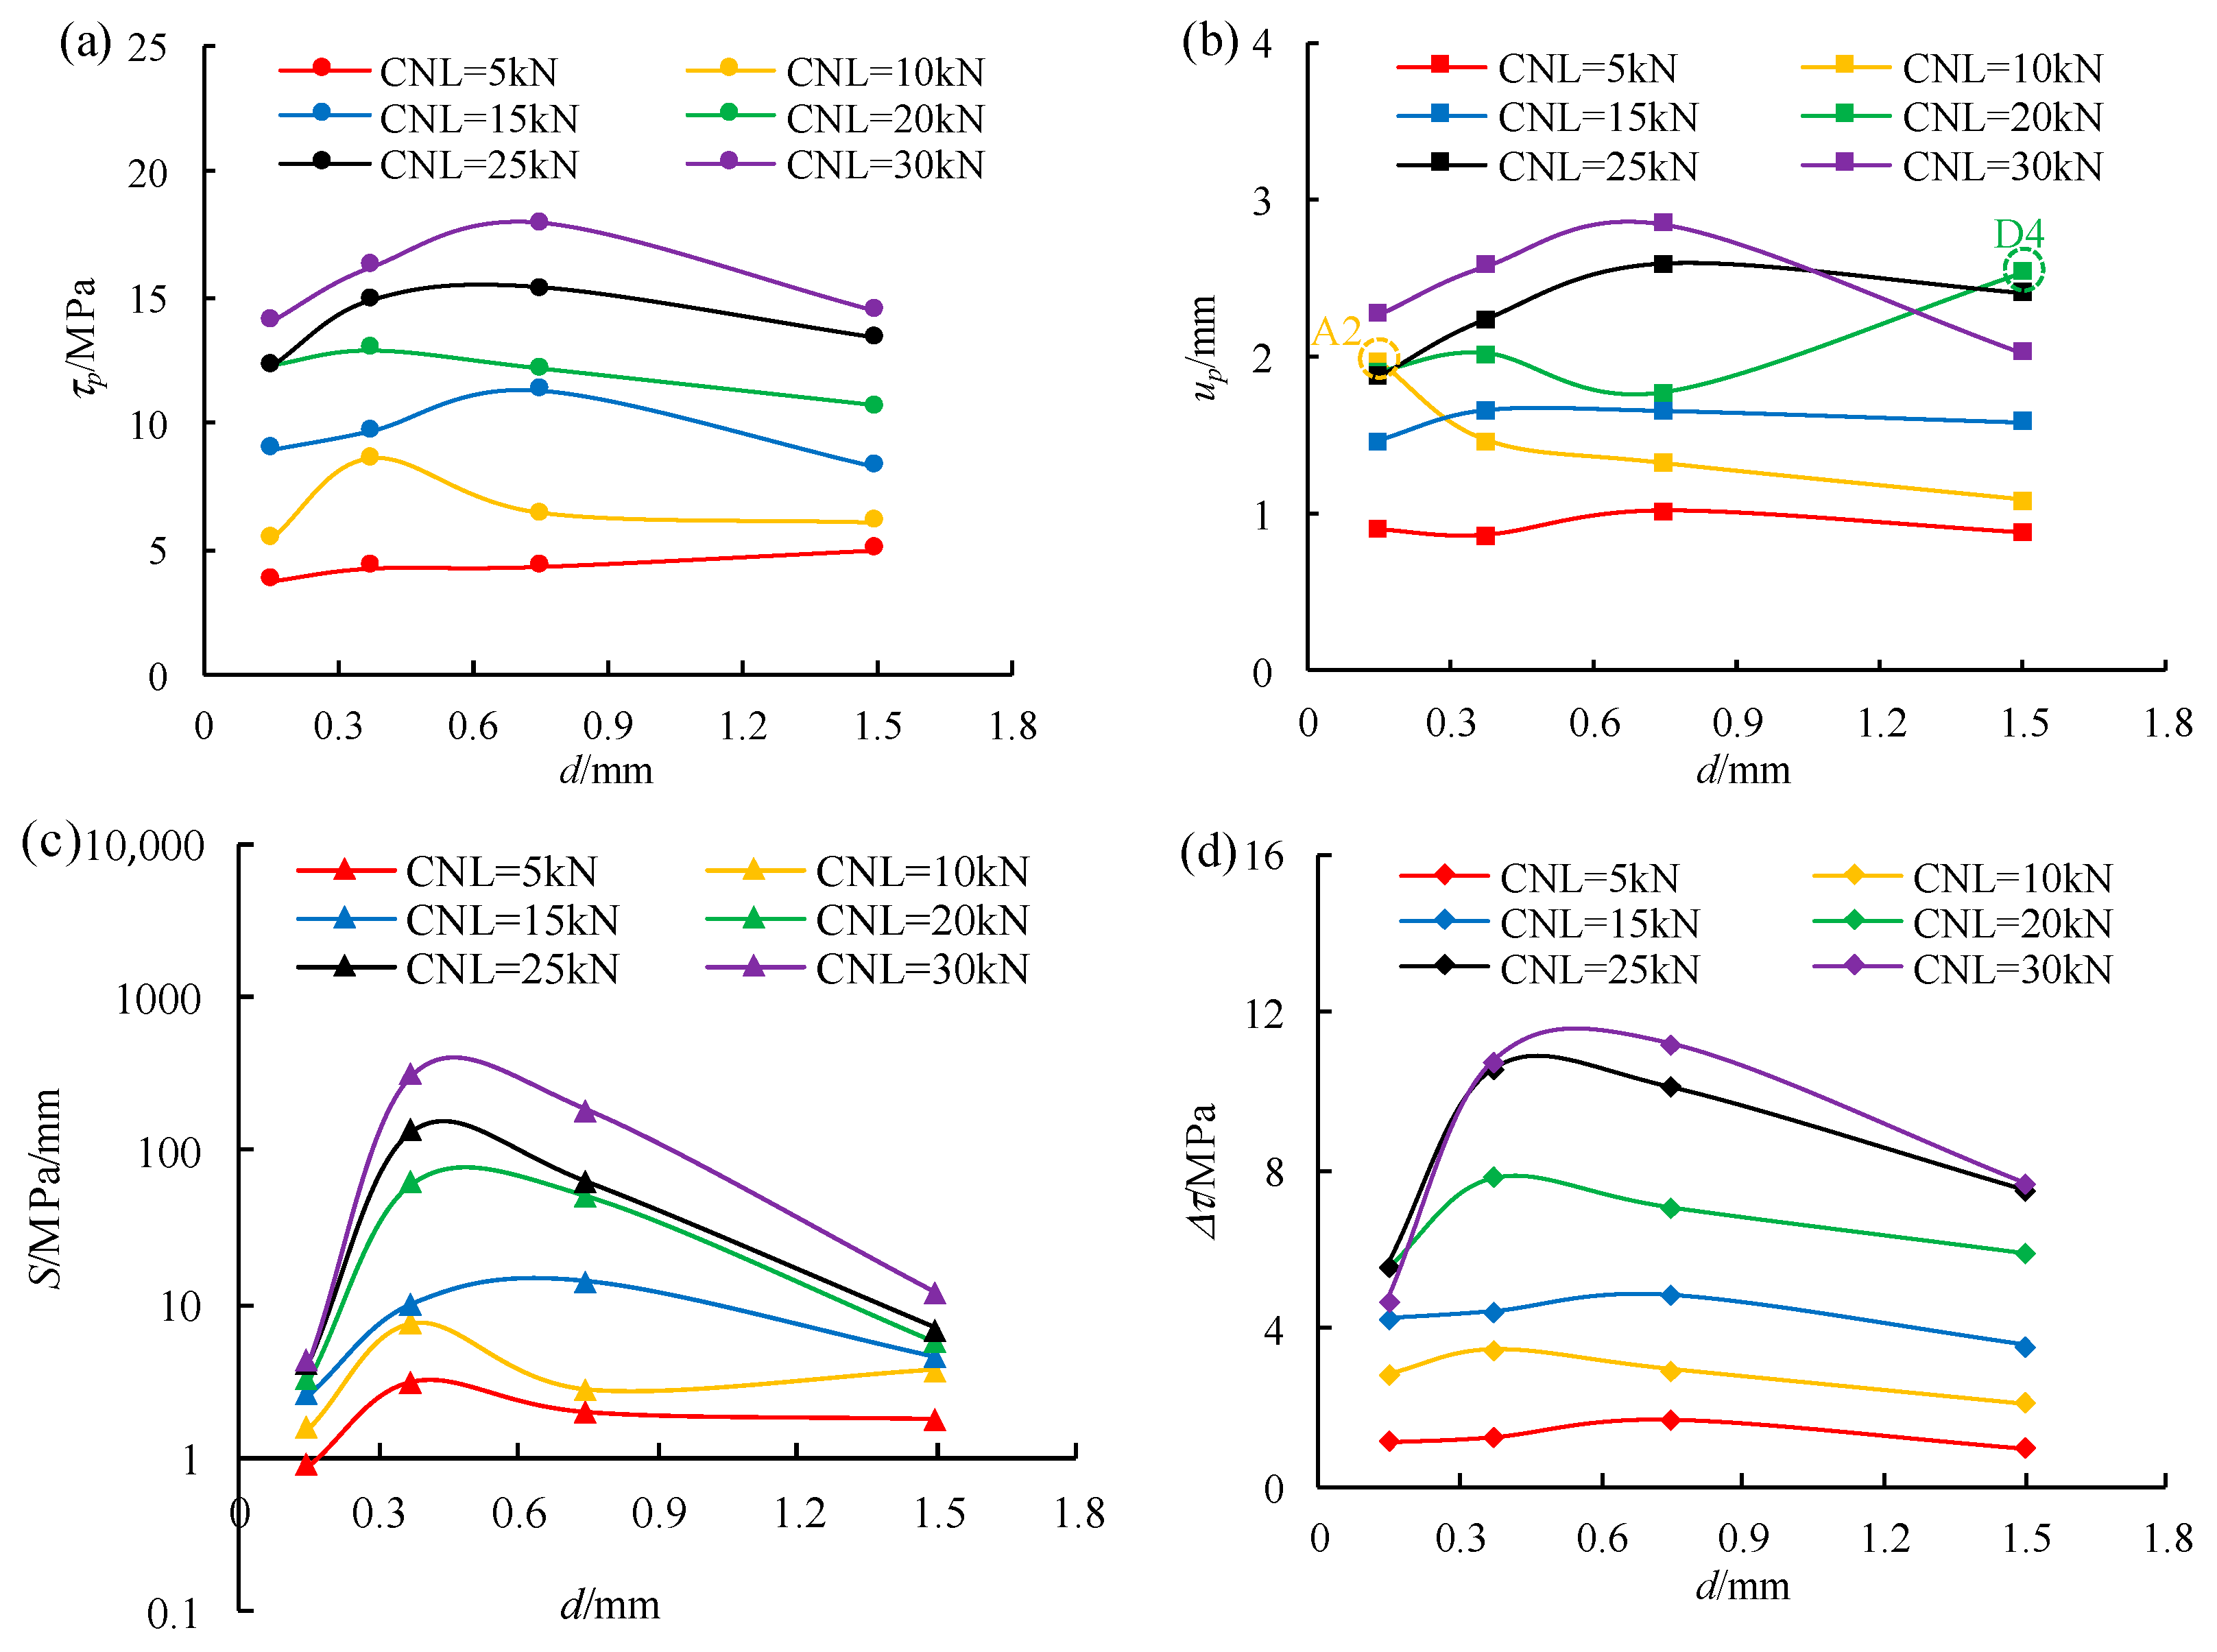
Figure 7 shows the effect of grain size (d) on the peak shear strength (τp), peak shear displacement (up), post-peak modulus (S), and stress drop (Δτ ) of rock joints. As shown in Figure 7a, the shear mechanical properties of rock joints are mainly determined by JRC under low normal load (CNL < 5 kN), so τp increases with the increase in d. However, when CNL > 5 kN, τp increases first and then decreases with the increase in d, which is mainly determined by the microstructure and mineral composition of rock specimens. The τp increases first, because (1) smaller d can provide a compact structure and more grain boundaries, thus effectively preventing crack propagation and improving rock strength, and (2) the dolomite with higher Mohs hardness accounts for a higher proportion. The τp decreases subsequently, because (1) larger d results in fewer grain boundaries; thus, the shear stress cannot be effectively dispersed, and (2) the proportion of calcite with lower Mohs hardness increases.
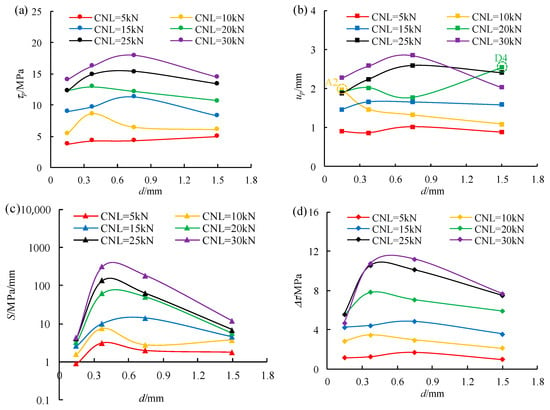
Figure 7.
Influence of grain size (d) on shear mechanical properties of rock joints. (a) Peak shear displacement τp, (b) peak shear displacement up, (c) post-peak modulus S, and (d) stress drop Δτ.
As shown in Figure 7b, up generally increased first and then decreased with the increase in d, which is related to the microstructure and mineral composition of rock specimens. When d is small, the rock specimen has a compact structure, fewer inherent cracks, and a higher proportion of dolomite with large Mohs hardness, which improves rock strength, so up increases first with the increase in d. As d continues to increase, the shear stress dispersion decreases, and the proportion of calcite with lower Mohs hardness increases, which reduces the rock strength, so up decreases subsequently. In addition, the higher up values of A2 and D4 are due to the slight dislocation of the upper and lower joint surfaces during installation.
S and Δτ are important parameters to characterize the shear instability intensity of rock joints. As shown in Figure 7c and d, when d is small, S and Δτ increase exponentially and linearly with the increase in d, which is related to the JRC of rock joints. Thus, when d < 0.5 mm, S and Δτ increase first with the increase in d. However, S and Δτ decrease subsequently as d continues to increase, which is due to the changes in microstructure and mineral composition. As d continues to increase, the shear stress dispersion decreases, and the proportion of calcite with lower Mohs hardness increases, which reduces the shear strength of rock joints, so the shear instability intensity of rock joints decreases accordingly.
3.2. Influencing Factor of Normal Load (CNL)
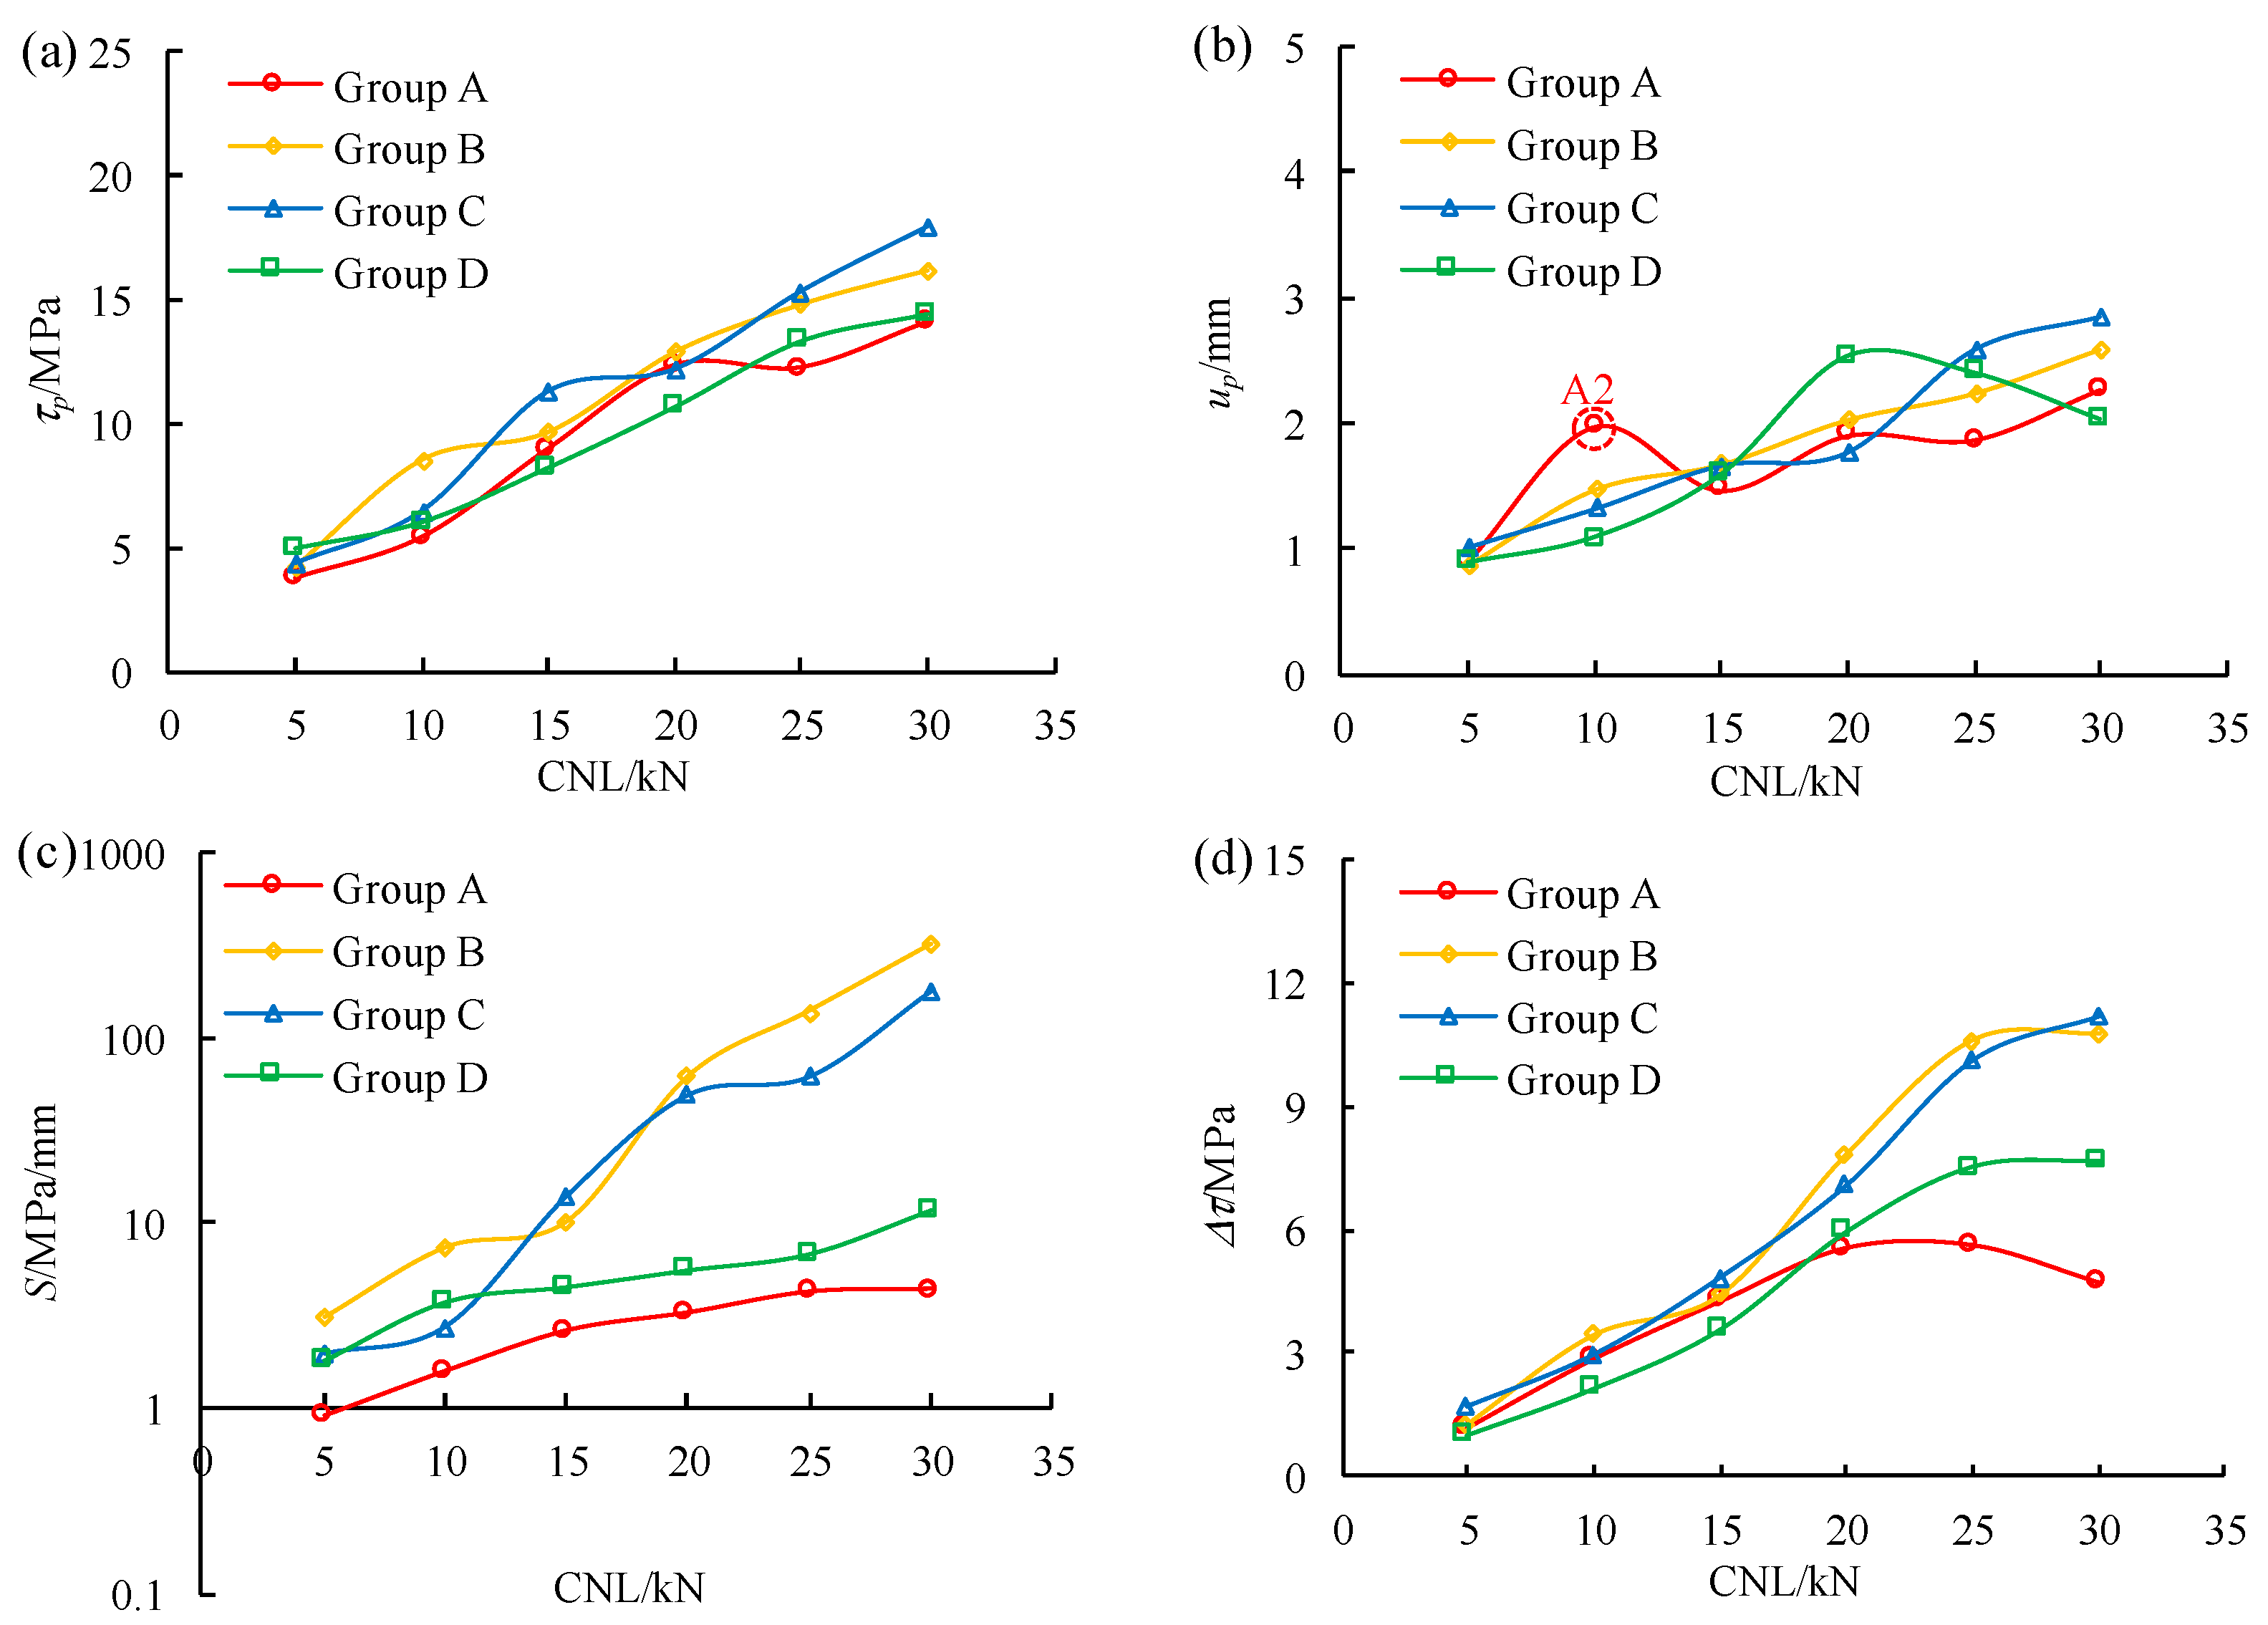
Figure 8 shows the effect of normal load (CNL) on the peak shear strength (τp), peak shear displacement (up), post-peak modulus (S), and stress drop (Δτ) of rock joints. As shown in Figure 8a, τp of groups A, B, C, and D all increased linearly with the increase in CNL. Figure 8b shows that up of groups A, B, and C increases linearly with the increase in CNL, whereas up of group D increased first and then decreased with the increase in CNL. With the continuous increase in CNL, group D is prone to crack propagation due to the larger grain size, and the proportion of calcite with lower Mohs hardness increases, resulting in the decrease in up.
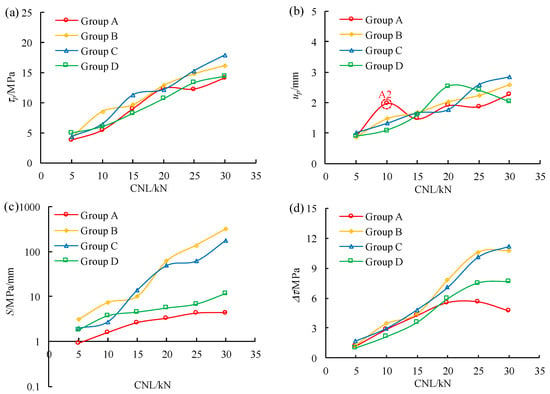
Figure 8.
Influence of CNL on shear mechanical properties of rock joints. (a) Peak shear displacement τp, (b) peak shear displacement up, (c) post-peak modulus S, and (d) stress drop Δτ.
As important parameters to characterize the shear instability intensity of rock joints, S of groups A, B, C, and D shows an exponential increase with the increase in CNL, as shown in Figure 8c, and Δτ of groups A, B, C, and D increases first with the increase in CNL and then tends to be stable or decreases, as shown in Figure 8d. Δτ tends to be stable or decreases with the increase in CNL because the grains are crushed under high shear and normal loads, and the shear failure behavior of rock joints changes from brittle shear failure to ductile failure.
4. Shear Instability Analysis
4.1. Shear Instability Mechanism
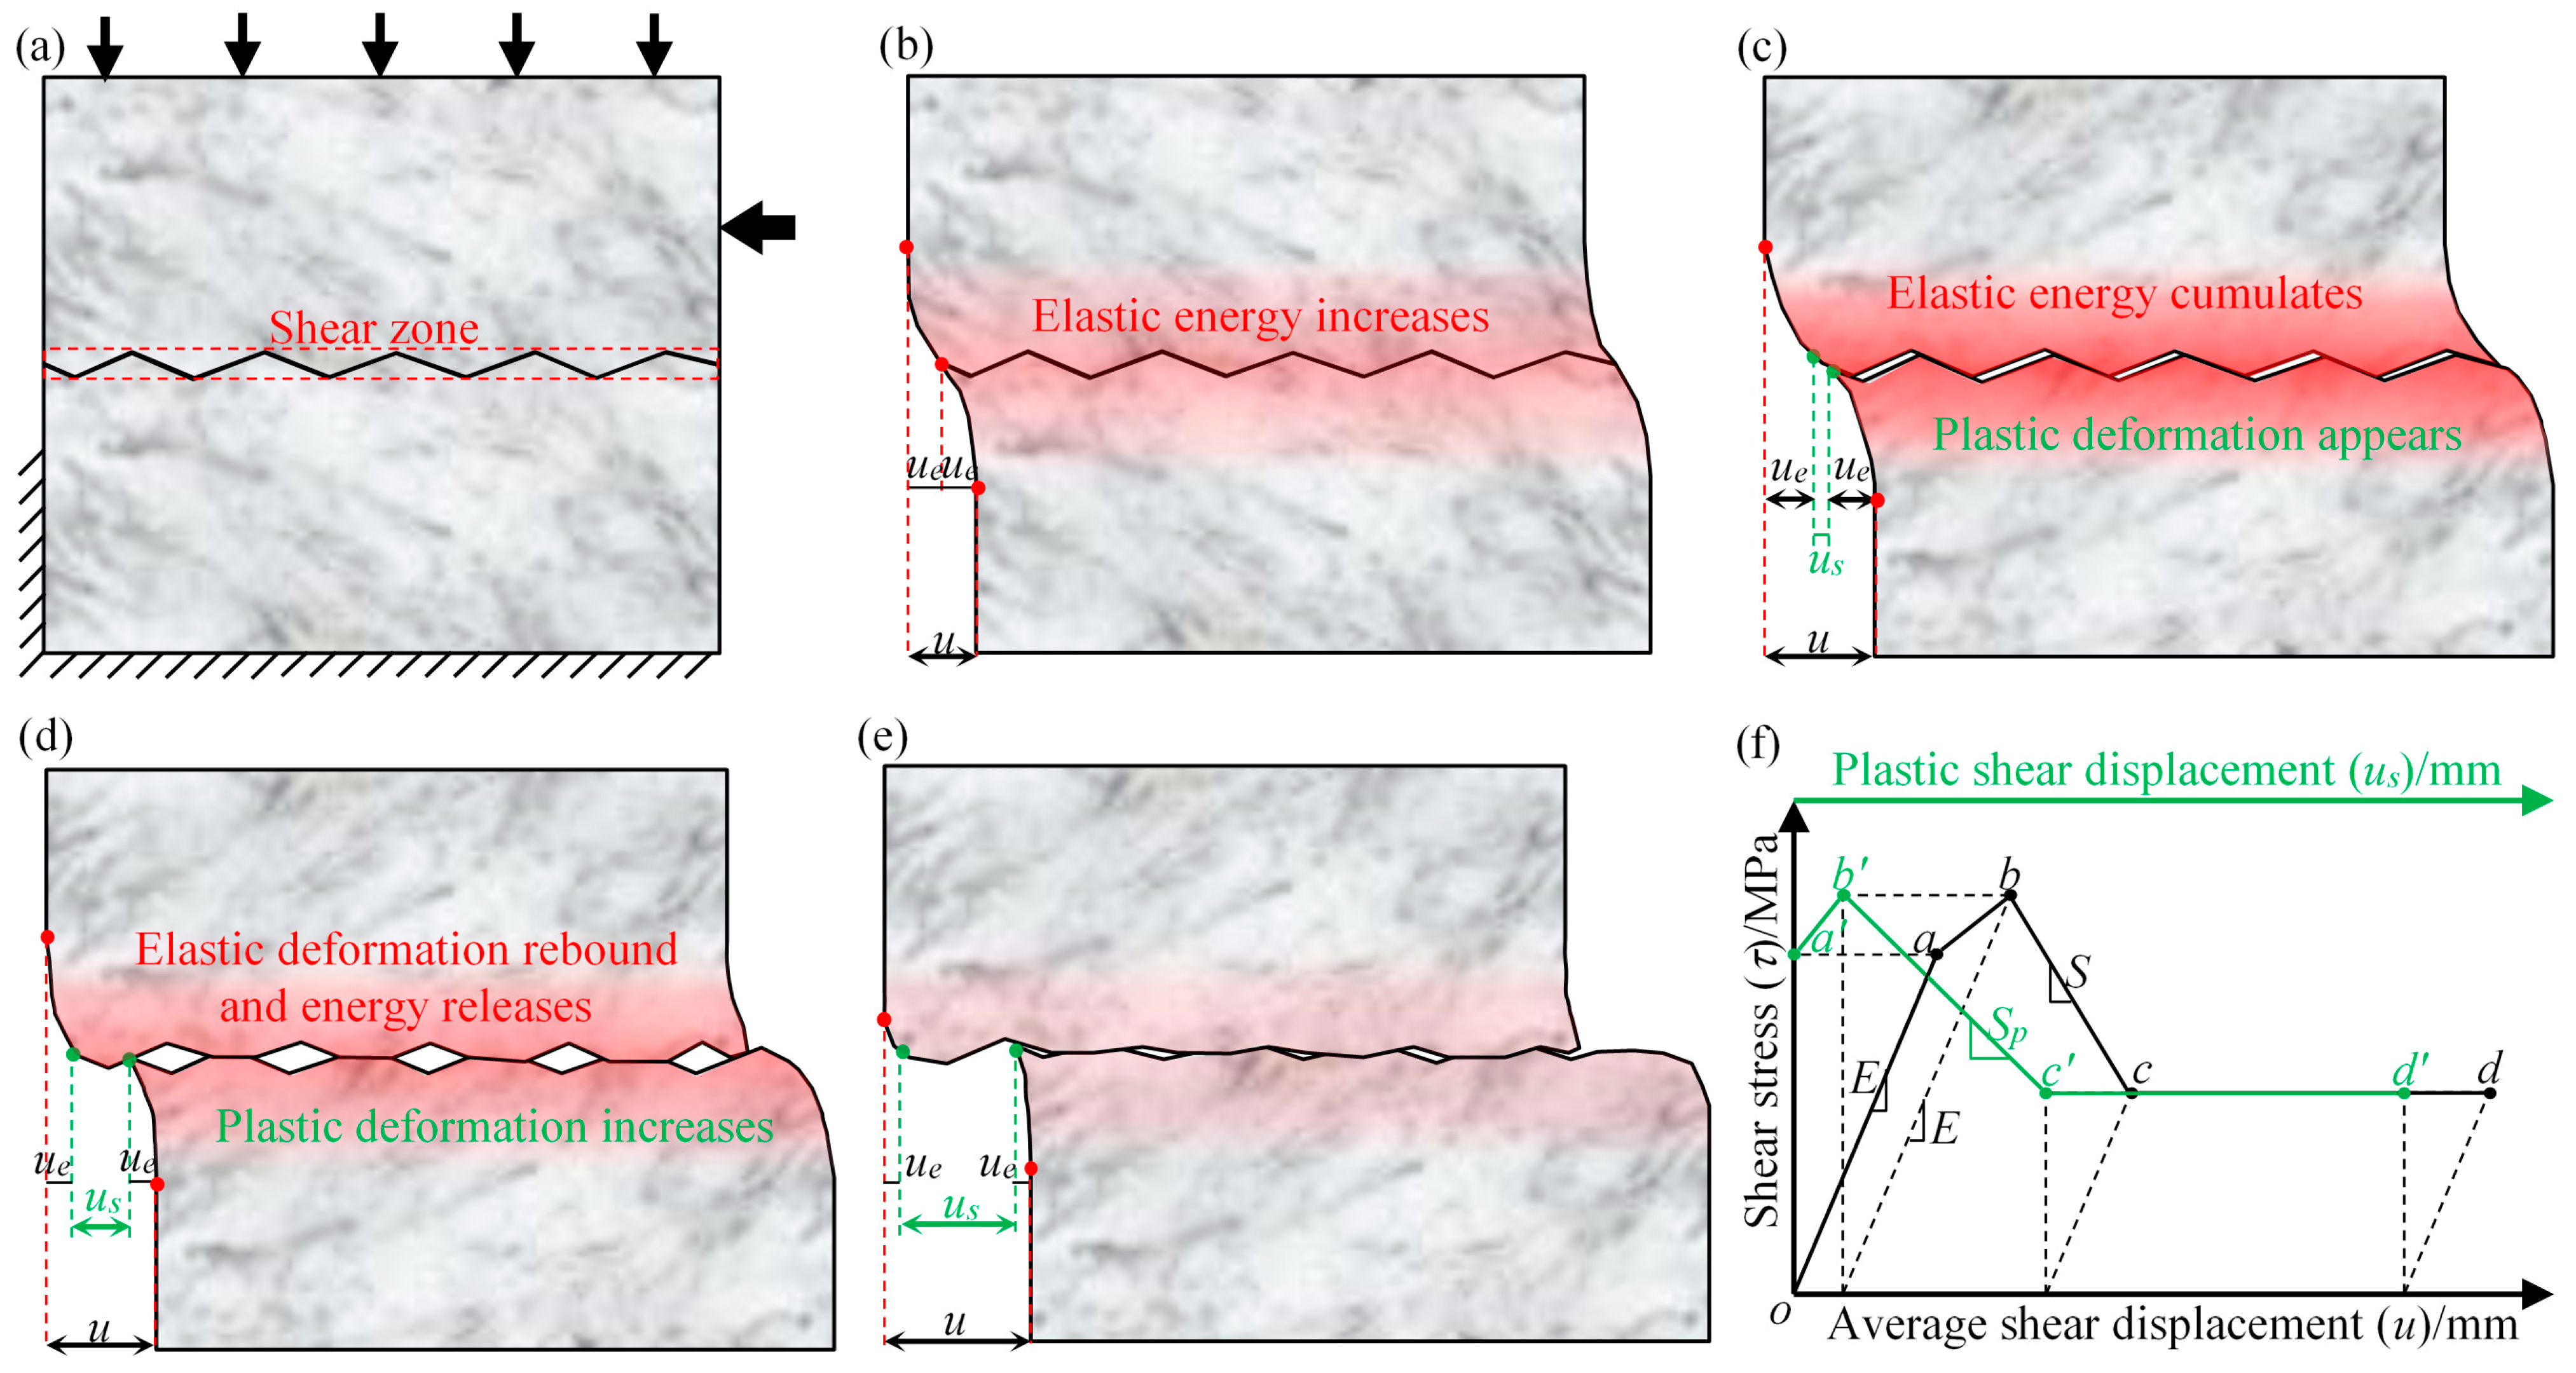
Figure 9a–e show the damage evolution diagram of shear zone asperities at different stages, as well as the accumulation and release process of elastic energy. Figure 9b shows the accumulation of elastic energy in the elastic stage (o–a), and only elastic deformation (ue) occurs on both sides of the joint surface. As shown in Figure 9c, the elastic energy and elastic deformation (ue) continue to increase during the yield stage (a–b) while the plastic deformation (us) occurs. Due to the different shapes, sizes, and distributions of the asperities, the strength of different areas of the shear zone is different. With the increase in shear displacement, the low strength region weakens, while the actual shear stress and elastic deformation increase in the high-strength region, resulting in the shear stress–displacement curve gradually deviating from a straight line (e.g., the yield stage). Thus, the damage of the joint surface only concentrates in the local area of the shear zone, that is, the shear failure process of rock joints is localized. As shown in Figure 9d, the shear stress decreases after the peak, the shear zone weakens locally, and the elastic deformation rebounds (i.e., ue is converted into us), and elastic energy release occurs on both sides of the joint (i.e., the shear instability). Therefore, the local damage evolution of the shear zone and the elastic deformation rebound of the specimen jointly determine the shear instability characteristics of rock joints.
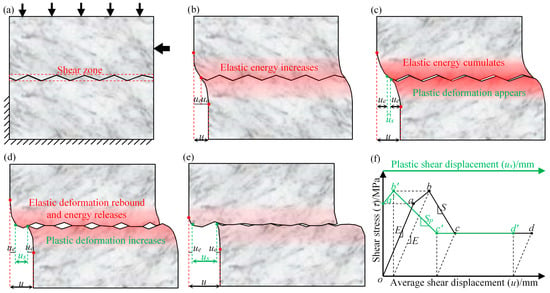
Figure 9.
Schematic diagram of shear instability mechanism of rock joints. (a) Initial stage o, (b) Elastic stage o–a, (c) Yield stage a–b, (d) Soften stage b–c, (e) Residual stage c–d, (f) Shear stress–plastic shear displacement.
The shear stress–displacement curve is an average reflection of the shear deformation and failure process of rock joints, which can be divided into four stages, as shown by the black curve in Figure 9f. However, the shear displacement (u) of rock joints is composed of elastic deformation (ue) and plastic deformation (us), as shown in Figure 9a–e. In the elastic stage o–a, the elastic deformation (ue) increases linearly, and the shear displacement (u) is mainly composed of elastic deformation (ue). In the yield stage a–b, plastic deformation (us) appears, and the elastic deformation (ue) reaches the maximum at the peak. In the soften stage b–c, the elastic deformation (ue) partially recovers, and the plastic deformation (us) continues to increase, that is, ue transforms into us. In the residual stage c–d, the elastic deformation (ue) remains unchanged, while the plastic deformation (us) increases continuously. In this respect, the rock joint shear weakening process should be described by the plastic shear displacement (us) of the damage area of the shear zone rather than the shear displacement (u). Therefore, the green shear stress–plastic shear displacement curve of rock joints in Figure 9f can be obtained by removing the elastic deformation part of the black shear stress–displacement curve according to Equation (1).
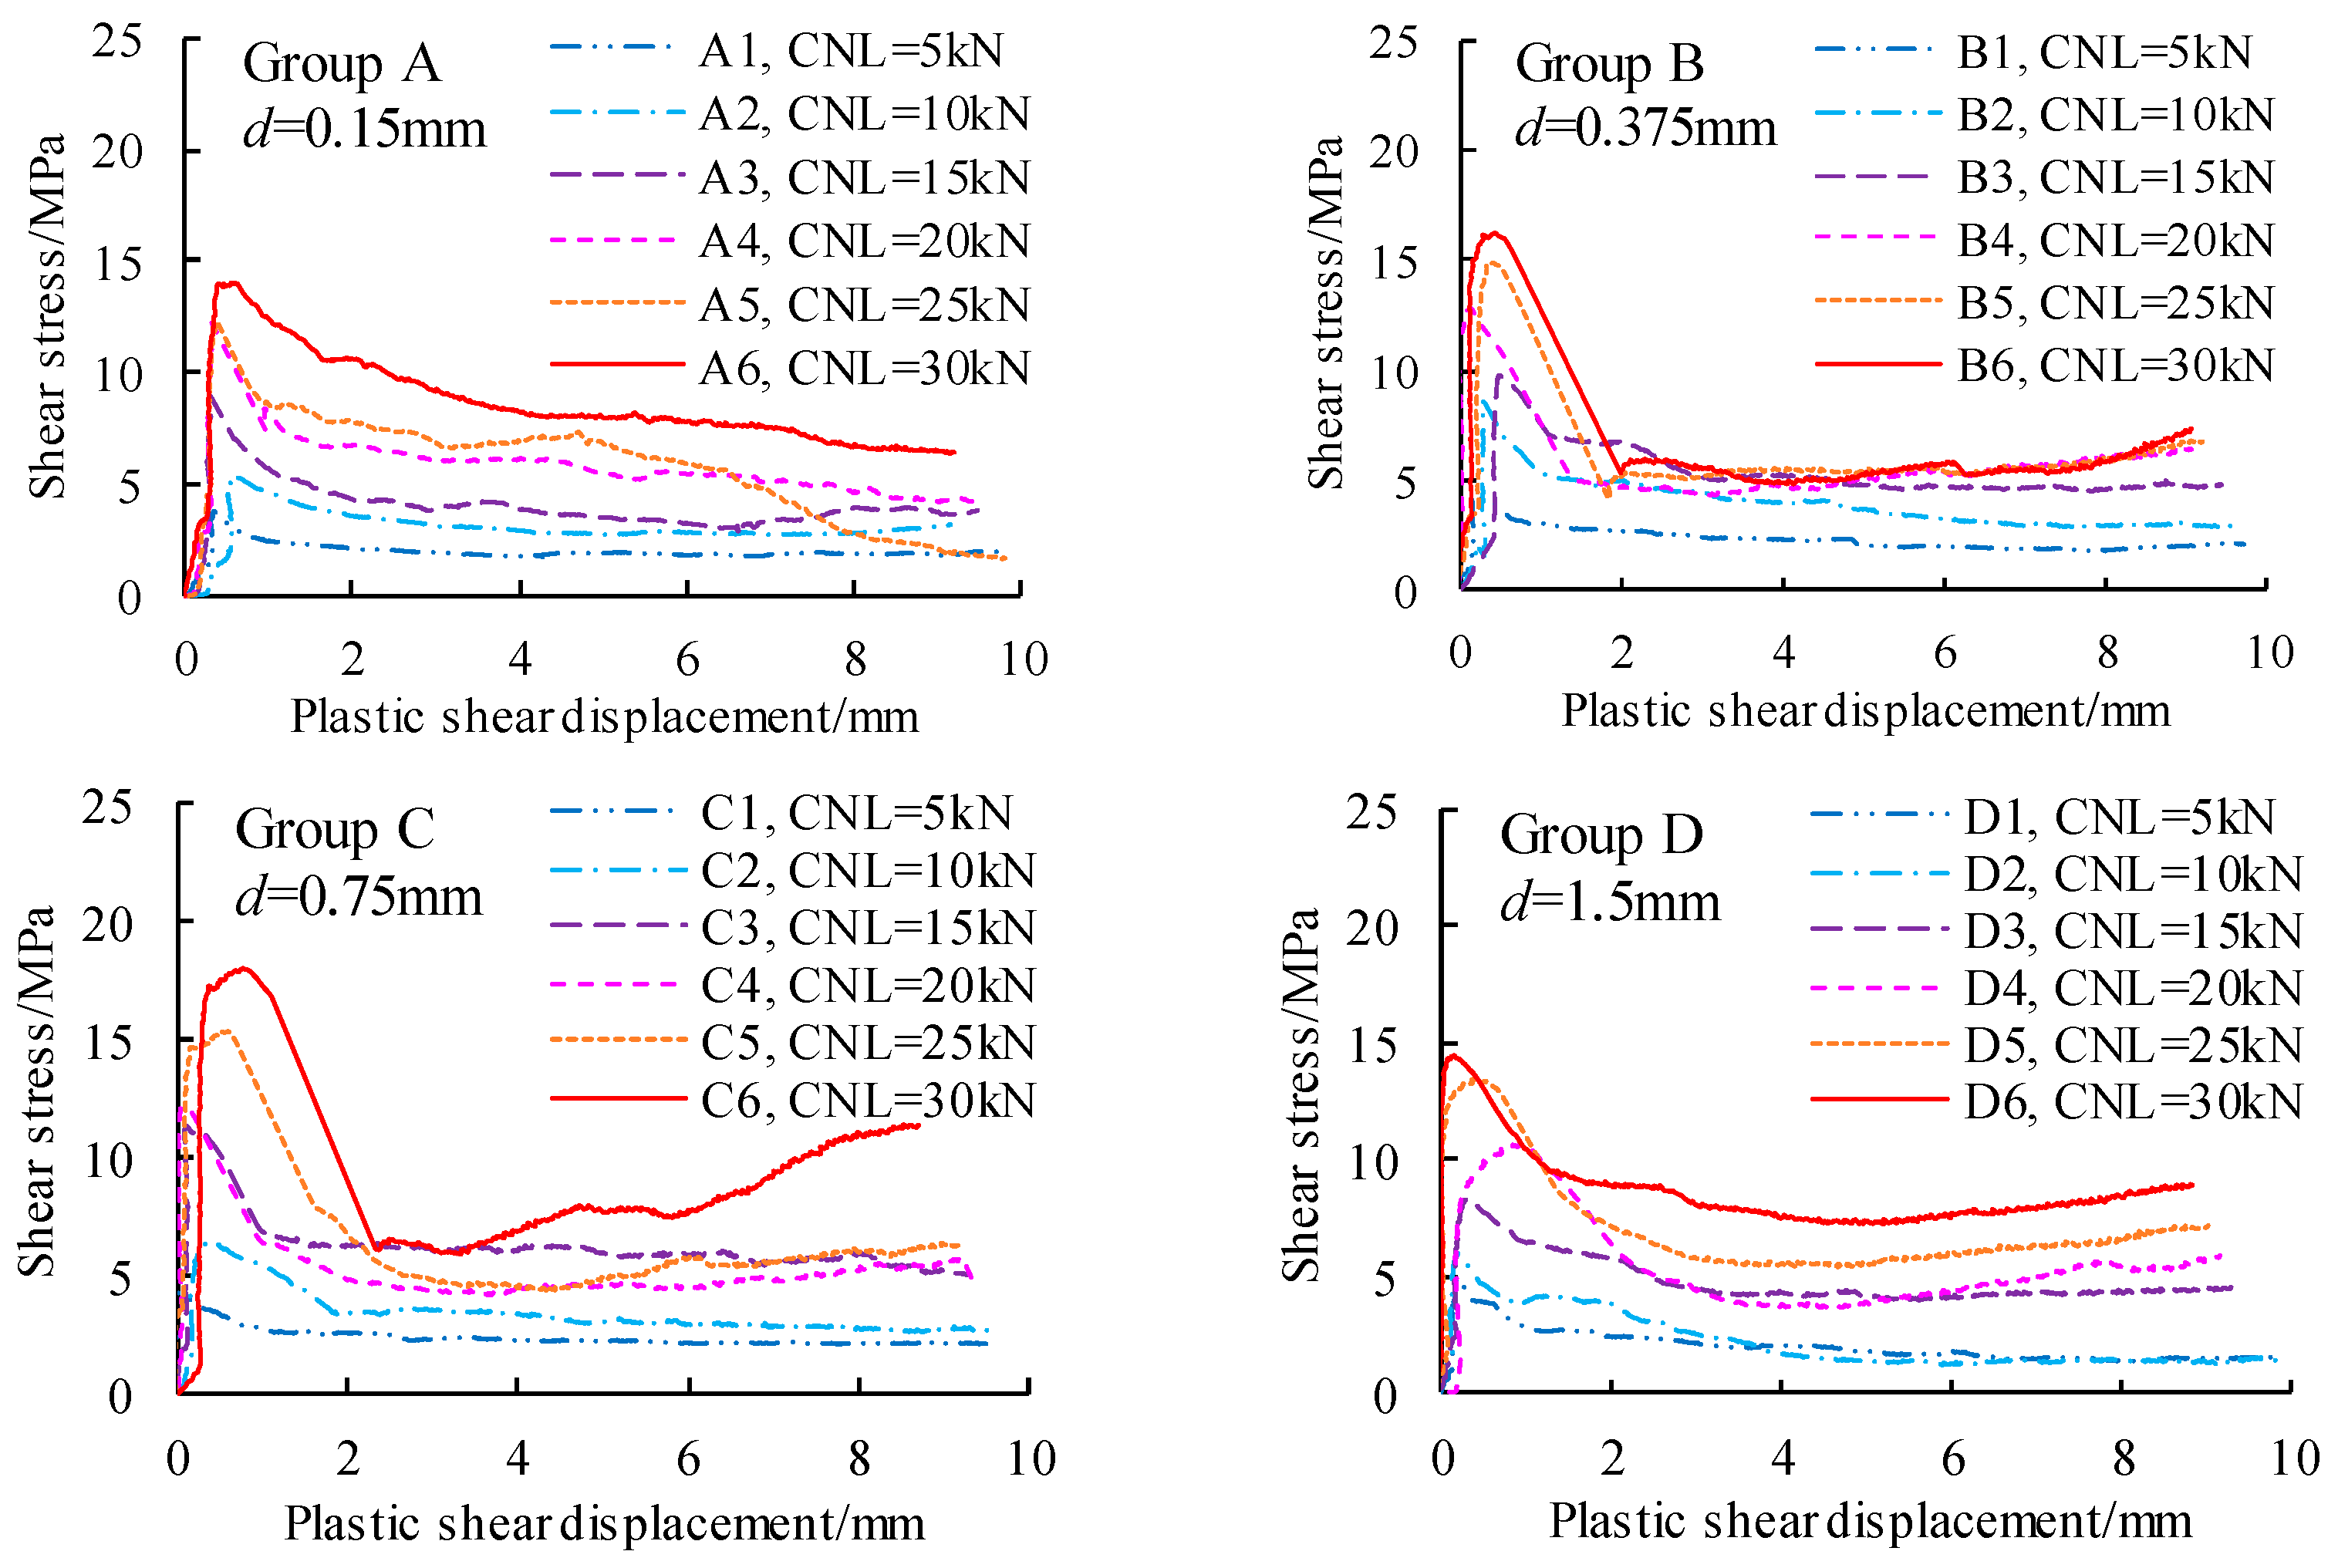
Sp in Figure 9f is the post-peak soft modulus of the shear stress–plastic shear displacement curve, which is used to describe the shear weakening process or shear instability behavior of rock joints. It should be noted that the post-peak soft modulus (Sp) is different from the post-peak modulus (S), because Sp only describes the weakening behavior of the local damage shear zone (e.g., asperities providing shear resistance) while S describes the average weakening behavior of the whole shear zone. Therefore, Sp is more suitable than S to describe the shear instability behavior of rock joints, which is also called the shear instability parameter. At present, there are few shear instability parameters that can specifically consider the influence of the damage zone alone. According to Equation (1), the shear stress–plastic shear displacement experimental curves of marble joints are obtained by eliminating the elastic deformation, as shown in Figure 10. The experimental values of Sp are listed in Table 4.
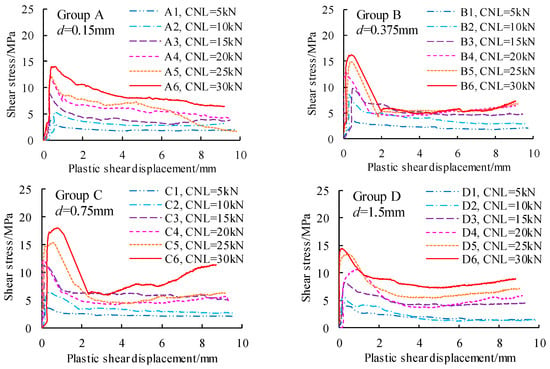
Figure 10.
Shear stress–plastic displacement curves of marble joints under different CNLs.

Table 4.
Values of shear instability parameters and influencing factors.
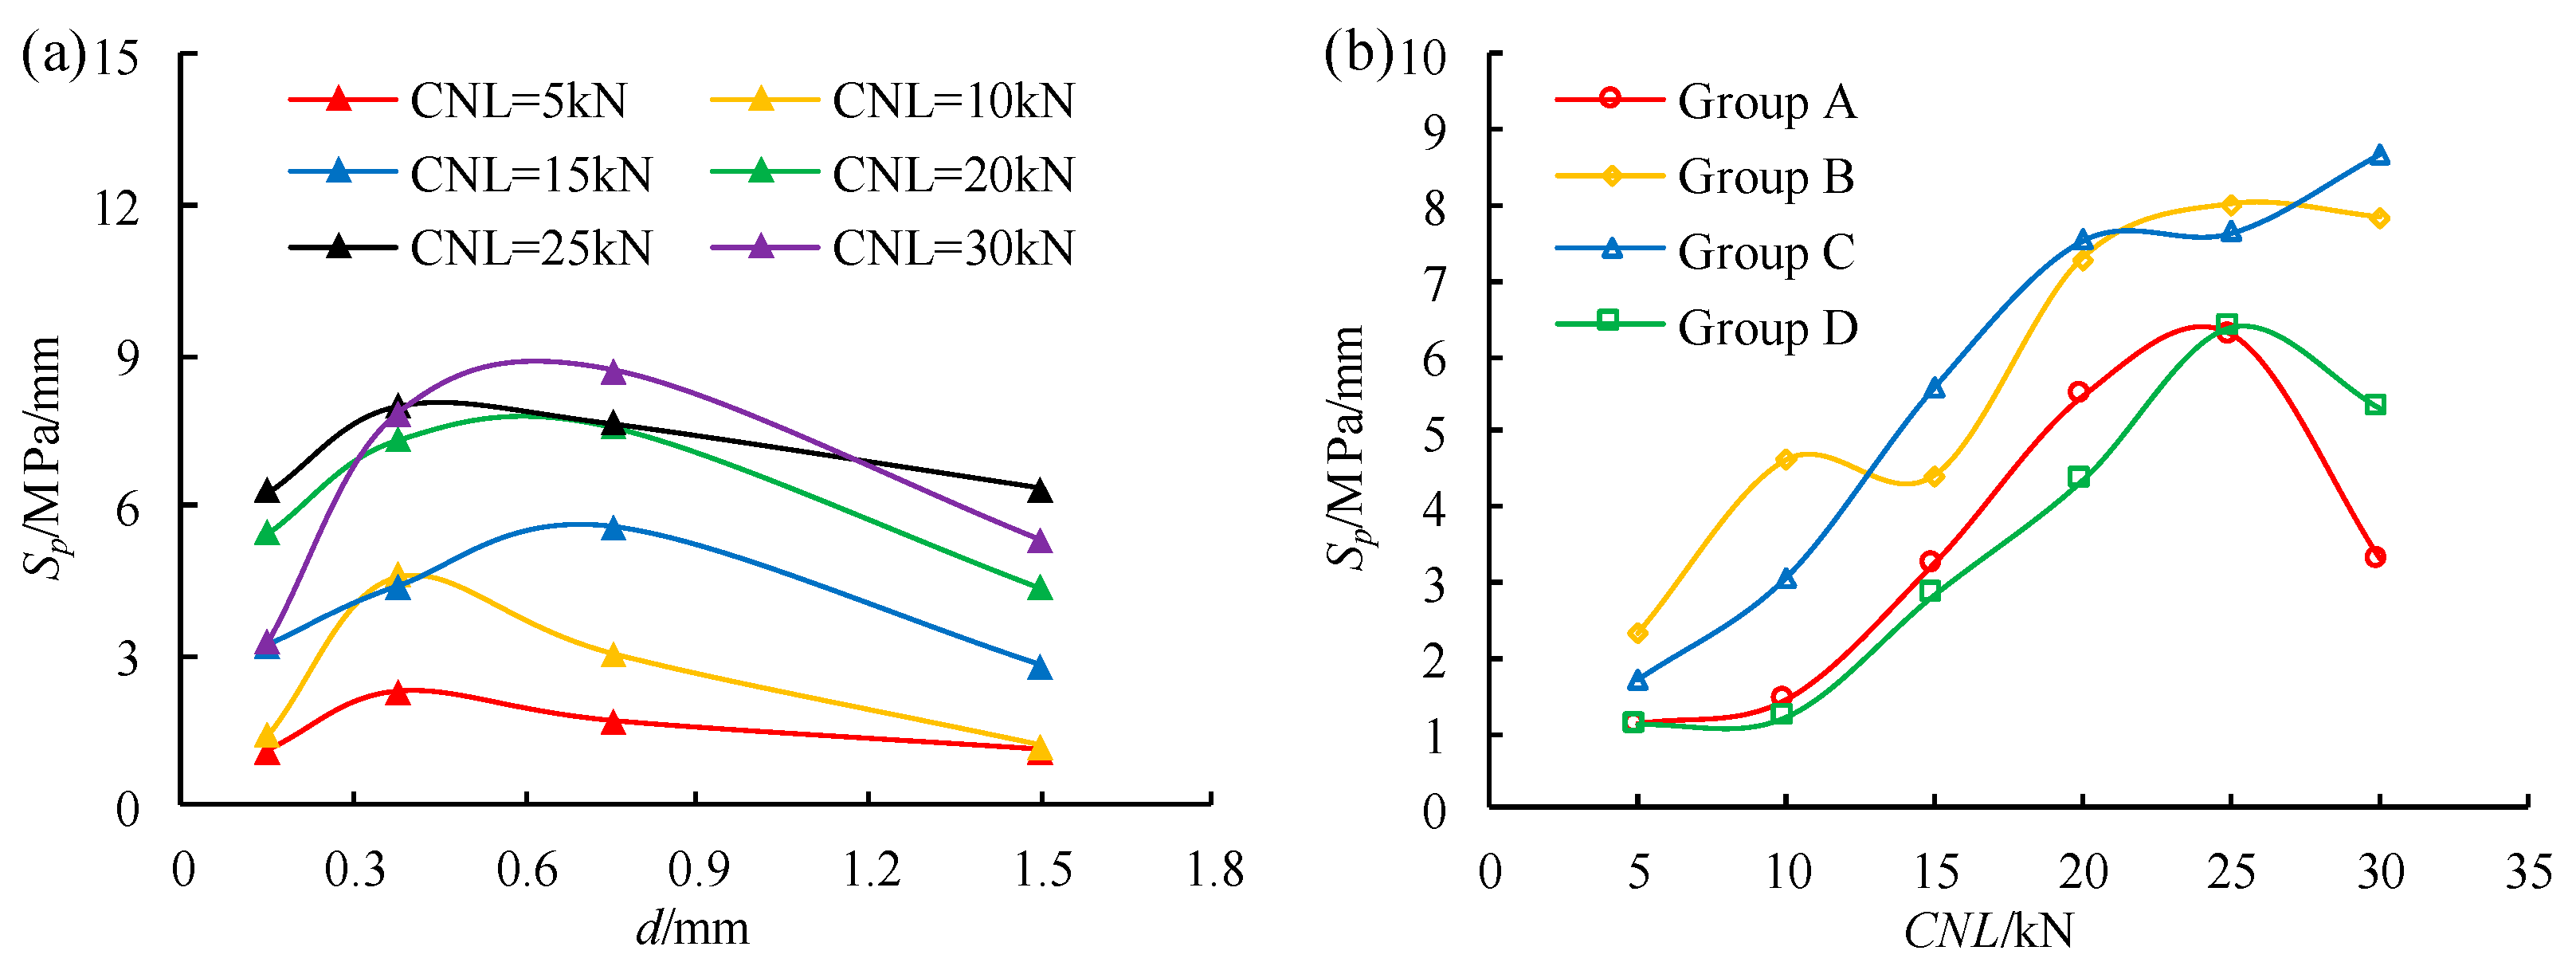
According to Figure 10, the relationship between CNL, d, and Sp can be obtained, as shown in Figure 11. Figure 11a shows that Sp first increases and then decreases linearly with the increase in d, which is different from the exponential relationship between S and d shown in Figure 7c. Figure 11b shows that Sp first increases linearly with the increase in CNL and then tends to be stable or decreases. However, the exponential increase in S with the increase in CNL in Figure 8c is not reasonable because the marble specimen changes from brittleness to ductility when CNL is very large. Therefore, Sp is more suitable for describing the shear weakening behavior of the local shear zone, while S is more suitable for describing the average shear weakening behavior of the whole shear zone.
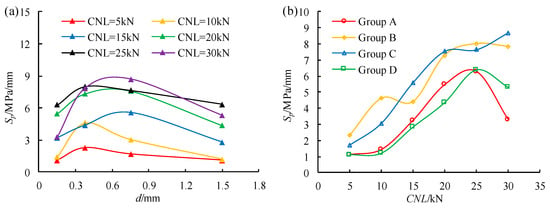
Figure 11.
Influence of CNL and d on Sp of rock joints. (a) Relationship between Sp and d, (b) Relationship between Sp and CNL.
4.2. Shear Instability Model and Criterion
Based on the shear instability mechanism of rock joints, the shear instability model of rock joints, as shown in Figure 12, is established. The model consists of a spring and a wedge in series. The spring characterizes the elastic deformation accumulated in the rockmass on both sides of the joint shear zone, and its characteristic parameter is the initial shear modulus (E); the wedge represents the weakening behavior of the joint shear zone, and the characteristic parameter is the post-peak soften modulus or shear instability parameter (Sp). The spring compresses and accumulates elastic energy with the increase in shear displacement, and the wedge slips after reaching the peak shear strength. When the wedge is weakened, the spring is unloaded, and the elastic deformation is transformed into plastic deformation. Therefore, the characteristic parameters of the spring and the wedge together determine the occurrence of the shear instability of rock joints. The mechanical model of the shear instability of rock joints reflects the physical essence of shear instability, that is, the elastic rebound and energy release of rockmass on both sides of the joint shear zone. At present, there are few mechanical models that consider the influence of the elastic rebound of rockmass on the shear instability of rock joints.

Figure 12.
Mechanical model of shear instability of rock joints.
The necessary condition for the shear instability of rock joints is that the elastic rebound on both sides of the joint shear zone is greater than the weakening deformation of the joint shear zone [27,28]. In this respect, the shear failure of rock joints can be accomplished only by the elastic rebound and energy release of the specimen itself. Therefore, the necessary conditions for the shear instability of rock joints (i.e., the shear instability criterion) are shown as follow:
Table 4 lists the values of CNL and d, which are influencing factors of shear instability, and the shear instability parameter Sp and elastic modules E, respectively. According to the shear instability criterion of Equation (2), it can be determined that B4, C4, B5, C5, B6, and C6 occur shear instability by comparing the experimental values of Sp and E.
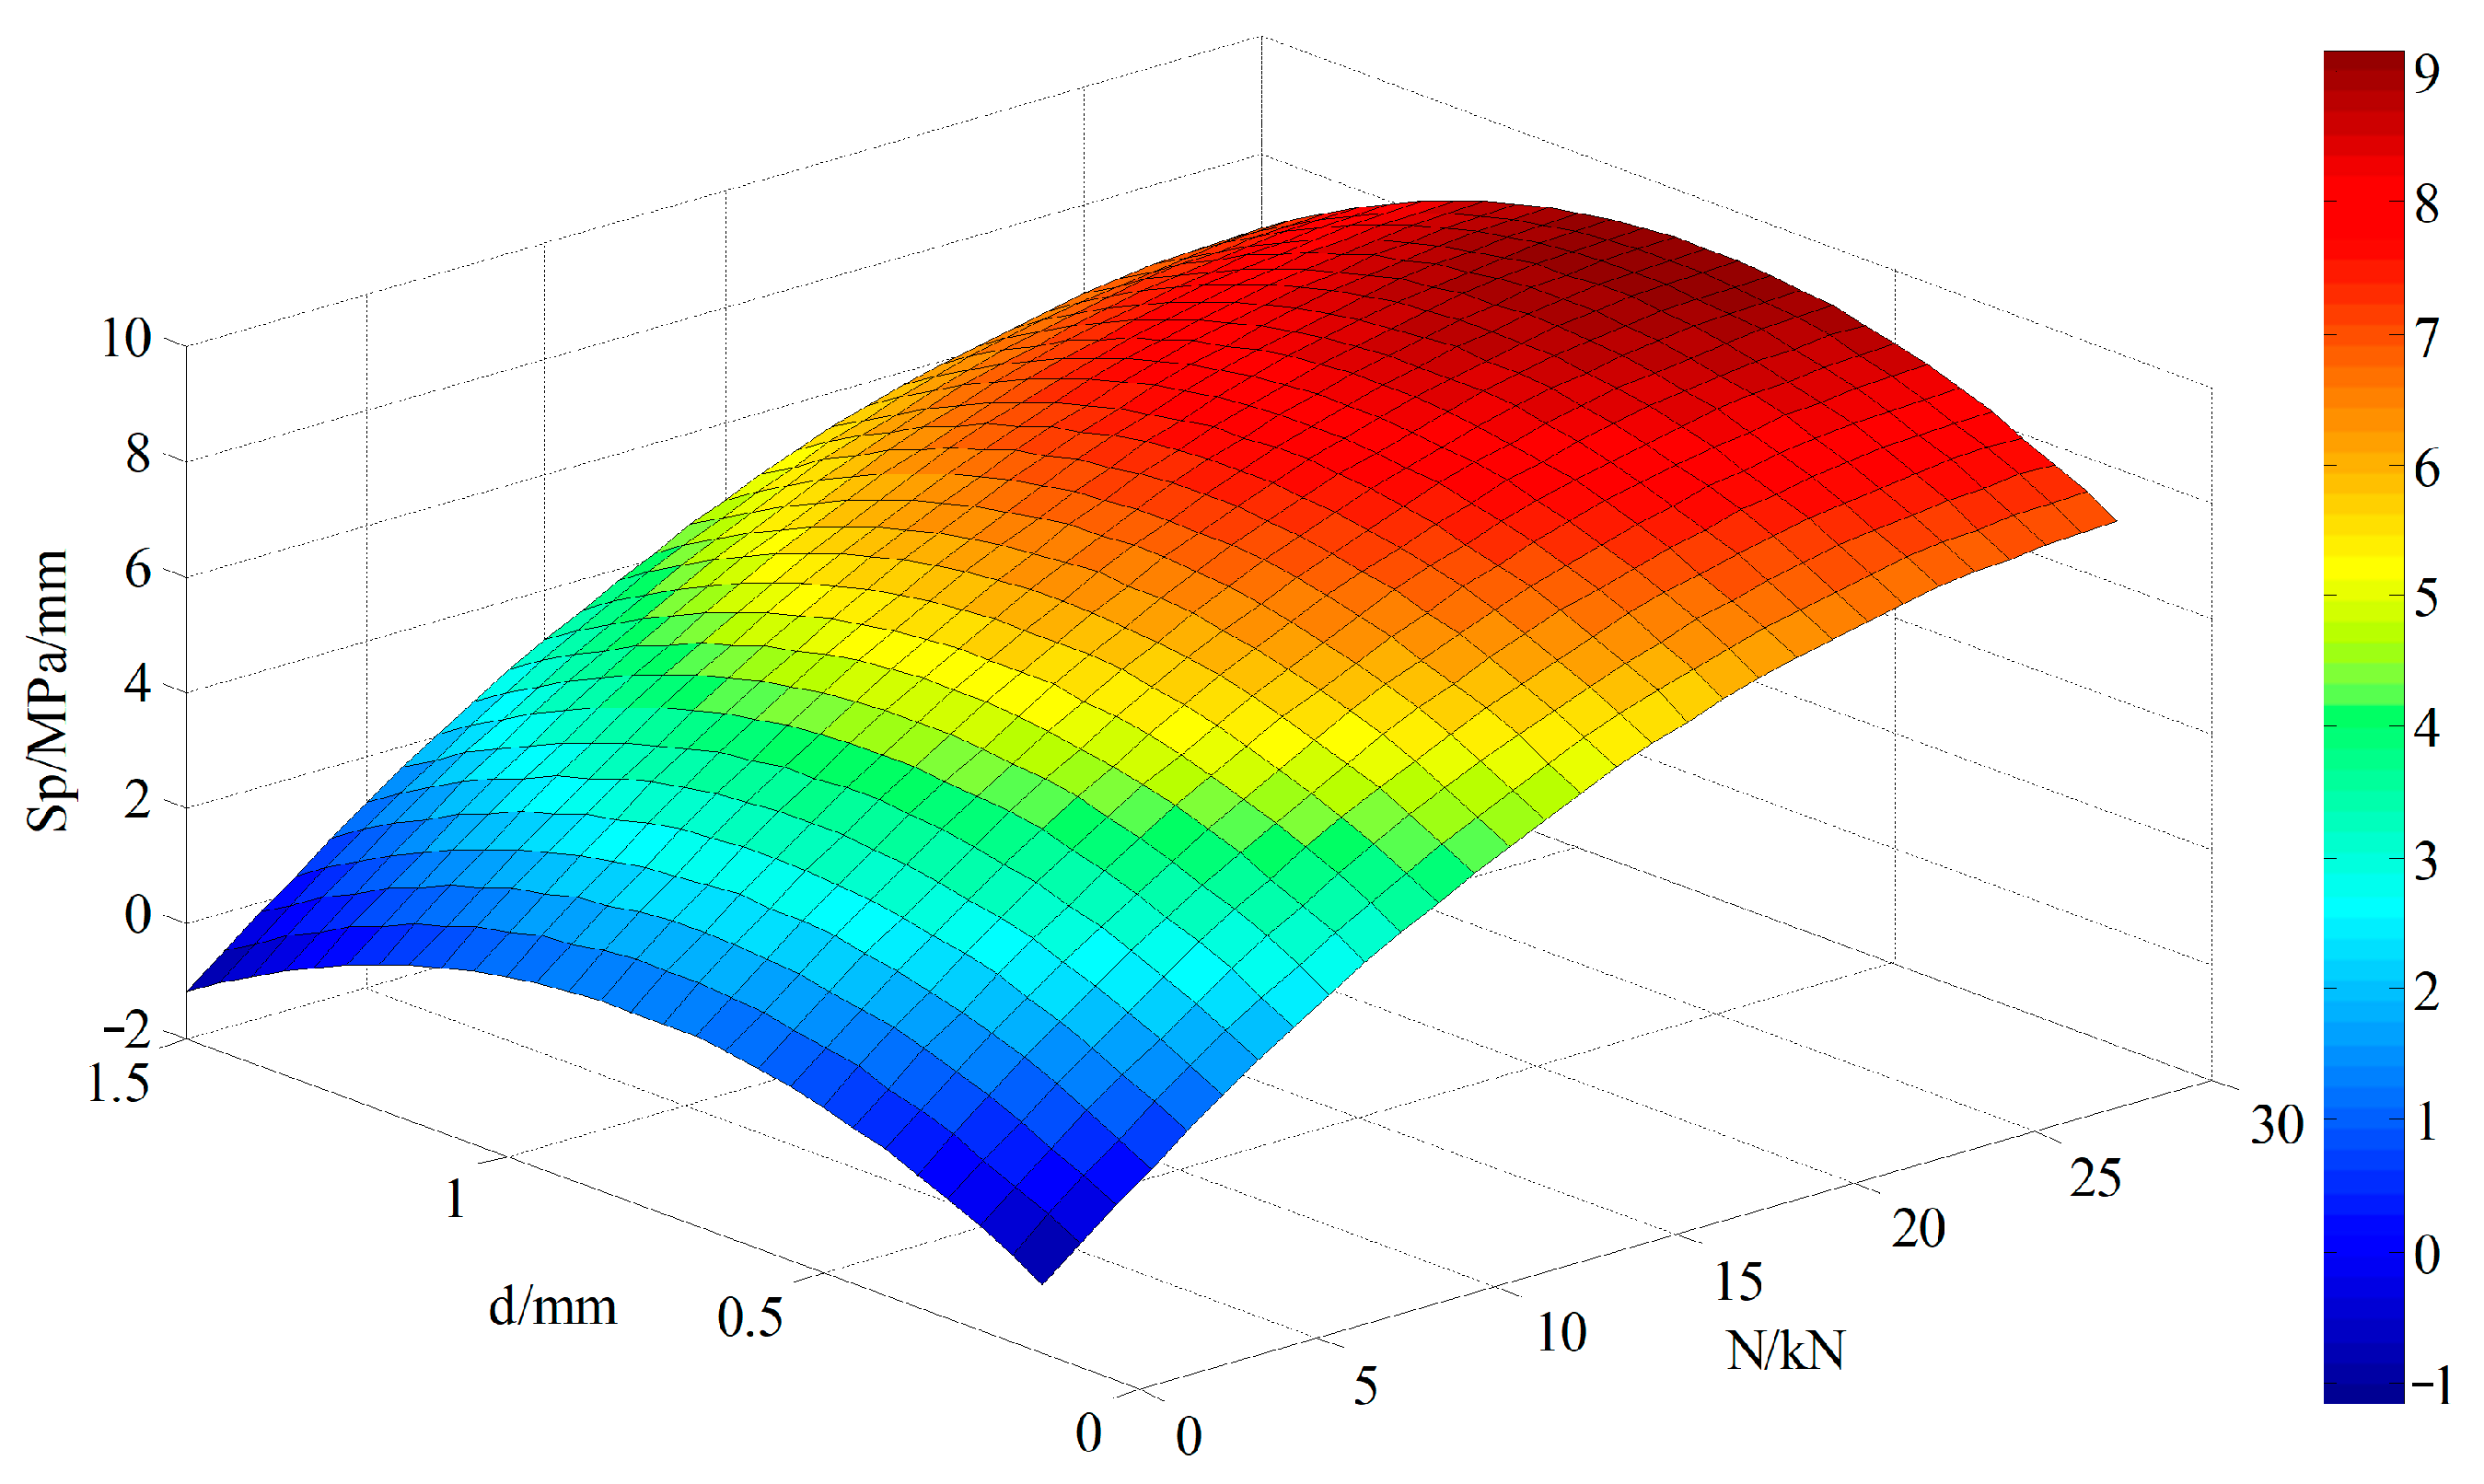
According to the experimental results from Figure 11, the relationship between the shear instability parameter (Sp) and its influencing factors CNL (N) and grain size (d) can be obtained by fitting, as shown by the empirical formula of Equation (3) and its 3D surface in Figure 13. The empirical relationship (Equation (3)) between the shear instability parameter (Sp) and its influencing factors CNL (N) and grain size (d) shows a moderate fit (e.g., R2 = 0.8115). This may be due to the following factors: (1) there exists a slight dislocation between the upper and lower joint surface during the encapsulation process of the joint specimen; (2) the local damage of the joint surface is caused by the Brazilian-splitting method in the process of making joints; and (3) the discreteness of the specimens may affect the fitting result. In this respect, in view of the three potential factors affecting the test results, the repeated test is used to reduce the effect.
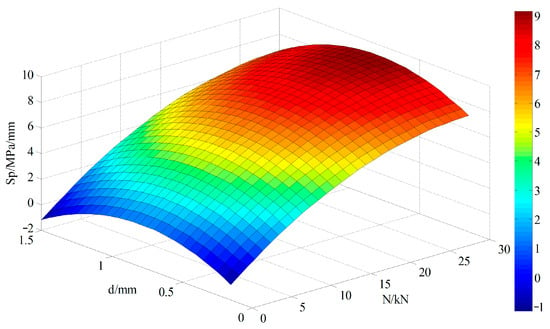
Figure 13.
Three-dimensional surface for shear instability parameter and its influencing factors.
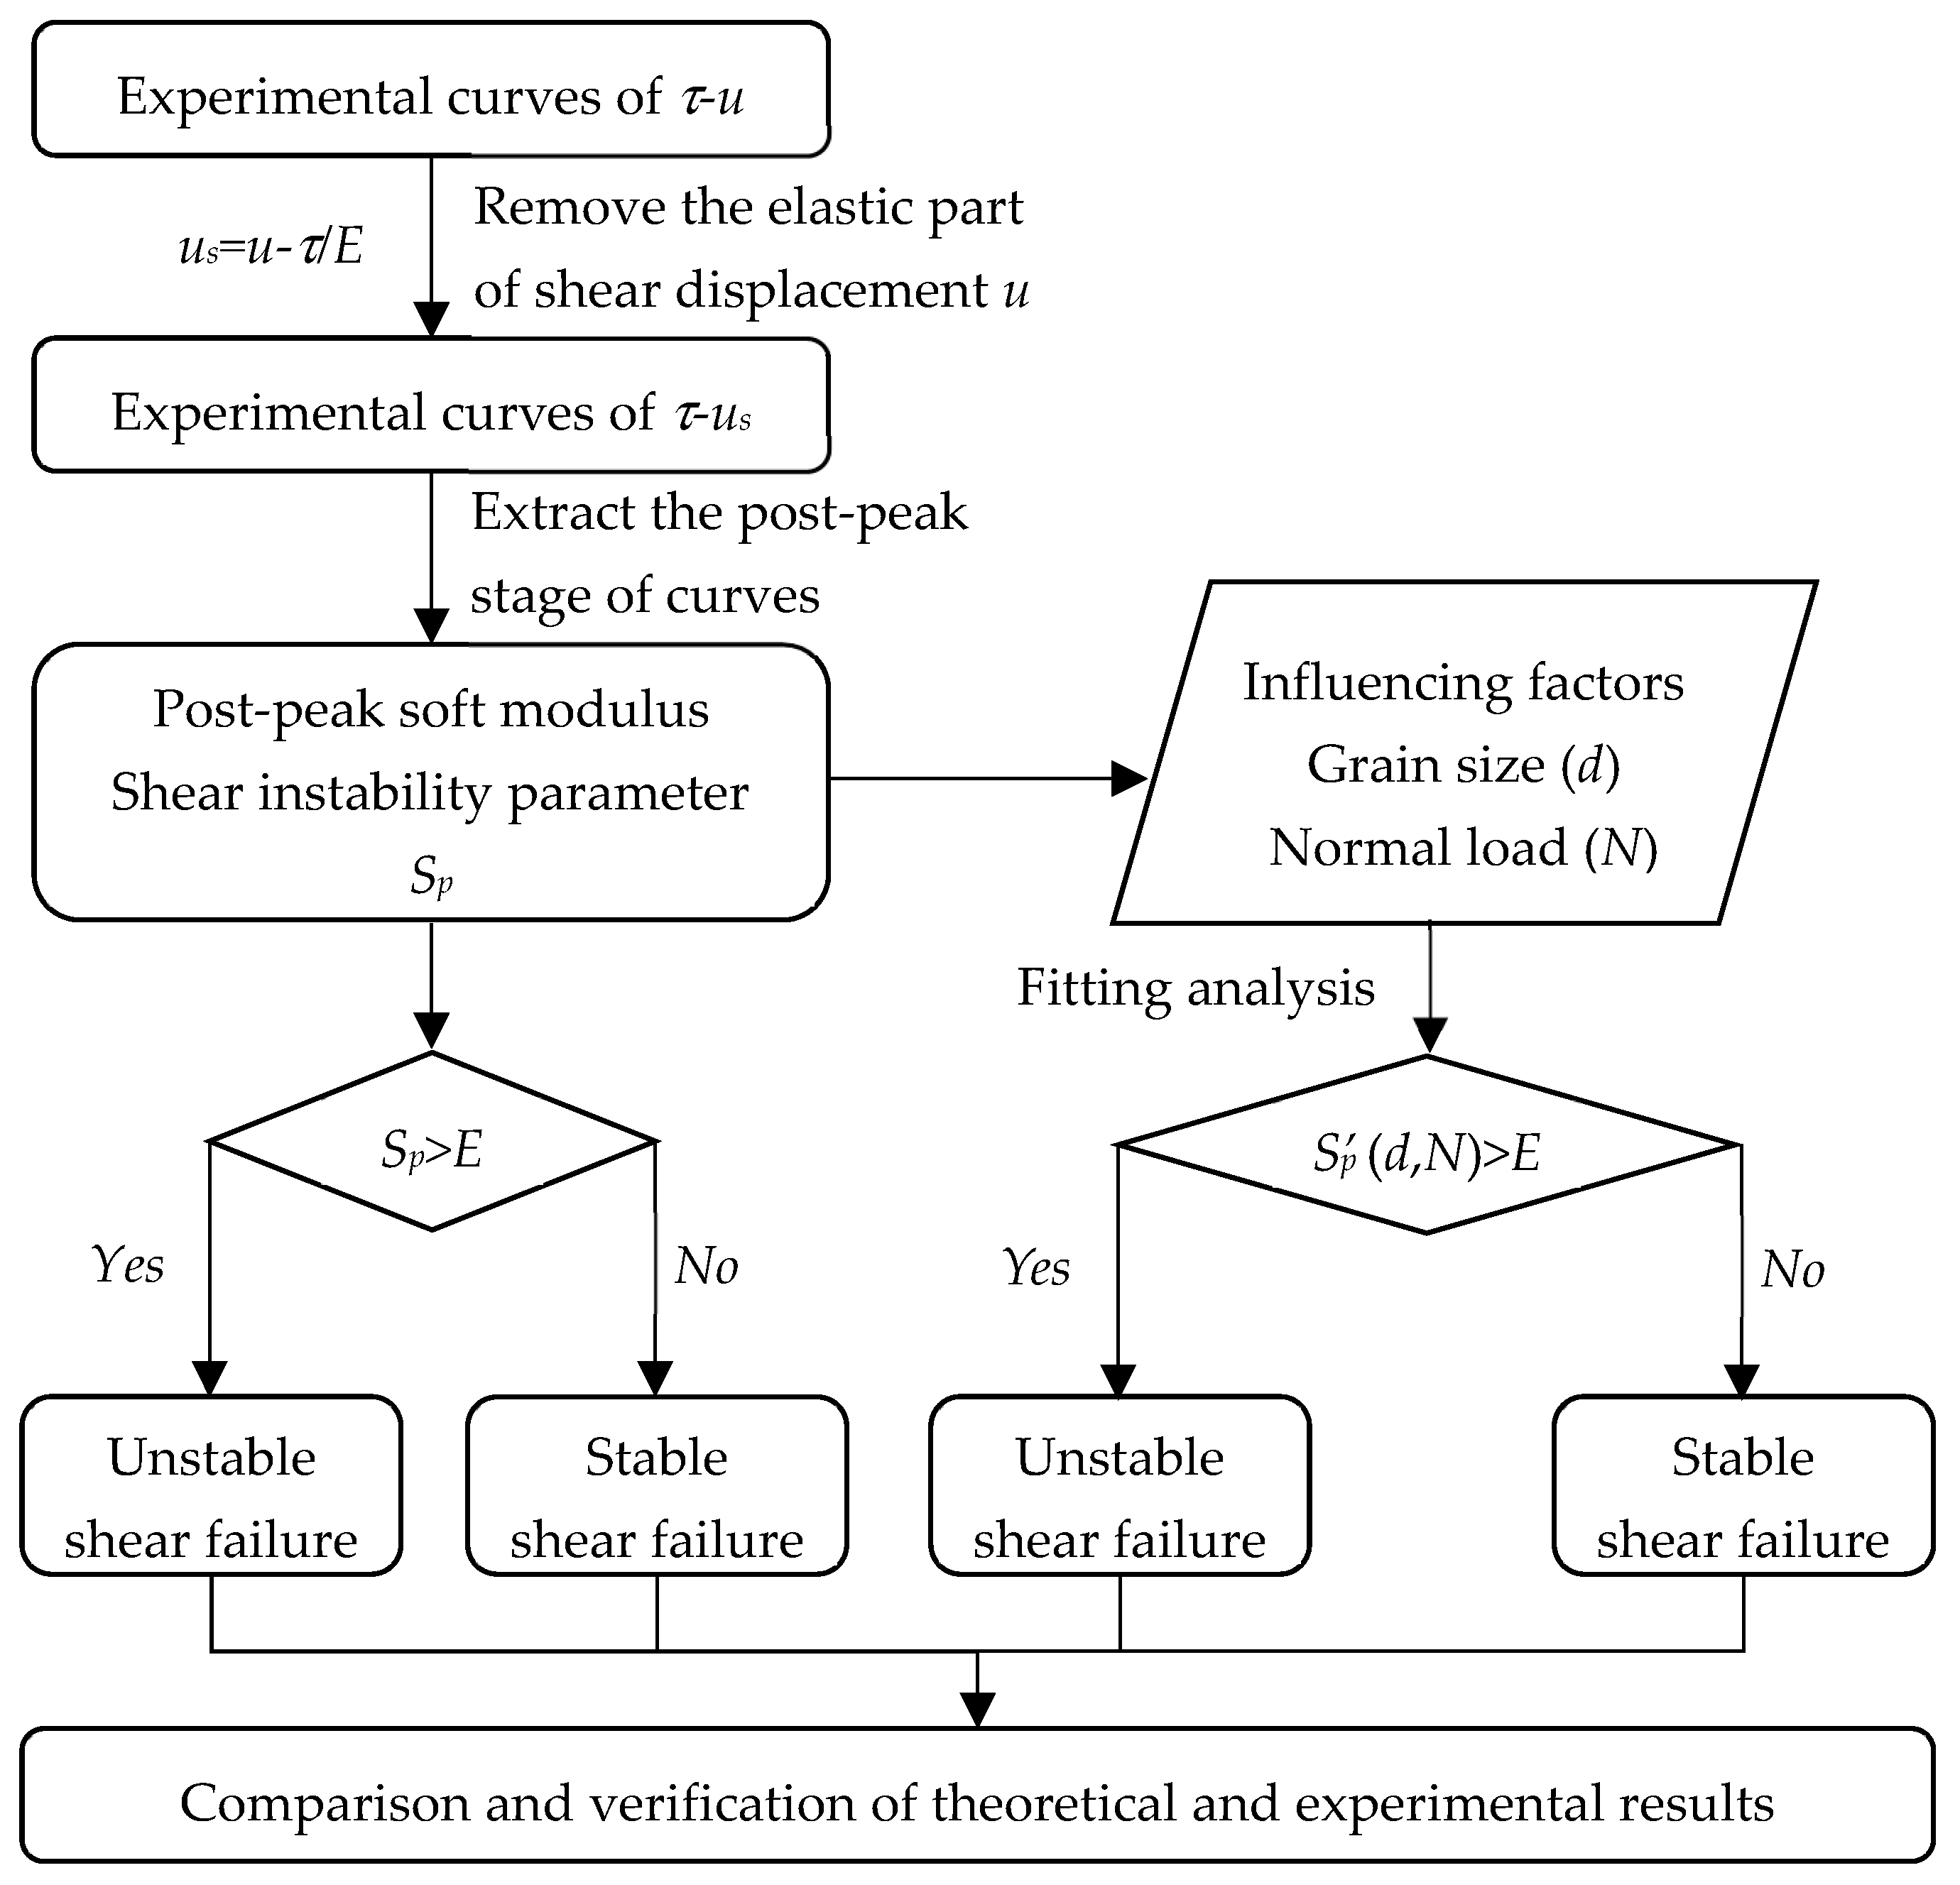
The empirical values of the shear instability parameter were calculated and are listed in Table 4. By comparing the empirical result () with the experimental result (Sp), the shear instability behavior of marble joints is further verified. In conclusion, it is possible to predict the possibility of the shear instability of marble joints by means of Equation (2) and Equation (3) and provide references for the stability analysis of rock engineering. Figure 14 shows the establishment and derivation process of the shear instability model, as well as the logical flow chart of shear instability discrimination. It should be noted that the shear instability parameter (Sp) is different from existing research because Sp focuses on describing the weakening behavior of the local damage shear zone (e.g., asperities providing shear resistance), which is more reflective of the physical reality. However, existing research describes the average weakening behavior of the whole shear zone, but in fact, some shear zones do not provide shear resistance. Therefore, Sp is more suitable to describe the shear instability behavior of rock joints than existing research. In addition, the shear instability models of rock joints in existing studies have not considered the elastic rebound of rockmass on both sides of the joint surface, which reflects the physical essence of shear instability.
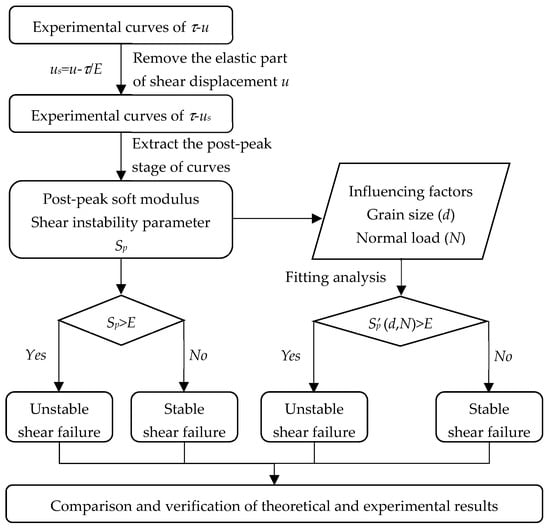
Figure 14.
Shear instability model derivation and discriminant logical diagram.
5. Conclusions
In this study, the influence of grain size (d) and constant normal load (CNL) on the shear mechanical properties of rock joints was investigated through experiments and theoretical method, which further revealed the shear instability mechanism of rock joints. The following conclusions can be drawn:
- The grain size (d) and normal load (CNL) have significant effects on the shear mechanical properties of rock joints, such as the peak shear strength (τp), peak shear displacement (up), post-peak modulus (S), and stress drop (Δτ). On the one hand, the τp, up, S, and Δτ of rock joints generally increase first and then decrease with the increase in grain size (d). On the other hand, the τp, up, S, and Δτ of rock joints generally increase with the increase in normal load (CNL).
- Marble specimens with a smaller grain size have a compact structure, fewer inherent cracks, and a higher proportion of dolomite with large Mohs hardness, which improves τp and up. Marble specimens with a larger grain size have a loose structure, fewer grain boundaries, and a higher proportion of calcite with lower Mhos hardness, resulting in decreases in shear stress dispersion, τp, and up. The mineral composition and microstructure have certain influences on the shear mechanical properties of rock joints.
- The established mechanical model of the shear instability of rock joints and the proposed shear instability parameter of the post-peak soften modulus () can be used to predict the possibility of the shear instability of marble joints. The shear instability behavior of marble joints is verified by comparing the empirical result () with the experimental result (Sp), that is, the rock joint specimens B4, B5, B6, C4, C5, and C6 are determined as shear instability.
- The proposed shear instability parameter (Sp) can describe the weakening behavior of the local damage shear zone, while S describes the average weakening behavior of the whole shear zone. The shear instability analysis proves that Sp is more suitable than S to describe the shear instability behavior of rock joints.
- This paper only studied the shear instability characteristics and influencing factors of marble joints (metamorphic rock), and the research on other types of rock is still insufficient. In future research, the shear instability characteristics and influencing factors of sandstone (sedimentary rock) and granite (igneous rock) joints will be studied to improve our understanding of the shear instability mechanism of different types of rock joints.
Author Contributions
Conceptualization, H.D.; methodology, H.D.; validation, B.G.; formal analysis, H.D.; investigation, H.D.; data curation, H.D.; writing—original draft preparation, H.D.; writing—review and editing, H.D. and B.G.; visualization, K.S., Q.M. and H.W.; supervision, B.G. All authors have read and agreed to the published version of the manuscript.
Funding
This work was financially supported by the Youth Fund of the Natural Science Foundation of Henan Province (Grant No. 242300421457), Anhui Province Joint Key Laboratory of Intelligent and Green Mining of Deep Coal Resources (Grant No. IGMDCR202404), North China University of Water Resources and Electric Power Launch Fund for High-level Talents Research (Grant No. 40937), and Henan Province Science and Technology Research Project (Grant No. 242102320364).
Institutional Review Board Statement
Not applicable.
Informed Consent Statement
Not applicable.
Data Availability Statement
The data are contained within the article.
Conflicts of Interest
Author Qing Ma was employed by the company Jiangsu Xukuang Energy Co., Ltd. The remaining authors declare that the research was conducted in the absence of any commercial or financial relationships that could be construed as a potential conflict of interest.
References
- Meng, F.; Zhou, H.; Wang, Z.; Zhang, C.; Li, S.; Zhang, L.; Kong, L. Characteristics of Asperity Damage and Its Influence on the Shear Behavior of Granite Joints. Rock Mech. Rock Eng. 2017, 51, 429–449. [Google Scholar] [CrossRef]
- Li, B.; Gong, X.; Wang, G.; Qiao, J. Benchmark experiment on shear behavior of ice-filled planar rock joints using a novel direct shear testing apparatus. Int. J. Rock Mech. Min. Sci. 2024, 178, 105757. [Google Scholar] [CrossRef]
- Sarfarazi, V.; Karimi Javid, H.; Asgari, K. Study of rock pillar failure consisting of non-persistent joint using experimental test and fracture analysis code in two dimensions. J. Min. Environ. 2021, 12, 163–179. [Google Scholar] [CrossRef]
- Dong, H.; Zhu, W.; Niu, L.; Hou, C.; Liu, X. Numerical and theoretical study of load transfer behavior during cascading pillar failure. J. Rock Mech. Geotech. Eng. 2024, 16, 3014–3033. [Google Scholar] [CrossRef]
- Gu, Q.; Zhang, Q.; Dai, W.; Ye, S.; Li, T. Measurement of 3D joint surface morphology and estimation for shear mechanical behavior: A theoretical model and experimental investigation. Measurement 2024, 237, 115202. [Google Scholar] [CrossRef]
- Lindqvist, J.E.; Åkesson, U.; Malaga, K. Microstructure and functional properties of rock materials. Mater. Charact. 2007, 58, 1183–1188. [Google Scholar] [CrossRef]
- Zhang, X.; Jiang, Q.; Kulatilake, P.H.S.W.; Xiong, F.; Yao, C.; Tang, Z. Influence of Asperity Morphology on Failure Characteristics and Shear Strength Properties of Rock Joints under Direct Shear Tests. Int. J. Geomech. 2019, 19, 04018196. [Google Scholar] [CrossRef]
- Meng, F.; Wong, L.N.Y.; Zhou, H.; Wang, Z. Comparative study on dynamic shear behavior and failure mechanism of two types of granite joint. Eng. Geol. 2018, 245, 356–369. [Google Scholar] [CrossRef]
- Kabeya, K.K.; Legge, T.F.H. Relationship between grain size and some surface roughness parameters of rock joints. Int. J. Rock Mech. Min. Sci. 1997, 34, 146.e1–146.e15. [Google Scholar] [CrossRef]
- Zhang, T.; Yu, L.; Peng, Y.; Ju, M.; Yin, Q.; Wei, J.; Jia, S. Influence of grain size and basic element size on rock mechanical characteristics: Insights from grain-based numerical analysis. Bull. Eng. Geol. Environ. 2022, 81, 347. [Google Scholar] [CrossRef]
- Peng, J.; Wong, L.N.Y.; Teh, C.I. Influence of grain size on strength of polymineralic crystalline rock: New insights from DEM grain-based modeling. J. Rock Mech. Geotech. Eng. 2021, 13, 755–766. [Google Scholar] [CrossRef]
- Wang, C.; Elsworth, D.; Fang, Y.; Zhang, F. Influence of fracture roughness on shear strength, slip stability and permeability: A mechanistic analysis by three-dimensional digital rock modeling. J. Rock Mech. Geotech. Eng. 2020, 12, 720–731. [Google Scholar] [CrossRef]
- Zhao, Y.; Zhang, L.; Asce, F.; Wang, W.; Liu, Q.; Tang, L.; Cheng, G. Experimental Study on Shear Behavior and a Revised Shear Strength Model for Infilled Rock Joints. Int. J. Geomech. 2020, 20, 04020141. [Google Scholar] [CrossRef]
- Shrivastava, A.K.; Rao, K.S. Physical Modeling of Shear Behavior of Infilled Rock Joints Under CNL and CNS Boundary Conditions. Rock Mech. Rock Eng. 2018, 51, 101–118. [Google Scholar] [CrossRef]
- Wang, W.; Yao, Q.; Tang, C.; Li, X.; Chong, Z.; Xu, Q. Experimental study on the shear characteristics and weakening mechanism of water-bearing rock joints. Bull. Eng. Geol. Environ. 2021, 80, 7653–7668. [Google Scholar] [CrossRef]
- Fan, H.; Liu, H.; Li, L.; Wang, X.; Tu, W.; Gao, J.; Yang, G. Weakening mechanism of shear strength of jointed rock mass considering the filling characteristics. Bull. Eng. Geol. Environ. 2024, 83, 224. [Google Scholar] [CrossRef]
- Meng, F.; Zhou, H.; Li, S.; Zhang, C.; Wang, Z.; Kong, L.; Zhang, L. Shear behaviour and acoustic emission characteristics of different joints under various stress levels. Rock Mech. Rock Eng. 2016, 49, 4919–4928. [Google Scholar] [CrossRef]
- Jia, B.-X.; Gao, Z.-X.; Han, X.-H.; Jin, J.-X.; Zhang, J.-J. Experimental analysis of the stick-slip characteristics of faults at different loading rates. PLoS ONE 2020, 15, e0231464. [Google Scholar] [CrossRef]
- Scuderi, M.M.; Collettini, C.; Viti, C.; Tinti, E.; Marone, C. Evolution of shear fabric in granular fault gouge from stable sliding to stick slip and implications for fault slip mode. Geology 2017, 45, 731–734. [Google Scholar] [CrossRef]
- Yuan, W.; Li, J.C.; Zou, C.J.; Zhao, J. A New Apparatus for Testing Shear-Slip Properties of Rock Joint Subjected to Dynamic Disturbance. Exp. Mech. 2024, 64, 745–759. [Google Scholar] [CrossRef]
- Gong, H.; Wang, G.; Luo, Y.; Liu, T.; Li, X.; Liu, X. Shear failure and mechanical behaviors of granite with discontinuous joints under dynamic disturbance: Laboratory tests and numerical simulation. Arch. Civ. Mech. Eng. 2023, 23, 171. [Google Scholar] [CrossRef]
- Kilgore, B.D.; McGarr, A.; Beeler, N.M.; Lockner, D.A. Earthquake Source Properties From Instrumented Laboratory Stick-Slip. In Fault Zone Dynamic Processes; American Geophysical Union: Washington, DC, USA, 2017; pp. 151–169. [Google Scholar]
- Gu, R.; Ozbay, U. Numerical investigation of unstable rock failure in underground mining condition. Comput. Geotech. 2015, 63, 171–182. [Google Scholar] [CrossRef]
- Zhang, B.; Zhang, S.; Shen, B.; Li, Y.; Song, S.; Han, X. Conducting Research to Identify Key Features and Critical Nodes in the Coalescence and Instability of Pre-Fabricated Jointed Rock. Appl. Sci. 2024, 14, 7905. [Google Scholar] [CrossRef]
- Tuğrul, A.; Zarif, I.H. Correlation of mineralogical and textural characteristics with engineering properties of selected granitic rocks from Turkey. Eng. Geol. 1999, 51, 303–317. [Google Scholar] [CrossRef]
- Dong, H.; Guo, B.; Li, Y.; Si, K.; Wang, L. Empirical formula of shear strength of rock fractures based on 3D morphology parameters. Geotech. Geol. Eng. 2017, 35, 1169–1183. [Google Scholar] [CrossRef]
- Dong, H.; Zhu, W.; Hou, C.; Liu, X. Load Transfer Behavior During Cascading Pillar Failure: An Experimental Study. Rock Mech. Rock Eng. 2022, 55, 1445–1460. [Google Scholar] [CrossRef]
- Dong, H.; Liu, X.; Zhu, W. Experimental and Theoretical Study of Shear Instability of Rock Joints in the Direct Shear Test. Int. J. Geomech. 2021, 21, 04021004. [Google Scholar] [CrossRef]
Disclaimer/Publisher’s Note: The statements, opinions and data contained in all publications are solely those of the individual author(s) and contributor(s) and not of MDPI and/or the editor(s). MDPI and/or the editor(s) disclaim responsibility for any injury to people or property resulting from any ideas, methods, instructions or products referred to in the content. |
© 2025 by the authors. Licensee MDPI, Basel, Switzerland. This article is an open access article distributed under the terms and conditions of the Creative Commons Attribution (CC BY) license (https://creativecommons.org/licenses/by/4.0/).

