Article

Uranium Mineral Transport in the Peña Blanca Desert: Dissolution or Fragmentation? Simulation in Sediment Column Systems

by
Victoria Pérez-Reyes
1,
Rocio M. Cabral-Lares
1,*,
Jesús G. Canche-Tello
1,
Marusia Rentería-Villalobos
2,*,
Guillermo González-Sánchez
1,
Blanca P. Carmona-Lara
1,
Cristina Hernández-Herrera
1,
Fabián Faudoa-Gómez
1,
Yair Rodríguez-Guerra
1,
Gregorio Vázquez-Olvera
1,
Jorge Carrillo-Flores
1,
Ignacio A. Reyes-Cortés
3,
Daniel Hernández-Cruz
4,
René Loredo-Portales
5 and
María E. Montero-Cabrera
1
1
Advanced Materials Research Center, Miguel de Cervantes 120, Complejo Industrial Chihuahua, Chihuahua 31136, Mexico
2
Faculty of Animal Science and Ecology, Autonomous University of Chihuahua, Perif. R. Almada km 1, Chihuahua 31453, Mexico
3
Faculty of Engineering, Autonomous University of Chihuahua, Circuito Universitario Campus II, Chihuahua 31125, Mexico
4
Faculty of Engineering, Autonomous University of Chiapas, Blvd. Belisario Domínguez km 1081, Tuxtla Gutiérrez 29050, Mexico
5
Instituto de Geología Estación Regional del Noreste, Universidad Nacional Autónoma de México, Luis Donaldo Colosio s/n, Los Arcos, Hermosillo 83250, Mexico
*
Authors to whom correspondence should be addressed.
Appl. Sci. 2025, 15(2), 609; https://doi.org/10.3390/app15020609
Submission received: 26 October 2024 / Revised: 21 December 2024 / Accepted: 22 December 2024 / Published: 10 January 2025
(This article belongs to the Special Issue Advances in Environmental Radioactivity Monitoring and Measurement)

Abstract

:
The Sierra Peña Blanca (SPB) region in Chihuahua, Mexico contains a significant uranium deposit representing about 40% of the country’s reserves. Common uranium minerals in this area include uranophane, schoepite, and weeksite/boltwoodite, with several superficial occurrences. Mining activities in the 1980s left unprocessed uranium ore exposed to weathering, with potential transport towards Laguna del Cuervo. This study presents an experimental simulation of uranium transport in SPB sediments using three approaches: (i) a batch experiment to evaluate the ideal adsorption of (UO2)2+ by fine sediment; (ii) a column system fed with 569 mgU L−1 UO2(NO3)2 to simulate adsorption by different sediment particle sizes; (iii) a column system with an upper horizon of uranophane from the area, fed with deionized water, to simulate uranium weathering and transport in particulate material, determined by liquid scintillation counting, revealed that the clay fraction had the highest adsorption capacity for U. X-ray Absorption Fine Structure (XAFS) analysis at the U L3 edge confirmed the U(IV) oxidation state and the fittings of the extended XAFS spectra confirmed the presence of the uranophane group of minerals. X-ray tomography further corroborated the distribution of particulate minerals along the column. The results suggest that the primary transport mechanism in SPB involves the fragmentation of uranium minerals, accompanied by eventual dissolution and subsequent adsorption of U onto sediments.

1. Introduction

Uranium (U) can be present in rock and soil matrices and redistributed in the environment, both naturally and anthropogenically [1]. The most relevant oxidation states of uranium in nature are two: U(IV), which appears in the insoluble oxide UO2, and U(VI), which forms the uranyl ion (UO2)2+ and forms water-soluble compounds [2].
The transport of U occurs through its release into the surrounding environment, through mining activities, radioactive waste, or nuclear accidents, among others [1]. Abandoned uranium deposits, a global issue, exist in the Americas, Europe, Asia, and Africa [3], now regarded as a legacy of the nuclear energy boom of the 20th century. The transport of uranium in these deposits is studied as a requirement for remediation work. There are frequent publications on transport in humid environments and groundwater [4,5]. Likewise, Transport studies have recently been conducted in rock piles from abandoned uranium mines [6,7]. On the other hand, many abandoned deposits are located in more or less arid territories in Argentina, Australia, Spain, the United States, and the former Soviet Union, among others. However, the study of the surface transport of uranium in arid areas is a significantly underexplored area in the scientific literature, with only a few scattered references [8,9,10]. This scarcity underscores the need for more research in this field.
Experiments have been carried out at different scales to determine the magnitude of uranium transport and interaction at contaminated sites. Among them, transport in sediment-packed columns stands out. For example, using vertical columns with saturated flow and an upward direction [11], investigated the leaching of U-contaminated sediments. In [11], discrete U-containing particles and U-rich areas were identified by SEM, and EDS analysis revealed that the U-containing phases contained U, Si, Ca, and Fe. Complex intergrowths between U-containing solids and aluminosilicates were observed. Analysis of the U-rich zones by X-ray absorption near edge spectroscopy (XANES) showed that uranium was in the oxidized U(VI) state. Extended X-ray absorption fine structure spectroscopy (EXAFS) indicated the possible coexistence of uranyl silicate precipitates and adsorbed uranyl. Applying these methods, in [11], they demonstrated that the release of U from particles is limited by the dissolution kinetics from the uranyl phases, showing a slow transport from the solid phase to the liquid in the pores. Likewise, in [12], the authors studied the potential for the production of U(IV) colloids from solid U(VI) phases under reducing conditions and under U biogeochemistry in dynamic systems using metaschoepite (UO3·nH2O) horizons. After 6 and 12 months of reaction in two vertical columns fed in the bottom-up direction, the sediments were extracted. Bulk, μ- and nano-focusing X-ray absorption spectroscopy (XAFS) and X-ray fluorescence (XRF) analyses were applied to track changes in solid U speciation over time. In [13], with 20 sediment columns and up-flow, an effluent and solids analysis was performed, and geochemical modeling was performed to determine uranium reactive transport in an abandoned uranium mine in Grand Junction, Colorado. The work [14] studied the transport of uranium from metaschoepite in different particle sizes in columns fed with rainwater. The sediments from the reactors were examined using autoradiography, μ-XRF mapping, U μ-XANES, and bulk EXAFS to track uranium migration and speciation. The authors in [15] studied the penetration of 134Cs, using vertical columns fed with a radioactive solution, determining the Kd values for the different particle sizes of the sediments studied.

Sierra Peña Blanca, Deserts and Streams

In the state of Chihuahua, around 40% of the proven uranium reserves in Mexico are reported, located approximately 50 km north of the capital at various points in the Sierra Peña Blanca (SPB) (Figure 1). The main uranium deposits in this area are Nopal I, Domitila, Puerto III, and Margaritas [16]. In the 1980s, the deposits were explored and exploited, and up to 300 tons of uranium ore were placed in the area in rock piles (repository), susceptible to weathering and erosion. Mineralization is associated with igneous rocks of volcanic origin (mainly rhyolitic tuffs), and the subsequent hydrothermal activity is presumed to be the event that mobilized and concentrated the mineral [17,18]. In Nopal I, it is estimated that uranium was deposited in oxides such as uraninite–pitchblende (UO2). In successive events, secondary minerals associated with uranium were formed, such as oxides, hydroxides, and silicates, represented mainly by the phases: schoepite ((UO2)4O(OH)6·6H2O), weeksite K(UO2)2(Si5O)·4H2O, and uranophane (Ca(UO2)2Si2O76H2O), which is predominant in the area [19,20].
The SPB is located within the Chihuahuan Desert and is characterized by an arid climate, according to the Köppen climate classification modified by [21]. The average temperature is 18–22 °C, with extremes in summer around 40 °C [22]. The average rainfall is 235 mm, with variations of 150–400 mm, and is distinguished by being sporadic but intense [23].
Physiographically, the SPB is located in the province of Basins and Ranges of the North (PBRN). This is distinguished by the folding of marine sequences deposited during the Mesozoic, which outcrop to the northeast and south of the mountain range, as well as the filling of valleys with continental sediments (Laguna del Cuervo LC to the east), and sequences of extrusive igneous rocks of felsic composition superimposed on marine rocks of the Mesozoic. The PBRN comprises mountain ranges and valleys with elongated morphologies with a preferential northwest-southeast orientation. These characteristics led to closed endorheic basins, such as the Laguna Hormigas aquifer, where SPB and LC are located [24].
Streams within the SPB are dry most of the year but are well-developed in the high and mountainous parts. Main streams open downslope and deposit most of their sediment in fan-shaped bodies. The phase composition of the sediment is strongly controlled by the source rocks, crystalline tuffs and vitrophides of felsic composition, and mainly limestone sedimentary rocks. Grain sizes vary from conglomerates-fanglomerates to sections with well-sorted sand and layers of clay or mud [25].
Previous research has primarily focused on understanding the transport of uranium in the low-saturated zone through groundwater analysis [26,27,28,29,30]. However, the mechanisms of uranium transport in desert areas, especially surface transport, have not been widely studied. In the Peña Blanca area, the works of [31,32] have shed some light on this issue. Sediment sampling was carried out along the Boca La Colorada and El Tigre streams, whose granulometries range from gravel to clay in different proportions. XRD established the mineralogical composition of these sediments as quartz, calcite, sanidine, natrolite, kaolinite, anorthite, and montmorillonite. These findings underscore the urgent need for further research in this area.
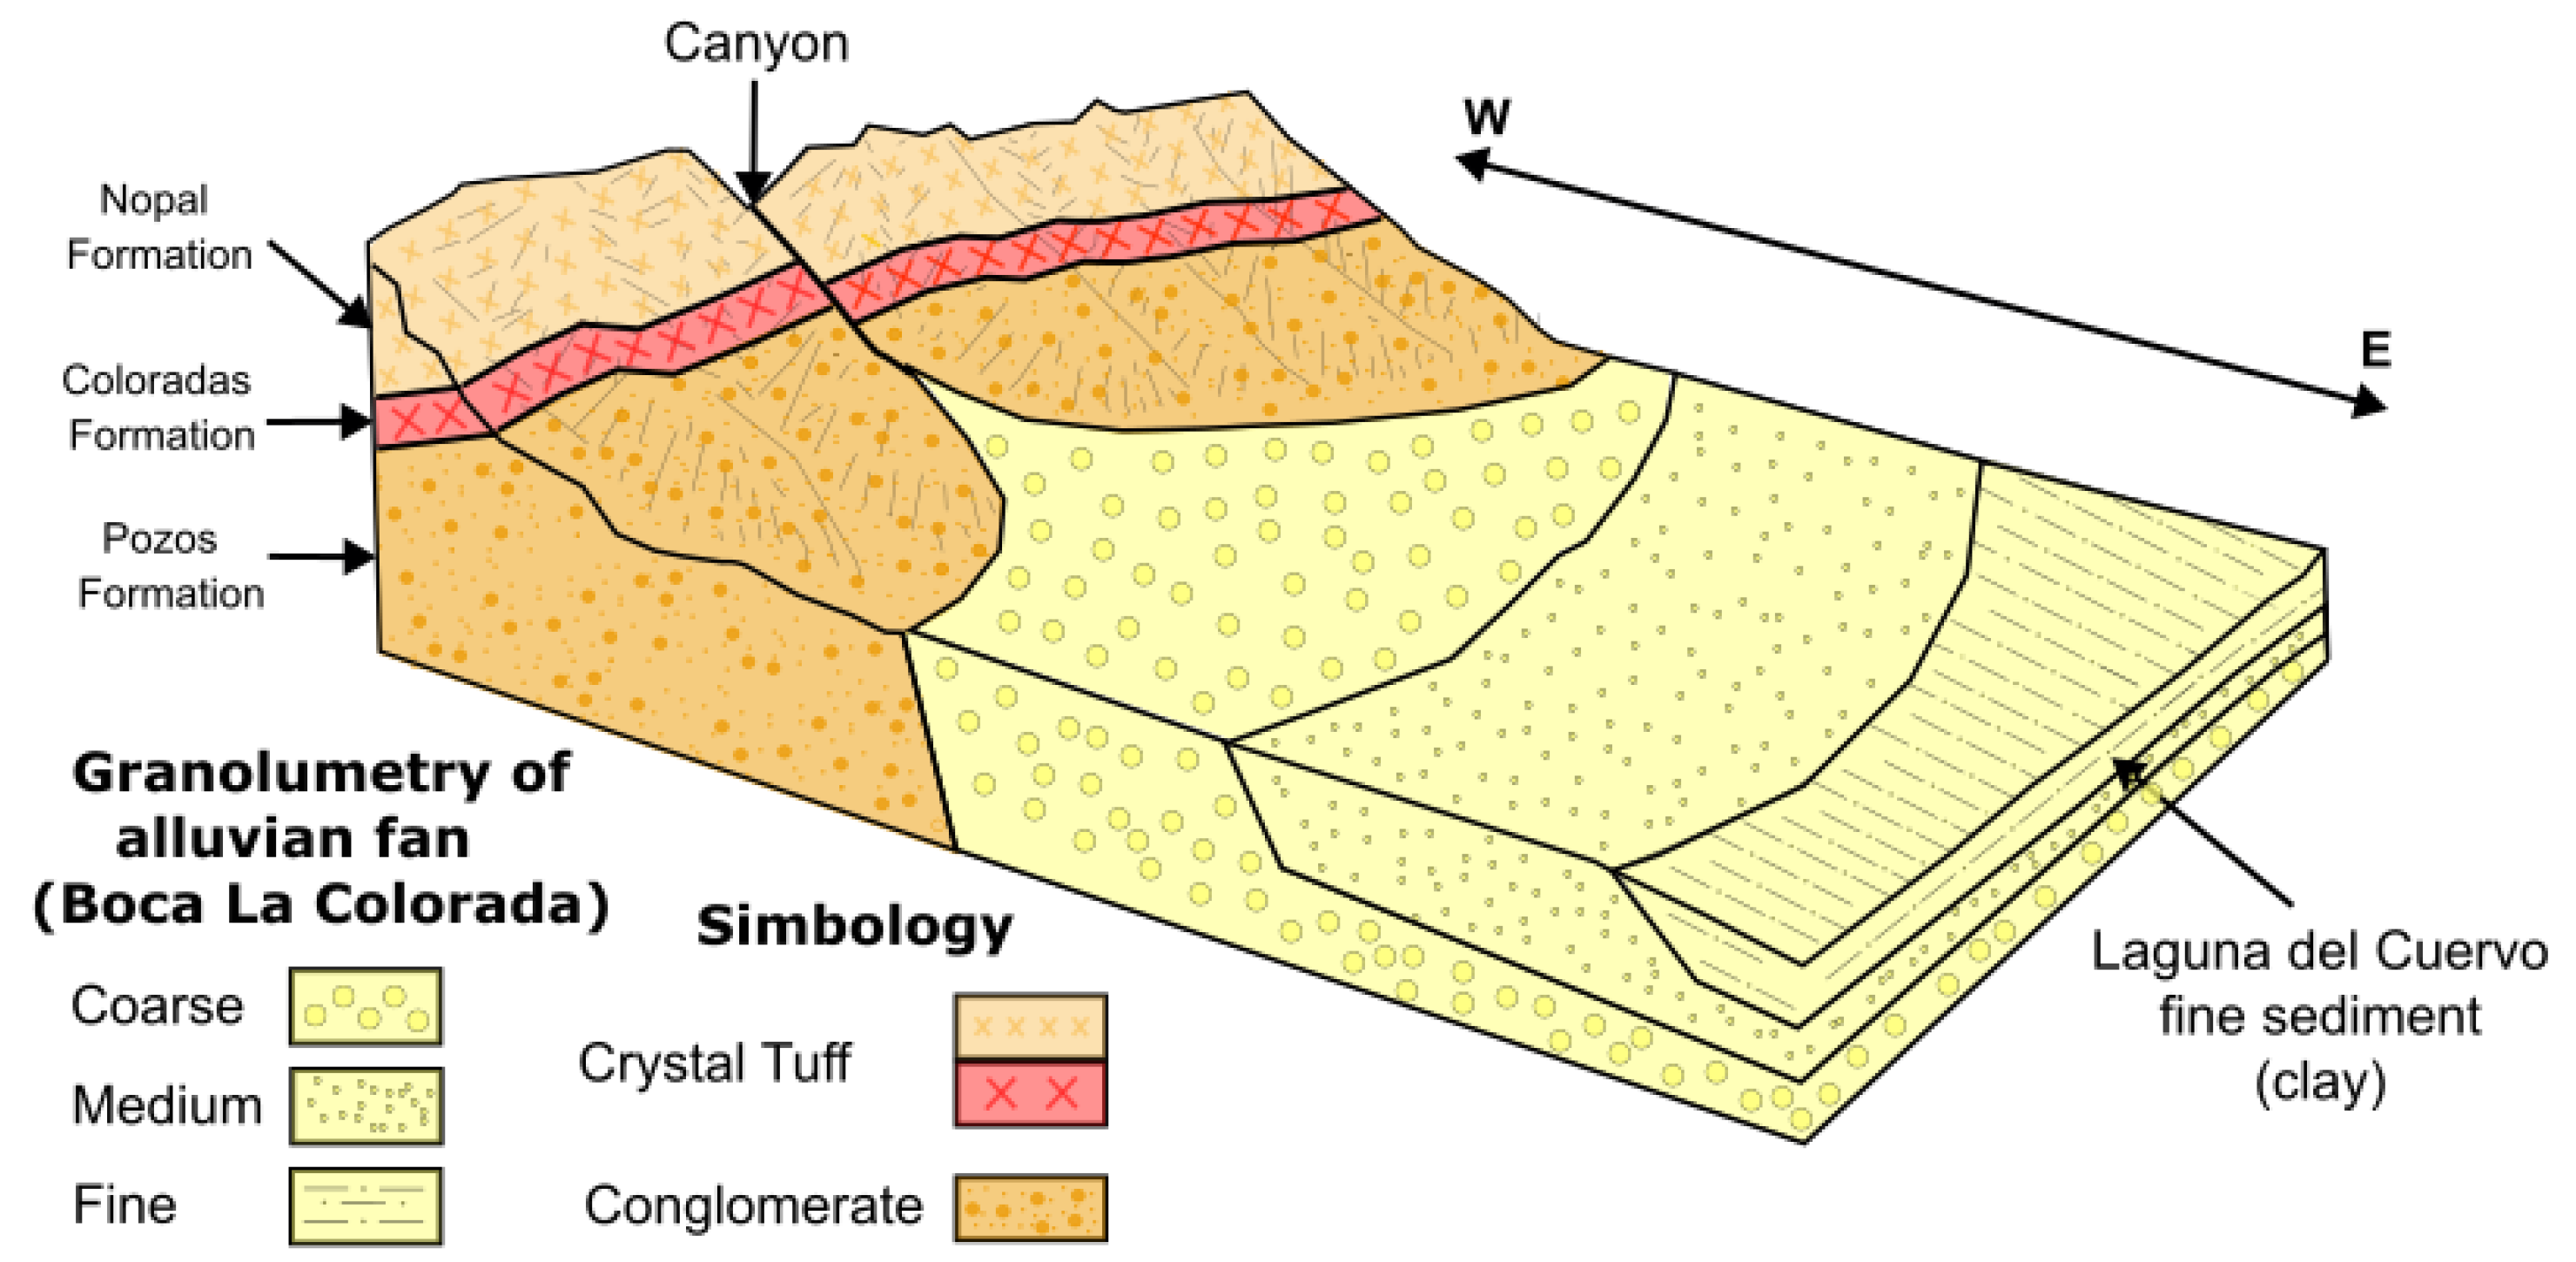
The Boca La Colorada stream, whose sediments are representative of the minerals and granulometry of the area, originates in the central part of the SPB and flows a few meters from the repository area. During its course, it travels around 9 km, flowing into the flood plain of Laguna del Cuervo as an alluvial fan. Boca La Colorada was chosen as one of the leading research targets. Along its course, the stream crosses the Mesa, Peña Blanca, Escuadra, and Nopal formations from west to east, with Nopal and Escuadra being where the highest concentrations of U have been described [33]. The distribution of the granulometry follows a normal behavior, in which the proportion of fine particles is found to a greater extent near the flood plain. In contrast, the coarsest material is found mainly in the Sierra’s high areas at the stream’s beginning (Figure 2).
In two wet mud samples and two dry mud samples collected in the floodplain during the rainy period of 2021, uranium concentrations were determined by liquid scintillation alpha spectrometry. At one point at the mouth of the stream, above the alluvial fan, the concentration of uranium in wet mud was 141 mgU kg−1 of sediment. The sampling point favored the presence of organic matter and the generation of a reduction zone. However, at points located 5, 8, and 12 km away in the lagoon, U concentrations of 4.05, 3.32, and 3.00 mgU kg−1 of sediment were obtained in the same order as that of the natural background of the area [34]. Silica-rich volcanic rocks such as those of Peña Blanca report U contents between 9 and 20 mg kg−1 [35]. Another critical point is that particles with high uranium content have been found in sediments near uranium sources (mines) [36].
The coexistence of anomalous and low concentrations in the flood plain leads to the need to know how uranium is transported from uranium minerals in the Peña Blanca area to Laguna del Cuervo and whether dissolution exists. To find answers to these questions, experimental simulations were carried out to evaluate the transport and adsorption of uranium by sediments from SPB to the floodplain–Laguna del Cuervo, taking the characteristic profile of the Boca La Colorada stream. It is suggested that uranium transport may be dissolved, which supports the hypothesis of U leaching by rainwater from the environmentally accessible uranium minerals. The alternative hypothesis is that the uranium ore does not dissolve but is transported to the floodplain in particulate material form, together with the sediments. To elucidate these hypotheses and to enhance the understanding, a simulation of U transport in solution was conducted, (i) a batch experiment was used to evaluate the ideal adsorption of uranyl nitrate by fine sediments; (ii) two columns fed by a high concentration solution of uranyl nitrate (UN) ions, simulating the adsorption by different particle sizes of the Peña Blanca sediments. The transport of U in particulate material was simulated using (iii) two columns with an upper horizon of uranium ore (URP) of the area, simulating the weathering of uranophane, the transport by several granulometries of the sediment, and the interaction of the transported U with silts and clays.
To interpret the experiments, uranium concentrations in effluent solutions and sediments were analyzed by alpha spectrometry with liquid scintillation counting (LSC) and microwave plasma atomic emission spectroscopy (MP-AES). Particle transport by the feed solution flow was assessed by X-ray tomography. XRD identified mineral phases. However, the uranium compounds in sediments in very low concentrations, as they are in adsorption on sediments, are below the detection limit for conventional techniques. A spectroscopy with a lower detection limit is XAFS, especially when measured in fluorescence mode [37]. XAFS is a synchrotron technique that provides a type of radial function of distances between a given atom of a chemical element, e.g., uranium, and neighboring atoms up to 6–8 Å. XAFS is used to analyze the amplitude modulation of the X-ray absorption coefficient at energies close to and above an X-ray absorption edge of the element in the sample [38]. All these techniques allow for precise quantification of uranium concentrations, even at low detection levels typically challenging for conventional techniques. Additionally, the investigation into the interactions between uranium, sediments, and varying particle sizes offers new insights into the environmental behavior of uranium in floodplain systems. This multifaceted approach not only elucidates the transport pathways of uranium from its mineral sources to sensitive ecosystems but also sets the groundwork for future studies aimed at addressing environmental contamination and managing uranium resources effectively.

2. Materials and Methods

The simulation aims to reproduce the conditions of uranium transport through surface waters in SPB. For this reason, adequate quantities of sediments from the area were collected, which would allow the sequence represented in Figure 2 to be reproduced in the cylindrical reactors. The simulation also includes uranium minerals of the majority composition, with high concentrations, and in the most representative state currently appearing in abandoned mines.

2.1. Sampling and Conditioning of Minerals and Sediments

Sampling involved collecting uranium ore and stream sediments. Uranium ore came from the Nopal I repository and mine, with samples rich in yellow dust for lab identification. Sediments were gathered along the Boca La Colorada stream: coarse sediments from the upper mountain, medium from the stream bed, and fine from the alluvial fan (Figure 1). Sampling followed regulations [39], using a 50 cm square frame, avoiding large stones, and collecting about 5 kg per sample in labeled polypropylene bags.
The sediments were classified by granulometry into coarse sand (CS), fine sand (FSD), silt (S), and clay (C), respectively [40]. Vibrational meshing was used at 15 min intervals, with mesh sizes of 4 (4.76 mm), 12 (1.68 mm), 70 (0.210 mm), 100 (0.149 mm), 200 (0.074 mm), and 400 (0.037 mm).

2.2. Elemental, Mineralogical, and Morphological Characterization

2.2.1. Scanning Electron Microscopy (SEM)

Digital images of secondary and backscattered electrons were obtained in a JEOL scanning electron microscope (JSM7401F, Tokyo, Japan) with an energy-dispersive X-ray detector (EDS) for the morphological and elemental characterization of the sediments. The materials were characterized by SEM before and after each experiment.

2.2.2. X-Ray Diffraction (XRD) and Elemental Characterization

The sediments were mineralogically analyzed by X-ray diffraction with a PANalytical® X’Pert-Pro diffractometer, Almelo, The Netherlands. The patterns that were obtained were analyzed using Data Collector® software version 7.2b. Cu Kα radiation was used (current 40 mA and voltage 40 kV). For the quantification of the mineral phases, the Rietveld method was used in the Fullprof_suite software, version 5.1 [41].
Cation determination of all samples was carried out in triplicate on an Agilent Technologies MP-AES spectrometer model 4210, Mulgrave, Australia, with a cyclonic spray chamber and a Meinhard nebulizer, using a main N2 flow of 20 L min−1 and an airflow of 25 L min−1.

2.3. Uranium Transport and Adsorption Experiments

2.3.1. Simulation of Ideal Adsorption by Fine Sediments

A batch experiment was performed to evaluate the ideal adsorption of uranyl compounds by fine sediments. The Langmuir model is valid for modeling monolayer adsorption onto a homogenous surface with constant adsorption energy; the Freundlich equation posits a heterogeneous surface and considers that molecules attached to a surface site will have an effect on the neighboring sites. Batch adsorption on FSC was evaluated using the Langmuir and Freundlich isotherm models to determine the adsorption mechanism that occurs between the sediment and different concentrations of UO2(NO3)2·6H2O in aqueous solution. Both mathematical models relate the uranium concentration in the solution and the adsorption capacity in the sediment when dynamic equilibrium is reached. U(VI) solutions (30, 60, 90, 120 mg L−1) were prepared from a stock solution of 253.2 mg L−1 in deionized water. FSC samples (0.3 g and 0.5 g) were placed in contact with 150 mL of the specified initial concentration of U(VI) solutions at room temperature (25 ± 2 °C) and a stirring speed of 90 rpm. The residual concentration of U(VI) was determined at different time intervals up to 48 h. To do this, the stirring was stopped for 15 min, 2 mL of aliquot was taken, passed through a 0.45 µm Whatman™ regenerated cellulose filter, 5.4 mL of Ultima Gold AB scintillating liquid was added, and U(VI) was read on the Triathler Hidex 425-034 detector, Turku, Finland. The experiments were performed at two different pH (5.0 and 7.0). pH = 5 is obtained by dissolving the uranyl nitrate salt with distilled water. On the other hand, to obtain pH = 7, 0.1 M NH4OH, (28–30%, J.T. Baker) was added to the UO2(NO3)2·6H2O solution.
The adsorption isotherm was fitted using the Langmuir [42]
Q e = Q m a x K L C e 1 + K L C e ,
and Freundlich models [42]
Q e = K F C e 1 n
where Qe (mg kg−1) is the equilibrium adsorption capacity, Ce (mg L−1) is the equilibrium residual concentration of (UO2)2+ in solution, and Qmax (mg kg−1) represents the maximum adsorption capacity; KL (L mg−1) is the Langmuir equilibrium adsorption constant showing the adsorption affinity; KF (L kg−1) is the Freundlich distribution coefficient and n is the correction factor indicating the degree of nonlinearity between solution concentration and adsorption.
SEM-EDAX (morphology and elemental composition) and XRD (mineral phases) were used to determine the chemical properties of the sediment surface before and after U(VI) adsorption.

2.3.2. Simulation of Uranium Transport in the SPB Profile

Column Design for Simulation

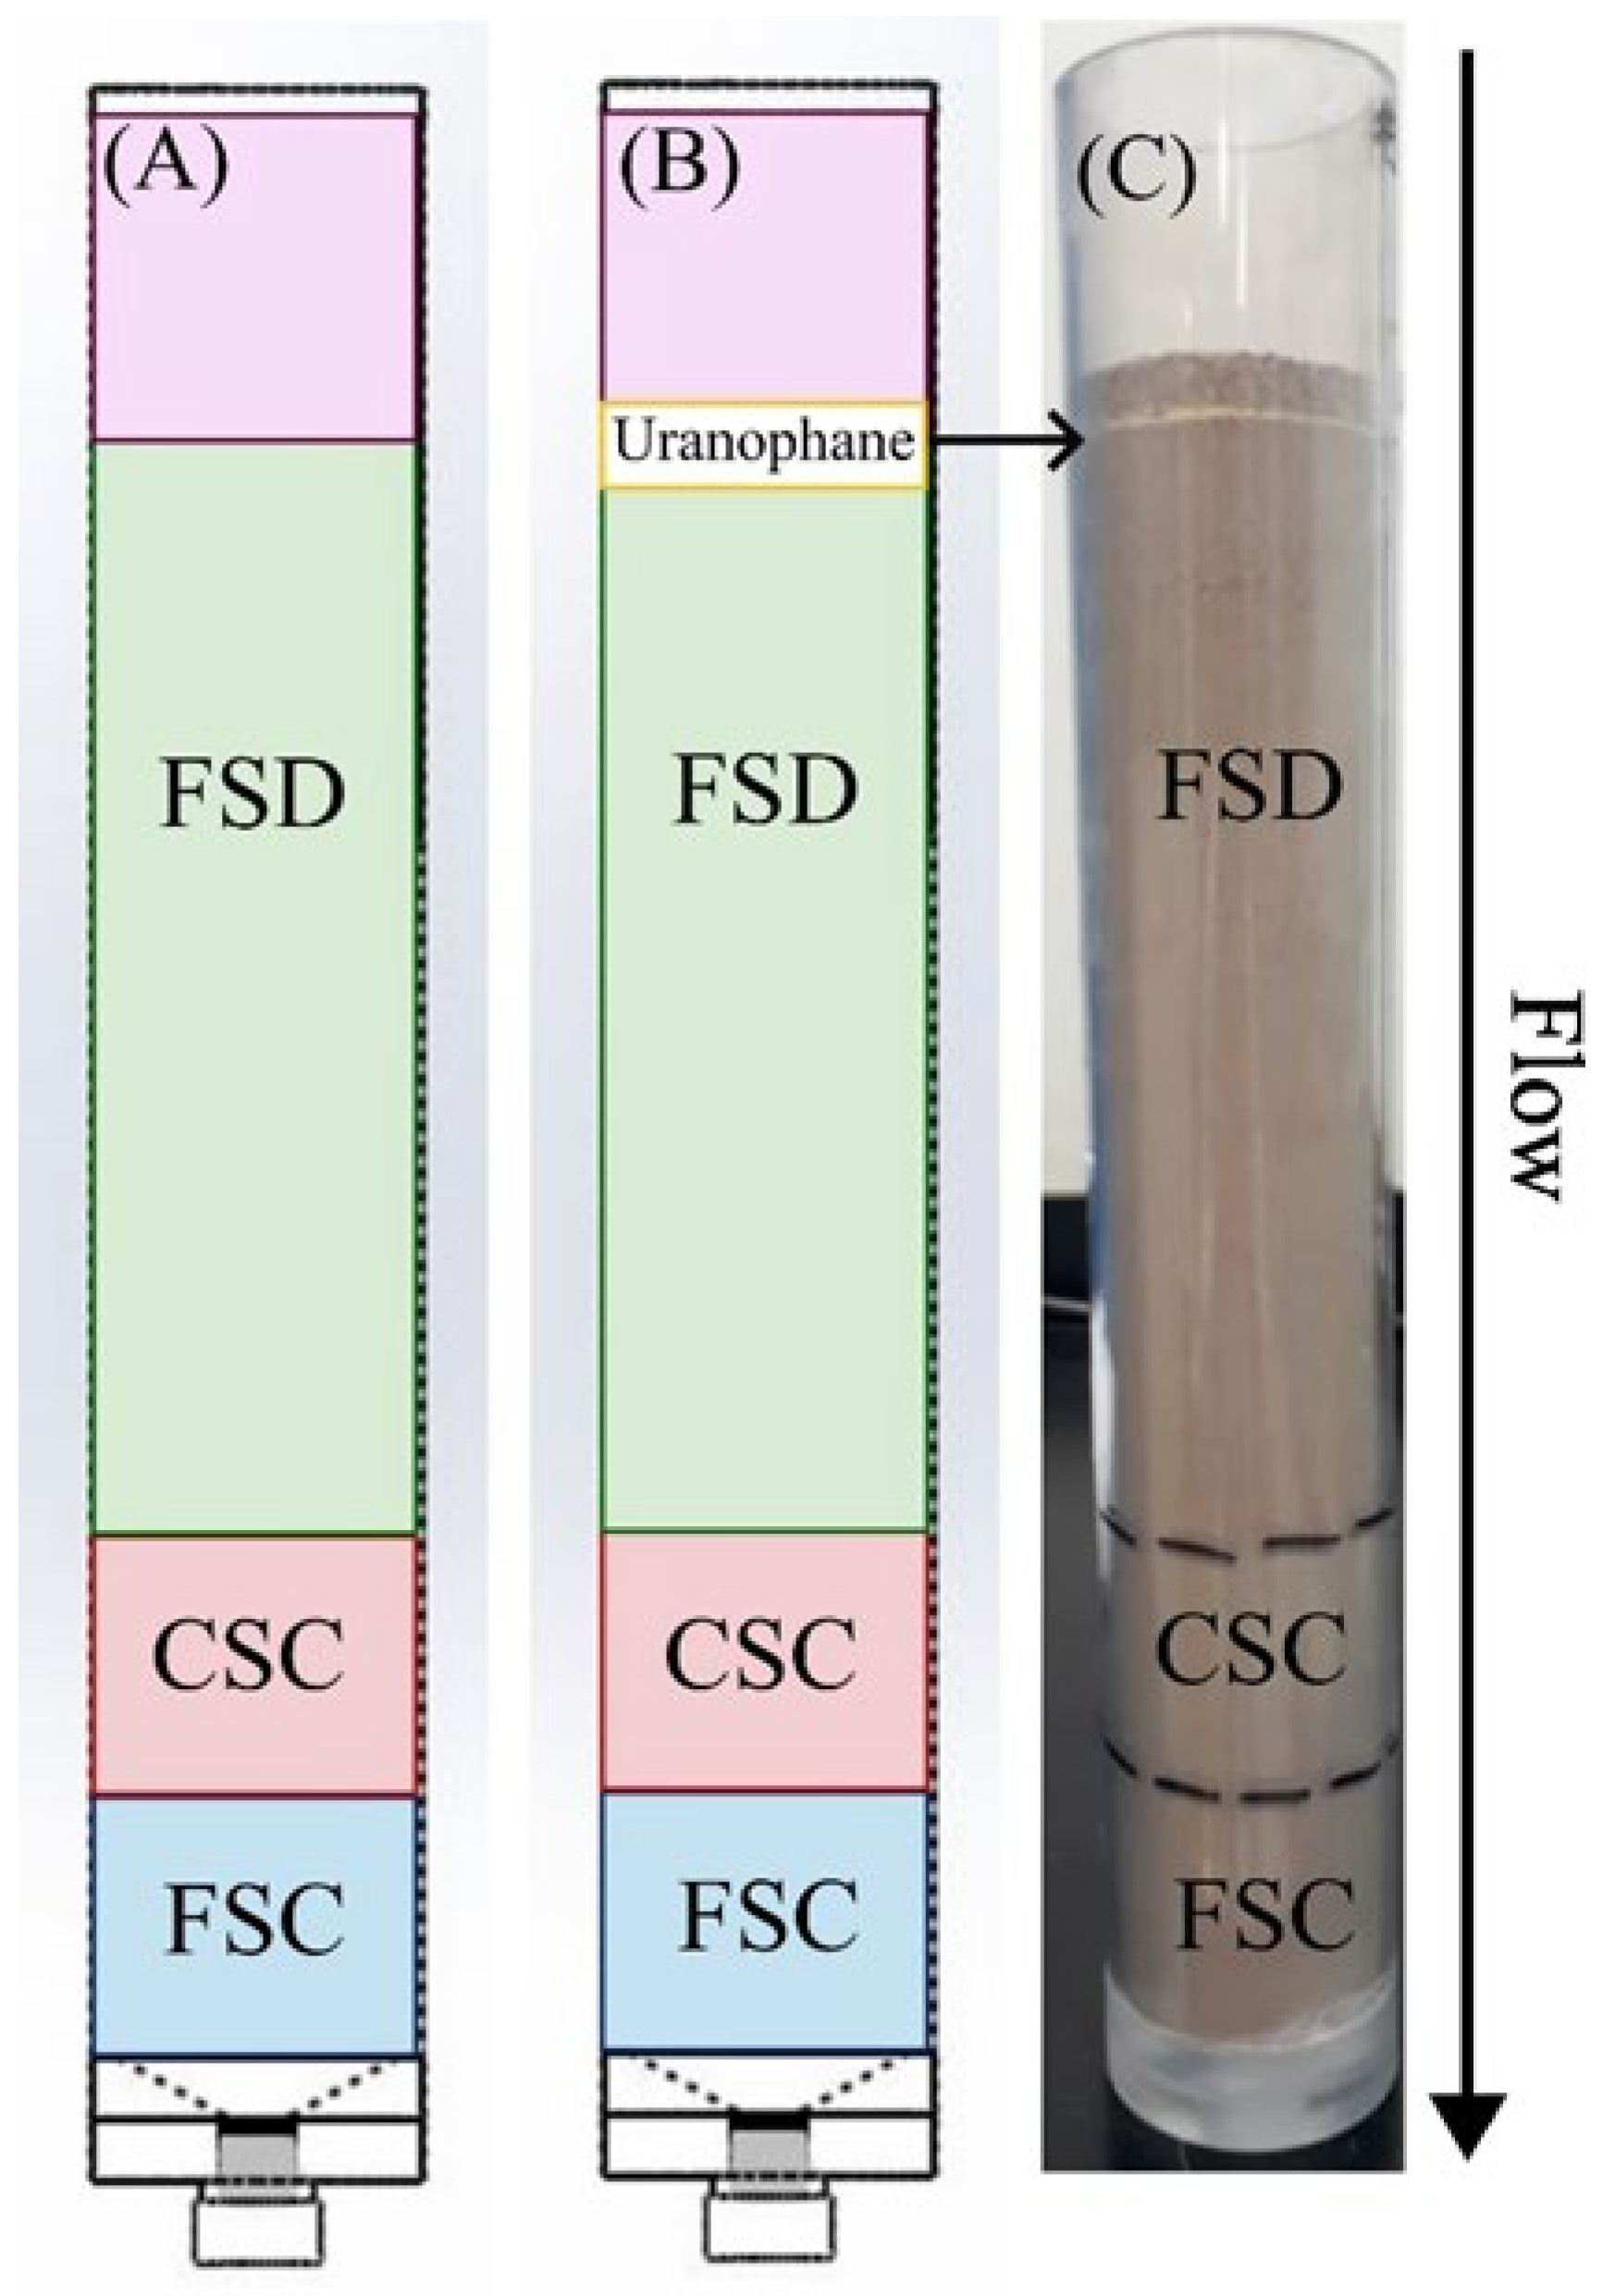
Polymeric methyl methacrylate columns measuring 30 cm long by 5 cm in external diameter were designed to simulate the transport of U by the sediments in the profile. A threaded plug at the bottom controlled the exit of the effluent liquid from each treatment. A two μm glass fiber filter disc was placed at the bottom of the columns to prevent material leakage, followed by a glass fiber wool support.
The columns were packed in a top-down sequence, corresponding to the granulometric fractions of the sediments upstream to the floodplain-Laguna Cuervo previously described (Section Sierra Peña Blanca, Deserts and Streams and Figure 2) in the proportions obtained by [31]: 65% Fine sand (FSD), 17% Coarse silt + clay (CSC), and 18% Fine silt + clay (FSC). In the columns to simulate the transport of uranium ore, a uranophane horizon was placed between the FSD segment and an upper layer of coarse sand as a filter (Figure 3).

Implementation of the Experiment

A control column was implemented, into which distilled water was poured with a retention time of one month. A total of 4 columns were prepared, with two columns for each test with the variants shown in Table 1.
Carrier U(VI) solutions with 569 mgU L−1 UO2(NO3)2 6H2O in deionized water were prepared. To simulate intermittent rains, carrier solutions were administered in each experiment with a peristaltic pump (Cole-Parmer Masterflex L/S model 07557-04, Vernon Hills, IL, USA) with a rate of 2.4 mL min−1. The equilibrium solutions in the laboratory environment have a pH of 5, similar to rainwater. To saturate the pores of each column, they were fed with distilled water for 11 days. The experiments were fed with 100 mL of solution, and the feeding was closed after 100 h. Feeding with the carrier solution for the 6 month retention time experiments was performed sequentially for 21 day cycles during the first four months and every 14 days in the last two months. For the 12 month experiment, feeding was regular in 21 day cycles. Samples from each column were collected in one aliquot after every cycle to be analyzed by liquid scintillation spectrometry (LSC) and microwave plasma atomic emission (MP-AES).

Characterization of Packed Columns

Upon completion of fluid feeding in the four experiments, UN6, URP6, UN12, and URP12, the columns were sectioned into segments according to Figure 3 and stored at −18 °C until uranium isotope analysis. Uranium concentrations were determined in the sedimentary fractions of the lower segments since the objective was to estimate the transport of uranium toward the flood plain. In the case of the URP6 and URP12 experiments, before sectioning into segments, 1 cm diameter cylindrical “cores” were extracted along the entire length of the column to be analyzed by X-ray tomography.
It should be noted that in elemental uranium, the isotopic abundance of 238U is much higher than that of 234U: 234U—0.0054%; 235U—0.7204% and 238U—99.2742%; 234U half-life = 2.455 × 10⁵ y; 235U half-life = 7.04 × 10⁸ y and 238U half-life = 4.468 × 10⁹ y [43].The adsorption experiments were performed with depleted uranium; therefore, the 234U contents contribute practically no mass to the adsorbate.
Table 2 presents the identification of each sample obtained. The CSC and FSC fractions from each experiment were separated into coarse silt, fine silt, and clay, and the procedure for calculation of pore volume (see Appendix A).

Uranium Determination

To quantify U in sediments, 0.5 g was taken and calcined at 600 °C for 24 h. The calcined sample was transferred to a PTFE beaker, and 1 g of 232U standard (concentration activity = 0.1148 ± 0.0008 Bq mL−1; Eurostandard, Prague, Czech Republic, 2021) was added as a tracer. An open-system acid digestion was performed. HF (40%, J.T. Baker), aqua regia (HNO3 and HCl, 1:3, 66.5% and 37.1%, J.T. Baker, respectively), and HClO4 (69.6%, J.T. Baker) were used [44].
When extracting the effluents from the solutions, the volumes obtained were noted and then completed in graduated cylinders up to 100 mL, then passed through a cellulose filter with a pore size of 25 µm and acidified with 5 M HNO3 (66.5%, J.T. Baker) until reaching pH 2. These samples were previously added with 232U standard as a tracer, under conditions similar to those described above.
The previously traced and digested sediments from the URP6 and URP12 columns and the traced effluents from URP6 and URP12 were subjected to extraction. Liquid scintillation (LSC) was used to determine the concentrations of 234U and 238U. For this purpose, 1.5 mL of the URAEX® scintillating cocktail from ETRAX was used [45], which together with the dissolved sample, was transferred to a glass vial and subjected to manual shaking to proceed with the liquid–liquid extraction of the U. It was left to rest for separation. The organic phase was extracted with a pipette and deposited in a culture tube. This liquid was bubbled with an argon flow with a toluene trap [45]. The repeatability and 10% uncertainties of the procedure for sediments were tested in [46]. Subsequently, for the quantification of isotopic uranium by liquid scintillation alpha spectrometry (LSC), they were introduced into the PERALS ORDELA Model OP-312 spectrometer. The spectrum measurement was carried out using the Canberra Multiport II analyzer and Genie 2000 software version 3.2.1, to record the spectra.
For the determination of total uranium in uranyl nitrate solutions, the effluents from experiments UN6 and UN12 were previously added to 100 mL and filtered; a 1.5 mL aliquot was taken, and Ultima Gold AB scintillating liquid was added in 7 mL borosilicate vials and measured by LSC on the Triathler Hidex type 425-034 spectrometer, Turku, Finland [47].

X-Ray Tomography

To determine the spatial distribution of uranophane relative to the solution flow in the column and to the sediments extracted in the URP6 and URP12 cores (see Section Characterization of Packed Columns), X-ray tomography was performed on the Nikon® XT H 225 tomograph, Nikon Corporation, Tokyo, Japan, with a 0.1 mm copper filter (current 78 µA and voltage 93 kV). X-ray tomography, both industrial and synchrotron, is widely used for the 3D characterization of natural porous media, and the results of particle and pore distribution resulting from fluid transport [48].
Data was collected using Inspect-X software version XT4.4.4, and volume generation was performed using CTPro 3D software version 3.1. The density of the uranium ore in the CT scans was calibrated to the uranophane ore used in these experiments (Appendix B.3, Figure B8).
Photographs were taken with short-wave UV light (254 nm) using a Spectroline lamp model ENF-240C New York, NY, USA, and pictures with visible light from the laboratory.

X-Ray Absorption Fine Structure (XAFS)

XAFS analysis has frequently been applied to analyze uranium in the environment [11,12,14,49,50,51,52] since it allows the local environment of U to be characterized, including its speciation and interatomic distances. This information will enable the identification of the mineral species of U present in the samples, as well as the nature of the adsorption of the uranyl ion in the sediments.
The XAFS measurement consists of obtaining the absorption coefficient as a function of the energy of the X-rays, µ(E). XAFS is an interference effect between photoelectron waves emitted upon absorption of X-rays and waves reflected by neighboring atoms. In the region of near-edge X-ray absorption spectroscopy (XANES), high resolution is employed to determine the incident energy on the sample. In the region of extended X-ray absorption fine structure (EXAFS), the energy dependence of the coefficient µ(E) is transformed into the function µ(k) of the wavenumber k of the absorbed X-ray beam. Mathematical procedures are applied to the experimental µ(k) function to identify the fingerprints of the short-range structure from the EXAFS spectra for comparison with experimental and theoretical model compounds.
For measurement of XAFS, sediment samples were prepared on cellulose discs of 6 mm diameter. The measurements were performed at beamline I20-scanning of the Diamond Light Source, Didcot, UK, in fluorescence mode with individual scans resultants of averaging 11 channels of a Ge fluorescence detector in a cryostat at liquid nitrogen temperature, with Si (111) double crystal monochromator. The energy was calibrated by measuring the K-edge of a Yttrium sheet [53]. Similarly, a measurement of a β-uranophane from the Peña Blanca sample was carried out [54] as a model compound of XAFS at beamline B18 of the Diamond Light Source, UK [55].
To identify the component species in the study samples through the normalized µ(E) spectrum, the linear combination analysis of the model spectra measurements under similar conditions in pure substances can be applied. Alternatively, theoretical spectra can be fitted from the structure of these substances. In the latter case, after obtaining the experimental µ(k) function, it is “amplified” by normalizing it to a unit absorption χ(k) and multiplying it by k3. The Fourier transform is applied to this weighted function k3χ(k), and |χ(R)| is obtained. The |χ(R)| reveals the characteristics of the absorption coefficient as a function of the distance, or radial distribution, between the X-ray-absorbing uranium atom and the atoms of neighboring elements.
The normalized absorption signal was obtained through the usual data reduction analysis using the program IFEFFIT 2.2. The XAFS spectra were processed using the Demeter suite of programs (Athena and Artemis) [56]. A linear combination analysis (LCA) and principal component analysis were performed with the standards of uranophane, uraninite [57], and boltwoodite [58].

3. Results

The concentration of uranium in the CSC and FSC fractions before performing the batch and transport experiments was 65 Bq kg−1 for each isotope 234−238U [31], equivalent to approximately 5.3 mg kg−1. The estimated pore volume for the UN columns was 189 cm3, while for the URP columns, it was 175 cm3.

3.1. Sediment Characterization for Batch and Transport Experiments

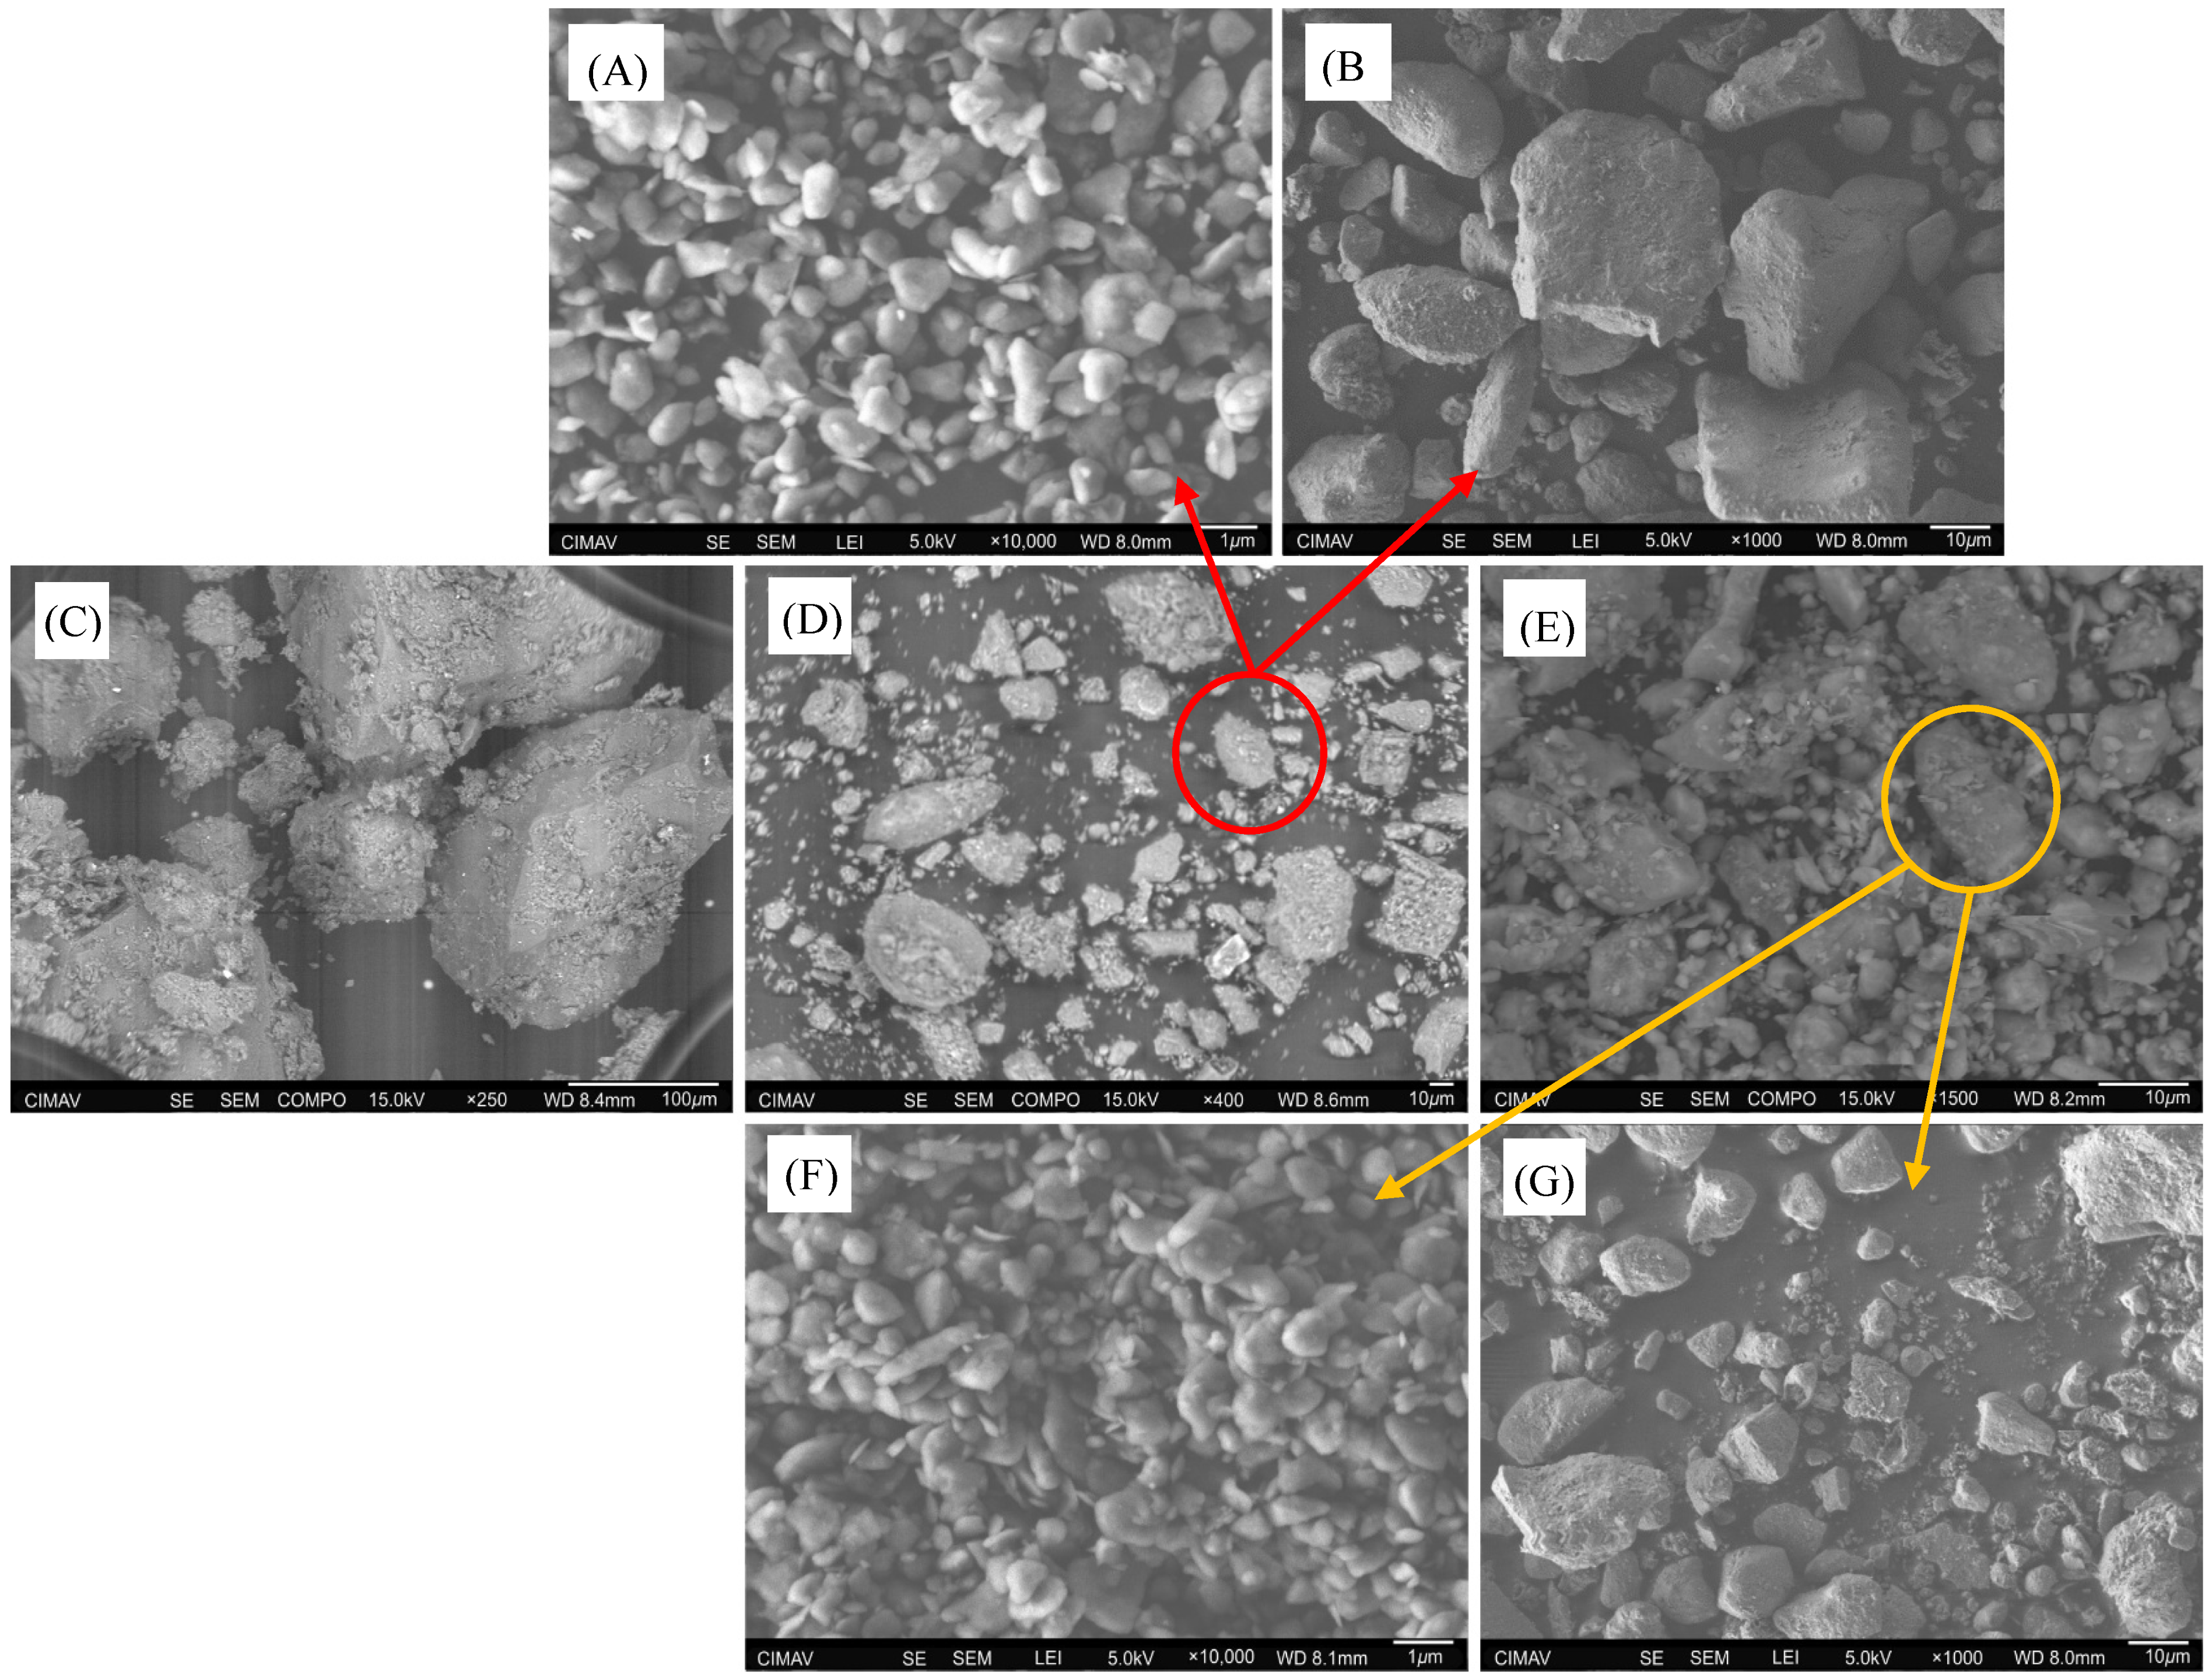
Figure 4 illustrates the microscopic morphology of the studied sediments. Figure 4C–E corresponds to the materials used to fill the columns, with average particle sizes of 100 µm for fine sand, 50 µm for CS, and 30 µm for FSC, showing subhedral and subangular grains. After the URP6 experiment, the fine fractions C1 and C2 (Figure 4A,F) reveal homogeneous, well-classified clays with grains ≤1 µm, subrounded and lenticular in shape. CS grains (50–30 µm) and FS grains (<30 µm) are subhedral and rough, likely due to clay particles that were not fully separated, matching the mineral phases observed in XRD analysis.
XRD indicates the presence of the mineral phases quartz, calcite, feldspars (albite, anorthite, sanidine), montmorillonite, kaolinite, and hematite. Table 3 shows the quantification of the sediments by the Rietveld method and the uranium mineral, which corresponds mostly to uranophane. The diffraction patterns of the sediments are presented in Appendix B, in Figure B1.
In the diffraction patterns of silt and clay, the correspondence between the different intensities in the peaks associated with the various contents of feldspars, kaolinite, and quartz for the samples in Table 3 is observed. The mineral phases in the sediments agree with the composition of the rocks and the mineral phases observed macroscopically in the SPB [19,59].
The initial cation concentrations of the CSC fraction were Na: 10 mg kg−1, K: 2675 mg kg−1, Mg: 2961 mg kg−1, Ca: 4828 mg kg−1, respectively. The values of the FSC fraction were Na: 32 mg kg−1, K: 6269 mg kg−1, Mg: 7055 mg kg−1, Ca: 10,224 mg kg−1. These values agreed with the crystalline phases reported in XRD. Ref. [59] describes the mineralogical composition of the Nopal and Escuadra formations, which includes potassium feldspars. The cation concentrations at the end of the UN and URP experiments presented average values of Na: 19 mg kg−1, K: 4683 mg kg−1, Mg: 5513 mg kg−1, Ca: 8519 mg kg−1 in the CSC fraction; and values of Na: 19 mg kg−1, K: 4394 mg kg−1, Mg: 5659 mg kg−1, Ca: 8420 mg kg−1 in the FSC fraction (see Appendix B, Table B1).

3.2. Modeling Adsorption from Uranium in Solution

3.2.1. BATCH Experiment

In the experiment performed at pH = 5, the adsorption capacities of the sediments increased rapidly as the concentration of U(VI) was increased in the solution. The fitted graph for the Langmuir and Freundlich isotherm models is presented in Figure 5A, while the parameters corresponding to each isotherm are reported in Table 4. The Langmuir adsorption model is based on several key assumptions: (a) the surface is homogeneous, (b) there’s a specific number of adsorption sites, leading to saturation when all are occupied, (c) the heat of adsorption remains constant regardless of surface coverage, and (d) all sites are equivalent, with energy unaffected by other molecules. However, a limitation of this model is its assumption of uniform heat of adsorption and monolayer formation on a homogeneous surface. Most surfaces are heterogeneous, with multiple adsorption sites that lead to variations in adsorption energy [60].
The Langmuir model’s correlation factor R2 > 0.90 was observed, while the Freundlich model’s R2 < 0.6. Therefore, it was concluded that the adsorption of U(VI) from the uranyl nitrate solution at pH = 5 was well described by the Langmuir model. In the case of the experiment carried out at pH = 7, an erratic behavior of the adsorption capacities of the sediments was obtained as the concentration of U(VI) in the solution increased. It was then deduced that other mechanisms must be predominating over the surface adsorption phenomenon. The uranium concentration values of the experiment at pH = 7 were attempted to be fitted with the Langmuir and Freundlich isotherm models; the parameters corresponding to each isotherm are shown in Table 4. The fitting quality parameters are very low and are shown in italics. The null fit of both isotherm models corroborates that uranium at neutral pH is being removed from the aqueous solution by other mechanisms. What can be established is that at pH = 5, there was greater removal of U(VI) with Qe values ~ 40 × 103 mg kg−1, while for adsorption at pH = 7, values of Qe barely exceeded 30 × 103 mg kg−1. The Langmuir model predicts a maximum Q value of 44.8 × 10³ mg kg−1 for adsorption at pH = 5 (see Table 4).
The phase composition of the sediments is shown in Table 3. In the batch adsorption of U(VI) on feldspars, a dependence on pH has been reported in the range 5 to 7, where the maximum removal is reached, while the presence of dissolved CO2(g) promotes the precipitation of uranium above pH = 7 [61]. In general, the adsorption of U(VI) in sediments containing a significant amount of clays occurs through two pathways: by cation exchange and by strong adhesion at the edges of the oxides in the minerals, forming surface complexes with ionizable hydroxyl groups [62]. The cation exchange process is favored at low pH and ionic strength by the formation of an external sphere complex between uranium and the surface with fixed charges. On the other hand, at neutral pH and high ionic strength, forming internal spheres at the edges and amorphous surfaces of clays with uranium causes the deposition of surface complexes to be the predominant sorption process. Isotherm models do not consider the precipitation phenomenon since the nucleation kinetics of solid phases are considered to be very slow; hence, it is preferred to establish semi-empirical models of surface complex formation as a function of the chemical conditions of the water [63].
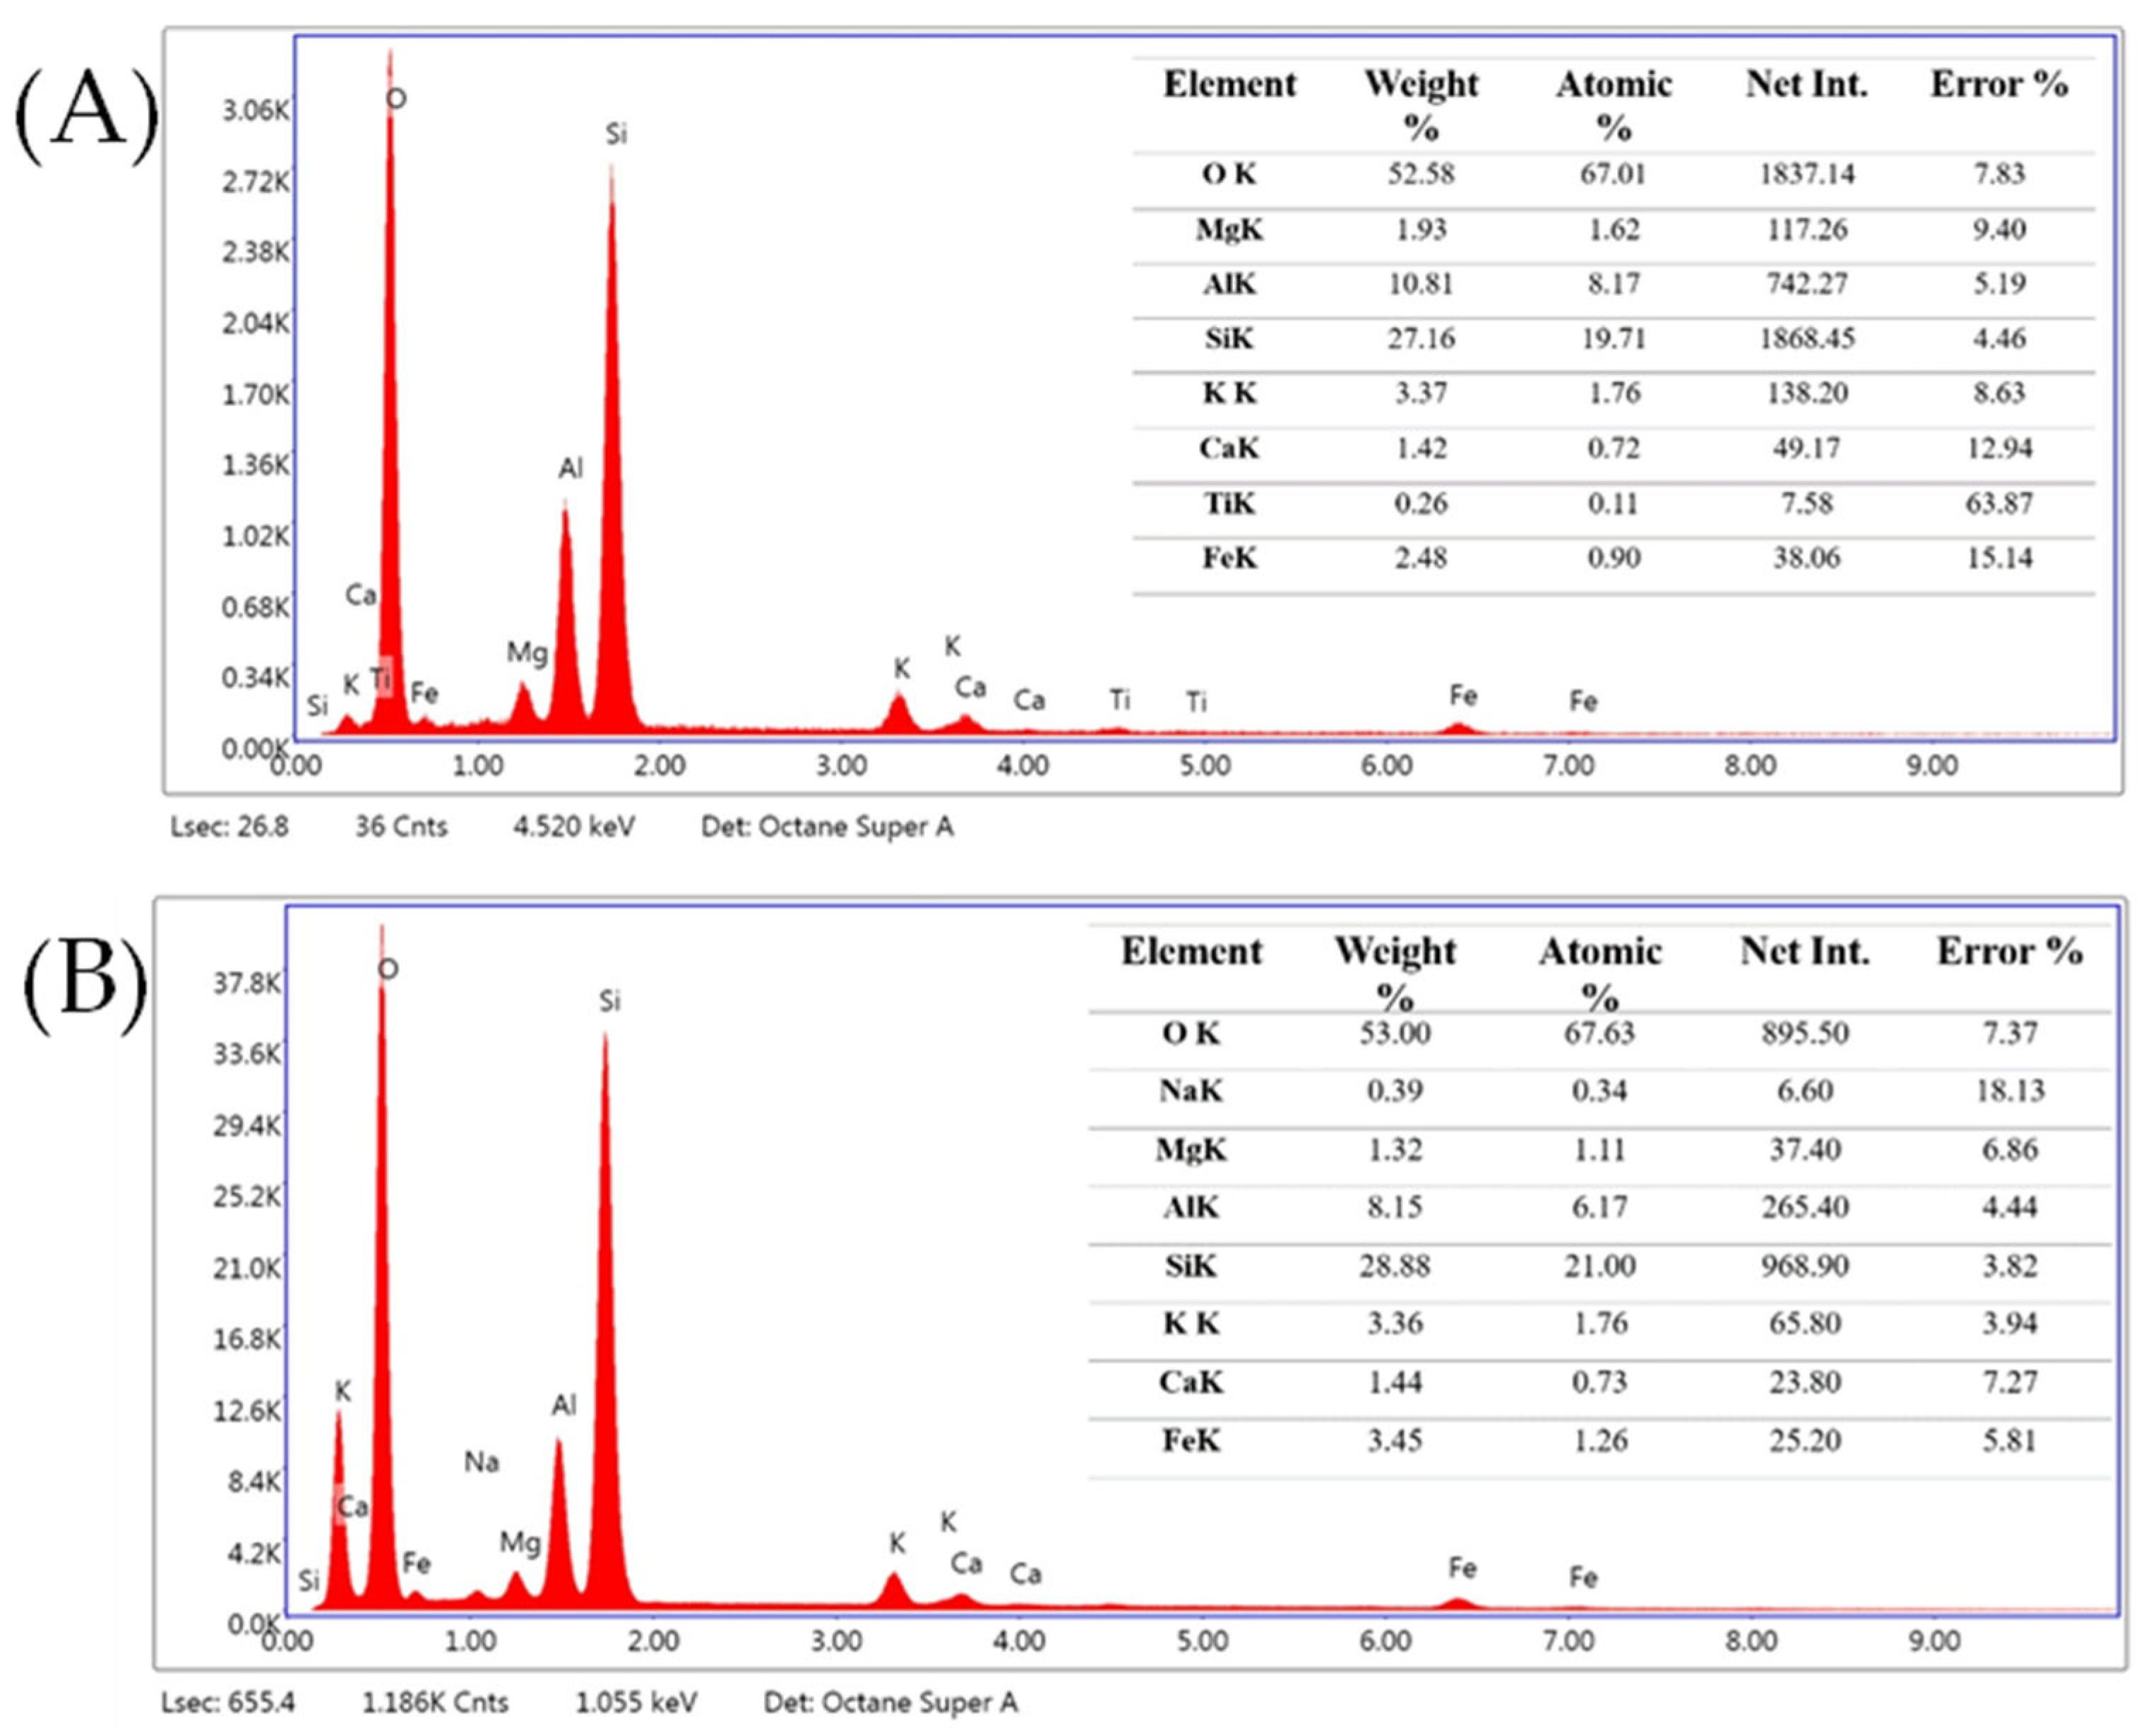
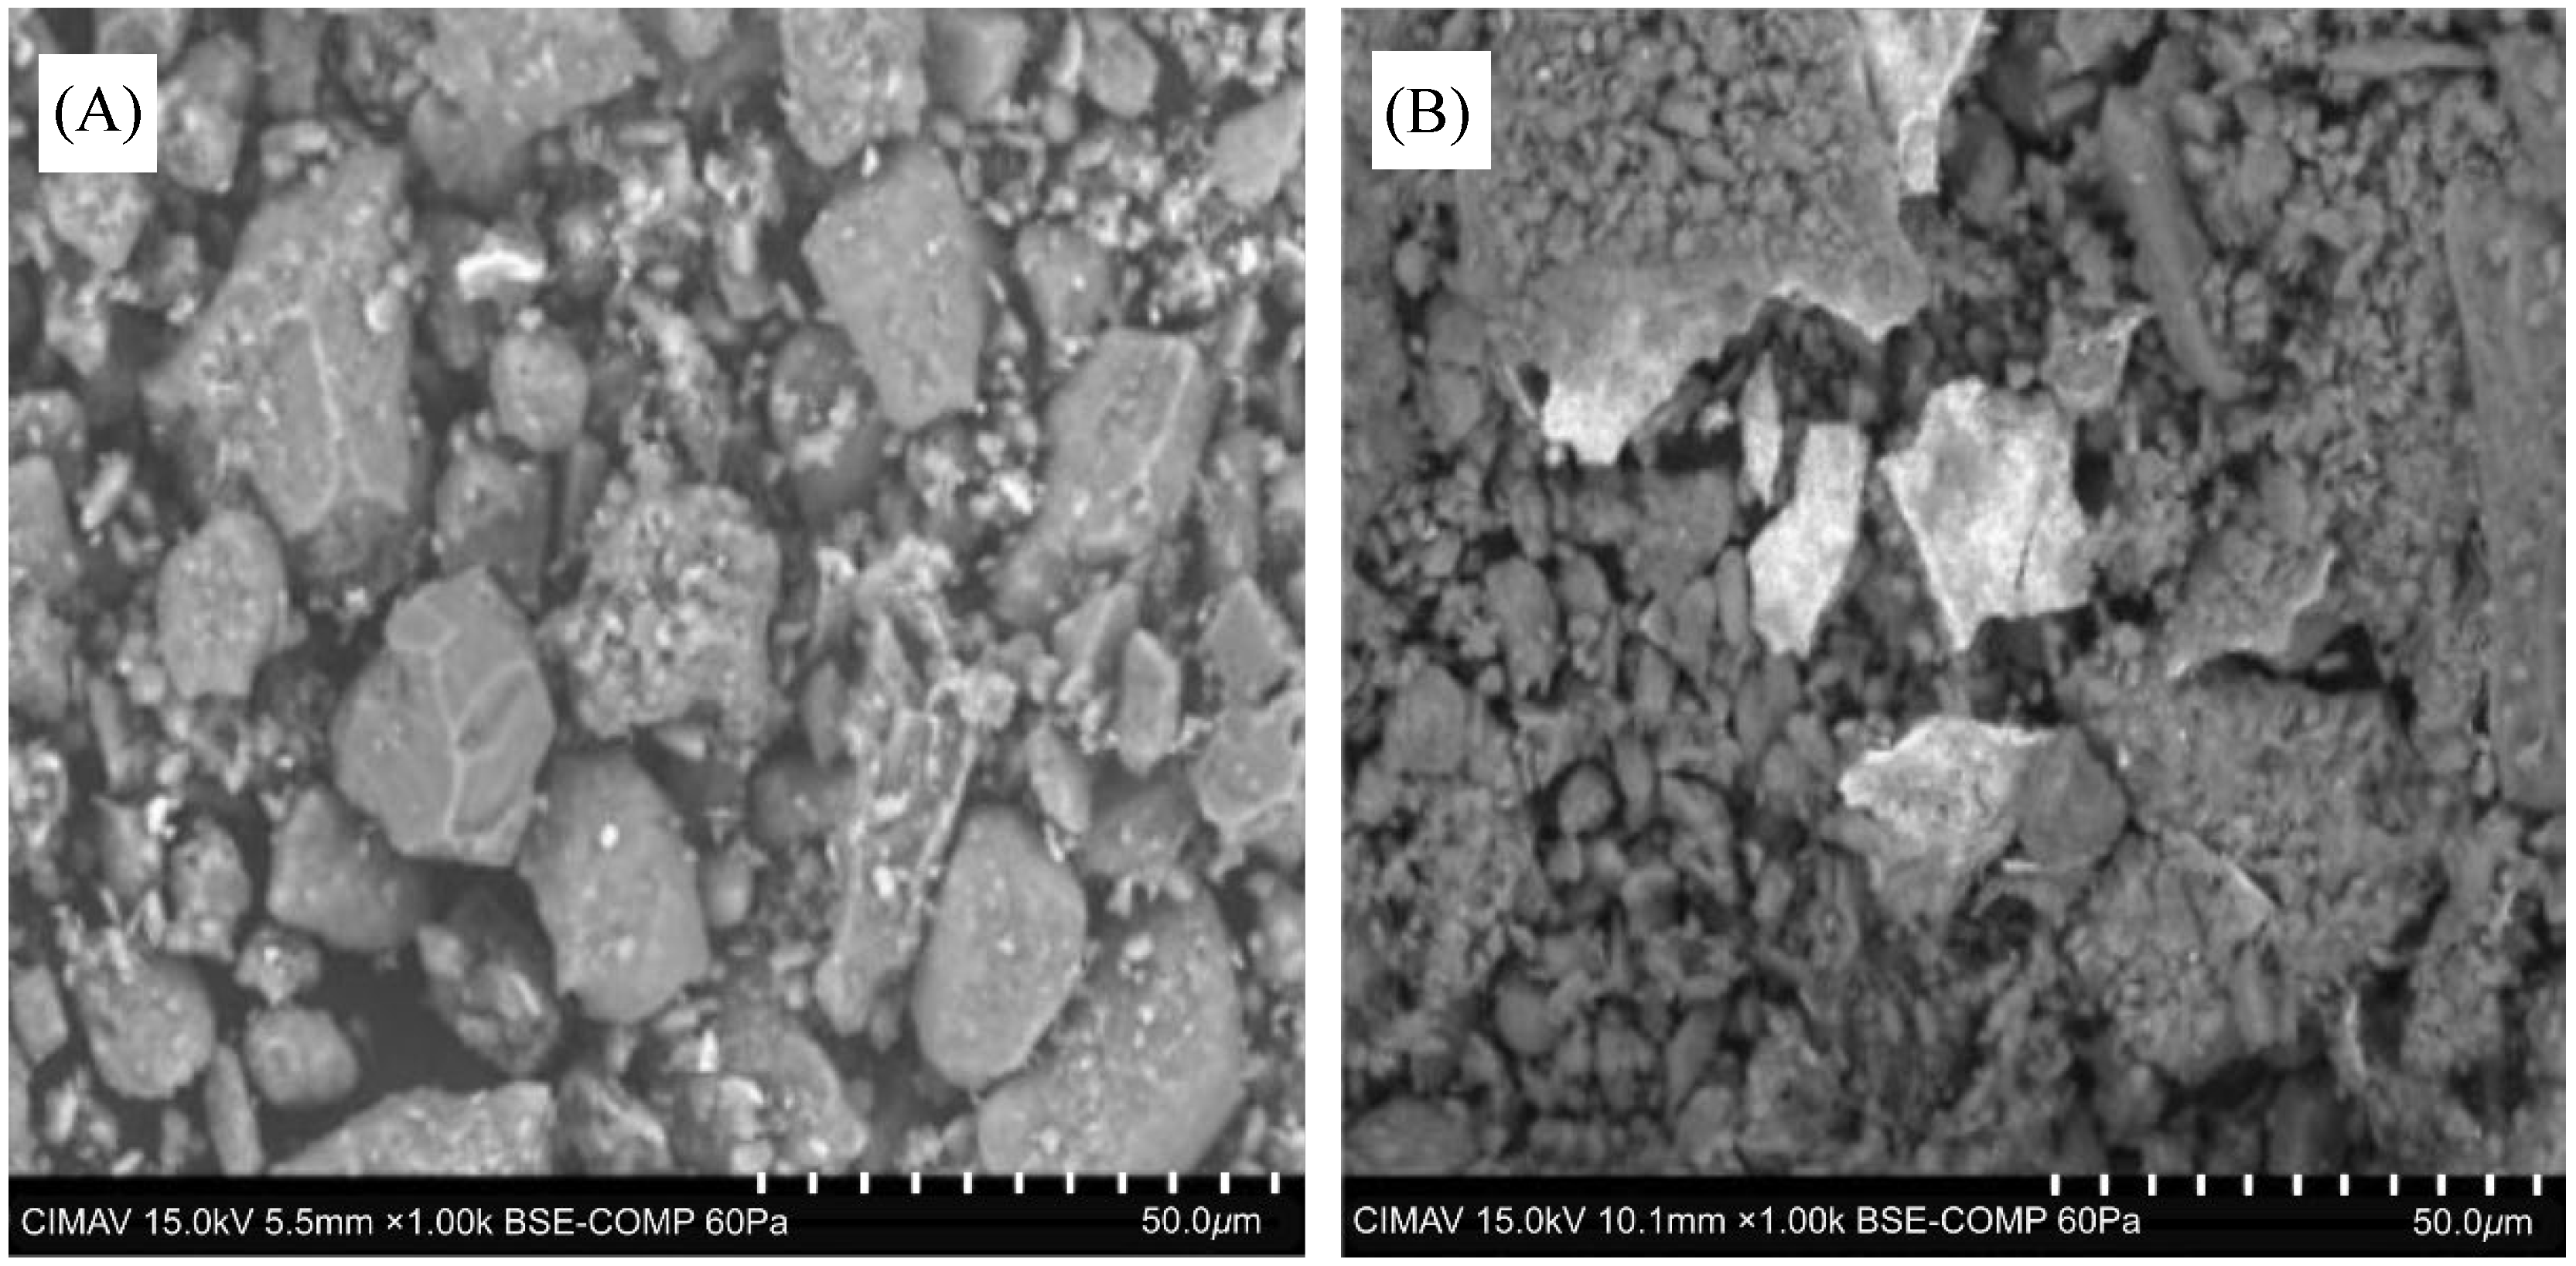
The sediments were analyzed by SEM–EDS after the corresponding batch adsorption experiments. The micrographs are shown in Figure B3 for pH = 5 and in Figure B4 for the removal of U(VI) at pH = 7 (Appendix B.2). It can be observed that U(VI) is homogeneously distributed throughout the sediment, although there is a predominant accumulation of U(VI) in certain particles. Figure 6A shows a micrograph obtained by backscattered electrons in SEM for sediments after U(VI) adsorption at pH = 5, while Figure 6B shows the SEM micrograph by backscattered electrons at pH = 7. The brightest areas corresponded to a high uranium content, and it is plausible that in the adsorption at pH = 7, there was uranium precipitation, which explains why the Langmuir and Freundlich adsorption models did not have a good fit with the uranium removal data in the prepared solutions. The results of the EXAFS analysis corresponding to the C2 clay type from the experiment at pH = 7 are presented in Appendix B.2, Table B3. These analyses suggest that the precipitated compound is similar to uranyl nitrate.

3.2.2. Transport Modeling with Uranium UN Solutions

Table 5 presents the results of uranium concentrations in the sediments of the lower segments of UN6 and supernatant solutions. The concentration values of Na, K, Mg, Ca, cations are shown in Appendix B.1, Table B2, and uranium in the effluent solution are shown in Appendix B.4, Table B4 from samples 1 to 5. Taken as a whole, the UN6 column was fed with 0.540 L of solution, carrying 307 mgU as uranyl. The transported uranyl replaced the pore water and was adsorbed by the sediments at the three levels of the column. The effluent solution showed negligible concentrations of uranium (Table B4); 6.39 mgU was adsorbed on the UN6CSC segment and 1.06 mgU was adsorbed on the UN6FSC segment. Overall, 2.42% of the uranyl was adsorbed in the lower segments of the column.
The concentration values of the effluent solution samples of WUN6 show practically only the displacement of pore water. In other words, the U in the solution was adsorbed by the fine sediment as it passed through the column, which was in agreement with the values of the U concentrations in the CS and FSC samples. The filter and fiberglass that support the packed material can be absorbing uranium; however, as the study’s goal is to examine sediment adsorption, no measurements were conducted on this material.
Table 6 presents the results of U concentrations in the sediments of the lower segments of UN12; WUN12 concentration values in the effluent solution are shown in Appendix B.4, Table B5 from samples 1 to 12, and cation concentration are in Appendix B.1, Table B2. The UN12 column was fed with 1.020 L of solution, carrying 580 mgU as uranyl. The effluent solution also showed negligible concentrations of uranium. A total of 14.35 mgU was adsorbed on the UN12CSC segment, and 9.46 mgU was adsorbed on the UN12FSC segment. Overall, 4.09% of the uranyl was adsorbed in the lower segments of the column.
Considering the initial concentration of the input solution of 569 mgU kg−1, the concentration values of the effluent solution samples from WUN12 are generally very low, similar to those of the UN6 experiment (see Table B4 and Table B5). The concentration values obtained by the two methods are of the same order of magnitude, up to the effluent WUN12_9. After pore water displacement, the concentrations of the WUN12_10 to WUN12_12 experiments better agree with each other and are in the order of 2 mgU kg−1. Considering the use of deionized water for the solutions, the appearance of significant concentration values of Na, Ca, K, and Mg cations in effluent solutions (Table B2) can be interpreted as desorption of these cations from the silt and clay sites, giving rise to the adsorption of uranium on these substrates. On the other hand, the concentrations of the solid samples show high U adsorptions, up to the equivalent of 303 mgU kg−1 sediment. It can be deduced that adsorption is observed from the first six months (experiment UN6), and the adsorption capacity of the fine fractions was not exhausted during the 12 months of experiment UN12 if it also considers that ideal adsorption reaches up to two orders of magnitude higher (see Section 3.2.1). According to the results of the batch experiment, adsorption is manifested on the clays.
The concentration range of U of samples WUN6CSC, WUN6FSC, WUN12CSC, and WUN12FSC is 0.014–0.72 mg L−1. These values are attributed to a desorption process of U during the separation experiment of the silt and clay fractions (Section 2.3.2).

3.2.3. Transport Modeling in URP Columns

Table 7 shows the U concentrations of the URP6 sediments. WURP6 samples show increasing U concentrations for longer times of the experiment, suggesting possible displacement of uranophane U along the column (see Appendix B, Table B6, from samples 2 to 6). Cation concentrations are shown in Appendix B.1, Table B2. The concentrations of the solid samples URP6CSC and URP6FSC are much higher than those of the original sediments (see Section 3.1).
U concentrations in URP12 sediments are presented in Table 8. The effluents from the WURP12 column showed U concentrations below the detection limit. Cation concentrations are shown in Appendix B.1, Table B2.
The concentration values of U in WURP6 and the U in solid samples of URP6 can be explained by the entrainment of uranium in the form of uranophane ore particles or dissolved, entrained along the column. However, uranium concentrations in the water of the URP12 experiment are not detected, and the values in the sediments are much lower than those of URP6. In the URP12 experiment, organic matter was formed at the top (see Appendix B.3, Figure B7). U in (UO2)2+ could be reduced and precipitated [64]. U concentrations in URP12 sediments were attributed to U being transported in particulate form (see below). The CS and FSC materials acted as a filter and trapped the uranophane particles that managed to pass through the fine sand.
Samples WURP6CSC, WURP6FSC, WURP12CSC, and WURP12FSC have U concentrations between 0.03 and 0.1 mg L−1. Because the differences in U concentration between the solutions of the WURP6 and WURP12 fractions are insignificant, it is difficult to elucidate whether a desorption process occurred. However, if the presence of URP12 organic matter is considered, the U concentrations in WURP12CSC and WURP12FSC can be attributed to uranophane particles transported to the CSC and FSC segments.
To elucidate whether U transport occurs in particulate or dissolved form, the sediments of the CS, FS, C1, and C2 fractions were observed by SEM-EDS (see Appendix B.3, Figure B5 and Figure B6). The obtained spectra did not reveal the presence of uranium, indicating that its concentration is below the detection limit.

Tomography of URP6 and URP12 Column Profiles

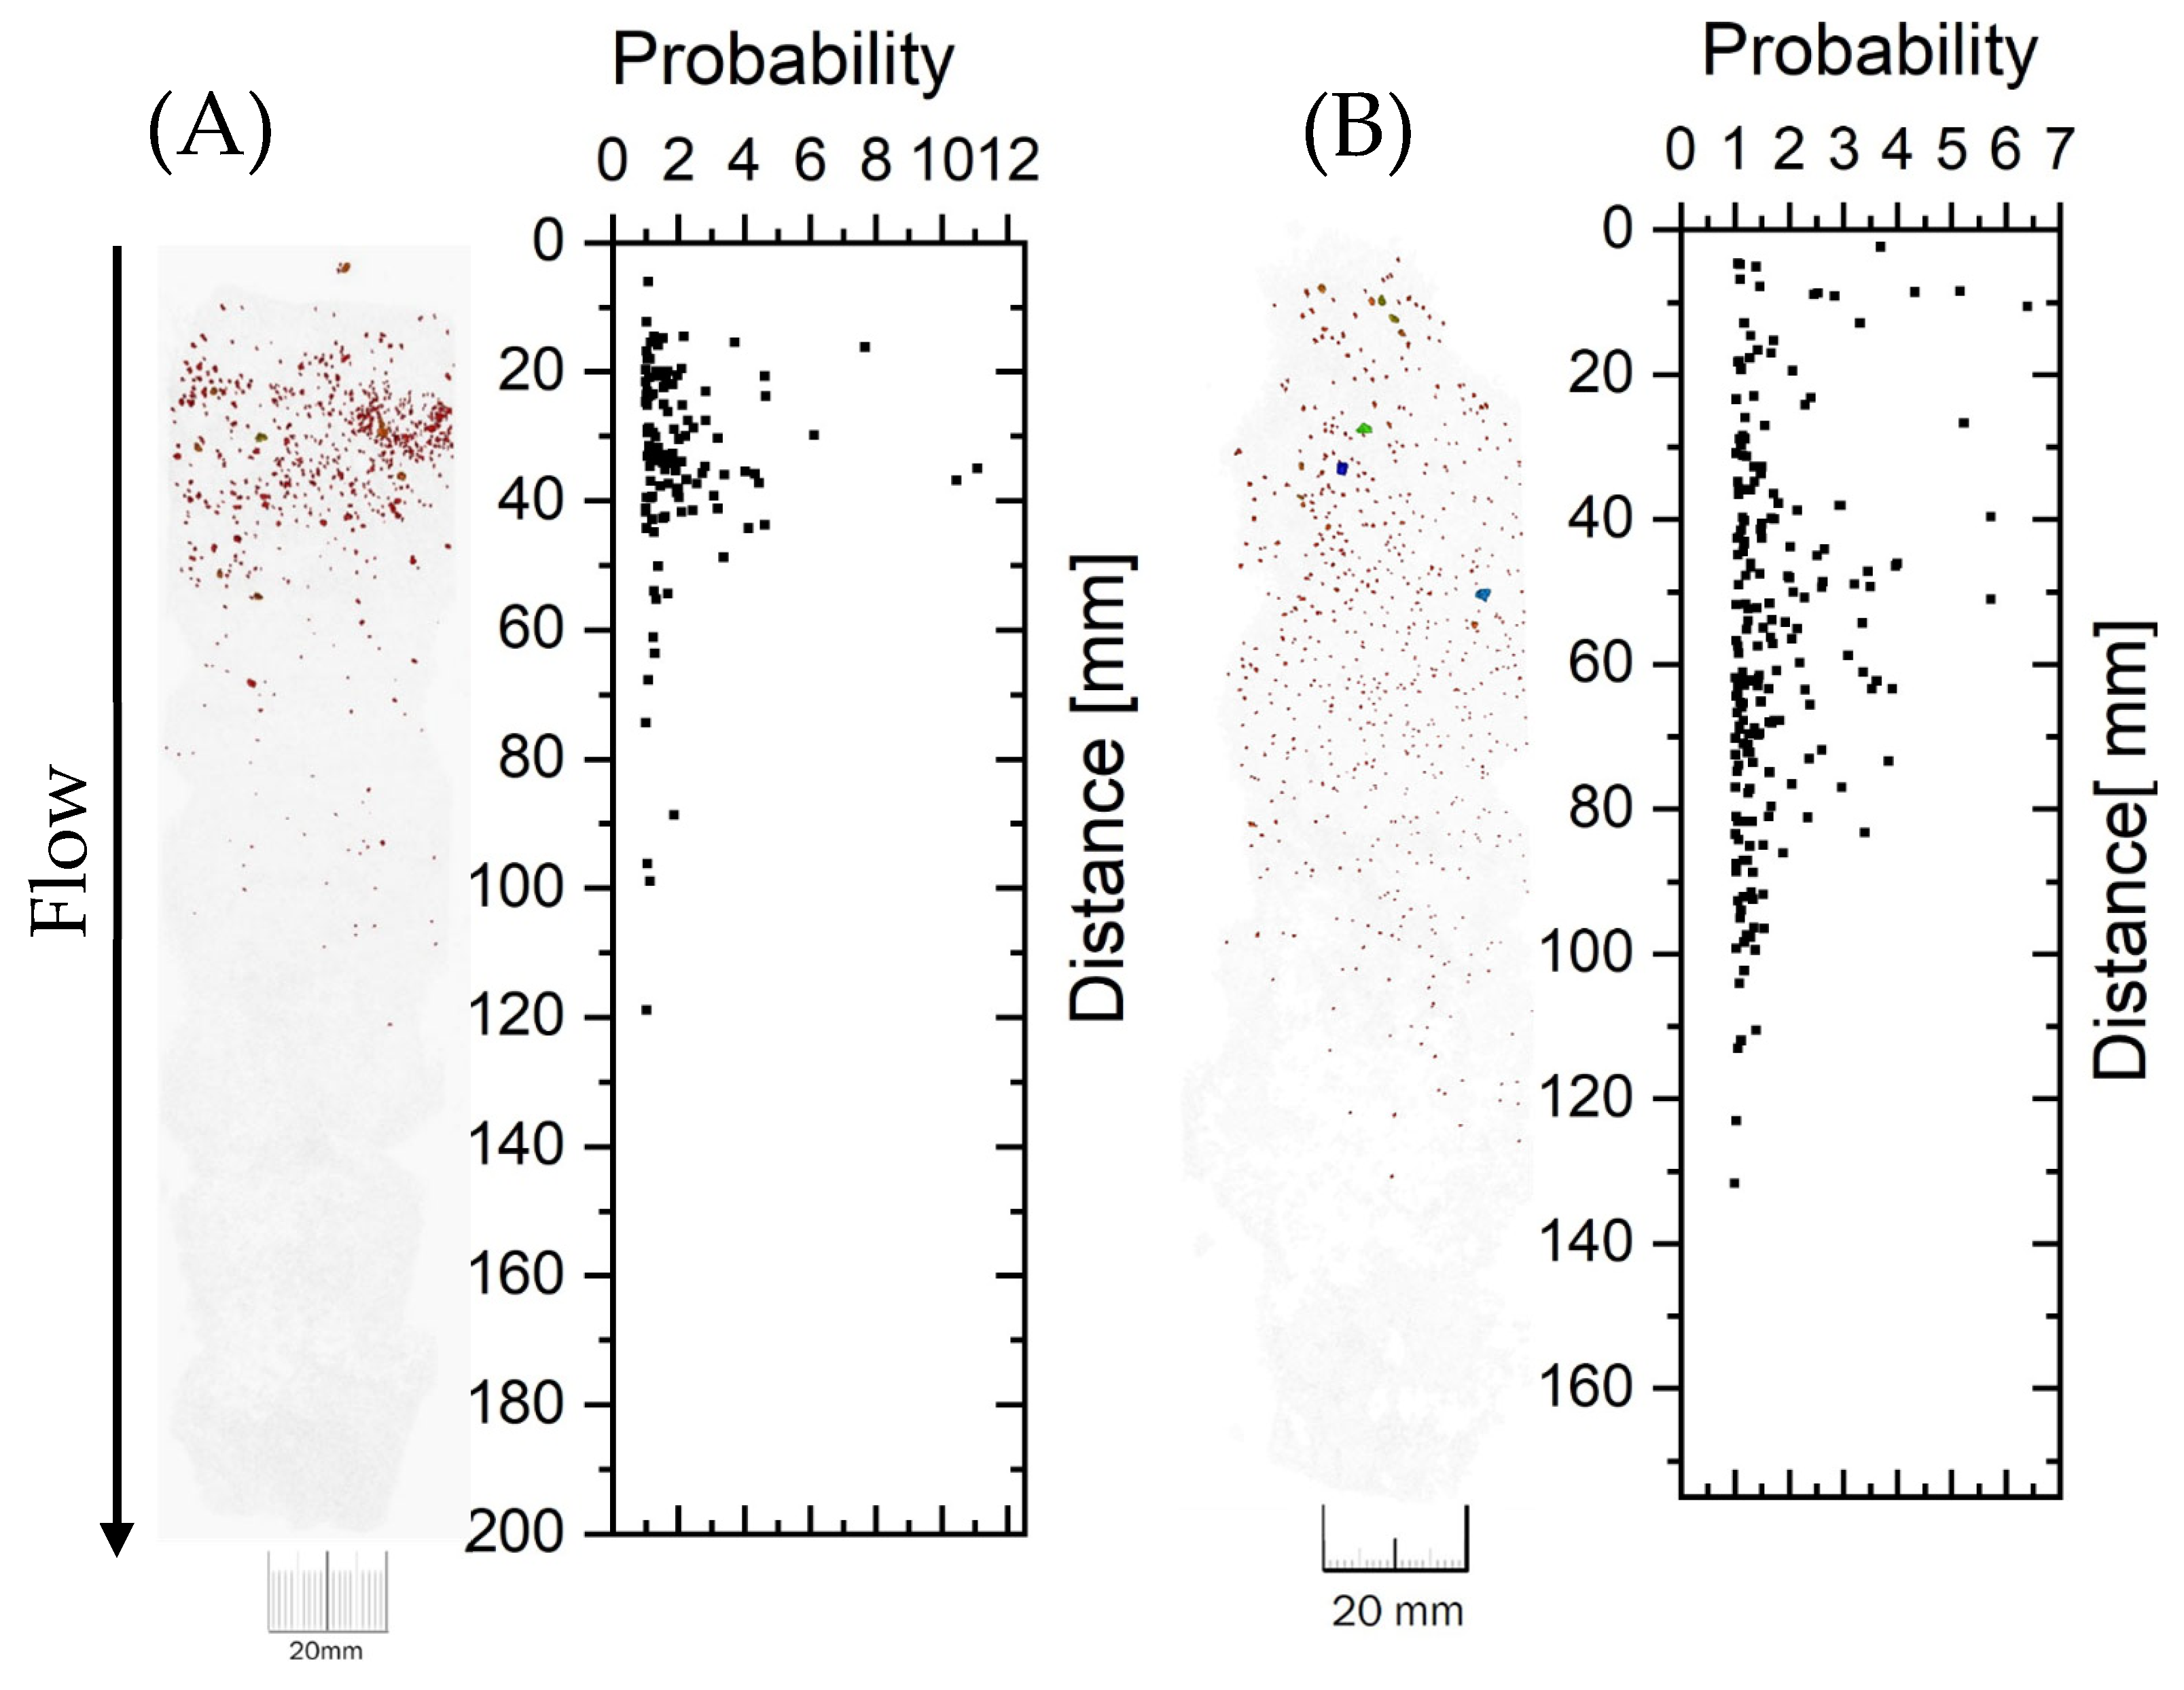
The spatial distribution of uranophane concerning the solution flow in the column was observed in the images of the sediments extracted by the URP6 and URP12 cores. Typical silt and clay compaction was observed by separating each column’s FSD, CSC, and FSC segments. For this reason, computer tomography scans of the spaces in the two lower segments were not obtained. Figure 7A,B show the tomographic images of the URP6FSD and URP12FSD segments. The tomography presents the quantitative results by density difference.
The FSD tomography of URP6 shows a high density of uranophane horizon particles at the top and the beginning of particle movement, presumably dragged by the solution flow. The FSD tomography of URP12 shows the rearrangement of the grains to the lower part of the segment towards the contact with CSC. The tomography probability graph suggests the drag of the finest uranophane particles transported toward the CSC. This result explains the higher U concentration values of CSC compared to FSC

XAFS

To explain the origin of high concentrations of uranium in fine sediment segments, XAFS was performed to identify the mineral components. The XANES spectra, in the case of the U-L3 edge, allow us to differentiate the exact energy of the edge in the spectrum μ(E), and thus to distinguish whether the species is U(IV) or U(VI).
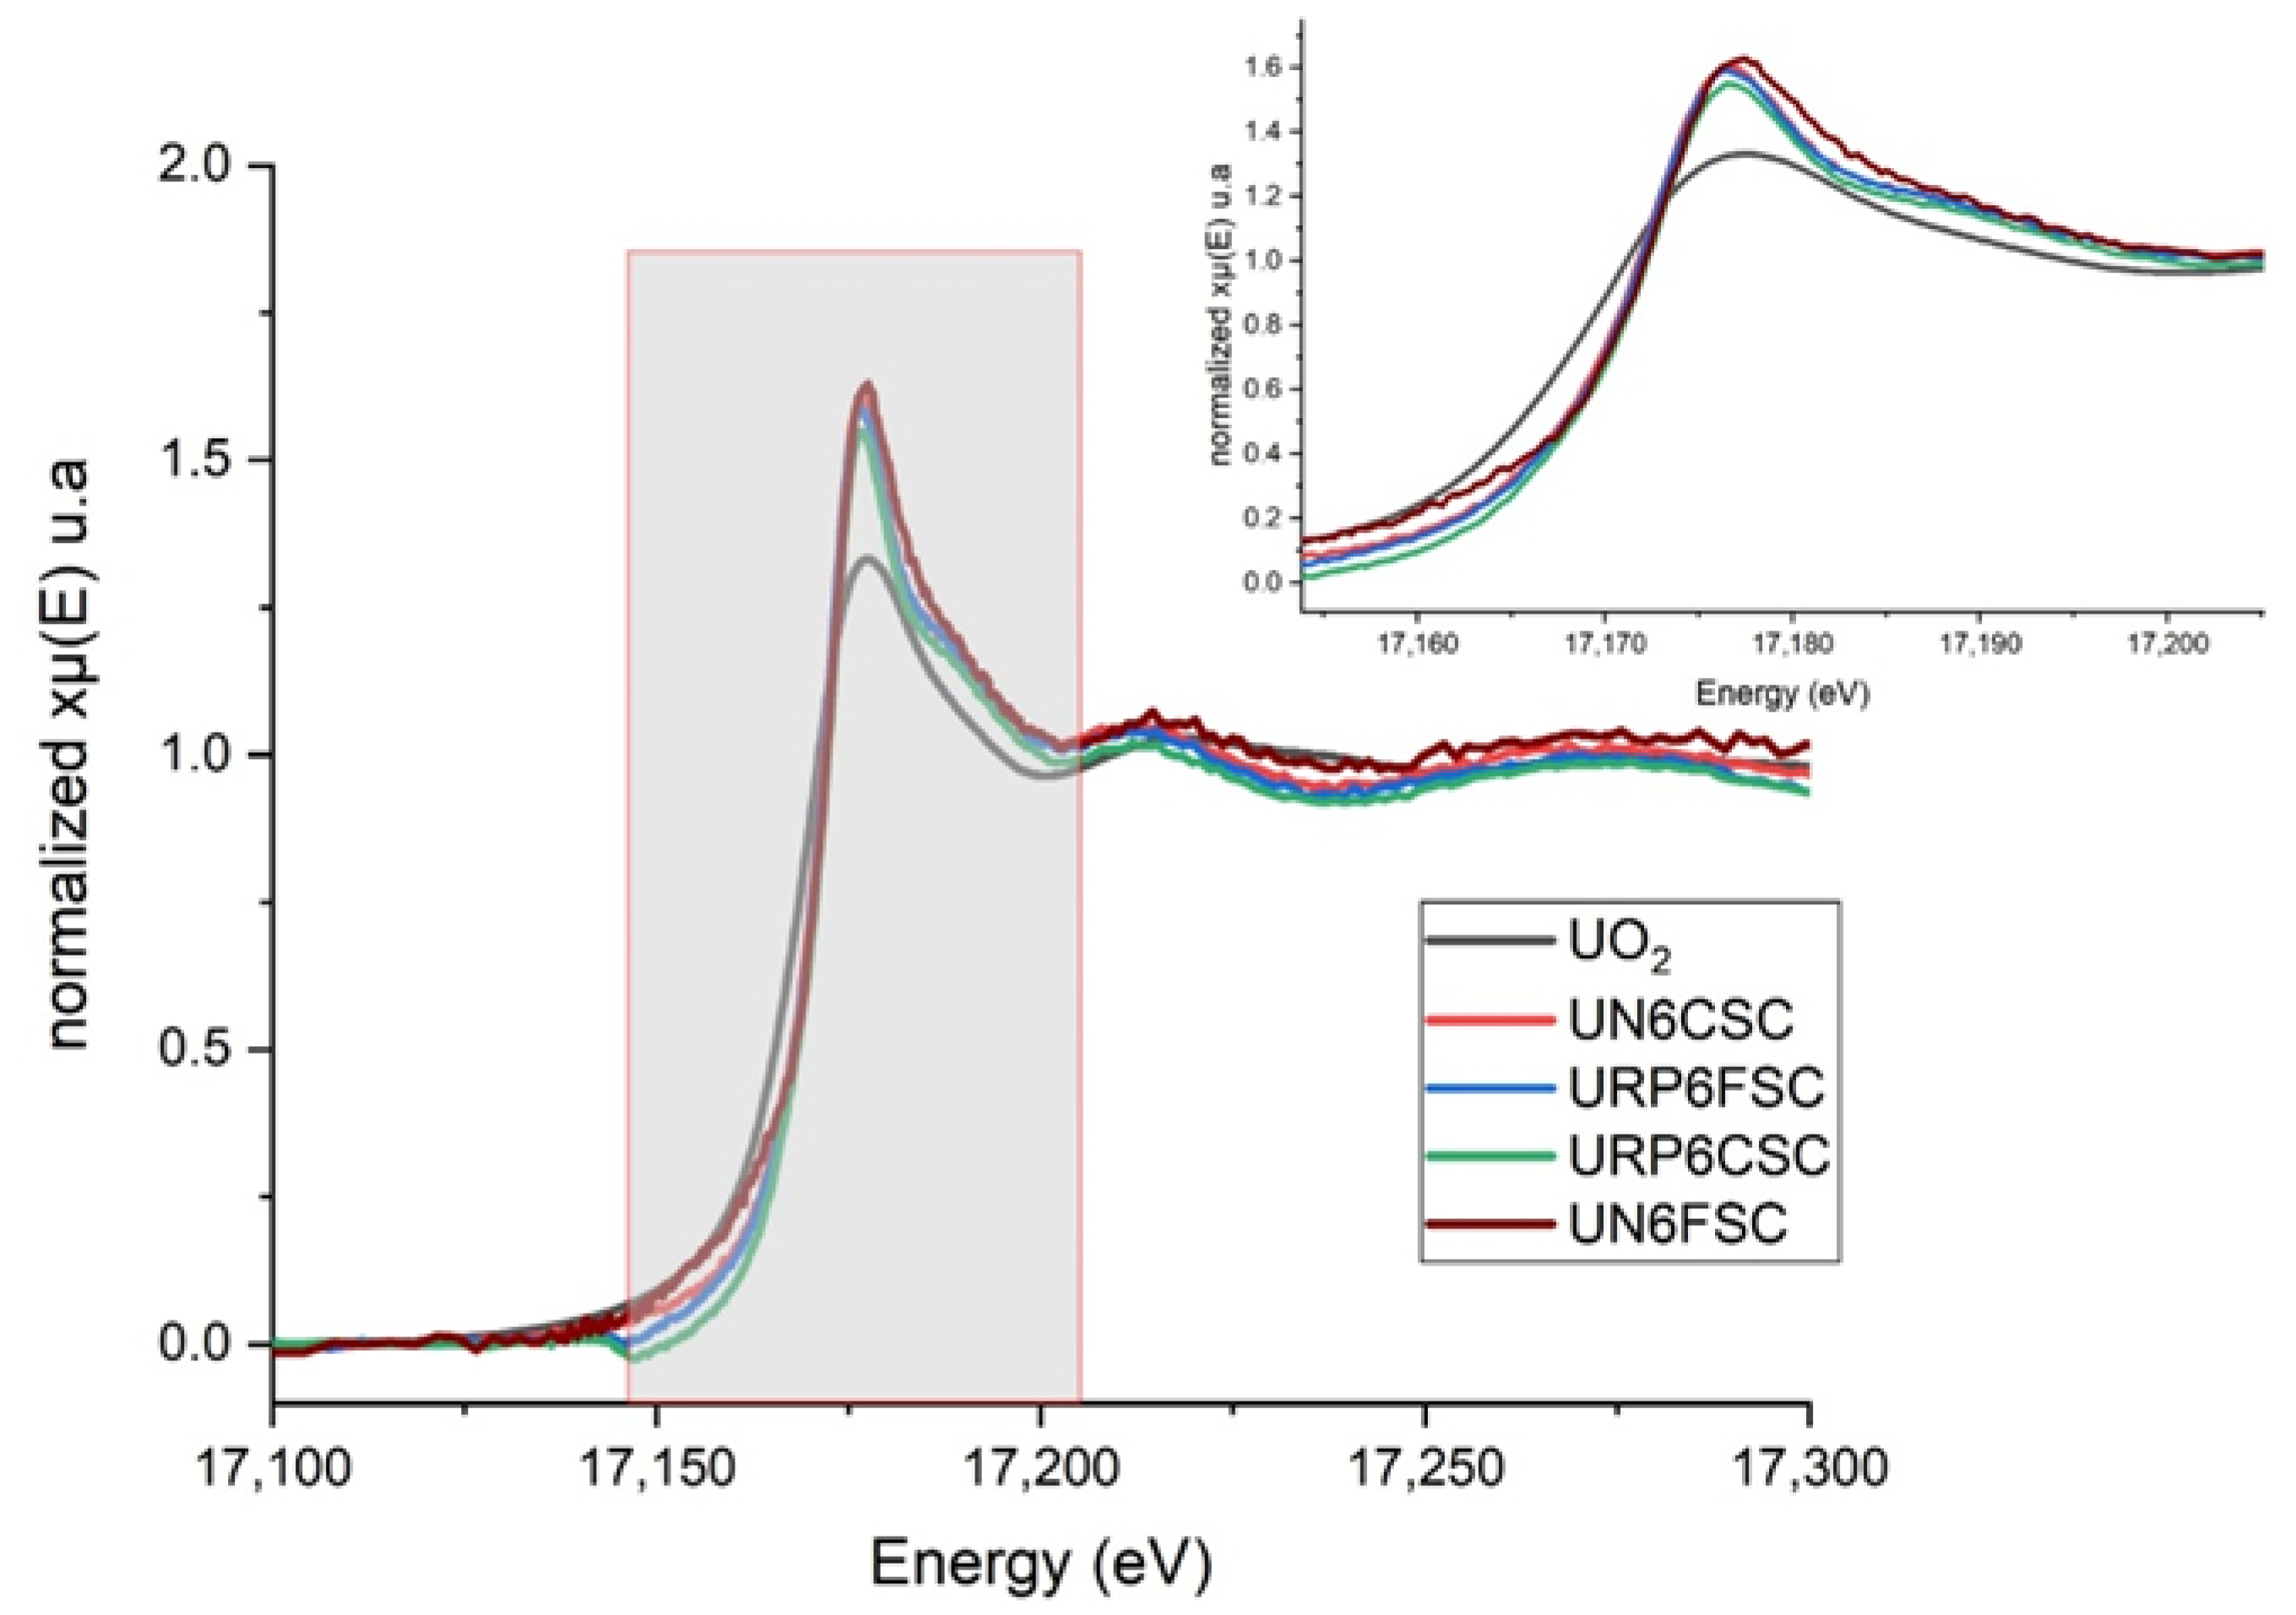
Figure 8 shows the normalized U-L3 XANES spectra of UN6FSC, UN6CSC, URP6FSC, URP6CSC, and UO2.
The energy of the absorption edge was chosen through the first derivative at the edge of each spectrum. The positions of the maximum resonance (white line WL) are 17,177.5, 17,176.6 eV, 17,177.5 eV, 17,176.8 eV, and 17,177.4 eV, respectively. The spectra show a “shoulder” on the side of the WL, a distinctive feature of the oxidation state of U(VI) [49,65,66], in our case, uranyl ions.
An EXAFS spectrum is typically acquired over thousands of eV beyond the absorption edge. The XAFS spectra of samples UN6CSC and UN6FSC showed low count statistics, making it impossible to interpret the EXAFS region of these spectra. EXAFS spectra were obtained for the fine sediment samples from the URP columns, and analyses were performed using both LCA and theoretical modeling.
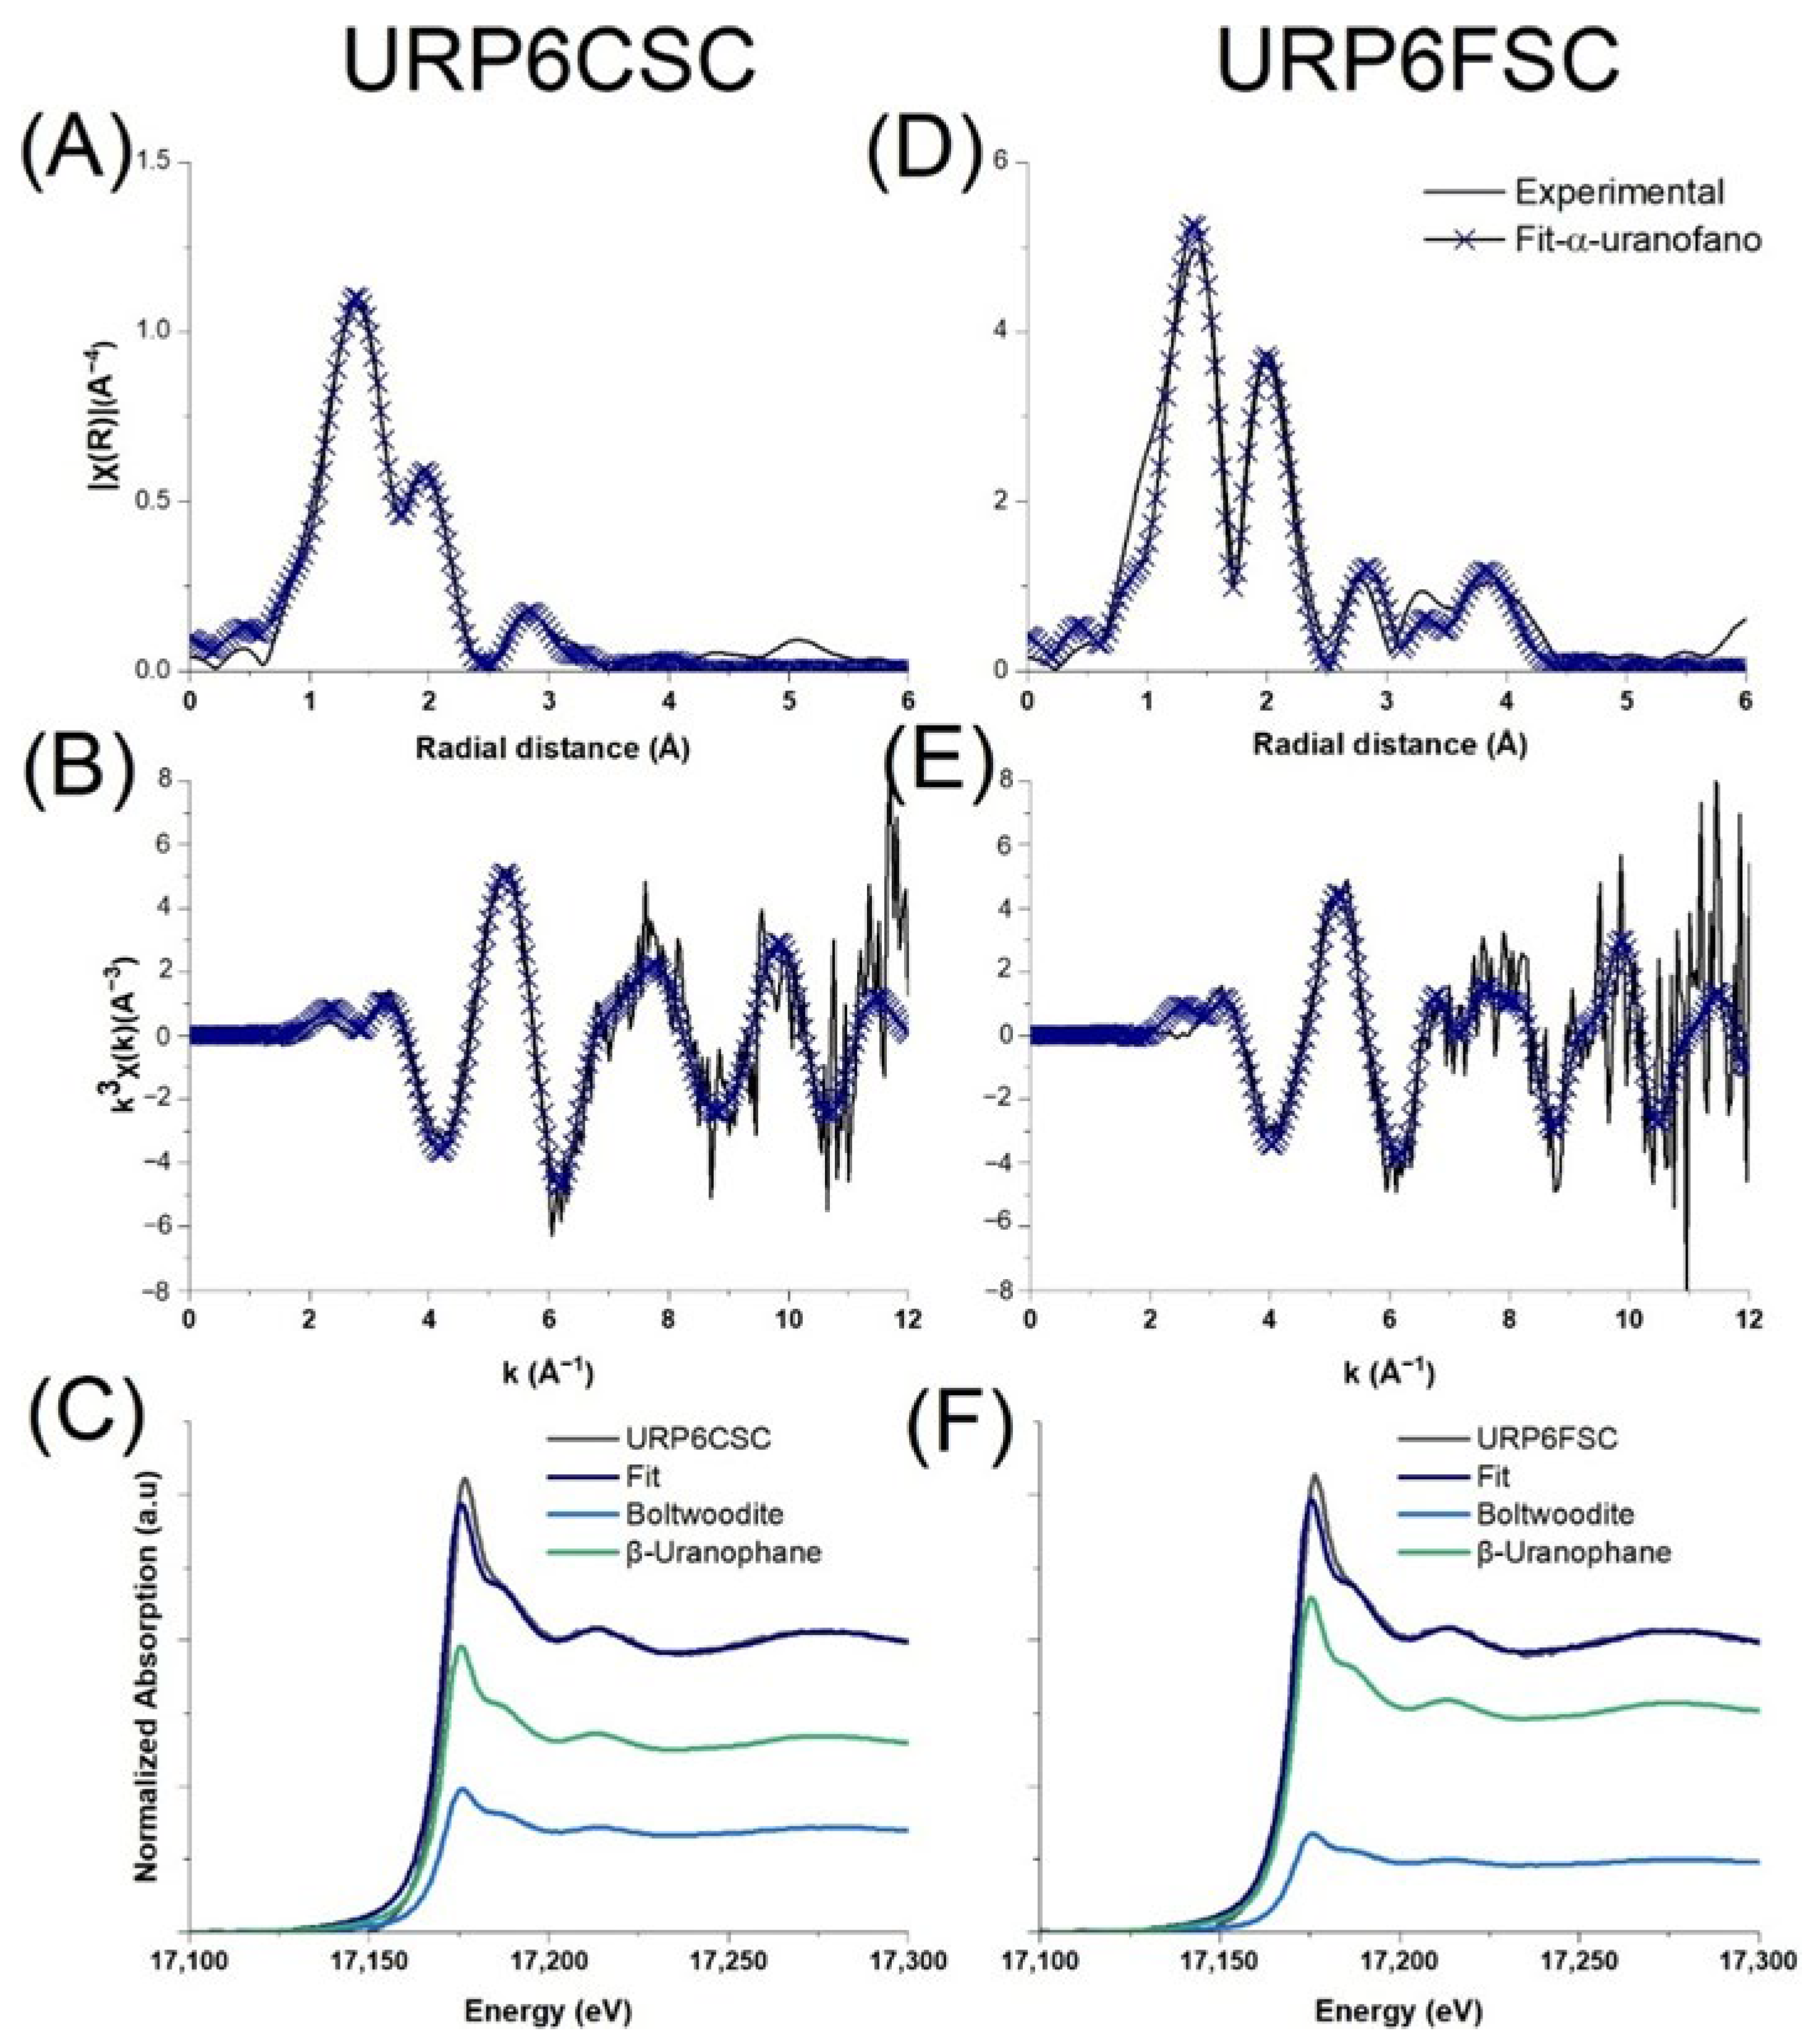
Figure 9 shows the EXAFS spectra obtained from the U-L3 edge for the URP6CSC and URP6FSC samples. Items (A) and (C) correspond to the Fourier transform in radial distance and (B) and (D) to the weighted function in k3. Items (C) and (F) show the spectra of the LCA interpretation. Table 9 presents the numerical results of the modeling analysis with theoretical standards.
The experimental EXAFS spectra were fitted using a theoretical model of α-uranophane [67]. In Figure 9A,B, the main features of the radial distribution function for sample URP6CSC, within the radial range of 1.30–1.805 Å, are associated with axial oxygen atoms. Distances between 2.00 and 2.43 Å correspond to equatorial oxygen atoms, while the range from 2.5 to 3.2 Å is attributed to U–Si bonding. Similar results were observed for the EXAFS spectra of the URP6FSC sample (Figure 9C,D). The best fits are shown in Figure 9, and the corresponding fitting parameters are provided in Table 9. [37,49] have reported that EXAFS spectra for different groups of uranium-bearing minerals exhibit characteristic spectral features. The features observed in Figure 9B,D occur at energies consistent with those reported for uranophane group minerals by [49]. These authors reported axial oxygen distances of 1.818 Å, equatorial oxygen distances of 2.292–2.480 Å, and a U–Si bond distance of 3.140 Å for uranophane.
A linear combination fitting was performed using the EXAFS spectra of β-uranophane, boltwoodite, and uraninite standards for the URP6FSC and URP6CSC samples (Figure 9C,F) using the DEMETER software package version 0.9.26. Ref. [49] reported that the EXAFS features of minerals within the uranophane group are highly similar, rendering β- and α-uranophane nearly indistinguishable. This justifies the use of β-uranophane EXAFS spectra in the linear combination analysis. The fitting results indicated a composition of 0.757 β-uranophane in URP6FSC and 0.647 in URP6CSC (Figure 9C,F).
The modeling results by LCA, the quality of the EXAFS spectra, and the low uncertainties in the numerical results using theoretical standards confirm the presence of the uranophane group minerals in the URP6CSC and URP6FSC sediments in the analyzed segments.

3.3. Discussion

Table 10 presents a compact summary of the evidence regarding uranium transport in sediments as provided by these experimental simulations.
The equilibrium concentration of uranium in the ideal adsorption of uranyl by fine sediments experiment (Section 3.2.1) for solutions with concentrations ranging from 30 to 120 mgU kg−1, at a pH close to that of oxidized rainwater was found to be significantly high, reaching 44.8 mgU/g sediment. This experiment revealed that clays were primarily responsible for the adsorption of uranyl nitrate. These values contrast those reported by [68], who observed equilibrium adsorptions of 27.4 mgU/g for bentonite and 18.68 mgU/g for kaolinite. The present study analyzed equilibrium over a substantially longer duration than that reported in [68]. The equilibrium value of 44.8 mgU/gsediment establishes an upper limit for the adsorption capacity of the uranyl ion by sediments in the study area, assuming the mineral dissolves in the mineralized zones of Peña Blanca. Furthermore, it indicates that uranyl ions tend to precipitate under neutral to alkaline conditions (Figure 6). The concentration of a mud sample collected from the alluvial fan of the Boca La Colorada stream [34] was 141 mgU kg−1 of sediment. This concentration represents the highest value reported in the area at sites far from mineral sources. This value is rare in sediments. Ref. [69] have reported 100–200 mgU kg−1 in sediments from two lakes in the Murmansk region, Arctic. Those high U concentration values have been explained by uranium migration from underground mineralized zones associated with Mo and REE. In that work, these concentrations are found in sediments with evidence of bio-reduction by organic matter. High concentration values of uranium have been observed in the surroundings of milling tailings from abandoned mines (e.g., [70]).
The simulation of uranyl ion adsorption by sediments from the characteristic profile of SPB (Section 3.2.2) corresponds to a scenario analogous to uranium dissolution by surface water near mineral sources. In this experiment, the columns were fed with a solution at 569 mgU L−1, significantly higher than the concentrations reported for the study site. Recent evaluations of natural uranium concentrations indicate values of 0.033 Bq L−1 in runoff water and 0.122 Bq L−1 in spring water, respectively [71]. The experiment results demonstrated that the clay fractions C1 and C2 in the UN6CSC, UN6FSC, UN12CSC, and UN12FSC segments exhibit a greater capacity to retain uranium than the silt fractions. This enhanced adsorption capacity of clays has also been observed in studies of uranium-contaminated sediments, where saturation values in the adsorption isotherms are higher for finer fractions, correlating with their larger surface areas of interaction [72].
Transport modeling in URP columns (Section 3.2.3) revealed low uranium concentrations in the effluent solutions. This finding is consistent with the results reported by [11], where the authors noted that stable uranium concentrations were not attained in leachate solutions from contaminated sediment columns. This phenomenon was attributed to the slow release of uranium-bearing solids or limited accessibility to pore fluids.
The concentrations of uranium in the fine sediments of the columns suggest the transport of mineral fragments by the feed solution. The verification of this hypothesis was obtained through tomographic analysis. In the photographs (see Appendix B.3, Figure B9) and tomograms (Figure 7), it was observed that throughout the experiments, there was a displacement of uranophane grains due to the advancing water feed. Concurrently, in the EXAFS experiments (Section XAFS), the spectra from the UN experiment were not of sufficient quality to allow for spectral analysis; however, the EXAFS spectra from the URP experiment corroborate the transport of very fine uranophane particulate material to the lower segment fractions of the sediment columns.
The experiment conducted on the URP6 and URP12 columns suggests the transport of uranophane particles, resembling the continuous sequence of 238U activity concentrations reported in the “El Tigre” stream [36]. Similar findings were reported by [14], who, through XAFS and µ-XRF techniques, observed diffusely migrating uranium from horizons of UO2 particles in hot spots. They suggested that this transport involves a combination of intact UO2 particles and oxidative alteration of uranium. Additionally, ref. [9] observed the physical dispersion of mineralized particles from landfills and naturally mineralized areas in stream sediments from a uranium mine in arid regions. In contrast, ref. [8] conducted a study in the “Rio Puerco” area near Church Rock, New Mexico, which experienced a significant incident when an earthen dam at a former uranium mill collapsed [73]. This study found that, within the uranium mining area, uranium-bearing particles from mining waste disposal sites are not transported far from their source. Instead, more soluble uranium-bearing minerals are subjected to dissolution during torrential desert rains.
Finally, future research should focus on developing integrated models considering multiple transport mechanisms, including fragmentation, dissolution, adsorption, and sediment dynamics. These models can simulate the interactions between environmental variables, such as rainfall patterns, temperature fluctuations, and soil characteristics, allowing for more accurate predictions of uranium dispersion across various spatial and temporal scales. Additionally, predictive models can be adapted to investigate the potential impacts of climate change on uranium transport. Changing precipitation patterns and an increased frequency of extreme weather events may alter leaching processes and sediment transport, underscoring the need for models that incorporate climate variables. Moreover, it is essential to create models to assess the risk of uranium dispersion to nearby water sources, agricultural lands, and human health. This information will guide remediation efforts to mitigate uranium contamination and inform land-use planning and regulatory decision-making.

4. Conclusions

Investigating uranium transport in desert environments—specifically through fragmentation and dissolution—provides valuable insights into how uranium behaves in arid ecosystems. The torrential rains characteristic of the sierras in deserts transport uranium from uraniferous minerals in the Peña Blanca area towards the Laguna del Cuervo. This process results in the coexistence of both anomalously high and low uranium concentrations at locations not far from the floodplain.
Uranium adsorption and transport simulation experiments clarified these phenomena by using liquid scintillation, microwave plasma atomic emission spectrometry, scanning electron microscopy, and synchrotron radiation techniques to analyze uranium speciation in matrices. Different scenarios were implemented to simulate: (1) dissolution near the sources (UN experiments) followed by adsorption; (2a) dissolution of the mineral by the feed solution and subsequent adsorption; and (2b) transport of mineral fragments along the column, with minimal or no adsorption of the eventually dissolved fraction (URP experiments).
The uranium concentration in the sediments from the various experiments exhibited the following sequence: C_URP < C_UN << Batch. Simulations involving solution flow through a uranium mineral horizon in the sediments suggest the transport of mineral fragments by the feed solution. The findings also emphasize the role of sediment characteristics—fine sediments may enhance uranium adsorption, while coarser materials can facilitate its physical transport.
The results of the various simulations suggest that fragmented mineral transport is the predominant type of transport in the SPB profile, accompanied by eventual dissolution and subsequent uranium adsorption in the sediments. These findings account for the low uranium concentration values observed in the lower zones of the SPB profile and the floodplain. This observation does not preclude the possibility that, in the future, the mineral fragments may dissolve and subsequently contribute to localized areas with uranium concentrations comparable to those found in the mud. This poses potential risks to nearby water sources and ecosystems.
Finally, this study underscores the need for a holistic approach to understanding uranium mobility in desert landscapes, considering both fragmentation and dissolution to improve monitoring and management strategies for uranium contamination.

Author Contributions

Conceptualization, V.P.-R., I.A.R.-C. and M.E.M.-C.; Formal analysis, V.P.-R., J.G.C.-T., R.M.C.-L., C.H.-H. and M.R.-V.; Funding acquisition, M.E.M.-C.; Investigation, V.P.-R., B.P.C.-L., J.G.C.-T., C.H.-H., F.F.-G., Y.R.-G., G.G.-S., D.H.-C., R.L.-P., J.C.-F. and G.V.-O.; Methodology, V.P.-R., G.G.-S., B.P.C.-L., J.G.C.-T., M.R.-V., G.V.-O. and R.M.C.-L.; Project administration, M.E.M.-C.; Supervision, M.E.M.-C.; Validation, M.R.-V. and G.G.-S.; Writing—original draft, V.P.-R., R.M.C.-L., G.G.-S. and M.E.M.-C.; Writing—review and editing, V.P.-R., G.G.-S., M.R.-V. and M.E.M.-C. All authors have read and agreed to the published version of the manuscript.

Funding

This research was funded by the CONAHCYT research project, funding number CF/2019 10853.

Institutional Review Board Statement

Not applicable.

Informed Consent Statement

Not applicable.

Data Availability Statement

Data are contained within the article and associated materials in Appendix A and Appendix B.

Acknowledgments

The authors would like to express their gratitude to CONACYT for funding the CF/2019 10853 project. We extend our thanks to Hilda Esparza Ponce and Andrés Isaak González Jáquez from CIMAV, as well as to J.F.W. Mosselmans from Diamond Light Source for their technical and scientific support. Finally, the XAS measurements were conducted as part of proposal SP31873 at Diamond Light Source in the UK. We sincerely appreciate their assistance.

Conflicts of Interest

The authors declare no conflicts of interest.

Appendix A

Appendix A.1. Separation of Silt and Clay Fractions

Once the column experiments were completed, silt and clay fractions were obtained in each column’s CSC and FSC segments to verify each particle size’s contribution to uranium adsorption. 30 g of sediment was placed in a 1000 mL test tube with distilled water, stirred, and left to stand for 48 h, based on [74]. The supernatant was extracted with a pipette and centrifuged at 4000 rpm to obtain the clay fraction. The supernatant solution was passed through a 0.45 µm pore filter. Each separated fraction was dried in an oven for 24 h. Each sediment fraction and the remaining solution were analyzed for 238,234U contents by LSC. With all the results, the balance of uranium contents was verified.

Appendix A.2. Pore Volume of Columns

The pore volume of FSD, CSC, and FSC was calculated by a separate experiment with the materials of each segment, determining the displacement of the pore gas upon saturation with distillate water and the difference in mass between the saturated and dry sediment [75].

Appendix B

Appendix B.1. Sediments and Effluent Characterization

Appendix B.1.1. Powder X-Ray Diffraction (XRD)
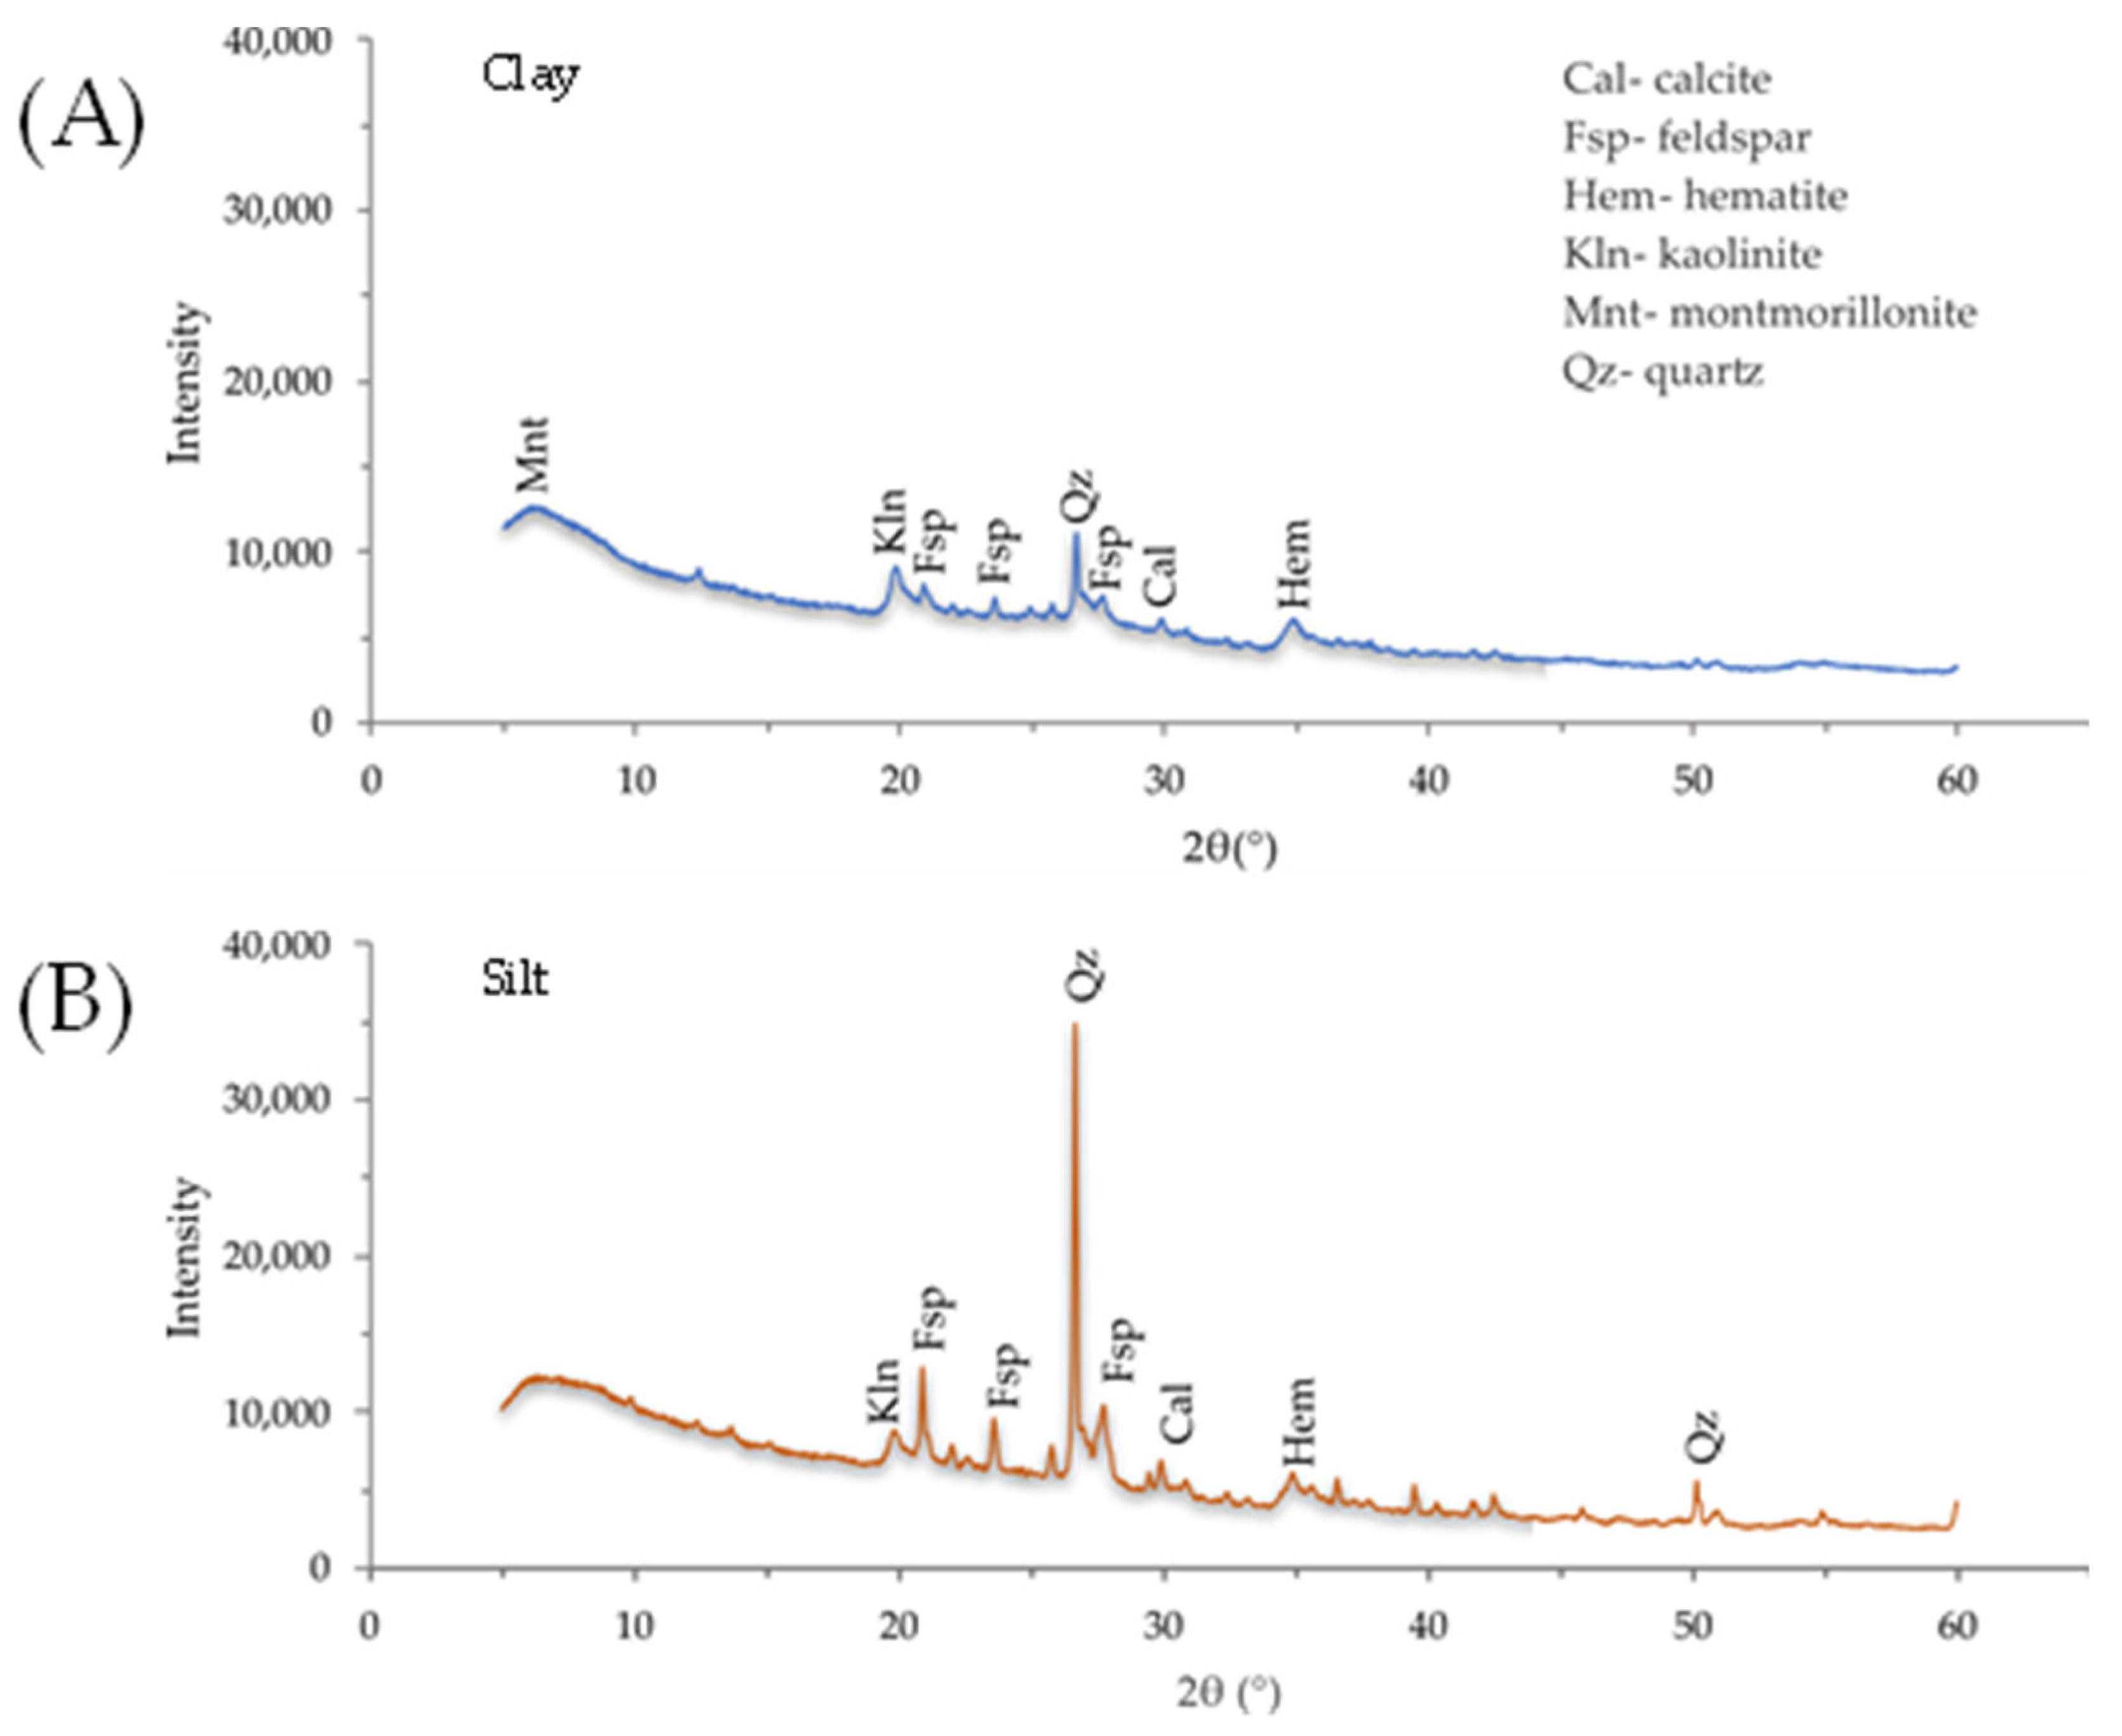
Figure B1. (A) Clay and (B) silt XRD patterns obtained from the CSC and FSC fractions used in this study. The qualitative identification of the mineral phases is included, showing a difference in the peaks associated with the different contents of feldspars, quartz, and kaolinite.
Applsci 15 00609 g0b1

Appendix B.1.2. Microwave Plasma Atomic Emission Spectrometry (MP-AES)

Sediment samples were digested in an open digestion system with HNO3, H2O2, and HCl for analysis by atomic emission spectrometry, according to EPA method 3050b, weighing 1.00 g of samples and bringing the final digested solution to a volume of 10 mL to be volumetrically gauged.
Table B1. Concentrations of major elements present in the sediments (CSC, FSC).
Sample IDElement (mg kg−1)
AlNaKMgCaFeCuSi *
Detection limit6.71.5121.3370.2312
CSC9655102675296148287733753
FSC21,900326269705510,22416,95917LOD
UN6CSC12,695733004005665810,325965
UN6FSD15,7951141444933743112,3781216
UN12CSC20,3581953246406973616,32211<LD
UN12FSD21,2332953496454919115,69814<LD
URP6CSC17,6222246395514842014,22511LOD
URP6FSD13,7291240354271634410,6001217
URP12CSC18,7683054686127926115,07114LOD
URP12FSD15,154224049697910,71313,90711LOD
LOD = below detection limit, * Si corresponds only to that which is soluble under the conditions of digestion referred to above.
Table B2. Cation concentration in effluent samples from UN6, UN12, URP6, and URP12.
ID SampleElement
mg L−1
NaKMgCa
Detection limit0.150.130.210.18
WUN6_1101.3657.8622.81108.3
WUN6_258.0745.0826.9562.56
WUN6_350.5847.5825.2326.33
WUN6_48.936.865.4923.88
WUN6_56.975.23.0719.07
WUN6_6<LOD 1.411.055.88
WUN6_74.332.891.9712
WUN12_145.549.6327.2479.83
WUN12_239.0540.7621.6863.72
WUN12_347.3837.9516.0932.11
WUN12_441.126.2216.4174.32
WUN12_539.625.7511.0757.48
WUN12_617.4812.757.641.52
WUN12_736.721.856.0741.36
WUN12_818.0914.44.1428.03
WUN12_915.9911.36321.63
WUN12_1043.7833.048.772
WUN12_1124.7121.976.0755.22
WUN12_1216.4223.356.7261.13
WURP6_1103.6562.6423.93114.23
WURP6_288.0970.5360.7295.89
WURP6_343.8264.4733.7757.55
WURP6_441.3235.6617.84114.06
WURP6_531.8125.1612.3479.09
WURP6_627.2419.689.4766.42
WURP6_722.4618.777.8863.28
WURP6_829.2517.726.7643.58
WURP12_362.247135.1450.84
WURP12_745.8226.469.4655.49
WURP12_89.828.94.4228.28
WURP12_916.9212.837.0946.51
WURP12_1013.499.064.6134.36
WURP12_1125.4419.436.0744.7
WURP12_129.8410.685.2639.86
WURP12_137.546.073.1823.84
LOD = below detection limit.

Appendix B.2. Batch Experiment

Appendix B.2.1. EXAFS Results for pH = 7 C2 Type Clay Fraction
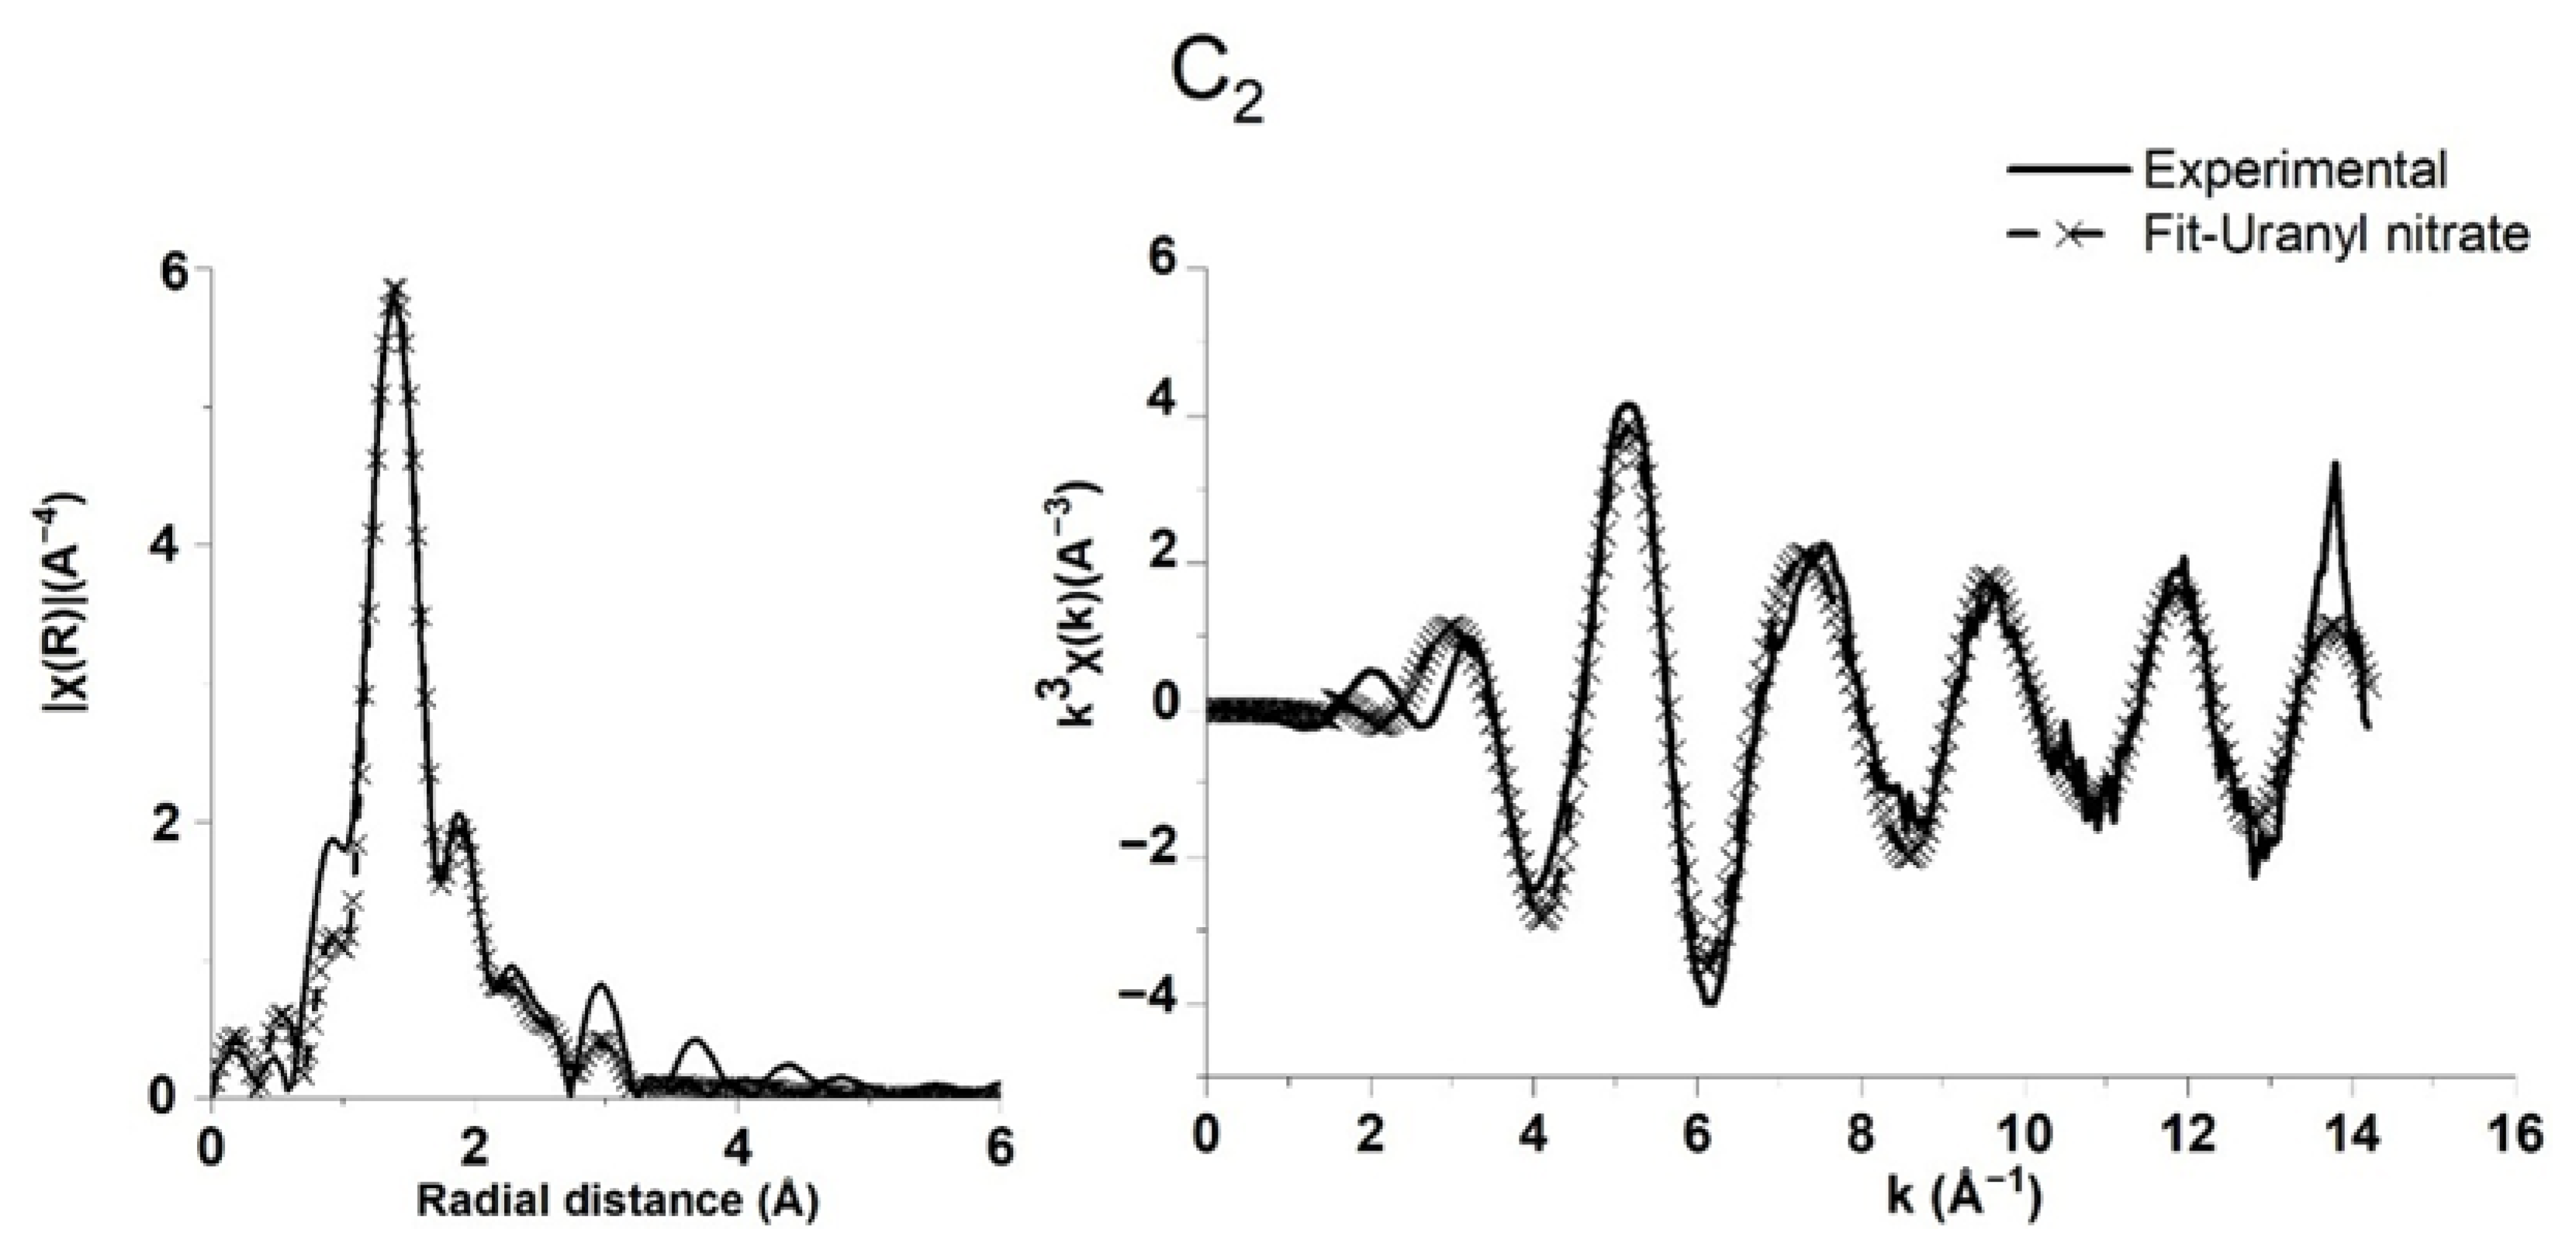
The results of the EXAFS experiments performed for the C2-type clay fraction corresponding to the batch experiment at pH = 7 with uranyl nitrate are presented in Figure B2 and Table B3.
Figure B2. The Fourier transform (radial distribution function) and the k3-weighted spectra of experimental (solid line) and fitted (dashed line) U L3 EXAFS on the C2 type clay fraction with uranyl nitrate.
Applsci 15 00609 g0b2
Table B3. Best fit parameters for U L3 EXAFS spectrum on the C2 type clay fraction. Parameters S02 and E0 were fixed for all paths to 0.95 and 9 eV, respectively. Independent points = 17.42; number of variables = 8; obtained R-factor = 0.0160.
NameNσ22)ΔRReff (Å)Reff + ΔR (Å)
U_Oax20.0031 (6)0.059 ± 0.0051.76021.819
U_Oeq120.005 (3)−0.09 ± 0.022.39722.31
U_Oeq220.010 (4)−0.04 ± 0.022.50382.47
U_Oeq320.010 (4)−0.04 ± 0.022.54752.51
U_N110.007 (5)−0.10 ± 0.042.95062.85
U_N210.007 (5)−0.10 ± 0.042.98452.88
Ref. [76] reported on batch experiments for the adsorption of uranyl nitrate on kaolinite, EXAFS spectra fitted with coordination numbers and interatomic distances with equivalent values at the axial (1.78 Å) and equatorial oxygens (2.35 Å). Ref. [77] obtained, for uranyl nitrate hexahydrate, fits of spectra with interatomic distances between U(VI) and axial O (1.75 Å), equatorial O (2.46 Å), N (2.93 Å). From the results in Table B3, it can be concluded that on the clay C2 of the batch experiment, a layer of a structure similar to uranyl nitrate was precipitated on sediments.

Appendix B.2.2. SEM-EDS Images for FSC pH = 5 and FSC pH = 7

Figure B3. Mapping of major elements in sediment particles after U(VI) adsorption (C0 = 120 mg L−1) at pH = 5 by SEM-EDS at 500× magnification.
Applsci 15 00609 g0b3
Figure B4. Mapping of major elements in sediment particles after U6+ adsorption (C0 = 120 mg·L−1) at pH = 7 by SEM-EDS at 1000× magnification.
Applsci 15 00609 g0b4

Appendix B.3. Modeling Transport in URP Columns

Appendix B.3.1. URP6 Column–End of Experiment (SEM-EDS)

Figure B5. Backscattered electron images of URP6 column of fractions (A) C1, (B) CS, (C) C2 and, (D) FS.
Applsci 15 00609 g0b5
Figure B6. Energy-dispersive X-ray spectroscopy (EDS) analysis was performed on (A) C1 of URP6 and (B) CS of URP6 samples. At the conclusion of the experiment, no U presence was detected in any of the analyzed samples. The other samples showed similar EDS results.
Applsci 15 00609 g0b6

Appendix B.3.2. URP12 Column-End of Experiment
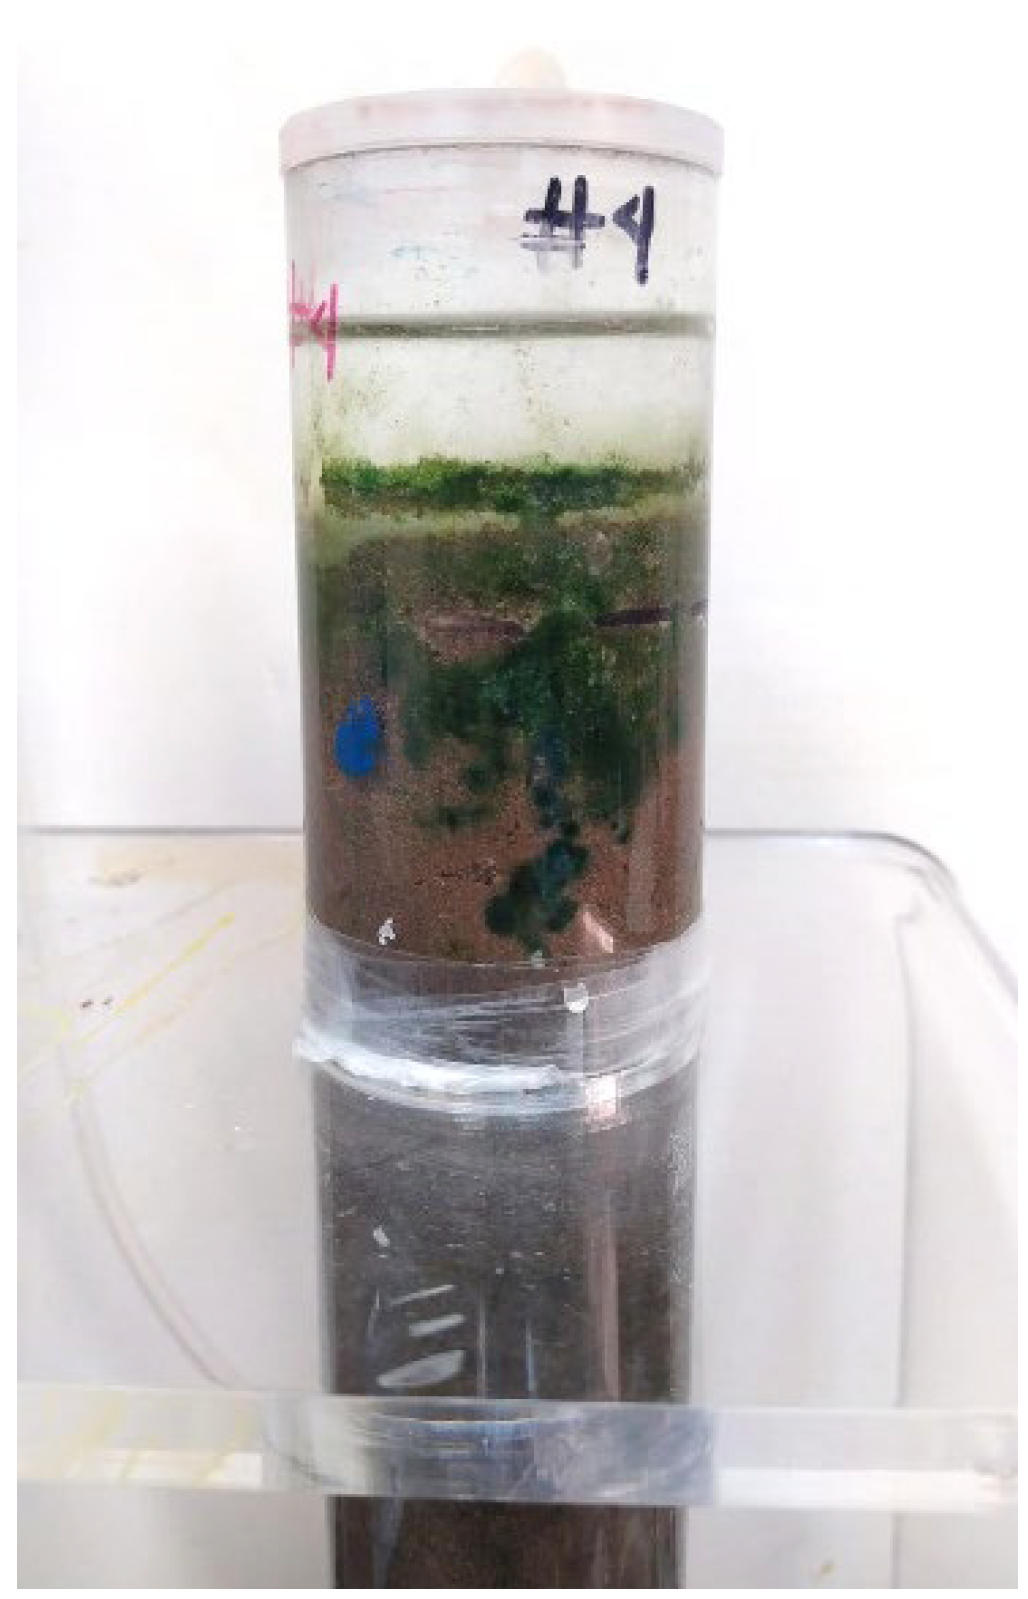
Figure B7. Photograph of the URP12 column at the end of the experiment, showing organic matter (algae) at the top interacting with the uranophane horizon. The organic matter exhibits a high affinity for dissolved uranium likely explains the low uranium concentrations in the WURP12 samples.
Applsci 15 00609 g0b7

Appendix B.3.3. URP Experiment–Tomography

Calibration
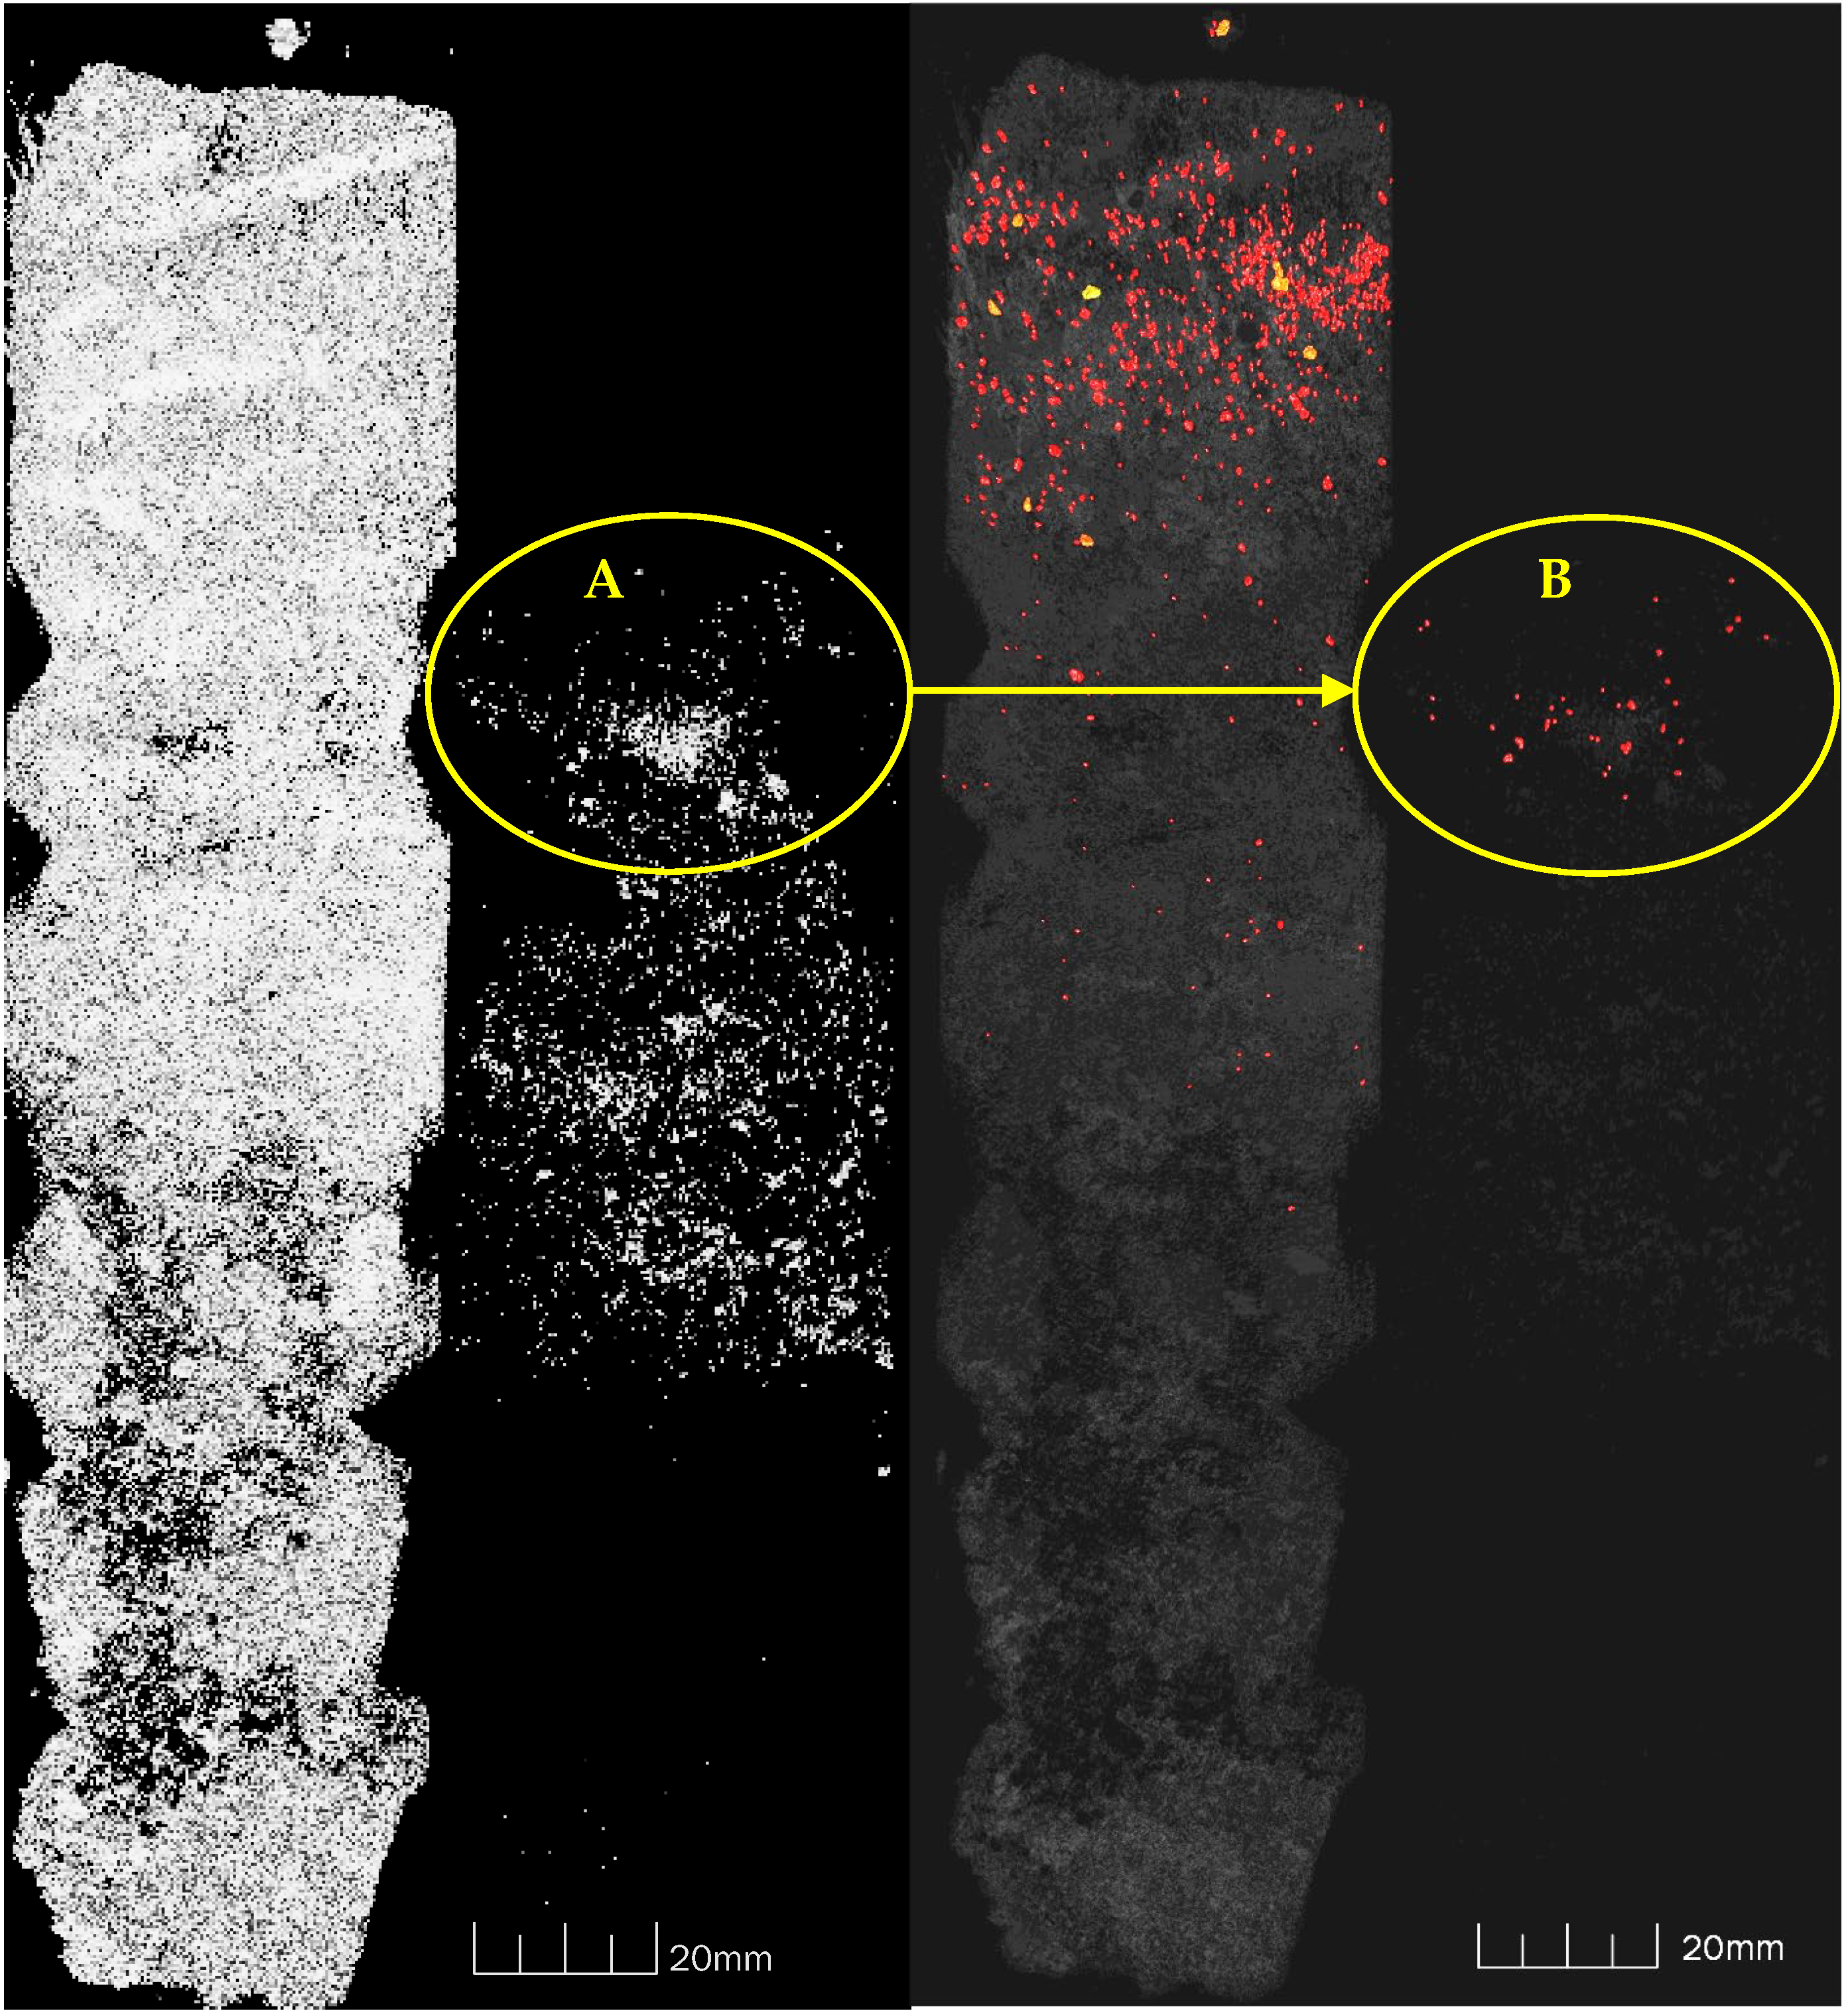
Figure B8. Tomography of the URP6FSD sample. Circle A shows uranophane (from SPB) used for calibration, with the bulk corresponding to FSD from the experiment. Circle B highlights uranophane particles at an “isovalue” of 28, distinguishing them from the rest of the sample.
Applsci 15 00609 g0b8

Comparison of Tomography-UV Light-Visible Light
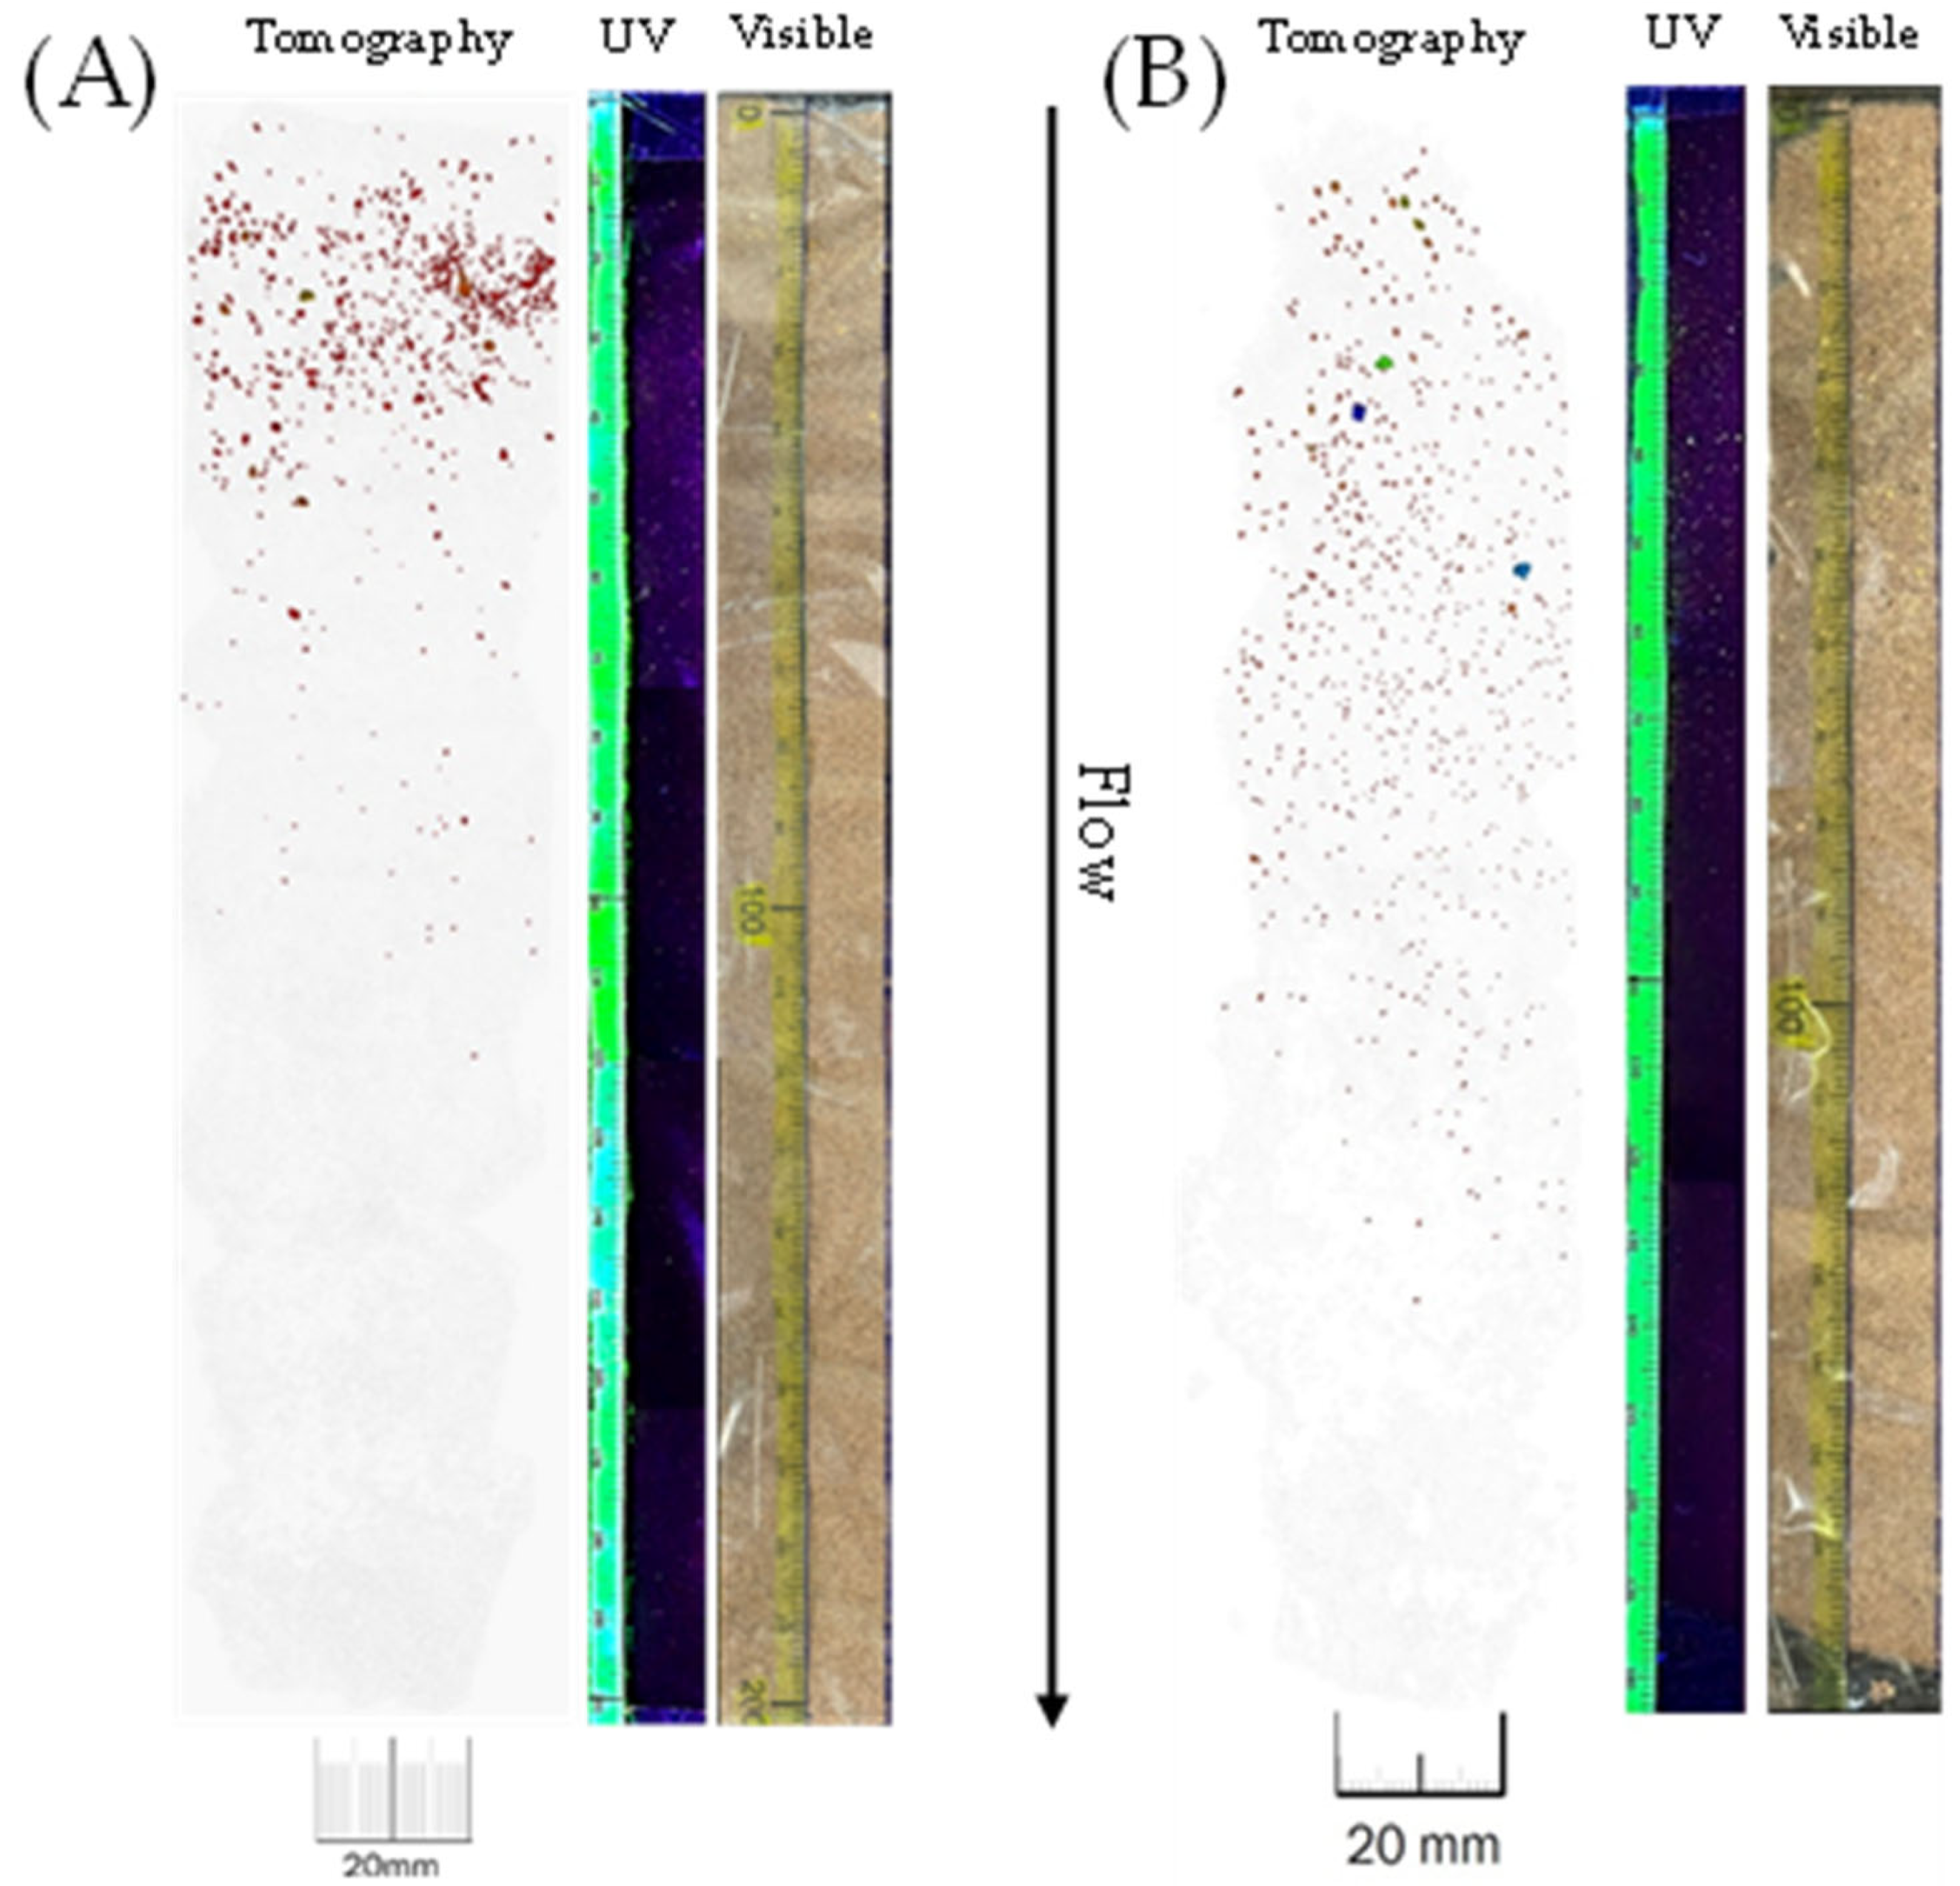
Figure B9. Computer tomography images display the raw image on the left and the material’s probability occurrence on the right. (A) URP6FSD sample and (B) URP12FSD sample. Composite image using three different wavelengths. X-ray tomography, calibrated with uranophane, reveals the displacement of mineral particles through the columns. Under UV light, the concentration of particles due to advection in the direction of the solution flow is qualitatively observed. In white light, the uranophane horizon is visible in the upper parts of both columns.
Applsci 15 00609 g0b9

Appendix B.4. Uranium Concentrations in Effluents from Experiments

Appendix B.4.1. Transport Modeling with Uranium Solutions (UN Columns)

Table B4. U concentrations in the effluents from the UN6 column.
UN6
Sample IDU Total (mg L−1)
WUN6_10.7
WUN6_20.1
WUN6_30.1
WUN6_40.1
WUN6_50.1
Table B5. U concentrations in the effluents from the UN12 column.
UN12
Sample IDU Total mg L−1
LSC
U mg L−1 MP-AES
WUN12_10.20.09
WUN12_20.210.07
WUN12_31.250.15
WUN12_40.540.1
WUN12_50.860.09
WUN12_62.370.13
WUN12_70.460.1
WUN12_83.680.64
WUN12_95.552.5
WUN12_109.029.01
WUN12_1116.4216.82
WUN12_1229.0925.99

Appendix B.4.2. Modeling Transport in URP Columns

Table B6. U concentrations in the effluents from the URP6 column.
URP6
ID Sample234U Bq L−1238U Bq L−1RQ (%)238U mg L−1
WURP6_22.1 ± 0.12.3 ± 0.1230.18
WURP6_32.1 ± 0.12.6 ± 0.1880.21
WURP6_46.3 ± 0.16.7 ± 0.1600.55
WURP6_619.0 ± 0.434.4 ± 0.7692.79

References

  1. Smedley, P.L.; Kinniburgh, D.G. Uranium in Natural Waters and the Environment: Distribution, Speciation and Impact. Appl. Geochem. 2023, 148, 105534. [Google Scholar] [CrossRef]
  2. Bourdon, B.; Turner, S.; Henderson, G.M.; Lundstrom, C.C. Introduction to U-Series Geochemistry. Miner. Geochem. 2003, 52. [Google Scholar] [CrossRef]
  3. International Atomic Energy Agency. The Long Term Stabilization of Uranium Mill Tailings; TECDOC Series; IAEA: Vienna, Austria, 2004; ISBN 92-0-108904-X. [Google Scholar]
  4. Liu, C.; Zachara, J.M.; Qafoku, O.; McKinley, J.P.; Heald, S.M.; Wang, Z. Dissolution of Uranyl Microprecipitates in Subsurface Sediments at Hanford Site, USA. Geochim. Cosmochim. Acta 2004, 68, 4519–4537. [Google Scholar] [CrossRef]
  5. Wang, Z.; Zachara, J.M.; Gassman, P.L.; Liu, C.; Qafoku, O.; Yantasee, W.; Catalano, J.G. Fluorescence Spectroscopy of U(VI)-Silicates and U(VI)-Contaminated Hanford Sediment. Geochim. Cosmochim. Acta 2005, 69, 1391–1403. [Google Scholar] [CrossRef]
  6. Pidchenko, I.; Bauters, S.; Sinenko, I.; Hempel, S.; Amidani, L.; Detollenaere, D.; Vinze, L.; Banerjee, D.; Van Silfhout, R.; Kalmykov, S.N.; et al. A Multi-Technique Study of Altered Granitic Rock from the Krunkelbach Valley Uranium Deposit, Southern Germany. RSC Adv. 2020, 10, 25529–25539. [Google Scholar] [CrossRef]
  7. Tayal, A.; Conradson, S.D.; Kanzari, A.; Lahrouch, F.; Descostes, M.; Gerard, M. Uranium Speciation in Weathered Granitic Waste Rock Piles: An XAFS Investigation. RSC Adv. 2019, 9, 11762–11773. [Google Scholar] [CrossRef]
  8. deLemos, J.L.; Bostick, B.C.; Quicksall, A.N.; Landis, J.D.; George, C.C.; Slagowski, N.L.; Rock, T.; Brugge, D.; Lewis, J.; Durant, J.L. Rapid Dissolution of Soluble Uranyl Phases in Arid, Mine-Impacted Catchments near Church Rock, NM. Environ. Sci. Technol. 2008, 42, 3951–3957. [Google Scholar] [CrossRef] [PubMed]
  9. Lottermoser, B.G.; Ashley, P.M.; Costelloe, M.T. Contaminant Dispersion at the Rehabilitated Mary Kathleen Uranium Mine, Australia. Environ. Geol. 2005, 48, 748–761. [Google Scholar] [CrossRef]
  10. Rodriguez, V.G.; Majumdar, A.; Meza, I.; Corcoran, L.; Pierson, A.; Gagnon, K.; Cano, C.; Ali, A.-M.S.; Shuey, C.M.; Jojola, G.; et al. Radiological Analyses of 226Ra and 238U in Surface Water and Sediments from the Jackpile Member of the Morrison Formation, Pueblo of Laguna, New Mexico. Environ. Sci. Technol. 2024, 58, 15138–15146. [Google Scholar] [CrossRef]
  11. Brown, C.F.; Serne, R.J.; Catalano, J.G.; Krupka, K.M.; Icenhower, J.P. Mineralization of Contaminant Uranium and Leach Rates in Sediments from Hanford, Washington. Appl. Geochem. 2010, 25, 97–104. [Google Scholar] [CrossRef]
  12. Bower, W.R.; Morris, K.; Livens, F.R.; Mosselmans, J.F.W.; Fallon, C.M.; Fuller, A.J.; Natrajan, L.; Boothman, C.; Lloyd, J.R.; Utsunomiya, S.; et al. Metaschoepite Dissolution in Sediment Column Systems—Implications for Uranium Speciation and Transport. Environ. Sci. Technol. 2019, 53, 9915–9925. [Google Scholar] [CrossRef]
  13. Johnson, R.H.; Tigar, A.D.; Richardson, C.D. Column-Test Data Analyses and Geochemical Modeling to Determine Uranium Reactive Transport Parameters at a Former Uranium Mill Site (Grand Junction, Colorado). Minerals 2022, 12, 438. [Google Scholar] [CrossRef]
  14. Fallon, C.M.; Bower, W.R.; Powell, B.A.; Livens, F.R.; Lyon, I.C.; McNulty, A.E.; Peruski, K.; Mosselmans, J.F.W.; Kaplan, D.I.; Grolimund, D.; et al. Vadose-Zone Alteration of Metaschoepite and Ceramic UO2 in Savannah River Site Field Lysimeters. Sci. Total Environ. 2023, 862, 160862. [Google Scholar] [CrossRef]
  15. Bam, W.; Teyssié, J.-L.; Metian, M.; Oberhaensli, F.; Maiti, K.; Swarzenski, P.W. An Experimental Approach to Assess the Post-Depositional Mobility of 134Cs. J. Environ. Radioact. 2021, 240, 106753. [Google Scholar] [CrossRef] [PubMed]
  16. Alba, L.A.; Chávez, R. K-Ar Ages of Volcanic Rocks from the Central Sierra Peha Blanca, Chihuahua, Mexic. Isochron/West 1974, 10, 21–23. [Google Scholar]
  17. George-Aniel, B.; Leroy, J.L.; Poty, B. Volcanogenic Uranium Mineralizations in the Sierra Pena Blanca District, Chihuahua, Mexico; Three Genetic Models. Econ. Geol. 1991, 86, 233–248. [Google Scholar] [CrossRef]
  18. Goodell, P.C. Chihuahua City Uranium Province, Chihuahua, Mexico. In Uranium Deposits in Volcanic Rocks, Proceedings of the Technical Committee Meeting on Uranium Deposits in Volcanic Rocks, El Paso, TX, USA, 2–5 April 1984; IAEA: Vienna, Austria, 1985; pp. 97–124. ISBN 92-0-041085-5. [Google Scholar]
  19. Dobson, P.F.; Fayek, M.; Goodell, P.C.; Ghezzehei, T.A.; Melchor, F.; Murrell, M.T.; Oliver, R.; Reyes-Cortés, I.A.; De La Garza, R.; Simmons, A. Stratigraphy of the PB-1 Well, Nopal I Uranium Deposit, Sierra Peña Blanca, Chihuahua, Mexico. Int. Geol. Rev. 2008, 50, 959–974. [Google Scholar] [CrossRef]
  20. Pearcy, E.C.; Prikryl, J.D. Alteration of Uraninite from the Nopai I Deposit, Pefia Blanca District, Chihuahua, Mexico, Compared to Degradation of Spent Nuclear Fuel in the Proposed U.S. High-Level Nuclear Waste Repository at Yucca Mountain, Nevada. Appl. Geochem. 1994, 9, 713–732. [Google Scholar] [CrossRef]
  21. García, E. Modificaciones al Sistema de Clasificación Climática de Köppen; Universidad Nacional Autónoma de México: Mexico City, Mexico, 2004; ISBN 970-32-1010-4. [Google Scholar]
  22. INEGI. Anuario Estadístico y Geográfico de Chihuahua; Instituto Nacional de Estadística y Geografía: Mexico City, Mexico, 2017; Available online: https://www.inegi.org.mx/app/biblioteca/ficha.html?upc=702825092139 (accessed on 5 September 2024).
  23. Schmidt, R.H. Chihuahuan Climate. Proceedings, Second Symposium on Resources of the Chihuahuan Desert, Chihuahuan; Chihuahuan Desert Research Institute: Alpine, TX, USA, 1986; pp. 40–63. Available online: https://www.utep.edu/leb/pdf/chihuahuanclimate.pdf (accessed on 5 September 2024).
  24. INEGI. Síntesis de Información Geográfica Del Estado de Chihuahua; Instituto Nacional de Estadística y Geografía: Mexico City, Mexico, 2003; ISBN 970-13-4166-X. [Google Scholar]
  25. Reineck, H.-E.; Singh, I.B. Depositional Sedimentary Environments with Reference to Terrigenous Clastics, Springer Study ed.; Springer: Berlin/Heidelberg, Germany, 2012; ISBN 978-3-540-10189-5. [Google Scholar]
  26. Denton, J.S.; Goldstein, S.J.; Paviet, P.; Nunn, A.J.; Amato, R.S.; Hinrichs, K.A. A Record of Uranium-Series Transport at Nopal I, Sierra Peña Blanca, Mexico: Implications for Natural Uranium Deposits and Radioactive Waste Repositories. Chem. Geol. 2016, 434, 12–27. [Google Scholar] [CrossRef]
  27. Dobson, P.F.; Ghezzehei, T.A.; Cook, P.J.; Rodríguez-Pineda, J.A.; Villalba, L.; De La Garza, R. Heterogeneous Seepage at the Nopal I Natural Analogue Site, Chihuahua, Mexico. Hydrogeol. J. 2012, 20, 155–166. [Google Scholar] [CrossRef]
  28. Goldstein, S.J.; Abdel-Fattah, A.I.; Murrell, M.T.; Dobson, P.F.; Norman, D.E.; Amato, R.S.; Nunn, A.J. Uranium-Series Constraints on Radionuclide Transport and Groundwater Flow at the Nopal I Uranium Deposit, Sierra Peña Blanca, Mexico. Environ. Sci. Technol. 2010, 44, 1579–1586. [Google Scholar] [CrossRef] [PubMed]
  29. Ku, T.L.; Luo, S.; Goldstein, S.J.; Murrell, M.T.; Chu, W.L.; Dobson, P.F. Modeling Non-Steady State Radioisotope Transport in the Vadose Zone—A Case Study Using Uranium Isotopes at Peña Blanca, Mexico. Geochim. Cosmochim. Acta 2009, 73, 6052–6064. [Google Scholar] [CrossRef]
  30. Pickett, D.A.; Murphy, W.M. Unsaturated Zone Waters From the Nopal I Natural Analog, Chihuahua, Mexico—Implications for Radionuclide Mobility at Yucca Mountain. MRS Proc. 1999, 556, 809. [Google Scholar] [CrossRef]
  31. Hernández-Hernández, D. Transporte y Equilibrio Radioactivo Del Uranio Desde El Yacimiento de Peña Blanca Hasta Laguna Del Cuervo, Chihuahua. Master’s Thesis, Centro de Investigación en Materiales Avanzados, Chihuahua, Mexico, 2019. [Google Scholar]
  32. Rodríguez-Guerra, Y. Transporte de Isótopos Radiactivos de La Serie Del Uranio Desde Peña Blanca Hasta Laguna Del Cuervo a Través Del Arroyo El Tigre, Chihuahua. Master’s Thesis, Centro de Investigación en Materiales Avanzados, Chihuahua, Mexico, 2023. [Google Scholar]
  33. Salas, G.; Castillo Nieto, F. Geology of Uranium Deposits in Mexico. In Economic Geology, Mexico; Geological Society of America: Boulder, CA, USA, 1991; Volume P-3, ISBN 978-0-8137-5470-3. [Google Scholar]
  34. Pérez-Reyes, V.; Cabral-Lares, R.M.; Méndez-García, C.G.; Caraveo-Castro, C.D.R.; Reyes-Cortés, I.A.; Carrillo-Flores, J.; Montero-Cabrera, M.E. Transport and Concentration of Uranium Isotopes in the Laguna Del Cuervo, Chihuahua, Mexico. Supl. Rev. Mex. Física 2022, 3, 010606-1. [Google Scholar] [CrossRef]
  35. Nash, T. Volcanogenic Uranium Deposits: Geology, Geochemical Processes, and Criteria for Resource Assessment; Open-File Report; United States Geological Survey: Reston, VA, USA, 2010. Available online: https://pubs.usgs.gov/of/2010/1001/pdf/OF10-1001.pdf (accessed on 5 September 2024).
  36. Hernández-Herrera, C.; Canche-Tello, J.; Reyes-Cortés, I.; Rodríguez-Guerra, Y.; Pérez-Reyes, V.; Faudoa-Goméz, F.; Cabral-Lares, M.; Hernández-Cruz, D.; Loredo-Portales, R.; Montero-Cabrera, M.E. Interpretación de Los Espectros de Absorción de Rayos-X Por Radiación Sincrotrón de Las Especies Minerales Uraníferas Transportadas Por El Arroyo “El Tigre”, En Peña Blanca, Chihuahua, México. In Proceedings of the LXVI Congreso Nacional de Física, Morelia, Mexico, 8–13 October 2023; Suplemento del Boletín Sociedad Mexicana de Física: Morelia, Mexico, 2023; p. 360. [Google Scholar]
  37. Kelly, S.D. Uranium Chemistry in Soils and Sediments. In Developments in Soil Science; Elsevier: Amsterdam, The Netherlands, 2010; Volume 34, pp. 411–466. ISBN 978-0-444-53261-9. [Google Scholar]
  38. Koningsberger, D.C.; Prins, R. X-ray Absorption: Principles, Applications, Techniques of EXAFS, SEXAFS and XANES; John Wiley and Sons: New York, NY, USA, 1987. Available online: https://www.osti.gov/biblio/6748791 (accessed on 3 October 2024).
  39. ISO 18400-102; Soil Quality-Sampling-Part 102: Selection and Application of Sampling Techniques. International Organization for Standardization (ISO): Geneva, Switzerland, 2017; p. 71ISBN 978 0 580 80925 5.
  40. Switzer, A.D. Measuring and Analyzing Particle Size in a Geomorphic Context. In Treatise on Geomorphology; Elsevier: Amsterdam, The Netherlands, 2013; Volume 14, pp. 224–242. ISBN 978-0-08-088522-3. [Google Scholar]
  41. Rodríguez-Carvajal, J. Recent Advances in Magnetic Structure Determination Neutron Powder Diffraction. Phys. B Phys. Condens. Matter 1993, 192, 55–69. [Google Scholar] [CrossRef]
  42. Ehiomogue, P.; Ahuchaogu, I.I.; Ahaneku, I.E. Review of adsorption isotherms models. Acta Tech. Corviniensis-Bull. Eng. 2021, 14, 87–96. [Google Scholar]
  43. Tuli, J.K. Nuclear Wallet Cards. 2011. Available online: https://www.nndc.bnl.gov/walletcards/doc/wallet-cards-large-2011-10.pdf (accessed on 1 October 2024).
  44. Tang, Y.Q.; Jarvis, K.E.; Williams, J.G. Determination of Trace Elements in 11 Chinese Geological Reference Materials by ICP-MS. Geostand. Newsl. 1992, 16, 61–70. [Google Scholar] [CrossRef]
  45. McDowell, W.J. Isotopic Uranium by PERALS; Reference SOP #AM-792.0; ORDELA, Inc.: Oak Ridge, TN, USA, 1994. [Google Scholar]
  46. del Rocío, C.-C.C.; Elena, M.-C.M.; Grisel, M.-G.C.; Aurora, M.-M.; Marusia, R.-V.; Magaly, C.-L.R. Determination of 234U and 238U Activities in Soil by Liquid Scintillation and High-Resolution Alpha Spectrometry. J. Nucl. Phys. Mater. Sci. Radiat. Appl. 2021, 8, 115–120. [Google Scholar] [CrossRef]
  47. Villalobos, R. Influencia Del Hierro En La Remoción de Uranio Por Membranas de Triacetato de Celulosa Con Carbón Activado. Ph.D. Thesis, Centro de Investigación en Materiales Avanzados, Chihuahua, Mexico, 2012. Available online: http://cimav.repositorioinstitucional.mx/jspui/handle/1004/690 (accessed on 26 September 2024).
  48. Werth, C.J.; Zhang, C.; Brusseau, M.L.; Oostrom, M.; Baumann, T. A Review of Non-Invasive Imaging Methods and Applications in Contaminant Hydrogeology Research. J. Contam. Hydrol. 2010, 113, 1–24. [Google Scholar] [CrossRef]
  49. Catalano, J.G.; Brown, G.E. Analysis of Uranyl-Bearing Phases by EXAFS Spectroscopy: Interferences, Multiple Scattering, Accuracy of Structural Parameters, and Spectral Differences. Am. Mineral. 2004, 89, 1004–1021. [Google Scholar] [CrossRef]
  50. Denecke, M.A.; Janssens, K.; Proost, K.; Rothe, J.; Noseck, U. Confocal Micrometer-Scale X-ray Fluorescence and X-Ray Absorption Fine Structure Studies of Uranium Speciation in a Tertiary Sediment from a Waste Disposal Natural Analogue Site. Environ. Sci. Technol. 2005, 39, 2049–2058. [Google Scholar] [CrossRef]
  51. Bargar, J.R.; Williams, K.H.; Campbell, K.M.; Long, P.E.; Stubbs, J.E.; Suvorova, E.I.; Lezama-Pacheco, J.S.; Alessi, D.S.; Stylo, M.; Webb, S.M.; et al. Uranium Redox Transition Pathways in Acetate-Amended Sediments. Proc. Natl. Acad. Sci. USA 2013, 110, 4506–4511. [Google Scholar] [CrossRef]
  52. Bone, S.E.; Dynes, J.J.; Cliff, J.; Bargar, J.R. Uranium (IV) Adsorption by Natural Organic Matter in Anoxic Sediments. Proc. Natl. Acad. Sci. USA 2017, 114, 711–716. [Google Scholar] [CrossRef]
  53. Diaz-Moreno, S.; Hayama, S.; Amboage, M.; Freeman, A.; Sutter, J.; Duller, G. I20; the Versatile X-Ray Absorption Spectroscopy Beamline at Diamond Light Source. J. Phys. Conf. Ser. 2009, 190, 012038. [Google Scholar] [CrossRef]
  54. Faudoa, F. Modelo de La Evolución de Las Especies Minerales Superficiales de Uranio de La Sierra Peña Blanca, Chihuahua, México. Master’s Thesis, Centro de Investigación en Materiales Avanzados, Chihuahua, Mexico, 2023. [Google Scholar]
  55. Dent, A.J.; Cibin, G.; Ramos, S.; Smith, A.D.; Scott, S.M.; Varandas, L.; Pearson, M.R.; Krumpa, N.A.; Jones, C.P.; Robbins, P.E. B18: A Core XAS Spectroscopy Beamline for Diamond. J. Phys. Conf. Ser. 2009, 190, 012039. [Google Scholar] [CrossRef]
  56. Ravel, B.; Newville, M. ATHENA, ARTEMIS, HEPHAESTUS: Data Analysis for X-ray Absorption Spectroscopy Using IFEFFIT. J. Synchrotron Radiat. 2005, 12, 537–541. [Google Scholar] [CrossRef]
  57. Reyes-Cortés, M.; Fuentes-Cobas, L.; Torres-Moye, E.; Esparza-Ponce, H.; Montero-Cabrera, M.E. Uranium Minerals from the San Marcos District, Chihuahua, Mexico. Mineral. Petrol. 2010, 99, 121–132. [Google Scholar] [CrossRef]
  58. XAS Database (XASDB). Canadian Light Source. 2024. Available online: http://xasdb.lightsource.ca (accessed on 26 September 2024).
  59. Cárdenas-Flores, D. Volcanic Stratigraphy and U-Mo Mineralization of the Sierra de Peña District, Chihuahua, Mexico. In Uranium Deposits in Volcanic Rocks, Proceedings of a Technical Committee Meeting on Uranium Deposits in Volcanic Rocks, El Paso, TX, USA, 2–5 April 1984; IAEA: Vienna, Austria, 1985; pp. 125–136. [Google Scholar]
  60. Adamson, A. A Textbook of Physical Chemistry; Elsevier: Amsterdam, The Netherlands, 2012; ISBN 978-0-12-044262-1. [Google Scholar]
  61. Gao, X.; Bi, M.; Shi, K.; Chai, Z.; Wu, W. Sorption Characteristic of Uranium(VI) Ion onto K-Feldspar. Appl. Radiat. Isot. 2017, 128, 311–317. [Google Scholar] [CrossRef] [PubMed]
  62. Davis, J.A.; Meece, D.E.; Kohler, M.; Curtis, G.P. Approaches to Surface Complexation Modeling of Uranium(VI) Adsorption on Aquifer Sediments. Geochim. Cosmochim. Acta 2004, 68, 3621–3641. [Google Scholar] [CrossRef]
  63. Baqer, Y.; Thornton, S.; Stewart, D.I.; Norris, S.; Chen, X. Analysis of Uranium Sorption in a Laboratory Column Experiment Using a Reactive Transport and Surface Complexation Model. Transp. Porous Media 2023, 149, 423–452. [Google Scholar] [CrossRef]
  64. Fuller, A.J.; Leary, P.; Gray, N.D.; Davies, H.S.; Mosselmans, J.F.W.; Cox, F.; Robinson, C.H.; Pittman, J.K.; McCann, C.M.; Muir, M.; et al. Organic Complexation of U(VI) in Reducing Soils at a Natural Analogue Site: Implications for Uranium Transport. Chemosphere 2020, 254, 126859. [Google Scholar] [CrossRef] [PubMed]
  65. Bès, R.; Rivenet, M.; Solari, P.-L.; Kvashnina, K.O.; Scheinost, A.C.; Martin, P.M. Use of HERFD–XANES at the U L3- and M4-Edges To Determine the Uranium Valence State on [Ni(H2O)4]3[U(OH,H2O)(UO2)8O12(OH)3]. Inorg. Chem. 2016, 55, 4260–4270. [Google Scholar] [CrossRef] [PubMed]
  66. Joseph, D.; Nayak, C.; Babu, P.V.; Jha, S.N.; Bhattacharyya, D. Chemical Shift of U L3 Edges in Different Uranium Compounds Obtained by X-Ray Absorption Spectroscopy with Synchrotron Radiation. Bull. Mater. Sci. 2014, 37, 643–647. [Google Scholar] [CrossRef]
  67. Ginderow, D. Structure de l’uranophane alpha, Ca(UO2)2(SiO3OH)2.5H2O. Acta Crystallogr. Sect. C Cryst. Struct. Commun. 1988, 44, 421–424. [Google Scholar] [CrossRef]
  68. Refaei, H.; Rabea, F.; Elnona, M.; Morci, A. Sorption of Uranium on Some Natural Modified Clay Mineral Deposits. Arab. Univ. J. Agric. Sci. 2019, 27, 2329–2340. [Google Scholar] [CrossRef]
  69. Slukovskii, Z.I.; Guzeva, A.V.; Dauvalter, V.A.; Udachin, V.N.; Denisov, D.B. Uranium Anomalies in Recent Sediments of Lakes from the Northern Part of the Murmansk Region, Arctic. Geochem. Int. 2020, 58, 1374–1378. [Google Scholar] [CrossRef]
  70. Carvalho, F.P.; Oliveira, J.M.; Lopes, I.; Batista, A. Radionuclides from Past Uranium Mining in Rivers of Portugal. J. Environ. Radioact. 2007, 98, 298–314. [Google Scholar] [CrossRef]
  71. Pérez-Reyes, V. Estudio de La Distribución de Uranio Proveniente Del Yacimiento de Peña Blanca En La Laguna Del Cuervo. Master’s Thesis, Centro de Investigación en Materiales Avanzados, Chihuahua, Mexico, 2020. [Google Scholar]
  72. Shang, J.; Liu, C.; Wang, Z.; Zachara, J.M. Effect of Grain Size on Uranium (VI) Surface Complexation Kinetics and Adsorption Additivity. Environ. Sci. Technol. 2011, 45, 6025–6031. [Google Scholar] [CrossRef]
  73. Shuey, C.; Taylor, L.; Siskin, J. Church Rock Revisited: The Tailings Spill Three Years Later. Mine Talk 1982, 2, 7–26. Available online: http://sric.org/churchrock/Church%20Rock_Mine%20Talk_1982_64.pdf (accessed on 1 October 2024).
  74. Soil Survey Staf Kellogg Soil Survey Laboratory Methods Manual. Soil Survey Investigations Report No. 42, Version 6.0. 2022. Available online: https://www.nrcs.usda.gov/sites/default/files/2023-01/SSIR42.pdf (accessed on 26 September 2024).
  75. Nimmo, J.R. Porosity and Pore Size Distribution. Encycl. Soils Environ. 2004, 3, 295–303. [Google Scholar] [CrossRef]
  76. Reich, T.; Drebert, J.; Boulyga, S. EXAFS Study of Uranium (VI) Sorption on Kaolinite; Speciation Techniques and Facilities for Radioactive Materials at Synchrotron Light Sources; Organization for Economic Cooperation and Development (OECD): Berkeley, CA, USA, 2004; pp. 61–67. [Google Scholar]
  77. Thompson, H.A.; Parks, G.A.; Brown, G.E. Spectroscopic Studies of U(VI) Sorption at the Kaolinite-Water Interface LANL Grant 9-X42-6947E-1; Los Alamos National Lab: Los Alamos, NM, USA, 1994. [Google Scholar] [CrossRef]
Figure 1. Location of the study area and sampling points at SPB.
Applsci 15 00609 g001
Figure 2. Schematic diagram of eastern section of Boca La Colorada stream alluvial fan.
Applsci 15 00609 g002
Figure 3. (A) Scheme UN experiment; (B) Scheme URP experiment; yellow color represents the horizon of uraniferous minerals; (C) Photograph of packed columns. All the columns were packed with the granulometries described above; the arrow shows the flow of the feed solutions.
Applsci 15 00609 g003
Figure 4. Backscattered electron images of fractions (C) FSD, (D) CSC, (E) FSC before experiments. After the experiment’s conclusion, secondary electron images of fractions (A) C1, (B) CS, (F) C2, and (G) FS were obtained from UN6.
Applsci 15 00609 g004
Figure 5. Adsorption isotherms for U(VI) at pH = 5 (A) and pH = 7 (B).
Applsci 15 00609 g005
Figure 6. SEM backscattered electron micrographs at 1000× magnification showing (A) U(VI) adsorption (C0 = 120 mg·L−1) at pH = 5; and (B) U(VI) adsorption (C0 = 120 mg·L−1) at pH = 7.
Applsci 15 00609 g006
Figure 7. Computer tomography images, showing the raw image (left side) and the probability of the material’s occurrence as a function of density for the distribution distance in the column profile (right side). (A) In sample URP6FSD, the highest concentration of particles is observed between 10 and 55 mm, showing a coincidence with the uranophane horizon. (B) For sample URP12FSD, the particle concentration is shown with a greater dispersion, up to 110 mm, which indicates the mobility of the particulate mineral of uranophane in the direction of the flow of distilled water (solution). In raw images, colors are according to the particle size; fine particles are in red, and coarse particles are in green and black colors. UV and visible light photography corroborate the particle-dragging behavior (see Appendix B.3, Figure B9).
Applsci 15 00609 g007
Figure 8. 5 XANES spectra for UO2 (gray line), UN6CSC (red line), URP6FSC (blue line), URP6CSC (green line), and UN6FSC (wine line).
Applsci 15 00609 g008
Figure 9. Left: (A) the Fourier transforms in radial distribution function, (B) k3-weighted spectra of experimental (black solid line) and fitted (blue solid line with crossed) for U L3 EXAFS, and (C) linear combination fitting for URP6CSC. Right: (D) the Fourier transforms in radial distribution function, (E) k3-weighted spectra of experimental (black solid line) and fitted (blue solid line with crossed) for U L3 EXAFS, and (F) linear combination fitting for URP6FSC.
Applsci 15 00609 g009
Table 1. Joint description of the simulation experiments on the transport of uranium by surface water.
ID ColumnExperimentCarrier SolutionRetention Time (Months)
UN6Exploration of adsorption of dissolved uranium by sediments.(569 mgU L−1)6
UN1212
URP6Exploration of mineral transport through sediments.Distilled water6
URP1212
Table 2. Generic identification of each sedimentary fraction. The background colors of the table rows correspond to coarse silt and clay (CSC) and fine silt and clay (FSC) sediments, respectively. These colors are maintained throughout the tables.
Sediment SampleID Name
Fine sandFSD
Coarse silt + clayCSC
Fine silt + clayFSC
Coarse siltCS
Fine siltFS
Clay from CSCC1
Clay from FSCC2
Table 3. Phase analysis of the mineral based on data obtained by XRD.
SampleMineral Phase (%)
QuartzCalciteAlbiteAnorthiteSanidineHematiteNatroliteKaoliniteMontmorilloniteUranophaneWeeksite
Sand a42.27.6-13.525-7.14.6LOD--
Silt b36-16-44.32-2.1LOD--
Clay b14.6-20-24.16.3-34.4<1--
Uranium mineral b 84
a [31]; b present work, LOD = below detection limit.
Table 4. The Langmuir and Freundlich isotherm parameters for U(VI) adsorbed on sediments at two different pH values.
pHLangmuir ConstantsFreundlich Constants
Qm/mg·kg−1KL/L·mg−1R2KF/(mg·g−1) (L·mg−1)1/n1/nR2
5.044.8 × 1030.200.9413.40.300.59
7.09.7 × 1030.040.2220.5−0.26 0.17
Table 5. U activity concentration in solid samples and the supernatant solution * of UN6 column.
UN6
Sample TypeID
Sample
234U (Bq kg−1)238U (Bq kg−1)RQ (%)238U mg kg−1
SolidUN6CSC641 ± 171015 ± 269082
UN6FSC101 ± 1171 ± 2X14
UN6CS364 ± 7796 ± 138264
UN6FS50 ± 1109 ± 2679
UN6C1742 ± 151573 ± 2994127
UN6C2189 ± 3329 ± 59327
Supernatant solution 234U (Bq L−1)238U (Bq L−1)RQ (%)238U mg L−1
WUN6CSC0.96 ± 0.032.07 ± 0.05 780.17
WUN6FSC0.086 ± 0.0030.18 ±0.01580.014
* The uncertainty of the supernatant solution experiments is approximately 15%, see Appendix A.1.
Table 6. U activity concentration in solid samples and the supernatant solutions * of the UN12 column.
UN12
Sample TypeID Sample234U Bq kg−1238U Bq kg−1RQ (%)238U mg kg−1
SolidUN12CSC1104 ± 212269 ± 4090184
UN12FSC803 ± 171532 ± 3085124
UN12CS1151 ± 212222 ± 3774180
UN12FS811 ± 161810 ± 3298147
UN12C11816 ± 253736 ± 4880303
UN12C21148 ± 222149 ± 3992174
Supernatant
solution
234U Bq L−1238U Bq L−1RQ (%)238U mg L−1
WUN12CSC4.5 ± 0.18.9 ± 0.2580.72
WUN12FSC2.68 ± 0.045.5 ± 0.1X0.45
* The uncertainty of the supernatant solution experiments is approximately 15%, see Appendix A.1.
Table 7. U activity concentration in solids samples and the supernatant solutions * of the URP6 column.
URP6
Sample TypeID Sample234U Bq kg−1238U Bq kg−1RQ (%)238U mg kg−1
SolidURP6CSC1058 ± 211124 ± 227891
URP6FSC918 ± 9865 ± 9X70
URP6CS782 ± 17772 ± 177863
URP6FS620 ± 14628 ± 148151
URP6C11324 ± 241362 ± 25100110
URP6C21304 ± 231272 ± 2379103
Supernatant
solution
234U Bq L−1238U Bq L−1RQ (%)238U mg L−1
WURP6CSC1.19 ± 0.011.29 ± 0.01X0.10
WURP6FSC1.30 ± 0.011.41 ± 0.02X0.11
* The uncertainty of the supernatant solution experiments is approximately 15%, see Appendix A.1.
Table 8. U activity concentration in solids samples and the supernatant solutions * of URP12 column.
URP12
Sample TypeID Sample234U Bq kg−1238U Bq kg−1RQ (%)238U mg kg−1
SolidURP12CSC234 ± 3244 ± 3X20
URP12FSC79 ± 182 ± 1X7
URP12CS253 ± 4305 ± 57825
URP12FS95 ± 299 ± 2818
URP12C1464 ± 7451 ± 79837
URP12C2169 ± 3172 ± 39414
Supernatant
solution
234U Bq L−1238U Bq L−1 238U mg L−1
WURP12CSC0.46 ± 0.010.58 ± 0.01800.05
WURP12FSC0.33 ± 0.0050.43 ± 0.01X0.03
* The uncertainty of the supernatant solution experiments is approximately 15%, see Appendix A.1.
Table 9. Best fit parameters of EXAFS U L3 spectra for URP6CSC (Independent points = 18.09; number of variables = 12; obtained R-factor = 0.0039) and URP6FSC (Independent points = 18.09; number of variables = 11; obtained R-factor = 0.0196).
URP6CSC
NameNS02σ22)E0 (eV)ΔRReff (Å)Reff + ΔR (Å)
U_Oax21.6 ± 0.30.006 (1)7.4 ± 2.70.000 ± 0.0091.80451.805
U_Oeq111.6 ± 0.30.017 (6)7.4 ± 2.7−0.04 ± 0.022.24112.20
U_Oeq221.6 ± 0.30.017 (6)7.4 ± 2.7−0.04 ± 0.022.29522.26
U_Oeq321.6 ± 0.30.004 (1)7.4 ± 2.7−0.022 ± 0.0132.44982.428
U_Si11.6 ± 0.30.009 (3)7.4 ± 2.70.05 ± 0.033.14443.19
URP6FSC
U_Oax21.350.006 (1)9.6 ± 2.20.019 ± 0.0091.80451.824
U_Oeq111.350.039 (6)9.6 ± 2.2−0.003 ± 0.052.24112.24
U_Oeq221.350.039 (6)9.6 ± 2.2−0.003 ± 0.052.29522.29
U_Oeq321.350.003 (1)9.6 ± 2.20.006 ± 0.0132.44982.456
U_Si11.350.006 (4)9.6 ± 2.20.06 ± 0.033.14443.21
Table 10. U Concentration in Clays C1 and C2 from UN and URP Experiments.
ExperimentU Conc. (mg kg−1)Distinctiveness, Singularity, Evidence
Batch44.8 × 103Upper limit
Mud “M2”141Maximum value at the study site a
UN6C1127Initial transport and adsorption in CSC
UN6C227Initial transport and adsorption in FSC
UN12C1303Maximum value of adsorption in CSC
UN12C2174Maximum value of adsorption in FSC
Tomography
URP6C1110Mineral particles close to the horizon. Dispersion up to 55 mm
URP6C2103
URP12C137Mineral particles are dispersed by liquid flow. Dispersion up to 110 mm
URP12C214
a [34].
Disclaimer/Publisher’s Note: The statements, opinions and data contained in all publications are solely those of the individual author(s) and contributor(s) and not of MDPI and/or the editor(s). MDPI and/or the editor(s) disclaim responsibility for any injury to people or property resulting from any ideas, methods, instructions or products referred to in the content.