Abstract
Drowsy driving contributes to over 6000 fatal incidents annually in the US, underscoring the need for effective, non-intrusive drowsiness detection. This study seeks to address detection challenges, particularly in non-standard head positions. Our innovative approach leverages computer vision by combining facial feature detection using Dlib, head pose estimation with the HOPEnet model, and analyses of the percentage of eyelid closure over time (PERCLOS) and the percentage of mouth opening over time (POM). These are integrated with traditional machine learning models, such as Support Vector Machines, Random Forests, and XGBoost. These models were chosen for their ability to process detailed information from facial landmarks, head poses, PERCLOS, and POM. They achieved a high overall accuracy of 86.848% in detecting drowsiness, with a small overall model size of 5.05 MB and increased computational efficiency. The models were trained on the National Tsing Hua University Driver Drowsiness Detection Dataset, making them highly suitable for devices with a limited computational capacity. Compared to the baseline model from the literature, which achieved an accuracy of 84.82% and a larger overall model size of 37.82 MB, the method proposed in this research shows a notable improvement in the efficiency of the model with relatively similar accuracy. These findings provide a framework for future studies, potentially improving sleepiness detection systems and ultimately saving lives by enhancing road safety.
1. Introduction
Considering the dangers caused by drowsy driving, there is a need for a drowsiness detection system to be developed. This study aims to improve existing approaches by using computer vision to detect drowsiness with higher accuracy and smaller model size. The dataset retrieved from the National Tsing Hua University was used to create handcrafted features, combining head pose estimation using HOPEnet and facial landmark detection using Dlib to calculate the percentage of eyelid closure over time (PERCLOS) and the percentage of mouth opening over time (POM).
Currently, several solutions have been applied in the market, such as the Attention Assist from Mercedes-Benz [1] and other devices based on reactive tests [2,3]; however, these solutions have drawbacks. Most experts agree that visual techniques are best for drowsiness detection, as they are considered non-intrusive and have proven hardware [4]. In addition, various techniques have been developed from existing research, ranging from simple computer vision eye blinking monitoring [5] to the use of artificial neural networks [6], and now to the use of deep learning [7,8,9], specifically the use of Convolutional Neural Networks (CNN) [2,10,11,12,13,14]. More on the previous techniques performed can be seen in Table 1, which showcases a summary of the literature review that has been conducted.

Table 1.
Summary of the literature review.
Statistics show that drowsy driving causes over 6000 fatal incidents annually in the US [26]. In fact, 24% of drivers have admitted to fatigued driving at least once per 30 days [27]. In addition, based on Ref. [5], 2% of fatal crashes are caused by drowsy driving. There are several causes of drowsy driving, such as sleep deprivation, the impact of medications, the effects of stress, irregular sleep patterns, and even specific medical disorders [26]. Usually, the key symptoms of drowsiness are caused by fatigue, although it may range from subtle mood swings to signs of illness [28]. Furthermore, drowsiness impairs the focus and attention of a driver, putting them in a dangerous situation that may result in a fatal accident [29]. In fact, drowsy driving is often linked to drunk driving because they share similar effects on individuals [30].
Various strategies for detecting drowsiness have been researched, and Ref. [4] categorized these into four categories: subjective, psychological, vehicular, and visual. A study has also attempted to use a hybrid approach of the four categories [31]. Among these, visual techniques have emerged as non-intrusive, have proven hardware, and are user-friendly, although they struggle with certain lighting conditions and backgrounds. As a solution, hybrid computer vision techniques stand out, offering both accuracy and non-intrusiveness. Ref. [15] showcased a model leveraging CNN, specifically a D2CNN-FLD model, centered on facial landmark detection that was trained using the National Tsing Hua University Driver Drowsiness Detection Dataset (NTHU-DDD), and was able to achieve over 83% accuracy. However, poor lighting conditions remained an issue that affected the model’s performance [15].
Deng et al. [16] ushered in an innovative cloud-based processing approach. Here, the data underwent a sequence of operations: face tracking, recognition of facial regions, and classification of the driver’s fatigue state. This model was then trained using the CelebA and YawDD datasets, which achieved an accuracy of 92% [16]. Ref. [14] used a depth-cascading Multitasking CNN (MTCNN) for face detection to use the facial features for an EM-CNN to analyze the states of the eyes and mouth, which was able to achieve an accuracy of 93.623% by using Biteda’s dataset, containing 4000 driver images [14]. Furthermore, research by Ref. [17] used the Circular Hough Transform after face detection with Viola–Jones to obtain PERCLOS [17]. It shows promising results; however, it struggles when faces are turned sideways owing to the constraints of the Viola–Jones method [32]. In addition, Ref. [2] obtained a 96.42% accuracy using Deep Learning with the Viola–Jones method followed by a stacked Deep Convolutional Neural Network (DCNN). This approach was trained using a proprietary dataset encompassing 2850 images [2].
Other techniques, such as those in Ref. [11], used a DCNN along with a Random Forest classifier on the iBUG 300 W dataset and achieved an accuracy of 99%. Furthermore, Refs. [18,19] proved its beneficiality in a resource-constrained context using heuristic-based eye region positioning and pixel-level classification techniques, respectively [18]. Using the NTHU-DDD Video Dataset and lightweight U-net architecture, the latter obtained an accuracy of 96.72% [19]. In fact, Ref. [20] performed fatigue detection using a visual characteristic analysis using yawn, sleepiness, and head pose. In addition, Ref. [21] and [33] suggested methods for using eye mechanics, analyzing the binary conversion of images [21] and pupillary light reflexes [33]. Finally, Refs. [12,22] provided fresh perspectives with a temporal network that achieved 84.82% accuracy [12] and a Residual Channel Attention Network (RCAN) that successfully distinguished eye and mouth states with an accuracy of approximately 98.5% [22].
Drowsiness detection technologies have evolved significantly, but they continue to face challenges such as variable lighting conditions, complex backgrounds, and limitations in detecting extreme head poses owing to reliance on traditional methods such as the Viola–Jones face detection method. More recent studies, such as those employing HOG descriptors and PCA by Ref. [23], which achieved 90% accuracy, and Ref. [24], reaching 85.62% accuracy with improved HOG features for a Naïve Bayes classifier, indicate ongoing improvements. Furthermore, Ref. [25] utilized an ensemble deep learning architecture with InceptionV3 modules to achieve impressive accuracies of 99.65% (training) and 97.1% (testing). Despite these advancements, there remains a need for an effective solution for challenging detection conditions.
This study aims to improve the issues from extreme head poses as well as efficiently perform drowsiness detection to be implemented on low computational devices such as a Jetson Nano (NVIDIA, Santa Clara, CA, USA). This is achieved by implementing handcrafted feature extraction using Dlib to perform face and landmark detection. The landmarks obtained are then frontalized and used to perform calculations of pairwise differences on each region of the face, along with PERCLOS and POM. In addition, the landmarks are used in parallel with the head pose estimation retrieved from the HOPEnet model. These features can then be used to perform classification using traditional machine learning models such as Support Vector Machines (SVM), Random Forest, and XGBoost (ver. 1.6.2). Classification is first performed on each region (head, eye, and mouth), and the results are then fed into another model for drowsiness classification. This method aims to provide a more efficient and lightweight model that enhances the practicality and applicability of drowsiness detection in real-world scenarios.
This paper is structured into several sections, starting with an introduction that highlights the significance of drowsy driving and the need for effective detection systems. The materials and methods section details the dataset used, the proposed method for drowsiness detection, and the evaluation metrics and scenarios. The results section presents the findings of Exploratory Data Analysis (EDA), handcrafted feature extraction, and the performance of different classifiers. A discussion section then compares these results with those of previous studies, addresses limitations, and suggests future research directions. Finally, the conclusions summarize the key findings and contributions of this study.
2. Materials and Methods
2.1. Dataset
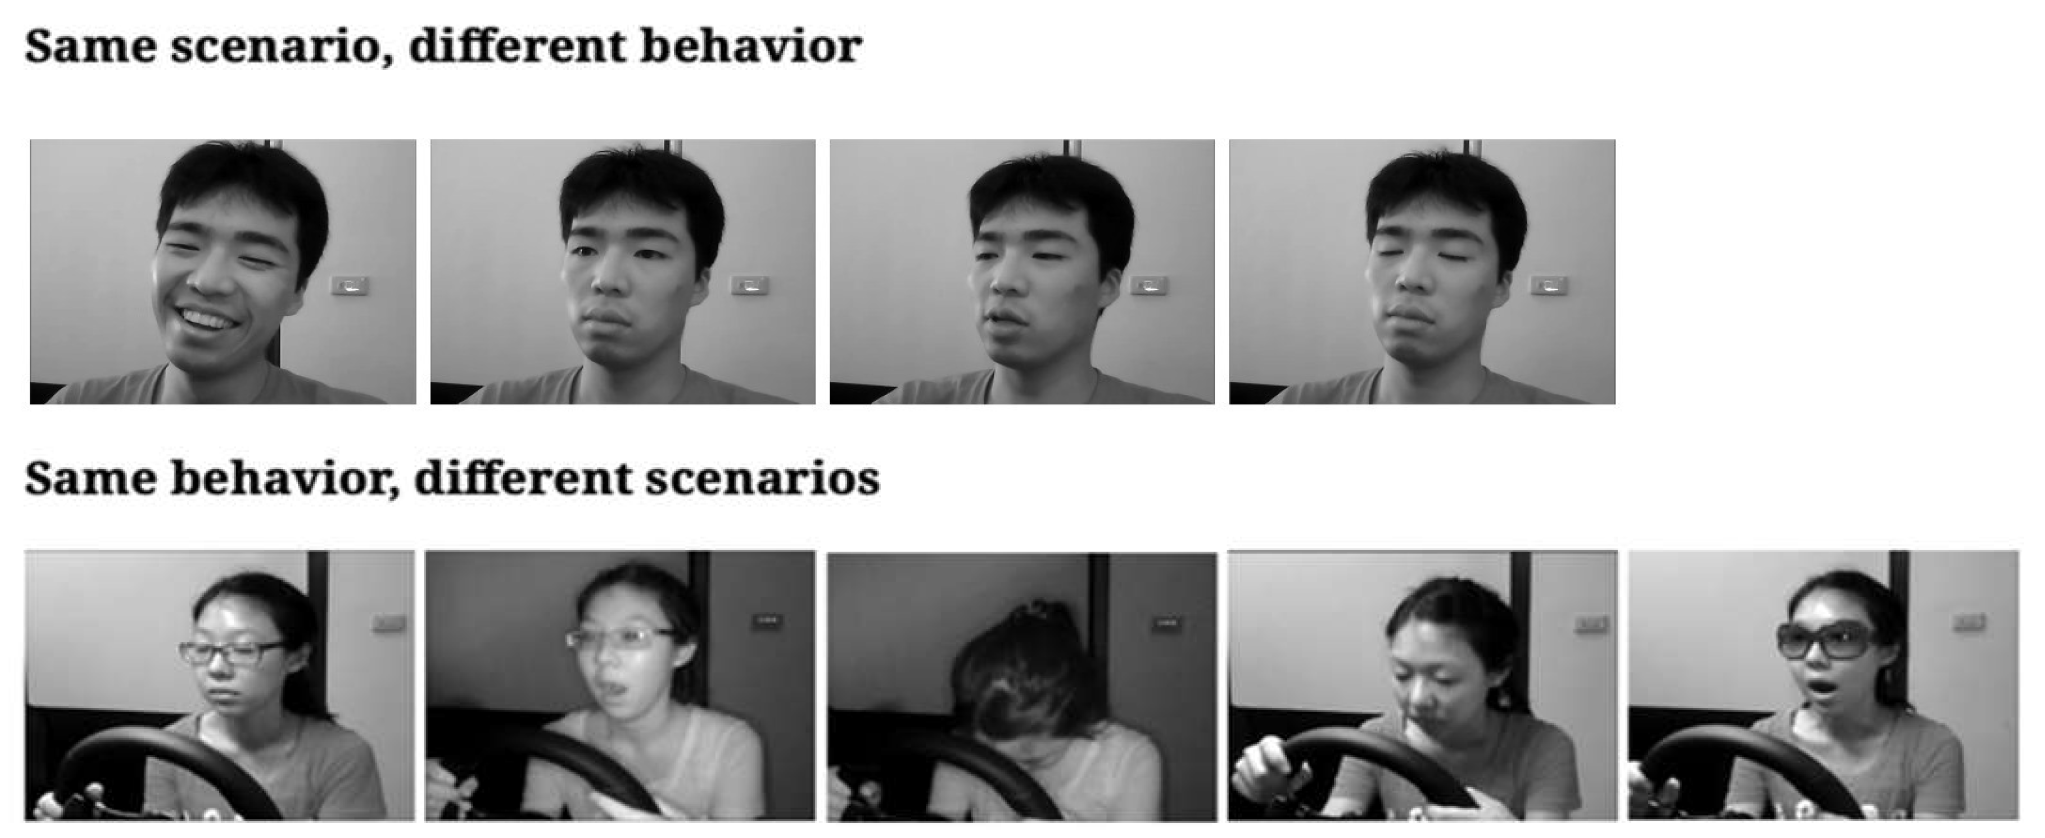
NTHU-DDD is used, which contains 9.5 h of footage from 36 diverse individuals participating in a driving simulation as shown in Figure 1 [12]. The dataset shows five distinct scenarios: three during daylight (barefaced, with sunglasses, and with glasses), and two at night (bare-faced and with glasses). This footage, captured using an IR camera in AVI format with a resolution of 640 × 480 pixels, showcases various driver behaviors, such as yawning, nodding, and laughing. The training dataset was organized into 18 folders, each representing the five scenarios, and further categorized by four driver conditions. Annotations for drowsiness, head movement, and mouth and eye conditions are provided. Additionally, an evaluation dataset and function compatible with MATLAB R.2024A and C++ are provided to assess drowsiness detection accuracy. Before any analysis, individual video frames were extracted and annotated using the provided text files.

Figure 1.
Example images from NTHU-DDD.
First, the dataset is prepared by organizing the dataset paths into lists and categorizing them into training, evaluation, and test segments. Using the OpenCV library, each video was broken down frame-by-frame, and annotations for each frame were extracted. These annotations, which include drowsiness and head, eye, and mouth conditions, were read from separate files and then merged based on the subject, scenario, condition, and frame number. After consolidating all the annotations and images into a single Pandas DataFrame, the data were exported into three CSV files: train.csv, eval.csv, and test.csv. This dataset is subsequently processed for face detection, facial landmark detection, landmark frontalization, calculations of PERCLOS and POM, and head pose estimation.
2.2. Proposed Method
The proposed method enhances driver drowsiness detection using computer vision by integrating face detection and efficient machine learning models. A comprehensive series of interconnected modules was utilized, specifically tailored to address the dynamic and unpredictable nature of drowsy driving indicators, employing traditional machine learning techniques and feature analysis for the robust, real-time identification of drowsiness.
By transitioning to the practical application of these techniques, by performing training on the NTHU-DDD dataset and hyperparameter tuning, the system can analyze real-time webcam footage taken from a generic webcam with a resolution of 720 p and 30 fps. The footage from the webcam is then preprocessed by first extracting each frame, then performing face detection, facial landmark detection, landmark frontalization, calculation of PERCLOS and POM, and head and pose estimation in real time on a low computational device such as a Jetson Nano Developer Kit. These features are then fed into finely tuned models to enable the real-time assessment of drowsiness detection by a driver.
Building on this foundation, the proposed method is suitable for simpler machine learning models, namely, SVM, Random Forest, and XGBoost. These models were chosen to reduce the complexity of the models, which in turn keeps the model smaller, similar to those implemented in Refs. [11,12]. These models are adept at processing detailed data extracted from facial landmarks and head pose analyses. Utilizing features such as the degree of eye and mouth openings, as well as head pose angles and metrics such as PERCLOS and POM, the models effectively classified the state of driver drowsiness. The proposed method offers a balance between computational efficiency and accuracy for use in real-time applications on limited resources, such as the Jetson Nano.
In addition to simple machine learning models, SVM and Random Forest are examples of models used in Ref. [12]. Moreover, XGBoost was used because the data derived from the implemented feature extraction are numerical, unlike other studies where image data are inputted into the model. This research uses numerical values derived from frontalized facial landmarks, pairwise differences of landmarks, and metrics such as PERCLOS, POM, and head pose. The use of these data allows for a more flexible machine-learning approach for drowsiness detection.
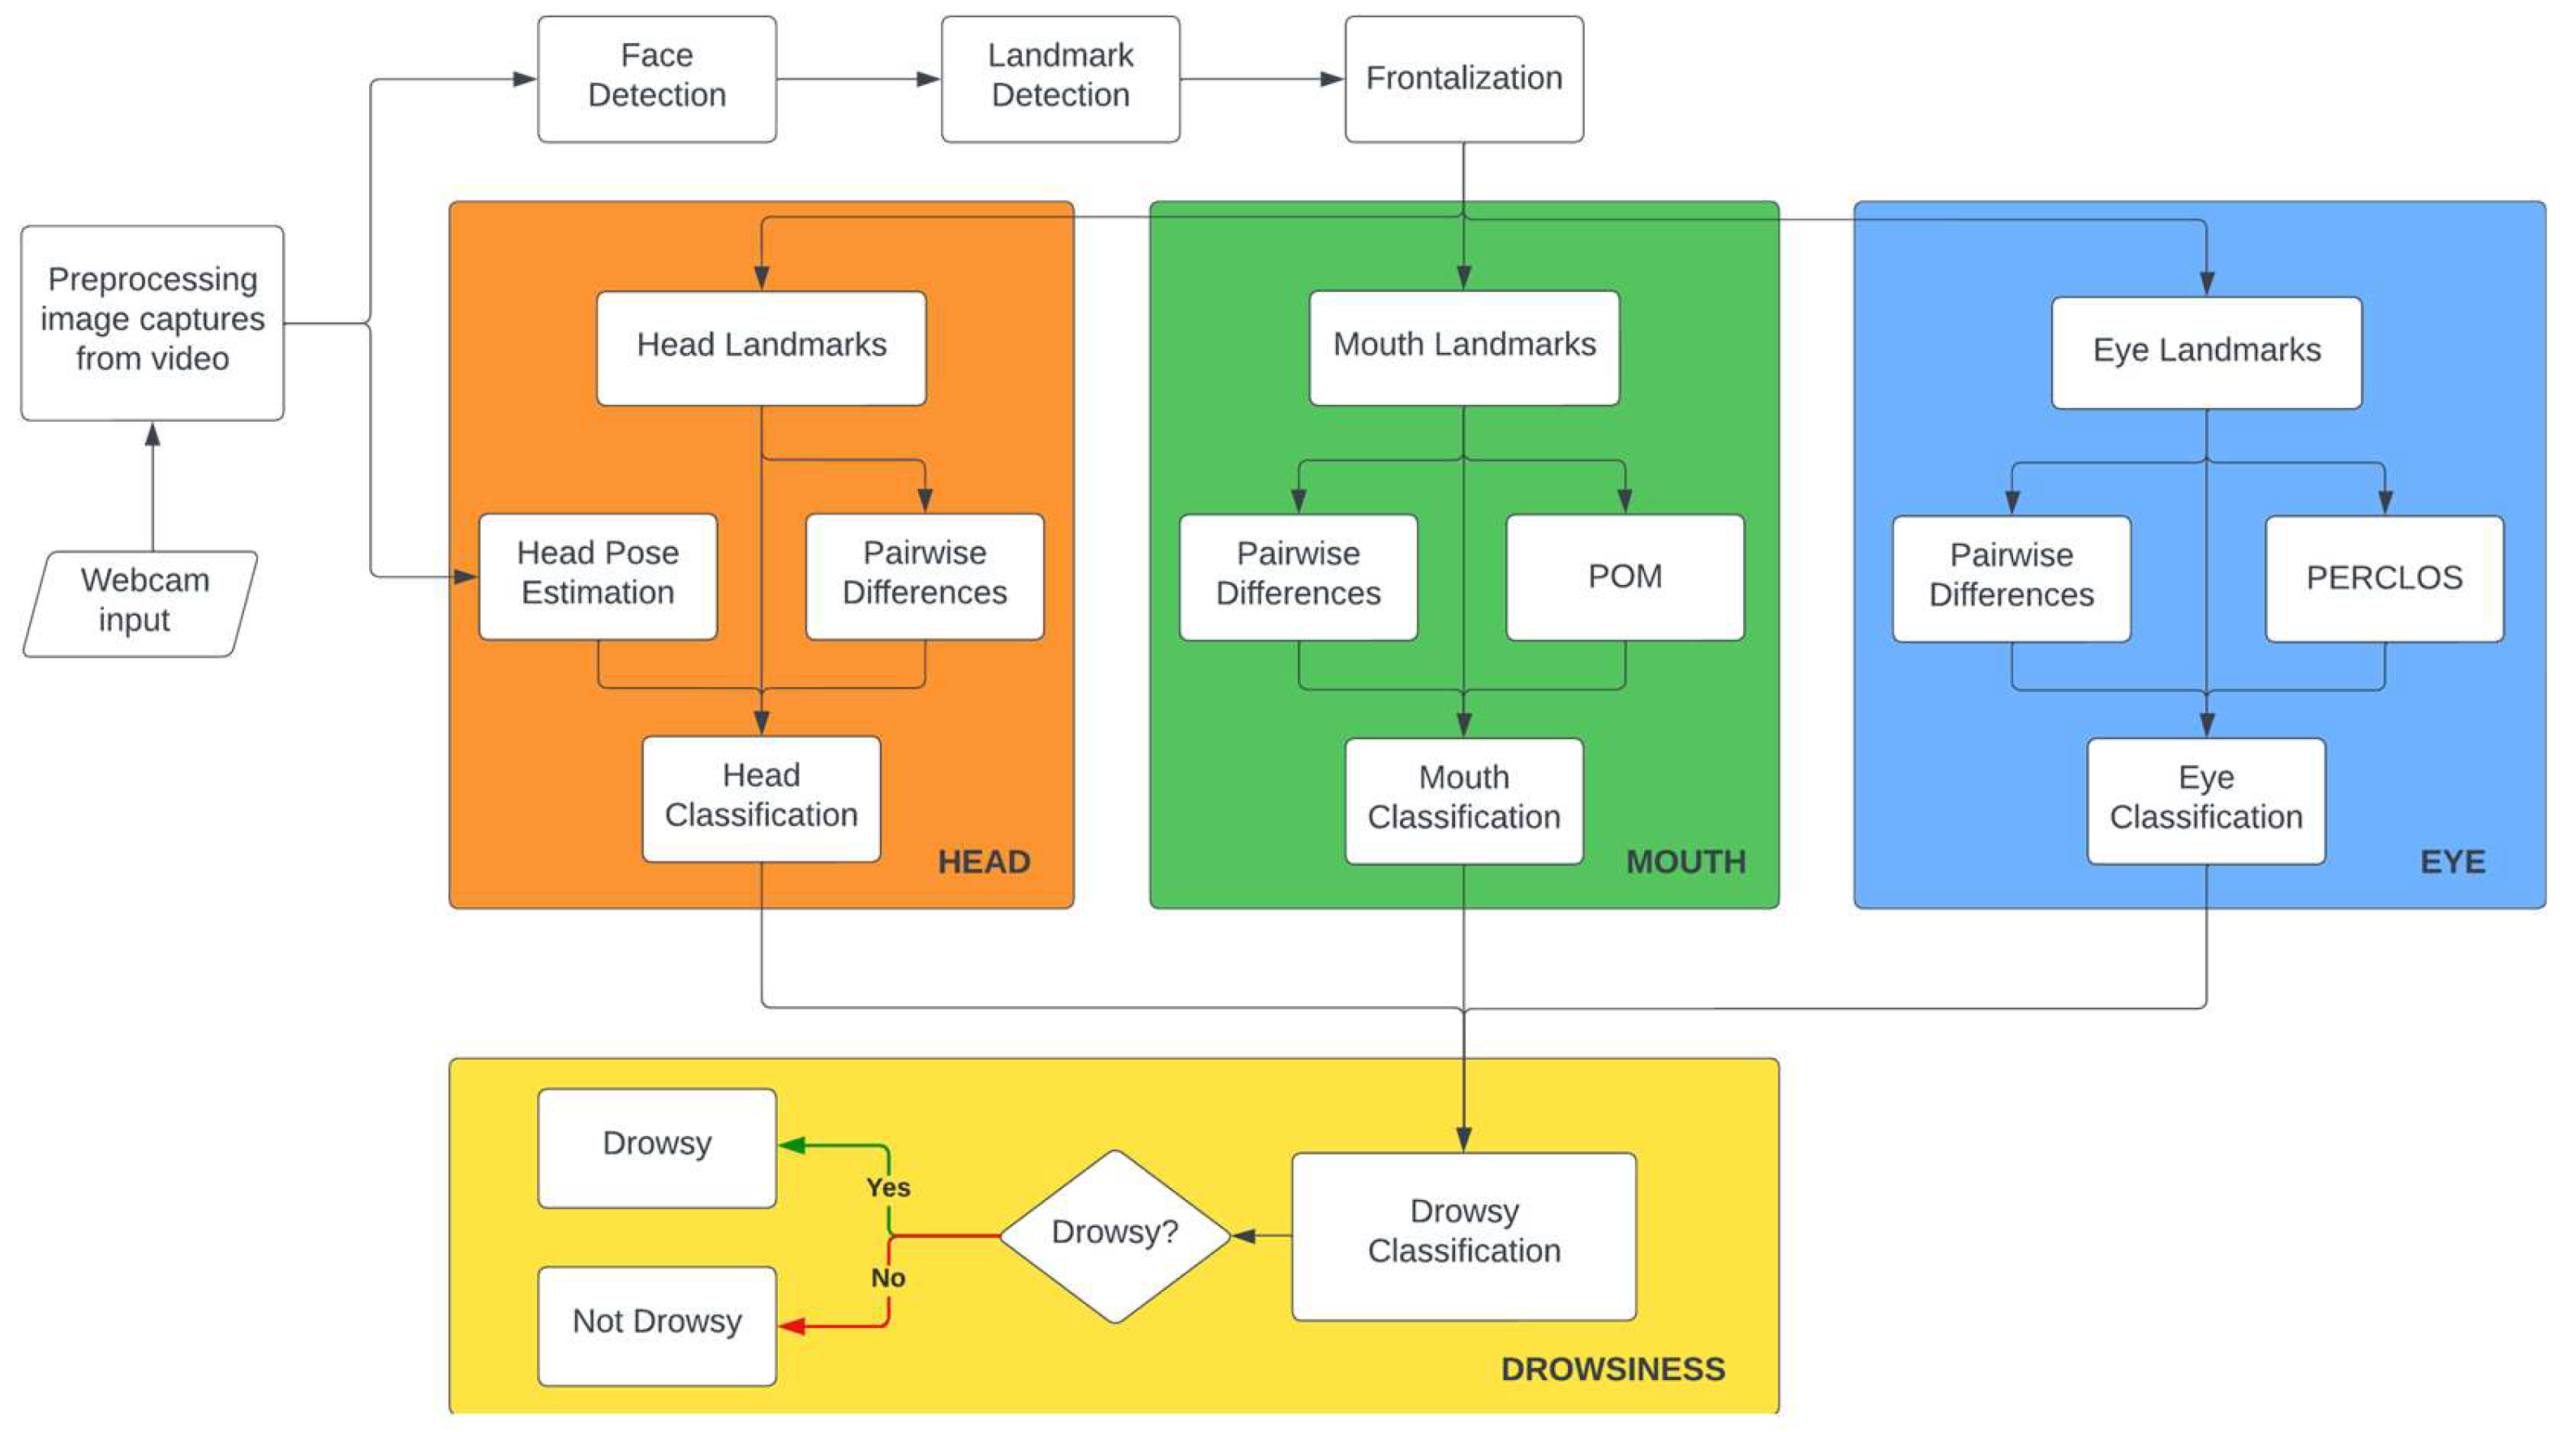
Furthermore, the detected features were first fed into multiple models for each facial area. Features related to the eye are fed into a model to detect the status of the eyes according to whether the eyes are sleepy or not. Features related to the mouth are fed into another model to detect the status of the mouth—if the mouth is yawning, still, or talking—and another model is fed features related to the head to detect whether the head is still nodding or looking to the side. From the results of these three trained models, the predictions will then be fed into another model to perform the classification of drowsy or non-drowsy. This is shown in the flowchart in Figure 2.

Figure 2.
Proposed method flowchart.
2.2.1. Face Detection, Landmark Detection, and Frontalization
First, face detection is required to locate and size human faces in images [34,35]. Most studies use the Viola–Jones algorithm to perform face detection [36]; however, it cannot detect the top and bottom points of the eyelids and the top and bottom inner lips of the mouth. The proposed method uses Dlib, a robust frontal face detector capable of out-putting 68 facial landmarks based on a Histogram of Oriented Gradients (HOG) alongside a linear SVM classifier. These landmarks are crucial to obtaining the key points in the human face that make each individual different [37], as facial components and contours differ from one person to another [38]. These landmarks were used to calculate the eye and mouth openings by measuring the distance between specific landmark points. The distances are then used to compute PERCLOS and POM. Furthermore, the facial landmarks detected using Dlib are also frontalized using a frontalizing method from Ref. [39] to create normalized landmarks for each result of facial landmark detection. This was performed to create normalized landmarks to provide consistent and reliable data.
2.2.2. Head Landmarks and Pose Estimation Module
A head pose estimator was inspired by Refs. [33,40] to determine the yaw, pitch, and roll angles of the head. It was used to further enhance the data gathered from the facial landmarks, more precisely from the head landmarks; assess the head orientation of the driver; and interpret head movements in correlation with drowsiness. The proposed method uses the HOPEnet model [41] with the default backbone network of ResNet50, in which the results act as a supplementary measure because reliable facial landmark detectors focus on frontal face detection. This model can estimate the head pose by determining the yaw, pitch, and roll angles, providing a 3D perspective on the orientation of the subject’s head. The estimated head pose is then used alongside the pairwise differences of the head landmarks to perform classification of the head status to allow the system to differentiate if the head is still, looking aside, or nodding.
2.2.3. Eye Landmarks and PERCLOS Calculation Module
Focusing on the eye region of interest, the eye landmarks, and the PERCLOS calculation module, the precise locations of the eye landmarks acquired from the landmark detection module enable the accurate computation of PERCLOS. PERCLOS is the percentage of eyelid closure over the pupil over time based on Ref. [42], where there are thresholds for the PERCLOS value to determine the drowsy state [43]. The state of the eye is highly linked to the state of drowsiness of an individual [19], and it is a measure to detect drowsiness caused by sleep deprivation, resulting in fatigued drivers [44]. By monitoring eye landmarks using pairwise differences alongside the PERCLOS calculation, the system can detect microsleeping and prolonged eyelid closures, both of which are critical cues for the early detection of drowsiness.
2.2.4. Mouth Landmarks and POM Calculation Module
The mouth landmarks and POM calculation module focus on the dynamics of the mouth region, where the detected and frontalized landmarks provide data for the POM computation. The POM is the percentage of mouth opening degree over time based on Ref. [22], which also states that there are threshold values to determine the drowsy state. This is then supported by Refs. [45,46], that mouth opening can be used to detect mouth conditions over time. This metric, particularly when associated with yawning, is a vital sign of fatigue. Furthermore, the integration of pairwise differences between mouth landmarks refines the capacity of the system to discern between speech, neutral expressions, and yawns, contributing to a comprehensive assessment of drowsiness.
2.2.5. Drowsiness Classification Module
From the results of the previous modules, the synthesis of independent assessments from the head, eye, and mouth classification modules takes place within the drowsiness classification module. From the results of the trained head, eye, and mouth models, the predictions will then be used to perform the classification of drowsy or non-drowsy. This allows the system to understand the driver’s condition by considering each section of the head, eyes, and mouth individually to determine the driver’s drowsiness. For example, if the head is nodding, the eyes are classified as sleepy, and if the mouth is yawning, the result is that the driver is drowsy.
2.2.6. Model Specifications
The real-time processing capability of the system is critical in the proposed methodology. A frame rate of 30 fps and a window size of 3 s were used. This time frame is optimal for capturing the transient characteristics of the drowsiness indicators. To ensure accuracy in PERCLOS and POM calculations, thresholds were set at 0.2 and 0.5, respectively. Machine learning models employing SVM, Random Forest, and XGBoost were configured with a balance of specificity and computational demand. While SVM and Random Forest models utilized RBF kernels and 100 estimators, respectively, the XGBoost model was finely tuned with an objective of ‘binary:logistic’, 100 estimators, and a learning rate of 0.05. When the hyperparameters were not explicitly modified, the default values were adopted to maintain model simplicity. The fusion of these parameters with real-time data serves as the foundational design for our drowsiness detection framework. While it is crafted with the intent of achieving accuracy and efficiency, especially on resource-constrained devices such as the Jetson Nano, we recognize that this design is a starting point. Actual deployment may necessitate further tuning to ensure the robustness and reliability of the model in varied and unpredictable conditions of real-world use.
2.3. Comparison from Previous Studies
Previous studies on drowsiness detection covered a variety of methodologies, with notable attempts to achieve high accuracy using advanced techniques. For instance, Refs. [2,20] leveraged deep learning and visual characteristic analysis, respectively, to achieve high accuracy and precision. Although effective, these methods often rely on complex processing or large datasets, potentially limiting their applicability in real-time or resource-constrained settings. Similarly, approaches by Refs. [7,16] demonstrated significant success in facial feature detection and fatigue indicator analysis but may encounter difficulties with extreme head poses or require substantial computational resources owing to their model sizes.
The studies utilizing the NTHU-DDD dataset highlighted the effectiveness of various machine learning techniques in drowsiness detection. Notable approaches include the use of CNN [15], HOG descriptors [24], SVM [23], and ensemble deep learning architectures with InceptionV3 modules [25]. These methods achieved high accuracy rates, such as 90% with HOG descriptors and SVM, and up to 99.65% train accuracy with an ensemble deep learning approach. The findings emphasize the potential of combining advanced feature extraction and machine learning models for efficient drowsiness detection on low-resource devices like the Jetson Nano.
In contrast, the proposed method combines facial feature detection using Dlib, head pose estimation with HOPEnet, and traditional machine-learning models to efficiently process detailed information from facial landmarks, head pose, PERCLOS, and POM. This approach not only maintains high accuracy but also ensures a relatively small model size of 5.05 MB, making it exceptionally suitable for real-time applications on low-computing devices, such as the Jetson Nano. By addressing both accuracy and computational efficiency, the proposed method presents a balanced solution for practical drowsiness detection in automotive safety systems, distinguishing it from previous attempts that may not fully cater to the demands of real-world scenarios owing to their complexity or resource requirements.
2.4. Evaluation
In this study, we evaluate the performance of a drowsiness detection model using various metrics and scenarios. The primary goal of the evaluation is to determine the model’s effectiveness in accurately predicting drowsiness, which is crucial for real-life implementation.
The evaluation metrics used are shown in Equations (1)–(4), as follows:
- Accuracy: This measures the proportion of correct predictions among all the predictions. It is calculated as the sum of true positives (tp) and true negatives (tn) divided by the sum of true positives, true negatives, false positives (fp), and false negatives (fn).
- Recall: Also known as sensitivity, this measures the ability of the model to identify all relevant instances (true positives) among the actual positives. It is calculated as the ratio of tp to the sum of tp and fn.
- Precision: This measures the proportion of tp predictions among all positive predictions. It is calculated as the ratio of tp to the sum of tp and fp.
- F1-Score: The harmonic mean of precision and recall provides a balance between the two metrics. It is particularly useful in scenarios with imbalanced data distributions.
- CPU Usage: percentage of CPU resources consumed by the model during inference.
- RAM Usage: amount of memory (in MB) consumed by the model during inference.
- GPU Usage: percentage of GPU acceleration and memory (in MB) utilized for faster inference (relevant for models deployed on devices with GPU support).
To ensure a balanced assessment of the model’s classification ability, we used macro-averaged values for precision, recall, and F1-score, representing the average scores across all classes. In addition to the aforementioned metrics, the computational efficiency of the drowsiness detection model in terms of CPU, RAM, and GPU usage during inference was also evaluated. The evaluation scenarios involved splitting the NTHU-DDD dataset into training and testing sets to assess the model’s performance on unseen data. This approach helps validate the model’s generalizability and robustness in detecting drowsiness. For the hardware used in development along with model training, the setup included a Ryzen 7 5800X 8-Core 3.80GHz processor, a Nvidia GTX1050Ti 4GB GPU, and 32 GB DDR4 RAM. The training process utilizes pretrained models for head pose estimation and facial landmark detection to enhance the accuracy and efficiency of the drowsiness detection model.
3. Results
3.1. EDA After Frame Extraction
As can be seen from Table 2, after frame extraction and annotation, the training dataset from NTHU-DDD consists of 723,248 rows across nine variables. It features data from 18 subjects, each subject in five scenarios with four conditions, ensuring that there are no missing or duplicate data. Analysis of the data also shows two distinct categories for drowsiness as well as eye annotations, and multiple categories for head and mouth annotations. There were also strong correlations between subject conditions and various annotations. In addition, the nine variables mentioned consisted of the subject number, scenario, condition, image path, frame number, drowsiness annotation, head annotation, eye annotation, and mouth annotation. As additional information, the scenario describes the specific driving scenario under which the data were recorded, such as ‘daylight’, ‘with sunglasses’, ‘nighttime’, ‘with glasses’, and ‘nighttime with glasses’. Then, the condition is the specific state or condition under which the data were captured, for instance, ‘nonsleepy‘, sleepy‘, ‘slow blink with nodding’, or ‘yawning’. Followed by that would be the image path of the saved frame, the frame number, the drowsiness annotation of drowsy or non-drowsy, head annotation of ‘stillness’, ‘nodding’ or ‘looking aside’, the eye annotation of ‘stillness’ or ‘sleepy-eyes’, and, finally, the mouth annotation of ‘stillness’, ‘talking and laughing’, or ‘yawning’.
Table 2.
Data results after frame extraction.
The evaluation dataset includes 143,482 rows with nine variables, covering four subjects across four scenarios under mixed conditions. Similar to the training dataset, the dataset displays distinct annotation categories. The evaluation dataset has the same amount of variables as the training dataset; however, it only has four subjects and four scenarios of ‘glasses’, ‘noglasses’, ‘nightglasses’, or ‘sunglasses’. There is only a mixed condition per scenario that may contain up to four conditions, which was mentioned earlier in the training dataset. The test dataset, containing 711,877 rows of data from 14 subjects across five scenarios, focuses solely on drowsiness annotations with two distinct states: drowsiness and non-drowsiness. There were no missing or duplicate entries that ensured data integrity. In addition, the test dataset only had six variables since it does not include annotations for the head, mouth, and eyes, where it has 14 subjects, the same five scenarios as the training dataset, as well as mixed conditions per scenario, similar to that of the evaluation dataset.
The extracted data were comprehensive, ensuring the integrity of the dataset for subsequent analysis. The absence of missing or duplicate entries further underscores the reliability of this dataset. The annotations, particularly those for drowsiness and head, eye, and mouth conditions, exhibited strong correlations with the condition of the subject. This distribution of subjects and scenarios across datasets ensures a diverse and representative sample, thereby setting a solid foundation for model training and evaluation.
3.2. Handcrafted Feature Extraction
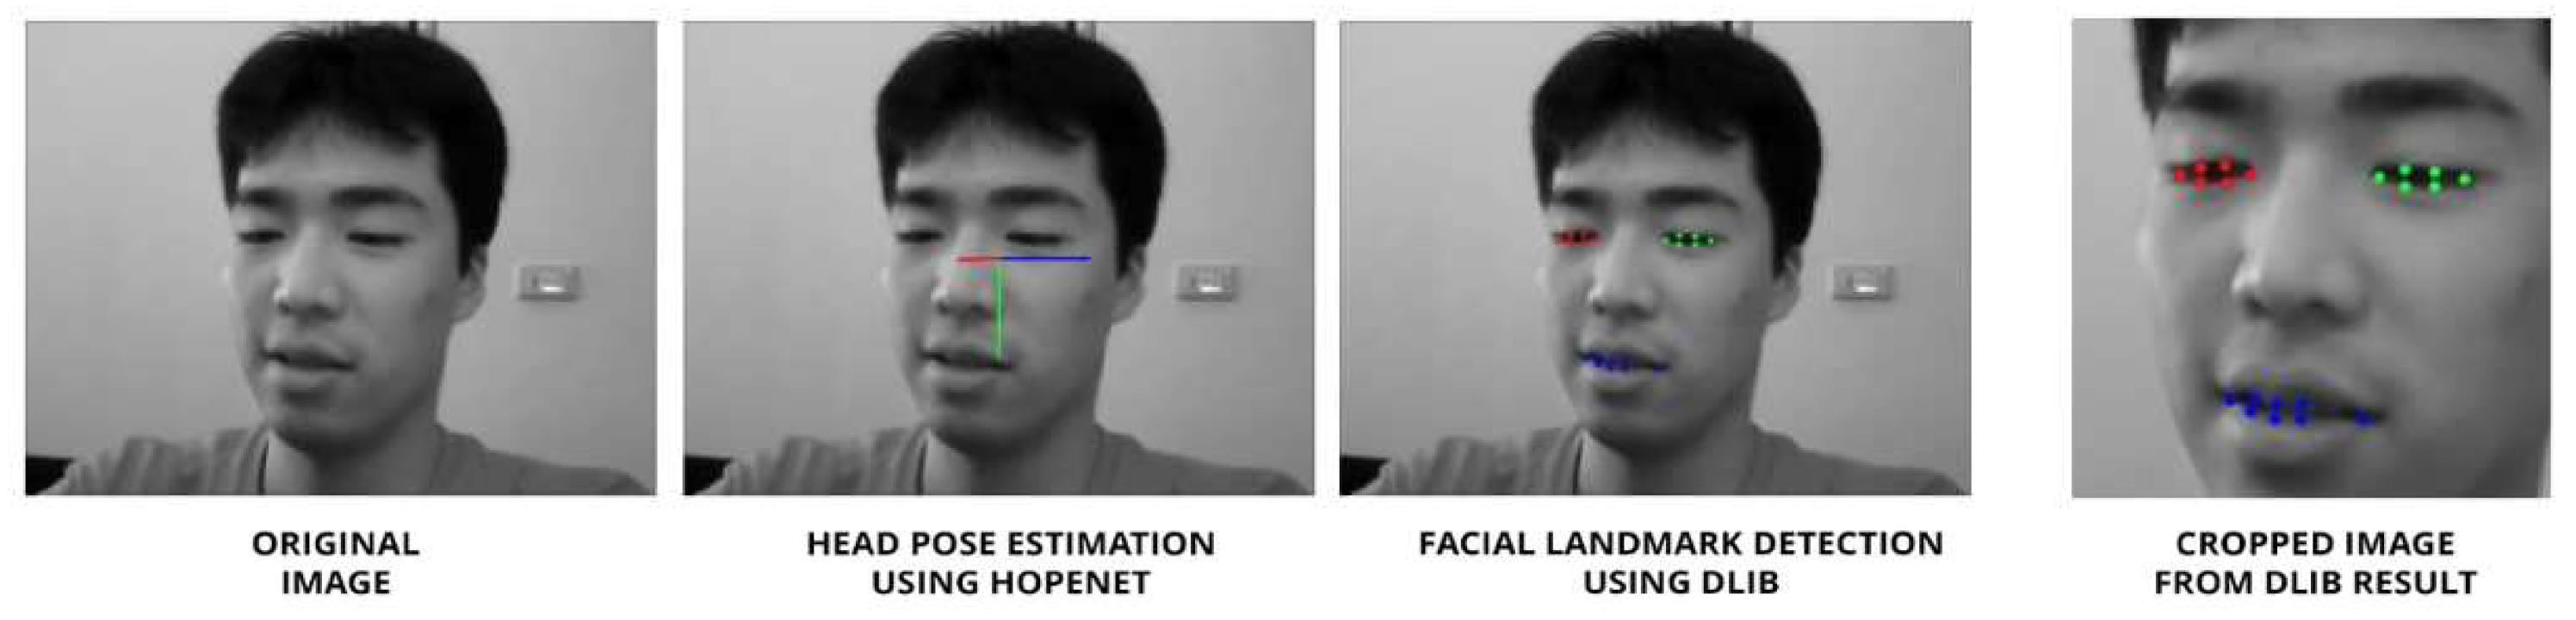
The handcrafted feature extraction process demonstrated its capability to capture essential facial features indicative of drowsiness. Dlib’s precision in detecting facial landmarks ensures accurate measurements of eyelid and mouth openings as shown by Figure 3. The integration of head pose estimation using HOPEnet offers a comprehensive 3D perspective, potentially enhancing the accuracy of drowsiness detection. The combination of these handcrafted features, including the three opening values, PERCLOS and POM calculations, and Euler angles, provides a robust dataset for subsequent modeling and analysis of the data.

Figure 3.
Results of head pose estimation using HOPEnet and landmark detection using DLIB in a sample.
To evaluate the impact of different features, the table below shows a series of trials that employed various methods. The use of frontalized landmarks alongside PERCLOS, POM, and head pose, replacing the use of landmarks instead of using pairwise features alongside PERCLOS, POM, and head pose, or even only using PERCLOS, POM, and head pose, as well as the use of eye cropping, to potentially increase the accuracy of eye state classification.
The results in Table 3 indicate that including both facial landmarks and pairwise differences generally leads to higher accuracy in drowsiness detection across all regions (eyes, mouth, and head) and models (SVM, Random Forest, XGBoost) compared to using only pairwise differences. The use of facial landmarks appeared to be particularly beneficial for the eye region, where a significant drop in accuracy was observed when landmarks were excluded. However, for the mouth and head regions, the effect of excluding landmarks was less pronounced. This suggests that while facial landmarks provide valuable information for drowsiness detection, pairwise differences alone can achieve comparable results for certain regions and models. Overall, the combination of these features offers a more robust approach for accurately detecting drowsiness.
Table 3.
Difference in using both facial landmarks and pairwise differences compared to only using pairwise differences.
3.3. Drowsiness Detection Classifier
The results of the performed experiments, as shown in Table 4, show that the use of the additional metrics of PERCLOS, POM, or head pose compared to without the metrics has a positive effect on the classification accuracy. Where the use of both the landmarks and pairwise differences are used, Table 4 above shows that the use of PERCLOS, POM, and head pose positively affects the accuracy of each state of the eyes, mouth, and head, which in turn also helps the drowsiness detection since it is based on the results of each of these features. The use of PERCLOS and POM both show a notable improvement in both eye and mouth detection accuracy, while the head pose shows a significant enhancement in head detection accuracy across different models used. Although these improvements are promising, there may be potential limitations in real-world applications.
Table 4.
Accuracy difference to check the relevance of handcrafted data.
In addition, the table above shows the different models used alongside the accuracies and sizes of the models that use PERCLOS, POM, and head pose for additional features to aid in drowsiness detection. The most suitable classifier for use in limited resource machines such as the Jetson Nano is XGBoost because of its relatively small model size and high accuracy, making it a highly balanced choice for both memory usage and performance. The SVM model may also be suitable owing to its high accuracy; however, its moderate size may become an issue. Despite its high accuracy, the Random Forest Neural Network model is not ideal for use in limited resource machines because there are storage constraints and higher computational costs. In addition, the previous methods in which others have tried to use heavier models, such as CNN-based methods, Hierarchical Temporal Deep Belief Networks (HTDBN), and RCAN, although their accuracies are much larger, also have larger model sizes. Owing to these larger model sizes, testing could not be performed on machines with limited resources.
Furthermore, from the data in Table 5, it is also possible to obtain the overall accuracies using the SVM, Random Forest, or XGBoost models. The Support Vector Machine (SVM) model, with an overall accuracy of 82.44%, shows its capability to effectively interpret the data at the cost of relatively large model sizes, especially noticeable in the head feature analysis with a size of 90.05 MB. The model size, measured in megabytes (MB), indicates the storage space required for the serialized model file. It is the size of the trained model that is created in the simulation. This suggests a trade-off between the accuracy and resource consumption for the SVM model. The Random Forest model, with an overall accuracy of 84.06%, not only slightly outperforms the SVM in accuracy but also shows a significant variance in model sizes, ranging from a modest 0.18 MB for drowsy state detection to a substantial 156.66 MB for eye state classification. This indicates its robustness but also points to potential challenges in deployment in devices with limited storage capacities. XGBoost, with an overall accuracy of 83.96%, showed not only competitive accuracy, particularly in head movement analysis but also the smallest model sizes compared to the other models, with the drowsy state detection model being notably compact at 0.12 MB. This size efficiency makes XGBoost particularly appealing for applications in environments with strict constraints on computational resources. The comparison of these models highlights the importance of balancing accuracy with model size, especially for real-world applications where both factors are crucial for the deployment of drowsy driving detection systems.
Table 5.
Experimentation results using the three classifiers of SVM, Random Forest, and XGBoost.
As shown by Table 6, the macro-averaged precision, recall, and F1-score results for SVM, Random Forest, and XGBoost showed strong performance in drowsiness detection, with each model achieving high scores in this category. However, there are variations in performance across different facial features, with SVM excelling in mouth detection but facing challenges in eye and head-state classification. Random Forest demonstrates a balanced performance across features, particularly in mouth and head detection. XGBoost shows an improvement in head feature classification compared with the other models. Overall, these results indicate the effectiveness of these models in detecting drowsiness while highlighting areas for improvement in specific feature classifications.
Table 6.
Evaluation of experiments using SVM, Random Forest, and XGBoost.
Comparing these results with previous methods that employed heavier models, such as CNN-based methods, HTDBN, and RCAN, it is evident that while those approaches may offer higher accuracies, their larger model sizes limit their applicability in resource-constrained environments. This study demonstrates the potential of using simpler yet effective machine learning models, such as XGBoost, to achieve a balance between accuracy and computational efficiency, paving the way for the development of practical drowsiness detection systems that can be deployed on a wider range of devices.
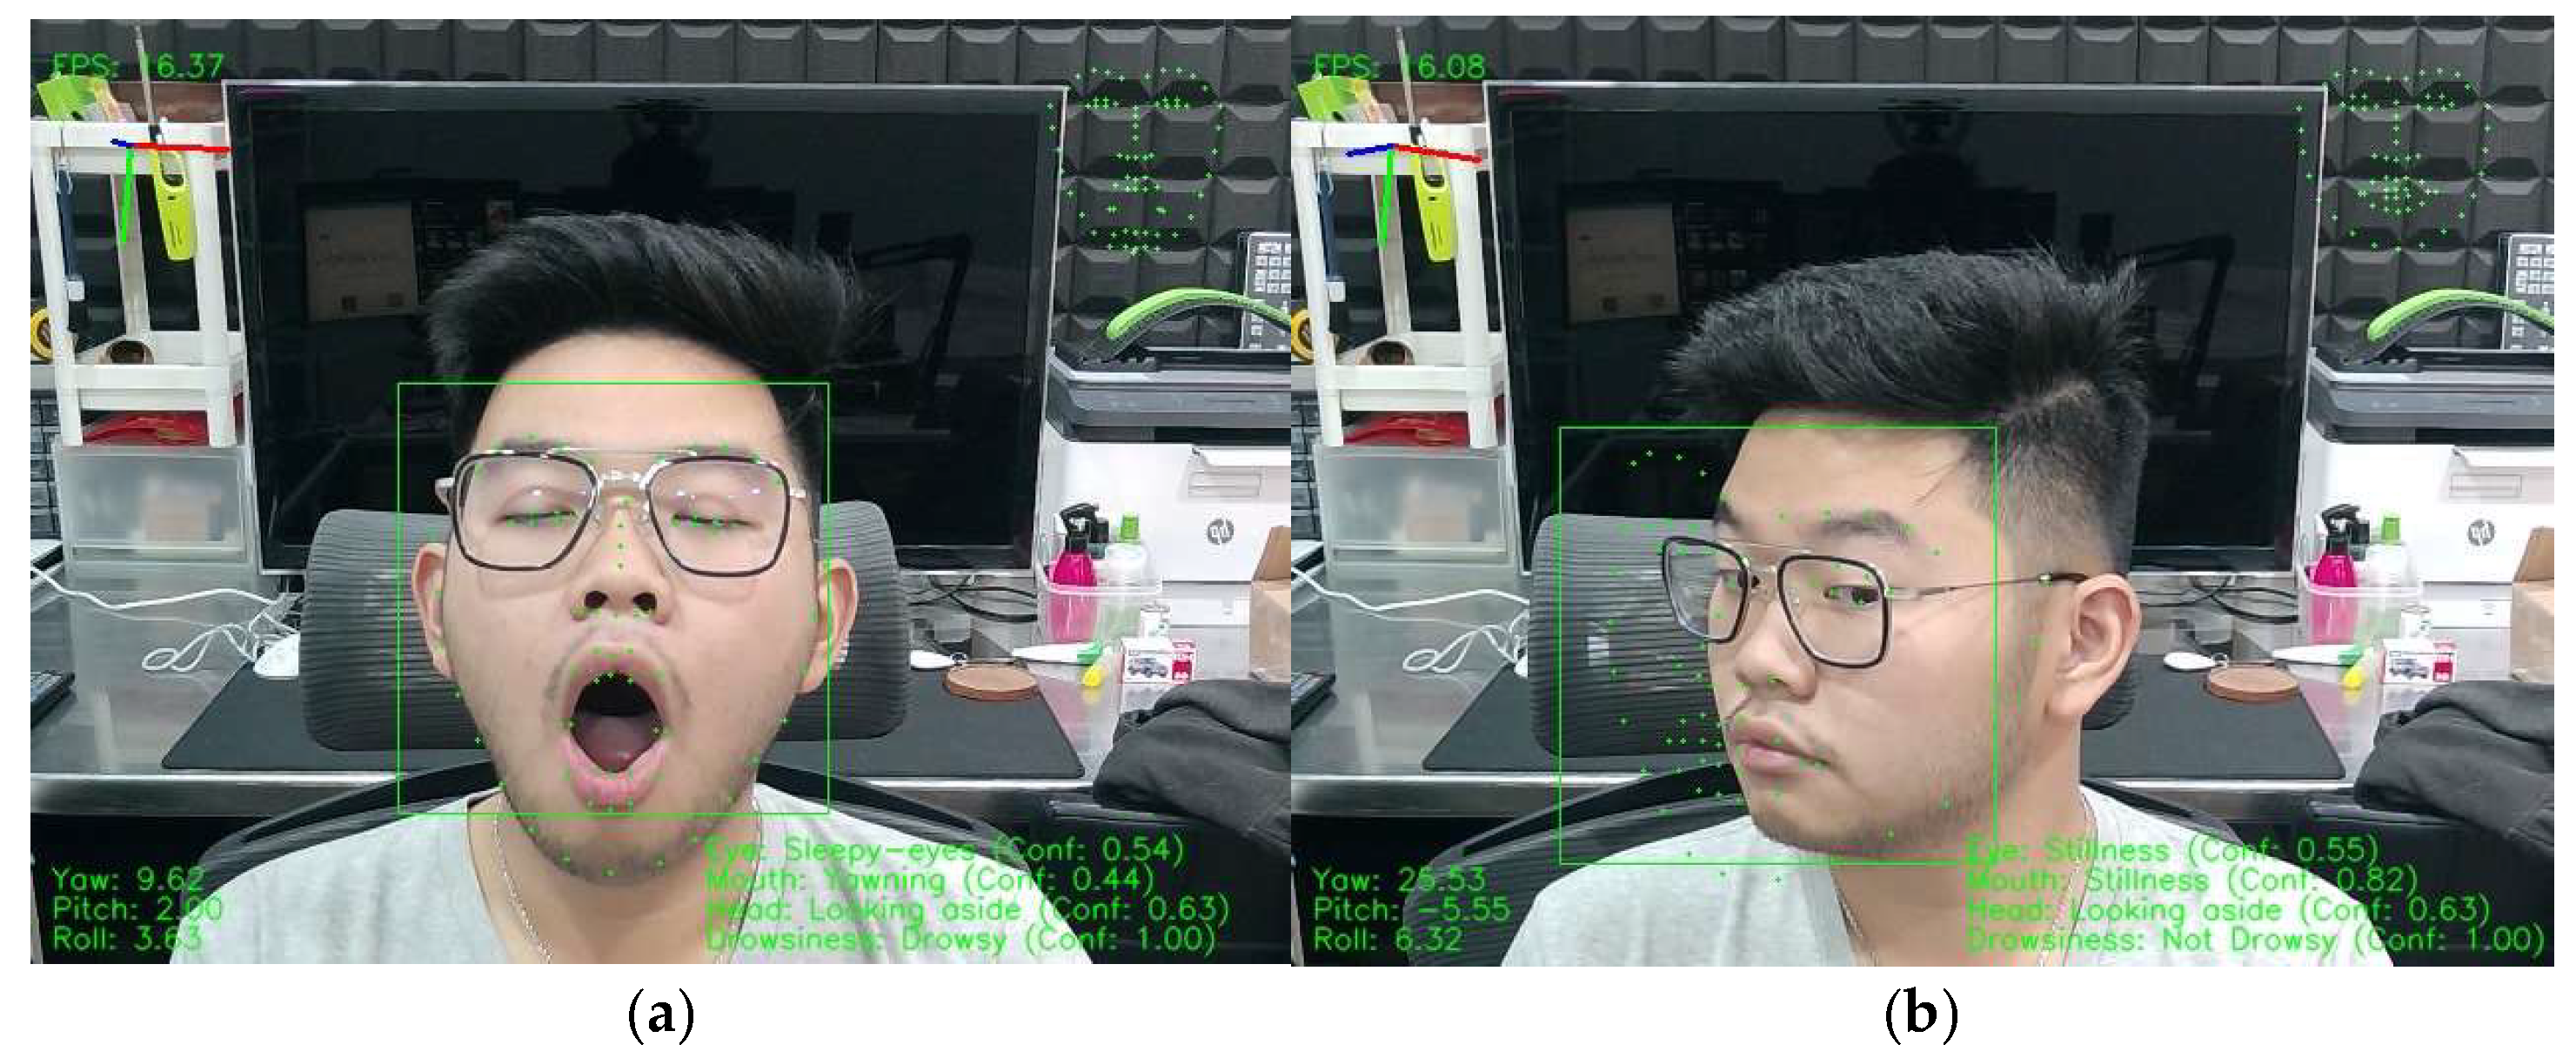
Figure 4 shows sample images taken from the webcam simulation, which on the top left of the display shows the frames per second of the stream along the orientation of the head visualized from the three Euler angles of yaw, pitch, and roll retrieved from the HOPEnet model. In addition, the proposed method achieved an average of 16 fps. The top right of the display shows the frontalized landmarks; the bottom left of the display shows the yaw, pitch, and roll; and the bottom right of the display shows the prediction of each region state and its confidence scores. The display also shows the face detected in the frame using a bounding box and 68-point landmarks on the face from Dlib.
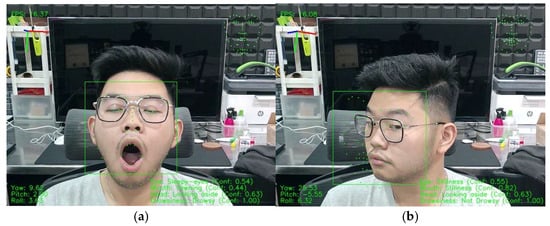
Figure 4.
Sample pictures taken from webcam simulation. (a) Sleepy eyes and yawning are detected as a drowsy subject; (b) stillness of eyes and stillness of mouth while head is looking aside are detected as not drowsy.
Table 7 shows a comprehensive comparison between the proposed method and other studies on drowsiness detection. Here, the HTDBN model is the closest comparison to the proposed method in terms of accuracy, where the proposed method using XGBoost shows an overall accuracy of 83.96% compared to the method performed using HTDBN [12] with an accuracy of 84.82%. The two accuracies are not far apart, with only a difference of 0.86%; however, the proposed method was able to achieve a total model size of only 5.05 MB compared to the larger 37.82 MB of the HTDBN. This size difference may limit their practicality in low-computing devices. Although research on using HTDBN for drowsiness detection [12] did not mention the size of the model, after performing experimentation, a size of 37.82 MB was achieved. This figure is a rough estimate based on replicating the HTDBN model as closely as possible to the descriptions provided in the study. It is important to note that this size may vary depending on the specific implementation details of Deep Belief Networks (DBN) and Hidden Markov Models (HMM), such as the number of layers, number of units in each layer, and precision of the weights used. Because the original paper did not provide explicit details on these aspects, the estimated size serves as an approximation that reflects the potential scale of the HTDBN model based on standard practices in model construction and optimization.
Table 7.
Comparison with similar papers based on accuracy, model size, and computational efficiency.
Other methods such as KCF + Dlib [16], as well as using U-Net + Decision Network [19], achieved high accuracies of 92% and 96.72%, respectively; however, they did not specify the model sizes. The KCF + Dlib method relies primarily on facial features and the KCF algorithm for drowsiness detection, which may not provide a comprehensive assessment of drowsiness. Similarly, the U-Net + Decision Network [19] approach focuses solely on eye closure, potentially overlooking other important indicators of drowsiness. Moreover, the CNN + Facial Landmark Detection method [15] offers a balanced approach with an accuracy of 83.33% and a minimal model size of 0.075 MB. However, it achieved a low frame rate of 6.87 fps on a Quadro P4000, which may limit its practicality in real-time applications. In contrast, the proposed method maintained a higher average frame rate of 16 fps, making it more suitable for real-time drowsiness detection on resource-constrained devices. Furthermore, the ensemble with InceptionV3 [25] and U-Net + Decision Network [19], although showing higher accuracies, likely have larger model sizes. Traditional machine learning methods such as HOG + SVM [23] and improved HOG with Naïve Bayes [24] offer competitive accuracy while being more lightweight. The choice of method depends on the specific requirements of the application, including real-time processing capabilities, computational resources, and desired accuracy level.
Moreover, the practical implications of deploying these models in real-world scenarios extend beyond computational efficiency. The robustness of the model under varying lighting conditions, the diversity of subjects in the dataset, and the ability of the model to generalize across different demographics are critical factors that influence the effectiveness of drowsiness detection systems. Future research could focus on enhancing dataset diversity, exploring hybrid models that combine the strengths of DBNs and decision tree-based methods such as XGBoost, and testing the models in more dynamic and challenging environments.
4. Discussion
Previous studies show that feature extraction plays a critical role in the development of effective drowsiness detection systems. Integrating the use of facial landmarks with pairwise differences across various models enhances the accuracy of drowsiness detection. The research also demonstrated different feature extraction techniques and model performances. However, the variations in model performance and size indicate the importance of considering computational resources and practical development scenarios. The use of SVM and XGBoost models is the ideal option that offers a balanced trade-off between accuracy and model size, making it ideal for applications in resource-constrained environments, such as the Jetson Nano.
The comparative analysis between the HTDBN and the proposed models reveals a marginal difference in accuracy but a significant variance in model size, underscoring a pivotal consideration for the deployment of drowsiness detection systems in real-world scenarios. This variance highlights the critical balance between achieving a high accuracy and maintaining a manageable model size for practical applications, particularly in environments with limited computational resources. The efficiency of the proposed model, with its relatively small size and competitive accuracy, suggests its suitability for integration into resource-constrained devices. This finding aligns with the broader objective of developing drowsiness detection technologies that are not only effective but also feasible for widespread implementation. As we move forward, addressing the limitations identified in this research, including dataset diversity and real-world testing conditions, is crucial.
In recognition of the potential adaptability of the proposed method to low-power devices such as the Jetson Nano, further optimization would be to enhance computational efficiency without compromising accuracy. Future efforts will focus on pilot testing edge devices to ensure robust performance under various environmental constraints and validate their practical applicability. Continuous improvements are crucial as technology advances, ensuring that the proposed method remains effective and relevant. These steps are essential for transitioning from theoretical models to practical applications that can be deployed widely, particularly in resource-constrained environments.
Moreover, the limitations of this study, including the composition of the dataset and its potential biases, may impact the generalizability of the findings. The models were tested under controlled conditions, which may not fully replicate the real-world scenarios. To address these limitations, future work should focus on expanding the dataset diversity and testing models under dynamic conditions. Exploring advanced machine learning techniques and refining feature extraction methods are crucial for further improving the accuracy and efficiency of the system. The results of this study lay a strong foundation for future studies, which can be enhanced by using more data, exploring hybrid models, and conducting real-world testing under various lighting conditions and with diverse populations. This approach will not only enhance the accuracy and robustness of drowsiness detection systems but also provide insights for other applications requiring fatigue or attention monitoring. The findings and their implications should be discussed in the broadest context possible, considering the perspective of previous studies and working hypotheses and highlighting future research directions.
5. Conclusions
Drowsy driving is a major issue, and the purpose of this study is to detect drowsiness using computer vision. The proposed method uses NTHU-DDD for training, evaluation, and testing, where the clips are read per frame, and the facial features alongside the head pose are detected. The key metrics of PERCLOS and POM were calculated to provide additional information indicating drowsiness.
Whereas previous methods used complex deep learning models, this research used simpler machine learning models, such as SVM, Random Forest, and XGBoost, to effectively process detailed data obtained from handcrafted features. These handcrafted features consist of frontalized facial landmarks, head poses, PERCLOS, and POM. The results were promising, showing that it is suitable for use in devices with limited computational resources, such as the Jetson Nano. The experiments conducted showed that XGBoost, although having an overall model size of 5.05 MB, which is considerably small, achieved a high accuracy of 86.848% with increased computational efficiency using less CPU, RAM, and GPU, making it the most suitable classifier for devices with limited computational resources. The evaluation metrics used in this study provided a comprehensive assessment of model performance. Specifically, the XGBoost model achieved an overall precision of 86.25%, recall of 78.5%, and F1-score of 80.75%. Additionally, the use of PERCLOS, POM, and head pose is also shown to have a positive effect, where the detections for each corresponding feature increase notably for PERCLOS and POM, whereas the use of head pose significantly improves the accuracy.
The findings of this research contribute to the ongoing efforts to enhance road safety by providing an efficient and accurate solution for drowsiness detection. Future studies could explore the integration of additional features, the optimization of model parameters, and the deployment of the system in real-world driving scenarios to further validate its effectiveness and reliability. By advancing the capabilities of drowsiness detection systems, we can take proactive steps towards preventing accidents caused by drowsy driving and ensuring the safety of all road users.
Author Contributions
Experimentation and Research, V.O.; Supervision and Review, N.S. All authors have read and agreed to the published version of the manuscript.
Funding
This research received no external funding.
Institutional Review Board Statement
Ethical review and approval were waived for this study due to the use of an existing, publicly available dataset. The dataset was collected by other researchers who obtained all necessary ethical approvals and consents for its use in research. This dataset has been de-identified to protect participants’ privacy, ensuring compliance with ethical standards for secondary data usage.
Informed Consent Statement
Written informed consent was obtained from the patients to publish this paper.
Data Availability Statement
Restrictions apply to the availability of these data. Data were obtained from the National Tsing Hua University Computer Vision Lab and are available from Shang-Hong Lai with the permission of the National Tsing Hua University Computer Vision Lab.
Conflicts of Interest
The authors declare no conflicts of interest.
References
- Wessel, R. What Are Driver Drowsiness Detection Systems?|TomTom Blog. TomTom. 2022. Available online: https://www.tomtom.com/newsroom/explainers-and-insights/driver-drowsiness-detection-systems/ (accessed on 1 March 2024).
- Chirra, V.; Reddy Uyyala, S.; Kishore Kolli, V. Deep CNN: A Machine Learning Approach for Driver Drowsiness Detection Based on Eye State. Rev. Intell. Artif. 2019, 33, 461–466. [Google Scholar] [CrossRef]
- Coxworth, B. Anti Sleep Pilot Detects Drowsy Drivers. New Atlas. 2011. Available online: https://newatlas.com/anti-sleep-pilot-monitors-driver-fatigue/17439/ (accessed on 1 March 2024).
- Ullah, M.R.; Aslam, M.; Ullah, M.I.; Maria, M.-E.A. Driver’s drowsiness detection through computer vision: A review. Adv. Comput. Intell. 2018, 10633, 272–281. [Google Scholar] [CrossRef]
- Insurance Information Institute. Facts + Statistics: Drowsy Driving. 2017. Available online: https://www.iii.org/fact-statistic/facts-statistics-drowsy-driving (accessed on 1 March 2024).
- Dastres, R.; Soori, M. Artificial neural network systems. Int. J. Imaging Robot. 2021, 21, 13–25. [Google Scholar]
- Chen, L.; Zheng, W. Research on railway dispatcher fatigue detection method based on deep learning with multi-feature fusion. Electronics 2023, 12, 2303. [Google Scholar] [CrossRef]
- Moshayedi, A.J.; Roy, A.S.; Kolahdooz, A.; Shuxin, Y. Deep learning application pros and cons over algorithm. EAI Endorsed Trans. AI Robot. 2022, 1, 1–13. [Google Scholar] [CrossRef]
- Phan, A.-C.; Nguyen, N.-H.-Q.; Trieu, T.-N.; Phan, T.-C. An efficient approach for detecting driver drowsiness based on deep learning. Appl. Sci. 2021, 11, 8441. [Google Scholar] [CrossRef]
- Bhatt, D.; Patel, C.; Talsania, H.; Patel, J.; Vaghela, R.; Pandya, S.; Modi, K.; Ghayvat, H. CNN variants for computer vision: History, architecture, application, challenges and future Scope. Electronics 2021, 10, 2470. [Google Scholar] [CrossRef]
- Saif, A.F.M.S.; Rasyid, Z. Robust drowsiness detection for vehicle driver using deep convolutional neural network. Int. J. Adv. Comput. Sci. Appl. 2020, 11, 343–350. [Google Scholar] [CrossRef]
- Weng, C.-H.; Lai, Y.-H.; Lai, S.-H. Driver drowsiness detection via a hierarchical temporal deep belief network. In Proceedings of the Computer Vision—ACCV 2016 Workshops, Taipei, Taiwan, 20–24 November 2016; pp. 117–133. [Google Scholar] [CrossRef]
- Yamashita, R.; Nishio, M.; Do, R.K.G.; Togashi, K. Convolutional neural networks: An overview and application in radiology. Insights Into Imaging 2018, 9, 611–629. [Google Scholar] [CrossRef]
- Zhao, Z.; Zhou, N.; Zhang, L.; Yan, H.; Xu, Y.; Zhang, Z. Driver fatigue detection based on convolutional neural networks using EM-CNN. Comput. Intell. Neurosci. 2020, 2020, 7251280. [Google Scholar] [CrossRef]
- Jabbar, R.; Shinoy, M.; Kharbeche, M.; Al-Khalifa, K.; Krichen, M.; Barkaoui, K. Driver drowsiness detection model using convolutional neural networks techniques for android application. In Proceedings of the 2020 IEEE International Conference on Informatics, IoT, and Enabling Technologies (ICIoT), IoT, Doha, Qatar, 2–5 February 2020; pp. 237–242. [Google Scholar]
- Deng, W.; Wu, R. Real-time driver-drowsiness detection system using facial features. IEEE Access 2019, 7, 118727–118738. [Google Scholar] [CrossRef]
- Junaedi, S.; Akbar, H. Driver drowsiness detection based on face feature and PERCLOS. In Proceedings of the International Conference on Computation in Science and Engineering, Bandung, Indonesia, 10–12 July 2017. [Google Scholar] [CrossRef]
- Ursulescu, O.; Ilie, B.; Simion, G. Driver drowsiness detection based on eye analysis. In Proceedings of the 2018 International Symposium on Electronics and Telecommunications (ISETC), Timisoara, Romania, 8–9 November 2018; pp. 1–4. [Google Scholar]
- Zhuang, Q.; Kehua, Z.; Wang, J.; Chen, Q. Driver fatigue detection method based on eye states with pupil and iris segmentation. IEEE Access 2020, 8, 173440–173449. [Google Scholar] [CrossRef]
- Akrout, B.; Mahdi, W. A novel approach for driver fatigue detection based on visual characteristics analysis. J. Ambient. Intell. Humaniz. Comput. 2021, 14, 527–552. [Google Scholar] [CrossRef]
- Kahlon, M.; Ganesan, S. Driver drowsiness detection system based on binary eyes image data. In Proceedings of the 2018 IEEE International Conference on Electro/Information Technology (EIT), Rochester, MI, USA, 3–5 May 2018. [Google Scholar] [CrossRef]
- Ye, M.; Zhang, W.; Cao, P.; Liu, K. Driver fatigue detection based on residual channel attention network and head pose estimation. Appl. Sci. 2021, 11, 9195. [Google Scholar] [CrossRef]
- Sheikh, A.A.; Mir, J. Machine learning inspired vision-based drowsiness detection using eye and body motion features. In Proceedings of the 2021 13th International Conference on Information & Communication Technology and System (ICTS), Surabaya, Indonesia, 20–21 October 2021; pp. 1–6. [Google Scholar] [CrossRef]
- Bakheet, S.; Al-Hamadi, A. A framework for instantaneous driver drowsiness detection based on improved HOG features and naïve bayesian classification. Brain Sci. 2021, 11, 240. [Google Scholar] [CrossRef]
- Ahmed, M.; Masood, S.; Ahmad, M.; El-Latif, A.A.A. Intelligent driver drowsiness detection for traffic safety based on multi CNN deep model and facial subsampling. IEEE Trans. Intell. Transp. Syst. 2022, 23, 19743–19752. [Google Scholar] [CrossRef]
- CDC. Dangers of Drowsy Driving; Centers for Disease Control and Prevention: Atlanta, GA, USA, 2020. Available online: https://stacks.cdc.gov/view/cdc/35742 (accessed on 1 March 2024).
- Rivelli, E.; Kempken, M. Drowsy Driving 2021 Facts; Statistics. Bankrate. 2022. Available online: https://www.bankrate.com/insurance/car/drowsy-driving-statistics/#drowsy-driving-statistics (accessed on 1 March 2024).
- Wallis, K.; Johnson, T. Why Am I Excessively Sleepy? Drowsiness Explained. 31 August 2022. Available online: https://www.healthgrades.com/right-care/symptoms-and-conditions/drowsiness (accessed on 1 March 2024).
- Andrew Currin. NHTSA. National Highway Traffic Safety Administration. 2016. Available online: https://www.nhtsa.gov/risky-driving/drowsy-driving (accessed on 1 March 2024).
- Trop, J. Drowsy Driving: Worse Than Drunk Driving? US News. 2016. Available online: https://cars.usnews.com/cars-trucks/advice/best-cars-blog/2016/12/drowsy-driving-worse-than-drunk-driving (accessed on 1 March 2024).
- Gwak, J.; Hirao, A.; Shino, M. An investigation of early detection of driver drowsiness using ensemble machine learning Based on Hybrid Sensing. Appl. Sci. 2020, 10, 2890. [Google Scholar] [CrossRef]
- Nagappan, I.; Kalluri, V.R.; Abraham, J.V.T.; Muralidhar, A. Real-time driver fatigue or drowsiness detection system using face image stream. Int. J. Civ. Eng. Technol. 2017, 8, 793–802. [Google Scholar]
- Amodio, A.; Ermidoro, M.; Maggi, D.; Savaresi, S.M. A low-cost system for dynamic analysis of pupillary light response for a driver drowsiness detection system. In Proceedings of the 2018 European Control Conference (ECC), Limassol, Cyprus, 12–15 June 2018; pp. 1–5. [Google Scholar] [CrossRef]
- Barney, N. What Is Face Detection and How Does It Work? Tech Target. 2023. Available online: https://www.techtarget.com/searchenterpriseai/definition/face-detection (accessed on 1 March 2024).
- Kumar, A.; Kaur, A.; Kumar, M. Face detection techniques: A review. Artif. Intell. Rev. 2018, 52, 927–948. [Google Scholar] [CrossRef]
- Lu, W.; Yang, M. Face detection based on viola-jones algorithm applying composite features. In Proceedings of the 2019 International Conference on Robotics and Intelligent System (ICRIS), Haikou, China, 15–16 June 2019; pp. 1–5. [Google Scholar] [CrossRef]
- Bodini, M. A review of facial landmark extraction in 2D images and videos using deep learning. Big Data Cogn. Comput. 2019, 3, 14. [Google Scholar] [CrossRef]
- Wu, Y.; Ji, Q. Facial landmark detection: A literature survey. Int. J. Comput. Vis. 2018, 127, 115–142. [Google Scholar] [CrossRef]
- Vonikakis, V.; Winkler, S. Identity-invariant facial landmark frontalization for facial expression analysis. In Proceedings of the 2020 IEEE International Conference on Image Processing (ICIP), Abu Dhabi, United Arab Emirates, 25–28 October 2020; pp. 1–5. [Google Scholar] [CrossRef]
- Asperti, A.; Filippini, D. Deep learning for head pose estimation: A survey. SN Comput. Sci. 2023, 4, 349. [Google Scholar] [CrossRef]
- Lee, S. Head Pose Estimation with Hopenet. Medium. 11 August 2021. Available online: https://towardsdatascience.com/head-pose-estimation-with-hopenet-5e62ace254d5 (accessed on 1 March 2024).
- Zhang, F.; Su, J.; Geng, L.; Xiao, Z. Driver fatigue detection based on eye state recognition. In Proceedings of the 2017 International Conference on Machine Vision and Information Technology (CMVIT), Singapore, 17–19 February 2017; pp. 1–5. [Google Scholar] [CrossRef]
- Chang, R.C.-H.; Wang, C.-Y.; Chen, W.-T.; Chiu, C.-D. Drowsiness detection system based on PERCLOS and facial physiological signal. Sensors 2022, 22, 5380. [Google Scholar] [CrossRef] [PubMed]
- Abe, T. PERCLOS-based technologies for detecting drowsiness: Current evidence and future directions. SLEEP Adv. 2023, 4, zpad006. [Google Scholar] [CrossRef]
- Ramzan, M.; Khan, H.U.; Awan, S.M.; Ismail, A.; Ilyas, M.; Mahmood, A. A Survey on state-of-the-art drowsiness detection techniques. IEEE Access 2019, 7, 61904–61919. [Google Scholar] [CrossRef]
- Tipprasert, W.; Charoenpong, T.; Chianrabutra, C.; Sukjamsri, C. A Method of driver’s eyes closure and yawning detection for drowsiness analysis by infrared camera. In Proceedings of the 2019 First International Symposium on Instrumentation, Control, Artificial Intelligence, and Robotics (ICA-SYMP), Bangkok, Thailand, 16–18 January 2019; pp. 1–5. [Google Scholar] [CrossRef]
Disclaimer/Publisher’s Note: The statements, opinions and data contained in all publications are solely those of the individual author(s) and contributor(s) and not of MDPI and/or the editor(s). MDPI and/or the editor(s) disclaim responsibility for any injury to people or property resulting from any ideas, methods, instructions or products referred to in the content. |
© 2025 by the authors. Licensee MDPI, Basel, Switzerland. This article is an open access article distributed under the terms and conditions of the Creative Commons Attribution (CC BY) license (https://creativecommons.org/licenses/by/4.0/).