Article

Grid Anchor Lane Detection Based on Attribute Correlation

1
Shenzhen Technology University, Shenzhen 518118, China
2
College of Applied Technology, Shenzhen University, Shenzhen 518118, China
3
Shenzhen Key Laboratory of Urban Rail Transit, Shenzhen Technology University, Shenzhen 518118, China
*
Authors to whom correspondence should be addressed.
Appl. Sci. 2025, 15(2), 699; https://doi.org/10.3390/app15020699
Submission received: 16 December 2024 / Revised: 8 January 2025 / Accepted: 10 January 2025 / Published: 12 January 2025

Abstract

:
The detection of road features is a necessary approach to achieve autonomous driving. And lane lines are important two-dimensional features on roads, which are crucial for achieving autonomous driving. Currently, research on lane detection mainly focuses on the positioning detection of local features without considering the association of long-distance lane line features. A grid anchor lane detection model based on attribute correlation is proposed to address this issue. Firstly, a grid anchor lane line expression method containing attribute information is proposed, and the association relationship between adjacent features is established at the data layer. Secondly, a convolutional reordering upsampling method has been proposed, and the model integrates the global feature information generated by multi-layer perceptron (MLP), achieving the fusion of long-distance lane line features. The upsampling and MLP enhance the dual perception ability of the feature pyramid network in detail features and global features. Finally, the attribute correlation loss function was designed to construct feature associations between different grid anchors, enhancing the interdependence of anchor recognition results. The experimental results show that the proposed model achieved first-place F1 scores of 93.05 and 73.27 in the normal and curved scenes on the CULane dataset, respectively. This model can balance the robustness of lane detection in both normal and curved scenarios.

1. Introduction

Autonomous vehicles represent a significant advancement in the automotive industry during the era of intelligent technology, and their core functionalities are heavily dependent on Advanced Driver Assistance Systems (ADASs) [1]. In autonomous driving scenarios, lane lines serve as essential indicators of road traffic regulations, and their detection performance is directly linked to a vehicle’s ability to operate in compliance with legal and regulatory standards. As a result, lane detection has become a key task within the perception module of ADASs.
Lane lines are typically marked on the road surface as solid or dashed lines, which are two-dimensional planar features and lack depth data. Consequently, cameras have become the main sensor for lane detection. The detection model provides accurate lane line shape and position information for the vehicle by detecting and analyzing the captured road images in real time.
Benefiting from the powerful feature extraction capabilities of a Convolutional Neural Network (CNN) [2,3], CNN-based models can achieve high accuracy in lane detection when processing images with well-defined features [4,5]. However, in complex scenarios, such as those involving vehicle occlusions or shadow interference (Figure 1a), the model must deeply capture local detail features to accurately locate lane lines, imposing higher demands on the extraction of low-level features. On the other hand, discontinuous lane lines present another significant challenge in detection tasks. For example, the left lane line in Figure 1b exhibits feature loss due to its fragmented structure, requiring the model to leverage global information for feature completion, thereby recovering the missing features.
In addition, in some scenarios without lane lines, such as intersections (Figure 1c), models must rely on global features to capture the semantic information of the surrounding environment and make judgments based on the semantic context to avoid false detections. However, anchor-based detection models [6,7,8,9,10] typically utilize only local features, making them prone to misjudgment due to feature similarity. For high-curvature lane lines on curved roads (Figure 1d), the slope undergoes significant variations. Segmentation-based [11,12,13,14,15] and anchor-based detection methods often struggle to perceive these slope changes and make corresponding predictive adjustments. Similarly, parameter-based methods [16,17,18,19] face difficulties in effectively modeling the complex shapes of such lane lines. As a result, detecting curved lane lines remains one of the key challenges in lane detection tasks.
Although semantic segmentation methods can precisely depict the shape of lane lines and produce detection results consistent with their corresponding positional features, their high computational complexity makes it challenging to meet real-time requirements. In contrast, anchor-based detection methods represent the classification results of regional features using a limited amount of data. However, because predefined anchor positions are not well suited to the diverse shapes of lane lines, these methods rely on offset adjustments to correct positional errors. Consequently, anchor predictions may be computed based on features outside the anchor region. To align anchor classification results more strictly with the corresponding feature regions, this paper proposes a novel representation for lane lines called the “grid anchor”. Current methods fail to capture slope and directional information inherent in lane lines. To address this limitation, the grid anchor incorporates various attributes to encode the relevant physical information. Global features play a crucial role in scenarios where lane lines are difficult to detect. SCNN [13] achieves global feature interaction by applying convolutions within the feature layer in different directions. In some anchor-based detection methods, global features are aggregated through fully connected layers; however, this approach neglects the information from local positional features. To effectively integrate global features and local detailed features, this paper improves the feature pyramid network (FPN) [20] by incorporating global information refined using a multi-layer perceptron (MLP) and proposing a novel convolutional reordering upsampling method. Furthermore, in previous studies, the relational information between different anchors on the same lane line has yet to be fully exploited. To address this issue, this paper introduces an attribute correlation loss function. The loss function significantly enhances detection accuracy by incorporating feature association between anchors.
The proposed method was evaluated on two widely used benchmark datasets, CULane [13] and Tusimple [21]. Experimental results demonstrate that the proposed model achieves superior detection performance on both datasets. The main contributions of this study can be summarized as follows:
(1)
Grid Anchor Design: A novel representation for lane lines, termed “grid anchor”, was proposed. This design has the same resolution as the feature map and can be directly computed through convolution. Furthermore, it can accurately capture and describe the interrelations between lane lines by incorporating attribute information.
(2)
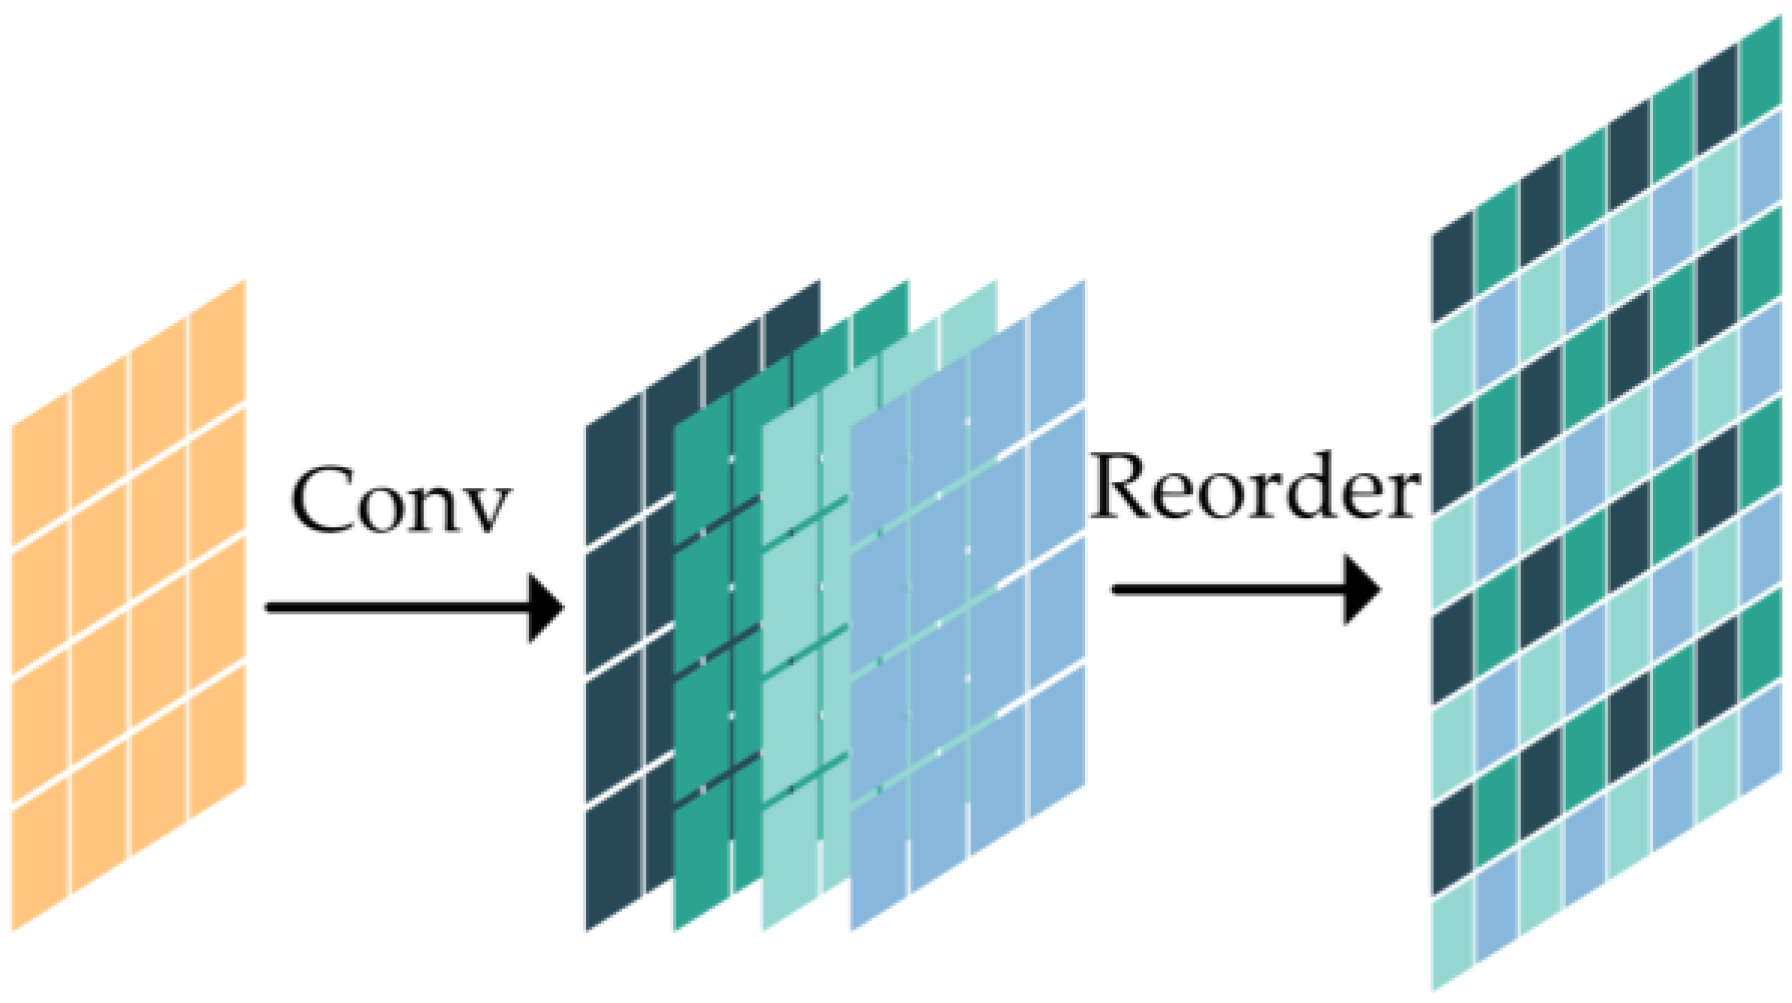
FPN Improvements: The FPN was optimized by integrating an MLP to construct a long-range feature association and proposing a convolutional reordering upsampling method. The improved FPN enhances the interaction between global and local features.
(3)
Attribute Correlation Loss: An attribute correlation loss function was designed to establish feature associations between anchors. This ensures that the loss value is not only dependent on the predictions of individual anchors but also influenced by the predictions of neighboring anchors.

2. Related Work

Lane detection involves extracting features from images to perform instance segmentation [4,22,23], with the output represented as either coordinate point sequences or curve equations for lane lines. Traditional detection methods [24,25,26,27,28] primarily rely on edge features of images. However, due to the superior robustness of deep learning techniques, detection methods based on deep learning have become the mainstream approach. Deep learning-based methods for lane detection can be categorized into four types: segmentation-based methods, keypoint-based methods, parameter-based methods, and anchor-based methods.
Segmentation-based methods. Inspired by semantic segmentation, researchers classify each pixel in an image as either background or lane lines to achieve precise alignment with the shape of the lane lines. LaneNet [12] adopts an instance segmentation approach to detect a variable number of lane lines, while simultaneously outputting learned inverse perspective transformation parameters to improve lane line fitting. SCNN [13] and RESA [14] leverage both horizontal and vertical convolutions to capture richer spatial information. Among these, RESA demonstrates higher computational efficiency due to its superior parallelism. ENet-SAD [11] employs Self-Attention Distillation (SAD) to better capture detailed features of high-level and low-level layers. UNet-ConvLSTM [15] combines CNN and RNN frameworks, utilizing temporal information from multiple images to further enhance detection accuracy. However, this category of methods involves significant computational overhead, making slow processing speed their primary limitation.
Keypoint-based methods. Some studies regard lane detection as a task of keypoint localization and confidence prediction. PINet [29] utilizes a stacked hourglass network to learn features at multiple scales of feature maps, outputs the confidence and offsets of keypoints, and adopts an instance segmentation approach to cluster the keypoints. FOLOLane [30] selects high-confidence points as keypoints at evenly spaced vertical positions in an image, predicts the horizontal offsets of adjacent keypoints, and reconstructs lane lines through geometric decoding. GANet [31] generates a confidence map for keypoints and an offset map relative to the starting points of lane lines through convolutional computations. Unlike other methods, GANet performs instance segmentation by clustering lane line starting points. However, keypoint-based methods heavily depend on low-level image features, leading to poor robustness in scenarios involving occlusions or environmental interference.
Parameter-based methods. Parameter-based methods model lane lines as piecewise spline curves and output polynomial coefficients by fitting lane line features. E2EDLSF [19] employs an end-to-end approach to regress solutions for lane lines fitted by the least squares method. PolyLaneNet [18] uses deep learning to directly output a fixed number of polynomial coefficients and the corresponding confidence scores for each polynomial. BezierLaneNet [16] horizontally flips high-level feature maps for symmetry and predicts the parameters of Bézier curves to determine the shape and position of lane lines. E2ET [17] extracts features using ResNet [32] and employs Transformers [33] to regress cubic polynomial parameters for lane lines. These methods transform the traditional two-step process of feature extraction and post-processing into a streamlined single-step process with direct output from the neural network. However, due to the diverse shapes of lane lines, fitting them with predefined parametric curves introduces inherent biases and lacks flexibility. As a result, these methods exhibit relatively low detection accuracy and require further improvement.
Anchor-based methods. Anchor-based detection methods first calculate the confidence scores and the relative coordinates of lane lines with respect to anchors using a neural network. Subsequently, confidence scores or non-maximum suppression (NMS) [34] are used to select appropriate anchors as prediction results. Line-CNN [6] and LaneATT [8] predefine a set of long straight lines with various starting points and angles along the image boundaries as anchor boxes. LaneATT incorporates an attention mechanism to aggregate global information and achieves higher efficiency compared to Line-CNN. CurveLane-NAS [9] employs neural architecture search (NAS) to determine the distances of lane lines relative to vertical anchor points. Ufldv2 [7] uses elongated anchors placed both horizontally and vertically to detect lane lines with varying angles but does not explicitly describe the relationship between anchor placement and lane angles. CLRNet [10] uses predefined anchors similar to Line-CNN and LaneATT, but introduces learnable starting points and angles for the anchors. Additionally, CLRNet proposes an IoU loss function specifically designed for lane lines. Since the shapes of predefined anchors are fixed, predicting lane lines with complex curvatures often requires features far from the anchor regions. As a result, this approach suffers from significant localization errors or fails to detect lane lines accurately in curved road scenarios.
Table 1 provides a detailed comparison that illustrates the relative advantages of the proposed method over four deep learning methods. Section 3.1 offers a thorough explanation of the reasons for these advantages.

3. Methods

This chapter introduces the lane detection model in detail. First, the data structure of the grid anchor is proposed, which serves both as a novel representation of lane lines and as the model’s output data. The process of converting ordinary lane line coordinate sequences into the grid anchor representation is also explained. The model adopts an FPN framework to perform detection on feature maps of different resolutions. However, the information transmission process between feature maps differs from that of the standard FPN structure. Finally, based on the standard loss function, an attribute correlation loss function is designed to establish feature associations between neighboring anchors.

3.1. Grid Anchor Representation Method for Lane Lines

The segmentation-based method localizes lane lines at the pixel level, while the anchor-based method localizes lane lines at the image region level. Inspired by these two approaches, we propose a grid anchor structure for lane detection. As illustrated in Figure 2, an image of size H × W is evenly divided into square regions, with a total of H s × W s regions. Each square region is referred to as an anchor. When viewed as a whole, the anchors resemble a grid laid over the image, hence the term “grid anchor”. The subscript s represents different division scales, and H s and W s denote the number of divisions along the horizontal and vertical axes of the image, respectively, corresponding to the number of grid anchors along the horizontal and vertical directions. To facilitate the computation of grid anchor detection results from extracted feature maps, H s and W s are set equal to the resolution of the feature maps.
In the FPN model architecture, three feature maps of different resolutions are used to compute detection results. Thus, s { 0 , 1 , 2 } , and the number of anchors follows a doubling relationship across scales, expressed as follows:
H 0 = H 1 2 = H 2 4 , W 0 = W 1 2 = W 2 4 .
s , i , j is used to represent an anchor at scale s , where i denotes the anchor’s position along the horizontal axis ( i { 0,1 , , W s 1 } ), and j denotes its position along the vertical axis ( j { 0,1 , , H s 1 } ). The four boundaries of the anchor s , i , j , denoted as B i , j s , can be expressed as follows:
B i , j s = i W W s x i + 1 W W s , y = j H H s x = i + 1 W W s , j H H s y ( j + 1 ) H H s i W W x i + 1 W W s , y = ( j + 1 ) H H s x = i W W s , j H H s y j + 1 H H s ,
where x represents the horizontal coordinate in the image, ranging from left to right, and y represents the vertical coordinate, ranging from top to bottom. The origin of the coordinate system is located in the image’s top-left corner.
As shown in Figure 2, to align image features with the classification results at corresponding positions, grid anchors containing lane line features are identified as lane lines, while others are labeled as background. This approach is essentially a binary classification of lane line existence, which is conceptually similar to low-resolution segmentation-based methods, as grid anchors only indicate whether lane line features exist within the anchor region. However, in practice, the lane line features within an anchor represent a line segment and include additional features such as the lane line’s index, slope, and position.
To increase the feature information represented by grid anchors, we introduced additional channel layers (Figure 3) following the binary classification channel for lane line existence in grid anchors (Figure 2). The channel layers that encode feature information within a grid anchor are referred to as attributes. After adding these channel layers, each grid anchor contains five attributes: existence, instance, direction, offset, and slope. The output values of grid anchors at different scales are denoted as A s , where A c , i , j s represents the value of A s at channel c , horizontal position i , and vertical position j . As shown in Figure 3, the attributes represented by different channel layers (Figure 3a) are explained in detail using the grid anchor ( s , i , j ) as an example (Figure 3b).
The existence attribute ( A 0 , i , j s ) corresponds to the original binary classification channel in the grid anchor, indicating whether lane line features exist within the anchor. When the attribute value is set to 1, the grid anchor is classified as a lane line; when the attribute value is set to 0, the grid anchor is classified as background. The instance attributes ( A 1 , i , j s , , A n , i , j s ) are designed for instance segmentation of lane lines, facilitating the identification of the lane line index to which features within anchors belong. This attribute contains n channels, where n corresponds to the maximum number of lane lines present in the image. During prediction, the index of the channel with the maximum value indicates the lane line index to which features within anchors belong. If no lane line features exist, the channel values for this attribute are set to 0.
The direction attributes ( A n + 1 , i , j s , A n + 2 , i , j s ) describe the position of the next anchor to which the lane line within the current anchor extends, provided the lane line exists. The direction of the lane line is defined as extending from the vanishing point of the lane line toward the edge of the image. To ensure the spatial continuity of lane lines, the direction attributes of an anchor must point to another anchor located either to its left, right, or directly below. The direction attribute consists of two channel layers. When a lane line is present, the channel values are determined based on the direction encoding table (Table 2). If no lane line features exist, the channel values for this attribute are set to 0.
The offset attribute ( A n + 3 , i , j s , A n + 4 , i , j s ) is designed to correct errors caused by using the anchor’s center coordinates as the detection result. It comprises the horizontal offset A n + 3 , i , j s and vertical offset A n + 4 , i , j s , resulting in two channel layers for this attribute. The slope attribute ( A n + 5 , i , j s ) indicates the average slope of the lane line segment within the anchor and is represented by a single channel layer. Considering that lane lines may be parallel to the image’s Y-axis, causing the slope to approach infinity, the slope attribute is calculated as the reciprocal of the average slope of the lane line.
Based on their definitions, the existence, instance, and direction attributes belong to classification tasks, while the offset and slope attributes belong to regression tasks.
Grid anchors are inspired by segmentation and anchor-based methods. The arrangement of grid anchors is similar to pixel points in segmentation, as they are arranged tightly and regularly on the image. Therefore, grid anchors can flexibly represent lane lines of arbitrary shape and position, just like segmentation methods. Grid anchors adopt the anchor box concept from anchor-based methods, discretizing the image into regions and using fewer data points to represent lane lines.
Grid anchors use attribute values to represent the classification results of pixels within an image region, which reduces computational complexity and improves speed compared to segmentation methods. Conventional anchor-based methods typically use predefined anchors with fixed shapes to represent lane markings. However, predefined anchor shapes are often difficult to fit various lane marking shapes. To address this, anchor-based methods use offsets to correct positional errors, but the prediction results may be influenced by features outside the anchor region, which increases the difficulty of training and prediction. The detection method of grid anchors employs a series of grid anchors to jointly represent a single lane marking. Since grid anchors are selected and combined by the model based on features, they do not have fixed positions or shapes, making them flexible enough to represent lane markings of arbitrary shape and position. In terms of data format, grid anchors share the same resolution as the feature map, and the feature and classification data at corresponding positions align with the image features. The prediction results of the grid anchors are computed from the features at corresponding positions on the feature map, allowing the use of convolution for direct computation. This not only reduces the complexity of model training and prediction tasks but also eliminates the need for the complex process of selecting anchor boxes. Furthermore, grid anchors incorporate a directional attribute to represent the internal relationships within a lane line—an aspect not present in other methods.

3.2. Calculation of the Grid Anchor Labels

The grid anchor A s , which represents lane lines, is also the output of the prediction model. To compute the loss function, it is necessary to generate lane line label data T s for the grid anchors. The process of obtaining label values for each anchor’s attributes begins by determining the lane line segment within the anchor. Typically, lane line label data are represented as coordinate point sequences. For the kth lane line, this can be expressed as follows:
L a n e k = x 1 k , y 1 k , x 2 k , y 2 k , , x m k , y m k , , x l k , y l k
where x m k , y m k denotes the mth coordinate point of the kth lane line ( k { 1 , , n } , m { 1 , , l } ), and l represents the number of coordinate points in a single lane line.
When the number of anchors covering the image is large, the area covered by each anchor becomes smaller, and the lane line within the anchor can be approximated as a line segment (as shown in Figure 4). Consequently, the lane line segment within an anchor can be represented by the intersection points between the lane line and the anchor’s boundaries. The attribute values of each grid anchor are computed individually (Algorithm 1). During the computation, two adjacent coordinate points from each lane line are sequentially selected to form a lane line segment (Statements 2–9 in Algorithm 1). The intersection coordinates are then determined by this lane line segment and the four boundaries of the grid anchor. If an intersection point exists, the two adjacent points belong to the kth lane line, and the value of the kth channel in the instance attribute is set to 1 (Statement 6). Since all other channel values of this attribute are initialized to 0 (Statement 1), no further modification is required.
Algorithm 1: The transformation process of label data from lane line coordinates to anchor attribute values.
1Initialization:  A c , i , j s 0 , c { 0 , , n + 5 }
2for all  k 1 , n  do
3 for all  m 1 , l 1  do
4 Compute the intersection points between the lane line segment formed by x m k , y m k and x m + 1 k , y m + 1 k and the anchor boundaries.
5 if intersection points exist then
6 Record the intersection coordinates, and T k , i , j s = 1 ,   T n + 5 , i , j s = x m + 1 k x m k y m + 1 k y m k .
7 end if
8 end for
9end for
10if the number of intersection points is 2 then
11 if  x i , j p 1 = i + 1 W W s   and   x i , j p 1 = i + 1 W W s  then
12 The anchor is classified as background, all attribute values are set to 0, and the program ends.
13 end if
14 The anchor is classified as lane lines, and the attribute values are calculated based on the two intersections.
15end if
16if the number of intersection points is 1 then
17 if  y i , j p = ( j + 1 ) H H s  then
18 The anchor is classified as background, all attribute values are set to 0, and the program ends.
19 end if
20 The anchor is classified as lane lines, and the attribute values are calculated based on the single intersection.
21end if
Figure 4 shows three types of intersections between lane lines and the anchor boundaries.

3.2.1. Two Intersections

When a lane line intersects the boundaries of an anchor at two distinct points (Statements 10–15), two scenarios can arise based on the position of the lane line relative to the anchor:
Case 1: The lane line passes through the interior region of the anchor (e.g., Anchor 1 and Anchor 3 in Figure 4a and Anchor 2 and Anchor 4 in Figure 4b). In this case, the grid anchor is classified as a lane line, and the attribute values of the anchor are computed. The two intersection points are denoted as x i , j p 1 , y i , j p 1 and x i , j p 2 , y i , j p 2 , where the intersection point with the larger y-coordinate is labeled as x i , j p , y i , j p . The direction attribute of the anchor can be determined from Table 2 using the coordinates of x i , j p , y i , j p .
Based on the definitions of the offset and slope, the attribute values are calculated as follows:
T n + 3 , i , j s = x i , j p 1 + x i , j p 2 2 2 i + 1 W 2 W s
T n + 4 , i , j s = y i , j p 1 + y i , j p 2 2 ( 2 j + 1 ) H 2 H s
T n + 5 , i , j s = x i , j p 2 x i , j p 1 y i , j p 2 y i , j p 1
Case 2: The lane line does not pass through the interior region of the anchor but instead lies precisely along the left or right boundary of the anchor (e.g., Figure 4c). In this scenario, the two intersection points are the two vertices of the anchor. Following the horizontal flooring rule, lane line features are assigned to the anchors on the right (e.g., Anchor 1 and Anchor 4 in Figure 4c), while the anchors on the left (e.g., Anchor 2 and Anchor 3 in Figure 4c) do not contain lane line features. Consequently, Anchors 1 and 4 in Figure 4c are classified as lane lines, and their attribute values are computed using the aforementioned method. Anchors 2 and 3 in Figure 4c are classified as background (Statements 11–13), and all their attribute values are set to 0.

3.2.2. Single Intersection

When a lane line intersects the boundary of an anchor at only one point (Statements 16–21), and the intersection occurs exclusively at the anchor’s vertex (e.g., Anchor 2 and Anchor 4 in Figure 4a and Anchor 1 and Anchor 3 in Figure 4b), classification is determined based on the horizontal flooring rule. In this case, Anchor 2 in Figure 4a and Anchor 1 in Figure 4b do not contain lane line features and are classified as background, with all attribute values set to 0 (Statements 17–19). Conversely, Anchor 4 in Figure 4a and Anchor 3 in Figure 4b contain lane line features and are classified as lane lines. The single intersection point is denoted as x i , j p , y i , j p , and the direction attribute of the anchor is determined using Table 2. Since there is only one intersection, the slope attribute value is calculated as the reciprocal of the slope of the lane line segment formed by the two adjacent lane line coordinate points that define this intersection (Statement 6). The formula for the offset attribute values is as follows:
T n + 3 , i , j s = x i , j p 2 i + 1 W 2 W s
T n + 4 , i , j s = y i , j p 2 j + 1 H 2 H s

3.2.3. No Intersection

When no intersection occurs between the lane line and the anchor boundary—indicating that the lane line neither passes through the interior region of the anchor nor touches its boundary—the anchor is classified as background, with all attribute values set to 0. In this case, the computation is completed during initialization (Statement 1).
Thus, the attribute values of an anchor can be computed based on the number and location of intersection points. Algorithm 1 illustrates the calculation process for the attribute values of an anchor ( s , i , j ) .
During the label conversion and computation process, an anchor’s attribute values depend only on its position and the sequence of lane line coordinates. Different anchors are not dependent on each other, enabling parallel computation to ensure efficiency.

3.3. Network Design

Lane lines are detection targets that represent elongated structures with a large span but a small area in images, exhibiting long-range dependency relationships. On the other hand, due to occlusions, wear, and dashed types, the lane line features in images tend to be discontinuous. As a result, visible features in the image must be leveraged to complete the missing lane line information. The detection model must not only capture global information and establish long-range feature associations to compensate for missing features but also focus on the fine details within the image to accurately regress the coordinates of the lane lines.
The feature pyramid network (FPN) [20] constructs connections between multi-resolution feature maps both in bottom-up and top-down directions, as well as lateral connections within feature maps at the same resolution. This architecture is designed to simultaneously acquire high-level semantic information and low-level detail information, with minimal computational overhead. In the FPN model, lateral connections at the top-level feature map are implemented using 1 × 1 convolution [35], which only performs data associations across different channel layers. However, it does not establish data associations across different spatial locations within the high-level feature map. To address this, we have incorporated a multi-layer perceptron (MLP) into the top-down process of the original FPN model, enabling data associations across different spatial locations within the feature map.
In Figure 5, the model consists of three-layer lateral connections, comprising the top, middle, and bottom layers, and outputs the corresponding recognition results 0, 1, and 2.
The left side of the model is the main architecture of ResNet, and the feature maps from ResNet with successively halved resolutions are used as inputs to the lateral connections. The lateral connection utilizes a 1 × 1 convolution (red arrow) to reduce the number of channels, producing the corresponding local feature map (red). To establish data connections across different spatial locations within the feature map and facilitate long-range feature associations, the top-layer local feature map is flattened (yellow arrow) into a 1D vector, which serves as input to the MLP. The 1D vector output from the MLP is then reshaped to the original resolution of the local feature map, resulting in the global feature map (yellow). To simultaneously obtain both the features corresponding to the anchor’s position and the globally completed features, at the top layer, the local and global feature maps are concatenated (blue rounded box) along the channel dimension. The concatenated result is then passed through a 3 × 3 convolution to output recognition result 0. At the middle and bottom layers, in addition to the local feature maps generated by lateral connections, the results include the diffusion feature map (blue), produced through upsampling (blue arrow), and the global feature map, produced via the MLP. The concatenated result of these three feature maps is passed through a 3 × 3 convolution to output recognition results 1 and 2, respectively. A distinguishing characteristic of the bottom layer, compared to the middle layer, is that the upsampling input at the bottom layer is the concatenated result of the middle-layer local and diffusion feature maps, while the upsampling input at the middle layer is the local feature map from the top layer.
Figure 6 illustrates the MLP used in the model, corresponding to the processing flow of the red arrow in Figure 5. At the top layer, the number of input and output nodes of the MLP equals the data size of the top-layer local feature map. For cross-layer MLPs, in order to maintain consistent feature map resolutions within the same layer for easy concatenation along the channel dimension, the number of output nodes is four times that of the input nodes.
Figure 7 describes the convolutional reordering upsampling method used in the model, which corresponds to the blue arrow in Figure 5. Given that the features obtained at different locations during upsampling may not be identical, the upsampling method does not use the nearest neighbor interpolation approach as in FPN. Instead, it combines convolution and reordering. Assuming the input format for upsampling is C × H × W , after the 3 × 3 convolution, the output data format is 4 C × H × W , denoted as B . Subsequently, after the reordering operation, the data are output in the format C × 2 H × 2 W , denoted as R . The reordering operation does not simply reorder by sequence position, but rather reorders by nearby positions. Equation (9) presents the calculation method for reordering, where % denotes the modulo operation, and ⌊⌋ represents the floor function.
B i , j , k n = 2 k + i % 4 % 2 l = i 4 ,   m = 2 j + i % 4 2 R l , m , n ,   i 0 , , 4 C 1 , l 0 , , C 1 , j 0 , , H 1 , m 0 , , 2 H 1 , k 0 , , W 1 , n 0 , , 2 W 1
As a result, the outputs at the middle and lower layers not only include features from the corresponding positions but also include neighborhood features obtained through upsampling from the high layers and global features drawn by the MLP. During the forward propagation process, the model extracts features through downsampling for local feature fusion, decodes the lane semantics through lateral connections and upsampling, and establishes long-range feature associations through the MLP. Finally, the model outputs the corresponding grid anchor recognition results at three different feature map resolutions.

3.4. Attribute Correlation Loss Function

The model outputs detection results on feature maps at three different scales. During training, the corresponding labels for each scale are used to compute the loss function, which is then backpropagated. The total loss of the model is the sum of the losses at the top, middle, and bottom layers. Since gradients tend to decrease as they propagate through deeper layers during backpropagation, the contribution of each layer’s loss to the overall loss is not equal.
L = s = 0 2 α s L s
The single-layer loss function L s measures the error between the predictions at that layer and the corresponding labels. Based on the grid anchor representation of lane lines, the attributes of an anchor consist of two parts: one part indicates the lane line features within the anchor itself, and the other part indicates the continuity relationship between the anchor and its neighboring anchors. According to the composition of the grid anchor information, L s can be decomposed into two main components: the intra-anchor loss function L s i and the inter-anchor loss function L s o .
L s = L s i + L s o
From the definition of the attributes of the grid anchor, it can be seen that the first n + 3 channel layers represent the existence, instance, and direction attributes, which are associated with classification tasks, while the subsequent three channel layers represent the offset and slope attributes, which are associated with regression tasks. The intra-anchor loss function L s i is composed of a classification part L s i c and a regression part L s i r . These components are calculated based on the model’s output values A s (the first n + 3 channel values of A s are normalized through the s i g m o i d function) and the corresponding grid anchor labels T s . L s i c and L s i r are accumulated from the attribute loss values of all anchors.
L s i = α s i c L s i c + α s i r L s i r ,
L s i c = c = 0 n + 2 i = 0 H s 1 j = 0 W s 1 β L C E A c , i , j s , T c , i , j s ,         T 0 , i , j s = 1       L C E A c , i , j s , T c , i , j s ,         T 0 , i , j s = 0 ,
Here, the coefficients α s i c and α s i r represent the proportions of the classification loss L s i c and the regression loss L s i r in the loss function L s i , respectively. L C E [36] represents the binary cross-entropy loss function, and β is to balance the number of positive and negative samples ( β > 1 ). A c , i , j s and T c , i , j s represent the output value A s and the label T s at channel layer c , vertical position i , and horizontal position j , respectively.
L s i r = c = n + 3 n + 5 i = 0 H s 1 j = 0 W s 1 L 1 A c , i , j s , T c , i , j s ,         T 0 , i , j s = 1 0                                                 ,         T 0 , i , j s = 0 ,
Here, L 1 denotes the smooth L1 loss function [37]. For the regression task, it is meaningless to calculate the loss for the offset and slope properties of the background anchor ( T 0 , i , j s = 0 ), so their loss value is calculated as 0.
L s o establishes the attribute correlation between adjacent anchors according to the direction attribute of the label T s . It mainly consists of two components:
L s o = α s i e d L s o e d + α s i o k L s o o k ,
where α s i e d and α s i o k are the proportion coefficients. L s o e d and L s o o k are accumulated from the loss values L i , j e d and L i , j o k of all anchors.
L s o e d = i = 0 H s 1 j = 0 W s 1 L i , j e d ,   L s o o k = i = 0 H s 1 j = 0 W s 1 L i , j o k
According to the meaning of the direction attribute, the values of T n + 1 , i , j s and T n + 2 , i , j s indicate the next anchor that the anchor i , j points to, and the pointed-to anchor should be classified as a lane line. When T n + 1 , i , j s = 1 , T n + 2 , i , j s = 0 , i 1 , anchor i , j points to its leftward anchor i 1 , j . L i , j e d and L i , j o k computation formulas are as follows:
L i , j e d = L 1 A 0 , i 1 , j s + A n + 1 , i , j s 2 , 1 + L 1 A 0 , i 1 , j s A n + 2 , i , j s , 1 ,
L i , j o k = L 1 A n + 3 , i , j s + W W s A n + 3 , i 1 , j s , A n + 4 , i , j s A n + 4 , i 1 , j s A n + 5 , i , j s + A n + 5 , i 1 , j s 2 ,
where L i , j e d correlates the directional attributes ( A n + 1 , i , j s , A n + 2 , i , j s ) of the current anchor i , j with the existence attribute ( A 0 , i 1 , j s ) of the pointed anchor i 1 , j . During parameter updates, the values A n + 1 , i , j s and A 0 , i 1 , j s move towards 1, so the combination method of A 0 , i 1 , j s + A n + 1 , i , j s 2 is adopted. On the other hand, the value A n + 2 , i , j s moves towards 0, so the combination method of A 0 , i 1 , j s A n + 2 , i , j s is used. L i , j o k correlates the offset and slope attributes of the current anchor and the pointed anchor. Assuming that the slope of the lane line changes uniformly (as shown in Figure 8a), the reciprocal of the slope of the straight line (yellow slanted line) formed by the lane line points predicted by the two anchors can be calculated from the offset attribute value and the anchor boundary length and is equal to the average of the slope attribute values of the two anchors, as shown in Equation (19).
A n + 3 , i , j s + W W s A n + 3 , i 1 , j s A n + 4 , i , j s A n + 4 , i 1 , j s = A n + 5 , i , j s + A n + 5 , i 1 , j s 2
In the calculation of L i , j o k , to avoid the case of 0 as a divisor, the divisor A n + 4 , i , j s A n + 4 , i 1 , j s is moved to the other side to convert it to multiplication. Similarly, when T n + 1 , i , j s = 1 ,   T n + 2 , i , j s = 1 ,   j H s 2 , anchor i , j points to its downward anchor i , j + 1 (as shown in Figure 8b), and the formulas for L i , j e d and L i , j o k are as follows:
L i , j e d = L 1 A 0 , i , j + 1 s + A n + 1 , i , j s 2 , 1 + L 1 A 0 , i , j + 1 s + A n + 2 , i , j s 2 , 1
L i , j o k = L 1 A n + 3 , i , j s A n + 3 , i , j + 1 s ,   A n + 4 , i , j s + H H s A n + 4 , i , j + 1 s A n + 5 , i , j s + A n + 5 , i , j + 1 s 2
When T n + 1 , i , j s = 0 , T n + 2 , i , j s = 1 , i W s 2 , the anchor i , j points to its rightward anchor i + 1 , j (as shown in Figure 8c), and the formulas for L i , j e d and L i , j o k are as follows:
L i , j e d = L 1 A 0 , i + 1 , j s A n + 1 , i , j s , 1 + L 1 A 0 , i + 1 , j s + A n + 2 , i , j s 2 , 1
L i , j o k = L 1 A n + 3 , i , j s W W s A n + 3 , i + 1 , j s , A n + 4 , i , j s A n + 4 , i + 1 , j s A n + 5 , i , j s + A n + 5 , i + 1 , j s 2  
In other cases, anchors are classified as background, with direction attribute values equal to 0, or the pointed anchor is beyond the range of H s × W s , and then L i , j e d = 0 ,   L i , j o k = 0 .
Overall, the loss function is the cumulative result of the loss values of each attribute as well as the loss values of all anchors and is programmed using a matrix computation method to ensure the rapidity of the computation.

3.5. Model Inference

The model produces multiple layer outputs, with A 2 serving as the model’s final output. A 2 still represents the lane line within the grid anchor system, but during testing or practical use, it is necessary to output the sequence of coordinates for the lane line. Therefore, this section outlines the process by which the grid anchor data are converted into lane line coordinates. The classification data from the first n + 3 channels of the grid anchors can be used as the classification basis for the anchors. First, the values of the first n + 3 channels of the predicted results are thresholded at 0.5, with the following thresholding formula:
A ^ c , i , j 2 = 1 ,   i f   A c , i , j 2 0.5 0 ,   i f   A c , i , j 2 < 0.5
Based on the definition of the attributes, an anchor must meet three conditions to be classified as a lane line:
(1)
The anchor must contain lane line features, with the existence attribute A ^ 0 , i , j 2 = 1 ;
(2)
The lane line within the anchor must be a part of a single lane line, with the sum of the instance attribute channel values equaling 1, c = 1 n A ^ c , i , j 2 = 1 ;
(3)
The anchor classified as a lane line must contain directional features, with the sum of the direction attribute values greater than or equal to 1, A ^ n + 1 , i , j 2 + A ^ n + 2 , i , j 2 1 .
Anchors that meet the above three conditions are classified as lane line anchors. Then, the coordinates of the lane line point x ^ i , j , y ^ i , j are calculated using the center coordinate of the grid anchor and their offset attribute values.
x ^ i , j = 2 j + 1 W 2 W s + A n + 1 , i , j 2 ,   y ^ i , j = 2 i + 1 H 2 H s + A n + 2 , i , j 2
In the predicted lane line coordinates, points with the same instance attribute values ( A ^ 1 , i , j 2 , , A ^ n , i , j 2 ) are clustered as belonging to the same lane line. Within the same lane line, the coordinate points are rearranged in ascending order based on their vertical coordinate values, which constitutes the inference result.

4. Experimental Results

4.1. Experimental Setting

4.1.1. Datasets and Evaluation Metrics

In this study, the proposed lane detection algorithm is trained and tested on the Tusimple [21] and CULane [13] lane detection benchmark datasets. Table 3 presents the specific information of the two datasets. The Tusimple dataset primarily includes urban roads and highways, while the CULane dataset presents diverse and challenging scenarios such as shadow occlusion, nighttime, and rainy weather, allowing for the evaluation of the model’s ability to recognize difficult situations and its generalization capability.
To quantify the model’s performance on the two datasets, both CULane and Tusimple use the F 1 score for evaluation, calculated as follows:
F 1 = 2 × P r e c i s i o n × R e c a l l P r e c i s i o n + R e c a l l ,
where P r e c i s i o n = T p r e d T p r e d + F p r e d , R e c a l l = T p r e d T p r e d + M p r e d , T p r e d represents the number of correctly predicted lane lines, F p r e d represents the number of incorrectly predicted lane lines, and M p r e d represents the number of undetected lane lines. However, the criteria for determining correct predictions differ between the two datasets. In the CULane dataset, the width of each lane line is 30 pixels, and a predicted lane line is considered correct if the Intersection over Union (IoU) with the ground truth exceeds 0.5. Otherwise, it is considered an incorrect prediction. In the Tusimple dataset, the number of correctly predicted points within a lane line is first calculated. A predicted point is considered correct if its deviation from the ground truth is within 20 pixels. If the ratio of correctly predicted points within a lane line exceeds 0.85, the predicted lane line is considered correct.
Additionally, in the Tusimple dataset [21], the proportion of correctly predicted points, the False Positive Rate ( F P ), and the False Negative Rate ( F N ) are also evaluation metrics. Their calculation formulas are as follows:
A c c u r a c y = c l i p C c l i p c l i p S c l i p ,   F P = F p r e d F p r e d + T p r e d ,   F N = M p r e d T p r e d + M p r e d ,
where C c l i p and S c l i p represent the number of correctly predicted points and ground truth points in a c l i p , respectively.

4.1.2. Implementation Details

For convenience in computation, the CULane and Tusimple images fed into the model are resized to 1600 × 320 and 960 × 480, respectively. The model training process consists of 40 iterations using the SGD optimizer with an initial learning rate of 0.015. The learning rate is reduced by 1/10 at epochs 15 and 25. The deep learning framework used for the model is PyTorch 1.12.1, and distributed training is performed on a server equipped with 8 NVIDIA GeForce RTX 2080 Ti GPUs, with a batch size of 12 per GPU. During training, random rotations, scaling, and translations of the images are applied for data augmentation. To prevent overfitting, dropout is used in the MLP with a dropout rate of 0.3.

4.2. Results

In this section, we present the test results of the model on two lane detection benchmark datasets, which are CULane and Tusimple.

4.2.1. Results on CULane

Table 4 presents a comparison of the proposed model (GAAC) with other mainstream lane detection methods on the CULane lane detection benchmark dataset. The proposed lane expression using grid anchors allows the direct use of convolutional results as outputs, without the need for a post-processing feature module. This results in a streamlined model architecture. The model achieves detection accuracies of 76.22% and 76.41% on the ResNet18 and ResNet34 backbone models, respectively, outperforming UFLDv2 (ResNet34) by 0.5%, with some scenarios reaching optimal results. In the normal scenario, our method achieves a first-place accuracy of 93.05%, outperforming LaneATT by 0.9% and UFLDv2 by 0.5%, demonstrating excellent lane detection accuracy in standard conditions. In the curve scenario, the model achieves a first-place accuracy of 73.27%, outperforming FOLOLane by 3.8%. This improvement is attributed to the grid anchor’s flexible representation, which does not have the fixed shape constraints of parameter curves or line-shaped anchors, making it more suitable for accurate lane localization in curved scenarios. In the arrow scenario, the model achieves a first-place accuracy of 89.01%, demonstrating that while the model performs well in standard and curved scenarios, it still maintains discriminative capability for lanes with similar features. Additionally, in the night scenario, the model achieves a second-place accuracy of 73.27%. This performance is due to the illumination challenges in nighttime scenes that cause feature loss in the images. The use of an MLP helps recover some of the lost lane features.
As shown in Table 4, the proposed method performs relatively well in the normal, arrow, curve, and night scenarios, while its performance in other extreme environments is relatively average. This may be attributed to the fact that the model uses convolutional outputs directly as detection results, lacking the feature post-processing layers present in other models. Additionally, the dataset contains a large number of samples in normal scenarios, while extreme environment samples are relatively scarce. This imbalance in the dataset is also a contributing factor to the model’s average performance in extreme environments.

4.2.2. Results on Tusimple

Table 5 shows a comparison of our model with other lane detection methods on the Tusimple lane detection benchmark dataset. Without the feature post-processing module, the proposed model achieved a top accuracy of 96.47% in terms of F1 score, demonstrating the model’s competitive advantage. The Tusimple dataset mainly consists of highway scenes, where methods are near performance saturation, resulting in slight differences in accuracy metrics such as the accuracy (Acc) score.

4.2.3. Qualitative Results

Figure 9 presents qualitative comparison results of our method, along with RESA, UFLDv2, and BezierLane on the CULane dataset. As shown, the UFLDv2 model, which uses hybrid anchors, exhibits unstable performance in crowd scenes due to the lack of continuity in anchor predictions. Both BezierLane, based on parameterized curves, and UFLDv2, using line-shaped anchors, struggle to fit lane lines with large curvatures in curved scenarios. Our model can accurately locate lane lines in normal, crowd, curve, and night scenarios, demonstrating its overall robustness. The detection model, implemented using the PyTorch framework, achieves a detection speed of 94 FPS on an NVIDIA GeForce RTX 2080 Ti GPU.

4.3. Ablation Study

To demonstrate the superiority of the method proposed in Section 3, we conducted an ablation study on the CULane dataset. All experiments in this section were implemented using the ResNet-34 backbone model, and the hyperparameters were set as described in Section 4.1.

4.3.1. Impact of Different Attributes

Section 3.1 discussed the grid anchor-based lane line representation, which includes five attributes. Among these, existence and instance attributes correspond to traditional low-resolution segmentation-based methods, while the direction, offset, and slope attributes are novel to the grid anchor representation. To evaluate the impact of these added attributes on the model’s performance, we constructed loss functions based on partial or all of these five attributes during training. To maintain the principle of single-variable testing, the experiments used only the intra-anchor loss function to converge the model.
From Table 6, it can be observed that compared to segmentation-based methods, learning any single additional attribute improves the model’s detection performance. When the model learns all the attributes during training, the detection accuracy is maximized. This is because the new attributes provide additional information dimensions that guide the model to better fit the dataset, expanding the range of information the model can focus on. On the other hand, the offset attribute transforms the discretized coordinates produced by semantic segmentation into continuous coordinates within the image range, thereby improving the model’s expression accuracy. Therefore, the grid anchor-based lane line representation method enhances the model’s ability to capture lane line features.

4.3.2. Model Comparison

In Section 3.2, we proposed a convolutional reordering upsampling method and added a multi-layer perceptron (MLP) to the cross-layer connections, as an improvement over the original FPN model. To evaluate the effect of these two improvements, we compared the original FPN model, the FPN model with a single improvement, and the fully improved FPN model. In this ablation study, the intra-anchor loss function was also used to converge the model.
Table 7 presents the experimental results for the different models. As shown, the new upsampling method and the addition of the MLP both enhance the model’s detection accuracy. The convolutional reordering upsampling method, which combines convolution and reordering operations, considers surrounding features to fill the gaps in the upsampled feature maps, and it also increases the model’s parameter count, thereby improving its fitting ability to the dataset. The addition of MLP also increases the number of parameters in the model. Compared to convolution, MLP can connect all the information from high-level feature maps, providing the model with a global view. Thus, the fully improved FPN model, as shown in Table 5, achieves the highest detection accuracy, and it can serve as a baseline model for other object detection tasks.

4.3.3. Impact of Loss Function on Model Performance

Section 3.3 introduced the anchor-based loss function used to converge the model. The loss function consists of two parts: one part is the intra-anchor loss function L s i , which is constructed using cross-entropy and L1 smooth loss functions, and the other part is the inter-anchor loss function L s o , constructed using the L1 smooth loss function. To verify the effectiveness of the inter-anchor loss function, we selectively incorporated L s o e d and L s o o k on top of L s i to converge the model. The experiments were performed on the fully improved FPN model using different combinations of loss functions.
Table 8 shows the model’s detection accuracy under different loss functions. It can be observed that both L s o e d and L s o o k improve the model’s detection accuracy. This is because both of these loss functions calculate the difference between predictions and labels, and their gradients for backpropagation are similar to those of L s i , thus driving the model towards the same direction for convergence. Unlike L s i , L s o e d and L s o o k consider the loss values of neighboring anchors, balancing the gradients across all anchors, and ensuring that the model learns consistently across different image regions. Therefore, when both L s o e d and L s o o k are applied, the convergence effect is the best, resulting in a 0.61% increase in detection accuracy.

4.4. Experimental Summary

The experimental results demonstrate that the proposed model achieves impressive lane detection performance across both the CULane and Tusimple datasets. The model excels in various scenarios, including normal (93.05%), curve (73.27%), and arrow (89.01%) scenarios, outperforming existing methods such as LaneATT and UFLDv2. The grid anchor-based lane representation, which allows for flexible and precise lane localization, is a key factor in the model’s success, especially in curved scenarios. The introduction of convolutional reordering upsampling and the integration of a multi-layer perceptron (MLP) further enhanced the model’s feature extraction capabilities, improving overall accuracy. Additionally, the loss function incorporating both intra-anchor and inter-anchor loss components contributed to more stable convergence and better detection results. However, the model’s performance in extreme environments (e.g., fog and rain) remains relatively average, likely due to the dataset imbalance and the absence of post-processing modules. Future improvements could focus on incorporating more diverse data and enhancing post-processing steps to address these challenges.

5. Conclusions

In this paper, a novel lane line representation method called the grid anchor was proposed. The grid anchor not only corresponds to the feature map structure but also introduces more detailed attributes that specify the lane line’s feature associations. To ensure that all positions in the feature map integrate global features, the model includes an MLP for feature propagation from top to bottom layers. Additionally, a convolutional reordering upsampling method was introduced. In the grid anchor representation, to enhance the feature associations between adjacent anchors, an attribute correlation loss function was constructed based on the direction attribute, grounded in the classification and regression loss functions. The model was evaluated on two mainstream lane detection datasets: CULane and Tusimple. The experimental results show that our model achieves first-place accuracy in both normal and curved scenarios, as well as good speed performance. Ablation studies also quantified the accuracy improvement brought by each proposed module.
The model still has considerable room for improvement. Each grid anchor’s detection result is computed using features from the corresponding location and its neighborhood. However, lane lines exhibit higher feature associations with each other, so using deformable convolutions to calculate the output grid anchor data could further improve the model’s performance. Additionally, incorporating a feature post-processing module into the model could further improve its robustness. Grid anchors calculate outputs based on feature maps without requiring additional detection models, making it possible to perform lane detection alongside other object detection tasks. Future research could focus on integrating lane detection and other road object detection using grid anchors, bringing the approach closer to real-world application needs. Additionally, the construction of future datasets should emphasize the collection of samples in extreme scenarios to provide diverse training and testing conditions, thereby promoting model performance improvements in such challenging environments.

Author Contributions

Conceptualization, Q.F.; data curation, C.C. and H.W.; formal analysis, J.S.; funding acquisition, F.C. and G.X.; methodology, Q.F.; project administration, F.C. and G.X.; resources, C.C., F.C. and J.S.; software, Q.F. and H.W.; supervision, C.C., F.C. and G.X.; validation, J.S. and H.W.; visualization, C.C.; writing—original draft, Q.F.; writing—review and editing, G.X. All authors have read and agreed to the published version of the manuscript.

Funding

This work was funded by the National Natural Science Foundation of China (52075345), the Department of Education of Guangdong Province (2022KCXTD027), the Ordinary University Engineering Technology Development Center Project of Guangdong Province (2019GCZX006), the Key Area Project for Higher Education Institution of Guangdong Province (No. 2023ZDZX3028), the Guangdong Key Construction Discipline Research Ability Enhancement Project (2021ZDJS108 and 2022ZDJS114), and the Self-made Experimental Instruments and Equipment Project of Shenzhen Technology University (JSZZ202301013).

Data Availability Statement

The data that support the findings of this study are openly available in CULane at http://dx.doi.org/10.48550/arXiv.1712.06080 and Tusimple. These datasets were derived from the following public domain resources: https://xingangpan.github.io/projects/CULane.html; https://github.com/TuSimple/tusimple-benchmark.

Acknowledgments

The authors gratefully acknowledge the support from the National Natural Science Foundation of China, the Science and Technology Planning Project of Shenzhen Municipality, the Ordinary University Engineering Technology Development Center Project of Guangdong Province, and the Department of Education of Guangdong Province.

Conflicts of Interest

The authors declare no conflicts of interest.

References

  1. Nidamanuri, J.; Nibhanupudi, C.; Assfalg, R.; Venkataraman, H. A progressive review: Emerging technologies for ADAS driven solutions. IEEE Trans. Intell. Veh. 2021, 7, 326–341. [Google Scholar] [CrossRef]
  2. Gu, J.; Wang, Z.; Kuen, J.; Ma, L.; Shahroudy, A.; Shuai, B.; Liu, T.; Wang, X.; Wang, G.; Cai, J. Recent advances in convolutional neural networks. Pattern Recognit. 2018, 77, 354–377. [Google Scholar] [CrossRef]
  3. Li, Z.; Liu, F.; Yang, W.; Peng, S.; Zhou, J. A survey of convolutional neural networks: Analysis, applications, and prospects. IEEE Trans. Neural Netw. Learn. Syst. 2021, 33, 6999–7019. [Google Scholar] [CrossRef] [PubMed]
  4. Tang, J.; Li, S.; Liu, P. A review of lane detection methods based on deep learning. Pattern Recognit. 2021, 111, 107623. [Google Scholar] [CrossRef]
  5. Zakaria, N.J.; Shapiai, M.I.; Abd Ghani, R.; Yassin, M.N.M.; Ibrahim, M.Z.; Wahid, N. Lane detection in autonomous vehicles: A systematic review. IEEE Access 2023, 11, 3729–3765. [Google Scholar] [CrossRef]
  6. Li, X.; Li, J.; Hu, X.; Yang, J. Line-cnn: End-to-end traffic line detection with line proposal unit. IEEE Trans. Intell. Transp. Syst. 2019, 21, 248–258. [Google Scholar] [CrossRef]
  7. Qin, Z.; Zhang, P.; Li, X. Ultra fast deep lane detection with hybrid anchor driven ordinal classification. IEEE Trans. Pattern Anal. Mach. Intell. 2022, 46, 2555–2568. [Google Scholar] [CrossRef] [PubMed]
  8. Tabelini, L.; Berriel, R.; Paixao, T.M.; Badue, C.; De Souza, A.F.; Oliveira-Santos, T. Keep your eyes on the lane: Real-time attention-guided lane detection. In Proceedings of the IEEE/CVF Conference on Computer Vision and Pattern Recognition, Nashville, TN, USA, 20–25 June 2021; pp. 294–302. [Google Scholar]
  9. Xu, H.; Wang, S.; Cai, X.; Zhang, W.; Liang, X.; Li, Z. Curvelane-nas: Unifying lane-sensitive architecture search and adaptive point blending. In Proceedings of the Computer Vision–ECCV 2020: 16th European Conference, Glasgow, UK, 23–28 August 2020; pp. 689–704. [Google Scholar]
  10. Zheng, T.; Huang, Y.; Liu, Y.; Tang, W.; Yang, Z.; Cai, D.; He, X. Clrnet: Cross layer refinement network for lane detection. In Proceedings of the IEEE/CVF Conference on Computer Vision and Pattern Recognition, New Orleans, LA, USA, 18–24 June 2022; pp. 898–907. [Google Scholar]
  11. Hou, Y.; Ma, Z.; Liu, C.; Loy, C.C. Learning lightweight lane detection cnns by self attention distillation. In Proceedings of the IEEE/CVF International Conference on Computer Vision, Seoul, Republic of Korea, 27 October–2 November 2019; pp. 1013–1021. [Google Scholar]
  12. Neven, D.; De Brabandere, B.; Georgoulis, S.; Proesmans, M.; Van Gool, L. Towards end-to-end lane detection: An instance segmentation approach. In Proceedings of the 2018 IEEE Intelligent Vehicles Symposium (IV), Changshu, China, 26–30 June 2018; pp. 286–291. [Google Scholar]
  13. Pan, X.; Shi, J.; Luo, P.; Wang, X.; Tang, X. Spatial as deep: Spatial cnn for traffic scene understanding. In Proceedings of the AAAI Conference on Artificial Intelligence, New Orleans, LA, USA, 2–7 February 2018. [Google Scholar]
  14. Zheng, T.; Fang, H.; Zhang, Y.; Tang, W.; Yang, Z.; Liu, H.; Cai, D. Resa: Recurrent feature-shift aggregator for lane detection. In Proceedings of the AAAI Conference on Artificial Intelligence, Online, 2–9 February 2021; pp. 3547–3554. [Google Scholar]
  15. Zou, Q.; Jiang, H.; Dai, Q.; Yue, Y.; Chen, L.; Wang, Q. Robust lane detection from continuous driving scenes using deep neural networks. IEEE Trans. Veh. Technol. 2019, 69, 41–54. [Google Scholar] [CrossRef]
  16. Feng, Z.; Guo, S.; Tan, X.; Xu, K.; Wang, M.; Ma, L. Rethinking efficient lane detection via curve modeling. In Proceedings of the IEEE/CVF Conference on Computer Vision and Pattern Recognition, New Orleans, LA, USA, 18–24 June 2022; pp. 17062–17070. [Google Scholar]
  17. Liu, R.; Yuan, Z.; Liu, T.; Xiong, Z. End-to-end lane shape prediction with transformers. In Proceedings of the IEEE/CVF Winter Conference on Applications of Computer Vision, Virtual, 5–9 January 2021; pp. 3694–3702. [Google Scholar]
  18. Tabelini, L.; Berriel, R.; Paixao, T.M.; Badue, C.; De Souza, A.F.; Oliveira-Santos, T. Polylanenet: Lane estimation via deep polynomial regression. In Proceedings of the 2020 25th International Conference on Pattern Recognition (ICPR), Milan, Italy, 10–15 January 2021; pp. 6150–6156. [Google Scholar]
  19. Van Gansbeke, W.; De Brabandere, B.; Neven, D.; Proesmans, M.; Van Gool, L. End-to-end lane detection through differentiable least-squares fitting. In Proceedings of the IEEE/CVF International Conference on Computer Vision Workshops, Seoul, Republic of Korea, 27–28 October 2019; pp. 905–913. [Google Scholar]
  20. Lin, T.-Y.; Dollár, P.; Girshick, R.; He, K.; Hariharan, B.; Belongie, S. Feature pyramid networks for object detection. In Proceedings of the IEEE Conference on Computer Vision and Pattern Recognition, Honolulu, HI, USA, 21–26 July 2017; pp. 2117–2125. [Google Scholar]
  21. Tusimple. Tusimple Benchmark. Available online: https://github.com/TuSimple/tusimple-benchmark (accessed on 2 September 2020).
  22. Wang, W.; Lin, H.; Wang, J. CNN based lane detection with instance segmentation in edge-cloud computing. J. Cloud Comput. 2020, 9, 27. [Google Scholar] [CrossRef]
  23. Aly, M. Real time detection of lane markers in urban streets. In Proceedings of the 2008 IEEE intelligent vehicles symposium, Eindhoven, The Netherlands, 4–6 June 2008; pp. 7–12. [Google Scholar]
  24. Bar Hillel, A.; Lerner, R.; Levi, D.; Raz, G. Recent progress in road and lane detection: A survey. Mach. Vis. Appl. 2014, 25, 727–745. [Google Scholar] [CrossRef]
  25. Maček, K.; Williams, B.; Kolski, S.; Siegwart, R. A Lane Detection Vision Module for Driver Assistance; Sascha Eysoldt Verlag: Aachen, Germany, 2004. [Google Scholar]
  26. Wu, C.-F.; Lin, C.-J.; Lee, C.-Y. Applying a functional neurofuzzy network to real-time lane detection and front-vehicle distance measurement. IEEE Trans. Syst. Man Cybern. Part C (Appl. Rev.) 2011, 42, 577–589. [Google Scholar]
  27. Beyeler, M.; Mirus, F.; Verl, A. Vision-based robust road lane detection in urban environments. In Proceedings of the 2014 IEEE International Conference on Robotics and Automation (ICRA), Hong Kong, China, 31 May–7 June 2014; pp. 4920–4925. [Google Scholar]
  28. Kang, S.-N.; Lee, S.; Hur, J.; Seo, S.-W. Multi-lane detection based on accurate geometric lane estimation in highway scenarios. In Proceedings of the 2014 IEEE Intelligent Vehicles Symposium Proceedings, Ypsilanti, MI, USA, 8–11 June 2014; pp. 221–226. [Google Scholar]
  29. Ko, Y.; Lee, Y.; Azam, S.; Munir, F.; Jeon, M.; Pedrycz, W. Key points estimation and point instance segmentation approach for lane detection. IEEE Trans. Intell. Transp. Syst. 2021, 23, 8949–8958. [Google Scholar] [CrossRef]
  30. Qu, Z.; Jin, H.; Zhou, Y.; Yang, Z.; Zhang, W. Focus on local: Detecting lane marker from bottom up via key point. In Proceedings of the IEEE/CVF Conference on Computer Vision and Pattern Recognition, Nashville, TN, USA, 20–25 June 2021; pp. 14122–14130. [Google Scholar]
  31. Wang, J.; Ma, Y.; Huang, S.; Hui, T.; Wang, F.; Qian, C.; Zhang, T. A keypoint-based global association network for lane detection. In Proceedings of the IEEE/CVF Conference on Computer Vision and Pattern Recognition, New Orleans, LA, USA, 18–24 June 2022; pp. 1392–1401. [Google Scholar]
  32. He, K.; Zhang, X.; Ren, S.; Sun, J. Deep residual learning for image recognition. In Proceedings of the IEEE Conference on Computer Vision and Pattern Recognition, Las Vegas, NV, USA, 27–30 June 2016; pp. 770–778. [Google Scholar]
  33. Vaswani, A. Attention is all you need. In Advances in Neural Information Processing Systems. arXiv 2017, arXiv:1706.03762. [Google Scholar] [CrossRef]
  34. Neubeck, A.; Van Gool, L. Efficient non-maximum suppression. In Proceedings of the 18th International Conference on Pattern Recognition (ICPR’06), Washington, DC, USA, 20–24 August 2006; pp. 850–855. [Google Scholar]
  35. Burrus, C.S.; Parks, T. Convolution Algorithms; Citeseer: New York, NY, USA, 1985; Volume 6, p. 15. [Google Scholar]
  36. Zhang, Z.; Sabuncu, M. Generalized cross entropy loss for training deep neural networks with noisy labels. Adv. Neural Inf. Process. Syst. 2018, 31, 8792–8802. [Google Scholar]
  37. Ren, S.; He, K.; Girshick, R.; Sun, J. Faster R-CNN: Towards real-time object detection with region proposal networks. IEEE Trans. Pattern Anal. Mach. Intell. 2016, 39, 1137–1149. [Google Scholar] [CrossRef]
  38. Yoo, S.; Lee, H.S.; Myeong, H.; Yun, S.; Park, H.; Cho, J.; Kim, D.H. End-to-end lane marker detection via row-wise classification. In Proceedings of the IEEE/CVF Conference on Computer Vision and Pattern Recognition Workshops, Seattle, WA, USA, 14–19 June 2020; pp. 1006–1007. [Google Scholar]
  39. Qin, Z.; Wang, H.; Li, X. Ultra fast structure-aware deep lane detection. In Proceedings of the Computer Vision–ECCV 2020: 16th European Conference, Glasgow, UK, 23–28 August 2020; pp. 276–291. [Google Scholar]
  40. Zoljodi, A.; Abadijou, S.; Alibeigi, M.; Daneshtalab, M. Contrastive Learning for Lane Detection via cross-similarity. Pattern Recognit. Lett. 2024, 185, 175–183. [Google Scholar] [CrossRef]
  41. Kao, Y.; Che, S.; Zhou, S.; Guo, S.; Zhang, X.; Wang, W. LHFFNet: A hybrid feature fusion method for lane detection. Sci. Rep. 2024, 14, 16353. [Google Scholar] [CrossRef] [PubMed]
  42. Nie, S.; Zhang, G.; Yun, L.; Liu, S. A Faster and Lightweight Lane Detection Method in Complex Scenarios. Electronics 2024, 13, 2486. [Google Scholar] [CrossRef]
  43. Chen, Z.; Liu, Q.; Lian, C. Pointlanenet: Efficient end-to-end cnns for accurate real-time lane detection. In Proceedings of the 2019 IEEE Intelligent Vehicles Symposium (IV), Paris, France, 9–12 June 2019; pp. 2563–2568. [Google Scholar]
  44. Philion, J. Fastdraw: Addressing the long tail of lane detection by adapting a sequential prediction network. In Proceedings of the IEEE/CVF Conference on Computer Vision and Pattern Recognition, Long Beach, CA, USA, 15–20 June 2019; pp. 11582–11591. [Google Scholar]
  45. Zhang, J.; Deng, T.; Yan, F.; Liu, W. Lane detection model based on spatio-temporal network with double convolutional gated recurrent units. IEEE Trans. Intell. Transp. Syst. 2021, 23, 6666–6678. [Google Scholar] [CrossRef]
Figure 1. Four difficult scenarios for lane detection: (a) scenarios with lane lines affected by lighting interference; (b) scenarios involving dashed lane lines; (c) false detection results (green lines) for no lane line scenarios in intersections; (d) high-curvature lane lines (blue lines) in curved road scenarios.
Applsci 15 00699 g001
Figure 2. Illustration of grid anchor placement. Each blue square represents a grid anchor, and the yellow curve depicts the lane line on a curved road. Red boxes indicate grid anchors classified as lane lines, while the remaining boxes are classified as background.
Applsci 15 00699 g002
Figure 3. Illustration of the grid anchor data structure: (a) the grid anchor employs multiple channel layers to represent the added attributes, where different color channels correspond to different attributes; (b) taking the anchor ( s , i , j ) as an example, the meanings of the attributes in each channel layer are explained.
Applsci 15 00699 g003
Figure 4. Illustration of three types of intersections between lane lines and the boundaries of anchors. (a) The intersection of the left lane boundary with the grid anchors; (b) The intersection of the vertical lane boundary with the grid anchors; (c) The intersection of the right lane boundary with the grid anchors. The yellow lines represent the lane boundaries, while the blue lines represent the boundaries of the grid anchors. The numbers indicate the identifiers of each grid anchor within the subfigures.
Applsci 15 00699 g004
Figure 5. Illustration of the network architecture. The model takes FPN as the basic architecture, and the features passed across the layers include the features generated by upsampling and MLP. The features from different sources are concatenated in the channel layer dimension. Finally, the detection results of the corresponding dimension are outputted in different feature layers. Different colored arrows represent different types of data processing methods.
Applsci 15 00699 g005
Figure 6. Illustration of the method for constructing global features. By flattening the tensor, applying the MLP, and reshaping, global features are obtained to establish interconnections between features at different spatial locations in the high-level layers. The figure shows the MLP processing flow at the top layer.
Applsci 15 00699 g006
Figure 7. Illustration of the convolutional reordering upsampling method. During the reordering process, for the data after 3 × 3 convolution, the relative positions of the data within the same channel layer remain unchanged, while the data from the same spatial location across different channel layers are sequentially placed into a 2 × 2 region according to a specified order.
Applsci 15 00699 g007
Figure 8. Illustration shows the three different cases for the computation of the loss function L i , j o k . (a) anchor i , j points to its leftward anchor i 1 , j ; (b) anchor i , j points to its downward anchor i , j + 1 ; (c) the anchor i , j points to its rightward anchor i + 1 , j . The offset attribute represents the relative position between the anchor’s predicted lane points (red points) and the center of the anchor, the green diagonal line represents the value of the slope attribute of the anchor prediction, and the yellow line represents the diagonal line formed by the predicted coordinate points of the two grid anchors.
Applsci 15 00699 g008
Figure 9. Visualization results from the CULane dataset with RESA, UFLDv2, BezierLane, and our method. In the image, the purple, green, red, and blue lines represent lane lines.
Applsci 15 00699 g009
Table 1. Relative advantages of the proposed method compared to four deep learning methods.
MethodsSegmentationKeypointParameterAnchor
Representative methodsLaneNet
SCNN
ENet-SAD
PINet
FOLOLane
GANet
PolyLaneNet
BezierLaneNet
E2ET
Line-CNN
LaneATT
Ufldv2
Relative advantages of the proposed methodReduced computational complexity; high speed; indicating internal relationships.Indicating internal relationships; flexible representation.Flexible representation;
indicating internal relationships.
Simple computation method; flexible representation;
correspondence between features and data at the same position; indicating internal relationships.
Table 2. Direction attribute value calculation table.
x i , j p y i , j p Direction T n + 1 , i , j s T n + 2 , i , j s
--No lane00
i W W s j H H s , j + 1 H H s Left10
i W W s , i + 1 W W s ( j + 1 ) H H s Down11
i + 1 W W s j H H s , j + 1 H H s Right01
The table defines the values of the direction attribute based on intersection coordinates. The symbol “-” indicates that the anchor is classified as background, in which case the intersection coordinates are not considered.
Table 3. Outline of the specific parameters of each dataset.
DatasetTrainTestImage SizeLanes
CULane88,88034,6801640 × 590 4
Tusimple362627821280 × 720 5
Table 4. Comparison of mainstream methods and our model on the CULane dataset.
MethodBackboneF1GFlopsNormalCrowdDazzleShadowNo LineArrowCurveCrossNight
SCNN [13]VGG1671.60328.490.6069.7058.5066.9043.4084.1064.40199066.10
RESA [14]ResNet3474.5041.091.9072.4066.5072.0046.3088.1068.60189669.80
ENet-SAD [11]ENet70.803.990.1068.8060.2065.9041.6084.0065.70199866.00
PINet [29]Hourglass74.40-90.3072.3066.3068.4049.8083.7065.60142767.70
FOLOLane [30]ERFNet78.80-92.7077.8075.2079.3052.1089.0069.40156974.50
BezierLaneNet [16]ResNet3475.57-91.5973.2069.2076.7448.0587.1662.4588869.90
ERF-E2E [38]ERFNet74.00-91.0073.1064.5074.1046.6085.8071.90202267.90
LaneATT [8]ResNet3476.6818.092.1475.0366.4778.1549.3988.3867.72133070.72
CurveLanes-L [9]Searched74.8086.590.7072.3067.7070.1049.4085.8068.40174668.90
UFLD [39]ResNet3472.3016.990.7070.2059.5069.3044.4085.7069.50203766.70
UFLDv2 [7]ResNet3475.9020.692.5074.9065.7075.3049.0088.5070.20186470.60
CLLD [40]U-Net70.43-89.8068.3958.9368.8640.6884.5066.20265671.21
LHFFNet [41]Hourglass75.90-92.0073.4067.3071.9051.3087.8069.60140170.60
CBGA [42]ResNet-3471.00-90.8070.8061.6071.4044.5086.3065.10202866.10
GAAC (ours)ResNet1876.2223.492.9774.3568.4674.5148.8588.2072.30178571.63
GAAC (ours)ResNet3476.4128.693.0575.2665.6569.7549.4189.0173.27203572.29
The comparative data are cited from other studies. ‘-’ means the results are not available. For cross-testing scenarios, only false positives are shown. Boldfaced data indicate that the data rank first in the corresponding metric.
Table 5. Comparison of mainstream methods and our model on the Tusimple dataset.
MethodBackboneF1AccFPFN
LaneNet [12]H-NET94.8096.387.802.44
SCNN [13]VGG1695.9796.536.171.80
PointLaneNet [43]GoogLeNet95.0796.344.675.18
ENet-SAD [11]ENet95.9296.646.022.05
FastDraw [44]ResNet5093.9295.207.604.50
PolyLaneNet [18]EfficientNet90.6293.369.429.33
ERF-E2E [38]ERFNet96.2596.023.214.28
PINet [29]Hourglass87.1097.6215.3010.50
ConvGRUs [45]ConvGRU90.9797.9813.264.38
UFLD [39]ResNet3488.0295.8618.913.75
UFLDv2 [7]ResNet3496.2295.563.184.37
CLLD [40]RESA94.9996.175.504.50
CBGA [42]ResNet3495.9396.1018.803.61
GAAC (ours)ResNet1896.4396.183.863.27
GAAC (ours)ResNet3496.4796.274.13.2.91
The comparative data are cited from other studies. Boldfaced data indicate that the data rank first in the corresponding metric.
Table 6. Ablation experiments with different attributes.
ExistenceInstanceDirectionOffsetSlopeF1
74.31
74.52
74.93
74.61
75.17
The symbol ✓ indicates that the corresponding attribute is included in the calculation of the F 1 score.
Table 7. Improved ablation experiments for FPN.
FPNUpsamplingMLPF1
75.09
75.68
75.27
75.83
The symbol ✓ indicates that the corresponding method is included in the calculation of the F 1 score.
Table 8. Ablation experiments for loss functions.
L s i L s o e d L s o o k F1
75.80
76.07
76.31
76.41
The symbol ✓ indicates that the corresponding loss is included in the calculation of the F 1 score.
Disclaimer/Publisher’s Note: The statements, opinions and data contained in all publications are solely those of the individual author(s) and contributor(s) and not of MDPI and/or the editor(s). MDPI and/or the editor(s) disclaim responsibility for any injury to people or property resulting from any ideas, methods, instructions or products referred to in the content.

