Article

Influence of the Radial Gap on the External Gear Pump Performance

1
Department of Hydroaerodynamics and Hydraulic Machines, Technical University of Sofia, Kliment Ohridski 8 boulevard, 1000 Sofia, Bulgaria
2
Department of Mechanics, Technical University of Sofia, Kliment Ohridski 8 Boulevard, 1000 Sofia, Bulgaria
*
Author to whom correspondence should be addressed.
Appl. Sci. 2025, 15(2), 907; https://doi.org/10.3390/app15020907
Submission received: 19 December 2024 / Revised: 14 January 2025 / Accepted: 15 January 2025 / Published: 17 January 2025

Abstract

:
The paper presents a numerical and experimental study of the radial gap influence on the external gear pump performance. The numerical study is performed with a two-dimensional (2D) computational fluid dynamics (CFD) model developed and advanced in previous authors’ works. The experimental study is carried out on a laboratory test bench. The presented numerical results are accurate in the entire operating range (500–3500 RPM) of the pump, which is confirmed by comparisons between the CFD results, experimental data, and manufacturer’s technical documentation. The comparative analysis shows that the differences obtained during the verifications are in the range of −6.44% to 2.48%. An original methodology has been developed that allows us to obtain the volumetric efficiency and overall efficiency characteristics as a function of the rotation frequency of the pump at different values of the radial gap, using the manufacturer’s data for the same characteristics at a nominal radial gap and the results of CFD simulations. The analysis of the numerical and experimental results shows that a gap size of 0.04 mm is close to the limit value for the investigated pump, if it is not operated at a rotational frequency above the nominal. The presented methodology can also be applied to other types of hydraulic displacement pumps in order to evaluate their performance in the wear process and to predict the maximum allowable value of a specific design parameter under different operating modes.

1. Introduction and Motivation

External gear pumps are one of the most commonly applied in the practice of hydraulic drives. They are used in both mobile and industrial hydraulic systems [1]. The reason for this wide applicability is their large number of advantages: a relatively simple construction, a wide range of variation in the displacement volume (most often between 1 and 200 cm3) [2], the possibility of coupling up to three pumps with different displacement volumes to one drive shaft, the ability to implement a similar design to hydraulic motors, and last but not least, a low cost compared to other types of displacement rotary pumps. Along with the listed advantages, there are also disadvantages: a higher level of flow ripple, a fixed displacement volume, a relatively lower overall efficiency, the impossibility of continuous operation at high pressures (over 20 MPa), a high level of noise, impossible repair in the case of wear in the housing or the rotating pair, etc. [3].
The listed disadvantages have motivated a number of researchers and manufacturers’ development divisions to improve the external gear pump design. Usually, the goal is to improve the performance, where the corresponding indicator is the overall efficiency. Often, the goal of developments is to increase overall efficiency, and in achieving this, some of the other listed disadvantages are also overcome, such as reducing noise and vibrations in the hydraulic system, etc.
There is a large number of published developments devoted to increasing the overall gear pump efficiency. They can be summarized into several groups depending on the way this goal is achieved. A large group of studies is dedicated to the inter-mesh zone design parameters [4,5,6,7,8,9]. Sometimes, this is associated with changes in the tooth profile, which is most often involute, but attempts have been made with the use of non-involute or non-symmetrical profiles [10]. Another group of studies is dedicated to the influence of the radial and axial gap sizes on the volumetric and overall efficiency [11,12,13]. Some studies have aimed at evaluating the influence of operating mode parameters, such as rotation frequency and the pressure load on the pump efficiency [14,15,16,17]. When the focus is on the performance and efficiency affecting processes, a significant place is occupied by the influence of cavitation phenomena [18,19,20,21,22]. There is also a body of research devoted to the influence of working fluid parameters on pump efficiency [23,24,25,26]. This implies a study of the working process when using special hydraulic oils as well as the influence of temperature changes [27]. For sure, this unification is conditional, as research often covers the influence of a combination of parameters—design, mode, process, etc. [28,29,30,31,32,33,34,35,36,37,38].
With the increase in IT computational capabilities, fluid simulations software products are also being improved. This is a prerequisite for deepening the CFD studies of the flow process in hydraulic machines, devices, and systems. The transition from 2D [39,40,41] to three-dimensional (3D) CFD models [29,42] has further improved the possibilities of fluid–structure theory. In this aspect, it has also increased the possibilities for researching the working process of gear pumps in order to study the influence of various design parameters. Moreover, reaching an experimentally verified CFD model of the hydraulic machine makes it possible to study in simulation conditions specific design parameters whose influence is not possible to study through a real experiment [43].
The authors created a 2D CFD model of a certain specimen of an external gear pump based on the Ansys Fluent® ver. 2019 R3 software product. A detailed description of the model is presented in [41], and its advancement and verification are presented in [44]. The verified CFD model accuracy motivated us to continue our research with a study on the influence of one of the main design features determining the efficiency—the radial gap between the tip of the gears and the pump housing. The value of the minimum radial gap is determined mainly by the possible value of the clearance in the bearings and their misalignment, as well as by the value of the eccentricity in the position of the gears in the housing seats [45]. Taking into account the possibility of an unfavorable coincidence with manufacturing tolerances, the radial gap is usually chosen as up to 0.03–0.05 mm per side [46,47]. However, in long-term operations of the pump with a heavy load or unsuitable working modes, this gap increases as a result of housing wear, which leads to an increase in pump volumetric losses. This leads to a sharp decrease in volumetric efficiency, which is a dominant part of the overall efficiency of every hydraulic rotary displacement machine.
The main goal of the article is to present the results of the study of the radial gap influence on the external gear pump performance. For this purpose, the authors developed a methodology for determining the overall pump efficiency based on an existing advanced 2D CFD model. The model was verified in a wide operating range through a laboratory experiment and a technical pump specification. In contrast to the existing studies, in this article, results are presented not only of the influence of the radial gap dimensions on the overall efficiency and its components (volumetric and hydromechanical efficiency) but on the flow rate at different rotation frequencies, which is another important performance characteristic. The main contribution of the present work is the original methodology and verification approach which can be used on other types of hydraulic machines. From an applied point of view, the represented deductive relationships between the investigated performance characteristics can be used to evaluate the current state of hydraulic machines.
This article is organized as follows. Section 2 includes a short description of the design features and CFD model development, Section 3 presents the main relations of the pump performance at different values of the radial gap (theoretical background and methodology), Section 4 shows the CFD results and verification, Section 5 presents the radial gap size influence on the volumetric flow rate, Section 6 shows the pump efficiency estimation at different radial gap sizes, and in Section 7, some conclusions are given.

2. Design Features and CFD Model

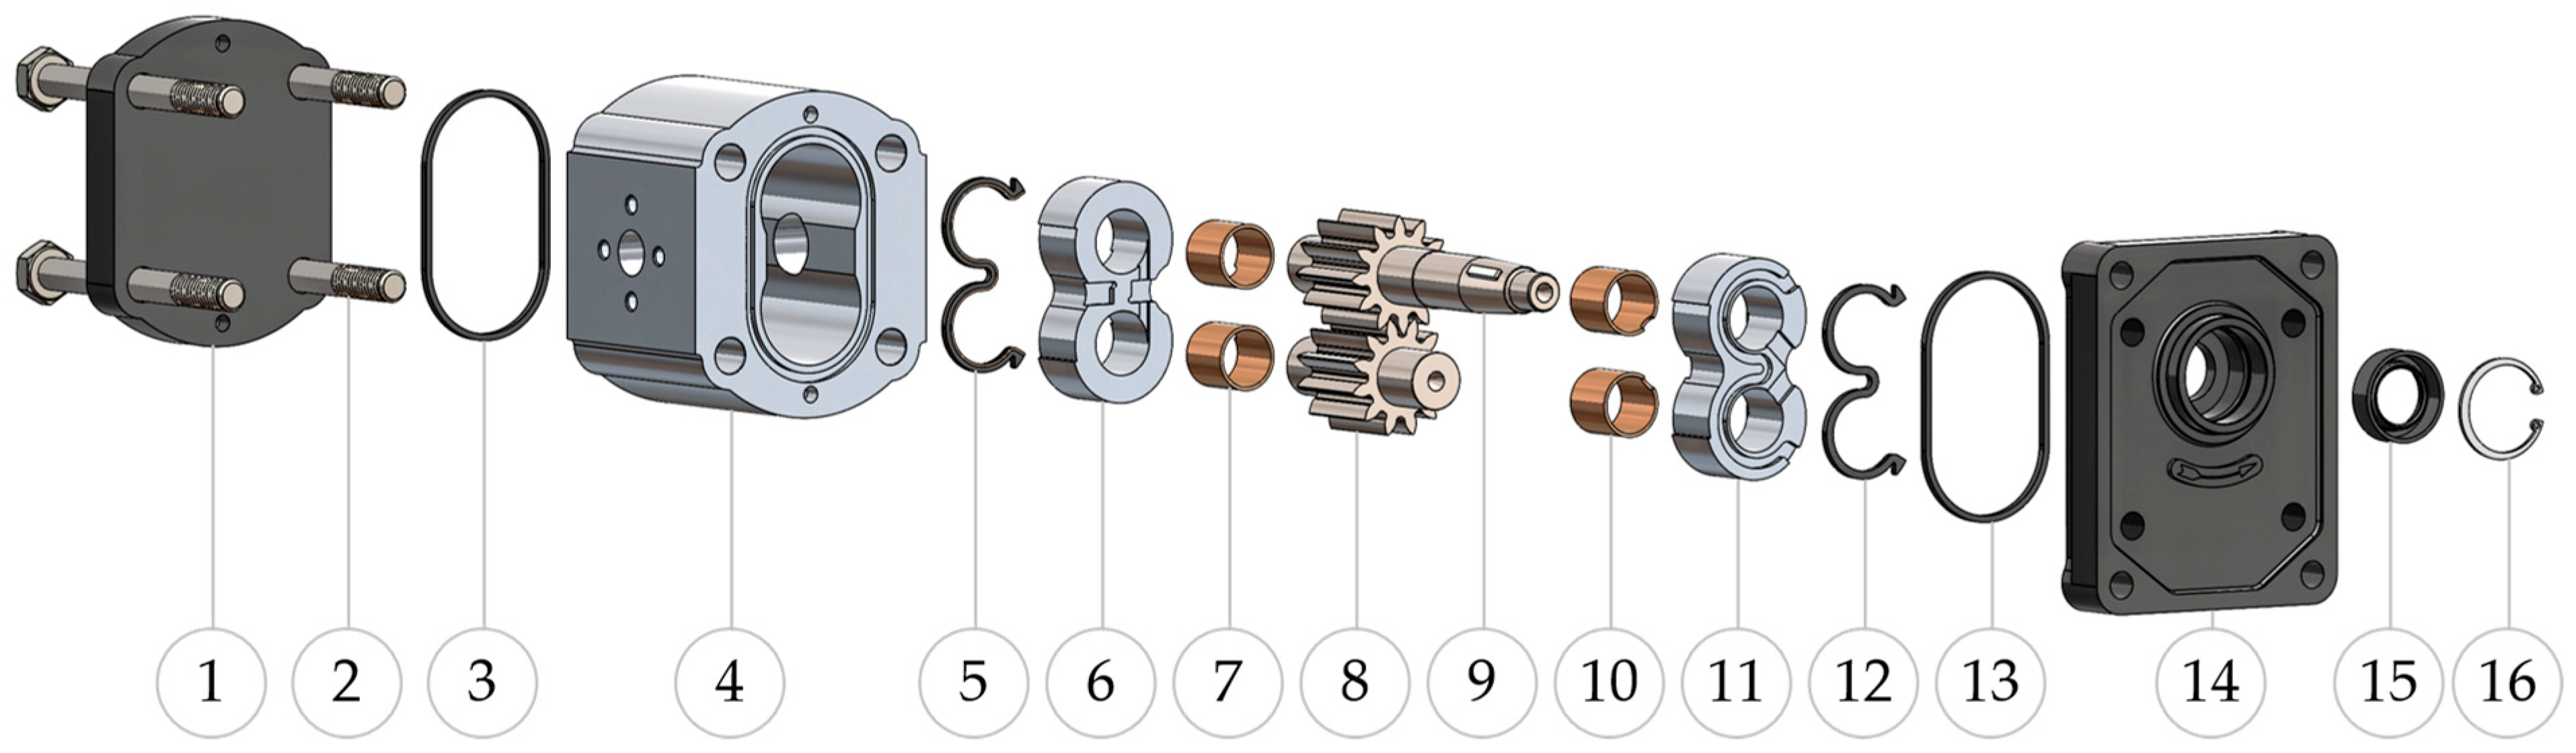
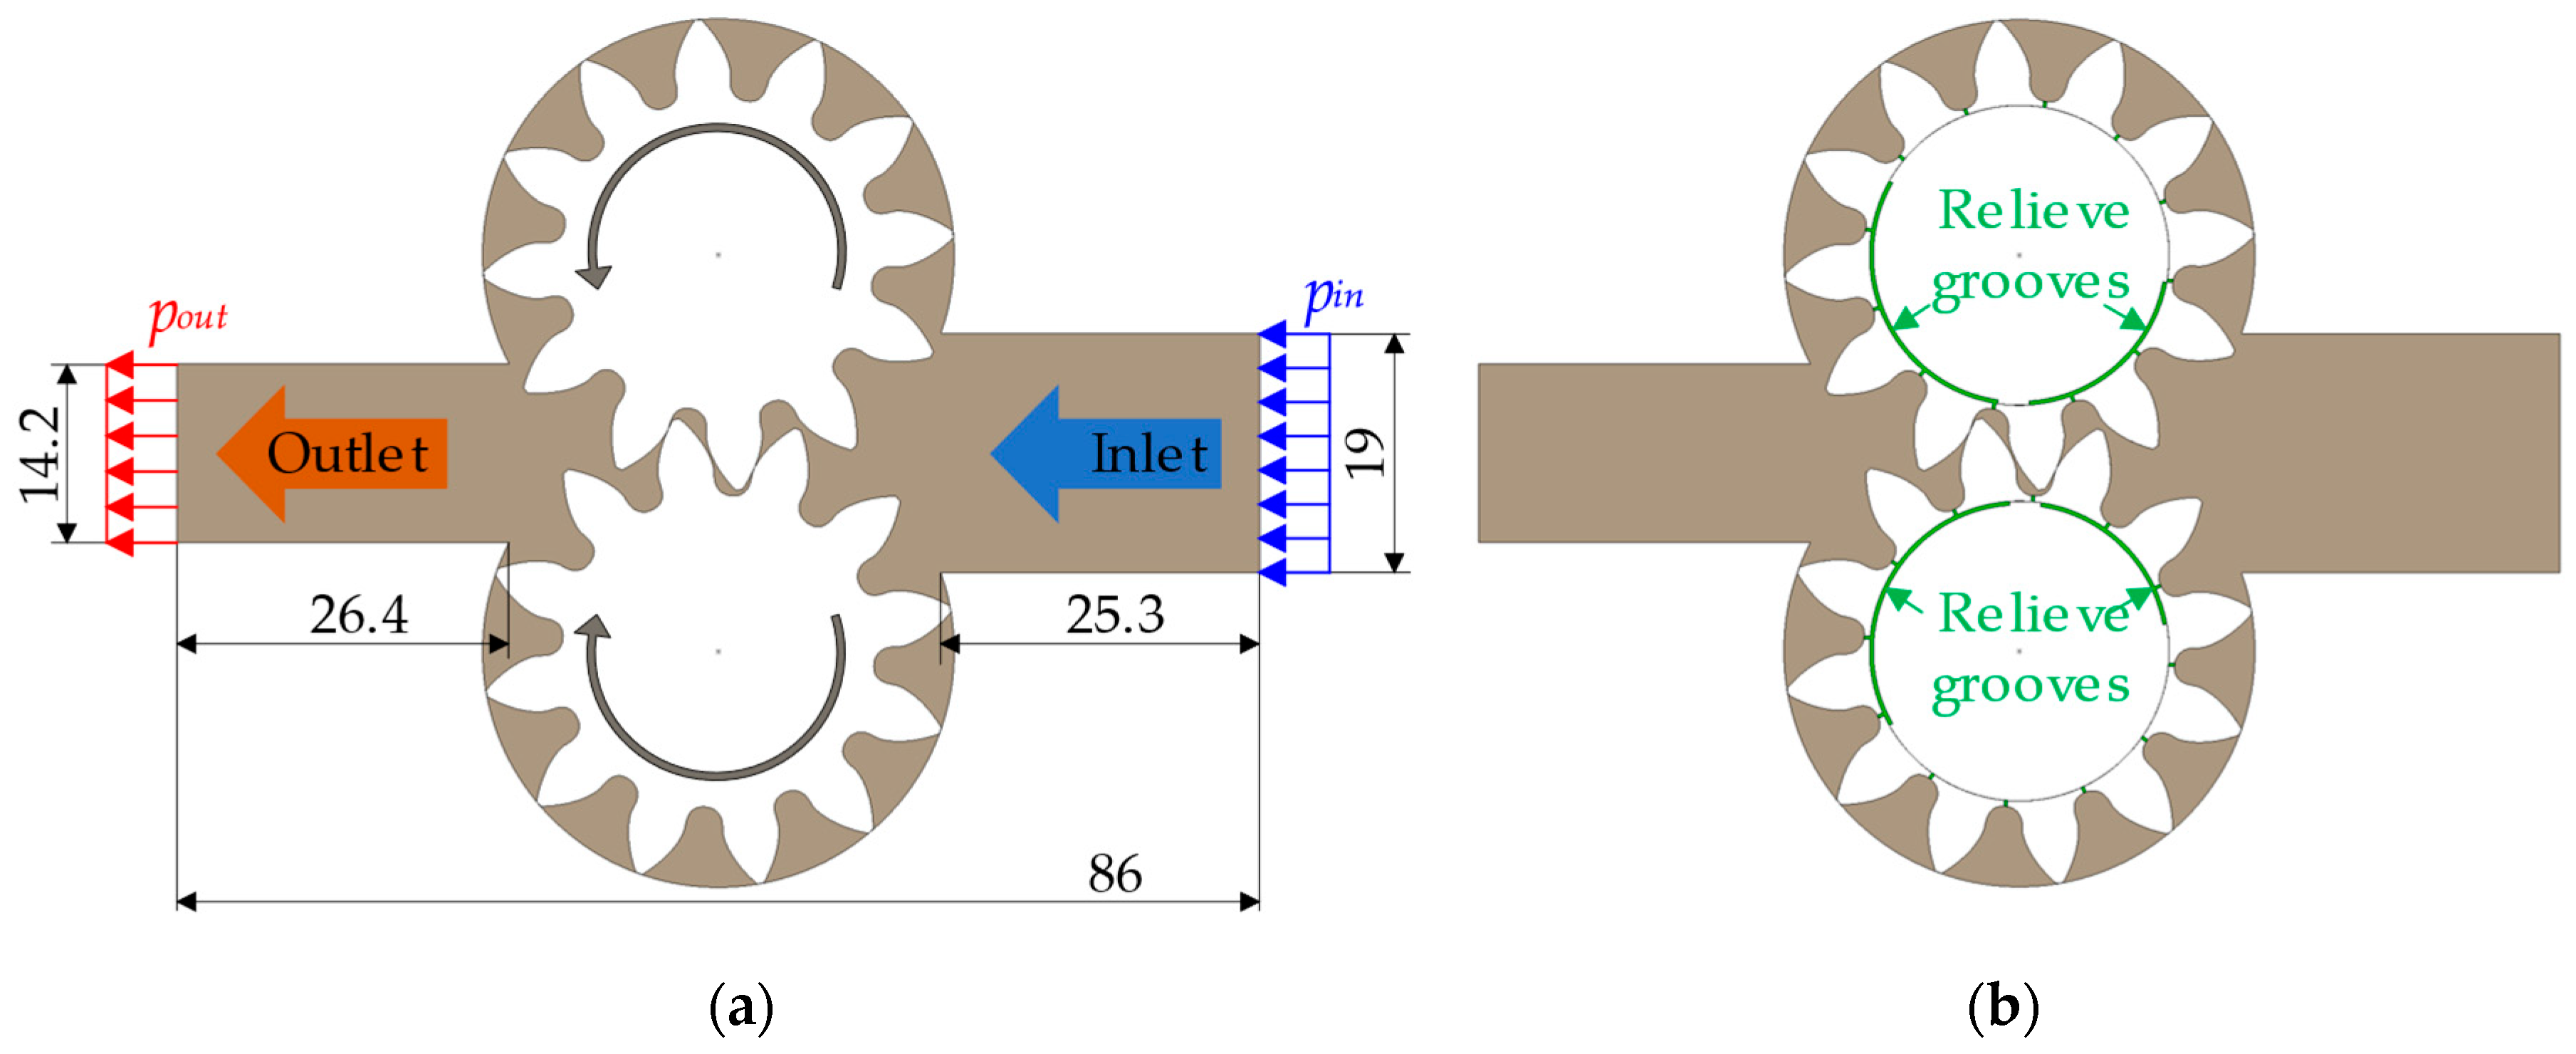
2.1. Design Features and Geometric Model of the Pump
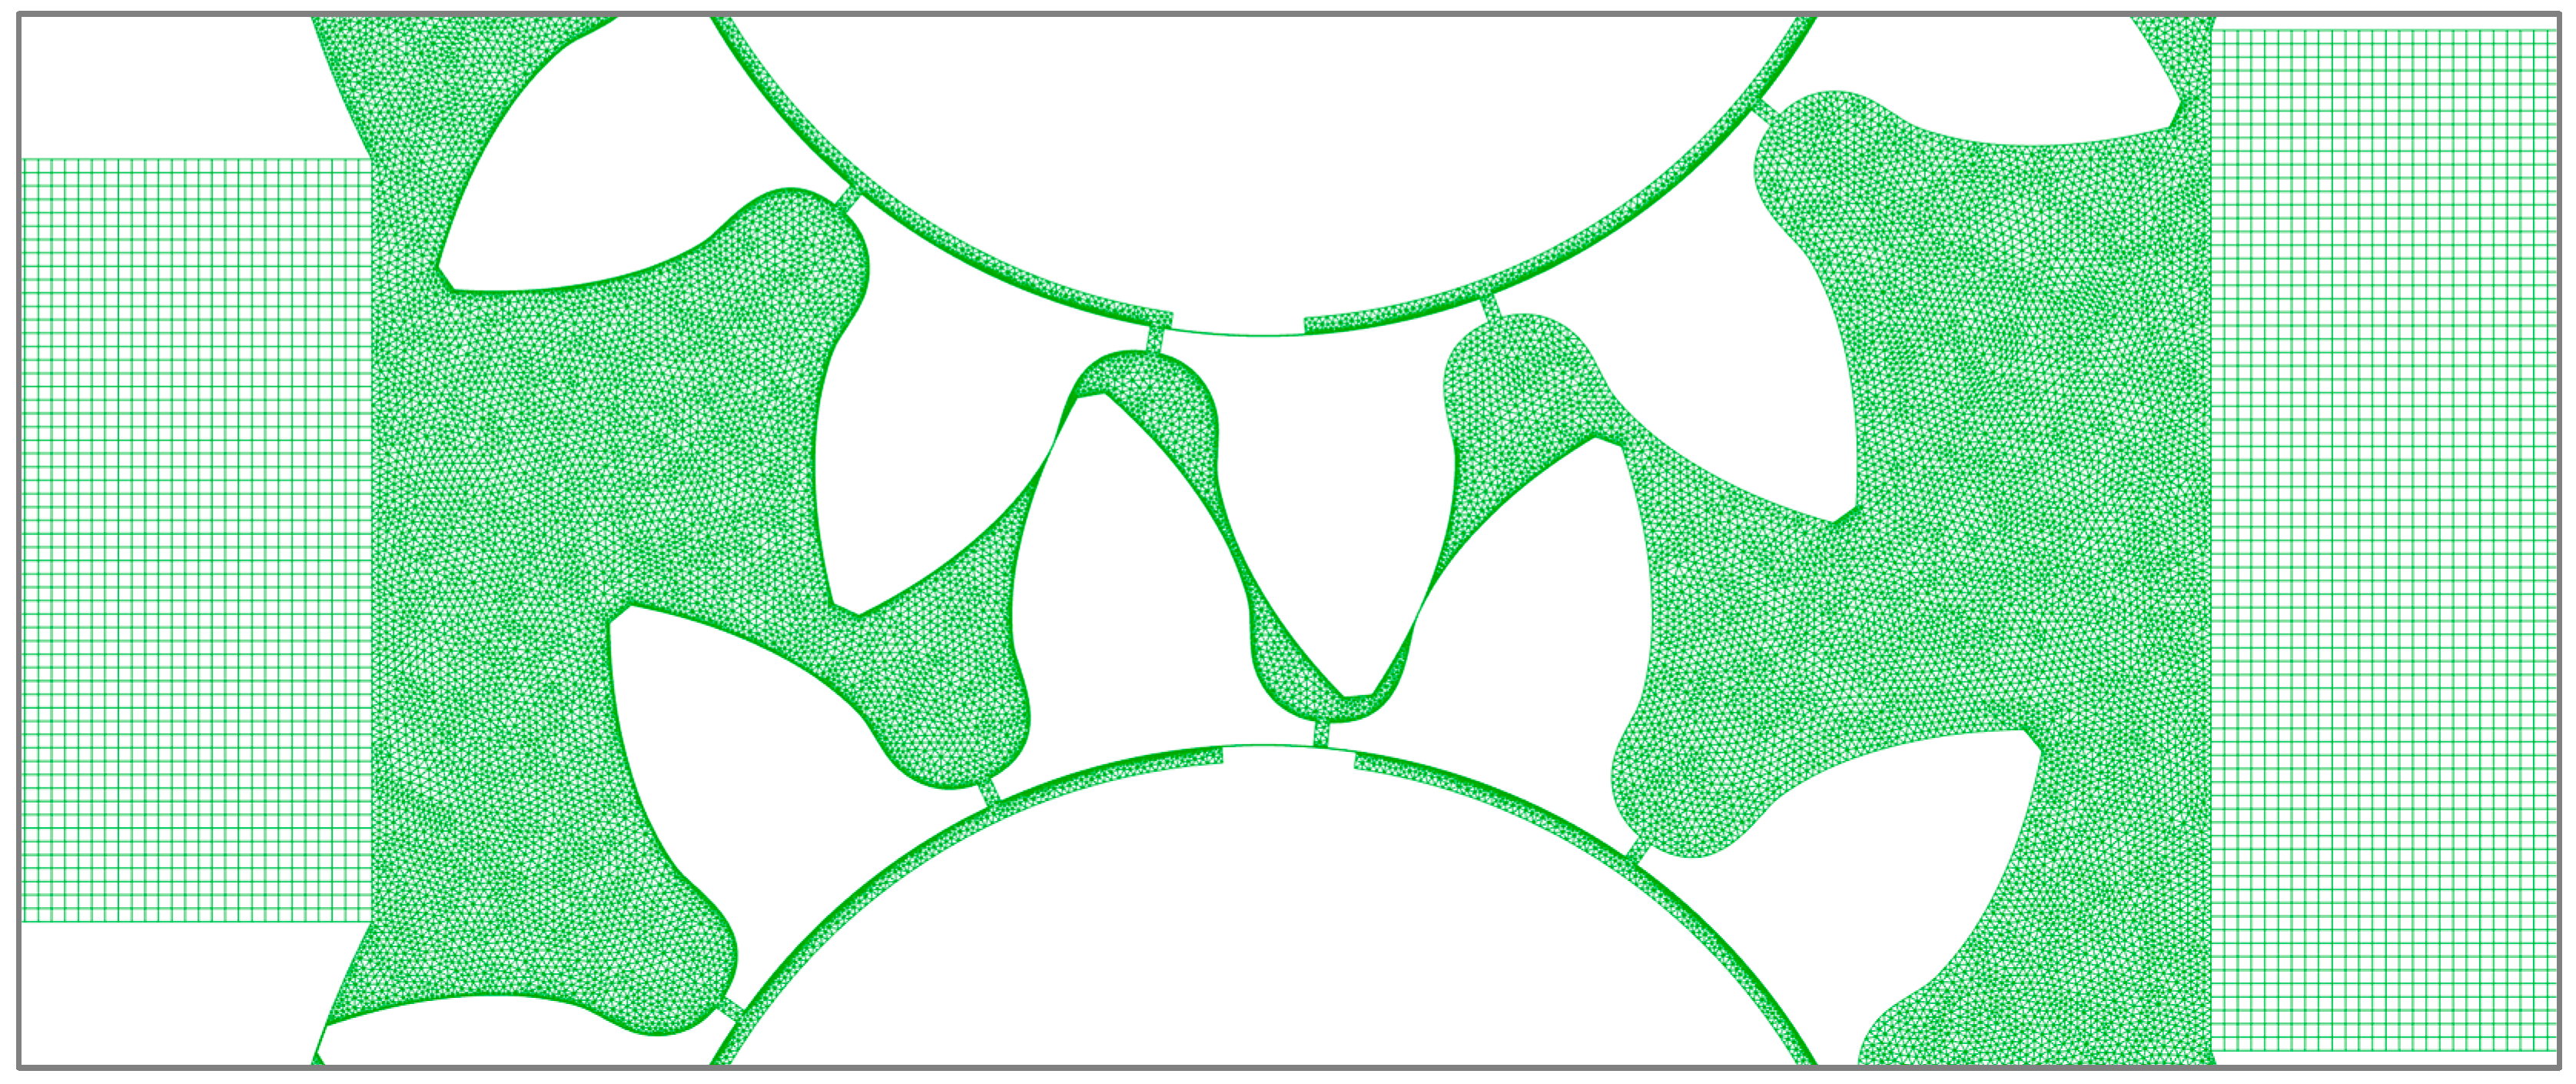
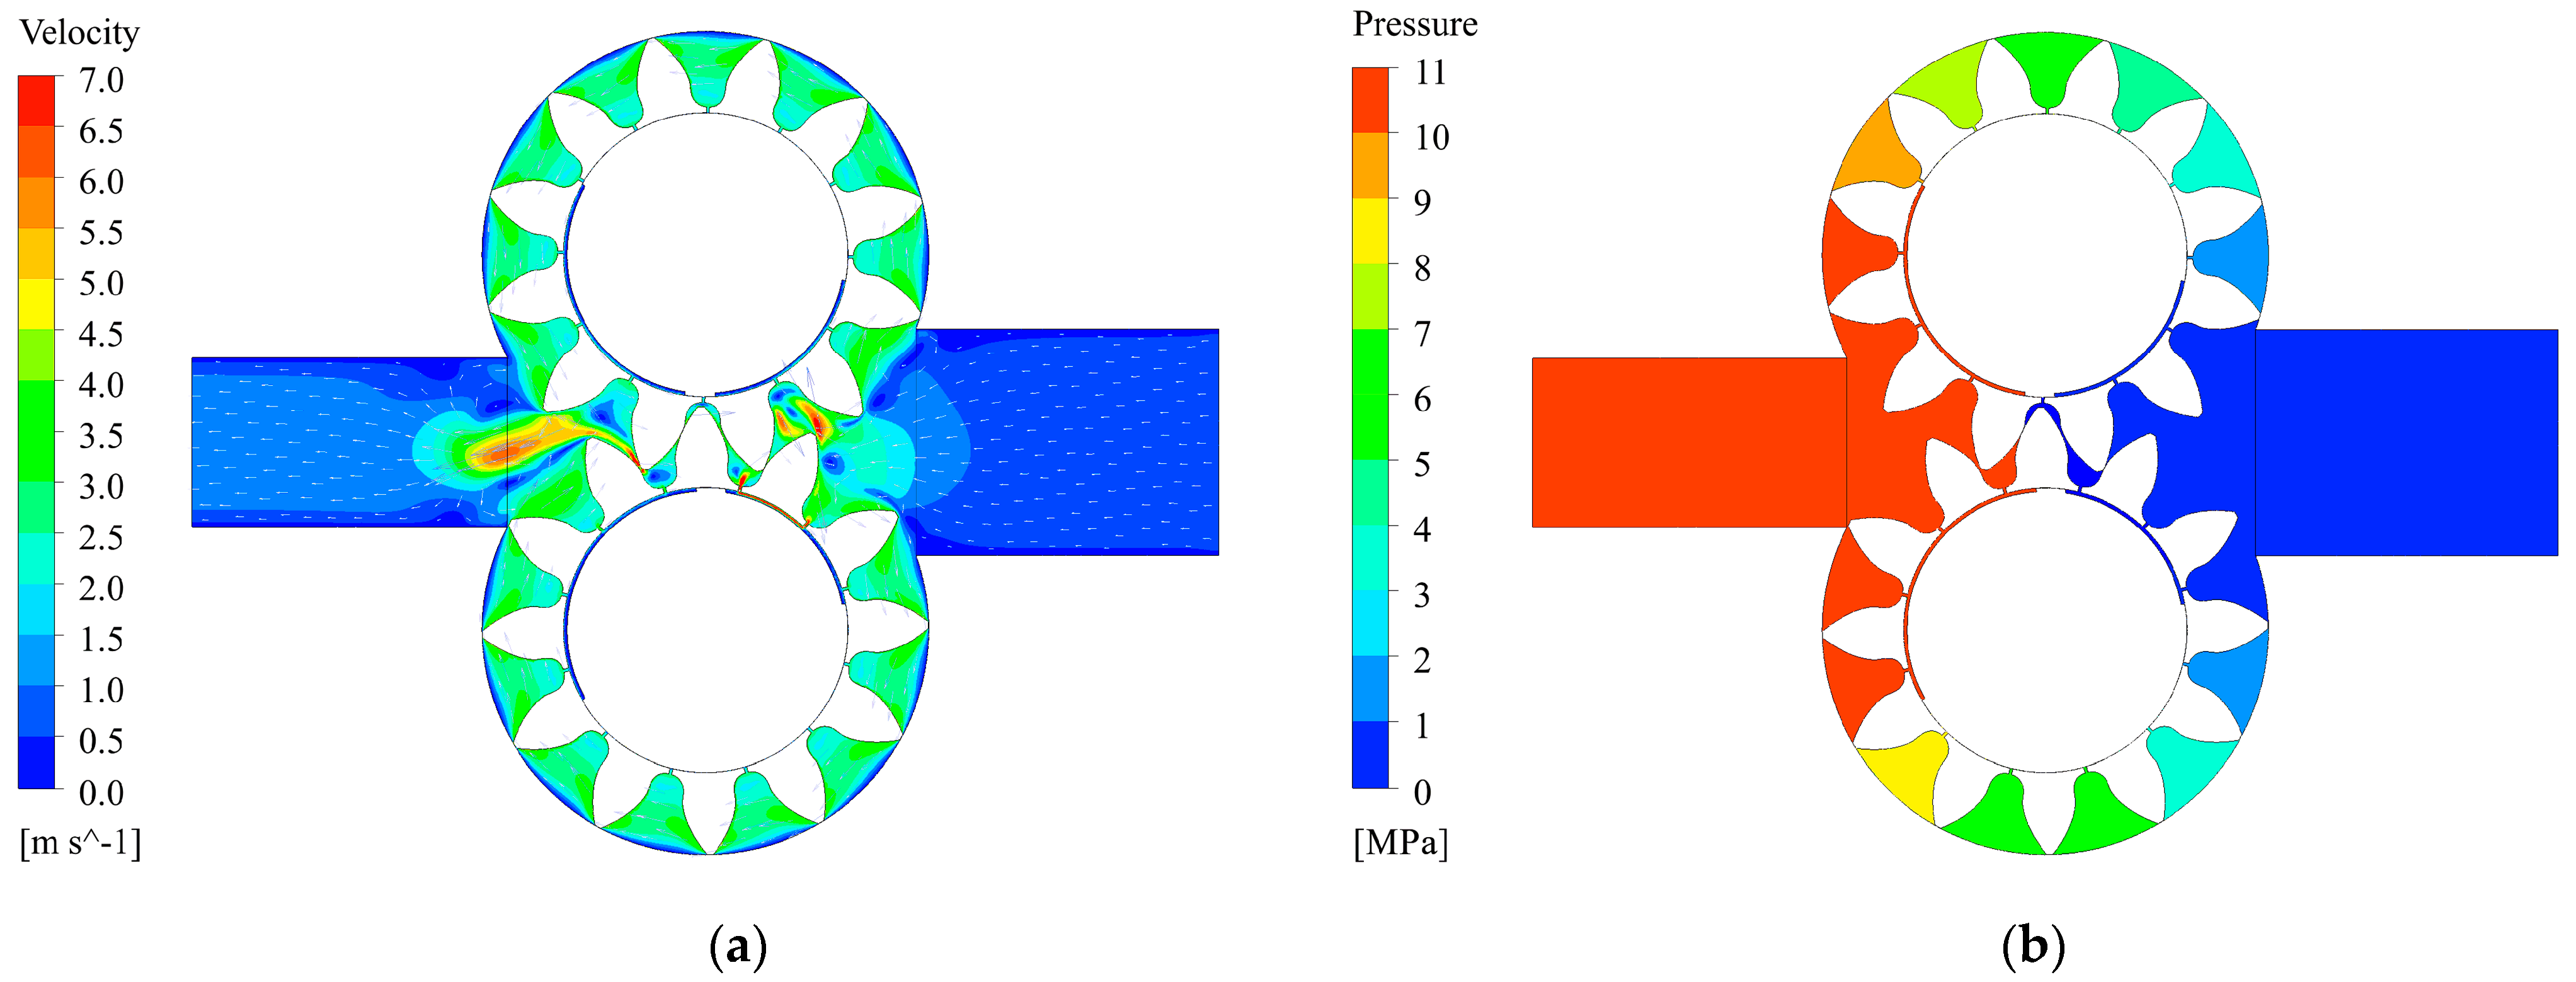
The investigated pump with a displacement volume of 19 cm3 had two identical spur gears with 12 involute teeth. The main details and design features are in Figure 1. As can be seen, the research object had a relatively simple and classic design, widespread in the practice of construction.
After creating a maximally accurate 3D CAD model [41], shown in Figure 1, a section was made in the assembled state with a vertical plane passing through the axes of the suction and discharge ports in the housing (4) of the pump. The resulting section view represents the geometry of a classic 2D CFD model—Figure 2a. Our previous research [41] showed that this model can successfully obtain the volumetric flow rate average value under different operating modes. The disadvantage of this model is that the relief grooves are not considered, which leads to deviations in the current value of the volumetric flow rate.
As a result of this disadvantage, the flow rate variation in the function of the time does not correspond to the curves known from the theory. These problems were addressed in our next study [44], where an original solution was proposed—an advanced 2D CFD model that considers the relief groove influence. The geometry of this model is shown in Figure 2b. It was found in [44] that this model gives current volumetric flow rate values that are accurate in form and value; therefore, it was also used in the present study.

2.2. CFD Model

The following assumptions were made in the process of creating the 2D CFD model of the investigated external gear pump: the working fluid is Newtonian (hydraulic oil), the fluid is incompressible, the flow process is 2D, the viscous heating is not considered, and the body forces are negligible.
The use of the 2D CFD model is based on the main computational fluid mechanics terms, which are embedded in Ansys Fluent® software [21,48,49].
For the compressible fluid, the continuity equation can be presented with the following expression:
ρ t + · ( ρ V ) = 0 ,
where V is a velocity vector, is the divergence, and ρ is the density of the working fluid.
In the case of a steady state in the compressible working fluid of t = 0 for any variables, then,
· ( ρ V ) = 0 .
In connection with the made assumption, the working fluid is incompressible ( ρ = c o n s t ); therefore, ρ t 0 . Thus, the continuity equation can be present as follows,
× V = 0 .
The formal form in the case of incompressible fluid is the following,
u x + v y + w z = 0 ,
where u , v , and w are the velocity along the corresponding axes.
The Navier–Stokes equations for incompressible fluid has a main vector form in a Cartesian coordinate system:
ρ V t + V V = P + ρ g + μ 2 V ,
where μ is the dynamic viscosity, g is the gravity, and P is the pressure. This expression follows from the assumption for the Newtonian fluid. For each of the coordinate axes, it can be expressed as follows:
X component of the equation:
ρ u t + u u x + v u y + w u z = P x + ρ g x + μ 2 u x 2 + v 2 u y 2 + w 2 u z 2 .
Y component of the equation:
ρ v t + u v x + v v y + w v z = P y + ρ g y + μ 2 v x 2 + v 2 v y 2 + w 2 v z 2 ,
where g x and g y are x and y gravity directions. The Z component of the Navier–Stokes equation is not applicable to this assumption for the 2D model.
The general form of the turbulence k - ε (kinetic energy) equation is as follows:
t ρ k + k V = μ + μ i σ k k + G k + G b ρ ε Y M + S k ,
t ρ ε + ε V = μ + μ i σ ε ε + C 1 ε ε k G k + C 3 ε G b C 2 ε ρ ε 2 k + S k ,
where k is the kinetic energy, ε is the kinetic energy dissipation rate, σ k is the turbulent Prandtl number for k , G k is the generation of turbulence kinetic energy (mean velocity gradients), G b is the generation of turbulence kinetic energy due to buoyancy, σ ε is the turbulent Prandtl number for ε , S k is the user-defined source terms, and C 1 ε , C 2 ε , C 3 ε , and C μ are the constants.
The Eddy viscosity μ i can be expressed by combining k and ε :
μ i = ρ C μ k ε .
The initial condition includes the following: working fluid—hydraulic oil with a density of 890 kg/m3 and a viscosity of 0.0712 kg/(m-s); a gravity of 9.81 m/s2; an inlet pressure p i n = 101,325 Pa and an outlet pressure p o u t = 10.5 MPa. The inlet and outlet pressures are applied normally to the boundary as shown in Figure 2a, with a turbulent intensity of 5% and a turbulent viscosity ratio of 10%. The rotational frequency n of the gears, as well as the gap between them and the housing, depends on the simulated operating mode. This is described in the next section.
The used initial finite element mesh is shown in Figure 3. In the inlet and outlet channels, the mesh is built with structured rectangular elements with a size of 0.25 mm, and the element’s shape and size are static during the solution. For the rest of the model, the mesh is formed by triangles with a basic element size of 0.14 mm. The mesh is thickened in the gaps, where the element sizes are between 0.0013 mm and 0.08 mm. The mesh around the gears is dynamically changed during the solution and the triangles sizes vary between 0.0007 and 0.32 mm with a maximum mesh skewness of 0.67. The total number of cells during the solution is between 79,821 and 65,401. More details about the model parameters are given in [41,44].
Each simulation covers a minimum of 40° of a gear rotation. The first 10 degrees is not used for the result analysis. The average flow rate is calculated for the next interval of 30°. In our previous studies [41,44], it was found that subsequent 30-degree periods completely repeated at first, which is normal for a gear pump with 12 teeth in steady-state operation.
Each simulation included between 1240 and 1720 steps and the angular step was varied over the course of the solution to achieve convergence, in the range of 0.024° to 0.036°, with a typical value around 0.029°. The simulation research showed that the solution is very sensitive to the choice of the angular step, with values around 0.03° proving optimal for the used CFD model. For example, when reducing the angular step to twice below these values, the noise in the solution slightly decreased, and the average flow rate slightly increased (by about 0.3%). On the other hand, however, decreasing the angular step led to a proportional increase in the number of required steps, and accordingly, in the total simulation time. At the same time, deviations from the given step values—both decreasing and increasing—led to a poor convergence and more frequent errors and interruptions. Using angular steps 30–40% larger than specified can still result in faster and relatively stable solutions. However, this comes at the expense of greater noise, especially at low rotation frequencies and at large radial gap values.

3. Pump Performance at Different Values of the Radial Gap

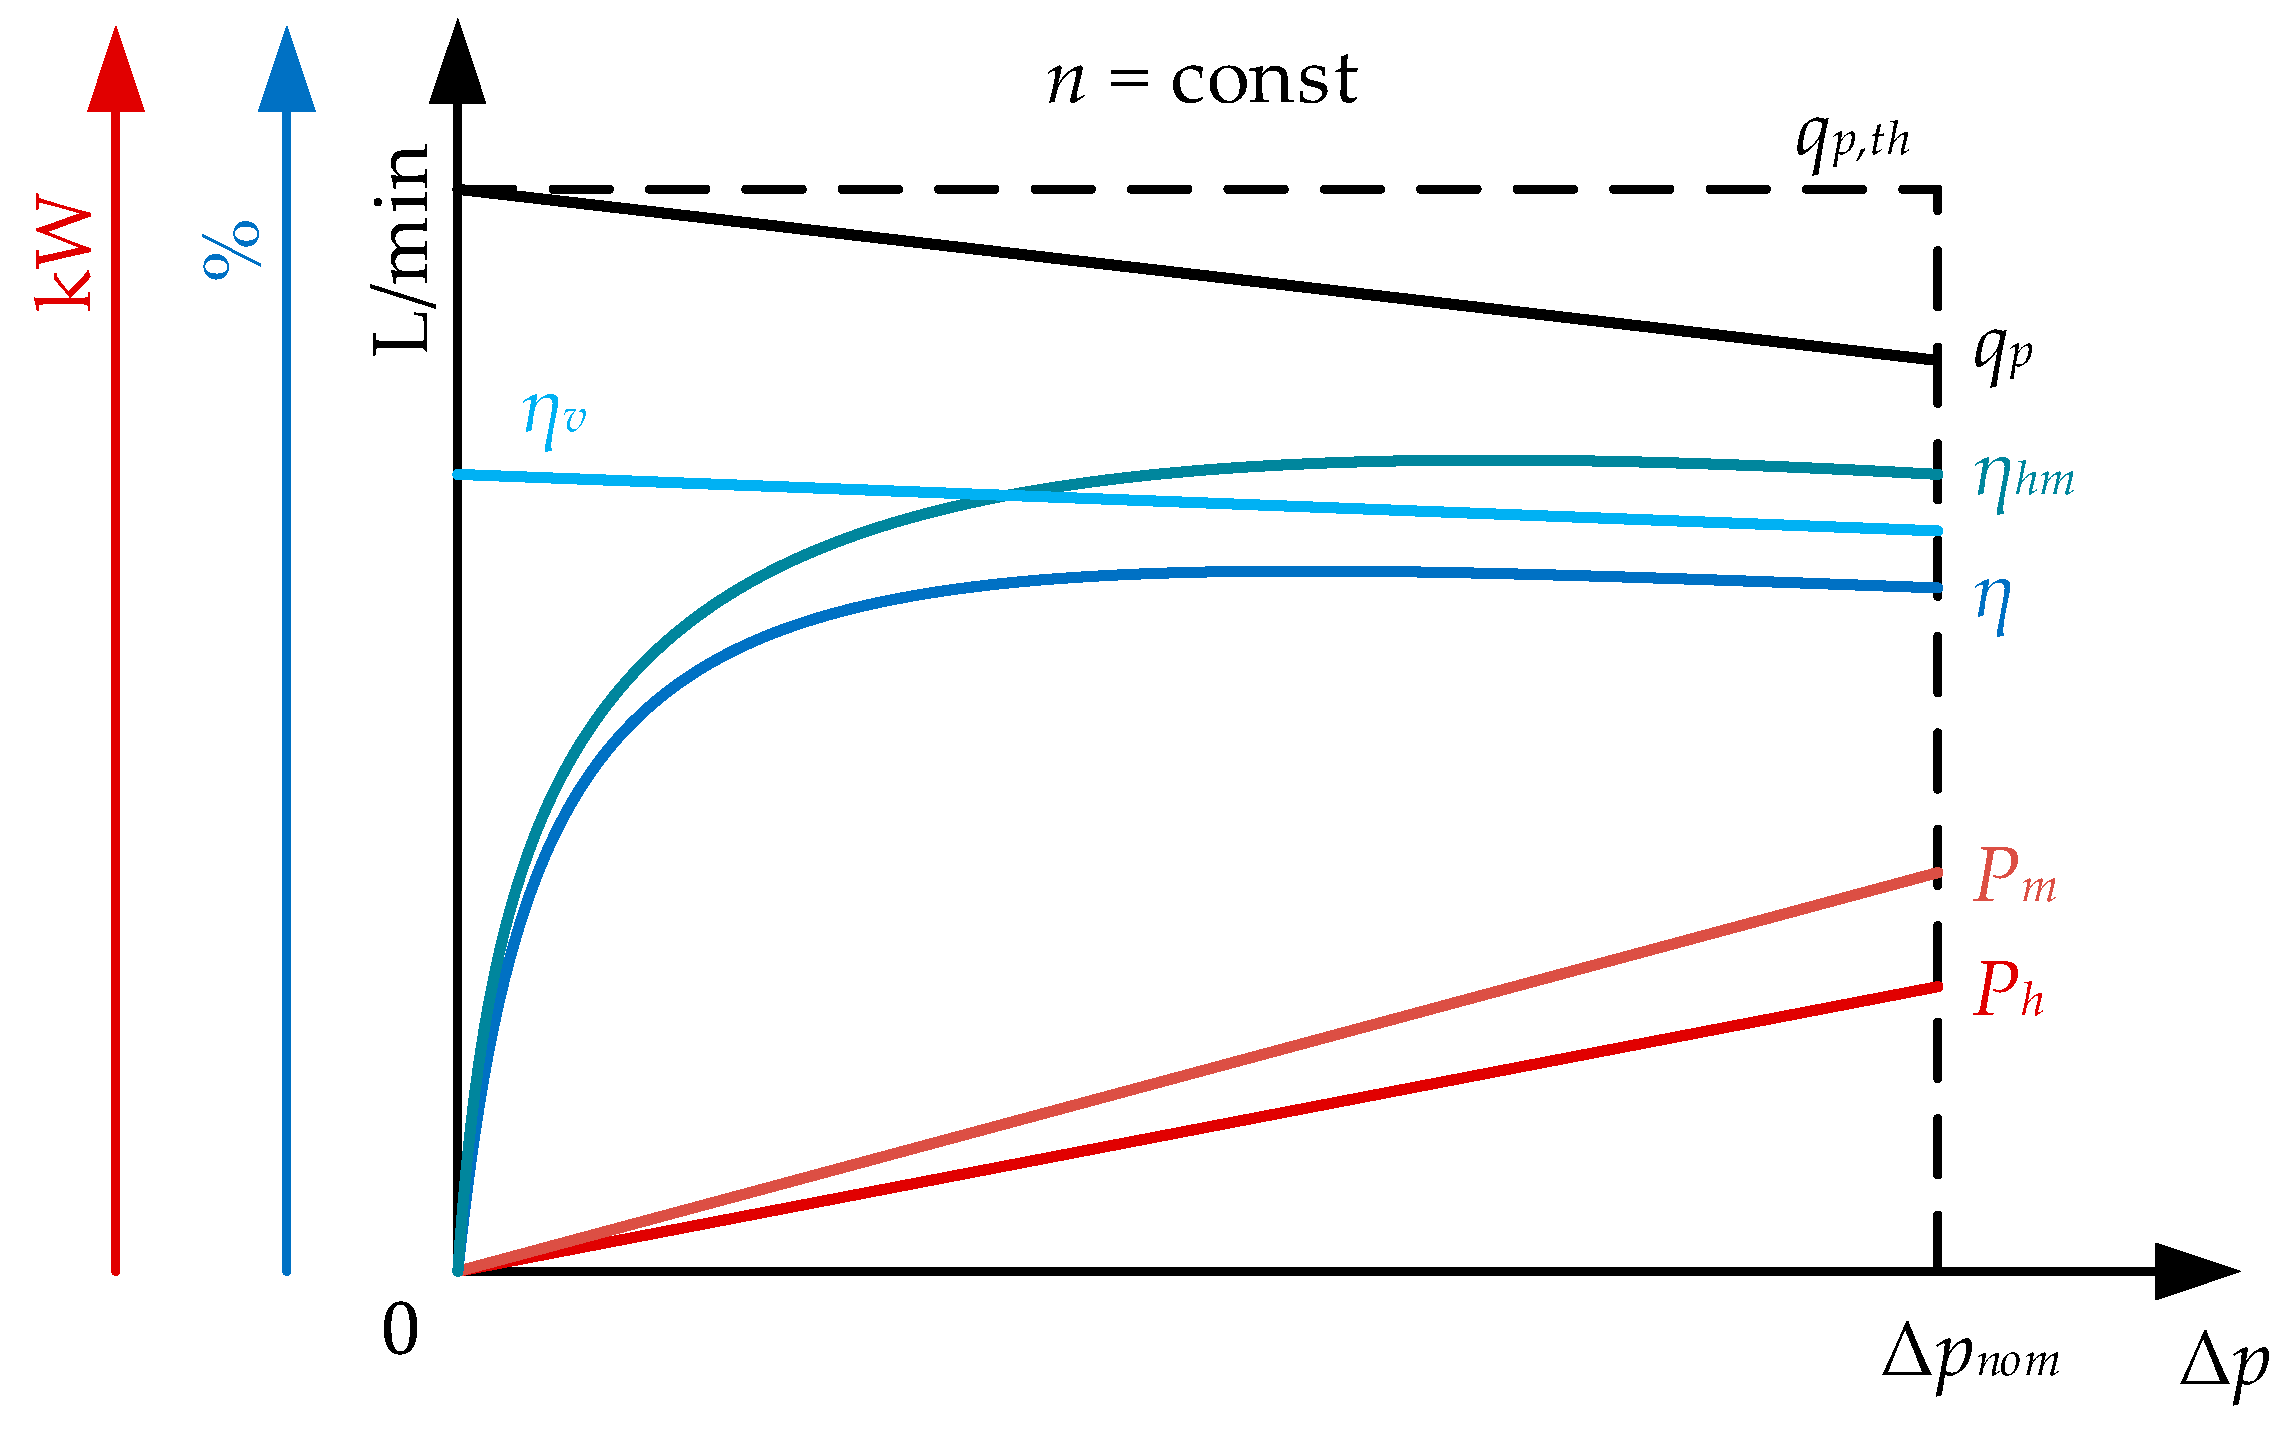
3.1. Theoretical Background

The performance characteristics of hydraulic displacement rotary pumps (including gear type) are the pump flow rate q p , the volumetric efficiency η v , the actual consumed power P , and the overall efficiency η in function of the pressure drop Δ p = p o u t p i n at a constant rotational frequency n [1]. The typical performance characteristics are shown in Figure 4 where the variables are shown at different scales [50].
The present study focused on the radial gap size influence on the pump performance’s main indicator—the overall efficiency η and its components (volumetric efficiency η v and hydromechanical efficiency η h m ). For this purpose, it is important to know the dependencies between the individual performance characteristics and some additional mechanical terms necessary for their determination. The basis is the determination of the theoretical flow rate:
q p , t h = V p , t h n ,
where V p , t h is a theoretical displacement volume and n is a rotational frequency.
The theoretical pump torque M p , t h is determined by the following expression:
M p , t h = V p , t h Δ p 20 π , N m
where Δ p is a pressure drop in the bar. Thus, the theoretical power of the pump P p , t h is as follows:
P p , t h = M p , t h ω = 2 π n 60 M p , t h = q p , t h Δ p ,
where ω is the rotation frequency in rad/s.
The first component of overall efficiency η is the volumetric efficiency η v , which can be represented as the dimensionless dependence:
η v = q p q p , t h = q p , t h q p , l o s s q p , t h = 1 q p , l o s s V p , t h n ,  
where q p is the effective flow rate and q p , l o s s is the flow rate looseness. Therefore, the q p can be expressed as follows:
q p = q p , t h η v = V p , t h n η v ,  
whence for the theoretical displacement volume V p , t h it follows,
V p , t h = q p n η v .  
The hydromechanical efficiency η h m is based on the fundamental relationship [51,52,53] to determine the effective torque:
M p = M p , t h + M p , l o s s ,  
where M p , l o s s is the torque looseness in the unit Newton-meters. In this aspect, η h m is as follows:
η h m = M p , t h M p = M p , t h M p + M p , l o s s = 1 1 + 2 π M p , l o s s V p , t h Δ p .  
This gives a reason to express the effective torque again:
M p = M p , t h η h m = V p , t h Δ p 20 π η h m = q p , t h Δ p 20 π n η h m .  
In addition to its two main components ( η v and η h m ), the overall efficiency η is also expressed by the derivation of output and input power in the pump. In this connection, it is necessary to determine the effective hydraulic (output) power [51]:
P h = q p Δ p ,
assuming that p i n p o u t ; therefore, P h q p p o u t [1,50]. The input power of the pumps is the mechanical power of the drive shaft:
P m = ω M p = 2 π n 60 M p .
Therefore, the following expression is obtained for the overall pump efficiency:
η = P h P m = P m P l o s s P m = 1 q p , l o s s Δ p + 2 π n M p , l o s s 60 P m ,
where P l o s s is the power looseness. The actual hydraulic power can be expressed by the η v as follows:
P h = q p , t h Δ p η v = P p , t h η v .
Also, the theoretical power can be expressed in terms of η h m as follows:
P p , t h = 2 π n 60 M p , t h = P m η h m .
Then, for the overall efficiency η of a gear pump, it follows:
η = P h P m = P p , t h η v P m = P m η h m η v P m .  
Therefore,
η = η v η h m .

3.2. Methodology for Pump Efficiency Determination at Different Radial Gap Sizes

If the experimentally determined characteristics η n and η v n at nominal gap sizes are available, using the CFD results, one can predict the characteristics η n and η v n at different values of the radial gap, which cannot be verified experimentally unless a pump with the same radial gap happens to be available. For this purpose, the following methodology was developed:
Using the CFD results, the average flow rates q for the desired values of the rotation frequency n and outlet pressure p o u t at nominal radial gap sizes are calculated.
The theoretical flow rate of the pump q p , t h is determined by (13). In our case, V p , t h is equal to 19 cm3.
The volumetric efficiency of the pump obtained with the CFD model η v , C F D is calculated by (16). Typically, the volumetric efficiency obtained with the 2D CFD model is larger than the actual one, due to the highly simplified and idealized environment in which the fluid simulation is performed.
The actual volumetric efficiency of the pump η v is determined. This can be done either by experiment or by technical data from the manufacturer. In the present study, data from the technical documentation of the pump are used.
In order to account for the actual volumetric losses of the real 3D geometry, an additional volumetric efficiency η v , a d is introduced:
η v , a d = η v η v , C F D 100 , % ,
The actual pump overall efficiency η is determined. This again is done either by experiment or by manufacturer’s data. In the present study, η is calculated by (27), where P h is calculated by (22), in which q p is determined by an experiment performed by the authors, and experimental information from the manufacturer is used for P m .
The hydromechanical efficiency of the pump η h m is determined. It includes all losses that are not considered in volumetric efficiency η v :
η h m = η η v 100 , % .
Using the CFD model, the average values of the flow rate q for the desired rotation frequency n and pressure drop Δ p at different values of radial gap are calculated.
η v , C F D , η v , and η for a new radial gap value are successively calculated using the Formulas (16), (29) and (30) again, where the values of η v , a d and η h m are assumed to be equal to those at the nominal value of the radial gap.

4. CFD Results and Verification

Eight rotational frequency modes were simulated—500, 750, 1000, 1250, 1450, 2000, 2500, and 3500 RPM at two radial gap values: 0.02 mm and 0.04 mm. The modes were selected due to the documentation available from the pump manufacturer [54], where the flow rate is given in the form of a curve in the range of 500–3500 RPM, and at a rotational frequency equal to 1000 and 1450 RPM, the flow rate values are given in a table form.
A gap of 0.02 mm was considered nominal, while the value of 0.04 mm was predicted to be close to the maximum at which the pump maintains its normal performance. Additionally, for a rotational frequency of 1000 RPM, numerical experiments were made at values of the radial gap of 0.03 mm and 0.05 mm, in order to fully investigate the influence of this parameter on the pump flow rate. Thus, the total number of realized simulations is 18.
The operating pressure in all the simulated modes is p o u t = 10.5 MPa. This value was also chosen because of the technical documentation, which provides experimental data for it that can be used to verify the model.
The workability of the developed CFD model is confirmed by the following Figure 5, which shows the velocity and pressure distribution at the chosen operating pressure of 10.5 MPa and a rotational frequency of 1450 RPM.

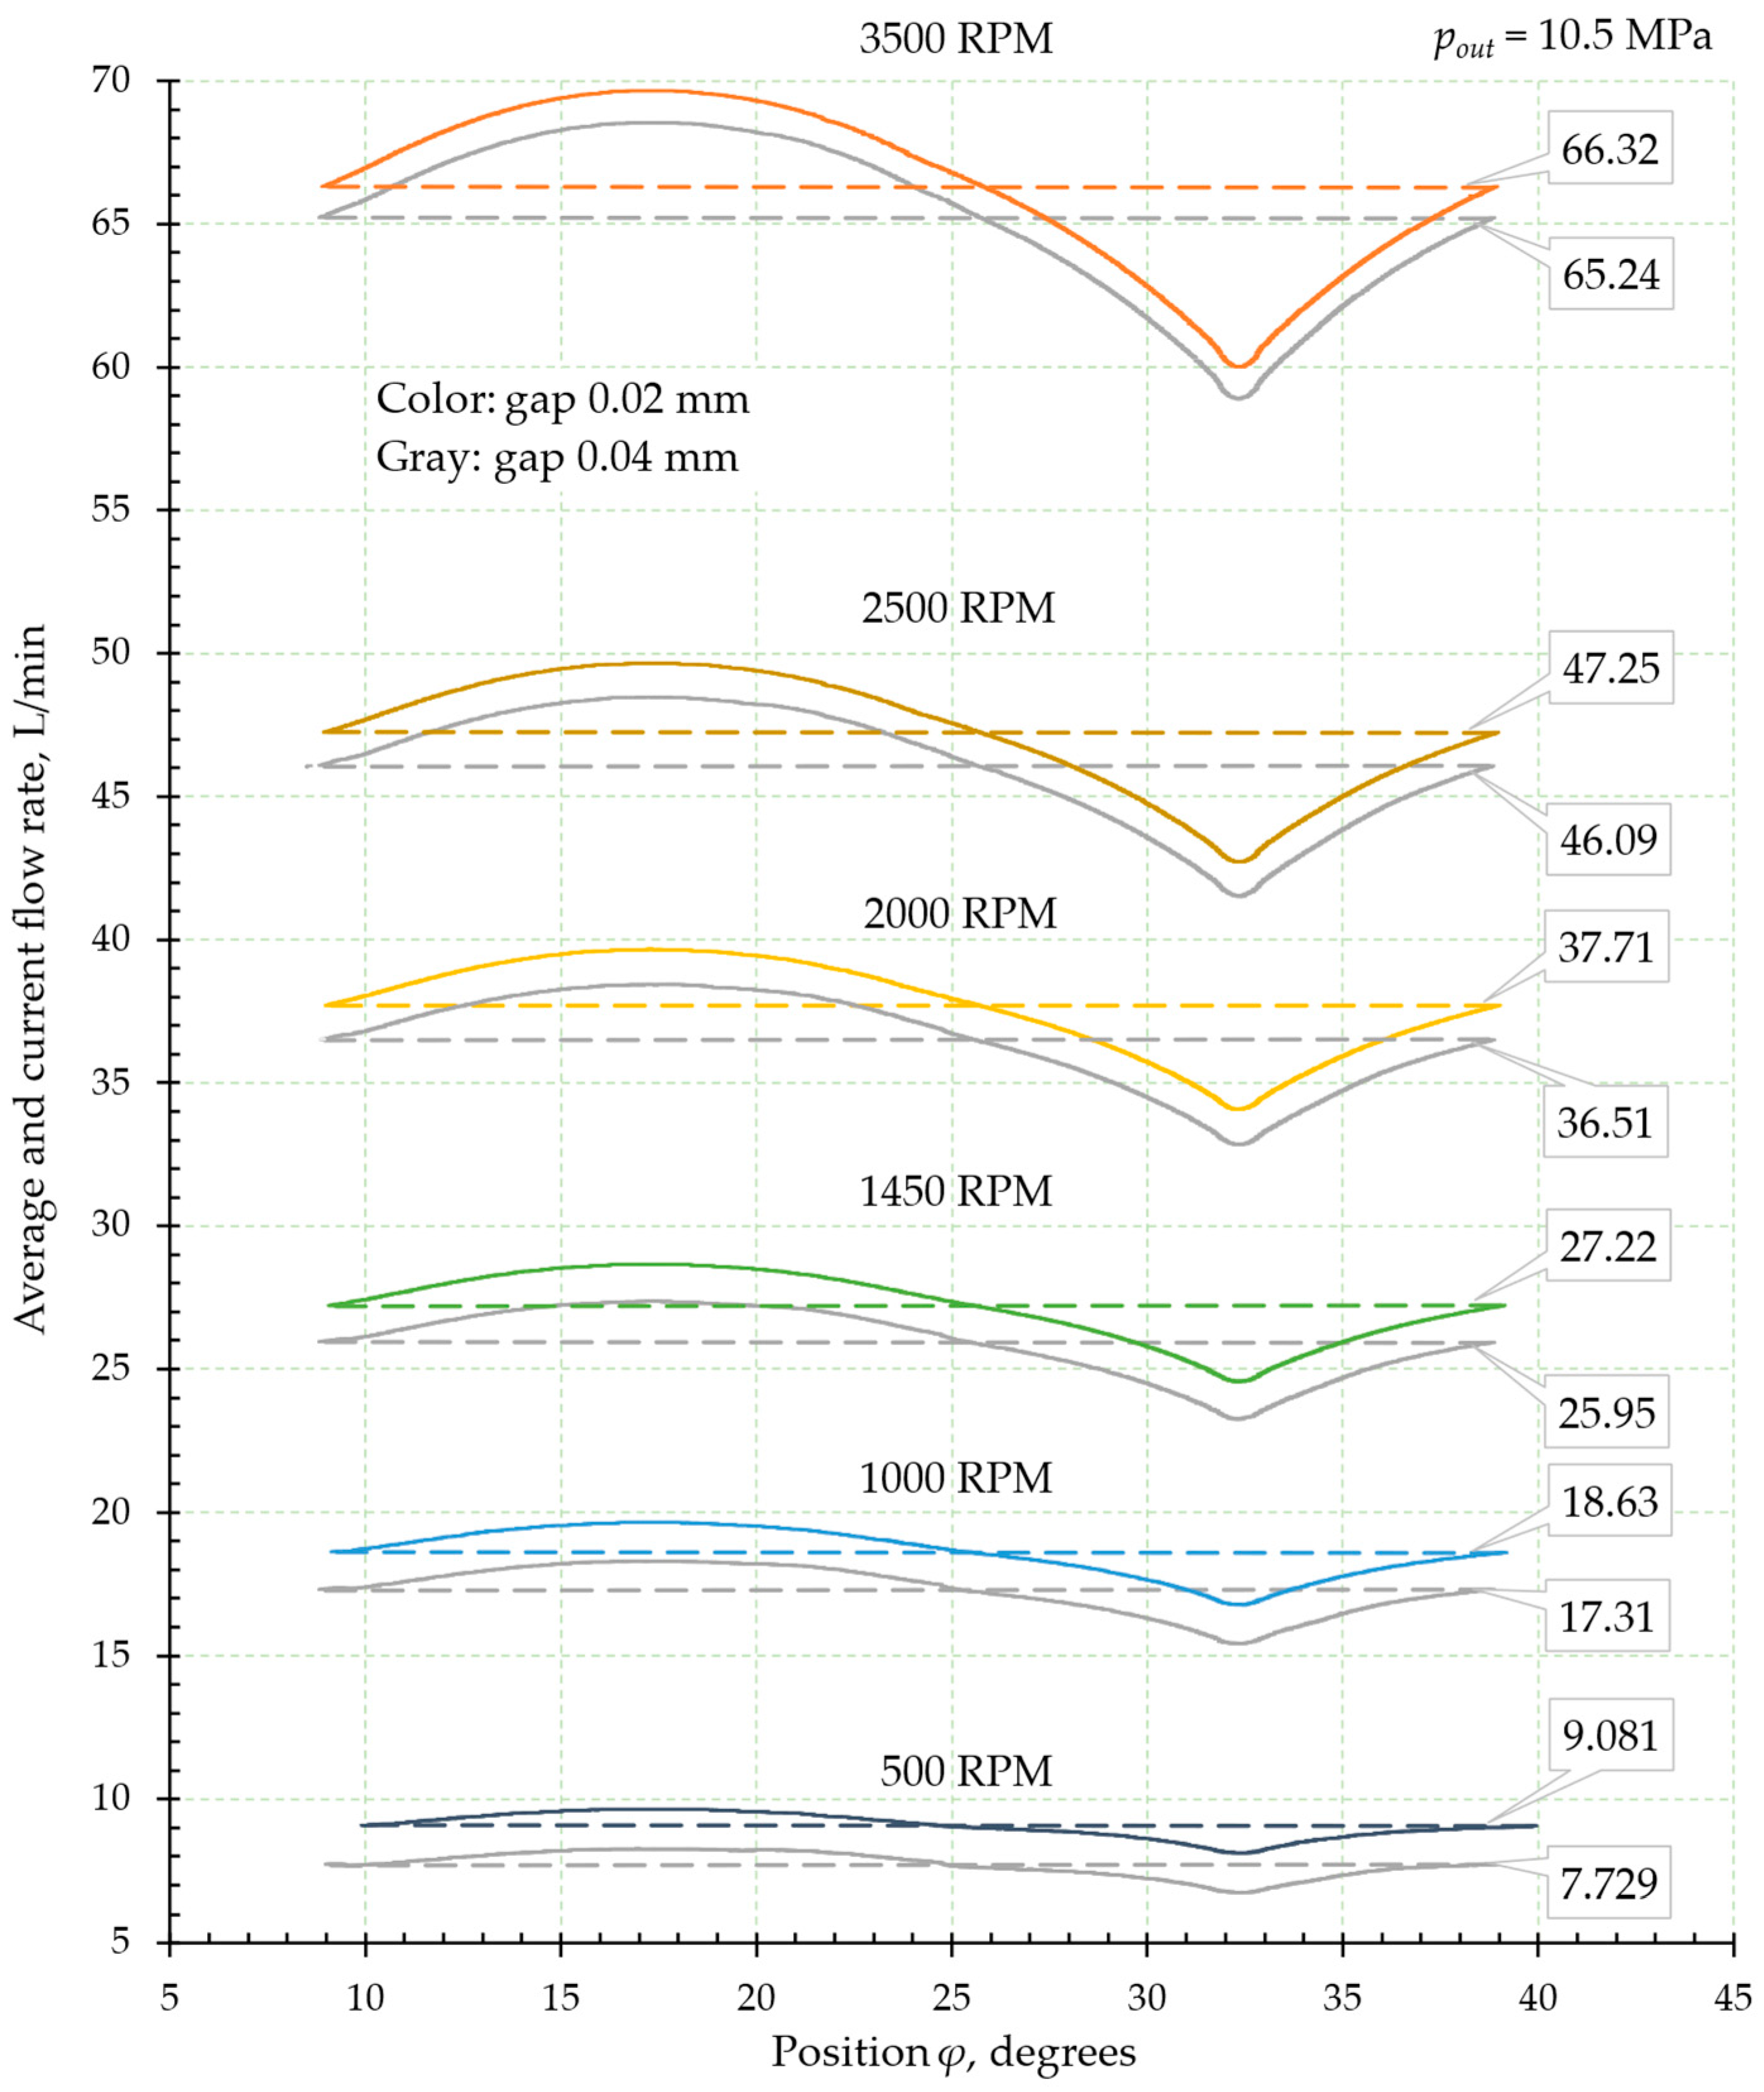
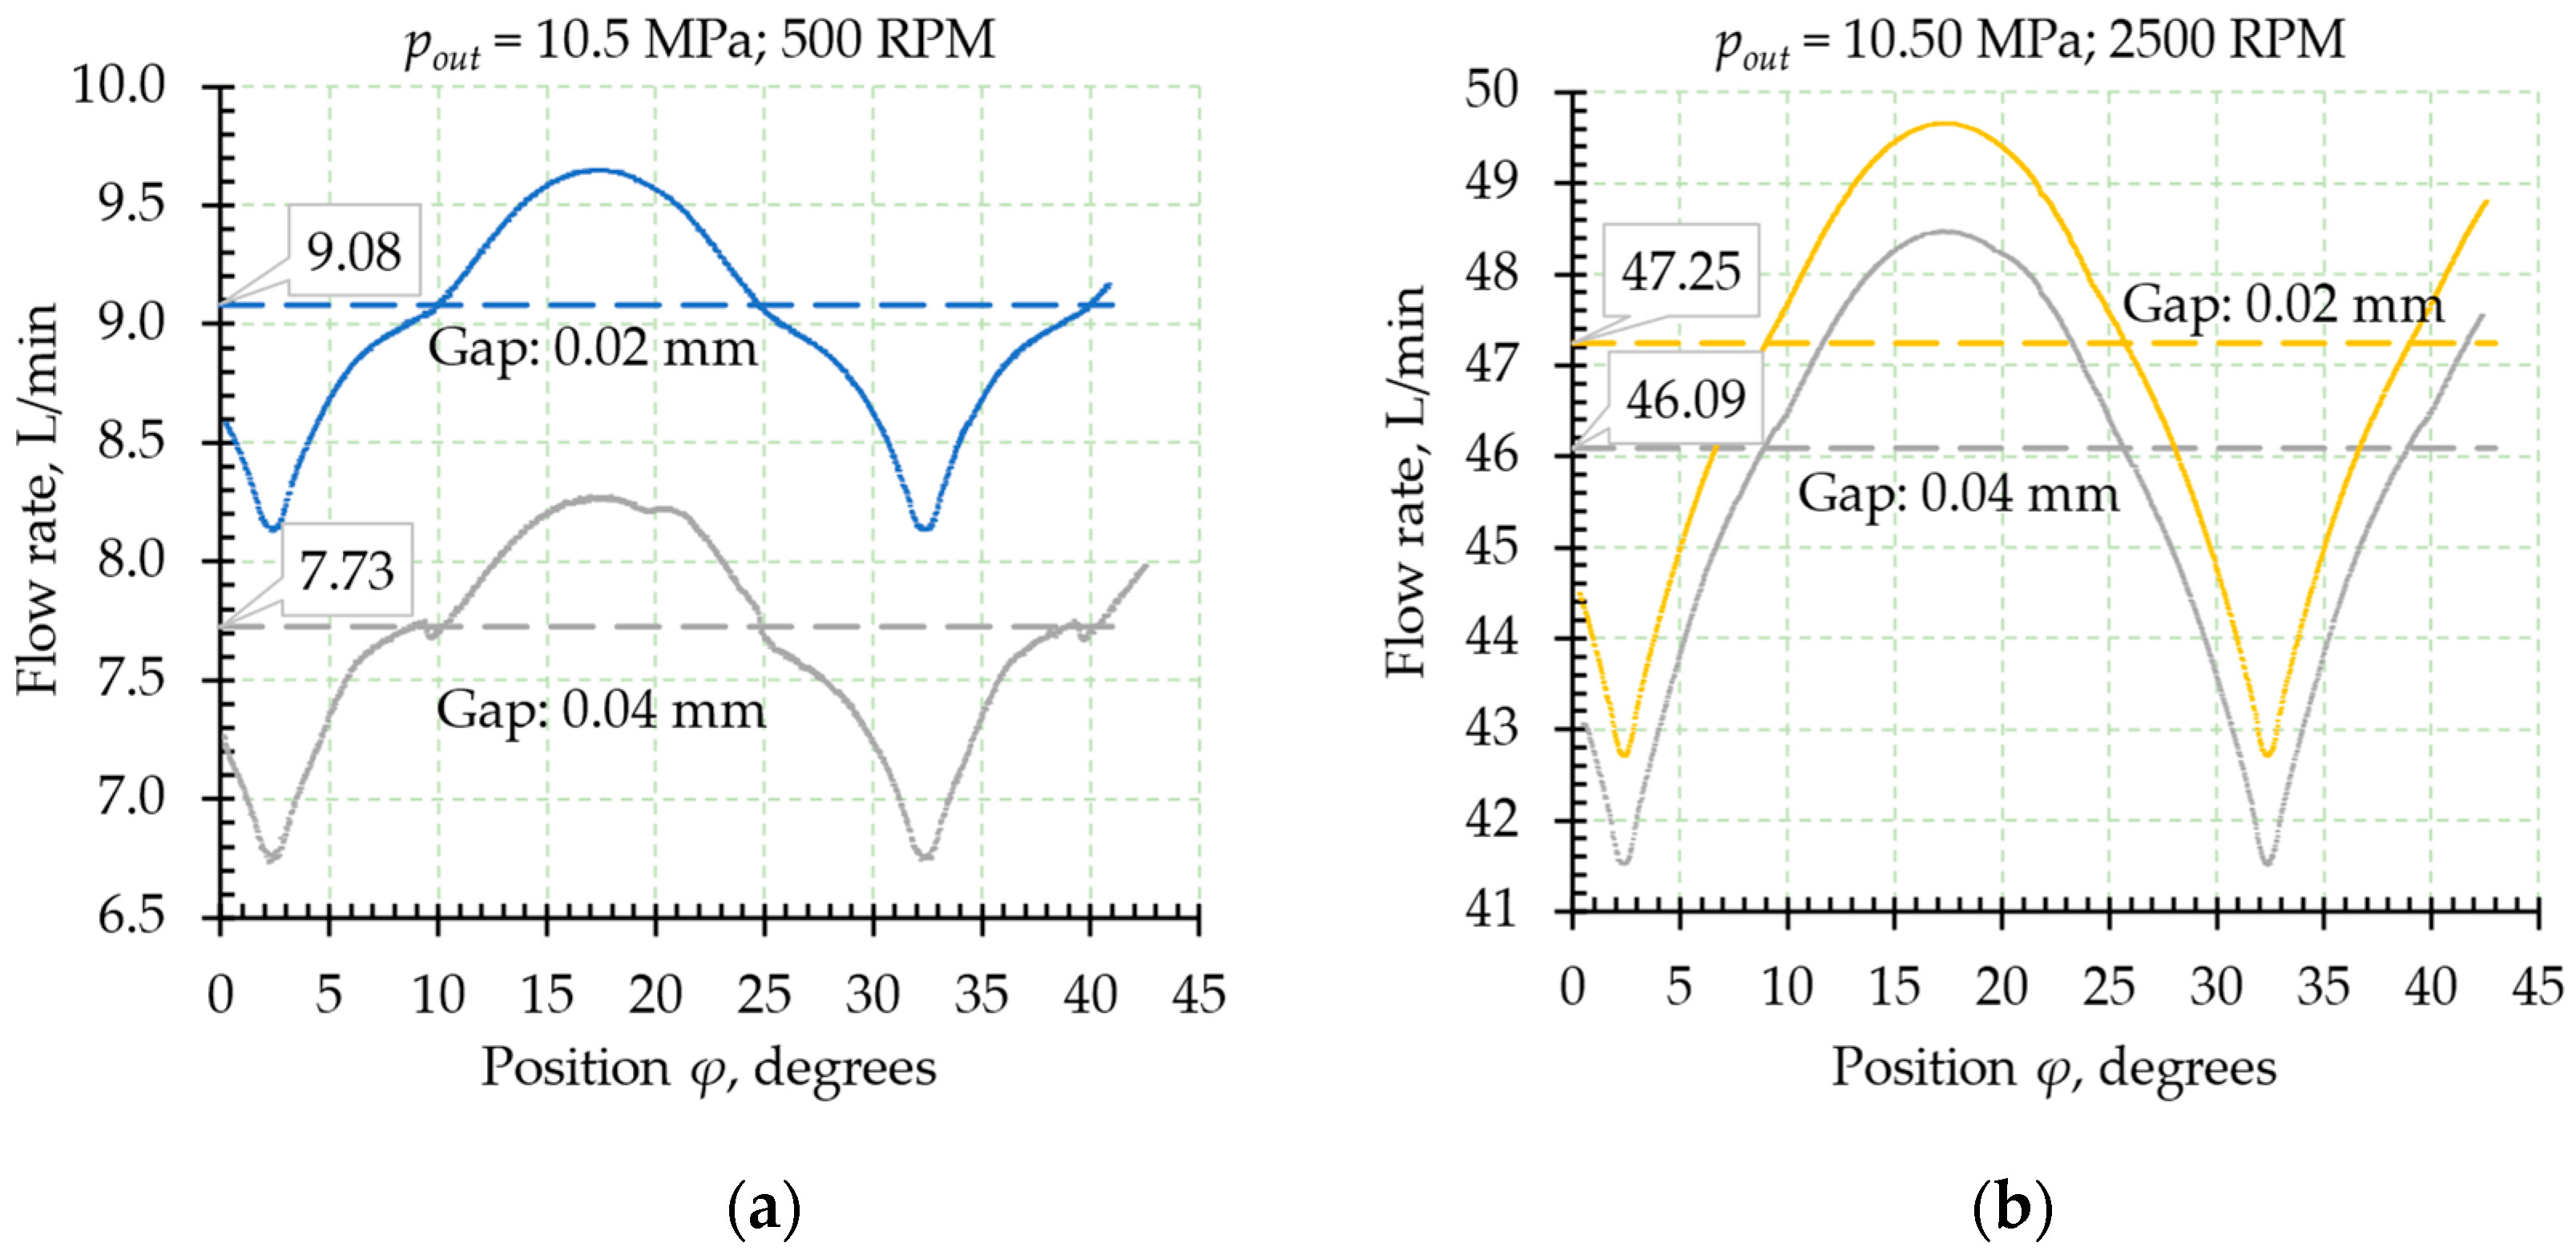
4.1. Average and Current Values of the Flow Rate

The average flow rate q was the main simulation performance characteristic used in the present study. It was analyzed how the size of the radial gap affects flow rate q at different rotation frequencies n .
Due to the variable angular step, the average flow rate q is calculated using the following formula applied over an exact 30° period:
q = i = 1 m q i + 1 + q i φ i + 1 φ i 2 φ m φ 1   ,
where q i   i = 1 m is the current flow rate, φ is the angular position of gears, and m is number of steps per 30° period (typically about 1000).
In Figure 6, one period of 30° is shown for each of the studied modes. For a better overview, the beginning and end of this period were chosen to be the position where the current and average flow rate are equal. The average flow rate q is given as a dashed line and as a value. The results at a 0.02 mm gap size are presented in different colors, and the results at a 0.04 mm gap size are depicted in gray.
It can be seen from Figure 6 that when the rotation frequency n increases, the losses decrease as an absolute value, while the flow rate increases significantly. This suggests a more detailed study on the relationships between the flow rate average value, the rotation frequency, and the radial gap size.
Figure 6 also does not provide a good presentation about the radial gap size and rotation frequency influence on the current flow rate variation, since the scale along the ordinate is insufficient. Therefore, Figure 7 shows a comparison between q i and q at 500 and at 2500 RPM for a 0.02 mm and 0.04 mm gap size. It can be seen that both the rotation frequency and the radial gap affect the flow rate variation with time. When the rotation frequency decreases and the radial gap increases, the shape becomes more complex and differs more significantly from that described in theory.

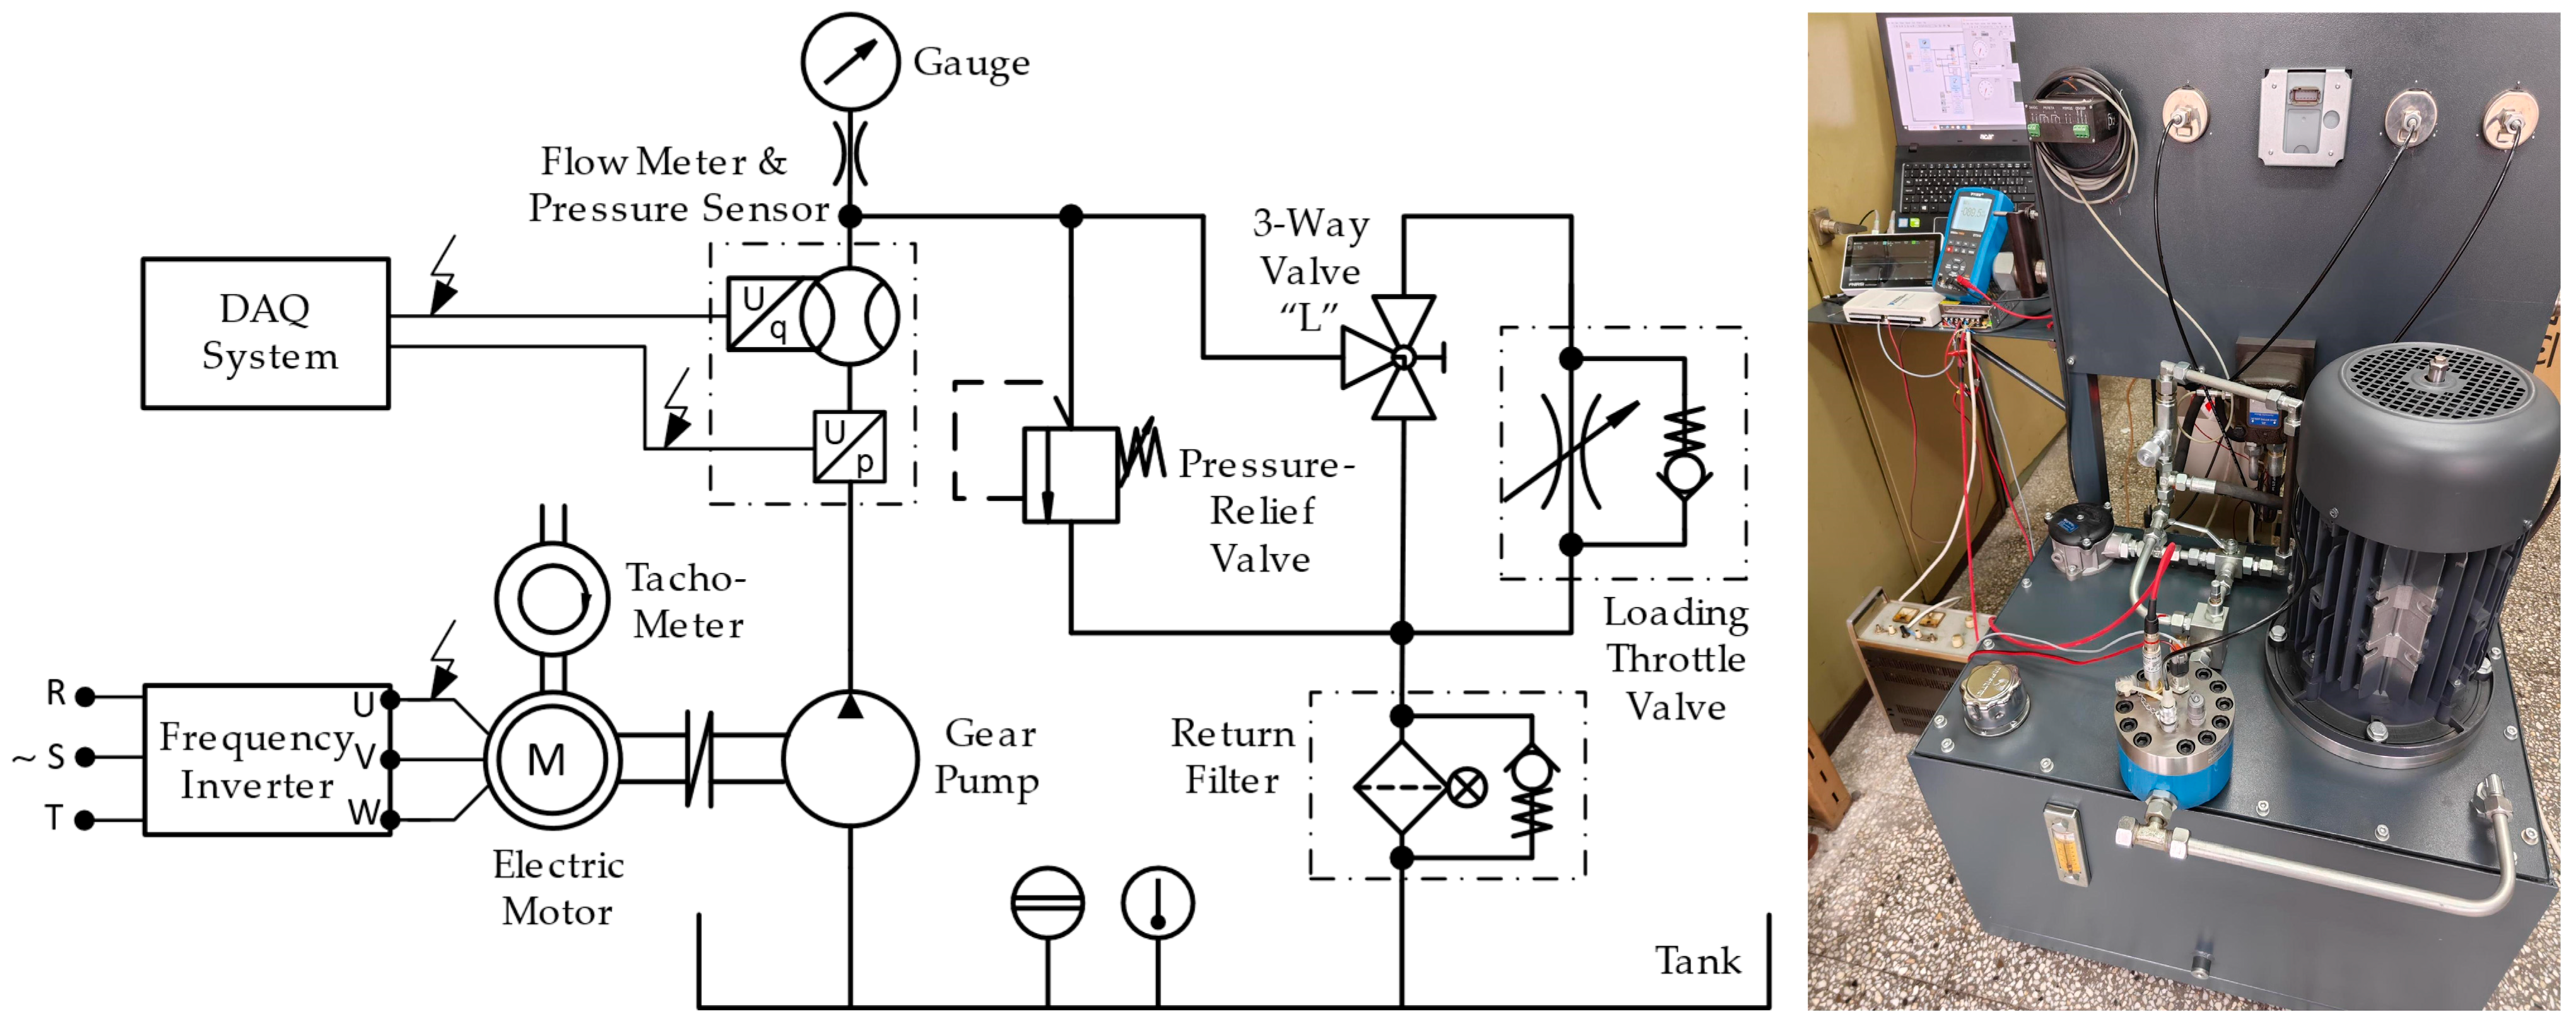
4.2. Experimental Verification of the CFD Results

The CFD experimental verification results were obtained by an existing laboratory test bench described in detail in [41]. Figure 8 shows the test bench hydraulic circuit diagram and its realization. The hydraulic system consisted of a tank with a volume of 130 L to which a motor pump group was mounted, consisting of an external gear pump driven by a three-phase asynchronous electric motor, which had a power of 7.5 kW and a nominal rotation frequency of 1450 RPM. The electric motor was equipped with a frequency inverter allowing the rotation frequency change in the range of 0–1450 RPM. A gear flowmeter with an integrated pressure transducer was connected to the pump discharge pipeline. For safety reasons, the pressure in the pump discharge pipeline was also visually measured with a manometer. A pressure loading system was connected after the flow meter. It consisted of a direct operated pressure-relief valve and a parallel-connected precision adjustable throttle check valve. A three-way “L”-type valve was connected between the pressure-relief valve and the throttle valve in order to switch between the two main operation modes—loading and unloading. In the loading mode, the maximum pressure value was determined by the pressure-relief valve setting, while the pressure load adjustment between the minimum and maximum values was made with the throttle valve. The loading system output was connected to the tank through a return filter group.
The flow meter output signals (flow rate and pressure) were both connected to a specially developed data acquisition (DAQ) system. It is based on an NI USB 6211 processing and recording device, connected to a laptop via USB. The user interface was developed in the LABView™ ver. 2010 software environment. Additionally, the system measured the motor and pump rotation frequency by a laser tachometer.
The experimentally obtained flow rate values q e x p   are presented in Table 1, where they are compared with the results of the CFD model and the experimental information from the manufacturer (marked as Tech Data). Since the function q e x p n is linear, the values of q e x p at 2500 and 3500 RPM were determined by the extrapolation of the experimentally obtained curve.
As can be seen from Table 1, the percentage difference Δ q e x p between the CFD simulation results and the experimentally obtained results at 1450 RPM did not exceed 2.5%, which confirms that the model provides reliable results in the verified range of rotation frequencies. It can be further used to investigate pump efficiency at different values of radial gaps, changing as a result of housing wear.

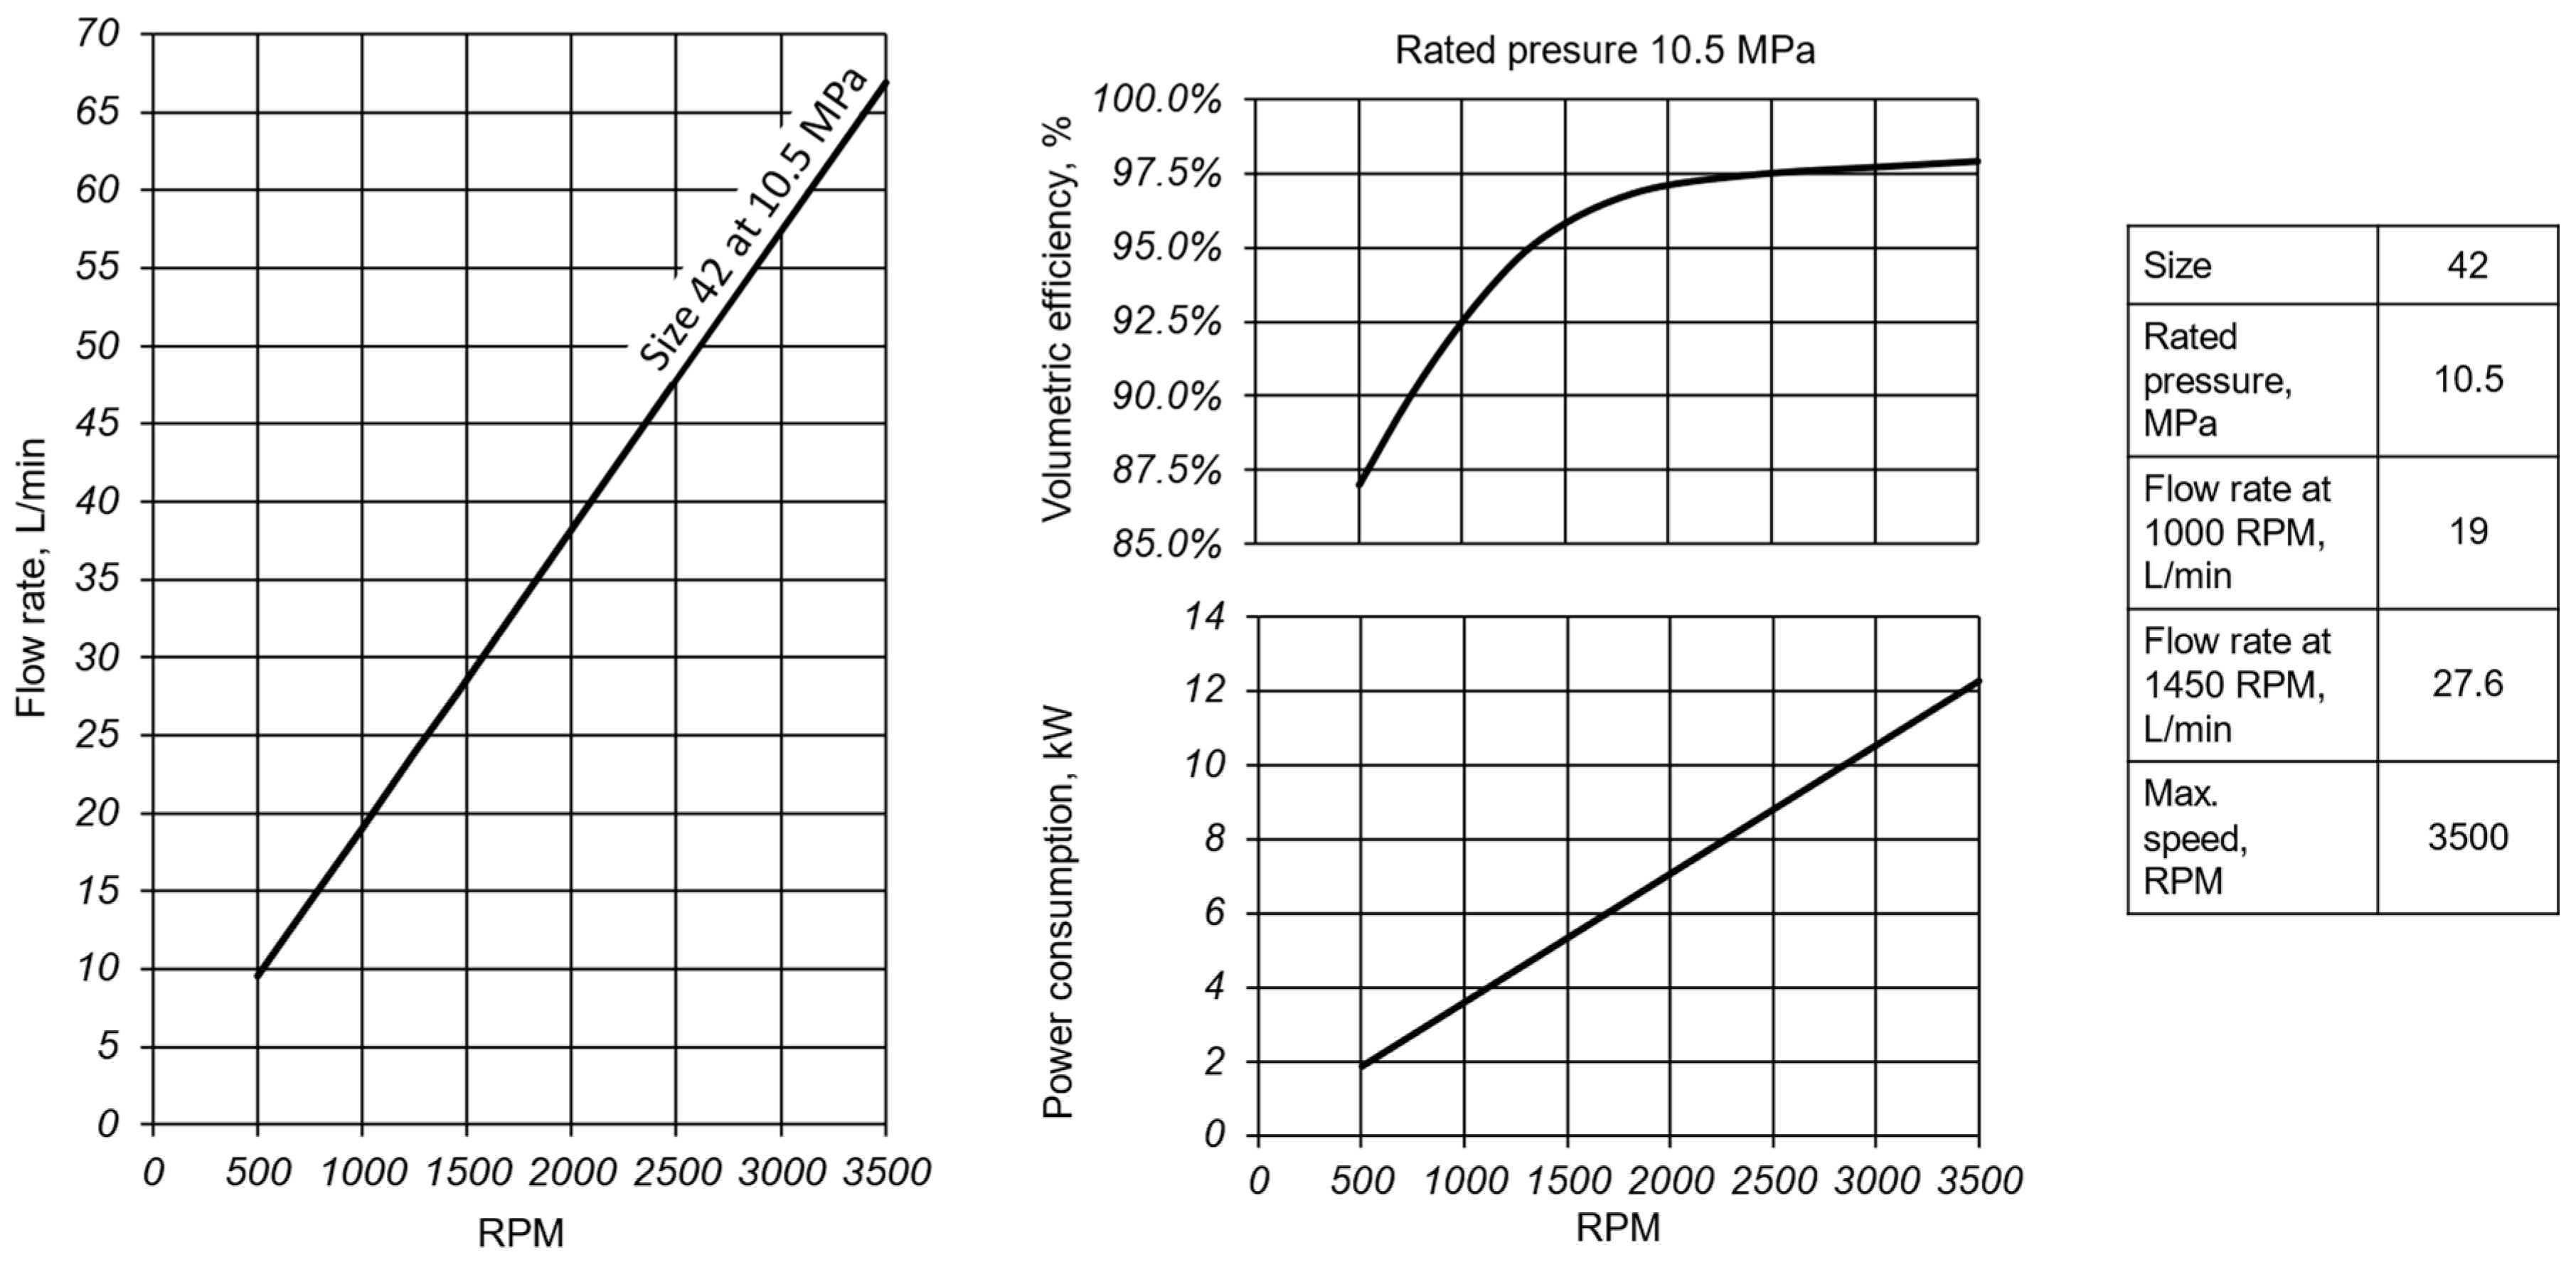
4.3. Verification of the CFD Results with Manufacturer Data

The experimental data are available from the manufacturer data sheet [54] of the studied pump, which can be used to verify the CFD results. It is in graphical and tabular form—Figure 9. As can be seen from the figure, the flow rate changed linearly with the rotation frequency, and for the considered pump displacement volume, at a pressure of 10.5 MPa, two specific values were given—19 L/min at 1000 RPM and 27.6 L/min at 1450 RPM. From these two values, some discrete values of the line q T e c h n were obtained using linear extrapolation and filled in Table 1.
As can be seen from Table 1, the percentage difference Δ q T e c h between the CFD simulation results and the technical data at 1450 RPM was −1.37%. While the experimental verification was for the range of 500–1450 RPM, as our test bench had a maximum of 1500 RPM, the verification with the manufacturer’s data confirmed the reliability of the CFD model results over the entire pump operating range (500–3500 RPM). Additionally, in Table 1, the percentage difference Δ q E T between the experimental and technical data for q was calculated. The values did not exceed −6.5%, which indicates that the characteristics of the investigated pump corresponded to those given in the technical documentation, and the technical data can be successfully used for verification.

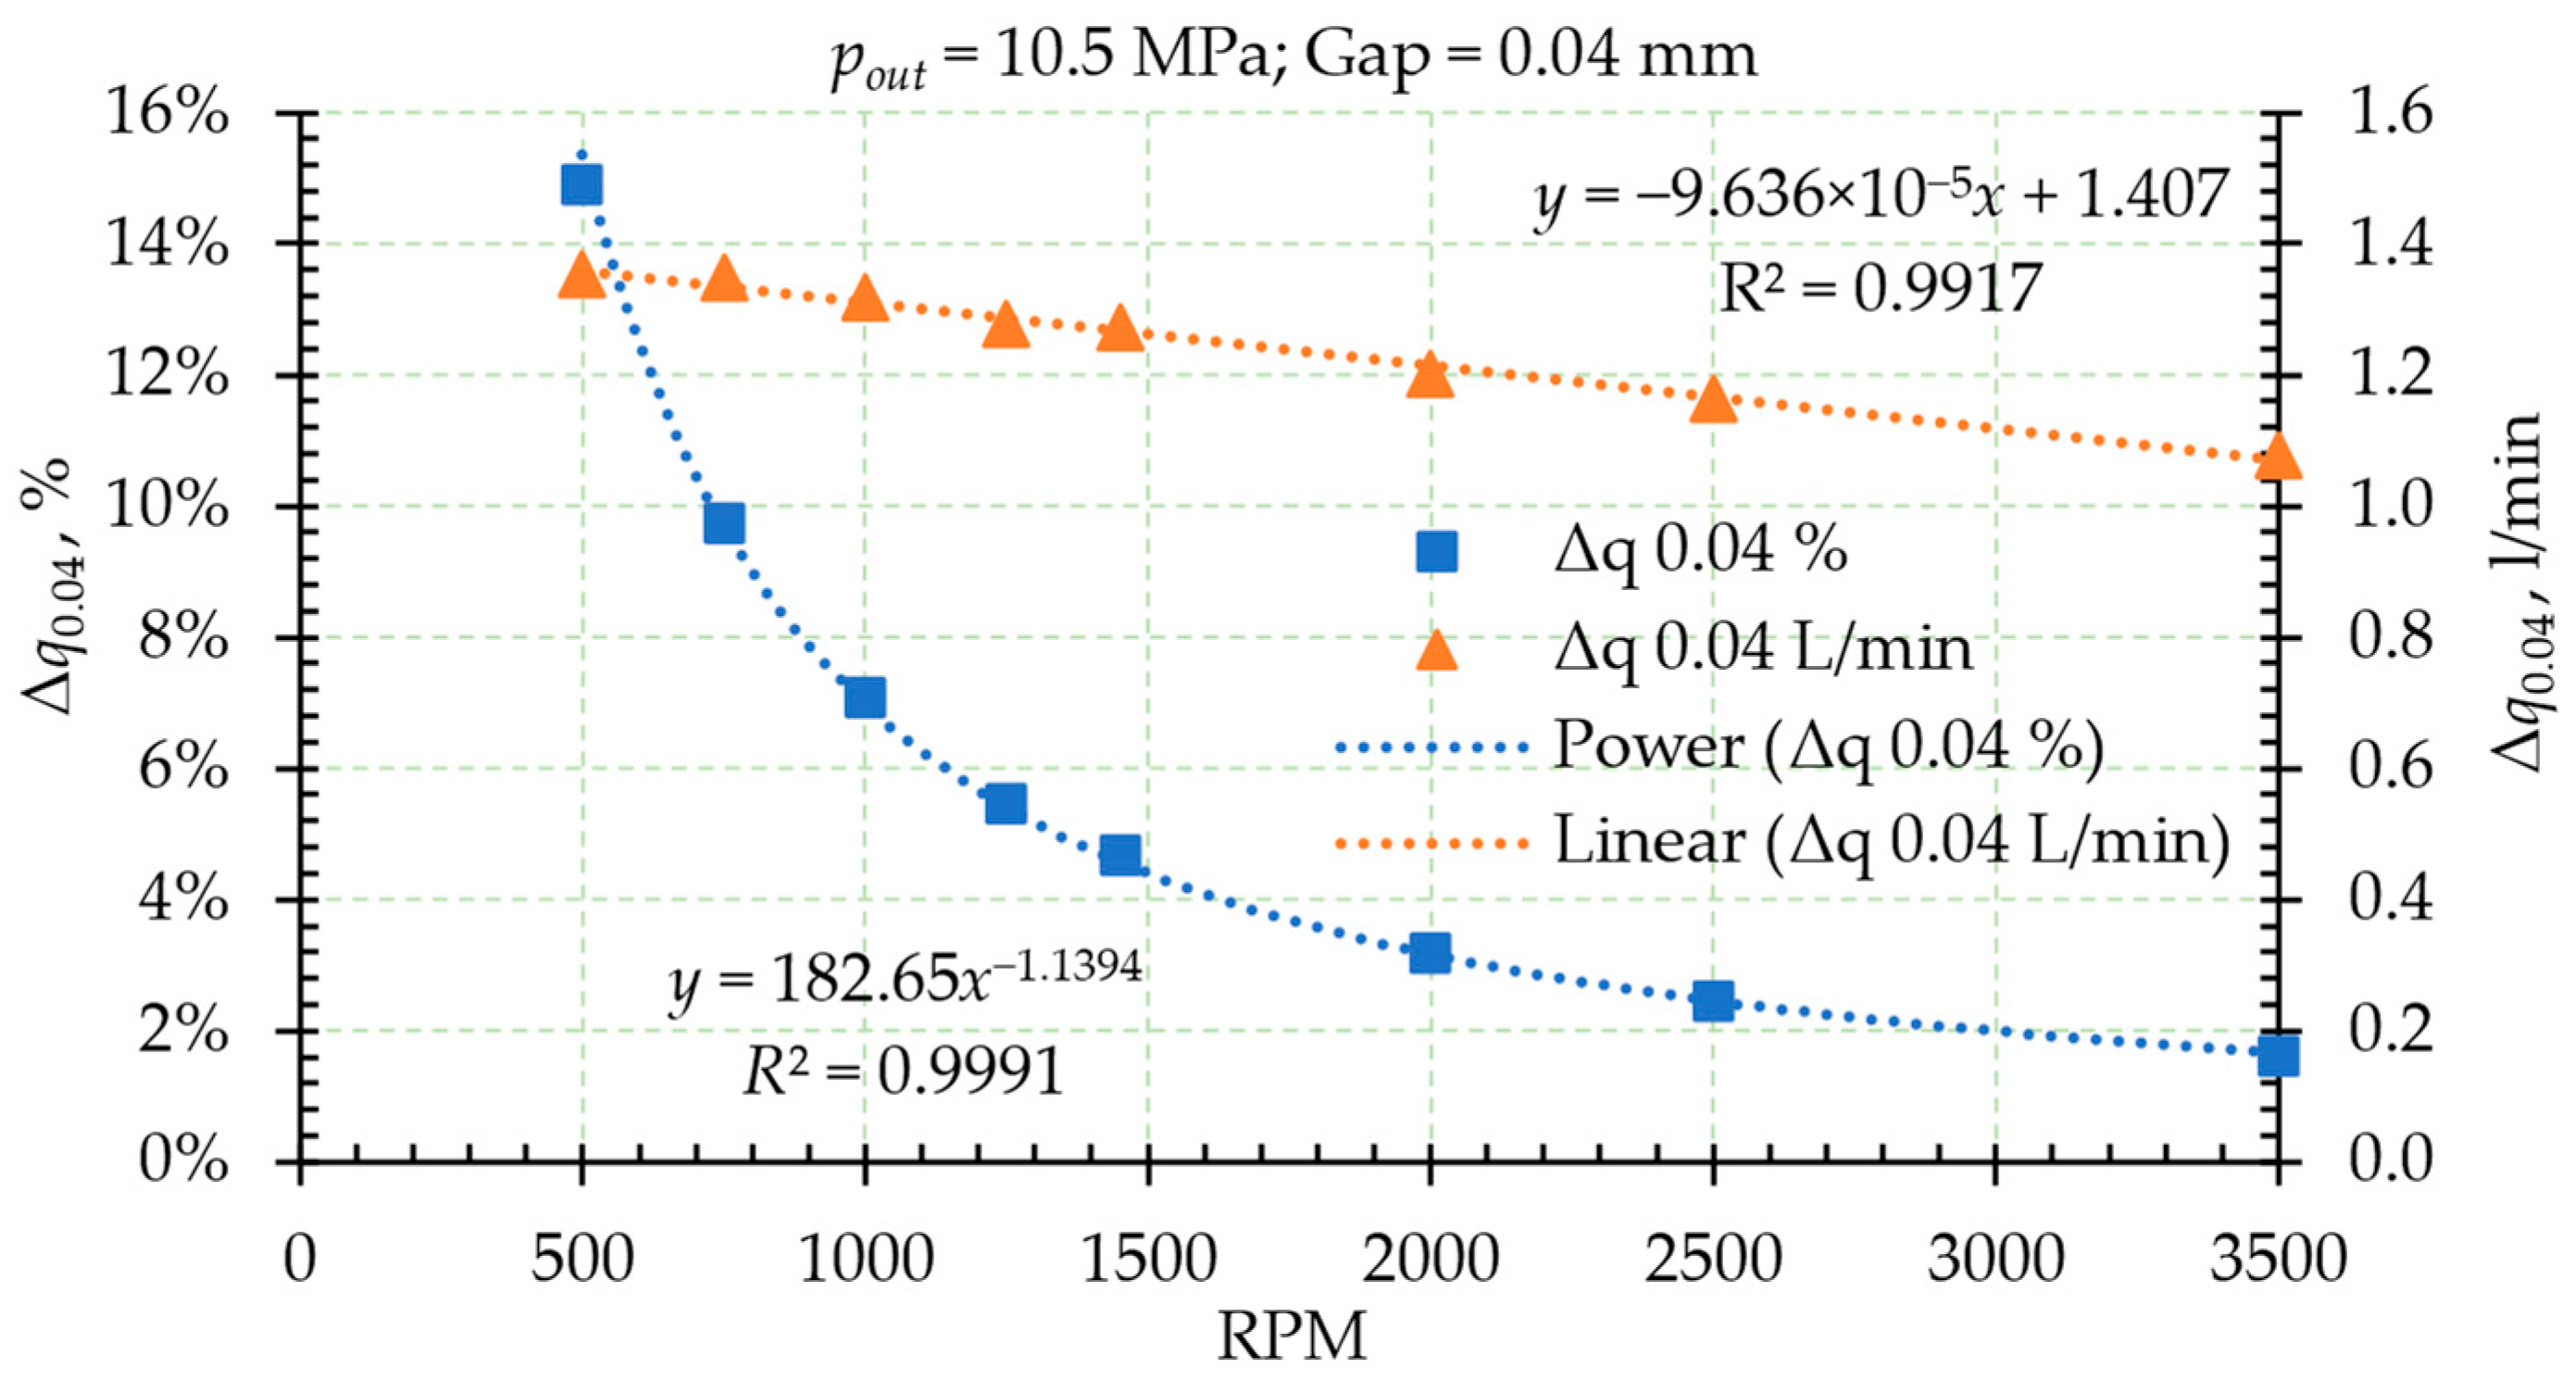
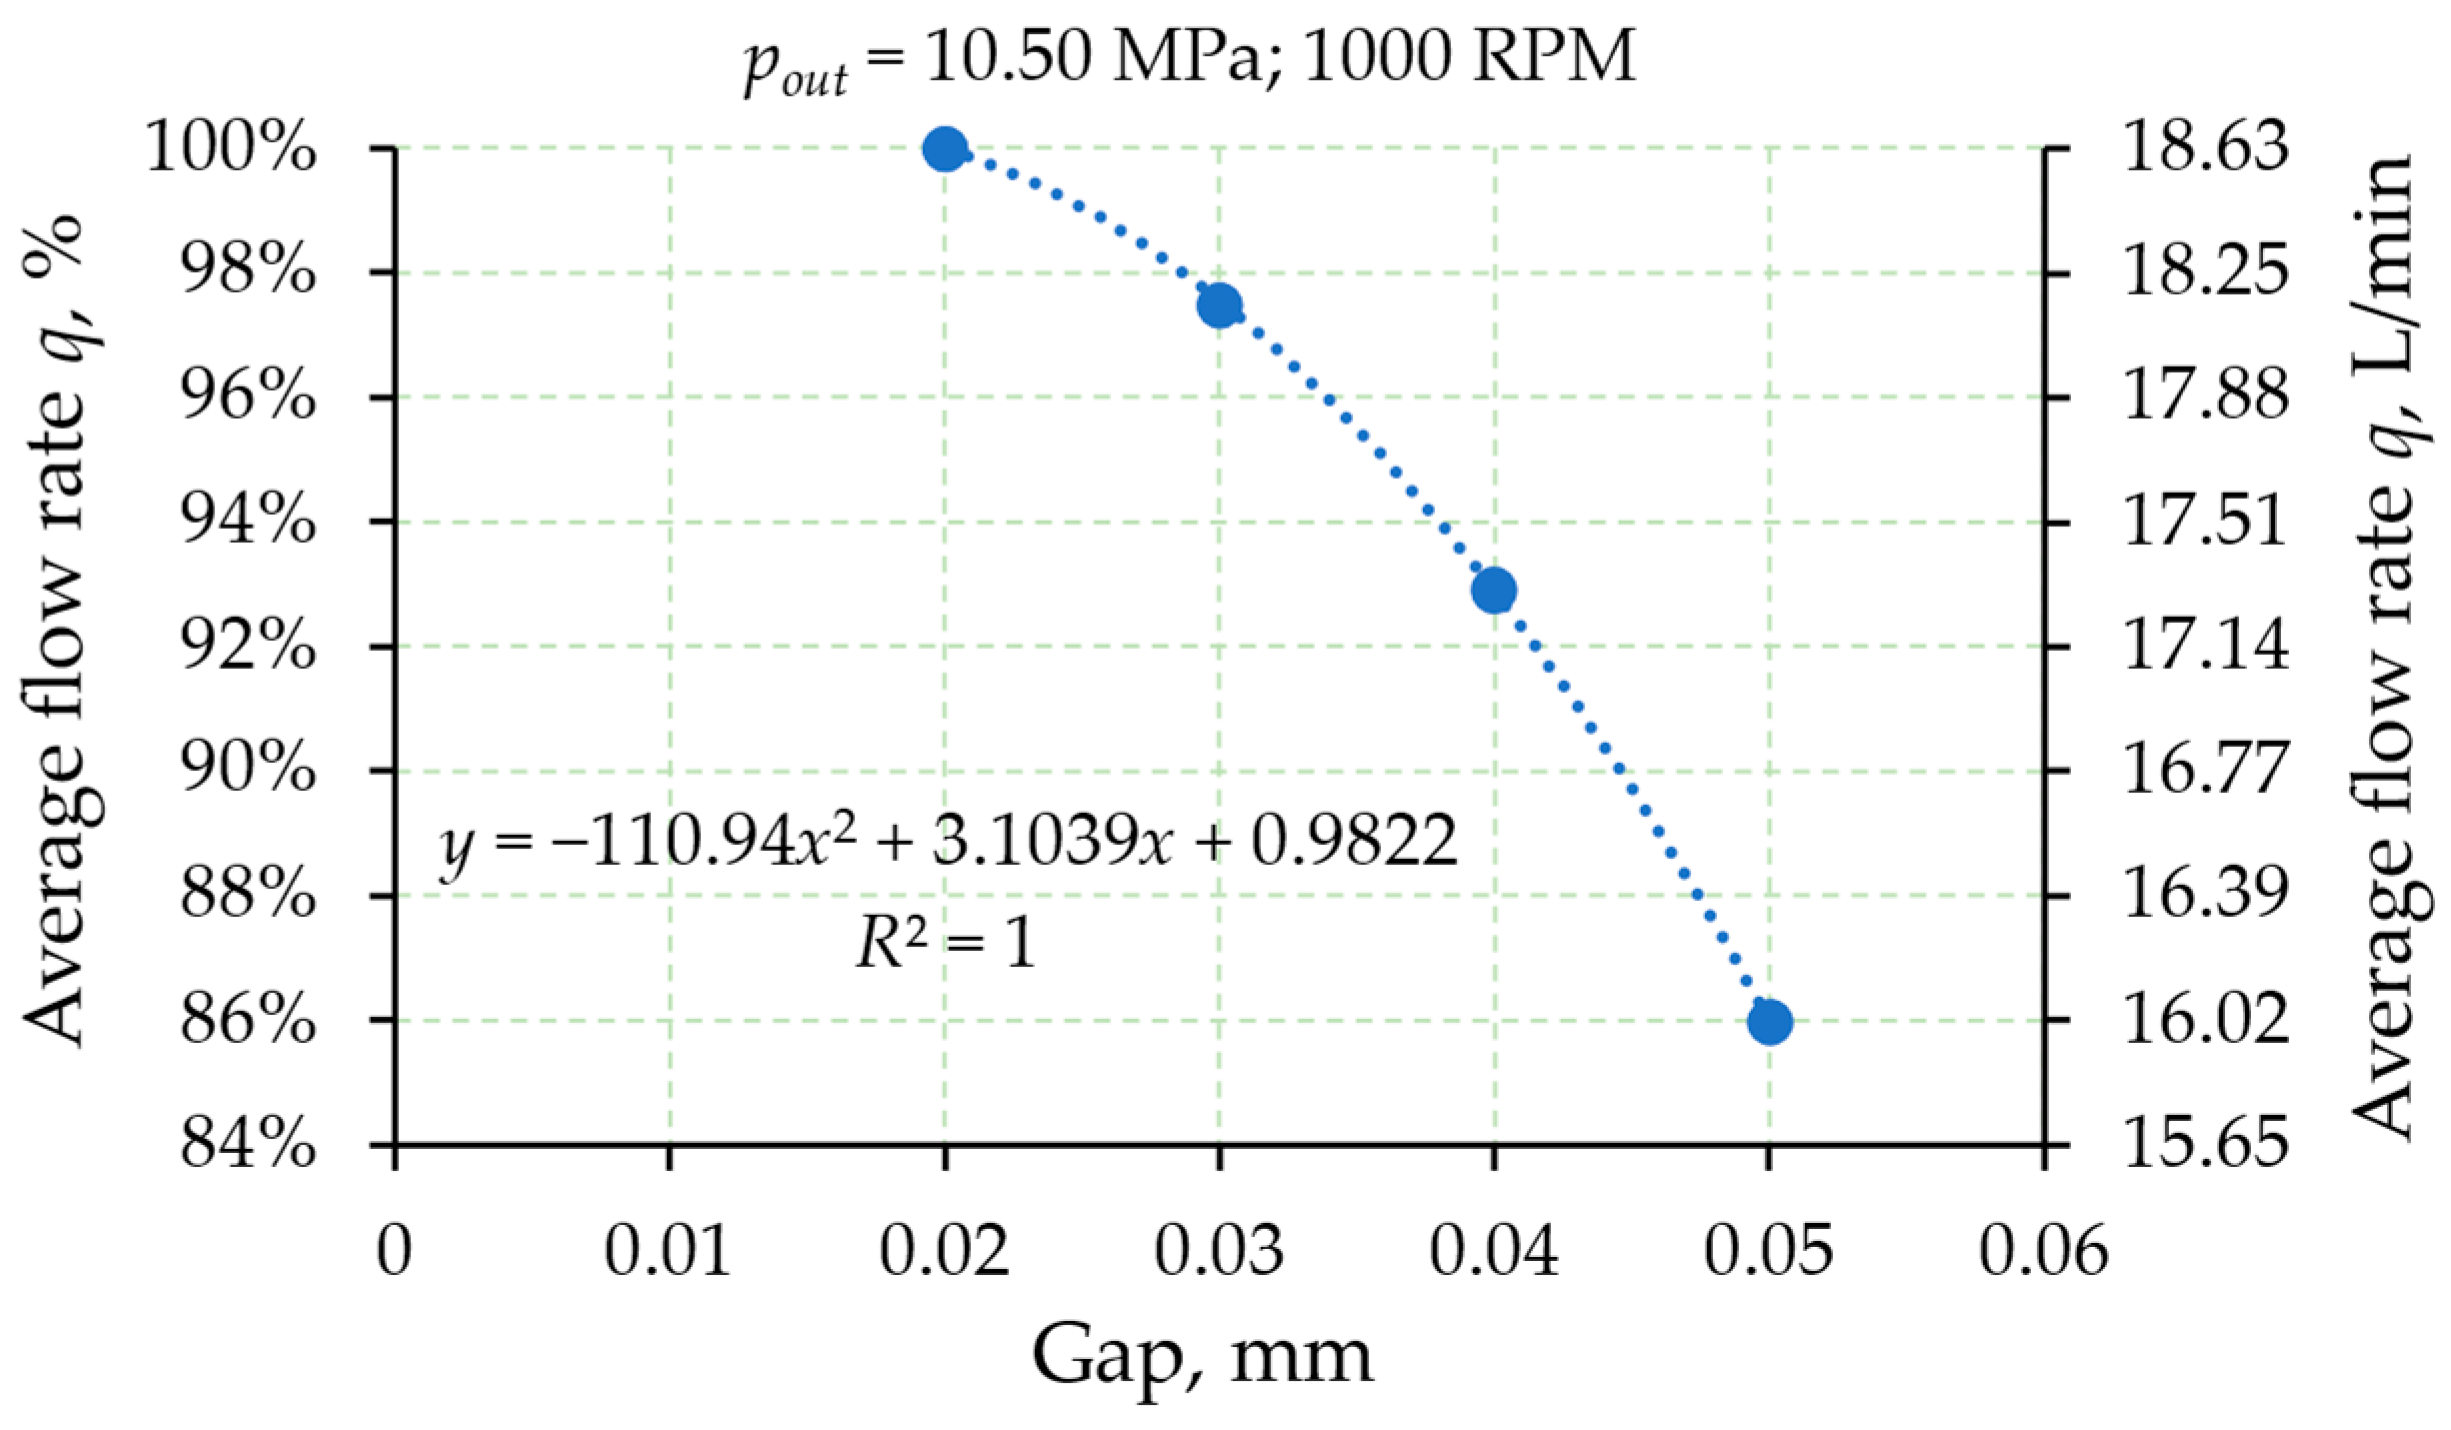
5. Radial Gap Size Influence on the Volumetric Flow Rate

The values of the average volumetric flow rate q at a radial gap of 0.2 mm and at a radial gap of 0.04 mm ( q 0.04 ) for different rotation frequencies n were obtained using the CFD model and presented in Table 2. In the same table, the differences Δ q 0.04 between q and q 0.04 in L/min and percentages are shown.
It can be seen that the absolute value of the flow rate losses Δ q 0.04 increased linearly with a decrease in the rotation frequency n when changing the radial gap from 0.02 mm to 0.04 mm—Figure 10. However, with the decrease in n , the flow rate losses Δ q 0.04 increased in proportion to q 0.04 . As a result, the Δ q 0.04 n dependence, measured in percent, was a power-law function, also shown in Figure 10, with a smooth part at rotation frequencies above 1500 RPM and a steep part at rotation frequencies below 1500 RPM.
The radial gap size influence on the flow rate was studied with four CFD simulations at 1000 RPM—with gap size values of 0.02, 0.03, 0.04, and 0.05 mm. The results are shown in Figure 11 where both the discrete values of the flow rate q i and the average flow rate q are presented. It can be seen that the effect of increasing the radial gap was similar to the effect of decreasing the rotational frequency, illustrated in Figure 7. As the gap increased, the curve became more complex and different from the theoretical one, as well as noisier, in the other same conditions. Figure 11 shows that the average flow rate q decreases disproportionately with an increase in gap size [55]. To further evaluate this dependence, Table 3 and Figure 12 were created.
Table 3 and Figure 12 show the average pump flow rate q as a function of the radial gap size in two measurement units—in L/min as well as in the percentage of the value 18.628 L/min, which was obtained at the nominal radial gap of 0.02 mm. It can be seen that the average flow rate decreased with an increased gap along a square parabola, i.e., the negative effect increased with the square of the radial gap.

6. Pump Efficiency Estimation at Different Radial Gap Sizes

The methodology described in Section 3.2 and the technical data, shown in Figure 9 were used to obtain the volumetric efficiency η v and the overall (total) efficiency η of the pump at a 0.02 mm and 0.04 mm radial gap, with the average flow values q and q 0.04 from Table 2. The results are shown in Table 4.
The characteristics of the pump efficiency are presented in Figure 13. While the characteristic η v ( n ) for the nominal gap of 0.02 mm repeated those given in the technical documentation (Figure 9), the other characteristics in Table 4 and especially those for the radial gap of 0.04 mm were difficult to achieve in a real experiment (without simulation) and illustrated well the possibilities of the proposed methodology.

7. Conclusions

The influence of radial gap on the performance characteristics of a certain specimen of an external gear pump was successfully studied using numerical and experimental results as well as the manufacturer’s technical data. This numerical study was performed on the basis of a 2D CFD model developed and advanced in previous authors’ works. The experimental study was carried out on a laboratory test bench. The presented numerical results were accurate in the entire pump operating range (500–3500 RPM), which was confirmed by validation both with our own experimental data and with data from the technical documentation. The analysis showed that the differences obtained during the verifications were in the range from −6.44% to 2.48%. This is the reason to use the presented CFD model to predict the pump’s performance characteristics as it wears, which leads to increasing the radial gap between the housing and the gears tips.
Based on the performance characteristics’ fundamental theory, an original methodology was created. It allowed us to obtain the volumetric efficiency and overall efficiency of the pump as a function of the rotation frequency at any values of the radial gap, using the manufacturer’s data for volumetric efficiency and power consumption at nominal radial gaps and CFD simulation results. This allowed us to evaluate the performance of the pump in the process of its wear and to predict the maximum allowable radial gap in different operating modes.
The simulation results with a radial gap of 0.04 mm at an outlet pressure of 10.5 MPa showed a decrease in the overall efficiency by approximately 20% at the minimum rotation frequency (500–650 RPM). At a nominal rotational frequency (1450 RPM), there was a decrease in the overall efficiency by 5%, and at the maximum frequency of 3500 RPM, the decrease was less than 2%. The acceptable practice limit, at which the pump was considered unfit for normal operation as a result of wear, was when the flow rate was reduced to about 80% of its maximum value. Therefore, it can be concluded that a radial gap of 0.04 mm was close to the limit value for the studied pump if it was not operated at rotation frequencies above nominal.
The presented original methodology can also be applied to other types of hydraulic displacement pumps in order to evaluate their performances in the wear process and to predict the maximum allowable value of a specific design parameter.

Author Contributions

Conceptualization, A.M., N.N. and I.K.; methodology, A.M. and N.N.; CFD model, N.N.; validation, A.M.; formal analysis, N.N. and A.M.; investigation, A.M. and N.N.; resources, A.M. and N.N.; data curation, N.N. and A.M.; writing—original draft preparation, A.M. and N.N.; writing—review and editing, A.M., N.N. and I.K.; visualization, N.N.; supervision, A.M.; project administration, I.K.; funding acquisition, I.K. All authors have read and agreed to the published version of the manuscript.

Funding

This work was accomplished with financial support by the European Regional Development Fund within the Operational Program “Bulgarian national recovery and resilience plan”, the procedure for direct provision of grants “Establishing of a network of research higher education institutions in Bulgaria”, under the project BG-RRP-2.004-0005 “Improving the research capacity and quality to achieve international recognition and resilience of TU-Sofia (IDEAS)”.

Institutional Review Board Statement

Not applicable.

Informed Consent Statement

Not applicable.

Data Availability Statement

Dataset available on request from the authors.

Conflicts of Interest

The authors declare no conflicts of interest.

References

  1. Findeisen, D.; Helduser, S. Ölhydraulik; Springer: Berlin/Heidelberg, Germany, 2015. [Google Scholar]
  2. ISO 3662:1976; Hydraulic Fluid Power—Pumps and Motors—Geometric Displacements. International Organization for Standardization: Geneva, Switzerland, 1976.
  3. Ivantysyn, J.; Ivantysynova, M. Hydrostatic Pumps and Motors: Principles, Design, Performance, Modelling, Analysis, Control and Testing; Academia Books International: New Delhi, India, 2001. [Google Scholar]
  4. Beacham, T.E. High-Pressure Gear Pumps. Proc. Inst. Mech. Eng. 1946, 155, 417–452. [Google Scholar] [CrossRef]
  5. Frosina, E.; Senatore, A.; Rigosi, M. Study of a high-pressure external gear pump with a computational fluid dynamic modeling approach. Energies 2017, 10, 1113. [Google Scholar] [CrossRef]
  6. Marinaro, G.; Frosina, E.; Senatore, A. A Numerical Analysis of an Innovative Flow Ripple Reduction Method for External Gear Pumps. Energies 2021, 14, 471. [Google Scholar] [CrossRef]
  7. Egbe, E.A.P. Design Analysis and Testing of a Gear Pump. Int. J. Eng. Sci. 2013, 3, 1–7. [Google Scholar]
  8. Mali, P.S.; Joshi, G.S.; Patil, I.A. Performance improvement of external gear pump through CFD analysis. Int. Res. J. Eng. Technol. 2018, 5, 430–433. [Google Scholar]
  9. Yanada, H.; Ichikawa, T.; Itsuji, Y. Study of the trapping of fluid in a gear pump. Proc. Inst. Mech. Eng. Part A Power Process Eng. 1987, 201, 39–45. [Google Scholar] [CrossRef]
  10. Nagamura, K.; Ikejo, K.; Tutulan, F.G. Design and performance of gear pumps with a non-involute tooth profile. Proc. Inst. Mech. Eng. Part B J. Eng. Manuf. 2004, 218, 699–712. [Google Scholar] [CrossRef]
  11. Cieślicki, R.; Karpenko, M. An investigation of the impact of pump deformations on circumferential gap height as a factor influencing volumetric efficiency of external gear pumps. Transport 2022, 37, 373–382. [Google Scholar] [CrossRef]
  12. Szwemin, P.; Fiebig, W. The Influence of Radial and Axial Gaps on Volumetric Efficiency of External Gear Pumps. Energies 2021, 14, 4468. [Google Scholar] [CrossRef]
  13. Peng, Z.; Wei, L.; Liu, R.; Liang, M.; Qiang, Y. Flow Field Modeling and Simulation of High-Speed Gear Pump Considering Optimal Radial and End Clearance. IEEE Access 2023, 11, 64725–64737. [Google Scholar] [CrossRef]
  14. Corvaglia, A.; Rundo, M.; Bonati, S.; Rigosi, M. Simulation and experimental activity for the evaluation of the filling capability in external gear pumps. Fluids 2023, 8, 251. [Google Scholar] [CrossRef]
  15. Borghi, M.; Zardin, B.; Specchia, E. External Gear Pump Volumetric Efficiency: Numerical and Experimental Analysis; SAE Technical Paper; SAE: Warrendale, PA, USA, 2009. [Google Scholar]
  16. Choudhuri, K.; Biswas, N.; Mandal, S.K.; Mitra, C.; Biswas, S. A numerical study of an external gear pump operating under different conditions. Mater. Today Proc. 2022, in press. [Google Scholar] [CrossRef]
  17. Mucchi, E.; Dalpiaz, G.; Rivola, A. Dynamic behavior of gear pumps: Effect of variations in operational and design parameters. Meccanica 2011, 46, 1191–1212. [Google Scholar] [CrossRef]
  18. Del Campo, D.; Castilla, R.; Raush, G.A.; Gamez Montero, P.J.; Codina, E. Numerical analysis of external gear pumps including cavitation. J. Fluids Eng. Trans. ASME 2012, 134, 081105. [Google Scholar] [CrossRef]
  19. Del Campo, D. Analysis of the Suction Chamber of External Gear Pumps and Their Influence on Cavitation and Volumetric Efficiency. Ph.D. Thesis, Universitat Politècnica de Catalunya, Barcelona, Spain, 2012. [Google Scholar]
  20. Ouyang, T.; Mo, X.; Lu, Y.; Wang, J. CFD-vibration coupled model for predicting cavitation in gear transmissions. Int. J. Mech. Sci. 2022, 225, 107377. [Google Scholar] [CrossRef]
  21. Killedar, J.S. CFD Analysis of Gear Pump. Master’s Thesis, Youngstown State University, Youngstown, OH, USA, 2005. [Google Scholar]
  22. Lee, J.-H.; Lee, S.-W. Numerical Simulations of Cavitation Flow in Volumetric Gear Pump. J. Korean Soc. Vis. 2011, 9, 28–34. [Google Scholar]
  23. Muzzioli, G.; Montorsi, L.; Polito, A.; Lucchi, A.; Sassi, A.; Milani, M. About the Influence of Eco-Friendly Fluids on the Performance of an External Gear Pump. Energies 2021, 14, 799. [Google Scholar] [CrossRef]
  24. Martorana, P.; Bayer, I.S.; Steele, A.; Loth, E. Effect of graphite and carbon nanofiber additives on the performance efficiency of a gear pump driven hydraulic circuit using ethanol. Ind. Eng. Chem. Res. 2010, 49, 11363–11368. [Google Scholar] [CrossRef]
  25. Novaković, B.; Radovanović, L.; Zuber, N.; Radosav, D.; Đorđević, L.; Kavalić, M. Analysis of the influence of hydraulic fluid quality on external gear pump performance. Eksploat. I Niezawodn. 2022, 24, 260–268. [Google Scholar] [CrossRef]
  26. Maccioni, L.; Concli, F. Computational fluid dynamics applied to lubricated mechanical components: Review of the approaches to simulate gears, bearings, and pumps. Appl. Sci. 2020, 10, 8810. [Google Scholar] [CrossRef]
  27. Dalla Lana, E.; De Negri, V.J. A New Evaluation Method for Hydraulic Gear Pump Efficiency Through Temperature Measurement; SAE Technical Papers; SAE: Warrendale, PA, USA, 2006. [Google Scholar]
  28. Battarra, M.; Mucchi, E. On the assessment of lumped parameter models for gear pump performance prediction. Simul. Model. Pract. Theory 2020, 99, 102008. [Google Scholar] [CrossRef]
  29. Yoon, Y.; Park, B.-H.; Shim, J.; Han, Y.-O.; Hong, B.-J.; Yun, S.-H. Numerical simulation of three-dimensional external gear pump using immersed solid method. Appl. Therm. Eng. 2017, 118, 539–550. [Google Scholar] [CrossRef]
  30. Zeleny, Z.; Vodicka, V.; Novotny, V.; Mascuch, J. Gear pump for low power output ORC—An efficiency analysis. Energy Procedia 2017, 129, 1002–1009. [Google Scholar] [CrossRef]
  31. Abdellah El-Hadj, A. Optimization of an External Gear Pump using Response Surface Method. J. Mech. 2020, 36, 567–575. [Google Scholar] [CrossRef]
  32. Casoli, P.; Vacca, A.; Berta, G.L. Optimization of relevant design parameters of external gear pumps. In Proceedings of the 7th International Symposium on Fluid Power JFPS, Toyama, Japan, 15–18 September 2008. [Google Scholar]
  33. Zardin, B.; Natali, E.; Borghi, M. Evaluation of the Hydro—Mechanical Efficiency of External Gear Pumps. Energies 2019, 12, 2468. [Google Scholar] [CrossRef]
  34. Kollek, W.; Radziwanowska, U. Energetic efficiency of gear micropumps. Arch. Civ. Mech. Eng. 2015, 15, 109–115. [Google Scholar] [CrossRef]
  35. McKelvey, J.M. Performance of gear pumps in polymer processing. Polym. Eng. Sci. 1984, 24, 398–402. [Google Scholar] [CrossRef]
  36. Michael, P.; Khalid, H.; Wanke, T. An Investigation of External Gear Pump Efficiency and Stribeck Values; SAE Technical Papers; SAE: Warrendale, PA, USA, 2012. [Google Scholar]
  37. Torrent, M.; Gamez-Montero, P.J.; Codina, E. Parameterization, Modeling, and Validation in Real Conditions of an External Gear Pump. Sustainability 2021, 13, 3089. [Google Scholar] [CrossRef]
  38. Wang, S.; Sakurai, H.; Kasarekar, A. The optimal design in external gear pumps and motors. IEEE/ASME Trans. Mechatron. 2011, 16, 945–952. [Google Scholar] [CrossRef]
  39. Manring, N.D.; Kasaragadda, S.B. The theoretical flow ripple of an external gear pump. J. Dyn. Syst. Meas. Control. Trans. ASME 2003, 125, 396–404. [Google Scholar] [CrossRef]
  40. Adake, D.G.; Dhote, N.D.; Khond, M.P. Experimentation and 2D Fluid Flow Simulation over an External Gear Pump. J. Phys. Conf. Ser. 2023, 2601, 012029. [Google Scholar] [CrossRef]
  41. Mitov, A.; Nikolov, N.; Nedelchev, K.; Kralov, I. CFD Modeling and Experimental Validation of the Flow Processes of an External Gear Pump. Processes 2024, 12, 261. [Google Scholar] [CrossRef]
  42. Castilla, R.; Gamez-Montero, P.J.; Del Campo, D.; Raush, G.; Garcia-Vilchez, M.; Codina, E. Three-dimensional numerical simulation of an external gear pump with decompression slot and meshing contact point. J. Fluids Eng. Trans. ASME 2015, 137, 041105. [Google Scholar] [CrossRef]
  43. Rundo, M. Models for Flow Rate Simulation in Gear Pumps: A Review. Energies 2017, 10, 1261. [Google Scholar] [CrossRef]
  44. Nikolov, N.; Mitov, A.; Kralov, I. Advanced 2D Computational Fluid Dynamics Model of an External Gear Pump Considering Relief Grooves. Appl. Sci. 2024, 14, 4299. [Google Scholar] [CrossRef]
  45. ISO 4413:2010; Hydraulic Fluid Power—General Rules and Safety Requirements for Systems and Their Components. International Organization for Standardization: Geneva, Switzerland, 2010.
  46. Bashta, T.M. Engineering Hydraulics: Handbook; Mashinostroenie: Moscow, Russia, 1963. [Google Scholar]
  47. Xu, W.; Wang, Z.; Zhou, Z.; Sun, C.; Zhang, J.; Yan, R.; Chen, X. An advanced pressure pulsation model for external gear pump. Mech. Syst. Signal Process. 2023, 187, 109943. [Google Scholar] [CrossRef]
  48. Cengel, Y.A.; Cimbala, J.M. Fluid Mechanics: Fundamental and Applications; McGraw-Hill: New York, NY, USA, 2013. [Google Scholar]
  49. Ansys Fluent. 12.0 Theory Guide; Ansys Inc.: Canonsburg, PA, USA, 2009. [Google Scholar]
  50. Linsingen, I. Fundamentos de Sistemas Hidráulicos; UFSC Ed.: Florianópolis, Brazil, 2008. [Google Scholar]
  51. VDI 3279:1971-12; Characteristic Quantities of Oil-Hydraulic Devices; Hydraulic Pumps (Including Flight Hydraulics). Verein Deutscher Ingenieure (VDI): Düsseldorf, Germany, 1971.
  52. ISO 4391:1983; Hydraulic Fluid Power—Pumps, Motors and Integral Transmissions—Parameter Definitions and Letter Symbols. International Organization for Standardization: Geneva, Switzerland, 1983.
  53. ISO 4409:2019; Hydraulic Fluid Power—Positive-Displacement Pumps, Motors and Integral Transmissions—Methods of Testing and Presenting Basic Steady State Performance. International Organization for Standardization: Geneva, Switzerland, 2019.
  54. Hydravlika Kazanlak DSO, Kombinat “Hydravlika”. Technical Data Sheet H2-1-01, Machinoexport, Bulgaria, 1985.
  55. Lakshmanan, K.; Tessicini, F.; Gil, A.J.; Auricchio, F. A fault prognosis strategy for an external gear pump using Machine Learning algorithms and synthetic data generation methods. Appl. Math. Model. 2023, 123, 348–372. [Google Scholar] [CrossRef]
Figure 1. Three-dimensional CAD model of the external gear pump: 1—rear cover; 2—screws; 3, 5, 12, 13, and 15—seals; 4—housing; 6 and 11—bearing units; 7 and 10—bearing bushes; 8—driven gear; 9—driving gear with shaft key; 14—front cover; 16—retaining ring.
Applsci 15 00907 g001
Figure 2. 2D geometrical models: (a) classical model. Flow direction, rotation direction, inlet, and outlet pressure ( p i n and p o u t ), and some dimensions (in mm) are shown; (b) advanced model. Relief grooves are shown (in green).
Applsci 15 00907 g002
Figure 3. Finite element initial mesh.
Applsci 15 00907 g003
Figure 4. Performance characteristics of displacement pumps.
Applsci 15 00907 g004
Figure 5. Simulation results: (a) velocity; (b) pressure.
Applsci 15 00907 g005
Figure 6. Simulated flow rate at different rotational frequencies. The gap between the gears and the housing is 0.02 mm for the colored curves and 0.04 mm for the gray curves.
Applsci 15 00907 g006
Figure 7. Simulated flow rate  q i and q at radial gap sizes 0.02 and 0.04 mm: (a) 500 RPM; (b) 2500 RPM.
Applsci 15 00907 g007
Figure 8. Experimental setup—hydraulic circuit diagram and implementation.
Applsci 15 00907 g008
Figure 9. Experimental data from the manufacturer’s technical documentation (Tech Data)—flow rate q T e c h n , volumetric efficiency η v n , power consumption P m n , as well as other performance parameters in table form.
Applsci 15 00907 g009
Figure 10. Effect of increasing the gap from 0.02 mm to 0.04 mm at different rotation frequencies.
Applsci 15 00907 g010
Figure 11. Effect of different radial gap sizes on the flow rate average and current values q and q i .
Applsci 15 00907 g011
Figure 12. Simulated flow rate at different radial gap sizes.
Applsci 15 00907 g012
Figure 13. Efficiency of the studied pump: (a) volumetric; (b) total.
Applsci 15 00907 g013
Table 1. CFD result verification with our own experiment and manufacturer technical data.
CFD Experiment Tech DataCFD/ExpCFD/TechExp/Tech
n Δ p q   n e x p Δ p e x p q e x p   q T e c h P m Δ q e x p Δ q T e c h Δ q E T
RPMMPaL/min min−1MPaL/min L/minkW%%%
50010.59.08 49810.418.94 9.561.881.58%−4.96%−6.44%
75010.513.85 74910.3813.46 14.332.602.88%−3.38%−6.09%
100010.518.63 100210.2018.24 19.003.472.14%−1.96%−4.02%
125010.523.40 125010.4722.89 23.894.332.21%−2.05%−4.17%
145010.527.22 145010.4626.56 27.605.032.48%−1.37%−3.76%
200010.537.71 --36.78 38.226.93-−1.33%−3.76%
250010.547.25 --46.07 47.788.67-−1.11%−3.57%
350010.566.32 --64.65 66.8912.27-−0.86%−3.35%
Table 2. CFD results at gaps of 0.02 mm and 0.04 mm.
Gap0.02 mm 0.04 mm
n q   q 0.04 Δ q 0.04 Δ q 0.04
RPML/min L/minL/min%
5009.08 7.731.3514.89%
75013.85 12.501.359.73%
100018.63 17.311.327.08%
125023.40 22.121.285.46%
145027.22 25.951.274.67%
200037.71 36.511.203.19%
250047.25 46.091.162.46%
350066.32 65.241.081.62%
Table 3. Average flow rate q at different radial gap sizes, in L/min and percentage.
GapqQ
mmL/min%
0.0218.628100.00
0.0318.16297.50
0.0417.30992.92
0.0516.01785.99
Table 4. Efficiency values at different radial gap sizes.
Gap0.02 mm 0.04 mm
RPM q q p , t h η v , C F D η v η v , a d η η h m   q 0.04 η v , C F D η v η
L/minL/min%%%%% L/min%%%
5009.089.5095.6%87.0%91.0%82.7%95.1% 7.7381.4%74.0%70.4%
75013.8514.2597.2%90.0%92.6%89.6%99.5% 12.5087.7%81.2%80.9%
100018.6319.0098.0%92.5%94.3%89.4%96.7% 17.3191.1%86.0%83.1%
125023.4023.7598.5%94.5%95.9%92.2%97.6% 22.1293.1%89.3%87.2%
145027.2227.5598.8%95.6%96.8%92.1%96.3% 25.9594.2%91.1%87.8%
200037.7138.0099.2%97.1%97.8%92.9%95.6% 36.5196.1%94.0%89.9%
250047.2547.5099.5%97.5%98.0%93.0%95.4% 46.0997.0%95.1%90.8%
350066.3266.5099.7%97.9%98.2%92.2%94.2% 65.2498.1%96.3%90.7%
Disclaimer/Publisher’s Note: The statements, opinions and data contained in all publications are solely those of the individual author(s) and contributor(s) and not of MDPI and/or the editor(s). MDPI and/or the editor(s) disclaim responsibility for any injury to people or property resulting from any ideas, methods, instructions or products referred to in the content.

