Featured Application
Velocity-based methods provide more accurate guidance for load prescription than baseline 1RM values during the Smith machine bench press exercise following a 4-week training period.
Abstract
This study aimed to determine whether traditional approaches based on baseline or group-adjusted 1RM values, or velocity-based methods, provide more accurate 1RM estimations after short-term training programs. Thirty resistance-trained men were randomly assigned to either a ballistic training group (bench press [BP] throw at 40% 1RM) or a traditional strength training group (BP at 70–90% 1RM) for 4 weeks (2 sessions/week). The post-intervention BP 1RM was compared to four 1RM estimations: (i) baseline 1RM—the pre-intervention value without modification; (ii) group-adjusted 1RM—the baseline adjusted by the group-level percentage change in 1RM; (iii) load-velocity profile—estimated post-intervention as the load corresponding to a mean velocity of 0.17 m·s−1; and (iv) baseline %1RM–velocity extrapolation—estimated from a single post-intervention velocity applied to the pre-intervention individual %1RM–velocity relationship. Trivial differences (ES < 0.20) were found between actual and estimated 1RM, except for a small underestimation using baseline 1RM in both groups (ballistic: ES = −0.28; traditional: ES = −0.23). Velocity-based methods showed greater accuracy (absolute errors: 2.0–2.1 kg) compared to baseline (5.1 kg) and group-adjusted (4.4 kg) approaches. These results suggest that, after a 4-week training period, velocity-based methods provide more accurate guidance for load prescription than baseline 1RM values.
1. Introduction
The one-repetition maximum (1RM) is widely regarded as the primary reference for individualizing training loads in resistance training (RT) programs across diverse populations and objectives [1,2,3,4,5]. This is supported by several factors, including its direct representation of maximal dynamic strength, high test–retest reliability [6,7], and practical applicability, as it requires no equipment beyond standard training tools. However, like any robust assessment measure, the 1RM is sensitive to several factors, including changes in training status [8,9] and temporary decrements in neuromuscular readiness induced by prior physical exertion [10,11]. This sensitivity is particularly relevant during a training cycle, as accurate prescription of relative loads (%1RM) requires frequent re-assessments to match current strength. Yet repeated maximal 1RM testing may not always be feasible because a full test including warm-up and progressive loading typically requires at least 30–40 min per participant, presents logistical challenges when testing multiple athletes simultaneously, and may interfere with the training process due to its high physical demands. Therefore, in practice, coaches must often balance the need for precision in load prescription with the practical constraints associated with frequent 1RM reassessments.
In the period between two 1RM assessments within a training cycle, coaches following traditional approaches are typically left with two options: to assume that the 1RM has remained unchanged or to estimate an increase based on a fixed expected improvement [12,13]. Both strategies are inherently prone to error—either by overlooking potential adaptations in strength or by applying a generalized correction that may not reflect individual responses. A more contemporary alternative involves estimating 1RM from movement velocity during submaximal lifts, a method that can be implemented frequently with minimal effort and may account for fluctuations in training status and neuromuscular readiness [14,15,16]. However, multiple studies have questioned the validity of this approach, reporting limited accuracy in 1RM estimations derived from velocity-based models [17,18]. It is important to note that both traditional and velocity-based strategies are subject to error, as both maximal strength and movement velocity are inherently variable measures due to the fluctuating nature of human performance. Still, it remains unclear which of these approaches provides the most accurate estimation of 1RM following a very short training period—when coaches may reasonably choose not to perform a new maximal test.
The decision of whether or not to perform a new 1RM test to readjust training loads after several weeks of training may depend on the type of training performed. Traditional strength training programs involving moderate-to-heavy loads (≥70% 1RM) are known to induce more pronounced improvements in maximal strength and may therefore warrant more frequent 1RM reassessments [19]. In contrast, ballistic training programs typically use light loads (≤40% 1RM) and are primarily aimed at enhancing movement velocity at submaximal intensities, with a comparatively lower impact on 1RM values [19]. Regarding velocity-based methods, only ballistic training—and not traditional strength training—has been shown to systematically alter the velocities associated with given %1RM values [20], potentially compromising the accuracy of approaches that rely on pre-established individual %1RM–velocity relationships when applied after ballistic interventions. In this context, it becomes relevant to examine whether the accuracy of different 1RM estimation methods following a short training period is influenced by the specific characteristics of the training performed.
To assist practitioners who may opt to limit frequent 1RM reassessments, this study aimed to determine whether post-intervention 1RM can be more accurately estimated using baseline 1RM values or velocity-based methods following short-term (4-week, 8-session) ballistic and traditional strength training programs. Despite previous studies reporting limited accuracy of velocity-based methods for 1RM estimation [17,18], we hypothesized that these approaches would yield lower estimation errors than traditional methods due to their unique ability to account for individual training adaptations and fluctuations in neuromuscular readiness [14,16].
2. Materials and Methods
2.1. Subjects
Thirty resistance-trained men volunteered to participate in the study. They were randomly allocated to a ballistic training group (BTG; n = 15; age: 22.6 ± 3.4 years; body mass: 80.3 ± 12.6 kg; height: 1.77 ± 0.07 m; bench press 1RM: 85.5 ± 13.0 kg) or a strength training group (STG; n = 15; age: 24.3 ± 3.5 years; body mass: 81.1 ± 14.0 kg; height: 1.76 ± 0.05 m; bench press 1RM: 82.4 ± 20.1 kg) using a computer-generated random sequence, ensuring that the groups were generally homogeneous at baseline. Although a formal a priori power analysis was not conducted, the chosen sample size (n = 30; 15 per group) is aligned with previous publications derived from the same research project [20,21], which have demonstrated adequate power to detect meaningful changes in maximal strength (1RM) and to systematically modify the velocities associated with given %1RM values.
All participants had at least one year of continuous RT experience and reported an average of 2.8 ± 3.1 years of bench press practice, typically performing the exercise at least once per week with moderate-to-heavy loads (≥60% 1RM). None of them had prior experience with ballistic bench press training. None had physical limitations, health issues, or musculoskeletal injuries that could affect performance. All completed the protocol without missing any session and refrained from additional upper-body strength training during the intervention. Subjects were informed of the purpose, procedures, benefits, and risks of the study before providing written informed consent. The protocol adhered to the Declaration of Helsinki and was approved by the Ethics Committee of University of Granada (protocol code: 935/CEIH/2019; date of approval: 15 October 2019).
2.2. Study Design
A longitudinal pre–post design was used to determine whether, after a short-term training period, relative loads (%1RM) are more accurately prescribed using baseline 1RM values or post-training velocity measurements. The protocol included 11 sessions over 6 weeks: two pre-tests (week 1), eight training sessions (weeks 2–5), and one post-test (week 6). Two pre-tests, separated by 48–72 h, were conducted to assess the test–retest reliability of the actual bench press 1RM, with only the second pre-test used for subsequent analyses. After the pre-tests, subjects were randomly allocated to a BTG (bench press throw at 40% 1RM) or a STG (bench press at 70–90% 1RM) for a 4-week intervention (two sessions/week). Post-training, four estimation methods were applied: two traditional approaches (baseline 1RM and group-adjusted 1RM) and two velocity-based approaches (post-intervention load–velocity [L–v] profile and baseline %1RM–velocity extrapolation). The accuracy of each method was evaluated by comparison to the directly measured post-test 1RM. All sessions took place in the same research facility, were separated by ≥48 h, and scheduled at consistent times for each subject (±1 h).
2.3. Testing Procedures
The three testing sessions (two pre-tests and one post-test) followed an identical protocol. Each began with a standardized warm-up comprising 5 min of jogging, dynamic stretching, 10 push-ups, and 10 continuous bench press repetitions performed with progressively increasing effort against 20 kg (unloaded Smith machine barbell). Subjects then rested for 3 min before undertaking a standard incremental loading test. The initial load was set at 20 kg and increased in 10 kg increments until the mean velocity (MV; average velocity from the start of the lifting phase until the bar reached its maximum height) dropped below 0.50 m·s−1. Thereafter, load increments were reduced to 5–1 kg until the 1RM was attained. The exact increment was determined by the examiner’s judgment based on lifting technique and bar velocity, while also considering the participant’s feedback regarding how much additional load he expected to successfully lift. Three repetitions were performed with light loads (MV > 1.00 m·s−1), two with medium loads (0.50 ≤ MV ≤ 1.00 m·s−1), and one with heavy loads (MV < 0.50 m·s−1). Rest periods were 10 s between repetitions with the same load and 5 min between different loads. Subjects received real-time velocity feedback after each repetition and were verbally encouraged to lift at maximal intended velocity throughout the test.
2.4. Training Procedures
All training sessions began with a general warm-up of 5 min of jogging, dynamic stretching, and 10 push-ups, followed by a specific warm-up in the bench press exercise consisting of 10 repetitions at 40% 1RM, 5 repetitions at 60% 1RM, and 2 repetitions at 80% 1RM. Over 4 consecutive weeks, the BTG and STG completed 8 training sessions (twice per week) separated by at least 48 h. The BTG performed the bench press throw (sets × repetitions: 5 × 5, 6 × 5, and 4 × 6 at 40% 1RM in sessions 1–2, 3–5, and 6–8, respectively), whereas the STG performed the conventional bench press (4 × 8 at 70%, 5 × 4 at 85%, and 6 × 2 at 90% 1RM in sessions 1–2, 3–5, and 6–8, respectively). Rest between sets was fixed at 4 min. Subjects were verbally encouraged to perform all repetitions with maximal intent and received real-time velocity feedback after each repetition. The fastest MV from the last warm-up set was used to adjust the training load to the target %1RM considering the individual %1RM–MV relationship from the second pre-test. This adjustment ensured that the relative intensity (%1RM) was maintained across sessions, with loads progressively increasing as bar velocity improved due to training adaptations, thereby allowing a more precise prescription of the intended %1RM.
2.5. Measurement Equipment and Data Analysis
The bench press exercise was performed on a Smith machine (FFITTECH FF683 Straight Line Smith Machine, Porto, Portugal) while maintaining the 5-point body contact position (head, upper back, and glutes in firm contact with the bench, and both feet flat on the floor) and using a self-selected grip width. Subjects employed the touch-and-go technique, beginning with elbows fully extended, lowering the bar until it made light contact with the chest at the lower sternum, and then immediately driving it upward at maximal intended velocity. Bouncing the bar on the chest or lifting the trunk off the bench was not permitted. A validated linear velocity transducer (T-Force System; Ergotech, Murcia, Spain) was attached to the right side of the bar with a Velcro strap to record barbell velocity at a sampling rate of 1000 Hz. The reliability and validity of the T-Force system for measuring MV in the bench press have been documented previously [22]. For analysis, only the repetition with the highest MV for each load was considered.
Four different methods were used to estimate each subject’s post-intervention 1RM, and their accuracy was evaluated by comparing them to the directly measured post-test 1RM.
- -
- Baseline 1RM. The 1RM value obtained prior to the 4-week training intervention was used without any modification, reflecting the scenario in which no change in maximal strength is assumed during the intervention period.
- -
- Group-adjusted 1RM. The pre-test 1RM was adjusted by applying the group-level percentage change observed in 1RM after the training intervention (4.3% for BTG and 5.9% for STG). Although this method assumes a known improvement rate, which is only available retrospectively, it was included to explore the potential accuracy of such an adjustment under ideal conditions.
- -
- Post-intervention L–v profile. A L–v profile was constructed during the post-intervention test using all submaximal loads up to the first load at which MV dropped below 0.45 m·s−1 (≈80%1RM). A linear regression model was applied to these data, and the estimated 1RM was defined as the load corresponding to an MV of 0.17 m·s−1 [15].
- -
- Baseline %1RM–velocity extrapolation. Each subject’s individual %1RM–MV relationship was established from the pre-test data using a linear regression model, including all submaximal loads and the actual 1RM trial. During the post-test, the MV recorded at the first load in which MV dropped below 0.45 m·s−1 (0.37 ± 0.06 m·s−1; 87 ± 3%1RM) was used to infer the corresponding %1RM based on the pre-test individual %1RM–MV relationship. The estimated 1RM was then calculated using the formula: load lifted (kg) × 100/inferred %1RM.
Each of these alternatives presents distinct advantages and limitations compared to directly retesting the 1RM after 4 weeks of training. The baseline 1RM requires no additional effort beyond the pre-test value, making it the least demanding option; however, it does not capture training-induced changes. The group-adjusted 1RM represents an idealized scenario in which the exact mean group-level improvement is assumed; however, this is not feasible in practice and does not reflect individual variability in training responses. The post-intervention L–v profile is less demanding than a complete 1RM test, as it only requires submaximal loads up to ~85% 1RM and can typically be completed in ~15–20 min (vs. ~30–40 min for a full 1RM test). The baseline %1RM–velocity extrapolation is also a low-demand option, since only one post-test load (ideally within the 80–90% 1RM range) is needed to estimate the 1RM. It should be noted, however, that velocity-based approaches require access to a reliable velocity measurement device, which currently is not standard equipment in most training facilities.
2.6. Statistical Analyses
Descriptive statistics are presented as means and standard deviations. Reliability of the actual bench press 1RM was assessed using data from the two pre-test sessions, calculating paired samples t-tests, Cohen’s d effect sizes (ESs), the coefficient of variation (CV), and the intraclass correlation coefficient (ICC, model 3.1) with a custom spreadsheet [23]. To assess the agreement between the directly measured post-intervention 1RM and each of the four estimated 1RM values within each training group, paired-samples t-tests, Cohen’s d ESs, and Bland–Altman plots were used. Additionally, a two-way mixed analysis of variance (ANOVA) was conducted on the absolute differences between the estimated 1RM and the directly measured post-intervention 1RM, with estimation method (baseline 1RM, group-adjusted 1RM, post-intervention L–v profile, and baseline %1RM–velocity extrapolation) as the within-subject factor, and training group (BTG and STG) as the between-subject factor. When significant main effects or interactions were observed, pairwise comparisons were conducted using LSD post hoc corrections. Mauchly’s test of sphericity was used to assess the within-subject factor, and when this assumption was violated (p < 0.05), the Greenhouse–Geisser correction was applied. The magnitude of the ES was interpreted according to the following thresholds: trivial (<0.20), small (0.20–0.59), moderate (0.60–1.19), large (1.20–1.99), and very large (≥2.00) [24]. All statistical analyses were performed using SPSS software (version 25.0; IBM Corp., Armonk, NY, USA). Alpha level was set at 0.05.
3. Results
The actual 1RM did not significantly differ between pre-test sessions (p = 0.082, ES = 0.07) and showed excellent reliability (CV = 3.0%, ICC = 0.98). Trivial differences (ES < 0.20) were observed between the directly measured post-intervention 1RM and all estimated 1RM values, except for a small underestimation by the baseline 1RM in both BTG (ES = –0.28) and STG (ES = –0.23) (Figure 1). Bland–Altman plots revealed that, in the BTG, the random error (i.e., half the width of the limits of agreement) was substantially larger for the traditional methods (baseline 1RM = 6.6 kg; group-adjusted 1RM = 6.7 kg) compared to the velocity-based methods (L–v profile = 1.6 kg; baseline %1RM–velocity extrapolation = 2.0 kg). In contrast, in the STG, the random error was more similar across all estimation methods (range = 3.4 to 4.1 kg).
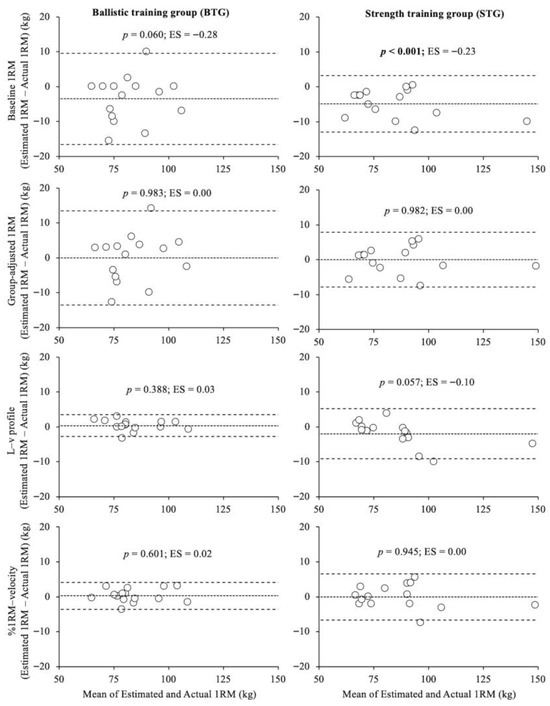
Figure 1.
Agreement between the directly measured post-intervention 1RM and each of the four estimated 1RM values in the ballistic (left column) and strength (right column) training groups. Each panel shows a Bland–Altman plot with the mean bias (short dashed line) and limits of agreement (±1.96 SD, long dashed lines). Paired samples t-test results and Cohen’s d effect size (ES) are also reported. Bolded statistics indicate significant differences between the estimated and actual post-session 1RM (p < 0.05).
The ANOVA on absolute errors showed a significant main effect of estimation method (F = 10.0, p < 0.001), with both the post-test L–v profile (2.0 ± 2.4 kg) and baseline %1RM–velocity extrapolation (2.1 ± 1.7 kg) producing significantly lower errors than the baseline 1RM (5.1 ± 4.7 kg) and group-adjusted 1RM (4.4 ± 3.3 kg). The main effect of training group was not significant (F < 0.1, p = 0.913). However, the interaction estimation method × training group reached significance (F = 3.0, p = 0.035), indicating that the two velocity-based methods were more accurate than the group-adjusted 1RM in the BTG, whereas in the STG their accuracy was comparable (Figure 2).
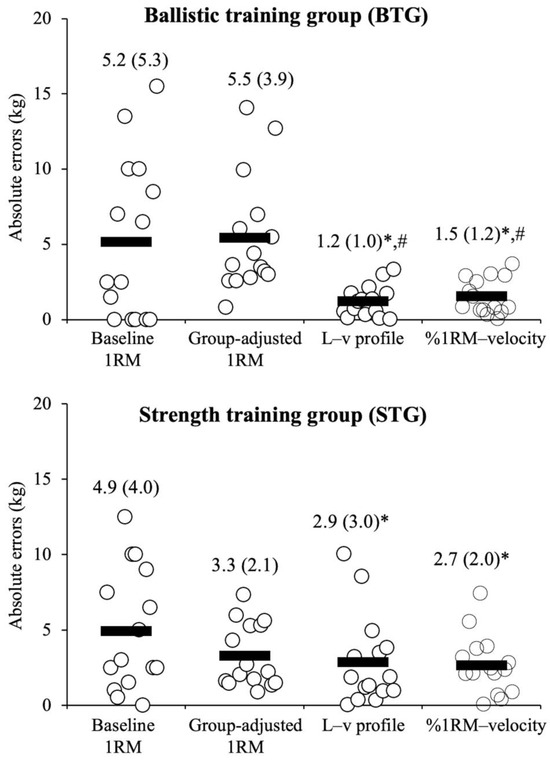
Figure 2.
Absolute errors between the estimated and measured post-intervention 1RM for each estimation method in the ballistic (upper panel) and strength (lower panel) training groups. Data are presented as mean (standard deviation) with individual data points overlaid. The black rectangles represent the average value. * and # represent significant differences compared to the baseline and group-adjusted 1RM, respectively.
4. Discussion
This study was designed to identify the most accurate method for estimating 1RM following a short-term (4-week, 8-session) RT program. This information is particularly valuable for practitioners who are reluctant to perform frequent direct 1RM re-assessments throughout the training process. The main findings revealed that relying on the baseline 1RM for load prescription leads to an underestimation of actual strength levels, potentially resulting in the systematic prescription of lower %1RM values than intended. Notably, even in the hypothetical scenario in which the coach perfectly guesses the group-level percentage change in 1RM after training, this method is, at best, equally accurate to the two velocity-based methods applied in the present study. The limitation of the group-adjusted 1RM method likely stems from the fact that 1RM adaptations are highly individual, which may explain why velocity-based methods outperformed the group-adjusted 1RM in the BTG (SD of 1RM changes = 6.6 kg) more than in the STG (SD of 1RM changes = 4.1 kg). Taken together, these results suggest that load prescription after a 4-week training period should be based on velocity-based approaches rather than on baseline 1RM values.
To establish a clear dose–response relationship in RT, it is essential to precisely characterize the training stimulus applied [25,26,27,28,29,30,31,32,33]. Among the key components of this stimulus, load intensity plays a critical role in determining the nature and magnitude of neuromuscular adaptations [34]. In both research and applied settings, the most common approach is to prescribe intensity based on the pre-intervention 1RM. However, in practice—and in many highly influential published studies—loads are often prescribed based on a 1RM value measured more than four weeks earlier [19,35,36]. This is problematic because maximal strength can fluctuate substantially over relatively short periods due to neuromuscular adaptations, fatigue, detraining, or other individual factors [8,9,10,11]. Consequently, the actual relative load (%1RM) experienced by the athlete may differ considerably from the intended prescription, hindering the ability to establish a clear dose–response relationship and compromising the validity of research findings, as individuals nominally assigned to the same relative load may, in reality, be training at markedly different intensities. These inherent limitations of traditional 1RM-based prescriptions highlight the need for more adaptive and individualized approaches.
The emergence of new technologies, particularly devices capable of accurately measuring barbell velocity in real time, has enabled the widespread application of velocity-based training (VBT), providing practical means to enhance the precision of load prescription in RT [14,16,25]. By quantifying movement velocity during exercise, VBT allows practitioners to estimate current strength levels without the need for frequent maximal testing, thereby reducing the mismatch between intended and actual relative loads [16]. While VBT cannot completely eliminate prescription errors—given the inherent variability of human performance—it represents a meaningful improvement over traditional methods that rely solely on outdated 1RM values or assumptions about potential strength changes. Our results extend this theoretical advantage by showing, for the first time, direct empirical evidence that VBT-based approaches outperform traditional prescriptions even after a relatively short training period, reinforcing their applicability in both research and practice. However, it should be acknowledged that linear position transducers are still not standard equipment in most training facilities and can be relatively expensive, often costing several hundred to over a thousand US dollars. Recent attempts to improve accessibility include smartphone-based applications that estimate barbell velocity from video recordings [37] and new low-cost linear transducers that have shown valid and reliable measurements in RT contexts [38], which may facilitate a broader adoption of VBT in the near future.
The superiority of velocity-based methods over traditional 1RM-based prescriptions was more pronounced in the BTG than in the STG. Interestingly, this was not the expected outcome, as the STG experienced greater systematic increases in 1RM (4.9 kg vs. 3.5 kg), which could have been expected to yield larger errors when relying on baseline 1RM values. However, the greater benefit of velocity-based methods in the BTG appears to be driven by its substantially higher inter-individual variability in strength gains (SD = 6.6 kg) compared to the STG (SD = 4.1 kg). In such contexts, group-average adjustments become less accurate, particularly when based on a multiplicative correction (pre-test 1RM × 1.043 in the BTG), which amplified random error by scaling corrections to baseline strength. This explains why the group-adjusted 1RM yielded a higher absolute error (5.5 kg) than simply using the baseline 1RM (5.2 kg) in the BTG. Conceptually, an additive correction (baseline 1RM + mean change in kg) would have removed the mean bias without scaling by baseline strength, but it would still fail to capture individual responses. These findings reinforce one of the main advantages of velocity-based methods—their ability to account for individual changes in strength—suggesting that their superiority for load prescription is not only expected when there are substantial systematic changes in 1RM but also when the variability of individual responses makes future strength levels harder to predict. This is particularly important, as individual variability in 1RM adaptations to RT appears greater than that observed for other outcomes, such as muscle hypertrophy and isokinetic strength [39].
This study presents several limitations that should be considered when interpreting the findings. First, the sample consisted exclusively of young, resistance-trained men with recreational sport participation, which limits extrapolation to women, untrained individuals, older adults, or elite athletes. While greater RT experience might stabilize actual 1RM values, the associated technical proficiency could also enhance the accuracy of velocity-based estimations. Future studies should examine populations with both lower and higher variability in strength adaptations to assess whether the present trends hold. Second, only the bench press performed in a Smith machine was evaluated. This exercise has the strongest evidence supporting the precision of velocity measures for estimating 1RM [15], which may not translate to free-weight movements or lower-body exercises where technical demands and bar-path variability are greater [17,18,40,41]. Third, the intervention lasted only 4 weeks; shorter timeframes should be explored to identify the minimal interval after which velocity-based methods begin to surpass traditional 1RM-based prescriptions in accuracy. Addressing these limitations will be essential to determine the generalizability of our findings and to refine load prescription strategies across diverse populations, exercises, and training contexts. Finally, the group-adjusted 1RM approach was included to model an idealized scenario where the exact group-level strength change is known, providing a benchmark against which VBT performance could be compared. However, such information is unattainable in practical settings, so its applicability in real-world coaching contexts is limited.
5. Conclusions
Direct 1RM testing remains the gold standard for prescribing relative loads (%1RM) in RT. However, this value can change noticeably within just a few weeks, with some athletes experiencing decreases, others maintaining, and others increasing their maximal strength to varying degrees. Testing the 1RM as frequently as in the present study would require dedicating roughly 1 out of every 9 sessions to assessment, which may be neither logistically feasible nor optimal for achieving the desired training outcomes. In such cases, velocity-based methods provide a practical and accurate alternative. Our findings show that, after four weeks without re-testing, velocity-based approaches reduced load prescription errors by about half compared to relying solely on baseline 1RM values—even under the idealized scenario in which a coach could perfectly estimate the group-level percentage change in 1RM. These results support integrating velocity monitoring into regular training sessions to fine-tune loads when recent direct 1RM measures are unavailable, thereby enhancing %1RM prescription accuracy while minimizing training disruption.
Funding
This research received no external funding.
Institutional Review Board Statement
The study was conducted in accordance with the Declaration of Helsinki and approved by the Ethics Committee of University OF Granada (protocol code: 935/CEIH/2019; date of approval: 15 October 2019).
Informed Consent Statement
Informed consent was obtained from all subjects involved in the study.
Data Availability Statement
The original data presented in the study are openly available in Open Science Framework at https://osf.io/ub3cp/?view_only=9f1e91d7e42143569a42a75eaab510ab accessed on 9 October 2025.
Acknowledgments
The authors thank all subjects who selflessly gave their maximal effort to participate in this study.
Conflicts of Interest
The authors declare no conflicts of interest.
Abbreviations
The following abbreviations are used in this manuscript:
| 1RM | One-repetition maximum |
| ANOVA | Analysis of variance |
| BP | Bench press |
| BTG | Ballistic training group |
| CV | Coefficient of variation |
| ES | Effect size |
| ICC | Intraclass correlation coefficient |
| L–v | Load–velocity |
| MV | Mean velocity |
| RT | Resistance training |
| SD | Standard deviation |
| STG | Strength training group |
| VBT | Velocity-based training |
References
- Ratamess, N.A.; Alvar, B.A.; Evetoch, T.K.; Housch, T.J.; Kibler, W.B.; Kraemer, W.J.; Triplett, N.T. American College of Sports Medicine Position Stand. Progression Models in Resistance Training for Healthy Adults. Med. Sci. Sports Exerc. 2009, 41, 687–708. [Google Scholar] [CrossRef]
- Suchomel, T.J.; Nimphius, S.; Bellon, C.R.; Hornsby, W.G.; Stone, M.H. Training for Muscular Strength: Methods for Monitoring and Adjusting Training Intensity. Sports Med. 2021, 51, 2051–2066. [Google Scholar] [CrossRef]
- Thompson, S.W.; Rogerson, D.; Ruddock, A.; Barnes, A. The Effectiveness of Two Methods of Prescribing Load on Maximal Strength Development: A Systematic Review. Sports Med. 2020, 50, 919–938. [Google Scholar] [CrossRef]
- Steele, J.; Malleron, T.; Har-Nir, I.; Androulakis-Korakakis, P.; Wolf, M.; Fisher, J.P.; Halperin, I. Are Trainees Lifting Heavy Enough? Self-Selected Loads in Resistance Exercise: A Scoping Review and Exploratory Meta-Analysis. Sports Med. 2022, 52, 2909–2923. [Google Scholar] [CrossRef]
- Reynolds, J.M.; Gordon, T.J.; Robergs, R.A. Prediction of One Repetition Maximum Strength from Multiple Repetition Maximum Testing and Anthropometry. J. Strength Cond. Res. 2006, 20, 584–592. [Google Scholar] [CrossRef]
- Grgic, J.; Lazinica, B.; Schoenfeld, B.J.; Pedisic, Z. Test–Retest Reliability of the One-Repetition Maximum (1RM) Strength Assessment: A Systematic Review. Sports Med. Open 2020, 6, 31. [Google Scholar] [CrossRef]
- Pereira, M.; Gomes, P. Muscular Strength and Endurance Tests: Reliability and Prediction of One Repetition Maximum—Review and New Evidences. Revista Brasileira de Medicina do Esporte 2003, 9, 336–346. [Google Scholar]
- Frost, D.M.; Bronson, S.; Cronin, J.B.; Newton, R.U. Changes in Maximal Strength, Velocity, and Power after 8 Weeks of Training with Pneumatic or Free Weight Resistance. J. Strength Cond. Res. 2016, 30, 934–944. [Google Scholar] [CrossRef]
- Tokmakidis, S.P.; Kalapotharakos, V.I.; Smilios, I.; Parlavantzas, A. Effects of Detraining on Muscle Strength and Mass after High or Moderate Intensity of Resistance Training in Older Adults. Clin. Physiol. Funct. Imaging 2009, 29, 316–319. [Google Scholar] [CrossRef] [PubMed]
- Şentürk, D.; Akyildiz, Z.; Janicijevic, D.; García-Ramos, A. Sensitivity of the Load-Velocity Relationship Variables to Discriminate the Level of Fatigue Induced by Multiple Sets of the Hexagonal Barbell Deadlift Exercise. J. Strength Cond. Res. 2025, 39, 407–413. [Google Scholar] [CrossRef] [PubMed]
- Häkkinen, K.; Pakarinen, A. Acute Hormonal Responses to Two Different Fatiguing Heavy-Resistance Protocols in Male Athletes. J. Appl. Physiol. 1993, 74, 882–887. [Google Scholar] [CrossRef]
- Helms, E.R.; Byrnes, R.K.; Cooke, D.M.; Haischer, M.H.; Carzoli, J.P.; Johnson, T.K.; Cross, M.R.; Cronin, J.B.; Storey, A.G.; Zourdos, M.C. RPE vs. Percentage 1RM Loading in Periodized Programs Matched for Sets and Repetitions. Front. Physiol. 2018, 9, 247. [Google Scholar] [CrossRef]
- Fleck, S.J.; Kraemer, W.J. Designing Resistance Training Programs; Human Kinetics; Bloomsbury Academic: London, UK, 2014; ISBN 0736081704. [Google Scholar]
- Weakley, J.; Mann, B.; Banyard, H.; McLaren, S.; Scott, T.; Garcia-Ramos, A. Velocity-Based Training: From Theory to Application. Strength Cond. J. 2021, 43, 31–49. [Google Scholar] [CrossRef]
- Garcia-Ramos, A. Resistance Training Intensity Prescription Methods Based on Lifting Velocity Monitoring. Int. J. Sports Med. 2024, 45, 257–266. [Google Scholar] [CrossRef]
- García-Ramos, A. Velocity-Based Training. Prescribing and Assessing the Effects of Resistance Training; Routledge: Abingdon, UK, 2025; ISBN 9780367756901. [Google Scholar]
- LeMense, A.T.; Malone, G.T.; Kinderman, M.A.; Fedewa, M.V.; Winchester, L.J. Validity of Using the Load-Velocity Relationship to Estimate 1 Repetition Maximum in the Back Squat Exercise: A Systematic Review and Meta-Analysis. J. Strength Cond. Res. 2024, 38, 612–619. [Google Scholar] [CrossRef] [PubMed]
- Greig, L.; Aspe, R.R.; Hall, A.; Comfort, P.; Cooper, K.; Swinton, P.A. The Predictive Validity of Individualised Load-Velocity Relationships for Predicting 1RM: A Systematic Review and Individual Participant Data Meta-Analysis. Sports Med. 2023, 53, 1693–1708. [Google Scholar] [CrossRef]
- Cormie, P.; McGuigan, M.R.; Newton, R.U. Adaptations in Athletic Performance after Ballistic Power versus Strength Training. Med. Sci. Sports Exerc. 2010, 42, 1582–1598. [Google Scholar] [CrossRef] [PubMed]
- Pérez-Castilla, A.; García-Ramos, A. Changes in the Load-Velocity Profile Following Power and Strength-Oriented Resistance-Training Programs. Int. J. Sports Physiol. Perform. 2020, 15, 1460–1466. [Google Scholar] [CrossRef] [PubMed]
- Cuevas-Aburto, J.; Janicijevic, D.; Pérez-Castilla, A.; Chirosa-Ríos, L.J.; García-Ramos, A. Changes in Bench Press Performance and Throwing Velocity after Strength-Oriented and Ballistic Resistance Training Programs. J. Sports Med. Phys. Fitness 2020, 60, 1423–1430. [Google Scholar] [CrossRef]
- Martínez-Cava, A.; Hernández-Belmonte, A.; Courel-Ibáñez, J.; Morán-Navarro, R.; González-Badillo, J.J.; Pallarés, J.G. Reliability of Technologies to Measure the Barbell Velocity: Implications for Monitoring Resistance Training. PLoS ONE 2020, 15, e0232465. [Google Scholar] [CrossRef]
- Hopkins, W. Spreadsheets for Analysis of Validity and Reliability. 2015. Available online: https://sportsci.org/2015/ValidRely.htm (accessed on 17 May 2025).
- Hopkins, W.G.; Marshall, S.W.; Batterham, A.M.; Hanin, J. Progressive Statistics for Studies in Sports Medicine and Exercise Science. Med. Sci. Sports Exerc. 2009, 41, 3–13. [Google Scholar] [CrossRef]
- González-Badillo, J.J.; Sánchez-Medina, L.; Ribas-Serna, J.; Rodríguez-Rosell, D. Toward a New Paradigm in Resistance Training by Means of Velocity Monitoring: A Critical and Challenging Narrative. Sports Med. Open 2022, 8, 118. [Google Scholar] [CrossRef]
- Schoenfeld, B.; Ogborn, D.; Krieger, J. Dose-Response Relationship between Weekly Resistance Training Volume and Increases in Muscle Mass: A Systematic Review and Meta-Analysis. J. Sports Sci. 2017, 35, 1073–1082. [Google Scholar] [CrossRef]
- Borde, R.; Hortobágyi, T.; Granacher, U. Dose-Response Relationships of Resistance Training in Healthy Old Adults: A Systematic Review and Meta-Analysis. Sports Med. 2015, 45, 1693–1720. [Google Scholar] [CrossRef]
- Schoenfeld, B.J.; Ogborn, D.; Krieger, J.W. The Dose-Response Relationship between Resistance Training Volume and Muscle Hypertrophy: Are There Really Still Any Doubts? J. Sports Sci. 2017, 35, 1985–1987. [Google Scholar] [CrossRef] [PubMed]
- Lesinski, M.; Prieske, O.; Granacher, U. Effects and Dose-Response Relationships of Resistance Training on Physical Performance in Youth Athletes: A Systematic Review and Meta-Analysis. Br. J. Sports Med. 2016, 50, 781–795. [Google Scholar] [CrossRef] [PubMed]
- Ramirez-Campillo, R.; Díaz, D.; Martínez, C.; Valdés-Badilla, P.; Delgado-Floody, P.; Méndez-Rebolledo, G.; Cañas-Jamet, R.; Cristi-Montero, C.; García-Hermoso, A.; Celis-Morales, C.; et al. Effects of Different Doses of High-Speed Resistance Training on Physical Performance and Quality of Life in Older Women: A Randomized Controlled Trial. Clin. Interv. Aging 2016, 11, 1797–1804. [Google Scholar] [CrossRef]
- Chang, Y.K.; Etnier, J.L. Exploring the Dose-Response Relationship between Resistance Exercise Intensity and Cognitive Function. J. Sport Exerc. Psychol. 2009, 31, 640–656. [Google Scholar] [CrossRef]
- Rhea, M.R.; Alvar, B.A.; Burkett, L.N.; Ball, S.D. A Meta-Analysis to Determine the Dose Response for Strength Development. Med. Sci. Sports Exerc. 2003, 35, 456–464. [Google Scholar] [CrossRef] [PubMed]
- Peterson, M.D.; Rhea, M.R.; Alvar, B.A. Applications of the Dose-Response for Muscular Strength Development: A Review of Meta-Analytic Efficacy and Reliability for Designing Training Prescription. J. Strength Cond. Res. 2005, 19, 950–958. [Google Scholar] [CrossRef]
- Lacio, M.; Vieira, J.G.; Trybulski, R.; Campos, Y.; Santana, D.; Filho, J.E.; Novaes, J.; Vianna, J.; Wilk, M. Effects of Resistance Training Performed with Different Loads in Untrained and Trained Male Adult Individuals on Maximal Strength and Muscle Hypertrophy: A Systematic Review. Int. J. Environ. Res. Public Health 2021, 18, 11237. [Google Scholar] [CrossRef]
- Marshall, P.W.M.; McEwen, M.; Robbins, D.W. Strength and Neuromuscular Adaptation Following One, Four, and Eight Sets of High Intensity Resistance Exercise in Trained Males. Eur. J. Appl. Physiol. 2011, 111, 3007–3016. [Google Scholar] [CrossRef]
- Jiménez-Reyes, P.; Castaño-Zambudio, A.; Cuadrado-Peñafiel, V.; González-Hernández, J.M.; Capelo-Ramírez, F.; Martínez-Aranda, L.M.; González-Badillo, J.J. Differences between Adjusted vs. Non-Adjusted Loads in Velocity-Based Training: Consequences for Strength Training Control and Programming. PeerJ 2021, 9, e10942. [Google Scholar] [CrossRef] [PubMed]
- Renner, A.; Mitter, B.; Baca, A. Concurrent Validity of Novel Smartphone-Based Apps Monitoring Barbell Velocity in Powerlifting Exercises. PLoS ONE 2024, 19, e0313919. [Google Scholar] [CrossRef] [PubMed]
- Lopez-Torres, O.; Fernandez-Elias, V.E.; Li, J.; Gomez-Ruano, M.A.; Guadalupe-Grau, A. Validity and Reliability of a New Low-Cost Linear Position Transducer to Measure Mean Propulsive Velocity: The ADR Device. Proc. Inst. Mech. Eng. Part P: J. Sports Eng. Technol. 2022, 239, 126–134. [Google Scholar] [CrossRef]
- Dankel, S.J.; Bell, Z.W.; Spitz, R.W.; Wong, V.; Viana, R.B.; Chatakondi, R.N.; Buckner, S.L.; Jessee, M.B.; Mattocks, K.T.; Mouser, J.G.; et al. Assessing Differential Responders and Mean Changes in Muscle Size, Strength, and the Crossover Effect to 2 Distinct Resistance Training Protocols. Appl. Physiol. Nutr. Metab. 2020, 45, 463–470. [Google Scholar] [CrossRef]
- Macarilla, C.T.; Sautter, N.M.; Robinson, Z.P.; Juber, M.C.; Hickmott, L.M.; Cerminaro, R.M.; Benitez, B.; Carzoli, J.P.; Bazyler, C.D.; Zoeller, R.F.; et al. Accuracy of Predicting One-Repetition Maximum from Submaximal Velocity in The Barbell Back Squat and Bench Press. J. Hum. Kinet. 2022, 82, 201–212. [Google Scholar] [CrossRef]
- LeSuer, D.A.; McCormick, J.H.; Mayhew, J.L.; Wasserstein, R.L.; Arnold, M.D. The Accuracy of Prediction Equations for Estimating 1-RM Performance in the Bench Press, Squat, and Deadlift. J. Strength Cond. Res. 1997, 11, 211–213. [Google Scholar] [CrossRef]


Disclaimer/Publisher’s Note: The statements, opinions and data contained in all publications are solely those of the individual author(s) and contributor(s) and not of MDPI and/or the editor(s). MDPI and/or the editor(s) disclaim responsibility for any injury to people or property resulting from any ideas, methods, instructions or products referred to in the content. |
© 2025 by the author. Licensee MDPI, Basel, Switzerland. This article is an open access article distributed under the terms and conditions of the Creative Commons Attribution (CC BY) license (https://creativecommons.org/licenses/by/4.0/).