

Effects of Varying Caffeine Dosages and Consumption Timings on Cerebral Vascular and Cognitive Functions: A Diagnostic Ultrasound Study
 , ,
, ,  and
and
Abstract
1. Introduction
2. Materials and Methods
2.1. Participants
2.2. Experimental Protocols and Data Acquisition
2.3. Statistical Analysis
3. Results
4. Discussion
5. Conclusions
Author Contributions
Funding
Institutional Review Board Statement
Informed Consent Statement
Data Availability Statement
Conflicts of Interest
References
- Nieber, K. The impact of coffee on health. Planta Med. 2017, 83, 1256–1263. [Google Scholar] [CrossRef] [PubMed]
- Barone, J.J.; Roberts, H.R. Caffeine consumption. Food Chem. Toxicol. 1996, 34, 119–129. [Google Scholar] [CrossRef] [PubMed]
- Kang, Y.-J. Effects of caffeine on nerve conduction velocity. J. Converg. Inf. Technol. 2020, 10, 195–199. [Google Scholar] [CrossRef]
- Quadra, G.R.; Brovini, E.M.; Dos Santos, J.A.; Paranaíba, J.R. Caffeine consumption over time. In Handbook of Substance Misuse and Addictions; Patel, V.B., Preedy, V.R., Eds.; Springer International Publishing: Cham, Switzerland, 2022; pp. 1535–1552. ISBN 978-3-030-92391-4. [Google Scholar]
- Mitchell, D.C.; Knight, C.A.; Hockenberry, J.; Teplansky, R.; Hartman, T.J. Beverage caffeine intakes in the U.S. Food Chem. Toxicol. 2014, 63, 136–142. [Google Scholar] [CrossRef]
- EFSA Panel on Dietetic Products, Nutrition and Allergies. Scientific Opinion on the safety of caffeine. EFS2 2015, 13, 4102. [Google Scholar] [CrossRef]
- Lee, J.-S.; Park, H.-S.; Han, S.; Tana, G.; Chang, M.-J. Study on relationship between caffeine intake level and metabolic syndrome and related diseases in Korean adults: 2013~2016 Korea National Health and Nutrition Examination Survey. J. Nutr. Health 2019, 52, 227. [Google Scholar] [CrossRef]
- Reddy, V.S.; Shiva, S.; Manikantan, S.; Ramakrishna, S. Pharmacology of caffeine and its effects on the human body. Eur. J. Med. Chem. Rep. 2024, 10, 100138. [Google Scholar] [CrossRef]
- Layland, J.; Carrick, D.; Lee, M.; Oldroyd, K.; Berry, C. Adenosine: Physiology, pharmacology, and clinical applications. JACC Cardiovasc. Intv. 2014, 7, 581–591. [Google Scholar] [CrossRef]
- McLellan, T.M.; Caldwell, J.A.; Lieberman, H.R. A review of caffeine’s effects on cognitive, physical and occupational performance. Neurosci. Biobehav. Rev. 2016, 71, 294–312. [Google Scholar] [CrossRef]
- Davis, J.M.; Zhao, Z.; Stock, H.S.; Mehl, K.A.; Buggy, J.; Hand, G.A. Central nervous system effects of caffeine and adenosine on fatigue. Am. J. Physiol. Regul. Integr. Comp. Physiol. 2003, 284, R399–R404. [Google Scholar] [CrossRef]
- Cappelletti, S.; Piacentino, D.; Sani, G.; Aromatario, M. Caffeine: Cognitive and physical performance enhancer or psychoactive drug? Curr. Neuropharmacol. 2015, 13, 71–88. [Google Scholar] [CrossRef] [PubMed]
- Echeverri, D.; Montes, F.R.; Cabrera, M.; Galán, A.; Prieto, A. Caffeine’s vascular mechanisms of action. Int. J. Vasc. Med. 2010, 2010, 834060. [Google Scholar] [CrossRef] [PubMed]
- Zulli, A.; Smith, R.M.; Kubatka, P.; Novak, J.; Uehara, Y.; Loftus, H.; Qaradakhi, T.; Pohanka, M.; Kobyliak, N.; Zagatina, A.; et al. Caffeine and cardiovascular diseases: Critical review of current research. Eur. J. Nutr. 2016, 55, 1331–1343. [Google Scholar] [CrossRef] [PubMed]
- Tavares, C.; Sakata, R.K. Caffeine in the treatment of pain. Rev. Bras. Anestesiol. 2012, 62, 387–401. [Google Scholar] [CrossRef] [PubMed]
- Turnbull, D.; Rodricks, J.V.; Mariano, G.F.; Chowdhury, F. Caffeine and cardiovascular health. Regul. Toxicol. Pharmacol. 2017, 89, 165–185. [Google Scholar] [CrossRef]
- Reich, N.; Mannino, M.; Kotler, S. Using caffeine as a chemical means to induce flow states. Neurosci. Biobehav. Rev. 2024, 159, 105577. [Google Scholar] [CrossRef]
- Da Silva, L.A.; Pereira, R.A.; Túrmina, J.A.; Kerppers, I.I.; Osiecki, R.; Altimari, L.R.; Malfatti, C.R.M. Sulfonylurea induction of caffeine-enhanced insulin secretion and reduction of glycemic levels in diabetic rats. Pharm. Biol. 2014, 52, 956–960. [Google Scholar] [CrossRef]
- Bakker, R.; Steegers, E.A.P.; Obradov, A.; Raat, H.; Hofman, A.; Jaddoe, V.W.V. Maternal caffeine intake from coffee and tea, fetal growth, and the risks of adverse birth outcomes: The generation R Study. Am. J. Clin. Nutr. 2010, 91, 1691–1698. [Google Scholar] [CrossRef]
- Ruxton, C.H.S. The impact of caffeine on mood, cognitive function, performance and hydration: A review of benefits and risks. Nutr. Bull. 2008, 33, 15–25. [Google Scholar] [CrossRef]
- Nehlig, A. Effects of coffee on the gastro-intestinal tract: A narrative review and literature update. Nutrients 2022, 14, 399. [Google Scholar] [CrossRef]
- Delleli, S.; Ouergui, I.; Messaoudi, H.; Trabelsi, K.; Ammar, A.; Glenn, J.M.; Chtourou, H. Acute effects of caffeine supplementation on physical performance, physiological responses, perceived exertion, and technical-tactical skills in combat sports: A systematic review and meta-analysis. Nutrients 2022, 14, 2996. [Google Scholar] [CrossRef] [PubMed]
- Chang, Y.-E.; Chung, H.-K. Survey of caffeine intake from children’s favorite foods. Korean J. Nutr. 2010, 43, 475. [Google Scholar] [CrossRef]
- Kim, N.; Shin, W.; Kim, Y. Study on relevance of high-caffeine drink intake frequency to mental health of adolescents. Korean J. Food Culture 2017, 32, 66–74. [Google Scholar] [CrossRef]
- Qian, J.; Chen, Q.; Ward, S.M.; Duan, E.; Zhang, Y. Impacts of caffeine during pregnancy. Trends Endocrinol. Metab. 2020, 31, 218–227. [Google Scholar] [CrossRef]
- Geiger Brown, J.; Wieroney, M.; Blair, L.; Zhu, S.; Warren, J.; Scharf, S.M.; Hinds, P.S. Measuring subjective sleepiness at work in hospital nurses: Validation of a modified delivery format of the Karolinska sleepiness scale. Sleep Breath. 2014, 18, 731–739. [Google Scholar] [CrossRef]
- Kaida, K.; Takahashi, M.; Åkerstedt, T.; Nakata, A.; Otsuka, Y.; Haratani, T.; Fukasawa, K. Validation of the Karolinska sleepiness scale against performance and EEG variables. Clin. Neurophysiol. 2006, 117, 1574–1581. [Google Scholar] [CrossRef]
- Seo, B.N.; Kim, I. Differences of stress, sleep quality and metabolic syndrome by prolonged fatigue in early adulthood. Korean J. Adult Nurs. 2019, 31, 202. [Google Scholar] [CrossRef]
- Alsabri, S.G.; Mari, W.O.; Younes, S.; Elsadawi, M.A.; Oroszi, T.L. Kinetic and dynamic description of caffeine. J. Caffeine Adenosine Res. 2018, 8, 3–9. [Google Scholar] [CrossRef]
- Mort, J.R.; Kruse, H.R. Timing of blood pressure measurement related to caffeine consumption. Ann. Pharmacother. 2008, 42, 105–110. [Google Scholar] [CrossRef]
- Sato, K.; Sanders, K.M.; Gerthoffer, W.T.; Publicover, N.G. Sources of calcium utilized in cholinergic responses in canine colonic smooth muscle. Am. J. Physiol. 1994, 267, C1666–C1673. [Google Scholar] [CrossRef]
- Mahmud, A.; Feely, J. Acute effect of caffeine on arterial stiffness and aortic pressure waveform. Hypertension 2001, 38, 227–231. [Google Scholar] [CrossRef] [PubMed]
- Echeverri, D.; Pizano, A.; Montes, F.R.; Forcada, P. Acute effect of coffee consumption on arterial stiffness, evaluated using an oscillometric method. Artery Res. 2017, 17, 16. [Google Scholar] [CrossRef]
- Dix, L.M.L.; van Bel, F.; Baerts, W.; Lemmers, P.M.A. Effects of caffeine on the preterm brain: An observational study. Early Hum. Dev. 2018, 120, 17–20. [Google Scholar] [CrossRef] [PubMed]
- Ozkan, B.; Yüksel, N.; Anik, Y.; Altintas, O.; Demirci, A.; Cağlar, Y. The effect of caffeine on retrobulbar hemodynamics. Curr. Eye Res. 2008, 33, 804–809. [Google Scholar] [CrossRef] [PubMed]
- McClaran, S.R.; Wetter, T.J. Low doses of caffeine reduce heart rate during submaximal cycle ergometry. J. Int. Soc. Sports Nutr. 2007, 4, 11. [Google Scholar] [CrossRef]
- Sullivan, J.J.; Knowlton, R.G.; Brown, D.D. Caffeine affects heart rate and blood pressure response to prolonged walking. J. Cardiopulm. Rehabil. 1992, 12, 418–422. [Google Scholar] [CrossRef]
- Mosqueda-Garcia, R.; Tseng, C.J.; Biaggioni, I.; Robertson, R.M.; Robertson, D. Effects of caffeine on baroreflex activity in humans. Clin. Pharmacol. Ther. 1990, 48, 568–574. [Google Scholar] [CrossRef]
- Ruíz-Moreno, C.; Lara, B.; Brito De Souza, D.; Gutiérrez-Hellín, J.; Romero-Moraleda, B.; Cuéllar-Rayo, Á.; Del Coso, J. Acute caffeine intake increases muscle oxygen saturation during a maximal incremental exercise test. Br. J. Clin. Pharmacol. 2020, 86, 861–867. [Google Scholar] [CrossRef]
- Gonzaga, L.A.; VanderLei, L.C.M.; Gomes, R.L.; Valenti, V.E. Caffeine affects autonomic control of heart rate and blood pressure recovery after aerobic exercise in young adults: A crossover study. Sci. Rep. 2017, 7, 14091. [Google Scholar] [CrossRef]
- Menon, V. 20 years of the default mode network: A review and synthesis. Neuron 2023, 111, 2469–2487. [Google Scholar] [CrossRef]
- Luo, W.; Liu, B.; Tang, Y.; Huang, J.W.; Wu, J. Rest Promotes Learning: From the Perspective of Brain’s Default Mode Network Perspective. Behav. Sci. 2024, 14, 349. [Google Scholar] [CrossRef] [PubMed]
- Cheng, X.; Yuan, Y.; Wang, Y.; Wang, R. Neural antagonistic mechanism between default-mode and task-positive networks. Neurocomputing 2020, 417, 74–85. [Google Scholar] [CrossRef]
- Devaney, K.J.; Levin, E.J.; Tripathi, V.; Higgins, J.P.; Lazar, S.W.; Somers, D.C. Attention and default mode network assessments of meditation experience during active cognition and rest. Brain Sci. 2021, 11, 566. [Google Scholar] [CrossRef] [PubMed]
- Bonnelle, V.; Leech, R.; Kinnunen, K.M.; Ham, T.E.; Beckmann, C.F.; De Boissezon, X.; Greenwood, R.J.; Sharp, D.J. Default mode network connectivity predicts sustained attention deficits after traumatic brain injury. J. Neurosci. 2011, 31, 13442–13451. [Google Scholar] [CrossRef]
- Koshino, H.; Minamoto, T.; Yaoi, K.; Osaka, M.; Osaka, N. Coactivation of the default mode network Regions and Working Memory Network regions during task preparation. Sci. Rep. 2014, 4, 5954. [Google Scholar] [CrossRef]
- Astorino, T.A.; Roberson, D.W. Efficacy of acute caffeine ingestion for short-term high-intensity exercise performance: A systematic review. J. Strength Cond. Res. 2010, 24, 257–265. [Google Scholar] [CrossRef]
- Alasmari, F. Caffeine induces neurobehavioral effects through modulating neurotransmitters. Saudi Pharm. J. 2020, 28, 445–451. [Google Scholar] [CrossRef]
- Subramaniam, K.; Vinogradov, S. Improving the neural mechanisms of cognition through the pursuit of happiness. Front. Hum. Neurosci. 2013, 7, 452. [Google Scholar] [CrossRef]
- Beedie, C.J. All in the mind? Pain, placebo effect, and ergogenic effect of caffeine in sports performance. Open Access J. Sports Med. 2010, 1, 87–94. [Google Scholar] [CrossRef]
- Jin, Y.-B.; Kim, J.-H.; Song, C.-H.; Park, C.; Kang, C.-K. Diagnostic Ultrasound-Based Investigation of Central vs. Peripheral Arterial Changes Consequent to Low-Dose Caffeine Ingestion. Nutrients 2024, 16, 228. [Google Scholar] [CrossRef]


| Age (Years) | Height (cm) | Weight (kg) | BMI (kg/m2) | |
|---|---|---|---|---|
| Males (n = 15) | 22.93 ± 1.33 | 174.93 ± 6.25 | 74.73 ± 11.27 | 24.35 ± 2.94 |
| Females (n = 15) | 22.53 ± 1.36 | 159.72 ± 3.22 | 53.38 ± 5.62 | 20.89 ± 1.75 |
| Total (n = 30) | 22.73 ± 1.33 | 167.33 ± 9.15 | 64.06 ± 13.94 | 22.63 ± 2.96 |
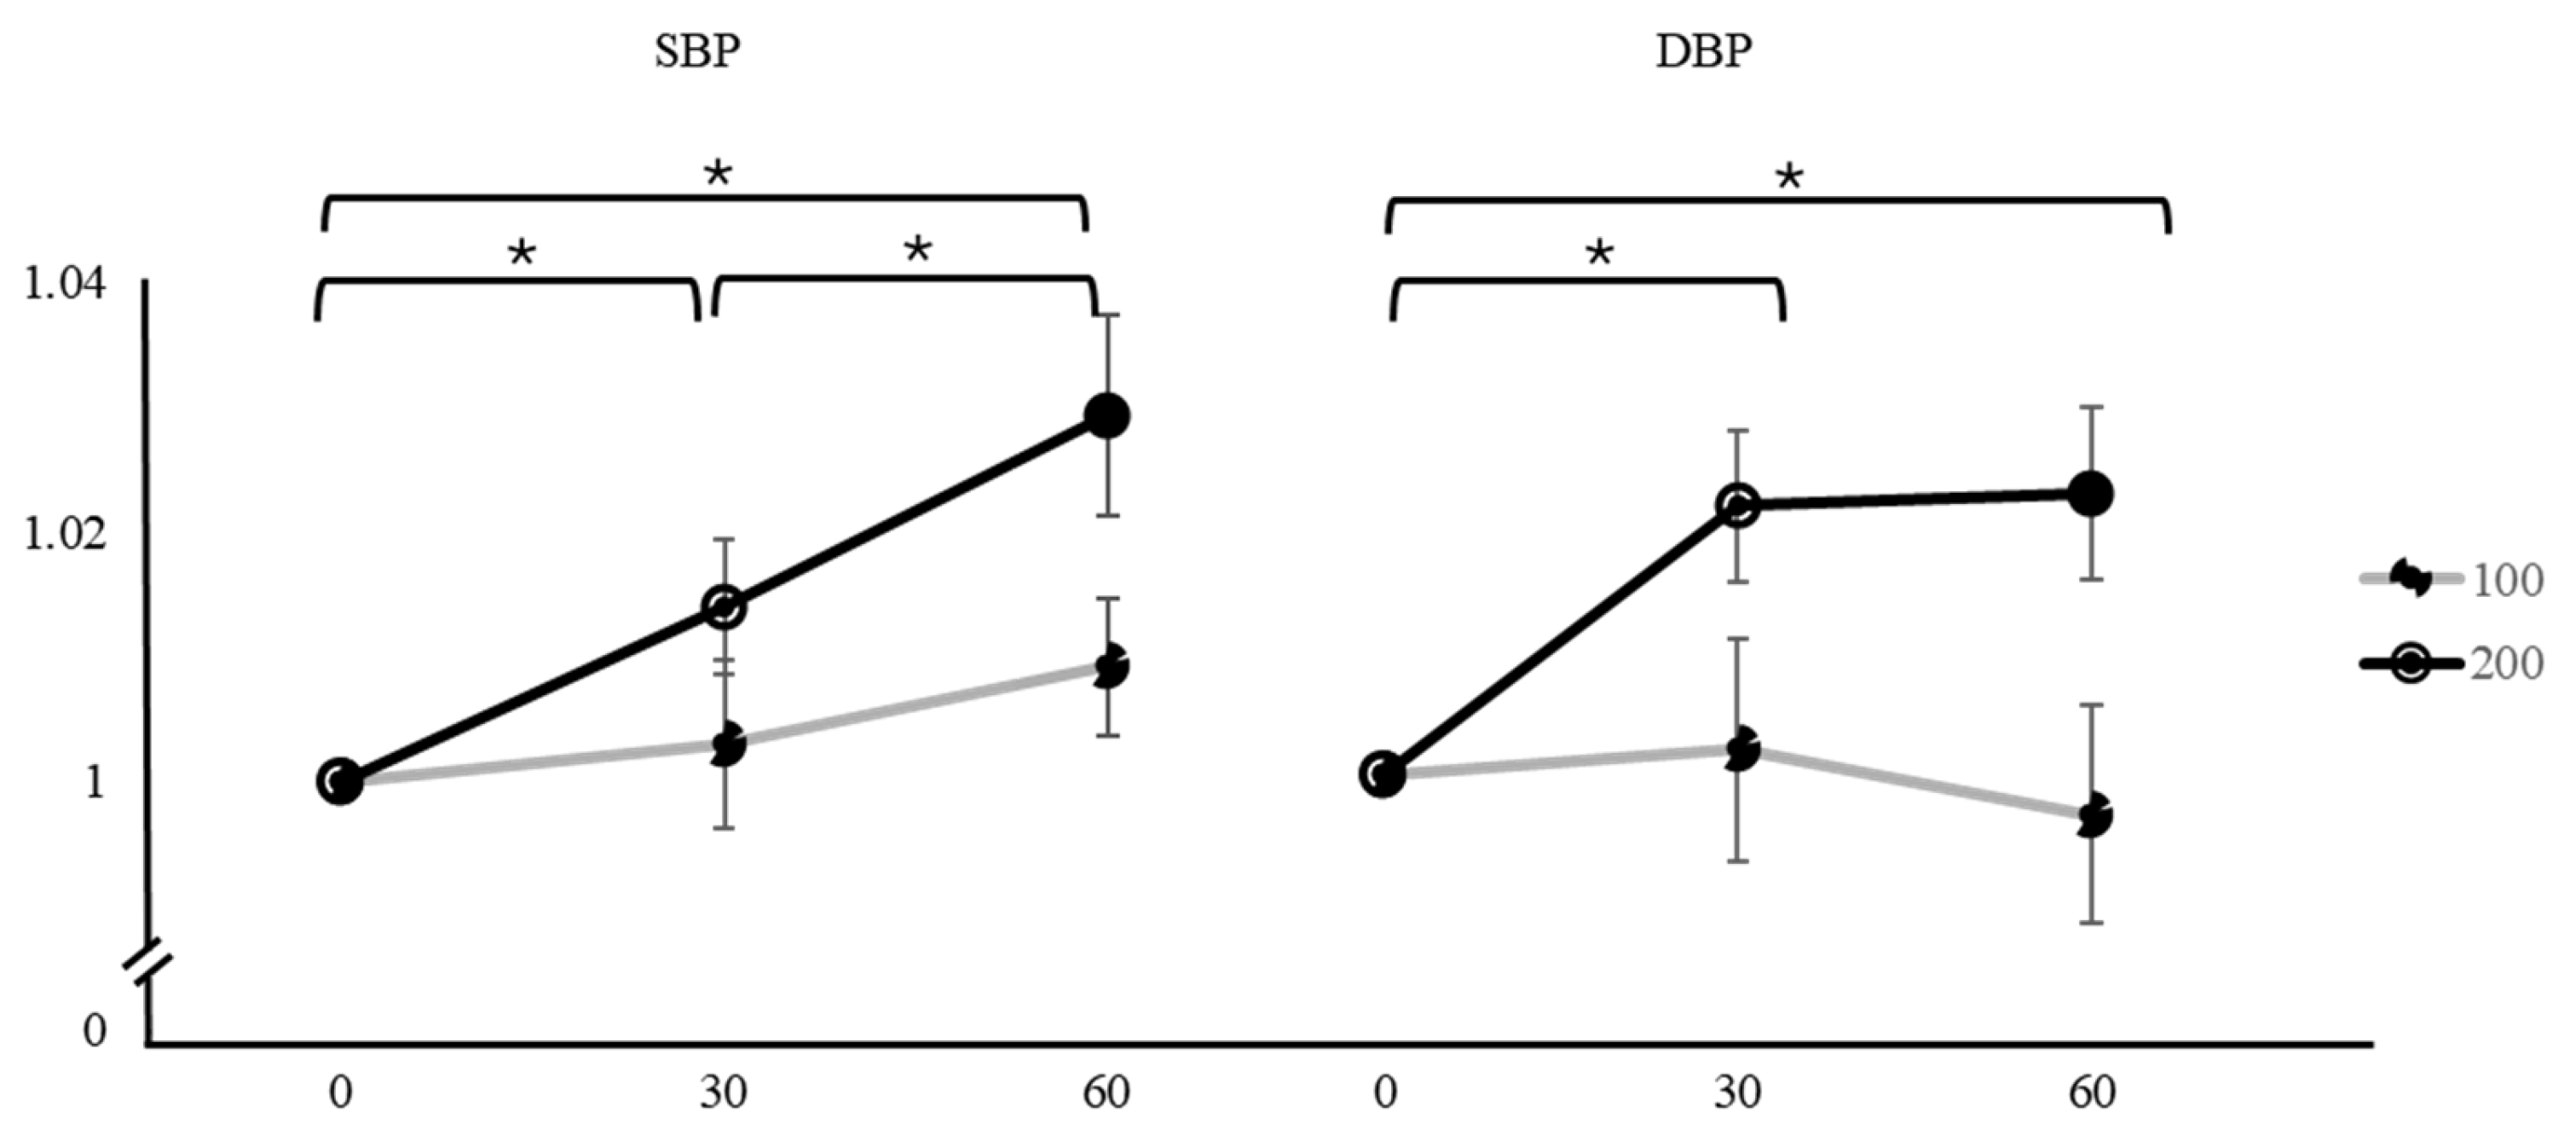
| Variation | Caffeine Dose | Time | Mean ± SD | F | p | Factor 1 | Factor 2 | Mean Difference ± SE (Factor 1–Factor 2) | t | pTukey |
|---|---|---|---|---|---|---|---|---|---|---|
| SBP | 100 mg | 0 min | 1 | 1.4 | 0.254 | 0 min | 30 min | −0.00301 ± 0.00669 | −0.450 | 0.895 |
| 30 min | 1.003 ± 0.03666 | 60 min | −0.00921 ± 0.00552 | −1.667 | 0.235 | |||||
| 60 min | 1.009 ± 0.03026 | 30 min | 60 min | −0.00620 ± 0.00436 | −1.420 | 0.344 | ||||
| 200 mg | 0 min | 1 | 10.3 | <0.001 * | 0 min | 30 min | −0.01400 ± 0.00536 | −2.610 | 0.037 * | |
| 30 min | 1.014 ± 0.02936 | 60 min | −0.02930 ± 0.00804 | −3.640 | 0.003 * | |||||
| 60 min | 1.029 ± 0.04403 | 30 min | 60 min | −0.01530 ± 0.00563 | −2.720 | 0.029 * | ||||
| DBP | 100 mg | 0 min | 1 | 0.179 | 0.836 | 0 min | 30 min | −0.00221 ± 0.00866 | −0.255 | 0.965 |
| 30 min | 1.002 ± 0.04777 | 60 min | 0.00262 ± 0.00842 | 0.311 | 0.948 | |||||
| 60 min | 0.997 ± 0.04639 | 30 min | 60 min | 0.00483 ± 0.00706 | 0.685 | 0.774 | ||||
| 200 mg | 0 min | 1 | 7.85 | 0.001 * | 0 min | 30 min | −0.02122 ± 0.00595 | −3.564 | 0.004 * | |
| 30 min | 1.021 ± 0.03207 | 60 min | −0.02551 ± 0.00752 | −3.390 | 0.006 * | |||||
| 60 min | 1.022 ± 0.03649 | 30 min | 60 min | −0.00429 ± 0.00711 | −0.603 | 0.820 |
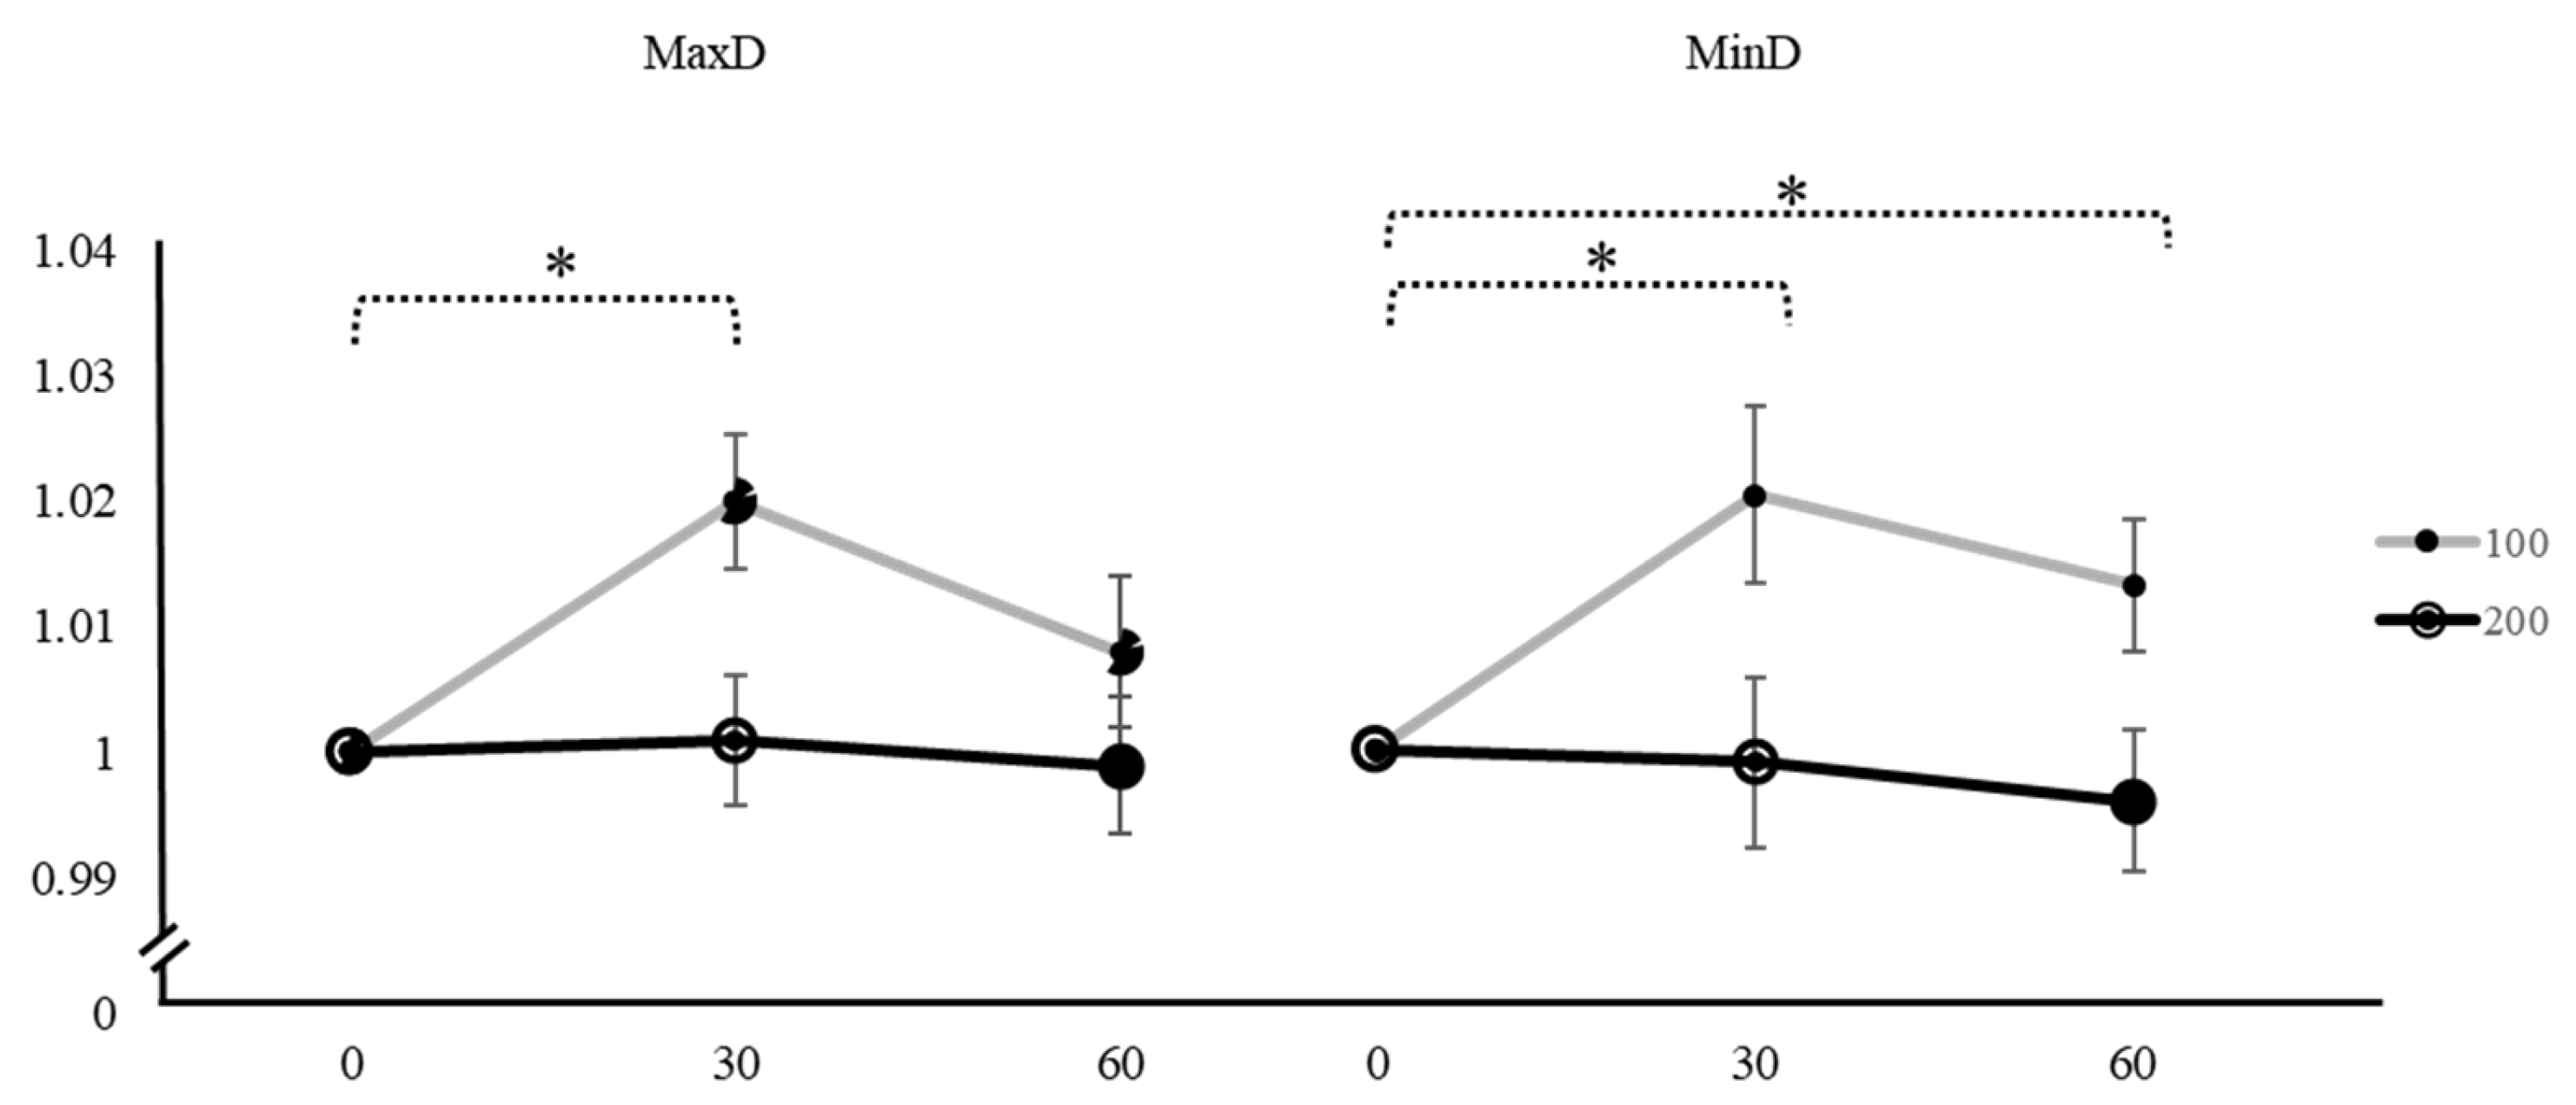
| Variation | Caffeine Dose | Time | Mean ± SD | F | p | Factor 1 | Factor 2 | Mean Difference ± SE (Factor 1–Factor 2) | t | pTukey |
|---|---|---|---|---|---|---|---|---|---|---|
| MaxD | 100 mg | 0 min | 1 | 4.610 | 0.014 * | 0 min | 30 min | −0.01777 ± 0.00594 | −2.990 | 0.016 * |
| 30 min | 1.020 ± 0.02951 | 60 min | −0.0071 ± 0.00628 | −1.130 | 0.504 | |||||
| 60 min | 1.008 ± 0.03317 | 30 min | 60 min | 0.01067 ± 0.00541 | 1.970 | 0.138 | ||||
| 200 mg | 0 min | 1 | 0.130 | 0.878 | 0 min | 30 min | −0.00070 ± 0.00504 | −0.136 | 0.990 | |
| 30 min | 1.001 ± 0.02800 | 60 min | 0.00214 ± 0.00549 | 0.389 | 0.920 | |||||
| 60 min | 0.999 ± 0.02998 | 30 min | 60 min | 0.00282 ± 0.00665 | 0.424 | 0.906 | ||||
| MinD | 100 mg | 0 min | 1 | 4.840 | 0.011 * | 0 min | 30 min | −0.01902 ± 0.00707 | −2.689 | 0.031 * |
| 30 min | 1.020 ± 0.03820 | 60 min | −0.01298 ± 0.00520 | −2.497 | 0.048 * | |||||
| 60 min | 1.013 ± 0.02849 | 30 min | 60 min | 0.00604 ± 0.00632 | 0.956 | 0.610 | ||||
| 200 mg | 0 min | 1 | 0.427 | 0.655 | 0 min | 30 min | 0.00229 ± 0.00674 | 0.340 | 0.938 | |
| 30 min | 0.999 ± 0.03647 | 60 min | 0.00545 ± 0.00571 | 0.953 | 0.612 | |||||
| 60 min | 0.996 ± 0.03033 | 30 min | 60 min | 0.00315 ± 0.00520 | 0.606 | 0.818 |
| Variation | Caffeine Dose | Time | Mean ± SD | F | p | Factor 1 | Factor 2 | Mean Difference ± SE (Factor 1–Factor 2) | t | pTukey |
|---|---|---|---|---|---|---|---|---|---|---|
| PWV | 100 mg | 0 min | 1 | 2.860 | 0.066 | 0 min | 30 min | −0.00245 ± 0.0254 | −0.0966 | 0.995 |
| 30 min | 1.005 ± 0.13648 | 60 min | −0.05081 ± 0.0208 | −2.4374 | 0.055 | |||||
| 60 min | 1.053 ± 0.11166 | 30 min | 60 min | −0.04836 ± 0.0253 | −1.9090 | 0.156 | ||||
| 200 mg | 0 min | 1 | 0.695 | 0.503 | 0 min | 30 min | −0.02844 ± 0.0313 | −0.9090 | 0.639 | |
| 30 min | 1.014 ± 0.16218 | 60 min | −0.00319 ± 0.0229 | −0.1390 | 0.989 | |||||
| 60 min | 1.001 ± 0.12751 | 30 min | 60 min | 0.02525 ± 0.0243 | 1.0390 | 0.559 |
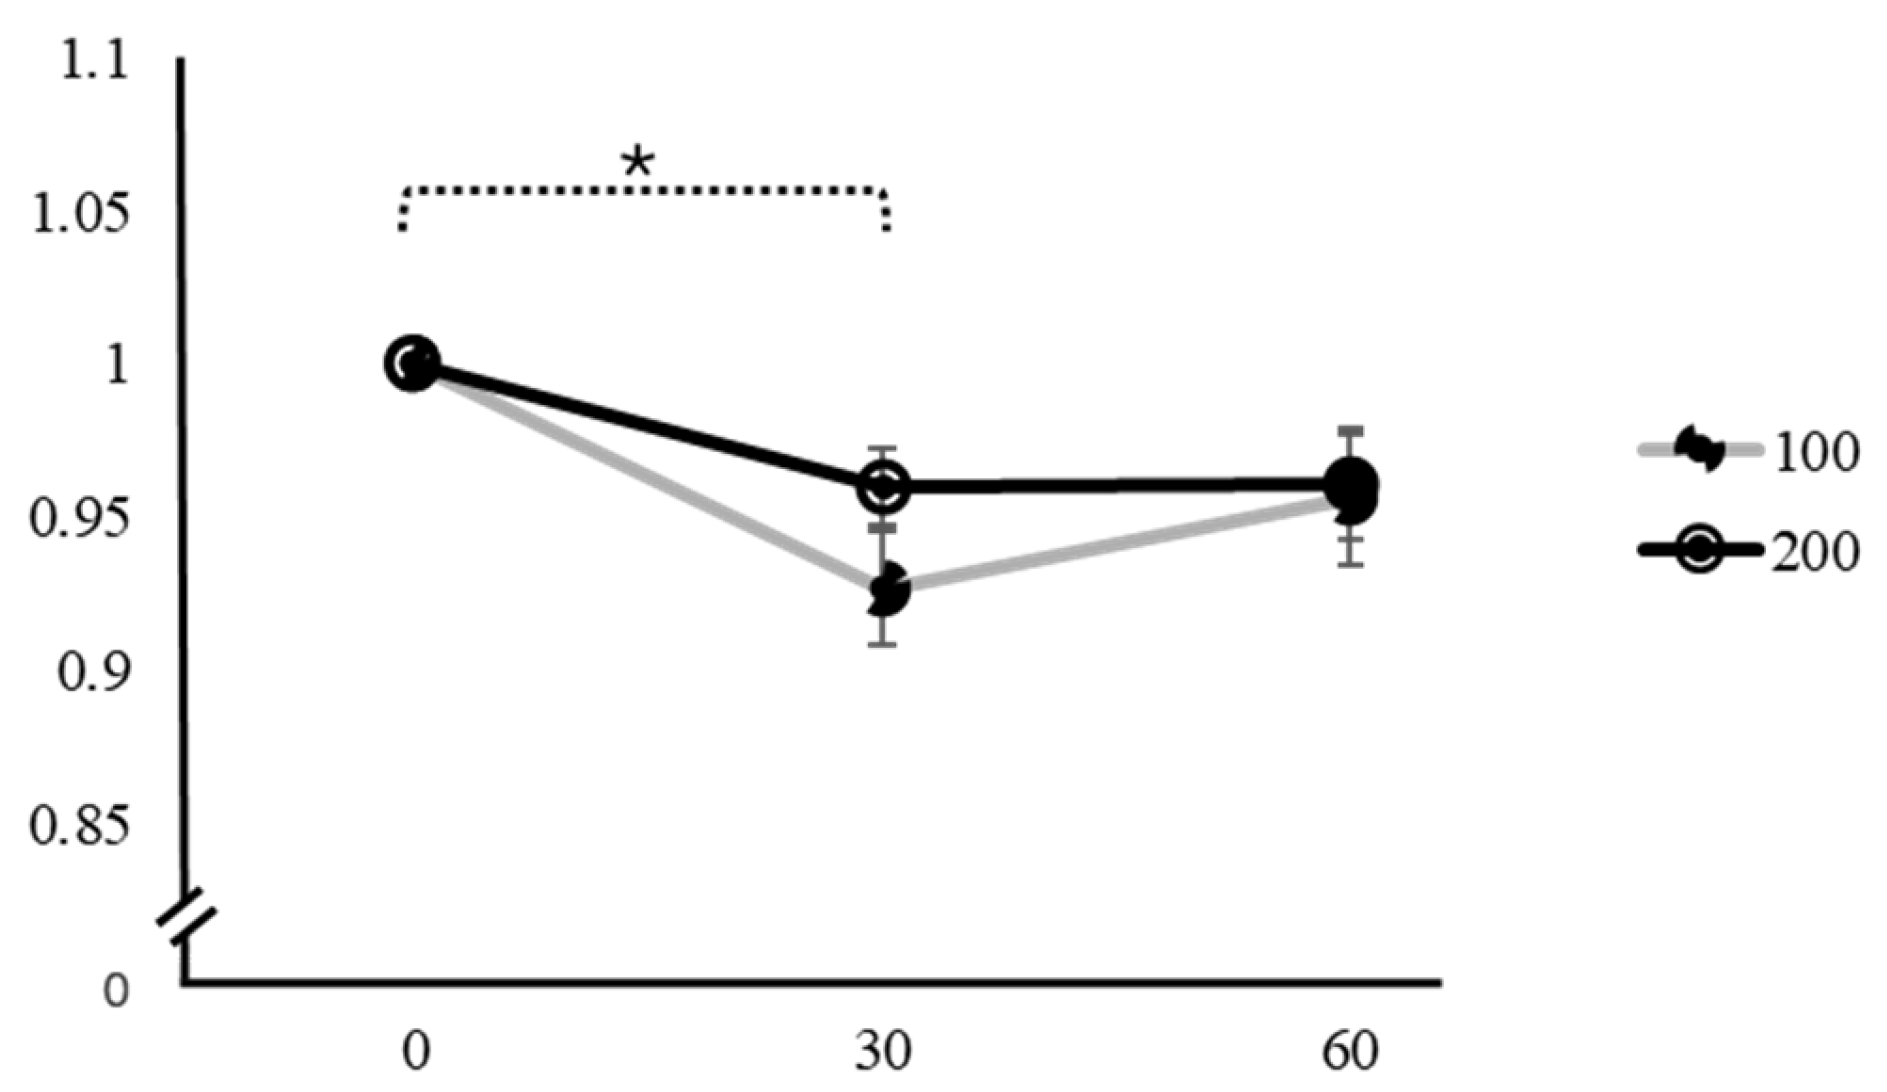
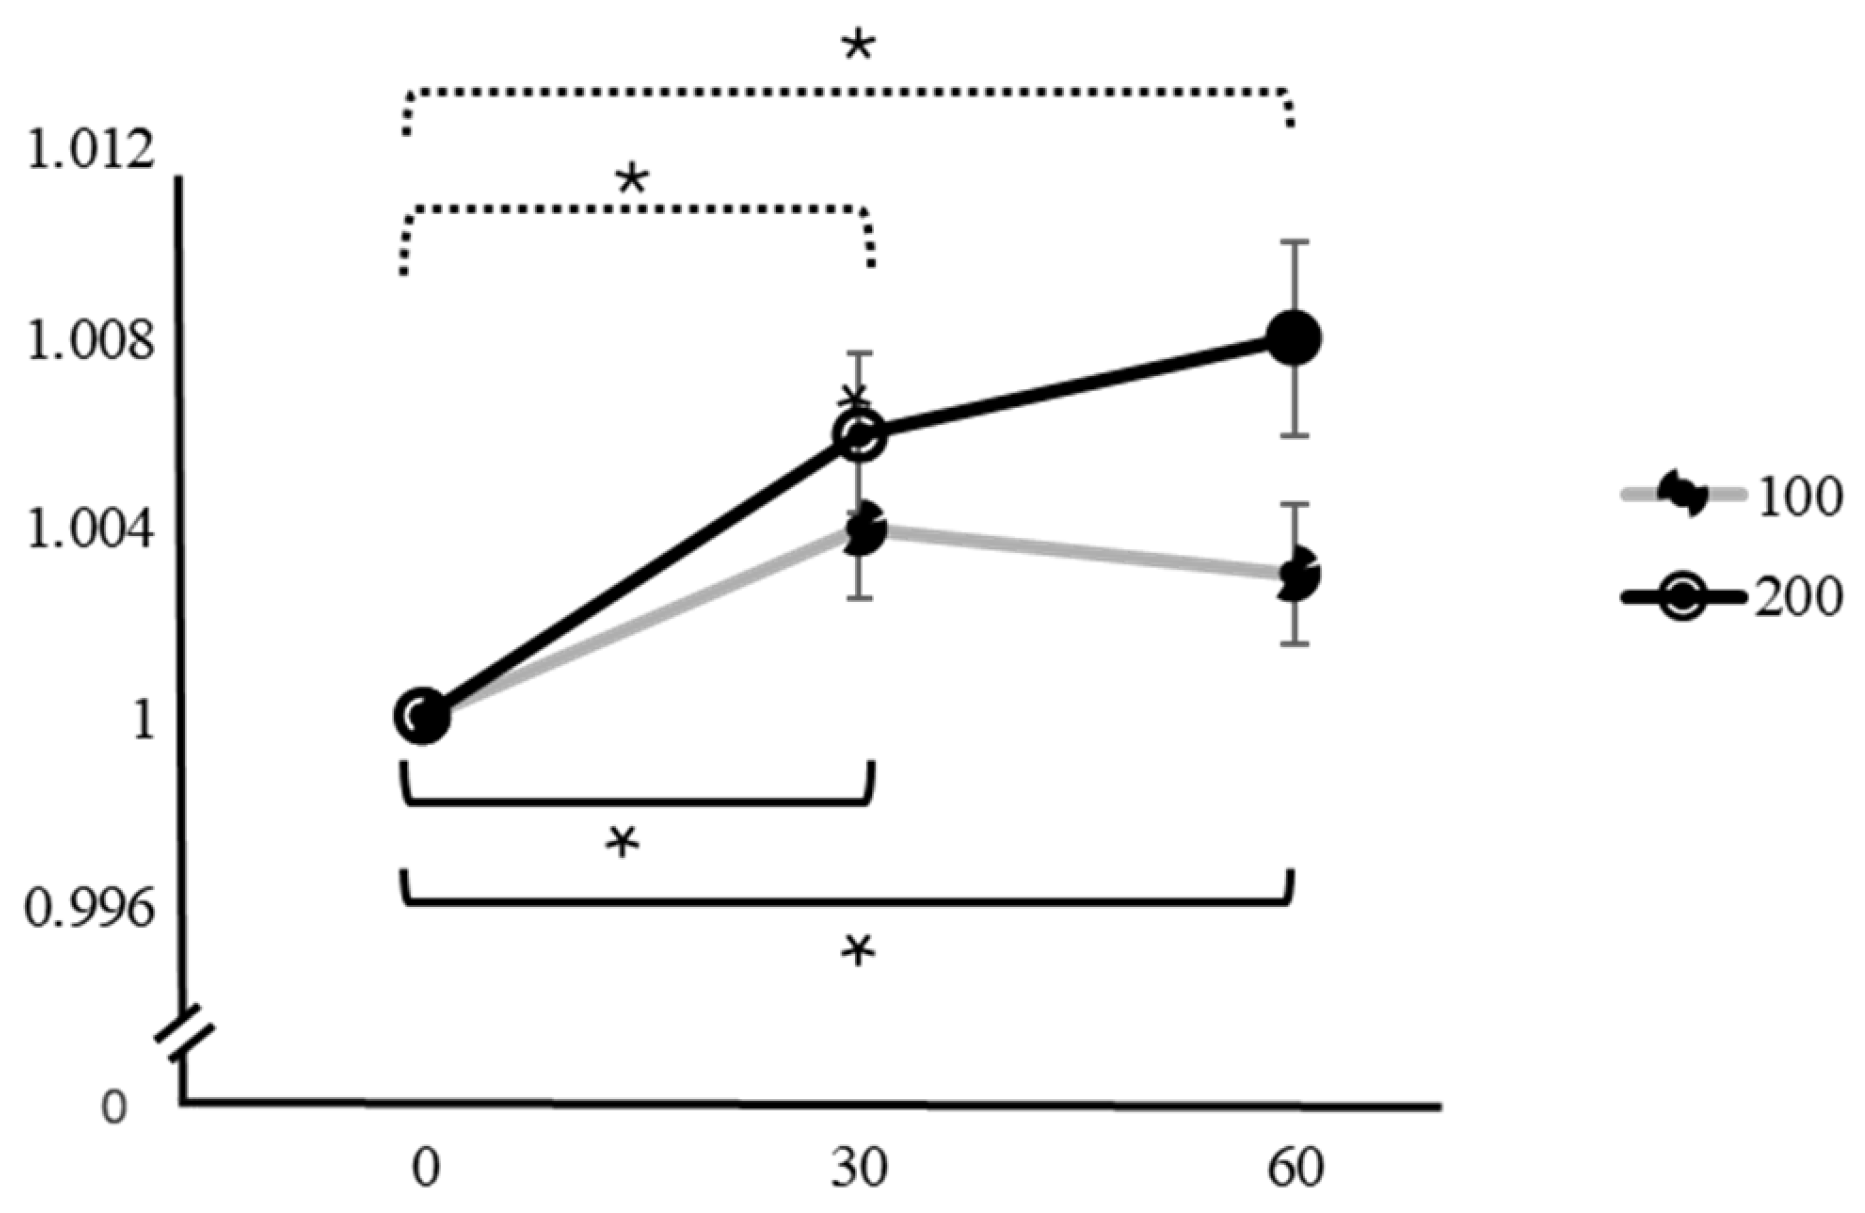
| Variation | Caffeine Dose | Time | Mean ± SD | F | p | Factor 1 | Factor 2 | Mean Difference ± SE (Factor 1–Factor 2) | t | pTukey |
|---|---|---|---|---|---|---|---|---|---|---|
| PSV | 100 mg | 0 min | 1 | 7.98 | <0.001 * | 0 min | 30 min | 0.0768 ± 0.0185 | 4.140 | <0.001 * |
| 30 min | 0.927 ± 0.10060 | 60 min | 0.0526 ± 0.0217 | 2.420 | 0.056 | |||||
| 60 min | 0.956 ± 0.11457 | 30 min | 60 min | −0.0242 ± 0.0186 | −1.300 | 0.407 | ||||
| 200 mg | 0 min | 1 | 2.11 | 0.131 | 0 min | 30 min | 0.02918 ± 0.0150 | 1.951 | 0.144 | |
| 30 min | 0.960 ± 0.06945 | 60 min | 0.03403 ± 0.0189 | 1.797 | 0.190 | |||||
| 60 min | 0.961 ± 0.09885 | 30 min | 60 min | 0.00484 ± 0.0195 | 0.248 | 0.967 | ||||
| HR | 100 mg | 0 min | 1 | 8.04 | 0.001 * | 0 min | 30 min | 0.0112 ± 0.0064 | 1.760 | 0.209 |
| 30 min | 0.988 ± 0.03054 | 60 min | 0.0310 ± 0.00875 | 3.540 | 0.005 * | |||||
| 60 min | 0.973 ± 0.03853 | 30 min | 60 min | 0.0198 ± 0.00814 | 2.430 | 0.061 | ||||
| 200 mg | 0 min | 1 | 6.09 | 0.008 * | 0 min | 30 min | 0.0187 ± 0.00830 | 2.250 | 0.080 | |
| 30 min | 0.980 ± 0.04016 | 60 min | 0.0298 ± 0.01049 | 2.840 | 0.022 * | |||||
| 60 min | 0.974 ± 0.05511 | 30 min | 60 min | 0.0111 ± 0.00662 | 1.670 | 0.235 | ||||
| SpO2 | 100 mg | 0 min | 1 | 5.28 | 0.008 * | 0 min | 30 min | −0.0043 ± 0.00148 | −2.914 | 0.018 * |
| 30 min | 1.004 ± 0.00808 | 60 min | −0.0038 ± 0.00153 | −2.482 | 0.049 * | |||||
| 60 min | 1.003 ± 0.00808 | 30 min | 60 min | 0.0005 ± 0.00133 | 0.379 | 0.924 | ||||
| 200 mg | 0 min | 1 | 11.5 | <0.001 * | 0 min | 30 min | −0.00693 ± 0.00181 | −3.821 | 0.002 * | |
| 30 min | 1.006 ± 0.00913 | 60 min | −0.00834 ± 0.00211 | −3.947 | 0.001 * | |||||
| 60 min | 1.008 ± 0.01113 | 30 min | 60 min | −0.00142 ± 0.00164 | −0.866 | 0.666 |
| Variation | Caffeine Dose | Time | Mean ± SD | F | p | Factor 1 | Factor 2 | Mean Difference ± SE (Factor 1–Factor 2) | t | pTukey |
|---|---|---|---|---|---|---|---|---|---|---|
| Accuracy rate | 100 mg | 0 min | 1 | 3.31 | 0.044 * | 0 min | 30 min | −0.01305 ± 0.00932 | −1.400 | 0.356 |
| 30 min | 1.013 ± 0.04842 | 60 min | 0.00903 ± 0.00947 | 0.953 | 0.613 | |||||
| 60 min | 0.991 ± 0.04923 | 30 min | 60 min | 0.02207 ± 0.00684 | 3.226 | 0.009 * | ||||
| 200 mg | 0 min | 1 | 5.44 | 0.007 * | 0 min | 30 min | 0.00537 ± 0.00586 | 0.917 | 0.634 | |
| 30 min | 0.995 ± 0.03218 | 60 min | 0.02034 ± 0.00708 | 2.874 | 0.020 * | |||||
| 60 min | 0.979 ± 0.04009 | 30 min | 60 min | 0.01497 ± 0.00618 | 2.423 | 0.055 | ||||
| Response time | 100 mg | 0 min | 1 | 30.4 | <0.001 * | 0 min | 30 min | 0.0445 ± 0.0094 | 4.740 | <0.001 * |
| 30 min | 0.963 ± 0.04238 | 60 min | 0.0701 ± 0.01048 | 6.690 | <0.001 * | |||||
| 60 min | 0.934 ± 0.04590 | 30 min | 60 min | 0.0256 ± 0.00706 | 3.620 | 0.003 * | ||||
| 200 mg | 0 min | 1 | 32.6 | <0.001 * | 0 min | 30 min | 0.0232 ± 0.00660 | 3.520 | 0.005 * | |
| 30 min | 0.976 ± 0.03408 | 60 min | 0.0637 ± 0.00928 | 6.860 | <0.001 * | |||||
| 60 min | 0.938 ± 0.04713 | 30 min | 60 min | 0.0404 ± 0.00784 | 5.160 | <0.001 * |
| Variation | Time | Mean Difference ± SE (100 mg–200 mg) | t | p |
|---|---|---|---|---|
| SBP | 30 min | −0.01097 ± 0.00732 | −1.4985 | 0.145 |
| 60 min | −0.02008 ± 0.00786 | −2.5530 | 0.016 * | |
| DBP | 30 min | −0.01852 ± 0.00939 | −1.9720 | 0.059 |
| 60 min | −0.02498 ± 0.01097 | −2.2760 | 0.031 * | |
| MaxD | 30 min | 0.01953 ± 0.00783 | 2.495 | 0.019 * |
| 60 min | 0.00837 ± 0.00638 | 1.311 | 0.201 | |
| MinD | 30 min | 0.02147 ± 0.00930 | 2.307 | 0.029 * |
| 60 min | 0.01718 ± 0.00844 | 2.035 | 0.052 | |
| PWV | 30 min | −0.00904 ± 0.04381 | −0.0206 | 0.838 |
| 60 min | 0.05229 ± 0.03464 | 1.5100 | 0.143 | |
| PSV | 30 min | −0.03298 ± 0.02186 | −1.509 | 0.144 |
| 60 min | −0.00489 ± 0.03181 | −0.154 | 0.879 | |
| HR | 30 min | 0.00818 ± 0.00897 | 0.912 | 0.373 |
| 60 min | −0.00185 ± 0.01311 | −0.141 | 0.889 | |
| SpO2 | 30 min | −0.002 ± 0.00205 | −0.976 | 0.338 |
| 60 min | −0.00437 ± 0.00213 | −2.051 | 0.050 * | |
| Accuracy rate | 30 min | 0.01782 ± 0.01168 | 1.526 | 0.139 |
| 60 min | 0.01242 ± 0.01464 | 0.849 | 0.404 | |
| Response time | 30 min | −0.01296 ± 0.01064 | −1.218 | 0.235 |
| 60 min | −0.00403 ± 0.0117 | −0.357 | 0.724 |
| Variation | Caffeine Dose | 0 min | Δ | 30 min | Δ | 60 min |
|---|---|---|---|---|---|---|
| VAS | 100 mg | 3.13 ± 2.19 | −0.06 | 3.07 ± 2.03 | −0.27 | 2.8 ± 2.04 |
| 200 mg | 2.87 ± 2.16 | −0.03 | 2.83 ± 2.09 | −0.26 | 2.57 ± 2.05 | |
| KSS | 100 mg | 4.87 ± 1.59 | −0.46 | 4.00 ± 1.46 | −0.28 | 4.13 ± 1.41 |
| 200 mg | 5.00 ± 1.55 | −1.13 | 3.87 ± 1.22 | 0.00 | 3.87 ± 1.28 | |
| CFS | 100 mg | 16.30 ± 5.53 | −1.90 | 14.40 ± 5.62 | 2.10 | 16.00 ± 5.64 |
| 200 mg | 14.80 ± 5.58 | −1.60 | 13.20 ± 5.64 | −0.40 | 12.80 ± 5.31 |
Disclaimer/Publisher’s Note: The statements, opinions and data contained in all publications are solely those of the individual author(s) and contributor(s) and not of MDPI and/or the editor(s). MDPI and/or the editor(s) disclaim responsibility for any injury to people or property resulting from any ideas, methods, instructions or products referred to in the content. |
© 2025 by the authors. Licensee MDPI, Basel, Switzerland. This article is an open access article distributed under the terms and conditions of the Creative Commons Attribution (CC BY) license (https://creativecommons.org/licenses/by/4.0/).
Share and Cite
Choi, M.-K.; Ahn, H.-S.; Kim, D.-E.; Lee, D.-S.; Park, C.-S.; Kang, C.-K. Effects of Varying Caffeine Dosages and Consumption Timings on Cerebral Vascular and Cognitive Functions: A Diagnostic Ultrasound Study. Appl. Sci. 2025, 15, 1703. https://doi.org/10.3390/app15041703
Choi M-K, Ahn H-S, Kim D-E, Lee D-S, Park C-S, Kang C-K. Effects of Varying Caffeine Dosages and Consumption Timings on Cerebral Vascular and Cognitive Functions: A Diagnostic Ultrasound Study. Applied Sciences. 2025; 15(4):1703. https://doi.org/10.3390/app15041703
Chicago/Turabian StyleChoi, Min-Ki, Hee-Seul Ahn, Da-Eun Kim, Da-Seul Lee, Chan-Sol Park, and Chang-Ki Kang. 2025. "Effects of Varying Caffeine Dosages and Consumption Timings on Cerebral Vascular and Cognitive Functions: A Diagnostic Ultrasound Study" Applied Sciences 15, no. 4: 1703. https://doi.org/10.3390/app15041703
APA StyleChoi, M.-K., Ahn, H.-S., Kim, D.-E., Lee, D.-S., Park, C.-S., & Kang, C.-K. (2025). Effects of Varying Caffeine Dosages and Consumption Timings on Cerebral Vascular and Cognitive Functions: A Diagnostic Ultrasound Study. Applied Sciences, 15(4), 1703. https://doi.org/10.3390/app15041703