Abstract
With the increasing complexity of engineering environments in tunnel construction, the vibrations generated by shield tunneling in hard rock strata pose significant challenges to the operation and maintenance of adjacent tunnels. This study investigates the vibration characteristics induced by shield tunneling and provides an in-depth analysis of the propagation behavior of these vibrations within tunnel segments and surrounding soil layers. Through a combination of theoretical derivations, on-site monitoring, and numerical simulations, the research examines the distribution of vibration energy and its attenuation patterns with increasing propagation distance. The findings reveal that vibration energy is primarily concentrated in the low-frequency range (3–4 Hz) and follows an exponential decay trend as distance increases. Furthermore, the vibration response of neighboring tunnels is heavily influenced by the construction vibration source, with rapid energy attenuation observed over short distances. Numerical simulations conducted using PFC3D6.0 (Particle Flow Code) software validate the theoretical model and emphasize the critical roles of soil-damping properties and tunnel segment material characteristics in vibration attenuation. This study offers a robust theoretical framework and valuable data to support the control of tunnel vibrations and the optimization of construction practices.
1. Introduction
To address the increasing demands of urban subway construction, shield tunneling technology has advanced rapidly and is now widely applied for tunnel excavation in hard rock strata. However, research on the environmental impacts induced by shield tunneling and the propagation of vibration waves within the surrounding soil layers remains limited. Most studies on subway tunnel vibrations have primarily focused on the effects generated during operational phases [1,2,3,4]. In contrast, the vibration acceleration caused by shield tunneling in hard rock can be several times higher [5].
Current research on tunnel vibration responses primarily focuses on factors related to vehicles, tracks, and vibrations induced by blasting construction. In the realm of monitoring experiments, Wang et al. [6], leveraging the Beijing Metro Line 8 project, developed a three-dimensional dynamic finite element model to analyze the interactions between tunnel structures, surrounding soil layers, and adjacent buildings. They utilized Z-soil finite element analysis software, establishing a foundation for numerical simulations of vibration propagation during shield construction. Similarly, Wu et al. [7] investigated vibration issues caused by shield construction, examining the attenuation characteristics of these vibrations in the ground through pendulum impact tests. They proposed a method for calculating the energy source, offering valuable theoretical insights into the transmission of vibration waves through soil layers. Serhii Landar et al. [8] presented the development and testing of the Smart 4 controller for monitoring vibration loads in drill strings during deep well drilling, aimed at improving operational efficiency and providing an evidence base for maintenance and warranty issues.
In theoretical studies, Belov et al. [9] assumed no interference between elastic wave energies within structures and derived differential control equations using structural vibration energy density as the core variable. Nefske and Sung [10] identified limitations of the statistical energy method for high-frequency analysis and introduced energy density as a more effective approach for describing high-frequency structural vibrations. Wohlever and Bernhard [11,12] established relationships between energy flow and energy density, outlining energy transmission for rods and beams. Building on this, Bouthier and Bernhard [13,14,15] expanded the energy flow model to higher-dimensional systems, deriving motion equations for membranes, acoustic cavities, and fields. Wang et al. [16] examined vibration attenuation over distance and damping effects in ground layers, proposing a practical method to estimate vibration impacts on the surrounding environment. Gupta et al. [17] conducted parametric analyses of tunnel–rock interactions, investigating the influence of tunnel dimensions, depth, and other factors on subway vibration transmission. Suwansawat and Einstein [18] employed a Gaussian formula to model settlement curves for tunnels excavated via the shield method. By combining these curves, they calculated the total settlement trough for twin tunnels and, using data from a Bangkok metro tunneling project, observed that maximum settlement typically occurred off-center, with the settlement trough often being asymmetric. Shatskyi lvan et al. [19] proposed a new design for a dry friction shell shock absorber with excellent damping characteristics, capable of operating under high loads. The design also includes a mechanical model that predicts its behavior under cyclic loading, with potential applications in the mining, oil and gas, and construction industries.
In numerical simulation studies, Chehade and Shahrour [20] used the two-dimensional numerical software Plaxis to analyze the construction process of twin tunnels and optimize their relative positions. Their findings indicated that soil settlement was minimized when the twin tunnels were horizontally aligned. In the same year, Funatsu et al. [21] employed a two-dimensional discrete element method (DEM) to investigate interactions between parallel twin tunnels, revealing that pre-strengthening the first tunnel significantly improved the stability of closely spaced twin tunnels. Comodromos et al. [22,23] developed a numerical model for twin tunnels that incorporated ground stress balance and shield tunneling. They analyzed how construction parameters, including excavation face support, grouting pressure, and grouting intervals, influenced ground settlement. Ding et al. [24] utilized boundary element methods in numerical simulations to assess the impact of tunnel vibrations on nearby buildings. These studies have established a foundational understanding of tunnel vibration responses. However, the relatively recent application of shield tunneling in urban subway engineering has resulted in an incomplete and unsystematic theoretical framework for studying vibrations induced by shield construction. Oliaei et al. [25] demonstrated that the two-dimensional particle flow method (PFC2D) effectively simulated discontinuities in coarse-grained alluvial soil, producing more accurate results. Since then, PFC has emerged as a crucial tool for investigating tunnel-soil interactions.
This study builds on existing vibration theories to further deduce energy variations within tunnel segments during shield construction. The validity of these deductions is confirmed through field monitoring and numerical simulations. Additionally, the vibration response of tunnel lining segments in double-lane shield construction is thoroughly analyzed.
2. Basic Theory
2.1. Vibration Energy Density Decay Theory
Vibration wave power density, derived from wave acceleration, represents the energy distribution of squared acceleration over a unit frequency range. It is widely used in vibration analysis to characterize the frequency properties and energy distribution of acceleration signals, with applications in mechanical vibration, civil engineering, seismic wave propagation, and related fields. Factors such as frequency, propagation path, and structural damping significantly influence power density attenuation [26,27].
The power density represents the energy distribution of the square value of the acceleration of the signal in the unit frequency range. In vibration analysis, the power density S(f) of the acceleration a(t) of a time-domain signal is defined as follows:
where A(k) is the Fourier transform of the acceleration signal a(t) and T is the observation time of the signal. The unit is (mm/s2)/Hz.
The energy distribution of the vibration signal on different frequency components can be analyzed by the power density, which provides a basis for the energy change in the signal propagation process.
When a vibration wave passes through a damped structure, its acceleration power density decay can be expressed as follows:
where SA(f) and SB(f) are the vibration acceleration power density before and after the structure, respectively; H(f) is the frequency response function of the structure; e−2ξω(f)d is the exponential decay due to structural damping; ξ is the damping ratio of the structure; ω(f) = 2πf is the angular frequency of the signal; and d is the propagation distance of the vibration signal.
The equation describes in the frequency domain how the vibration acceleration power density decays with the propagation process, focusing on the role of structural damping and frequency.
The frequency response function H(f) describes the transmission properties of a structure for signals of different frequencies. For structures with complex geometrical and material properties, H(f) exhibits nonlinear variations due to resonance, material absorption, and geometrical reflection. In the vicinity of the resonance frequency, the response of the structure to vibration is enhanced and the power density SB(f) may show a localized increase. For the frequency response function of a structure, the solution can be based on a dynamic model of the structure. For example, for the vibration analysis of a simply supported beam, the frequency response function can be calculated from the stiffness matrix K and the mass matrix M of the structure. The dynamic equations of this system are as follows:
where u(t) is the displacement and F(t) is the excitation force. By analyzing this equation in the frequency domain, the frequency response function is obtained, as follows:
where j is an imaginary unit.
The damping effect reflects the ability of the structure to dissipate vibration energy. The larger the damping ratio ξ is, the faster the energy decays during signal propagation. The exponential term shows that higher frequency signals (larger f) decay more significantly than lower frequency signals and that, the farther the signal travels from d, the more the power density SB(f) decreases.
2.2. Microscopic Concrete Particle Vibration Energy State
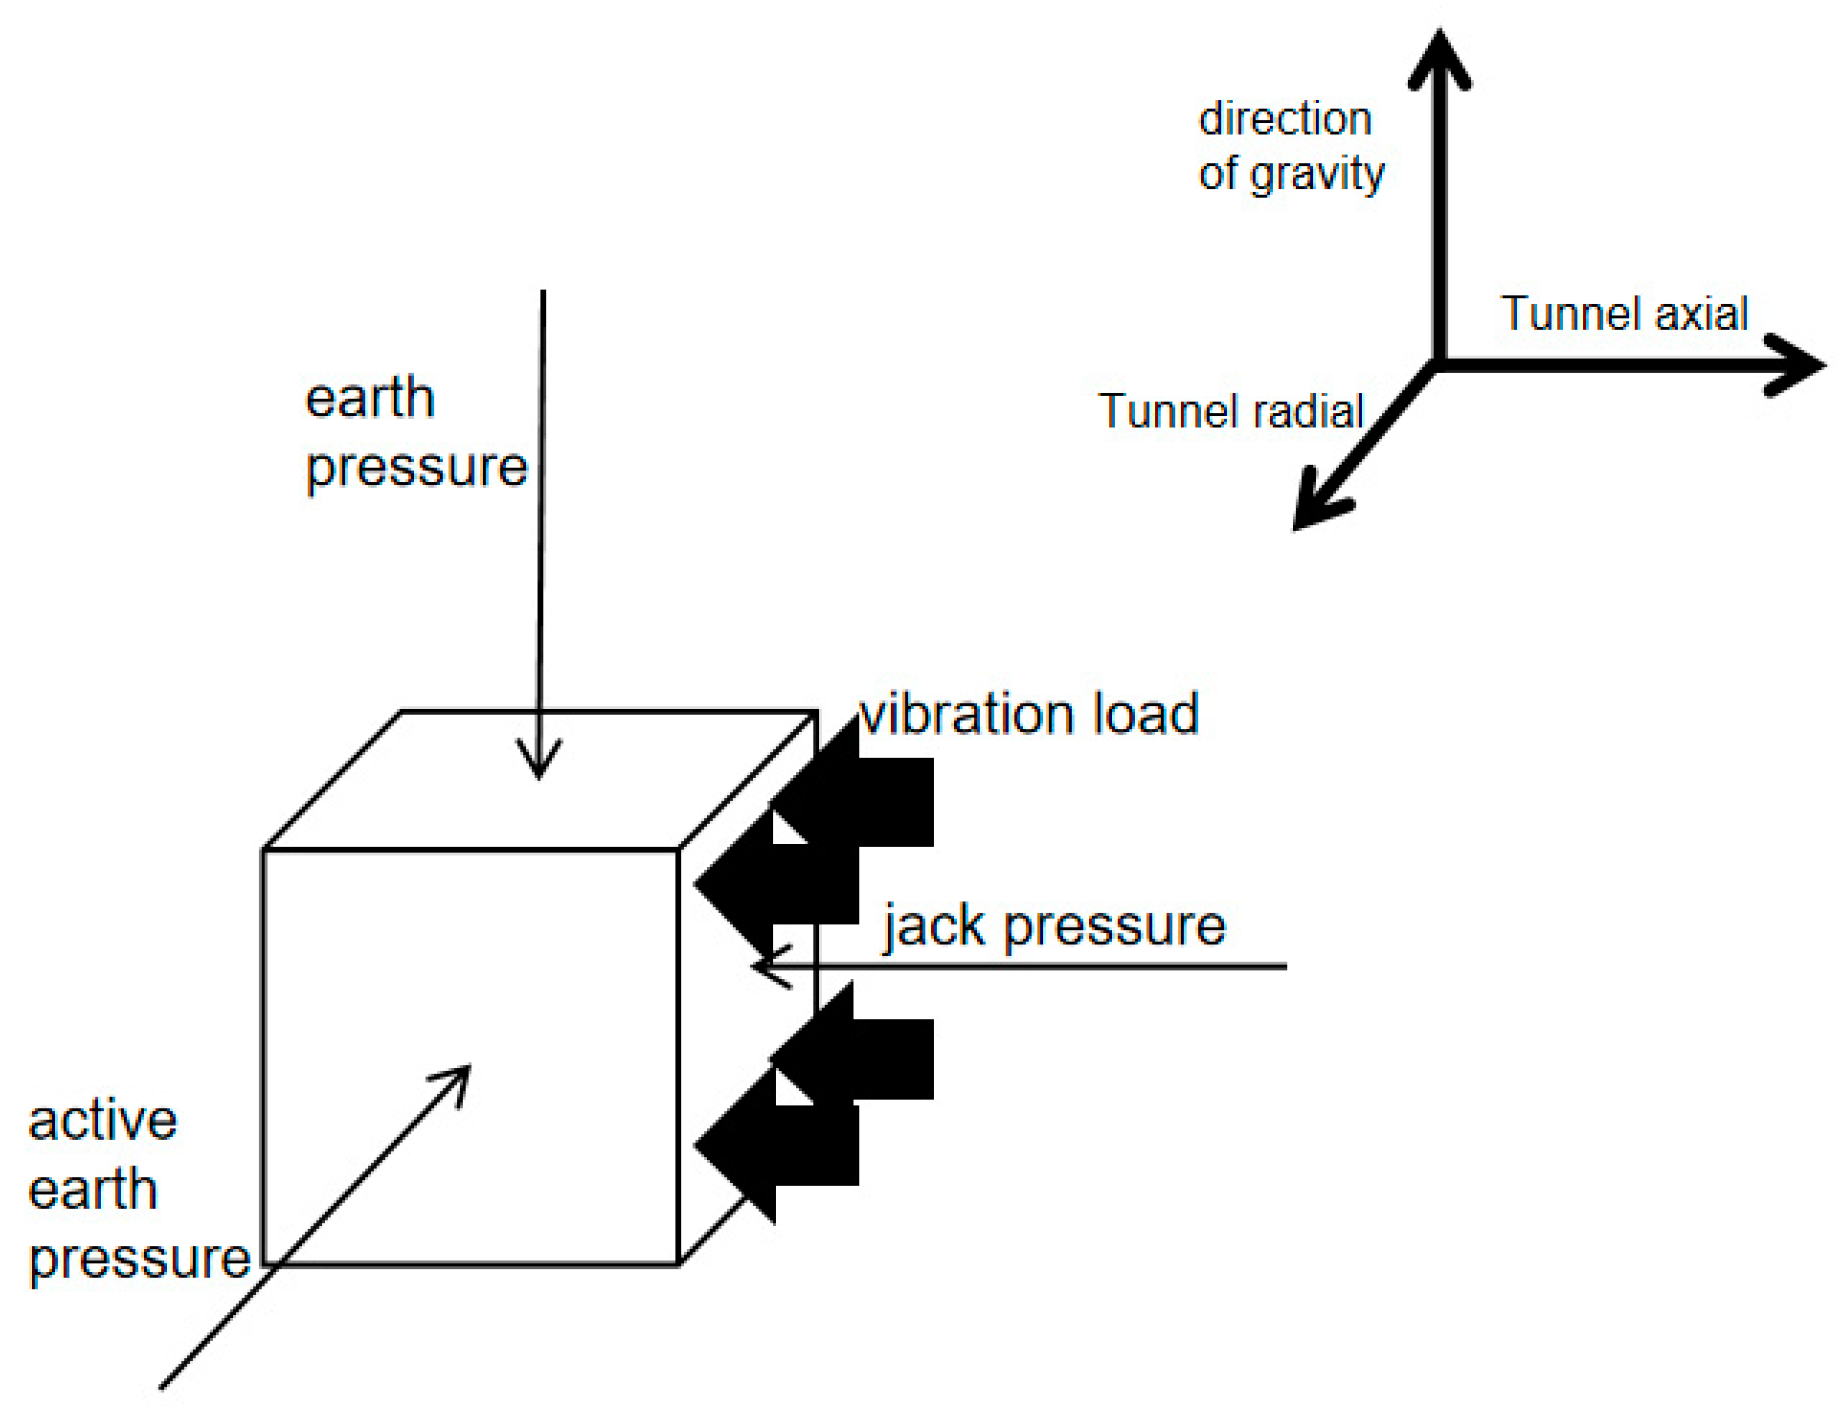
The force state of concrete is much more complex than uniaxial compression. If we take the segment adjacent to the cutter plate in shield construction as an example, its force includes axial propulsion jack pressure, earth pressure, and active earth pressure [28], in addition to the construction-induced power load transmitted through the jack connection. The force state of concrete particles in the concrete segment is shown in Figure 1.
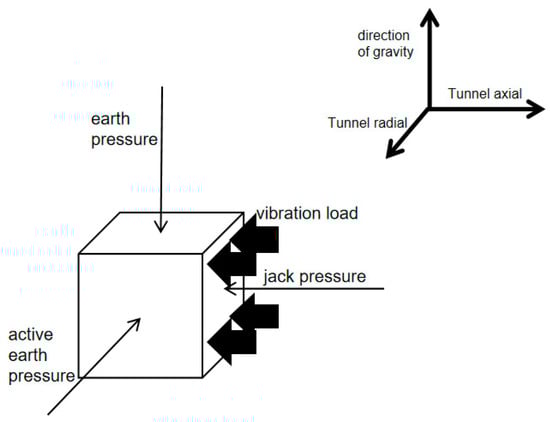
Figure 1.
Force state of concrete particles in pipe sheets.
The earth pressure is replaced by parameters such as soil density and burial depth. In order to satisfy the energy analysis of the microstates, assuming that the concrete particles are in the form of 1 × 1 × 1, the active earth pressure and soil pressure can be expressed by Equations (5) and (6), as follows:
where is the unit gravity density of the soil; h is the burial depth; and is the active earth pressure coefficient, which can usually be calculated based on Coulomb earth pressure theory or Rankine earth pressure theory.
Assuming that the total thrust of the shield machine is shared equally by the propelling jacks, the propelling jack pressure can be expressed by Equation (7), as follows:
where is the total thrust of the shield machine; n is the number of propelling jacks; and A is the contact area between the jacks and the concrete pipe sheet, which can be calculated according to the cross-sectional area of the jacks.
For the analysis of the effect of its vibration load, specifically for the aspect calculation, we assume that the sinusoidal vibration wave is applied in the axial direction and the velocity amplitude of the vibration wave is =; therefore, we integrate over the velocity to obtain the displacement u(t), i.e., Equation (8), as follows:
where is the velocity amplitude and is the vibration frequency. Strain ε(t), on the other hand, is the ratio of displacement to length L, which is calculated using Equation (9), as follows:
The stress σd(t) can be obtained from the strain using Hooke’s law, as detailed in Equation (10) below:
Therefore, the stress state of concrete under a triaxial stress state is shown in Equation (11), as follows:
The strain energy density U(t) per unit volume after substituting the total stress state is shown in Equation (12), as follows:
Expanding and organizing this leads to Equation (13), as follows:
The energy dissipation rate is the rate of change of strain energy density with time and can be obtained by taking the time derivative of the pair, as shown in Equation (14) below:
Concrete particles crack when the strain energy density or energy dissipation rate exceeds the energy density limit of the concrete material’s resistance (usually determined experimentally). Specific critical values can be determined from experimental data. When the actual strain energy density or energy dissipation rate exceeds these critical values, the concrete particles will crack.
From Equation (12), assuming that the main direction of vibration is the x-axis and σx is the total vibration stress, the instantaneous value of strain energy density U(t) is as follows:
where 1/σ02 is the mean square contribution of the vibration component.
The power density P(f) is the distribution of vibrational energy at frequency f, obtained by Fourier transform, which is related to the strain energy density according to the following equation:
where Z is the mechanical impedance of the vibration medium, consisting of three parts, namely inertial impedance, damping impedance, and stiffness impedance, and tunnel shield construction-induced vibration is mostly low-frequency vibration, wherein stiffness is dominant. The mechanical impedance is approximated as:
The frequency distribution of the strain energy density is directly related to the power density, and the coupling is realized through the medium impedance and the elastic modulus of the material, i.e., the vibration energy attenuation effect should be calculated with full consideration of its force state for simulation verification.
3. Monitoring Data Validation Analysis
3.1. Project Overview
The monitoring interval selected for the Jinan Metro Line 4 extends from Iiangshuiquan Road Station to Yanshan Overpass West Station. This interval line begins at Yanshan Overpass West Station, follows the 10th Road to the east with an underground alignment beneath the Yanshan Overpass, and connects to Yanshuiquan Road Station. The total length of the single-line interval is 1709.126 m, with a V-shaped longitudinal profile and a maximum longitudinal slope of 27‰. The tunnel depth ranges from 16.2 to 41.5 m, with line spacing varying between 11.0 and 36.5 m. A contact channel and a pumping station are established at the lowest point of the interval, along with an additional single contact channel.
The interval tunnel traverses strongly weathered amphibolite, moderately weathered amphibolite, and moderately weathered limestone. The mechanical properties of these lithologies are as follows:
Strongly weathered amphibolite: its compressive strength is 5030 MPa, with low wave velocity and high porosity, indicating a loose structure with relatively low tensile and shear strength.
Moderately weathered amphibolite: its compressive strength is approximately 8045 MPa, exhibiting a more compact structure with lower porosity and higher tensile and shear resistance.
Moderately weathered limestone: Its compressive strength is 10,060 MPa, demonstrating strong compressive properties. However, the abundance of calcium carbonate minerals makes it susceptible to water, acidic environments, and dissolution, which may compromise its long-term stability.
To ensure the safety and stability of the tunnel structure, construction must adopt appropriate support measures tailored to the varying lithologies encountered along the interval.
3.2. Monitoring Program
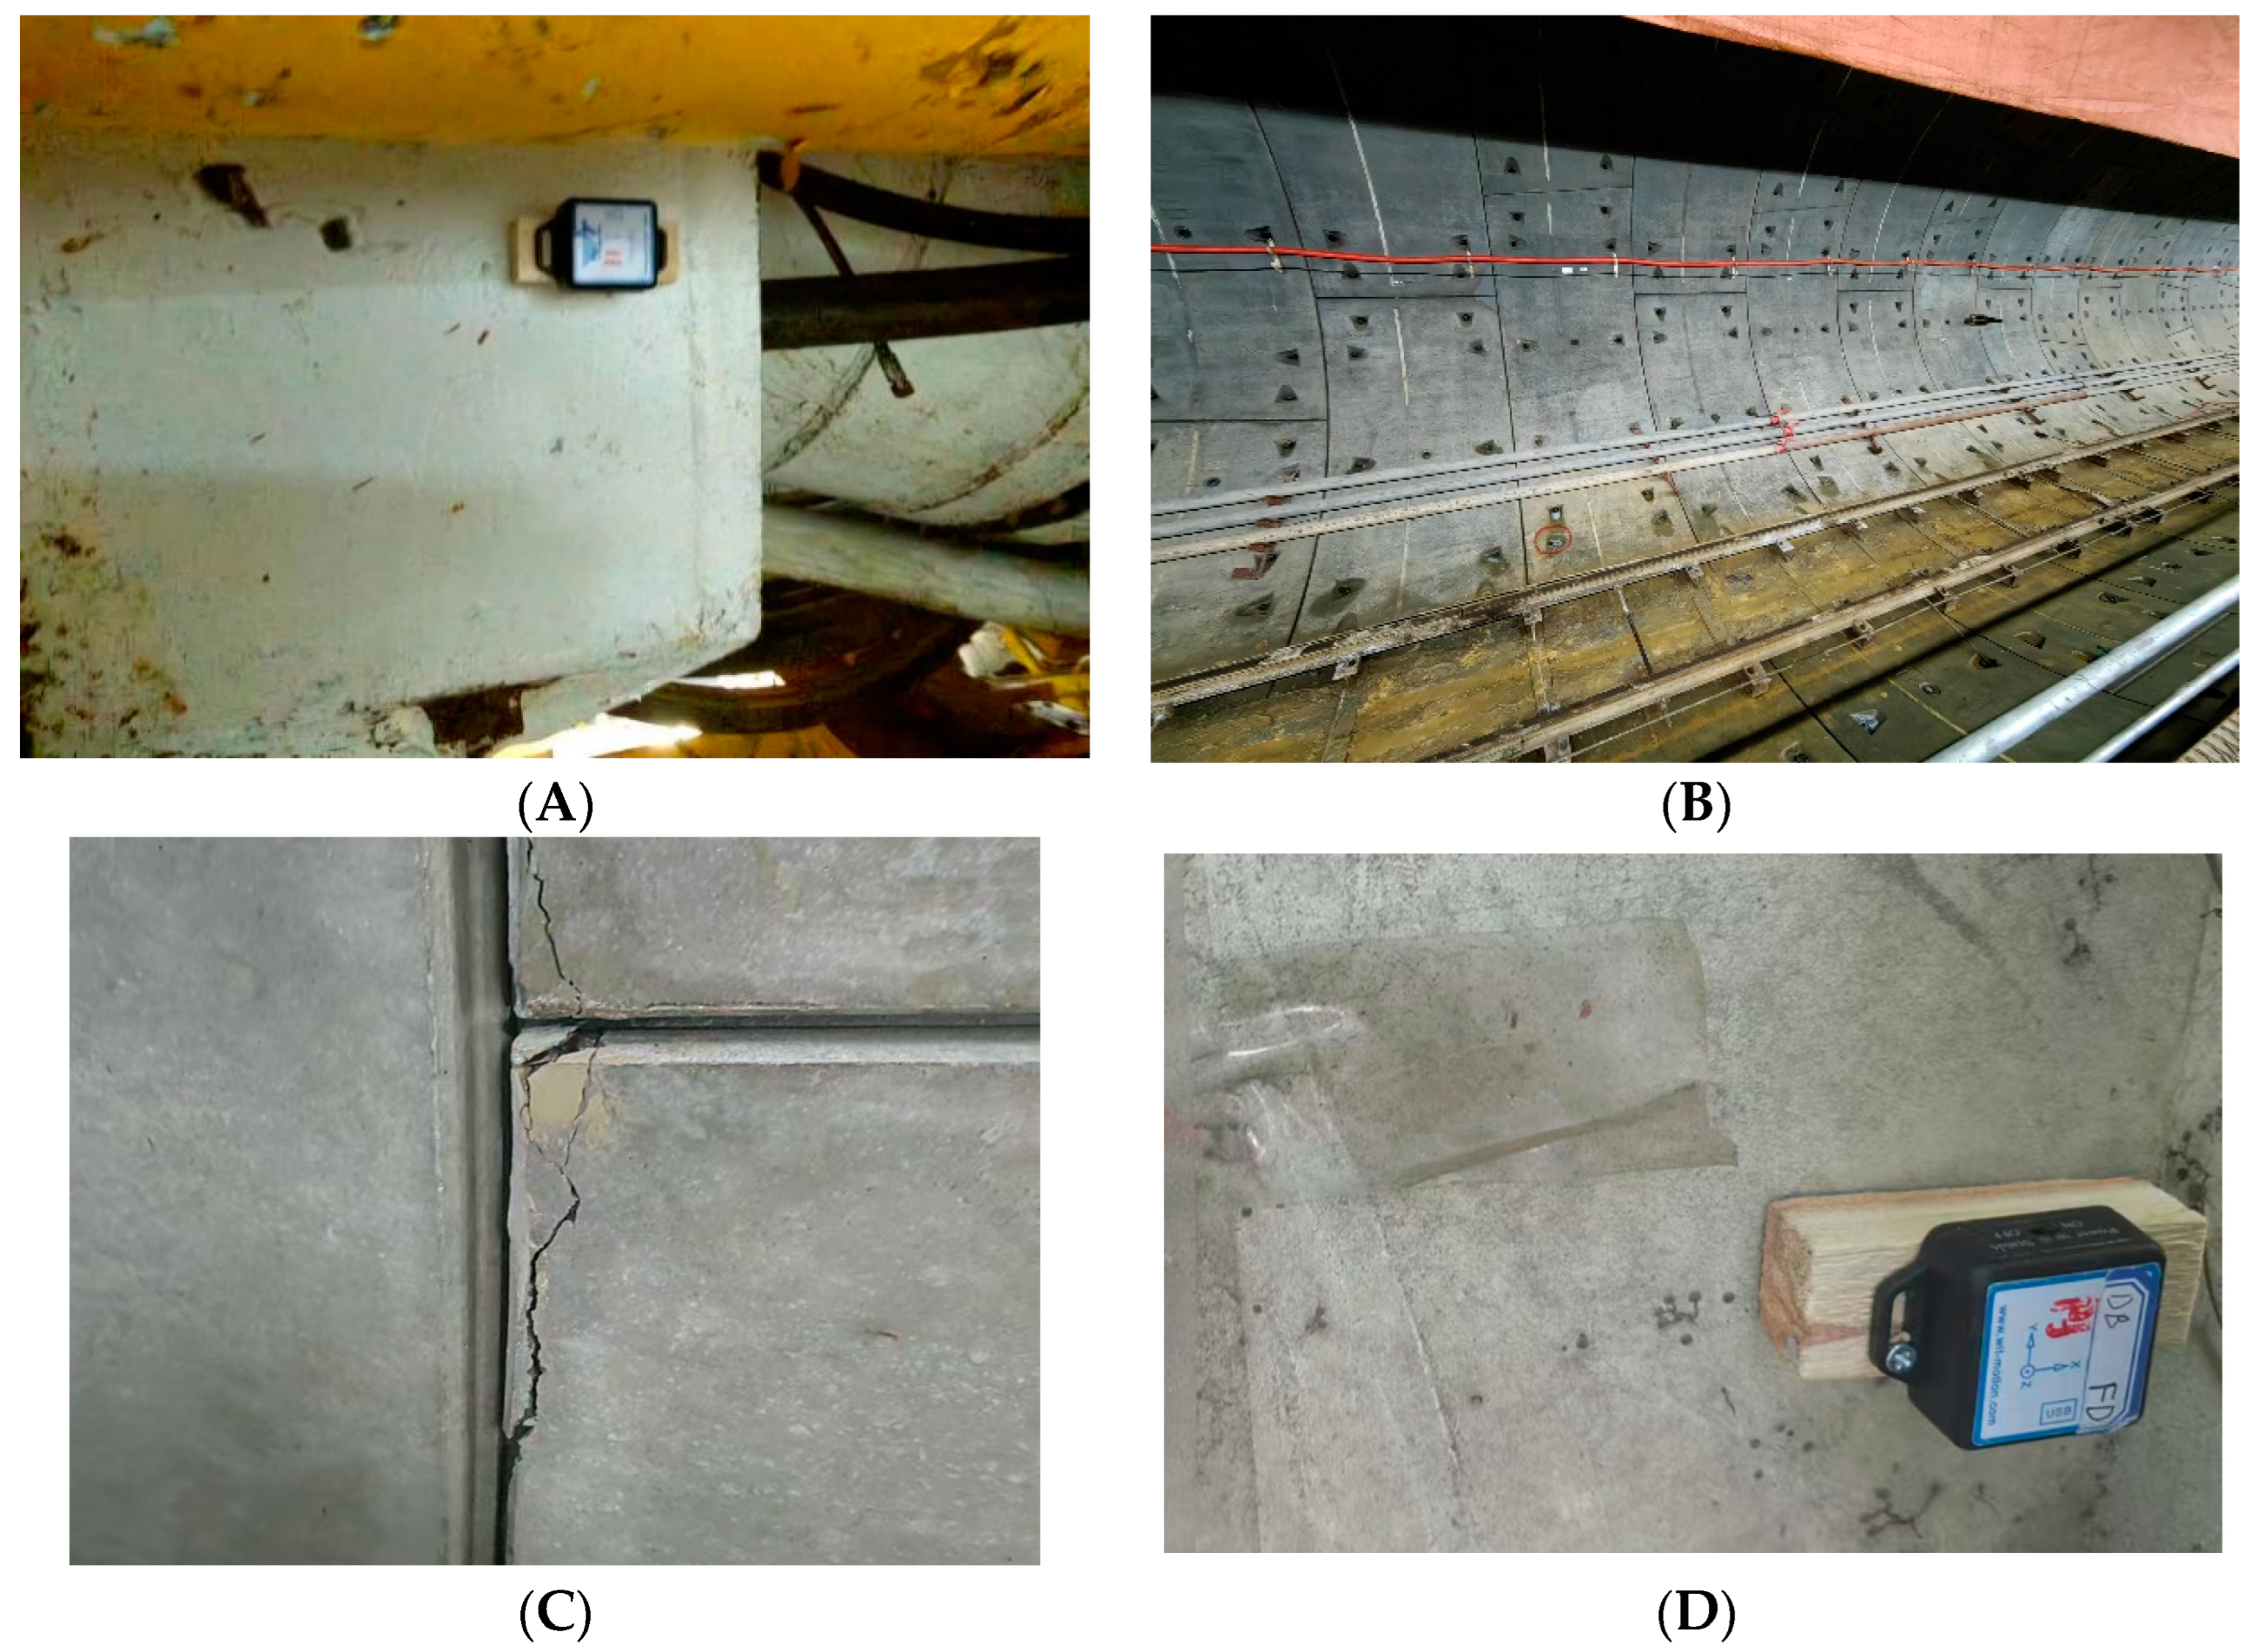
On-site monitoring was conducted on the existing neighboring tunnel, with sensors arranged at 1.5 m intervals to capture vibration data from the tunnel segments during shield construction. Additionally, two sensors were installed on either side of the shield machine chassis to monitor vibration data generated by the shield machine during construction. The sensor layout is illustrated in Figure 2.
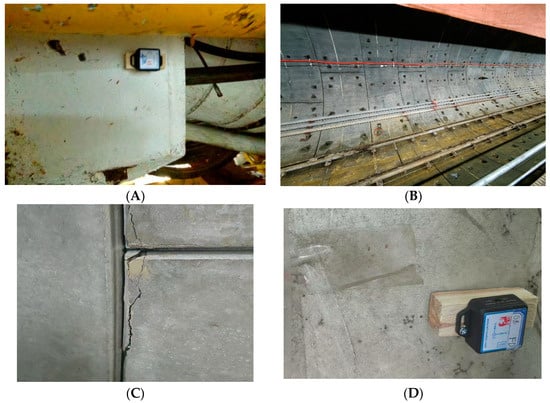
Figure 2.
Sensor monitoring arrangement diagram. (A) Sensors on the shield machine; (B) sensors arranged in the tunnel; (C) cracks in tunnel lining pipe sheet cracks; (D) sensors arranged adjacent to the tunnel side.
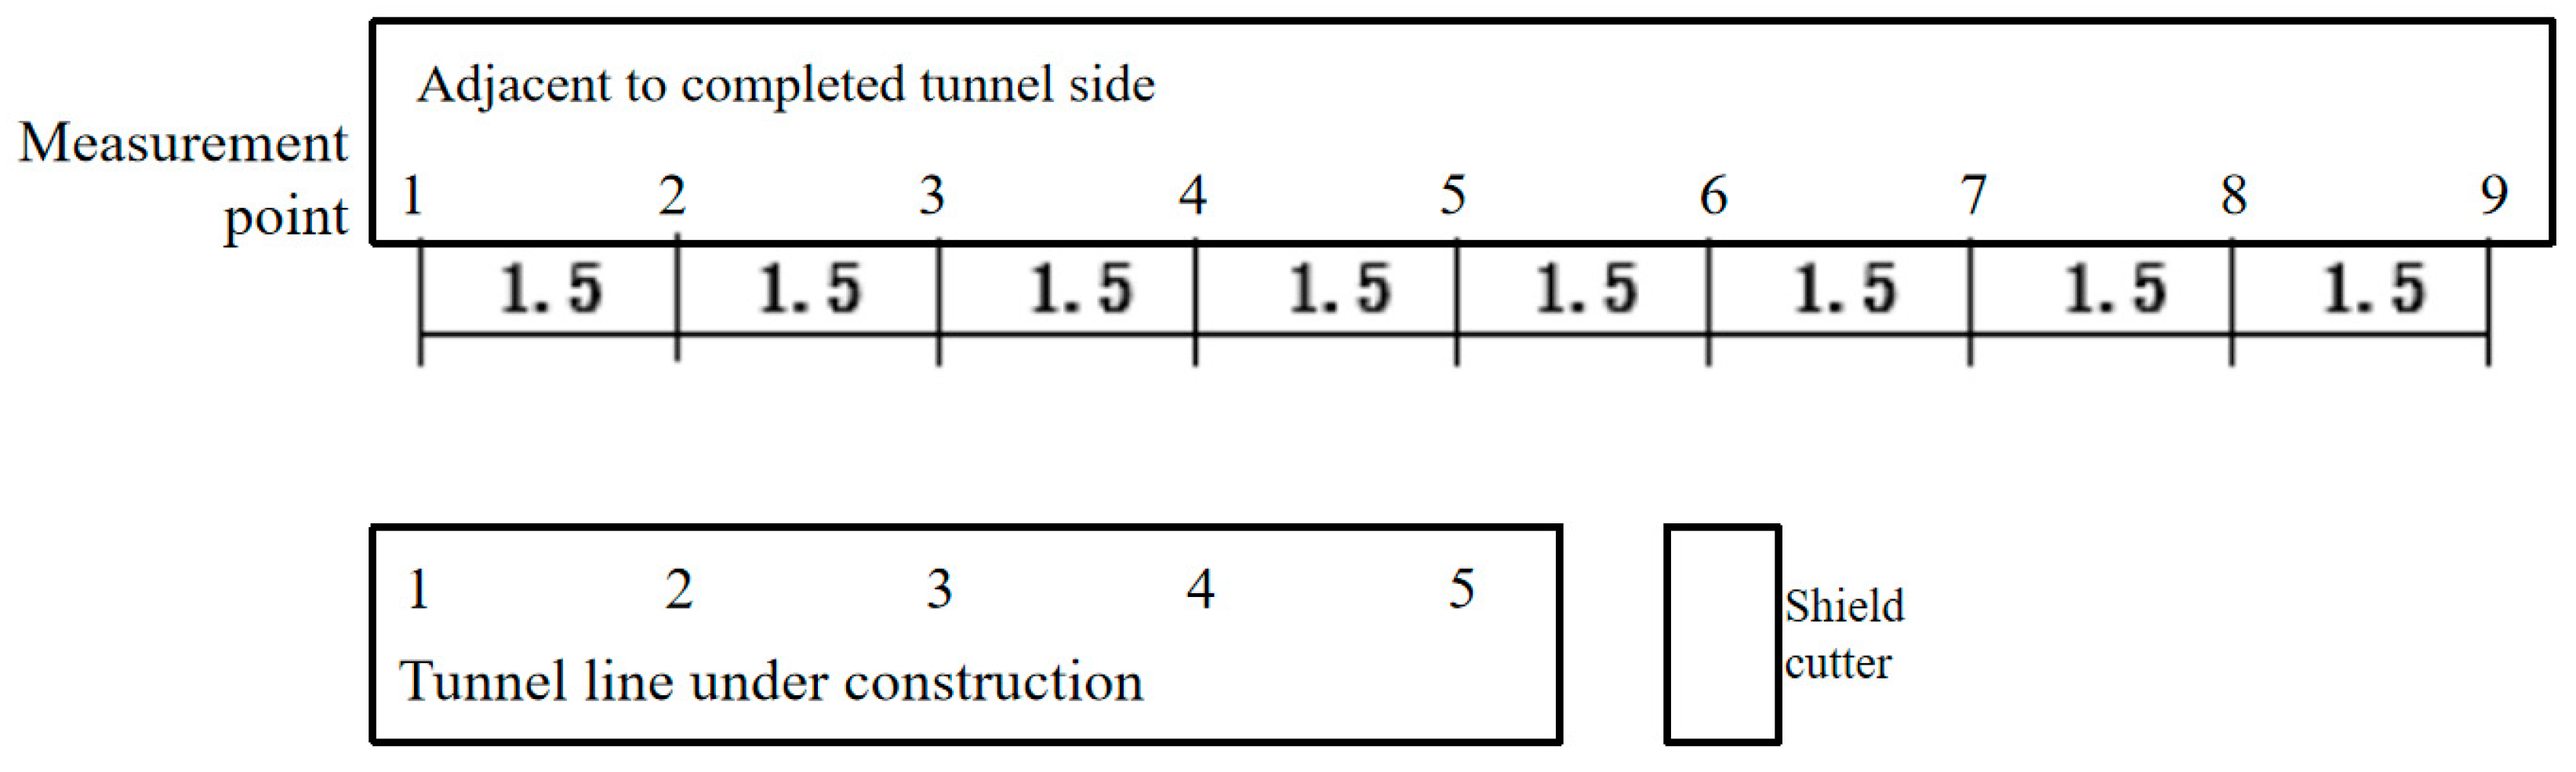
Monitoring points were set up on the segments behind the cutter, which were already lined and supported, to measure the acceleration of the segments at varying distances during excavation. Measurement points can be positioned at the top of the monitoring ring. The specific arrangement and the vibration response of neighboring tunnel lines are shown in Figure 3. The number of measurement points can be adjusted and increased as needed based on actual monitoring requirements.
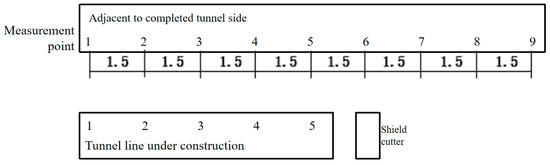
Figure 3.
Sketch of monitoring point layout.
Monitors carried computers and other connecting equipment into the tunnel to interface with sensors positioned in the construction area. Before the shield machine was worked, the monitoring equipment was initialized and activated to ensure it could capture all dynamic data from start-up through the operation of the shield machine. During operation, the sensors collected key parameters in real time, including vibration intensity, stress distribution, displacement changes, and other critical data, which were transmitted to the monitoring equipment for recording and storage. Monitoring activities concluded only after the shield machine was shut down to ensure that the collected data fully covered an entire operation cycle. This approach enabled a systematic and comprehensive analysis of the vibration characteristics generated during the shield construction process and their impact on surrounding structures, providing essential data to support construction safety and design optimization.
3.3. Monitoring Results
3.3.1. Analysis of Vibration Monitoring Results on the Construction Tunnel Side
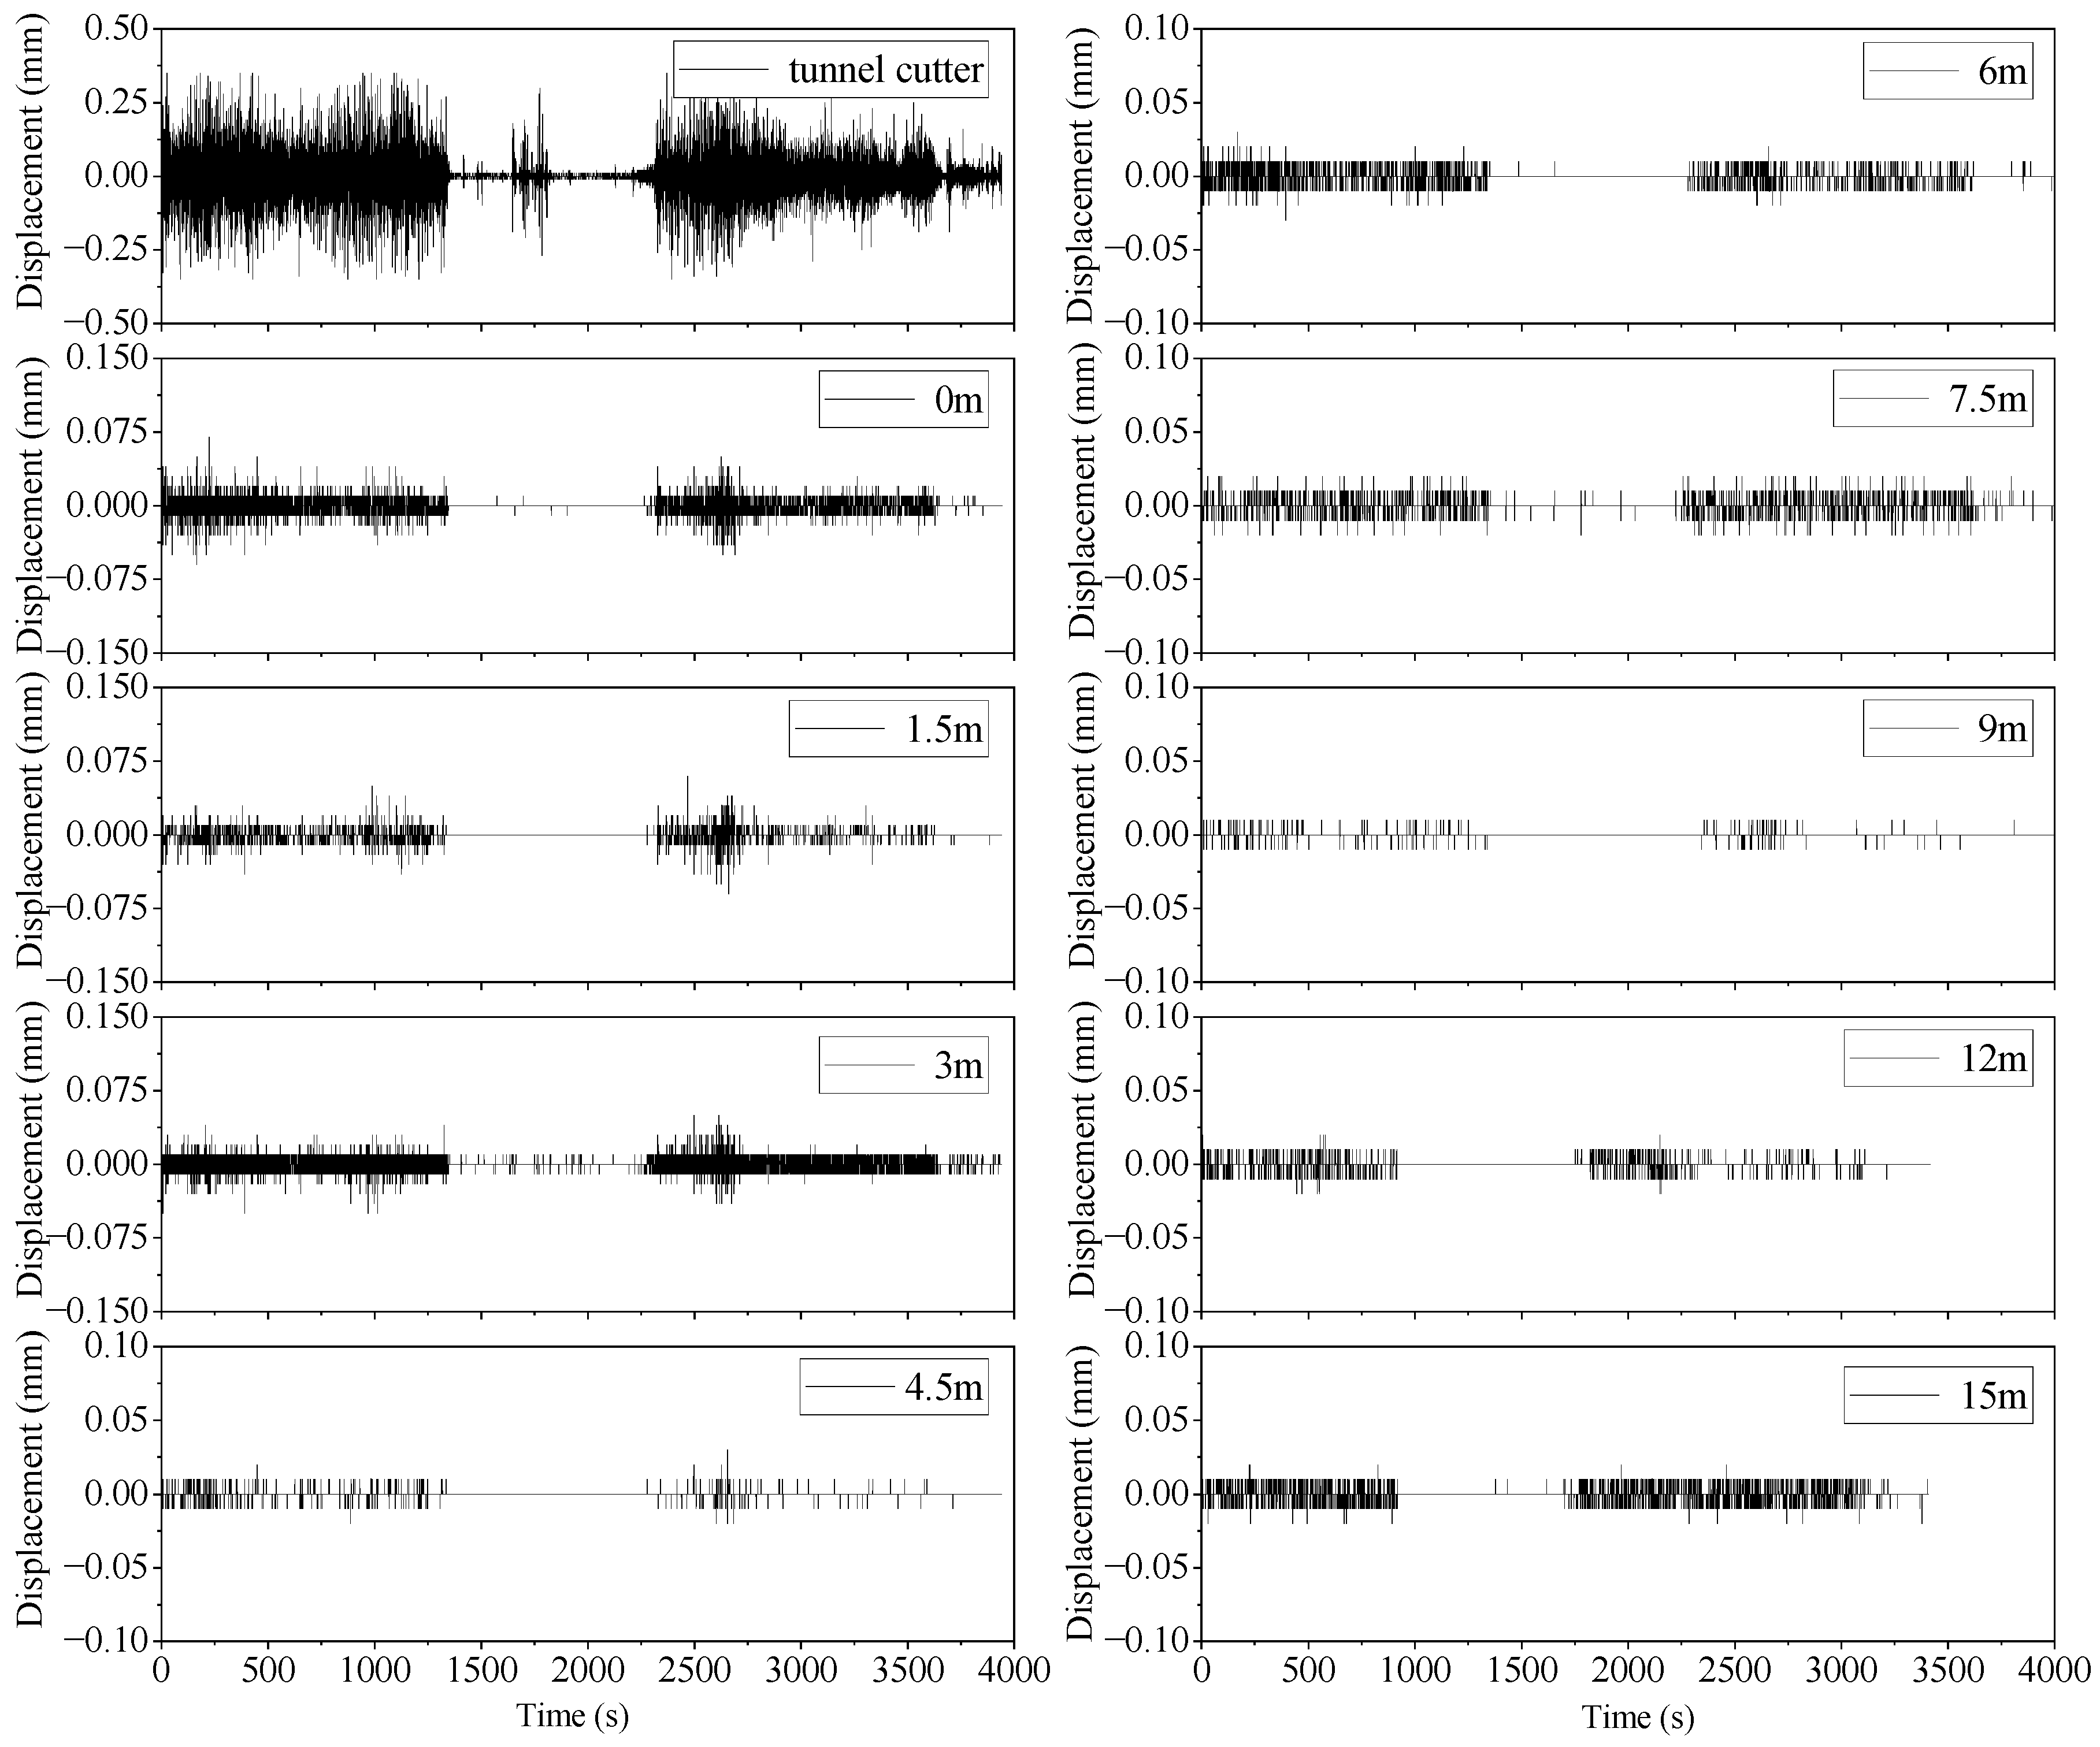
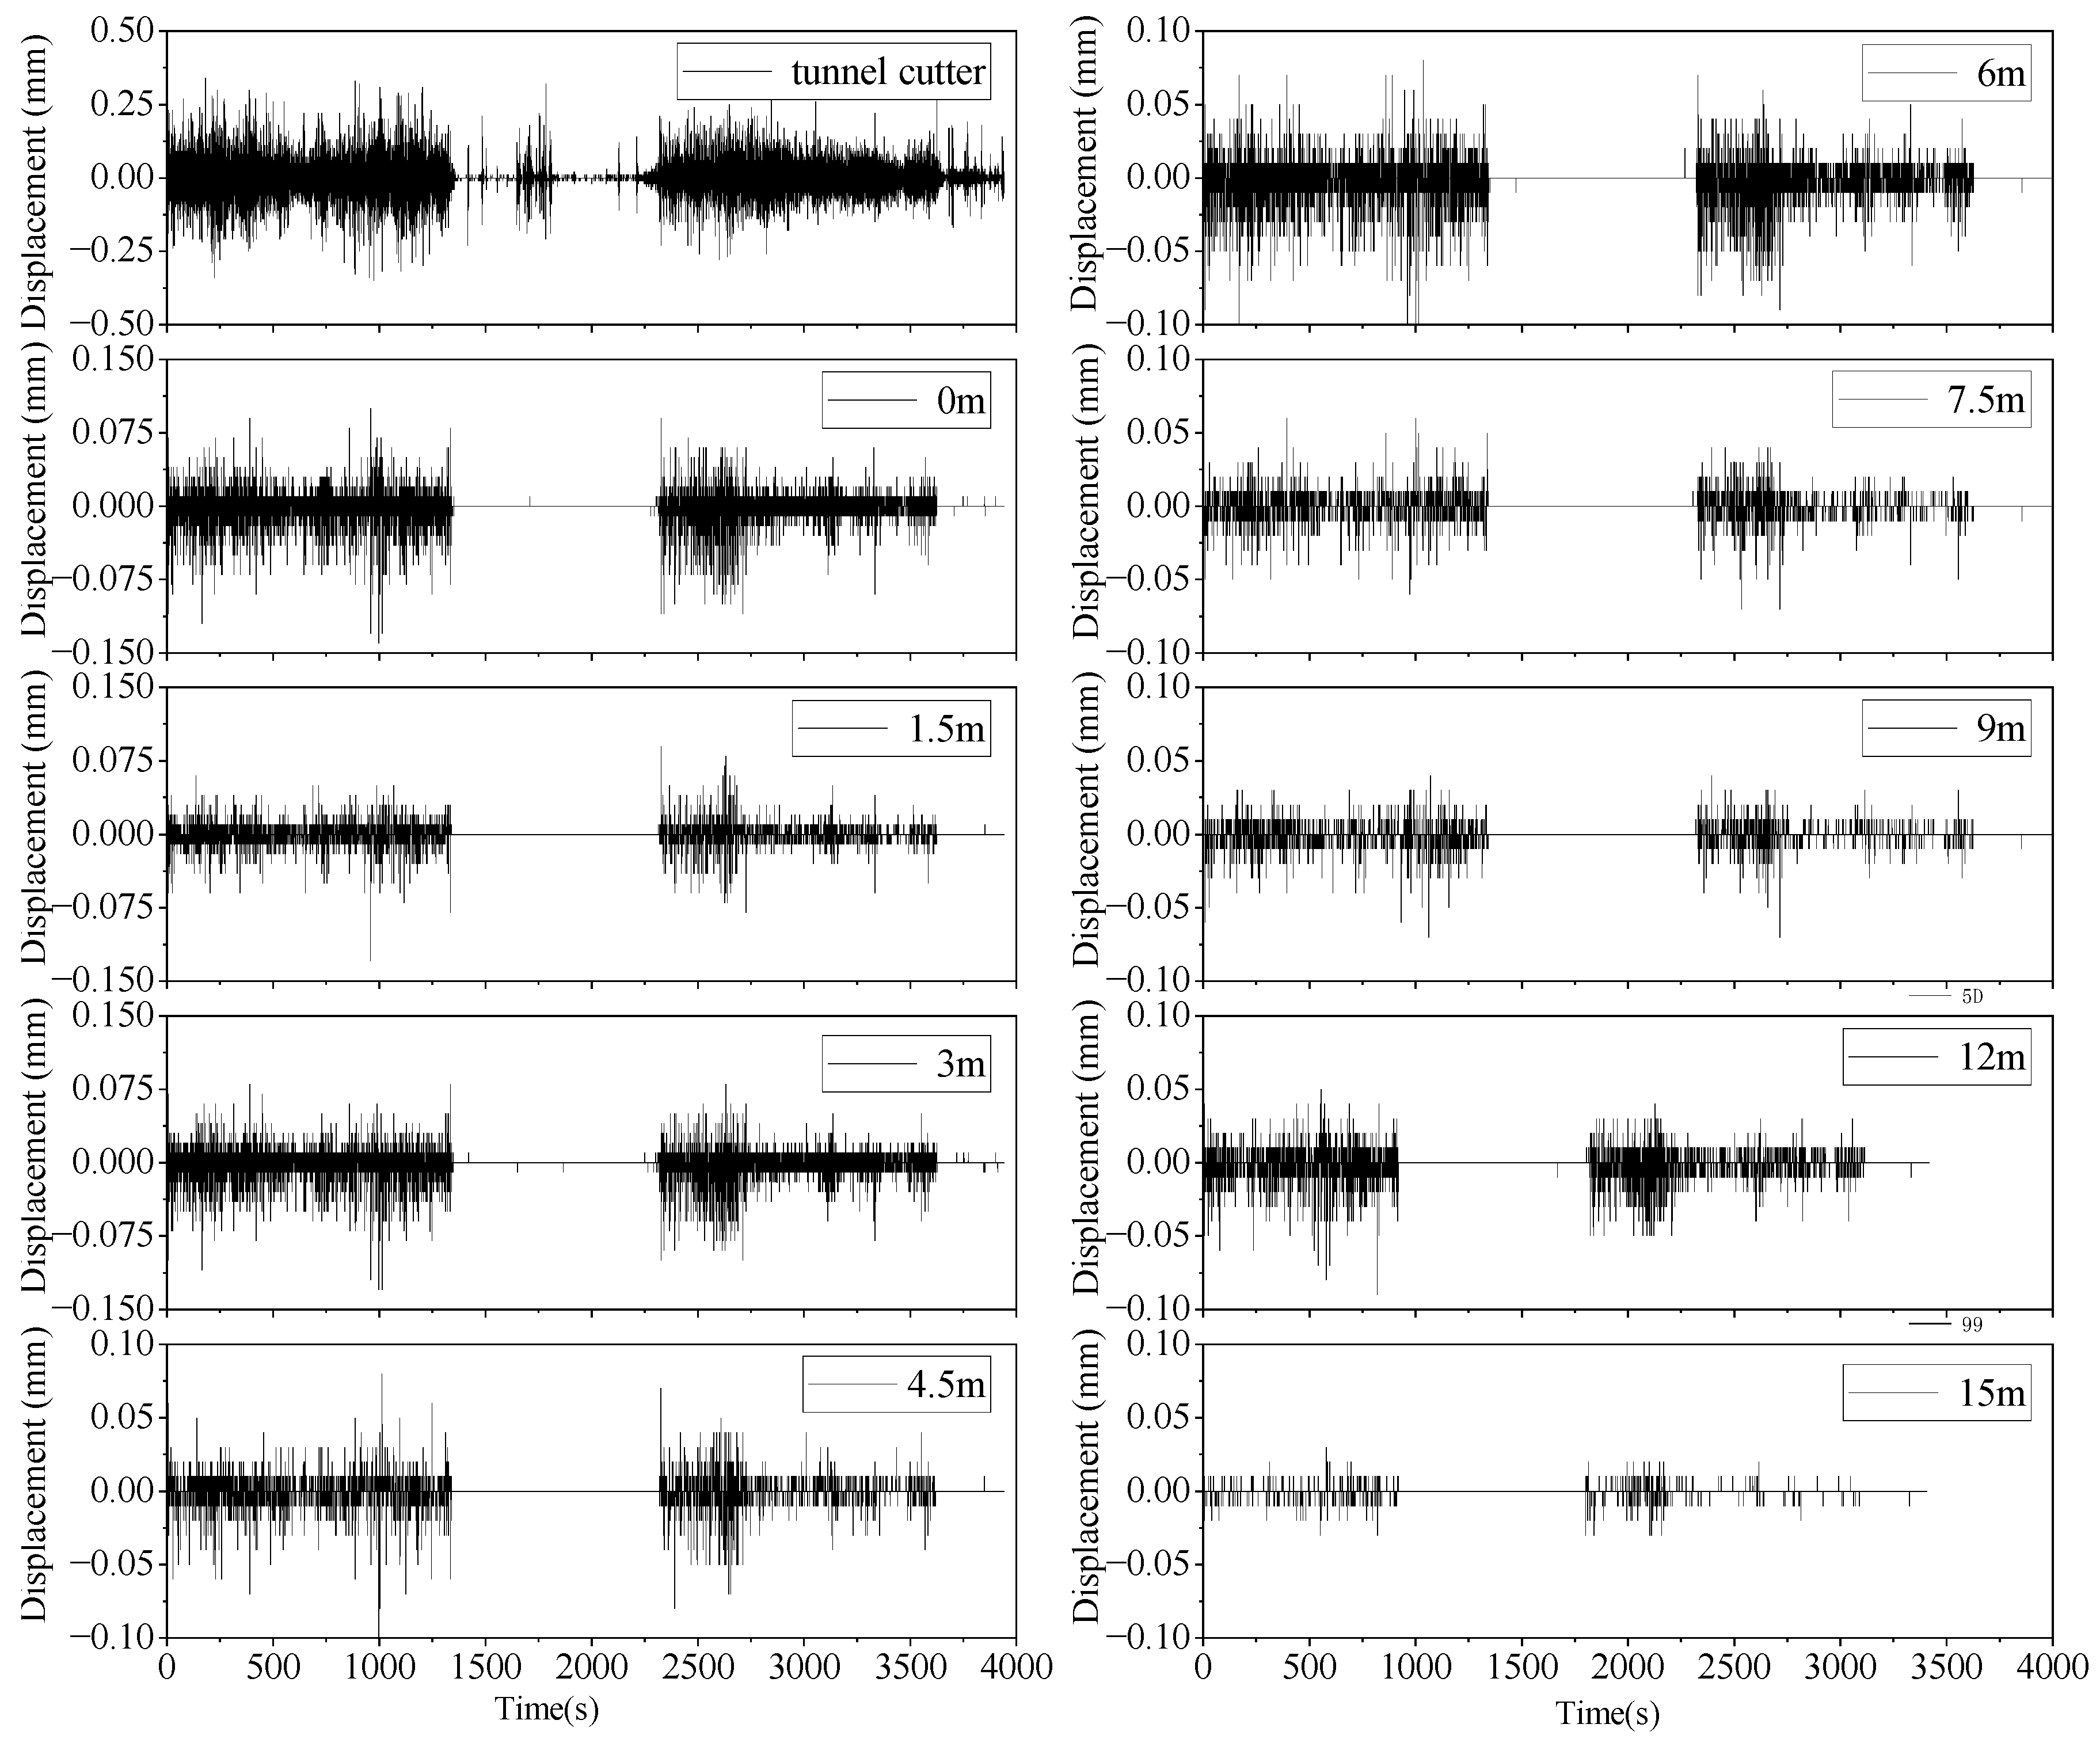
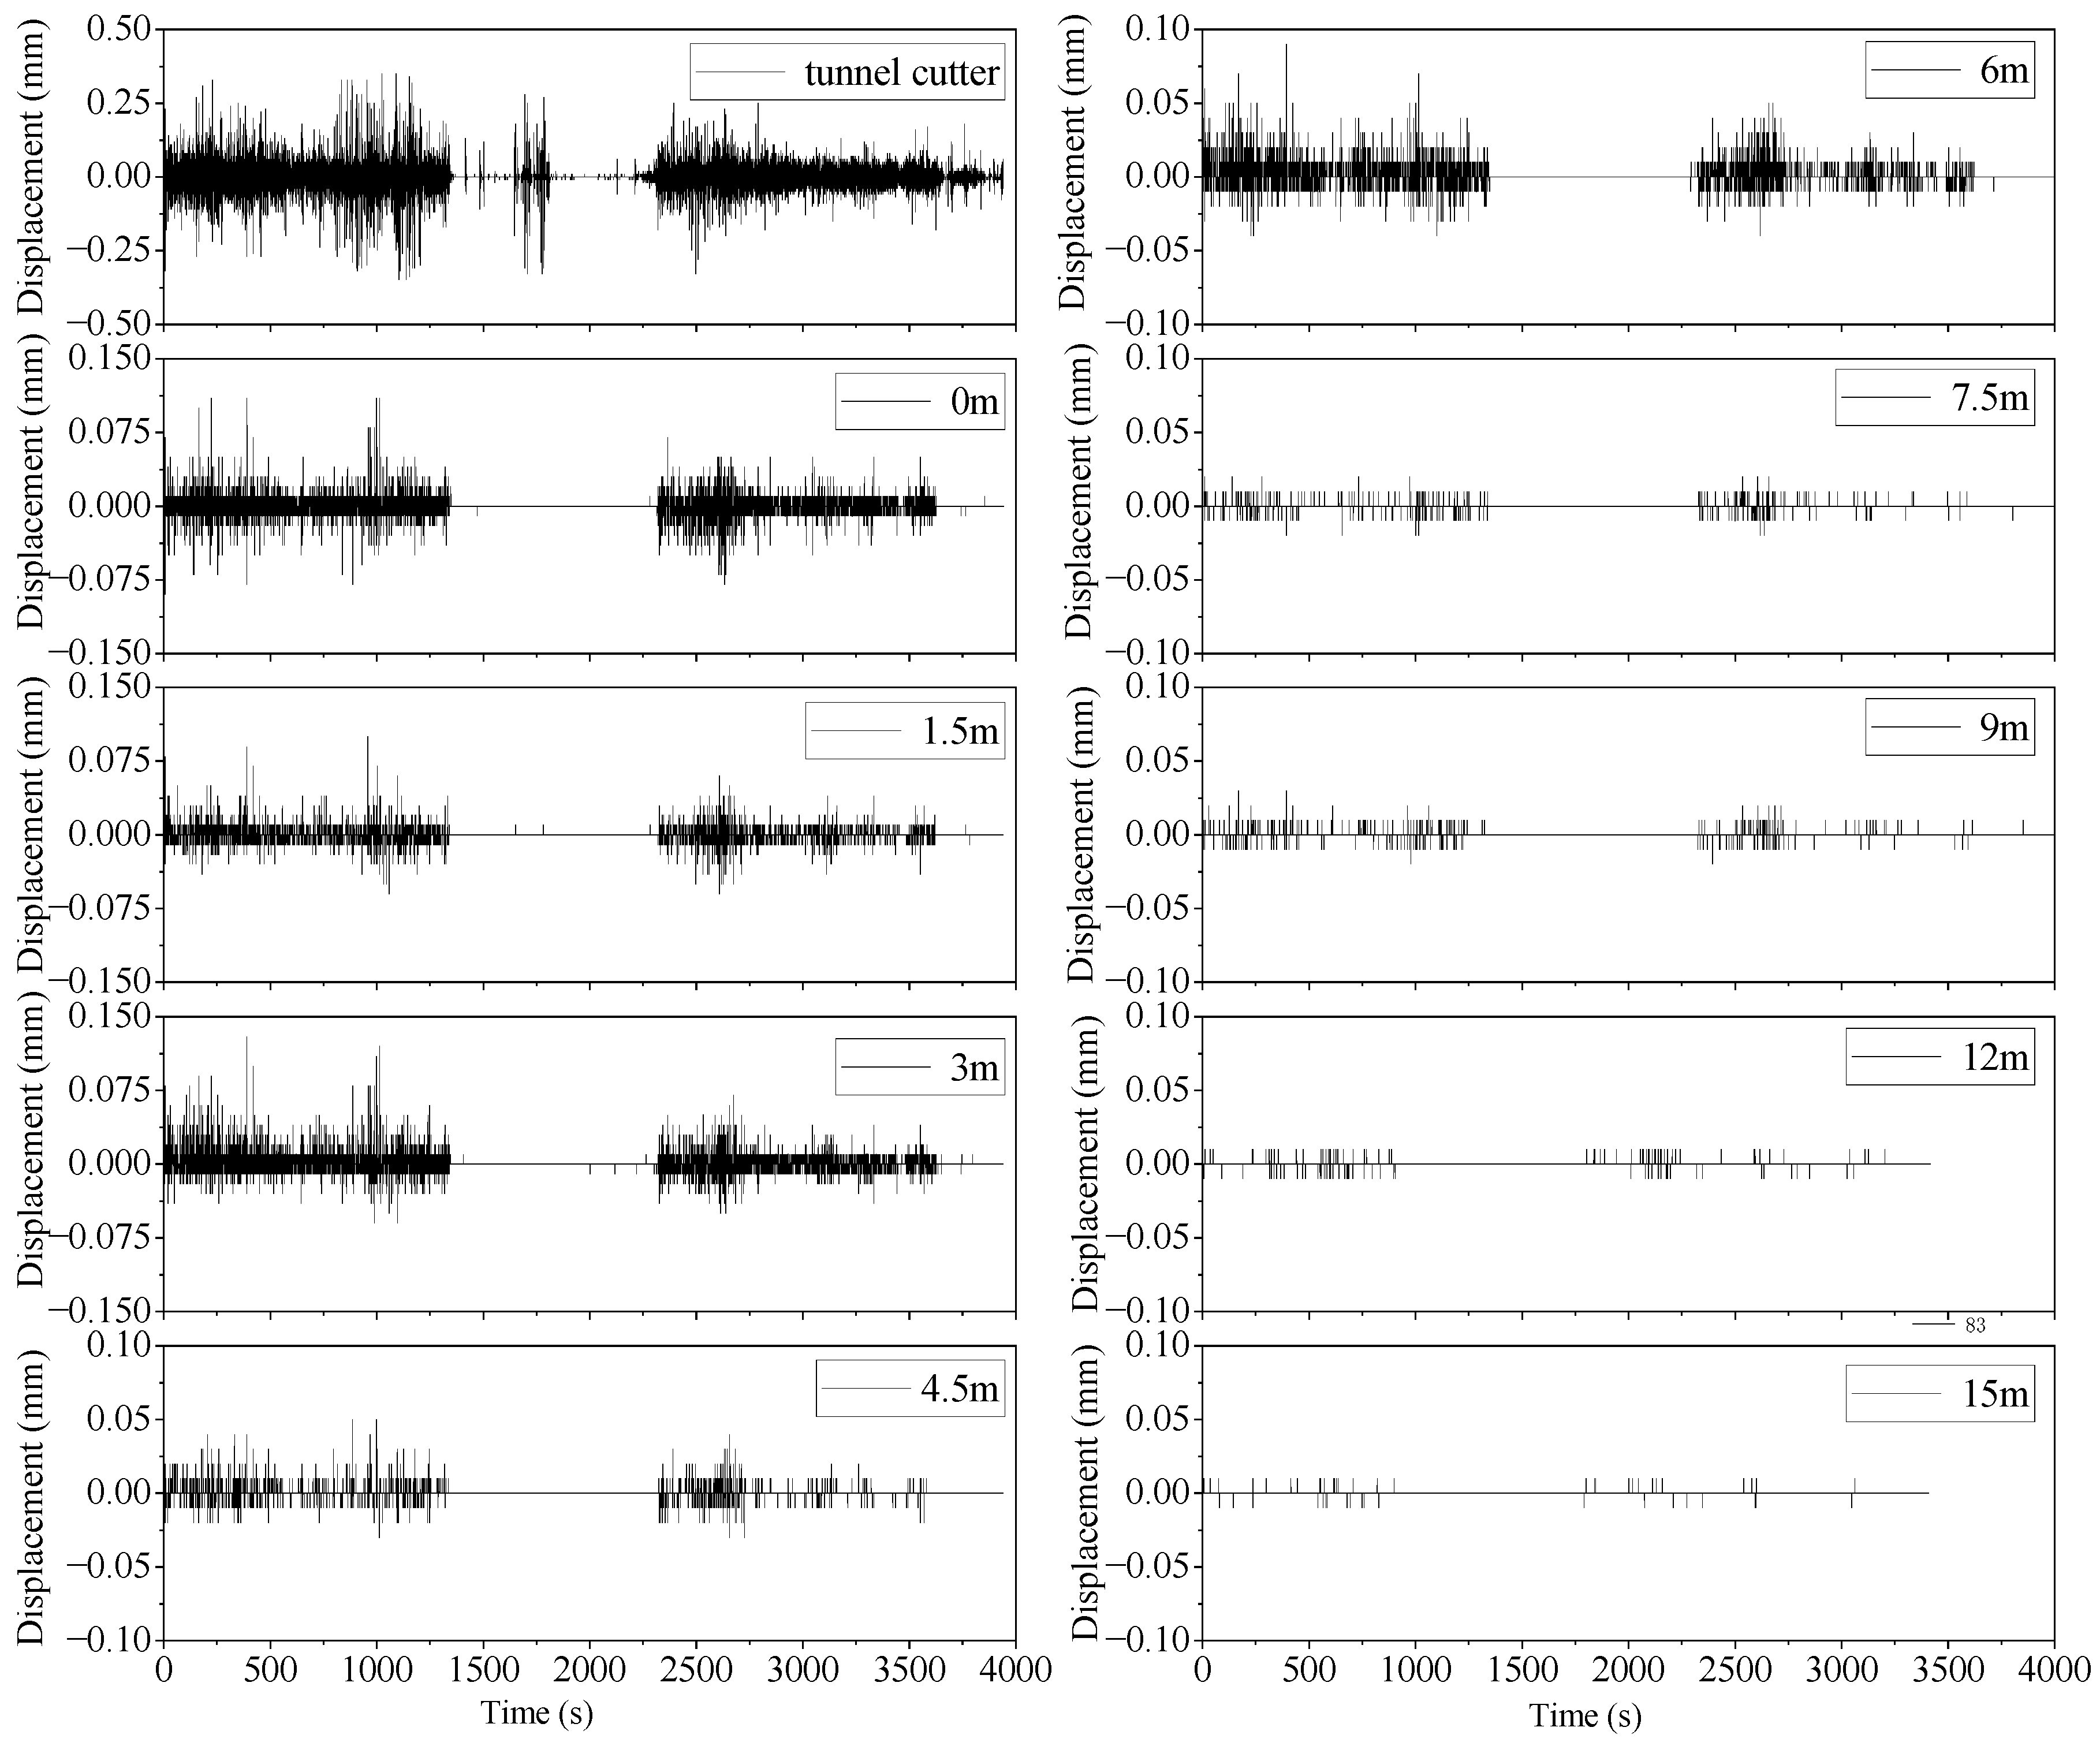
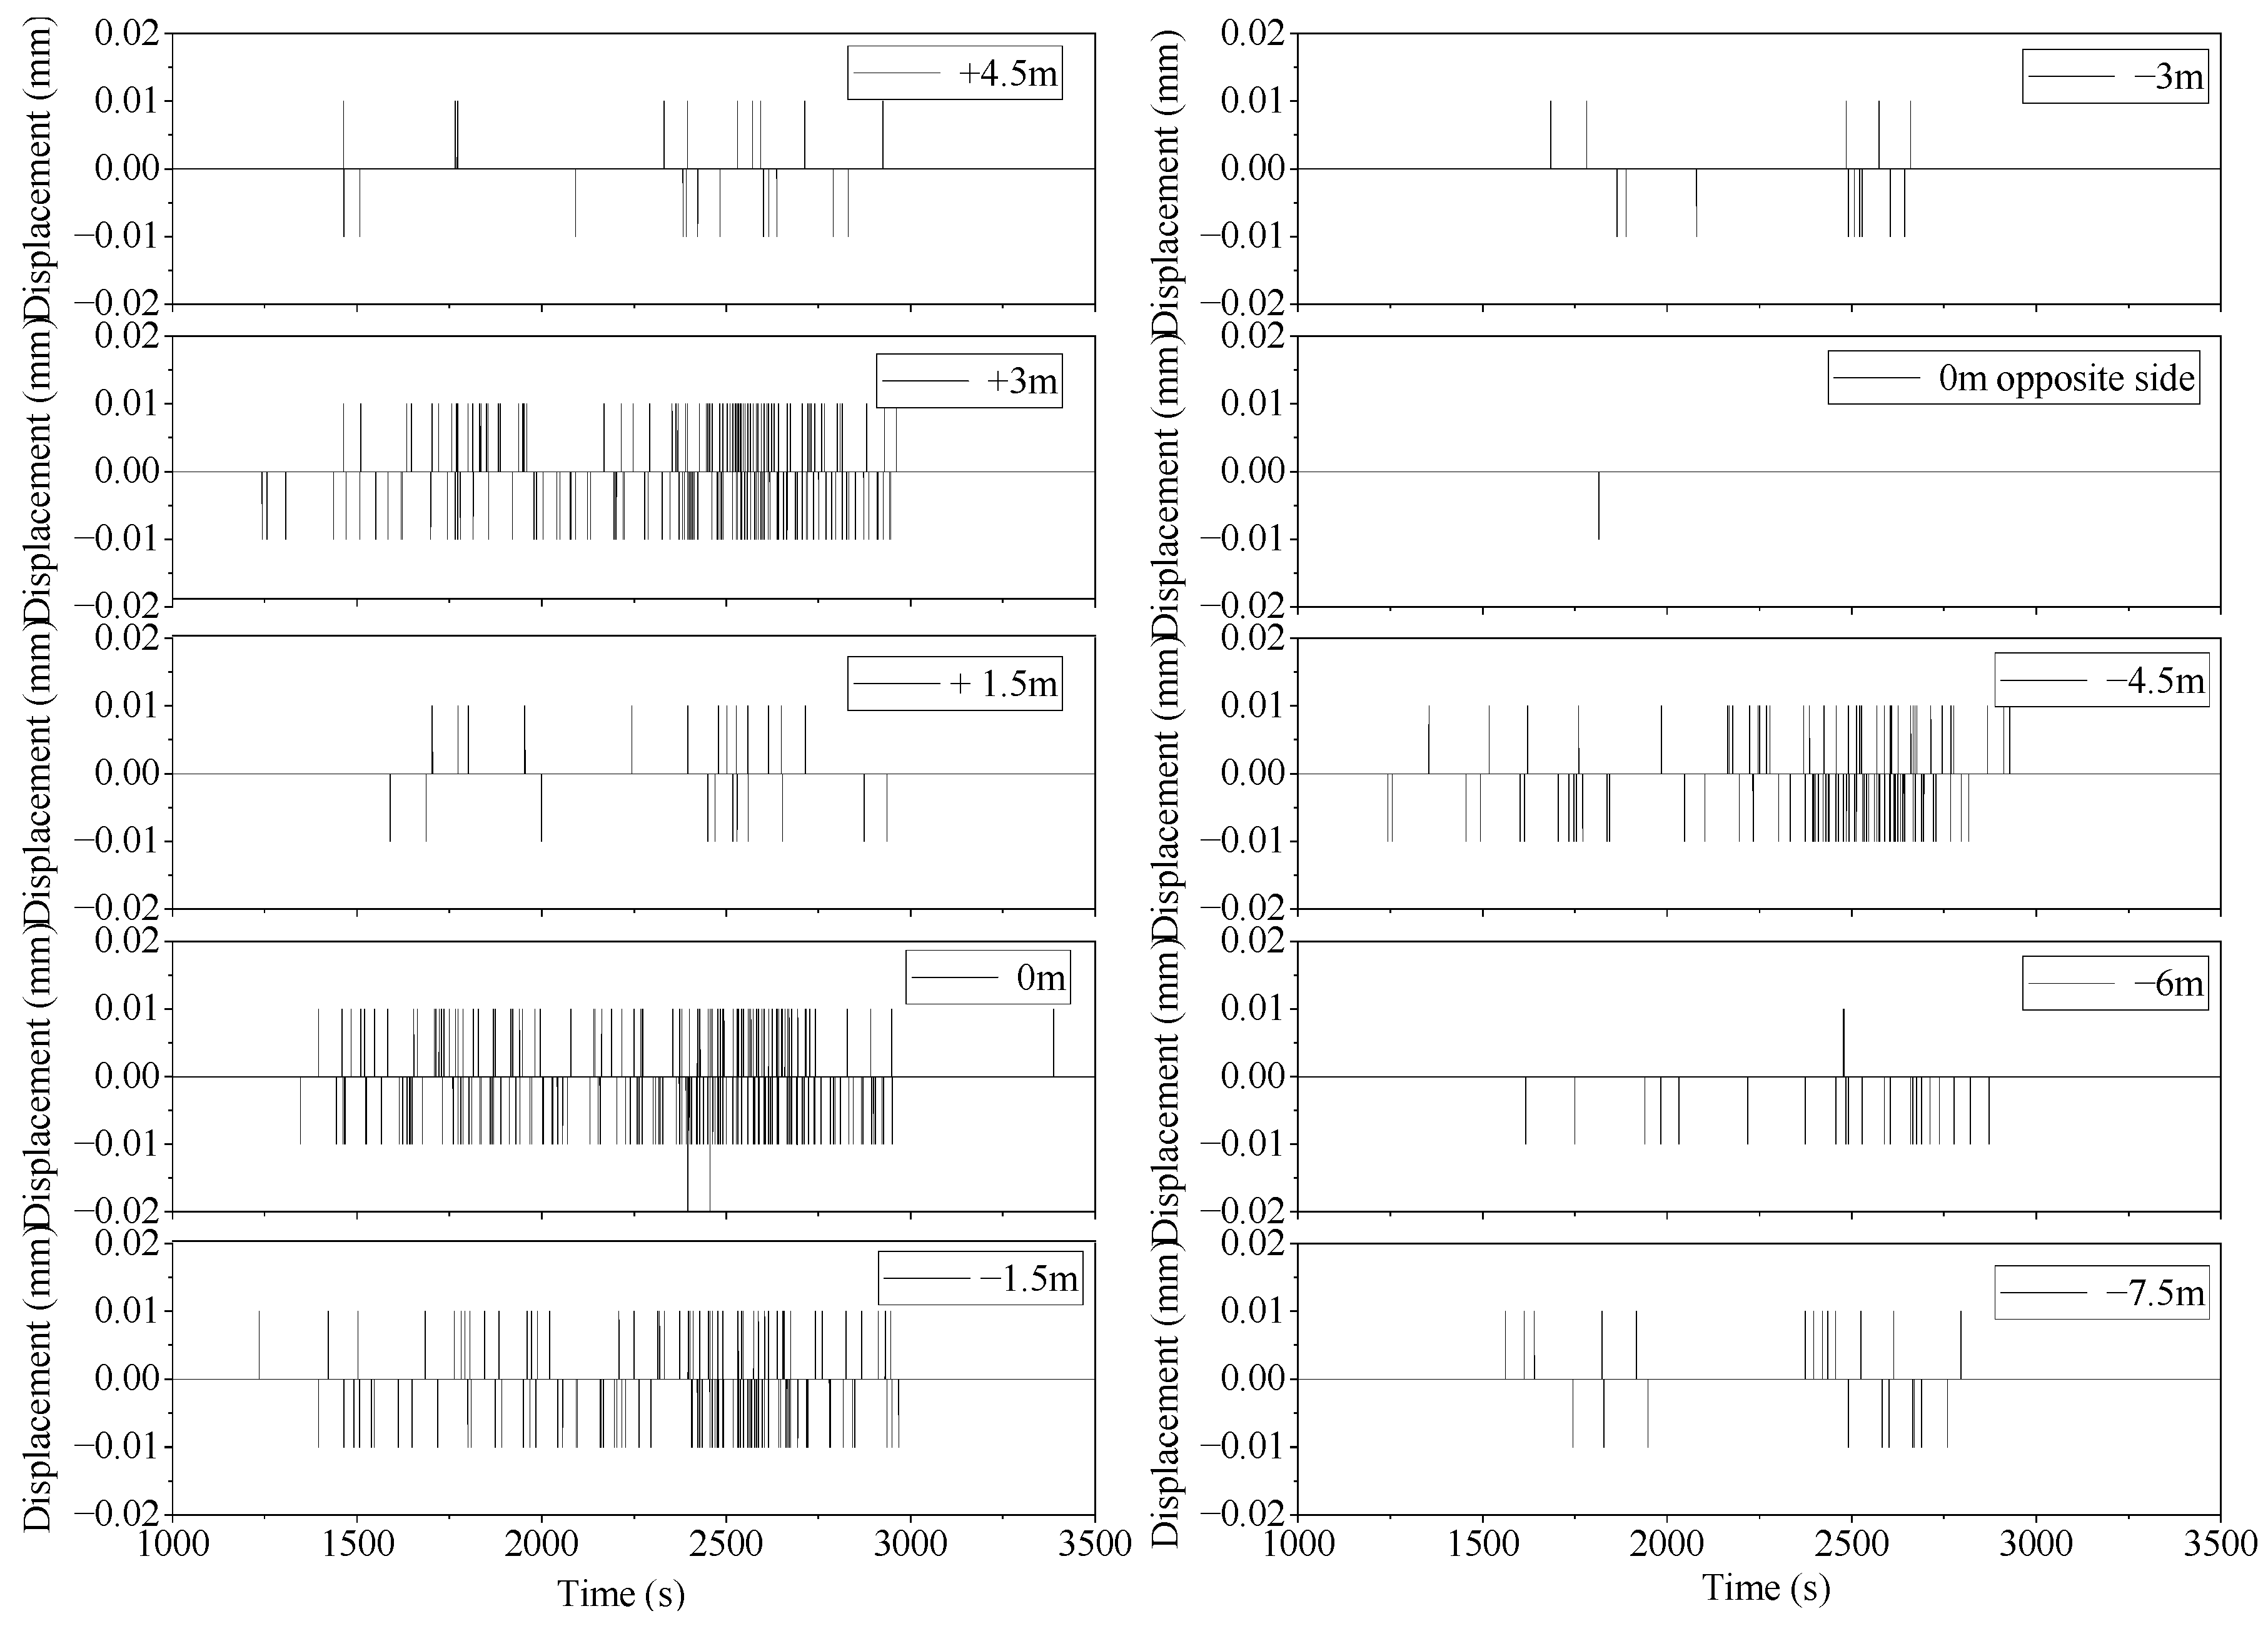
At the shield construction site, 10 sensors were installed along the construction-side tunnel to monitor vibration responses. One sensor was positioned at the head of the shield machine to serve as the reference point for the vibration source. The remaining seven sensors were placed along the tunneling line at 1.5 m intervals, corresponding to the length of the pipe segments, covering the area from 0 m to 9 m. The 0 m position, located adjacent to the shield chassis, corresponds to the most recently assembled pipe segment ring. Additionally, because the vibration response becomes weaker beyond 10 m, the final two sensors were positioned at 12 m and 15 m to ensure data integrity and comparability. This sensor arrangement enables a more comprehensive reflection of the propagation characteristics of vibrations at different axial distances. The vibration displacements of the vibration source and each monitoring point in the radial, axial, and gravitational directions of the tunnel are shown in Figure 4, Figure 5, and Figure 6, respectively.
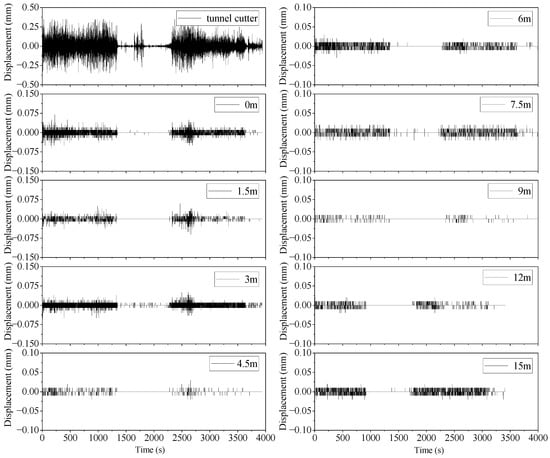
Figure 4.
Vibration displacement in the radial direction of the tunnel.
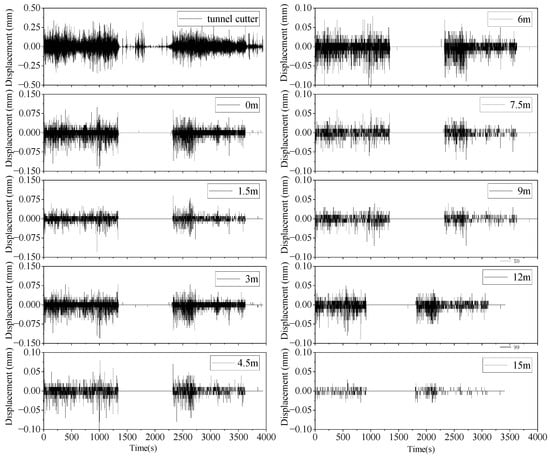
Figure 5.
Tunnel axial vibration displacement.
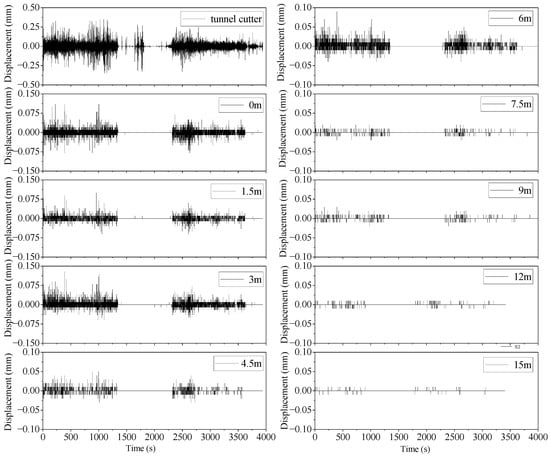
Figure 6.
Vibration displacement in the direction of gravity.
As shown in Figure 4, the shield cutter exhibited the most significant vibration characteristics during the construction process. Specifically, the peak vibration displacement in the radial direction of the tunnel at the cutter head (i.e., pointing toward the tunnel center) reached 0.4 mm, significantly higher than the vibration levels observed at other locations. This indicates that the cutter head was the most intense vibration area throughout the construction process. This strong vibration primarily originated from the substantial thrust force generated by the shield machine during advancement and the impact force of cutting the soil, with particularly pronounced vibrations during startup and steering.
In contrast, the segment at the 0 m position (i.e., the first section of the lined segment immediately adjacent to the cutter head) exhibited a smaller radial vibration displacement of 0.07 mm. This suggests that, although the vibration at the cutter head was intense, its effect diminished rapidly over a short distance. As the shield machine advanced, vibration energy was gradually transferred to subsequent segments; however, the vibration amplitude decreased sharply due to the increasing distance and the damping effect of the segment structure.
By the fourth lined segment (located at 4.5 m), the radial vibration displacement of the tunnel had significantly reduced, with a peak value not exceeding 0.03 mm. This indicates that as distance increases, vibration energy is progressively absorbed and attenuated during propagation, with the damping effect of the segment structure playing a crucial role. At the 9 m position, the vibration displacement in the radial direction further diminished to 0.01 mm, which is almost negligible. This demonstrates that the vibration impact effectively dissipated within approximately 9 m behind the cutter head, confirming that the vibration impact of the shield construction on the surrounding environment was well controlled.
As shown in Figure 5, the vibration displacement in the axial direction of the tunnel is significantly larger than that in the gravity direction. This phenomenon highlights the unique nature of vibration propagation during shield machine construction. Specifically, the shield cutter exhibits the most prominent vibration characteristics in the tunnel’s axial direction, with a peak vibration displacement reaching 0.4 mm, much higher than the vibration levels at other locations. This suggests that the axial thrust force generated by the shield machine during its advancement, along with the impact force during soil cutting, not only creates a strong vibration source at the head but also facilitates strong vibration propagation along the tunnel axis.
In contrast, the segment located at 0 m (the first section of lined segment immediately adjacent to the shield’s nose) experiences a vibration displacement of 0.15 mm in the axial direction, which, although lower than at the nose, remains at a high level. This indicates that, despite being just one step away from the nose, the pipe sheet structure has not fully mitigated the vibration, and the vibration energy is still transmitted relatively strongly to the first ring of pipe sheets.
As the shield progresses further to the fourth lined segment (at 4.5 m), the axial vibration displacement remains as high as 0.1 mm, demonstrating the strong persistence and propagation capacity of the vibration along the tunnel axis. Even at distances beyond 9 m, the axial vibration displacement decreases to less than 0.05 mm, suggesting that the vibration energy maintains a certain level of intensity over longer distances. In contrast, the vibration displacement in the gravity direction has significantly decreased at the same locations, further confirming the distinctiveness and persistence of axial tunnel vibrations.
As shown in Figure 6, the shield machine cutter plate exhibits the most significant vibration in the gravity direction (i.e., the vertical direction), with a peak vibration displacement reaching as high as 0.4 mm. This phenomenon highlights the strong vibrations generated by the shield machine during the propulsion process, especially during startup and steering, when the impact force of the cutter cutting through the soil and the propulsion system result in substantial vibration energy. This intense vibration not only affects the shield machine itself but also propagates through the mechanical structure to the neighboring segments.
Specifically, the segment located at 0 m (the first ring of segments immediately adjacent to the shield nose) experiences a vibration displacement of 0.13 mm in the gravity direction. While weaker than at the cutter plate, this value remains significant, indicating that vibration energy is still strongly transmitted to the segment even when only one step away from the cutter plate. This may be due to the close connection between the segment and the shield, allowing the rapid transfer of vibration energy, while the segment structure has not yet fully utilized its damping effect.
As the shield advances to the fourth ring of pipe sheets (at 4.5 m), the vibration displacement in the gravity direction decreases significantly, with a peak value no greater than 0.05 mm. This indicates that the vibration energy is progressively absorbed and attenuated as it propagates over distance. The damping effect of the segment structure begins to manifest, particularly in the axial and radial directions. Factors such as the connection method between the segments, their material properties, and thickness all contribute to the effective reduction in vibration transmission. Additionally, the soil medium absorbs part of the vibration energy, further diminishing the impact of the vibration.
By the time the pipe sheet reaches 9 m, the vibration displacement in the gravity direction decreases further to 0.02 mm, which is nearly negligible. This indicates that the vibration impact has essentially disappeared within about 9 m behind the shield cutter, and the shield construction’s impact on the surrounding environment has been effectively controlled. Notably, vibration signals collected at a distance of 15 m are extremely sparse, indicating that the vibration energy has almost completely dissipated at this distance and no longer significantly affects the surrounding environment.
Comparing Figure 4, Figure 5 and Figure 6 reveals that the vibration displacement on the construction-side tunnel lining segment is greatest in the tunnel’s axial direction, followed by the radial direction, and is smallest in the vertical direction. This pattern indicates that the primary vibration response of the construction-side tunnel arises from the shield machine’s thrust force transmitted through the excavation face to the tunnel lining segments. Consequently, the data along the axial direction are more pronounced.
This phenomenon can be attributed to the mechanical characteristics of shield tunneling construction. The thrust force generated by the shield machine jacks primarily propagates along the tunnel axis, resulting in significant energy concentration in this direction. Radial and vertical vibrations, while present, are secondary and typically exhibit lower amplitudes due to energy dispersion and damping effects. The axial dominance underscores the critical role of shield machine parameters—such as uniformity of thrust force and the alignment of jacking operations—in controlling vibration intensity.
Additionally, the directional distribution of vibration responses highlights the need for differentiated control strategies. For the construction-side tunnel, mitigating axial vibration requires optimizing shield machine operations, including thrust force control, cutterhead rotation speed, and soil conditioning. Enhancing the stability of the tunnel lining segments through improved segment reinforcement and material selection can further reduce the transmission of vibration energy along the axial direction.
These findings emphasize the importance of tailoring vibration mitigation measures to the specific characteristics of the construction-side tunnel, thereby improving the overall effectiveness of vibration control strategies in shield tunneling construction.
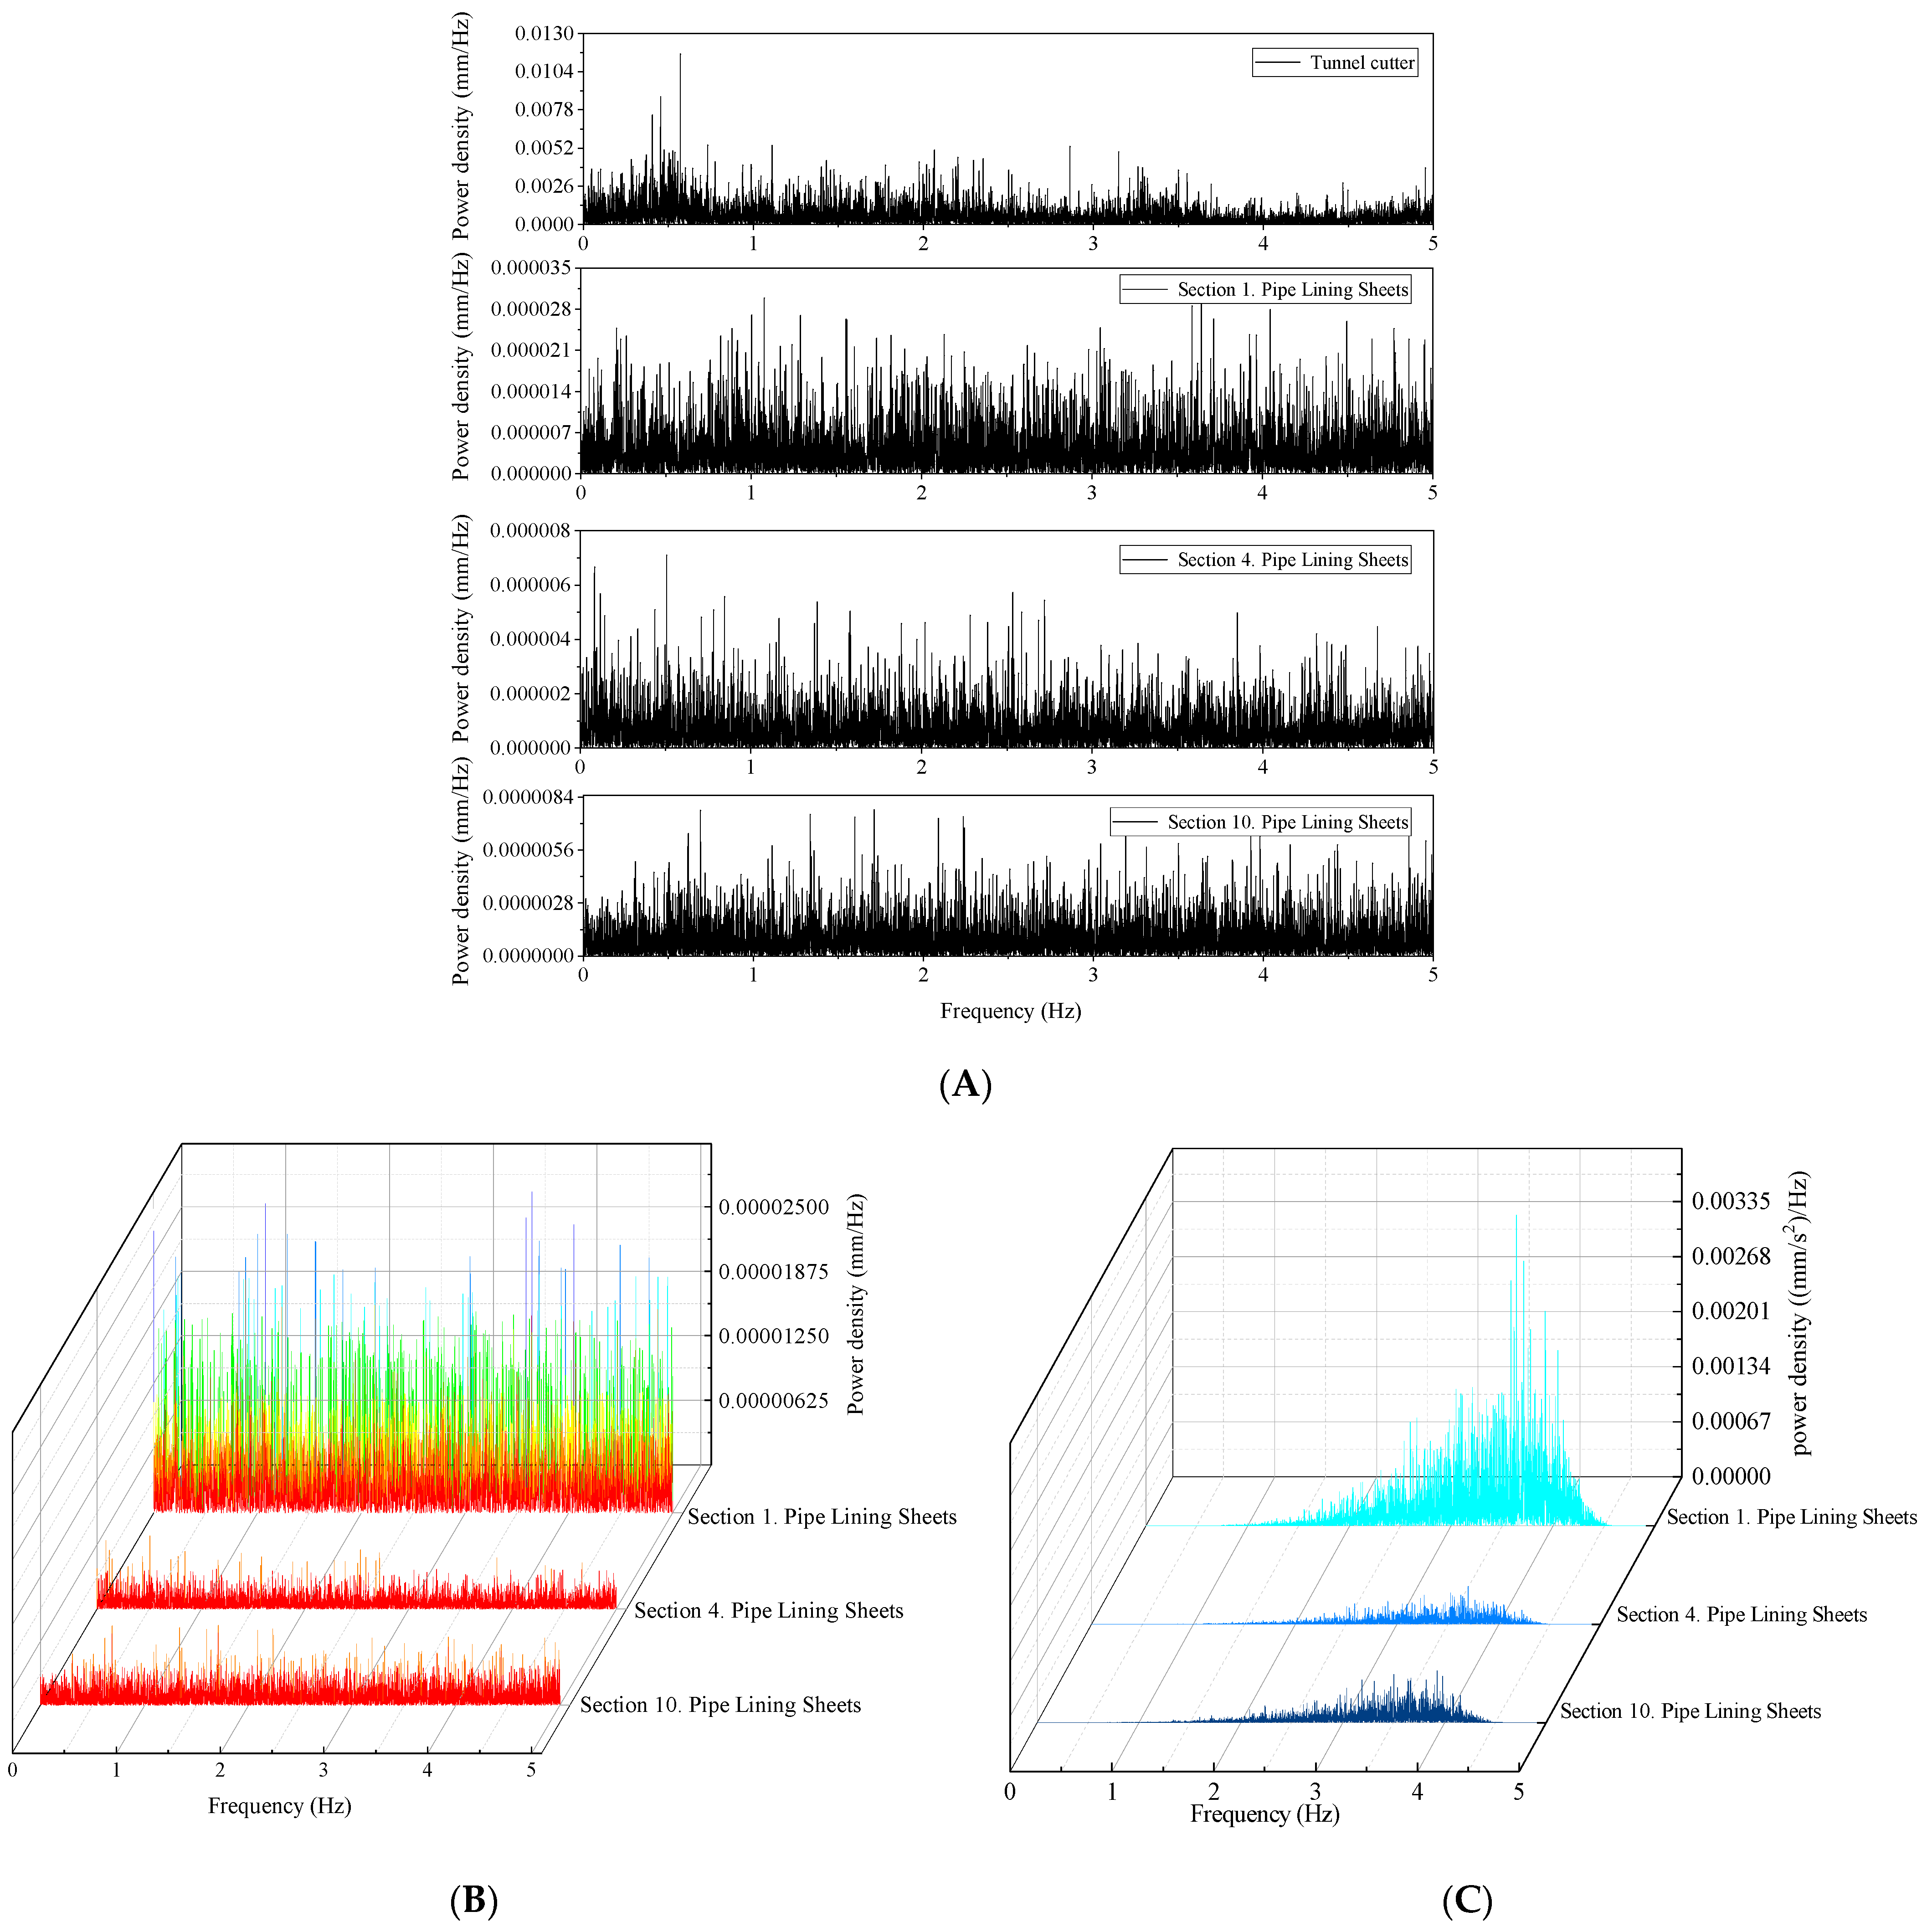
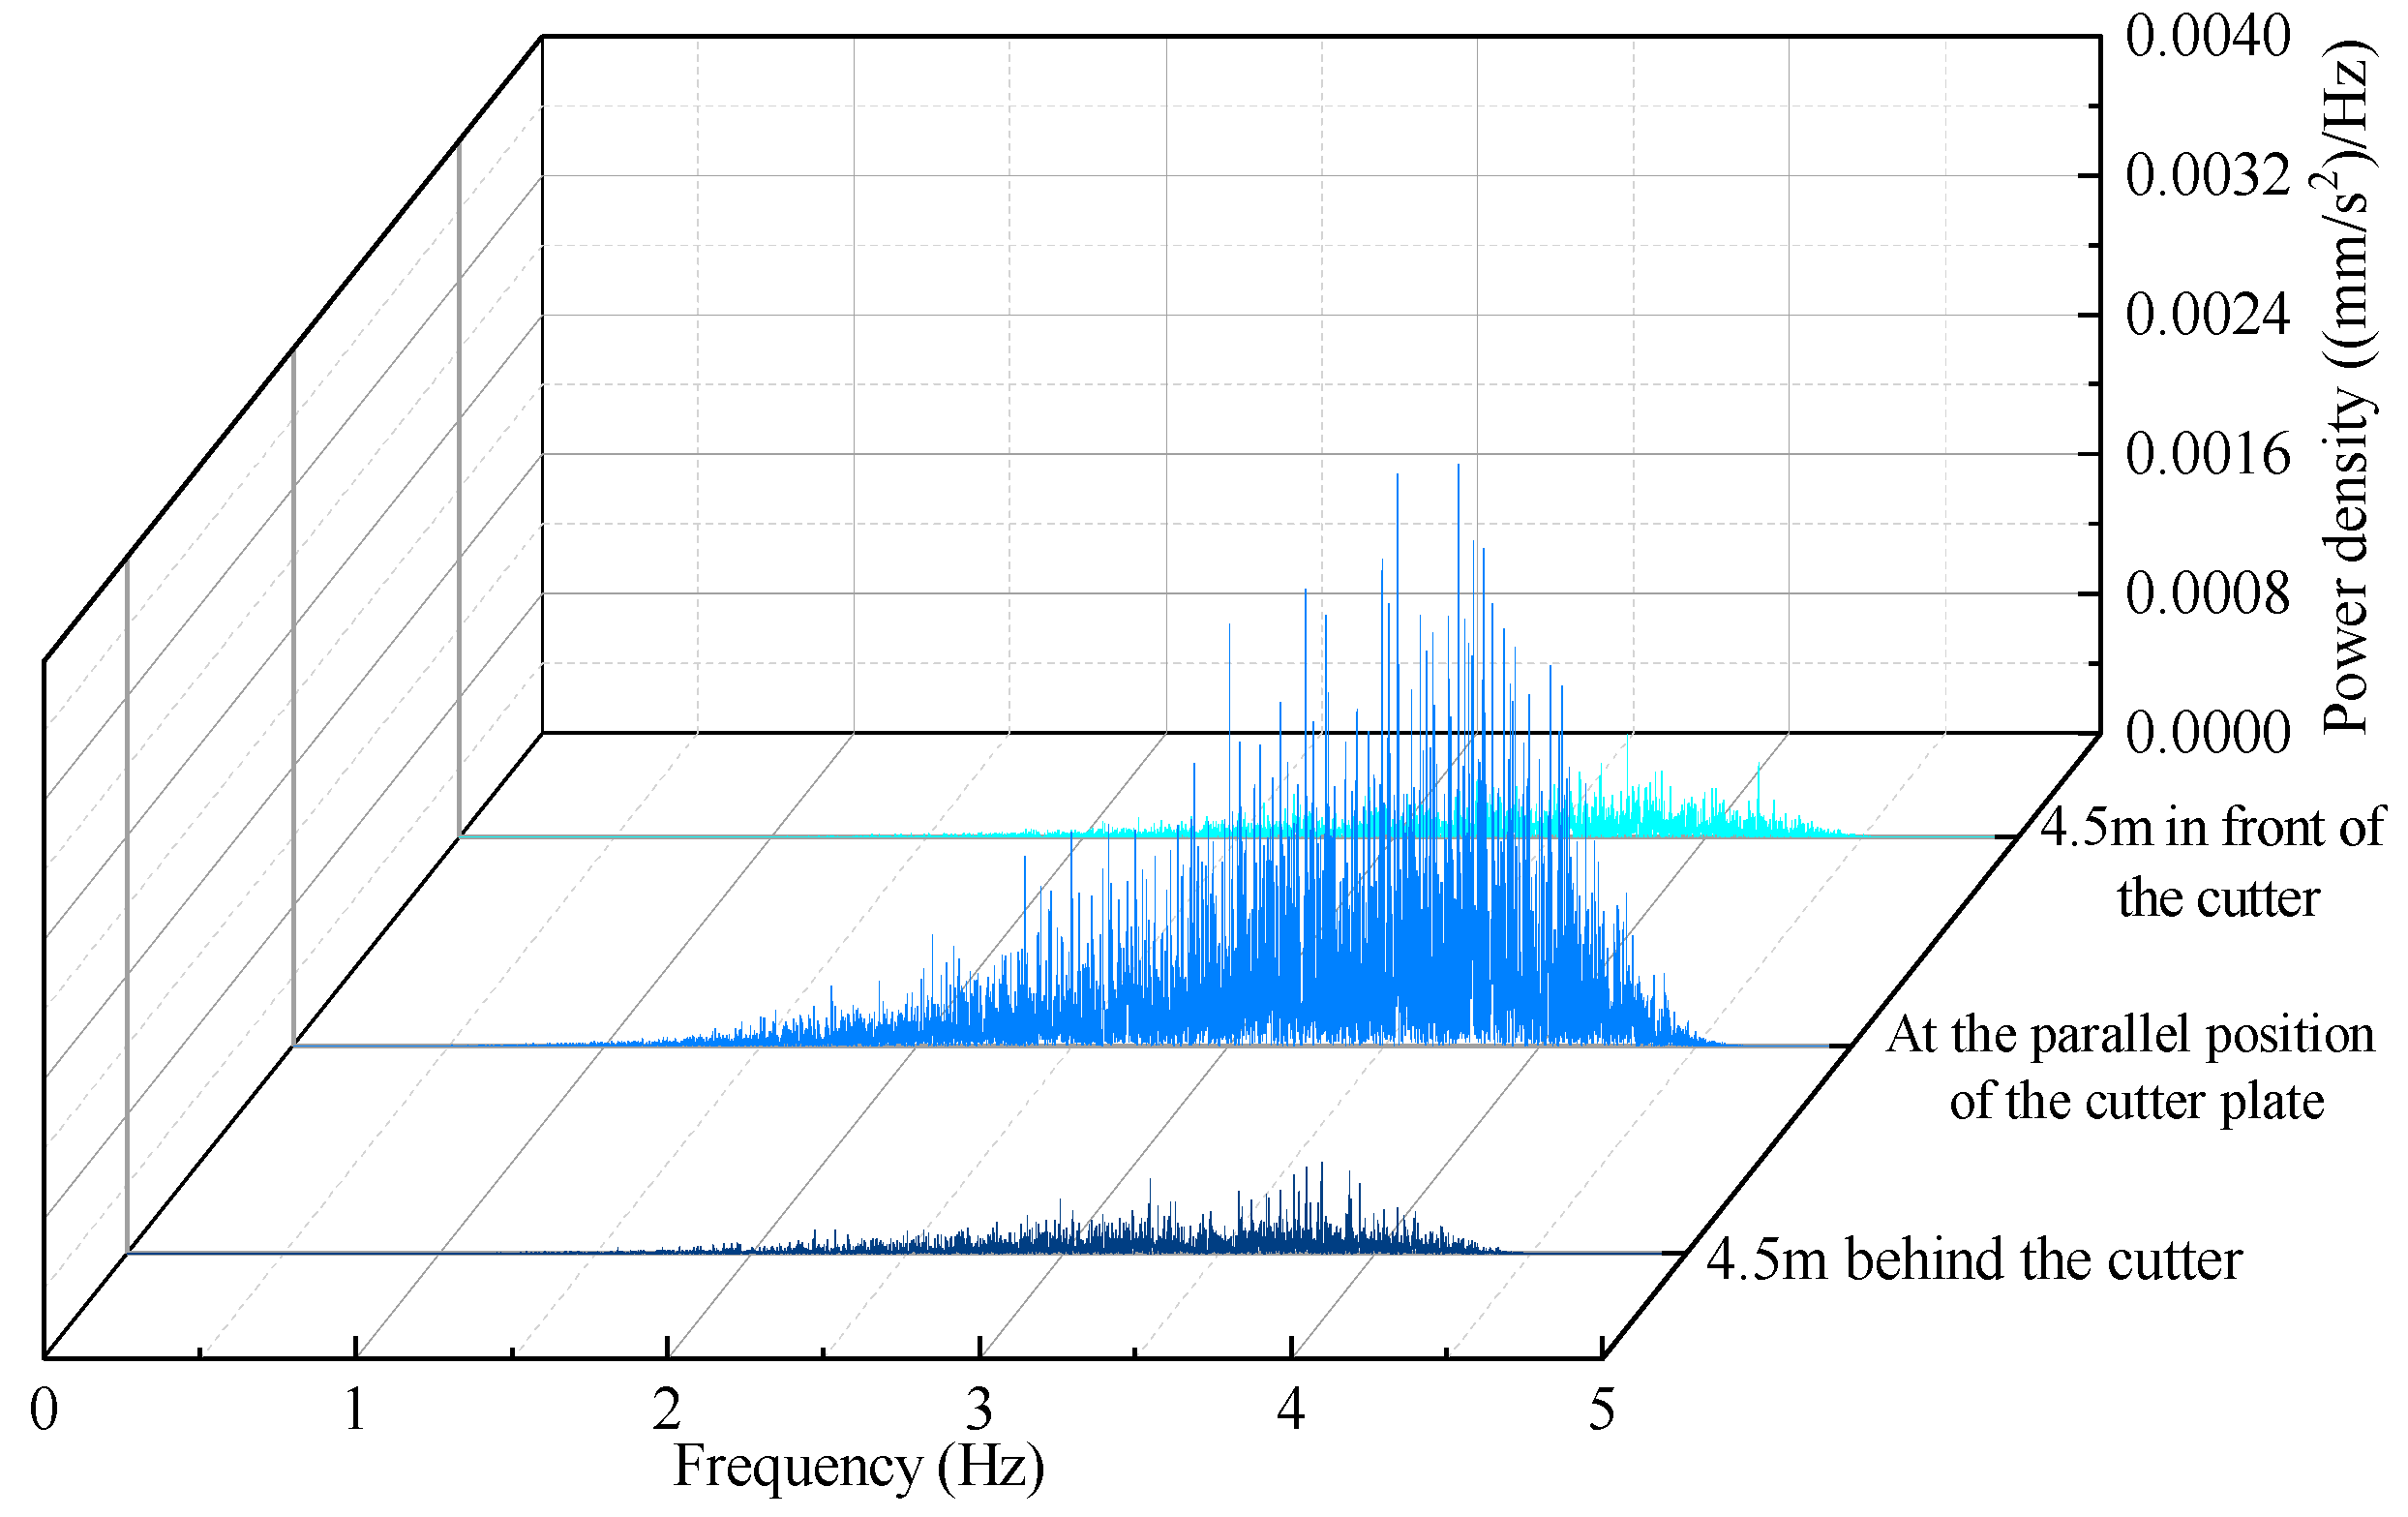
Due to significant variations in vibration data at the cutterhead, the first segment, the fourth segment, and the tenth segment, the displacement data at these four locations were subjected to Fourier transform to calculate their displacement power density. However, since the displacement spectrum data did not exhibit clear patterns, the original vibration displacement data were converted back to obtain the vibration acceleration, which was then processed through Fourier transform to calculate the acceleration power density. Notably, the power density of the cutterhead differs from that of the segments by a factor of 1000. The power density spectrum is shown in Figure 7.

Figure 7.
Power density spectrogram of the construction side tunnel. (A) Displacement power density comparison chart (2D: two-dimensional view); (B) displacement power density comparison chart (3D: three-dimensional view); (C) acceleration power density comparison chart.
From Figure 7A,B, it can be observed that the displacement power density attenuates to 0.28% from the cutterhead to the first ring segment. However, its pattern in the frequency domain is not evident, and no phenomenon of concentrated power density in specific frequency domains is observed. Figure 7 demonstrates the results of back-calculating the displacement time–history data to obtain the acceleration time–history data and then performing a Fourier transform. The peak power densities of the lined pipe sheets were concentrated in the range of 3.6–3.7 Hz, with peaks of 0.00378 ((mm/s2)/Hz) for the first section of lining, 0.000464 ((mm/s2)/Hz) for the fourth section, and 0.00063 ((mm/s2)/Hz) for the tenth section. Therefore, in the subsequent frequency domain analysis, the power density of the acceleration is selected for analysis to identify its regularity. This result indicates that, although all lined pipe sheets exhibited a significant concentration of vibration energy at 3.64 Hz, there was a notable difference in the intensity of vibration at this frequency across different locations. The highest peak power density was observed in the first section of the lining, suggesting that it was most strongly affected by vibration. As the distance from the shield cutter increased, the vibration energy gradually decayed, and the intensity was significantly reduced by the fourth and tenth sections of the lining.
This phenomenon may be related to the axial thrust generated during the advancement of the shield machine, the rotational frequency of the cutter disk, and the soil–structure interaction—particularly the resonance effect around 3.6–3.7 Hz, which made this frequency the primary source of vibration. Additionally, the damping characteristics of the segment structure and the energy-absorbing effect of the soil medium also influence the propagation and attenuation of the vibration energy to some extent.
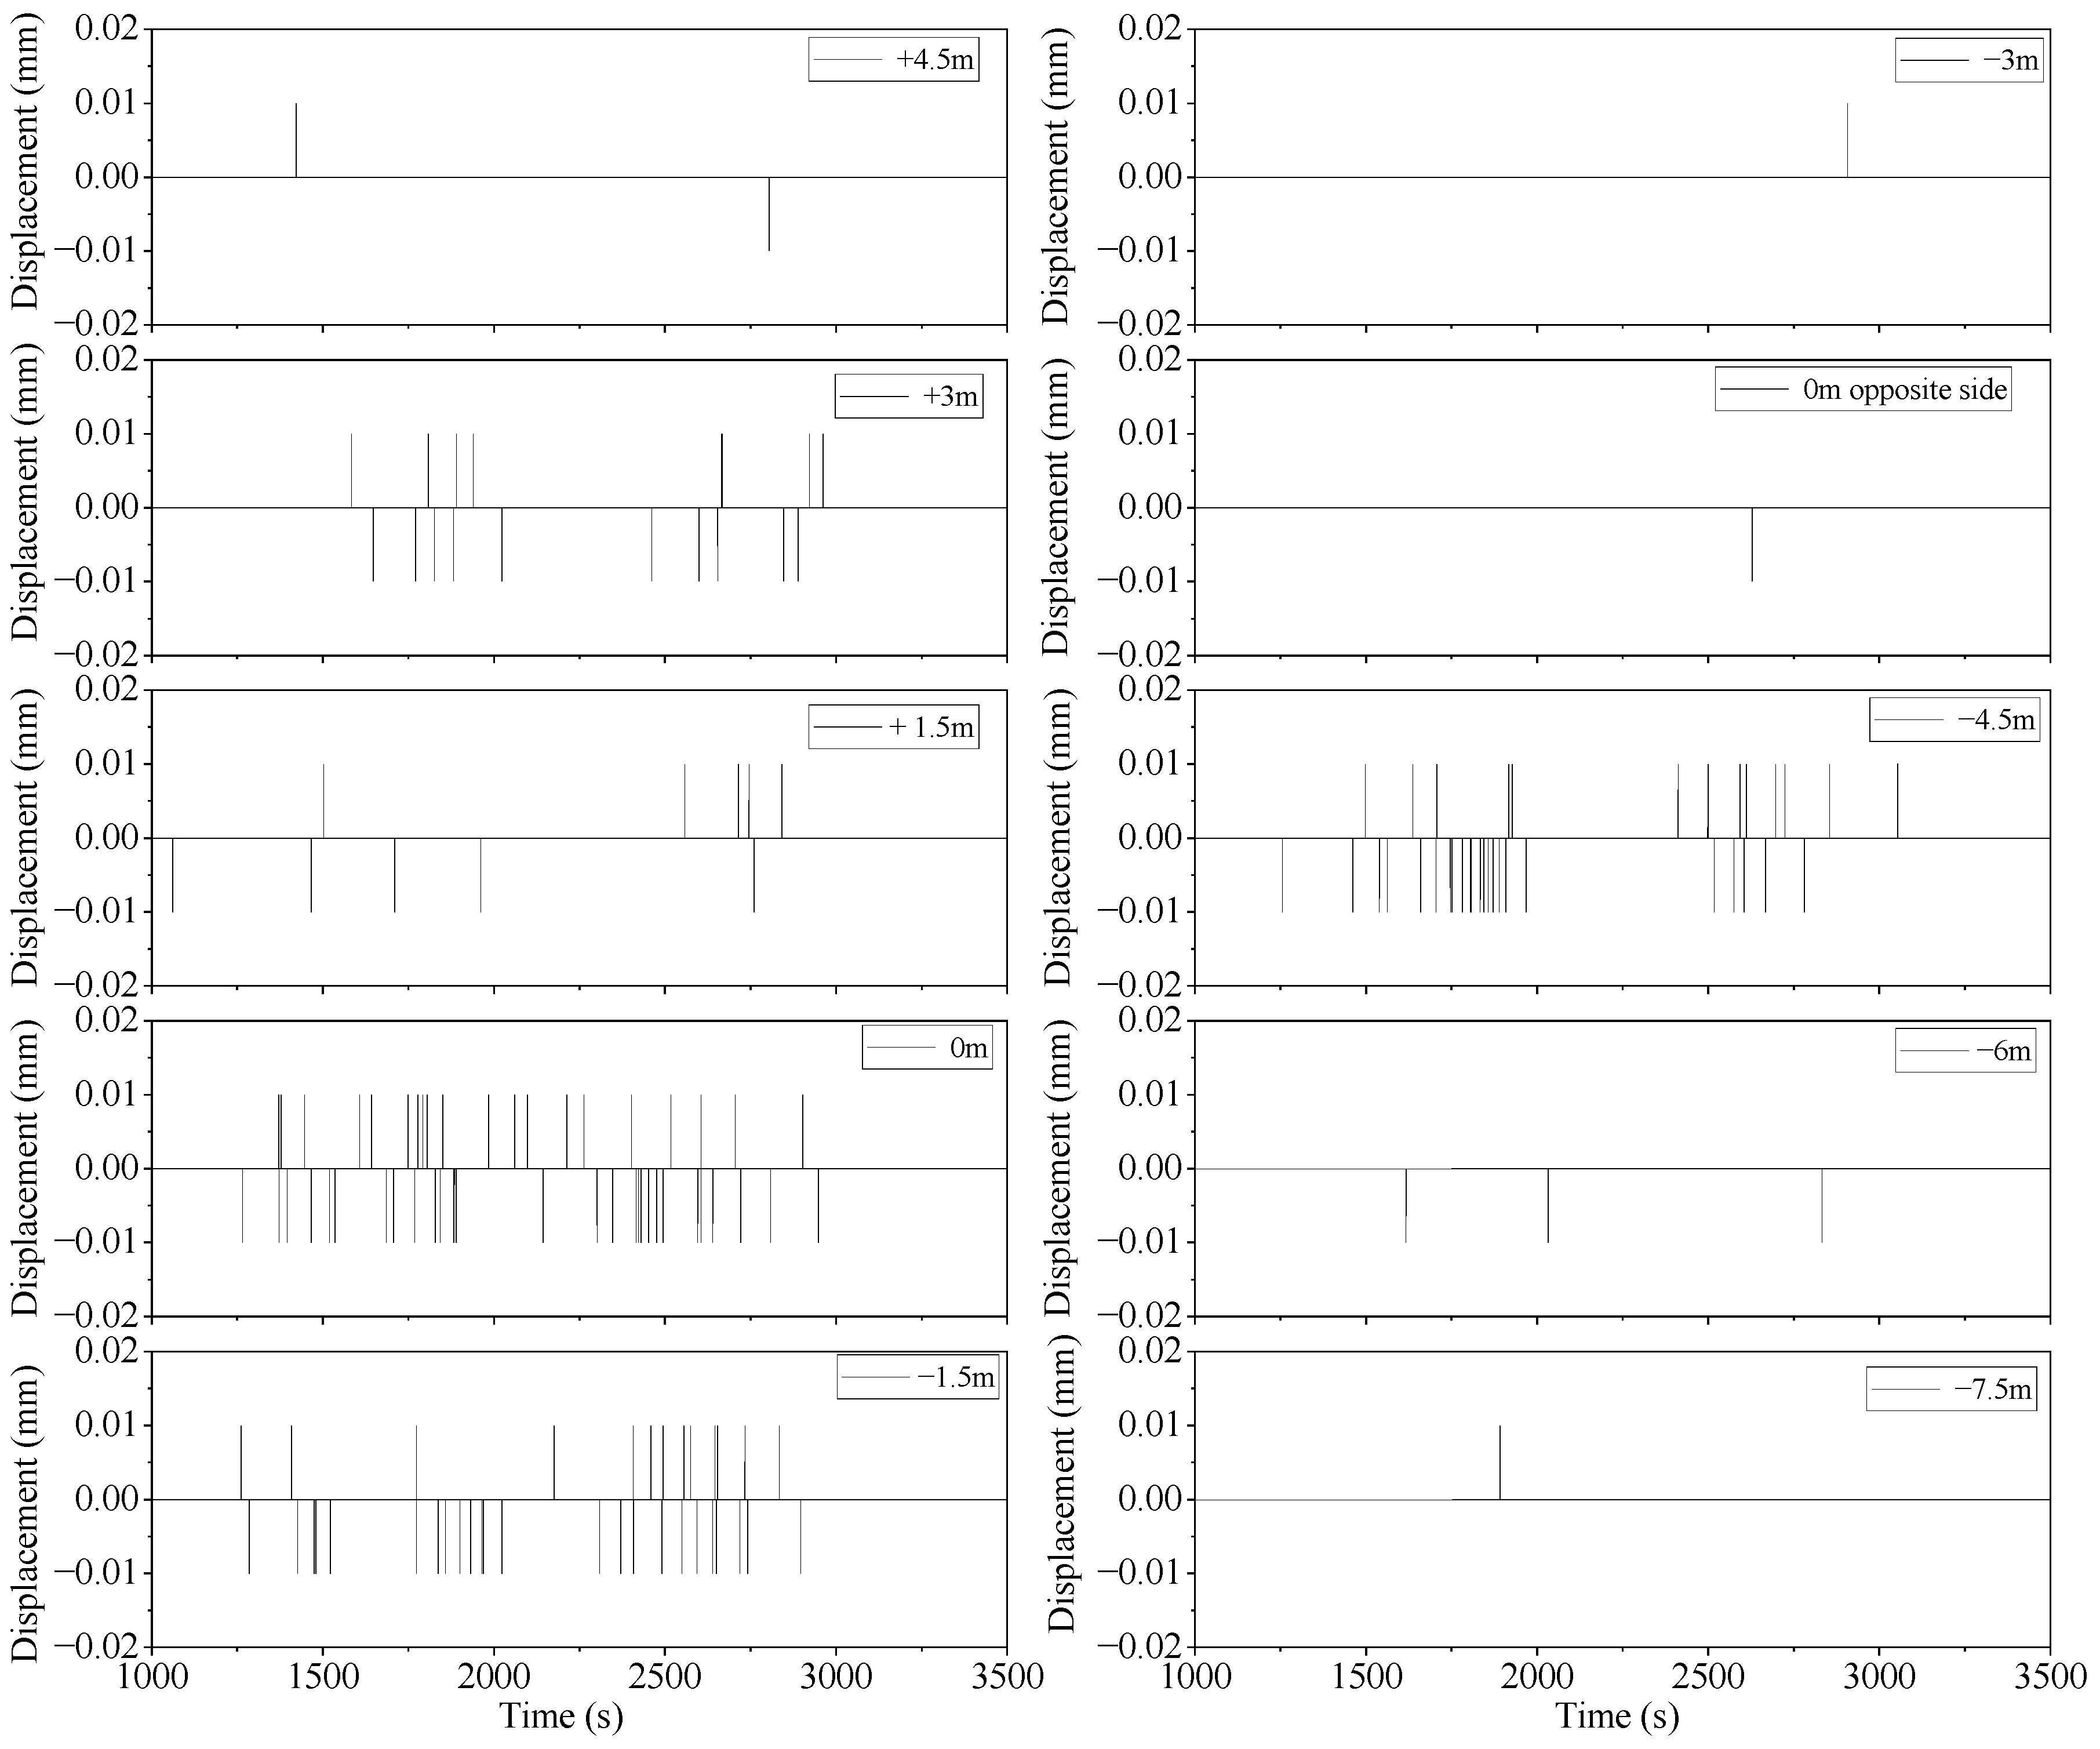
3.3.2. Vibration Response of Neighboring Tunnel
At the shield construction site, 10 sensors were installed on the opposite side of the tunnel, which had already been constructed, to monitor the vibration response at intervals of 1.5 m. The vibration displacements of the neighboring tunnels along the radial direction of the tunnel are shown in Figure 8.
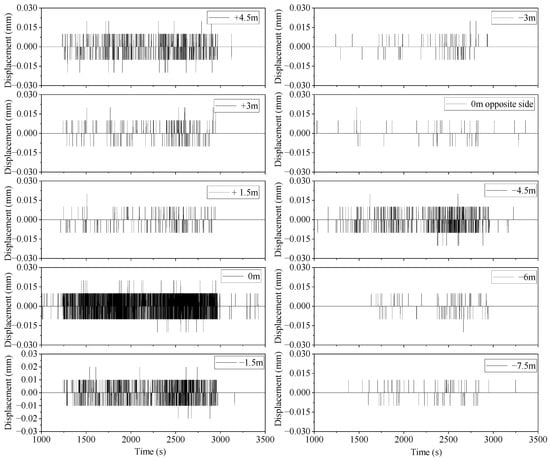
Figure 8.
Vibration displacements along the radial direction of the tunnel in the neighboring tunnels.
As shown in Figure 8, the vibration response of the neighboring tunnels is less intense compared to the vibration response of the tunnel on the construction side. Specifically, the vibration displacements at 0 m, parallel to the shield head, are the most pronounced in the radial direction of the tunnel, with a peak value of 0.02 mm. This phenomenon indicates that radial vibration remains significant near the vibration source (i.e., at the shield head), even though the neighboring tunnels are farther from the source. As the distance increases, after 5 m, the vibration displacement response rapidly decreases to 0.01 mm, and the vibration signal becomes much sparser and nearly negligible. This suggests that while the neighboring tunnels are less affected by the vibration, the vibration energy still propagates radially and reaches these tunnels, producing some vibration response in the region. The vibration displacements of the neighboring tunnels along the axial and gravitational directions are shown in Figure 9 and Figure 10.

Figure 9.
Vibration displacements along the tunnel axis in the neighboring tunnels.
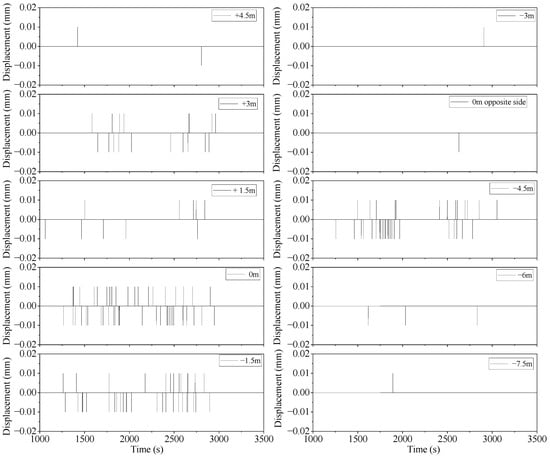
Figure 10.
Vibration displacement in the direction of gravity in neighboring tunnels.
From Figure 9 and Figure 10, it can be observed that the vibration displacements of the neighboring tunnels along the axial and gravity directions are relatively sparse, and the vibrations are not pronounced. The Fourier transformations of these vibrations were converted into power densities, which are shown in the power density spectrograms in Figure 11.

Figure 11.
Spectrogram of power density on the neighboring tunnel side.
The peak power density of the adjacent tunnel-side lined pipe sheets is concentrated in the range of 3.7–3.8 Hz, with a peak of 0.00333 ((mm/s2)/Hz) at 0 m (the same horizontal position as the cutter plate), 0.00059 ((mm/s2)/Hz) at 4.5 m in front of the cutter plate, and 0.00053 ((mm/s2)/Hz) at 4.5 m behind the cutter plate. This result indicates that, although the peak power density of all the lined pipe sheets is concentrated in the same frequency range (3.7–3.8 Hz), there is a significant difference in the vibration intensity of the lined pipe sheets at different locations at this frequency.
4. Numerical Model Validation
4.1. Boundary Condition Setting
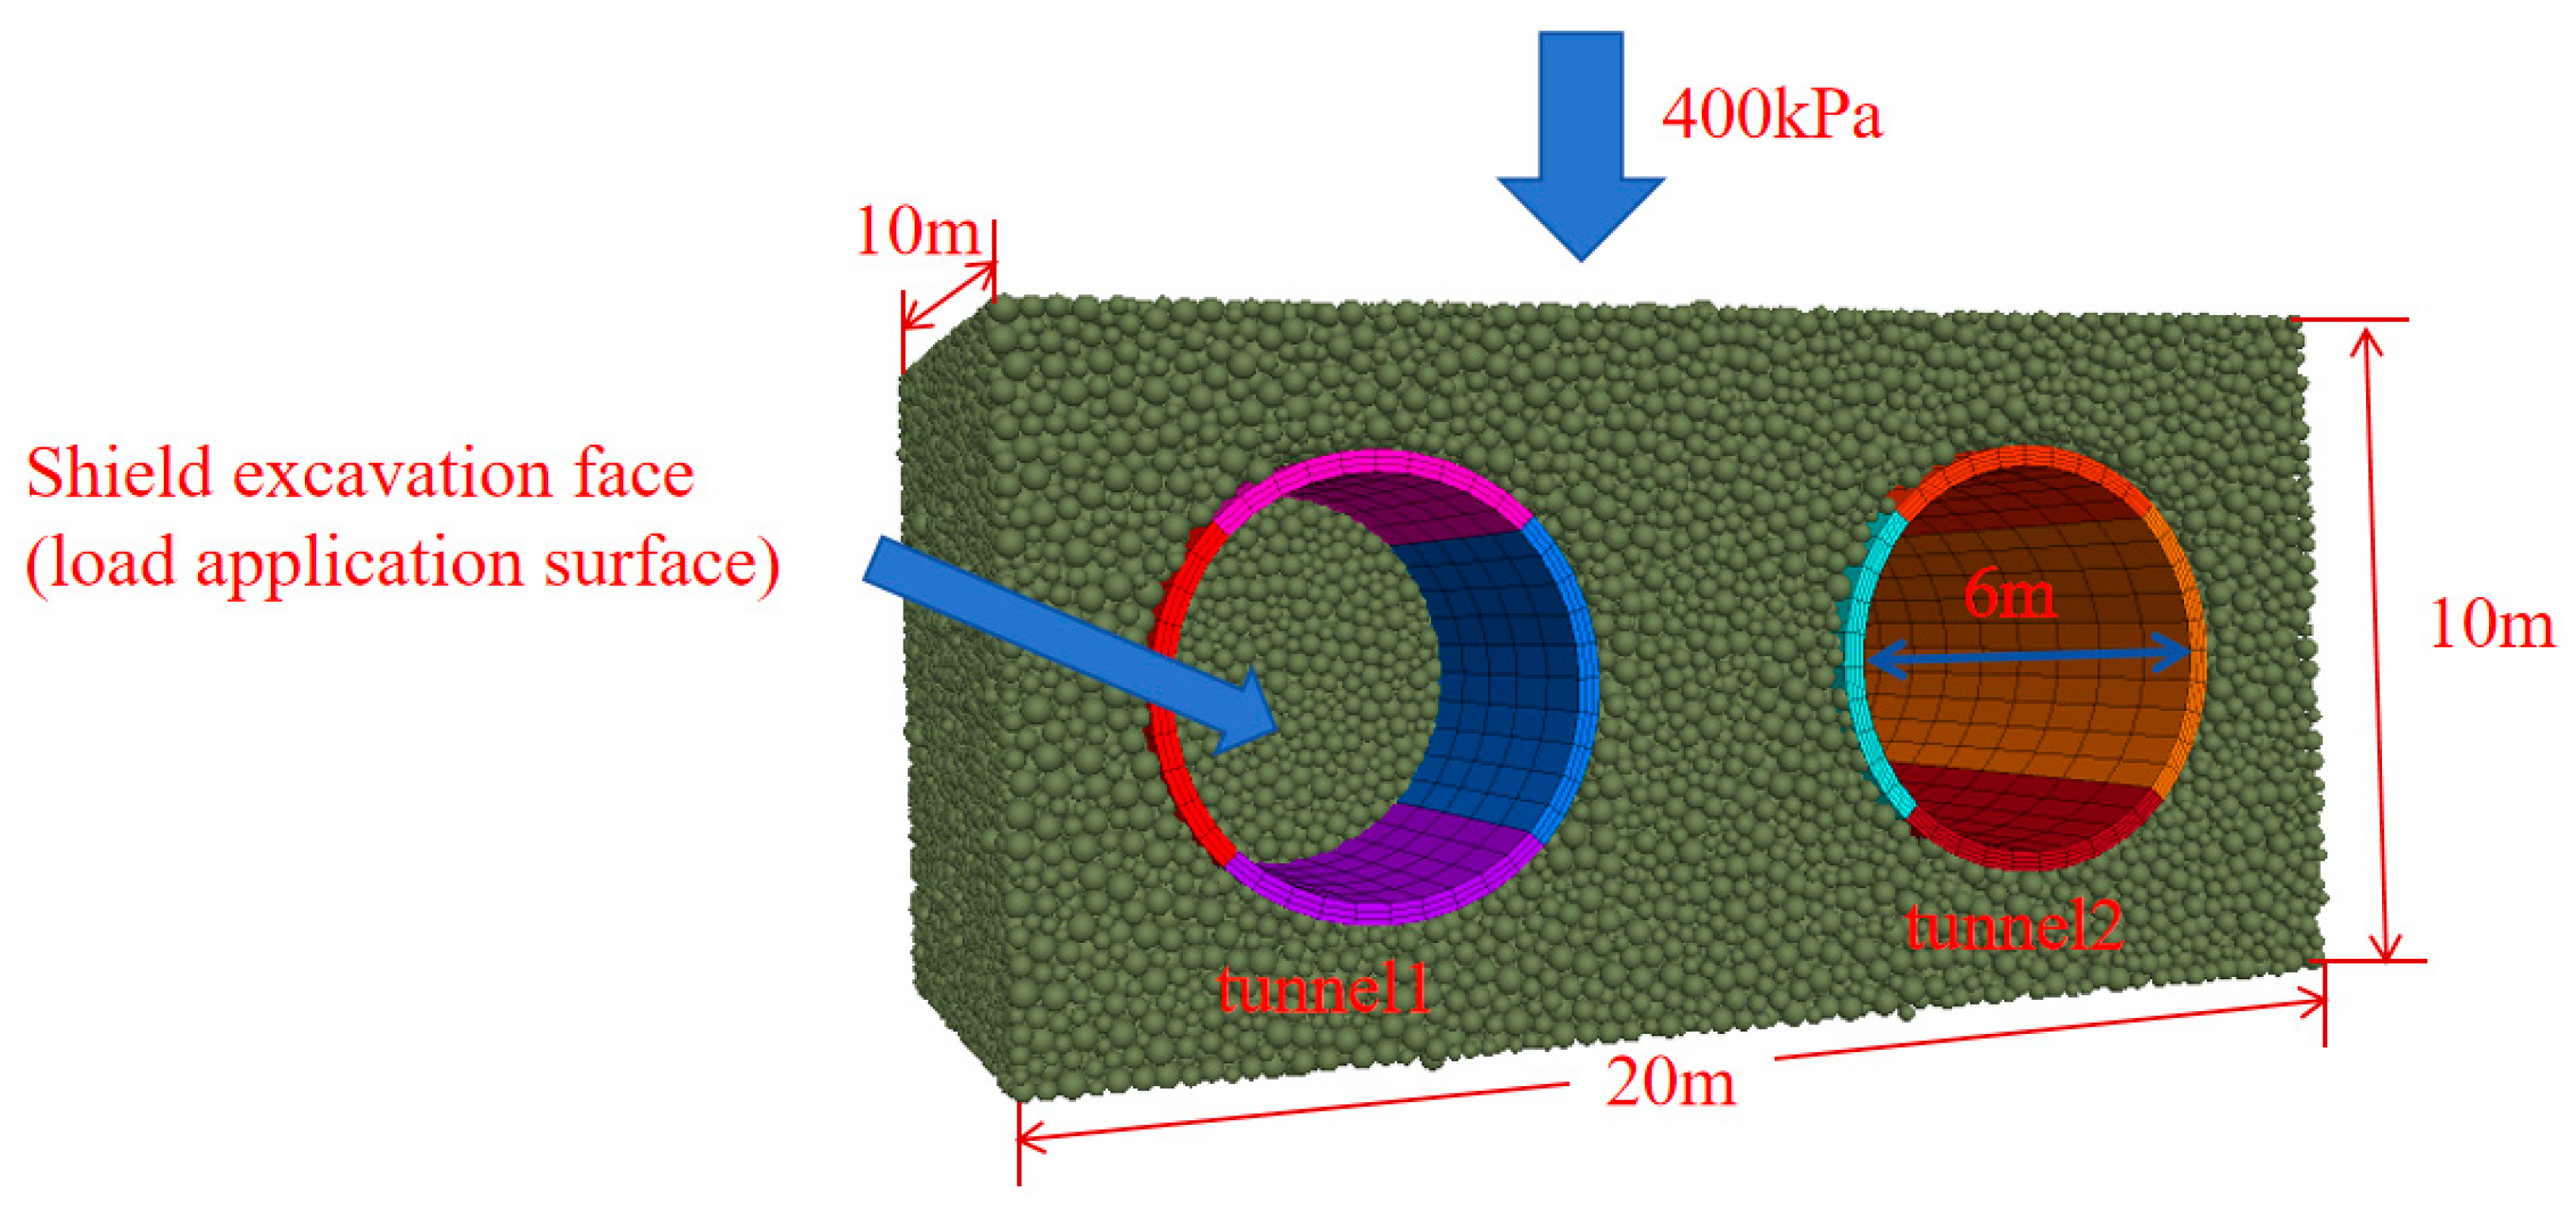
If a scaled model is established based on the engineering overview, it would generate 20.41 million ball elements. Therefore, to optimize the computational rate of the model, the model in this chapter is simplified by replacing the influence of the removed soil with confining pressure applied to the model boundaries. The dimensions of the simplified model are 20 × 10 × 10 m, containing 60,000 ball elements, which significantly improves computational efficiency.
In the model, the excavation diameters of Tunnel 1 and Tunnel 2 are 6 m, and the lining segment thickness is 0.3 m. For simplicity, the numerical model does not include soil far from the twin tunnels. Instead, a confining pressure of 400 kPa is applied to the six outer boundaries to simulate the lateral pressure of the surrounding environment. The boundaries between the tunnel lining segments and the soil particles are set as DEM-FDM(Finite Difference Method) coupled boundaries [29,30,31,32,33,34,35].
To facilitate the seamless transfer of mechanical and physical properties between discrete element particles and finite difference grids, an interface coupling method was employed. A PFC model component, termed a “Wall”, was implemented on the surfaces of FLAC(Fast Lagrangian Analysis of Continua) model elements (zones or structural units) to serve as a medium for exchanging and transferring coupling variables. This method enabled the integration of continuous and discontinuous coupling processes, as illustrated in Figure 12. By generating walls aligned with the nodes on the finite difference grid surface, discrete element particles could transfer forces and displacements to grid nodes and elements through these walls. The discrete elements in the contact zone and the finite difference units provided mutual boundary conditions, ensuring compatibility. This approach effectively harmonized the spatial unit size and computational time step for optimal simulation performance [28,29].
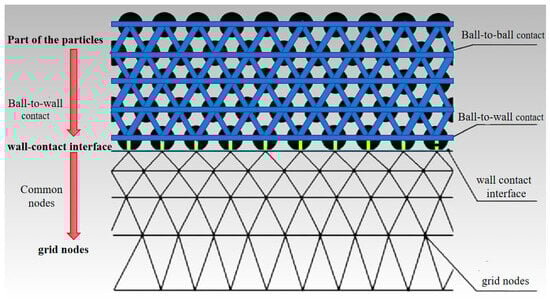
Figure 12.
Schematic diagram of the DEM-FDM coupling model based on contact zone discretization.
When setting the ball–facet contact parameters, the contact stiffness should not be excessively low to prevent particles from overly penetrating into the zone. Conversely, this study found that using the “ball distribute” command often caused particles to collide with the wall at high initial velocities during the equilibrium phase. As a result, the contact stiffness should not be overly high to avoid zone damage from excessive contact forces. After several trial calculations, it was determined that setting the normal stiffness kn to 20 MPa and the tangential stiffness ks to 8 Mpa allowed for a consistent transfer of stress and strain between particles and zones.
The coupled approach of DEM and FDM is typically used to simulate complex problems that involve both large-scale structural deformations and particle behaviors (e.g., soils, geotechnical media, etc.). The basic concept involves integrating the microscopic interactions between particles, simulated using DEM, with the macroscopic mechanical responses, simulated using FDM. The core of the coupling method lies in how to transfer the macroscopic continuous medium field information (e.g., stress, strain, etc.) to the motion and contact forces of microscopic particles. A simplified cross-section of the PFC3D model is shown in Figure 13. In Figure 13, Tunnel 1 represents the first tunnel, and Tunnel 2 represents the second tunnel.

Figure 13.
PFC3D numerical model diagram.
4.2. Calibration of Model Parameters
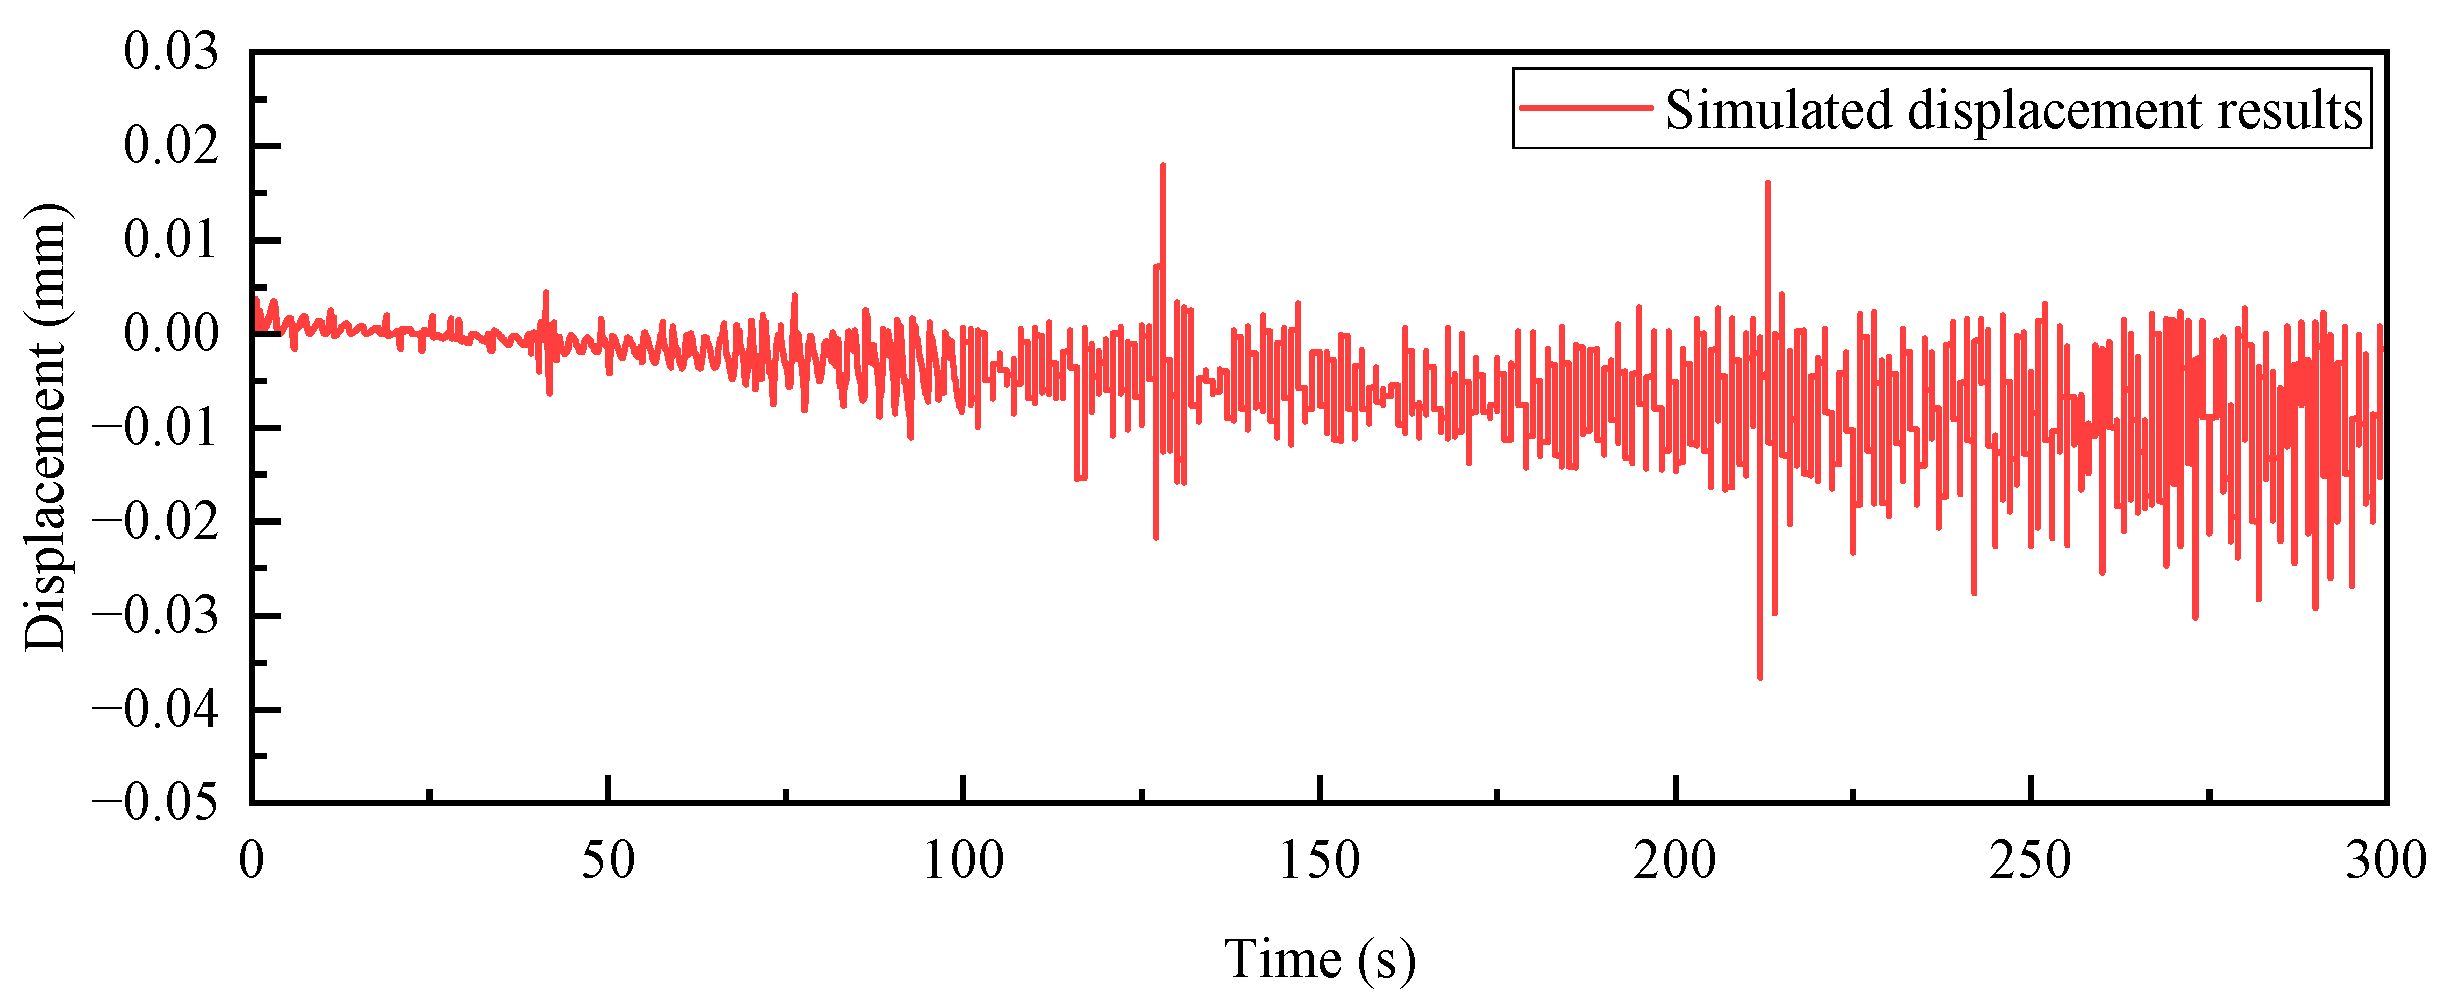
The numerical model parameters were determined based on the engineering geological report and triaxial tests of the soil, as shown in Table 1. In the DEM-FDM coupled model, the selection of damping parameters was optimized through continuous adjustment to ensure that the model’s output aligns with the monitored data response range. Specifically, the damping coefficients were set based on the field survey data and experimental results, referencing values from similar projects. These parameters were fine-tuned in the model to match the actual measurement data. Data from 300 s of monitoring the shield machine cutterhead were selected as the vibration source input to verify the feasibility of the model. The response displacement data on the adjacent tunnel side obtained through monitoring are shown in Figure 14, with a vibration displacement range of 0–0.03 mm, which matches the displacement range at the parallel section of the cutterhead shown in Figure 8. This indicates that the numerical model is feasible for dynamic analysis, and the damping parameters within the model accurately reflect the actual vibration response. Subsequently, for the simplification of calculations, a theoretical sine wave with an amplitude of 1 mm was applied. Monitoring observations were made by inputting a sinusoidal theoretical wave of 1 mm. The wave was applied to the vibration excavation face on the construction-side tunnel of the model and was loaded in the axial direction for 10 s.

Table 1.
Numerical model parameter table.
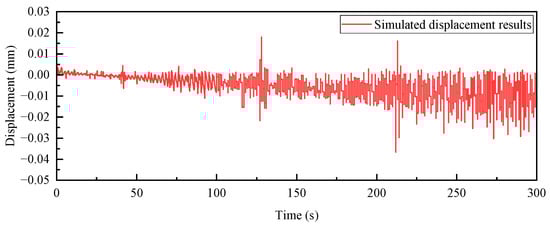
Figure 14.
Simulated displacement results.
4.3. Analysis of Simulation Results
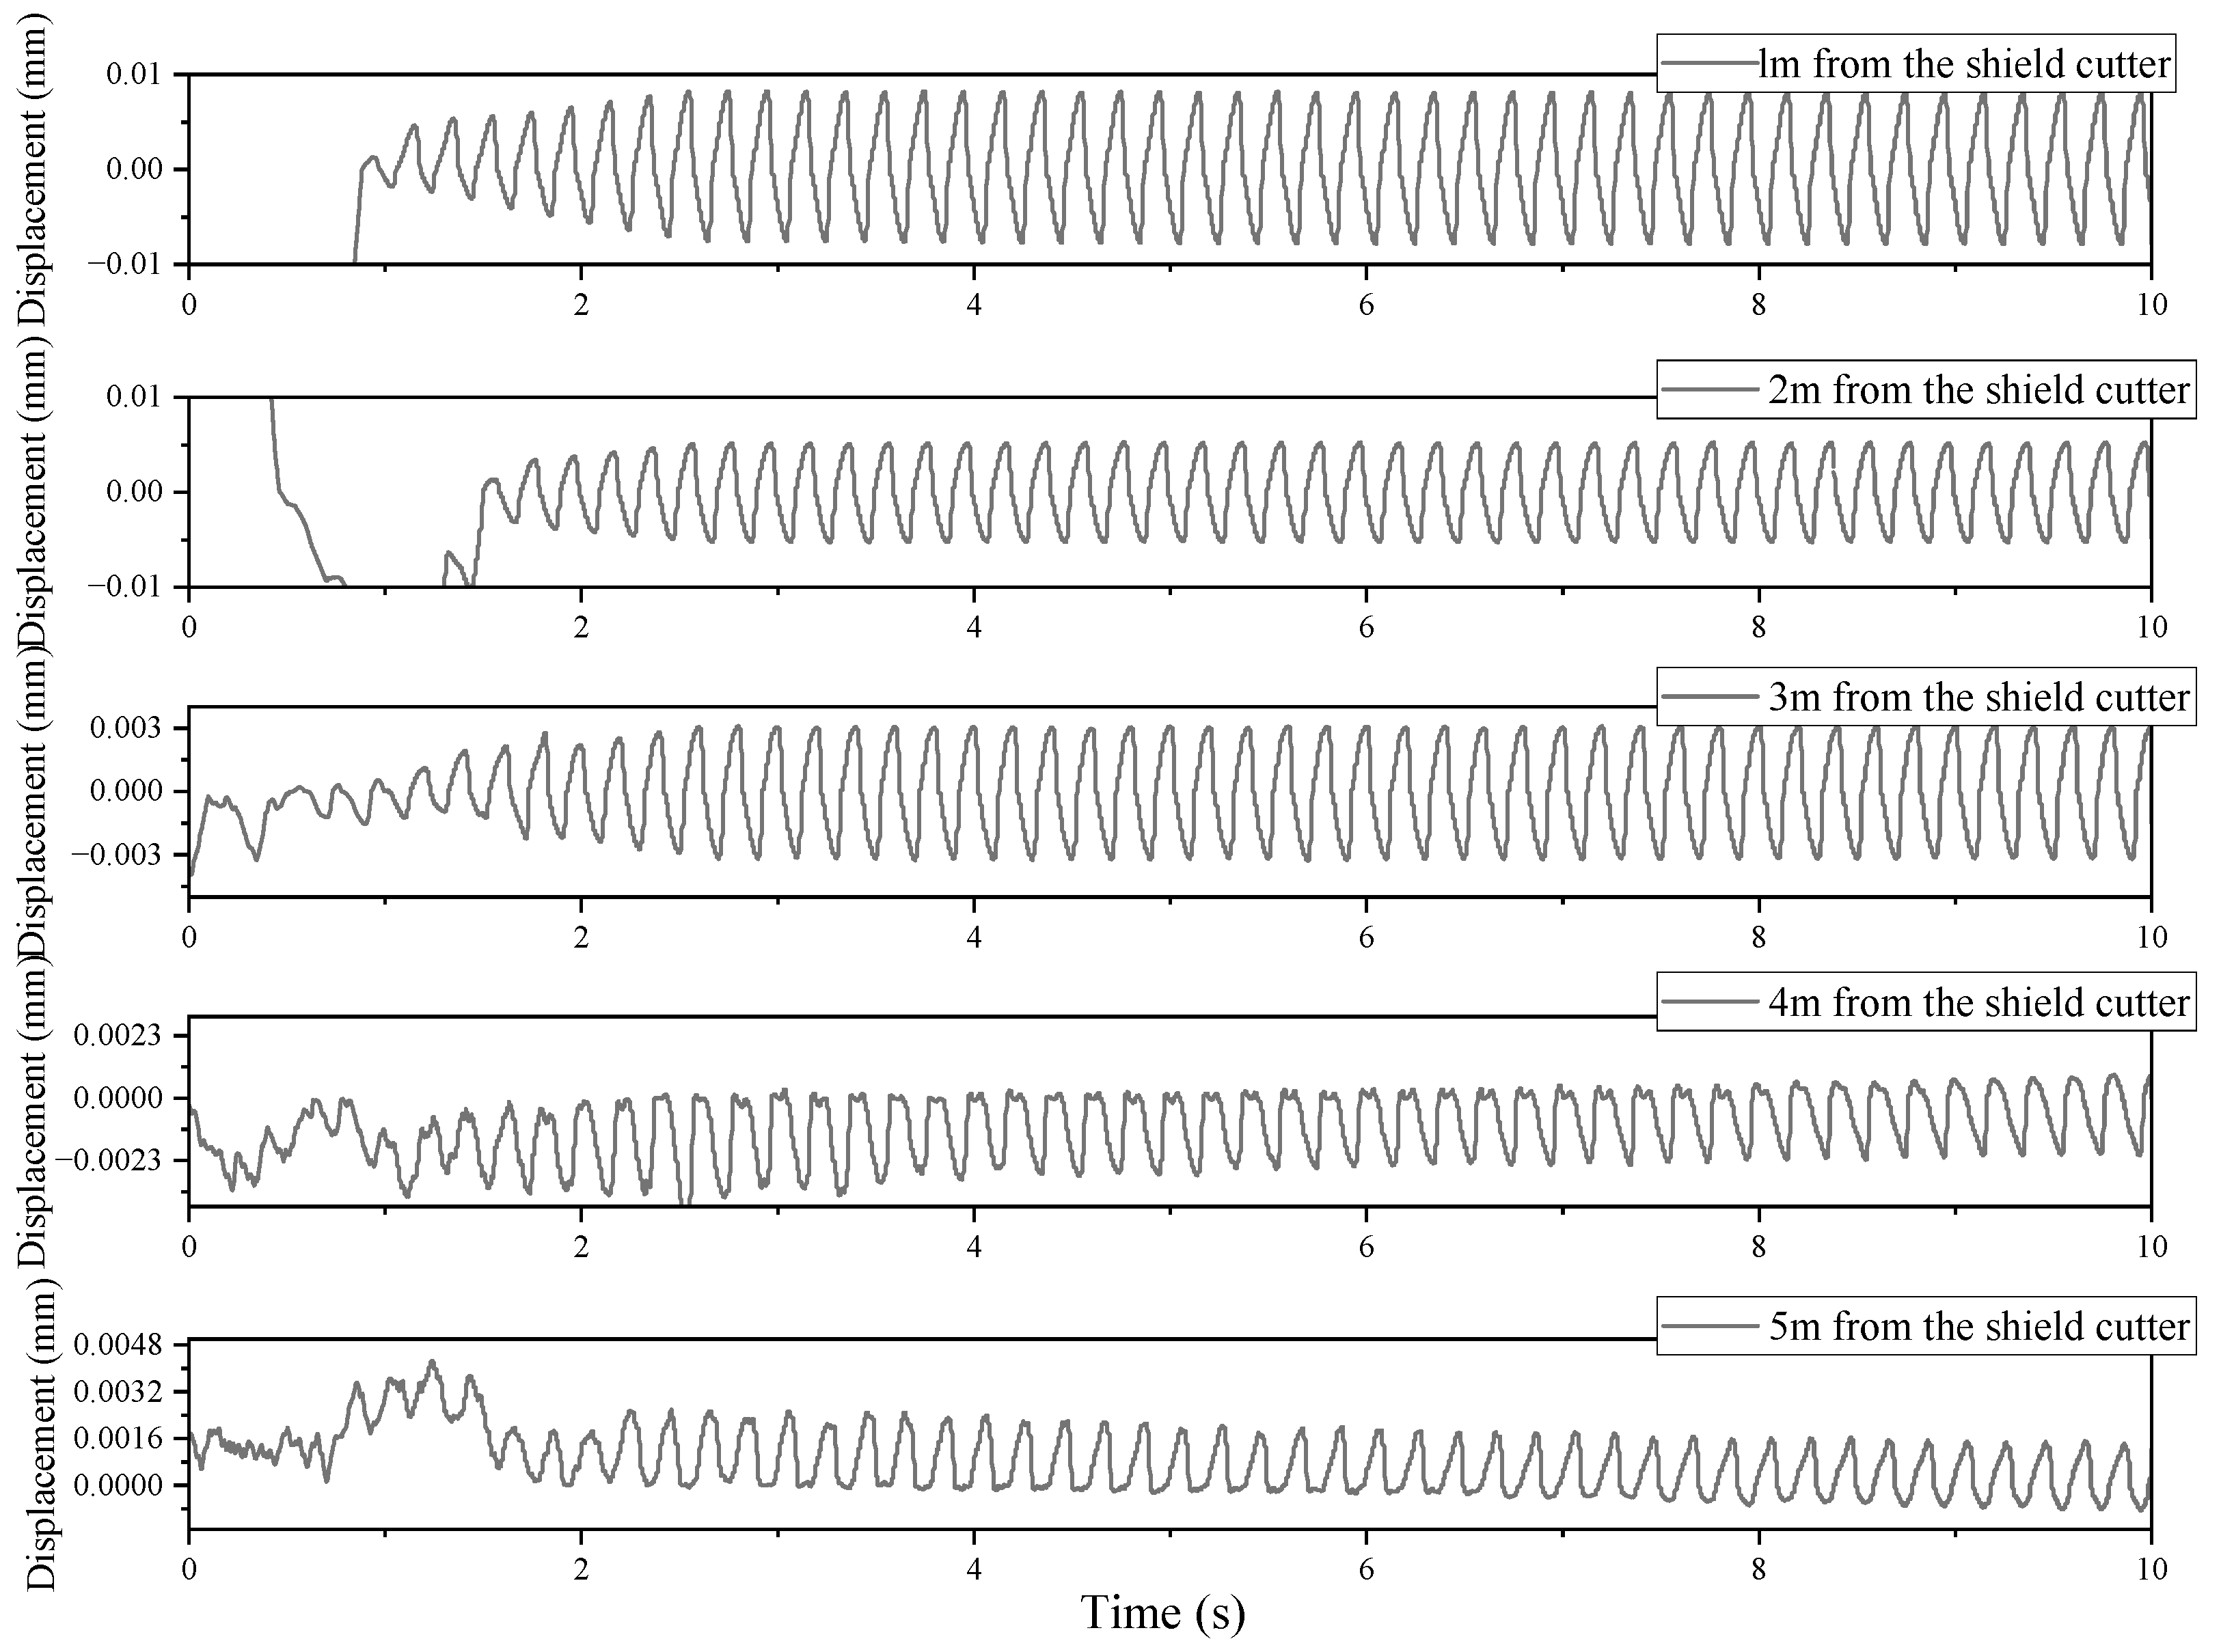
On the construction tunnel side, a monitoring point is selected at every 1 m interval to measure the vibration displacement of the segment unit at each position, as shown in Figure 15.
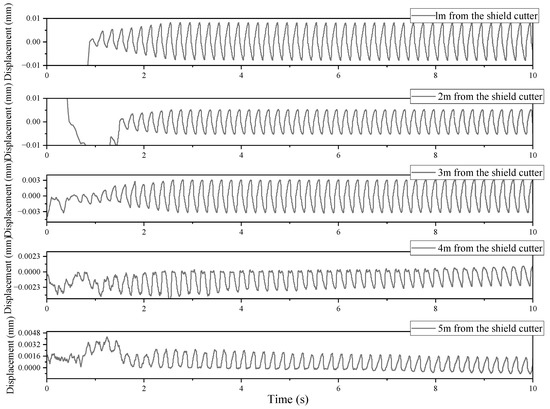
Figure 15.
Vibration displacement of segment at different positions.
As shown in Figure 15, as the distance from the vibration source increases, the vibration displacement of the tunnel segment decreases most significantly. Within the tunnel spacing range of 4 m, the vibration attenuation is more pronounced. From 1 m to 4 m, the vibration displacement on the adjacent side decreases by 80.29%.
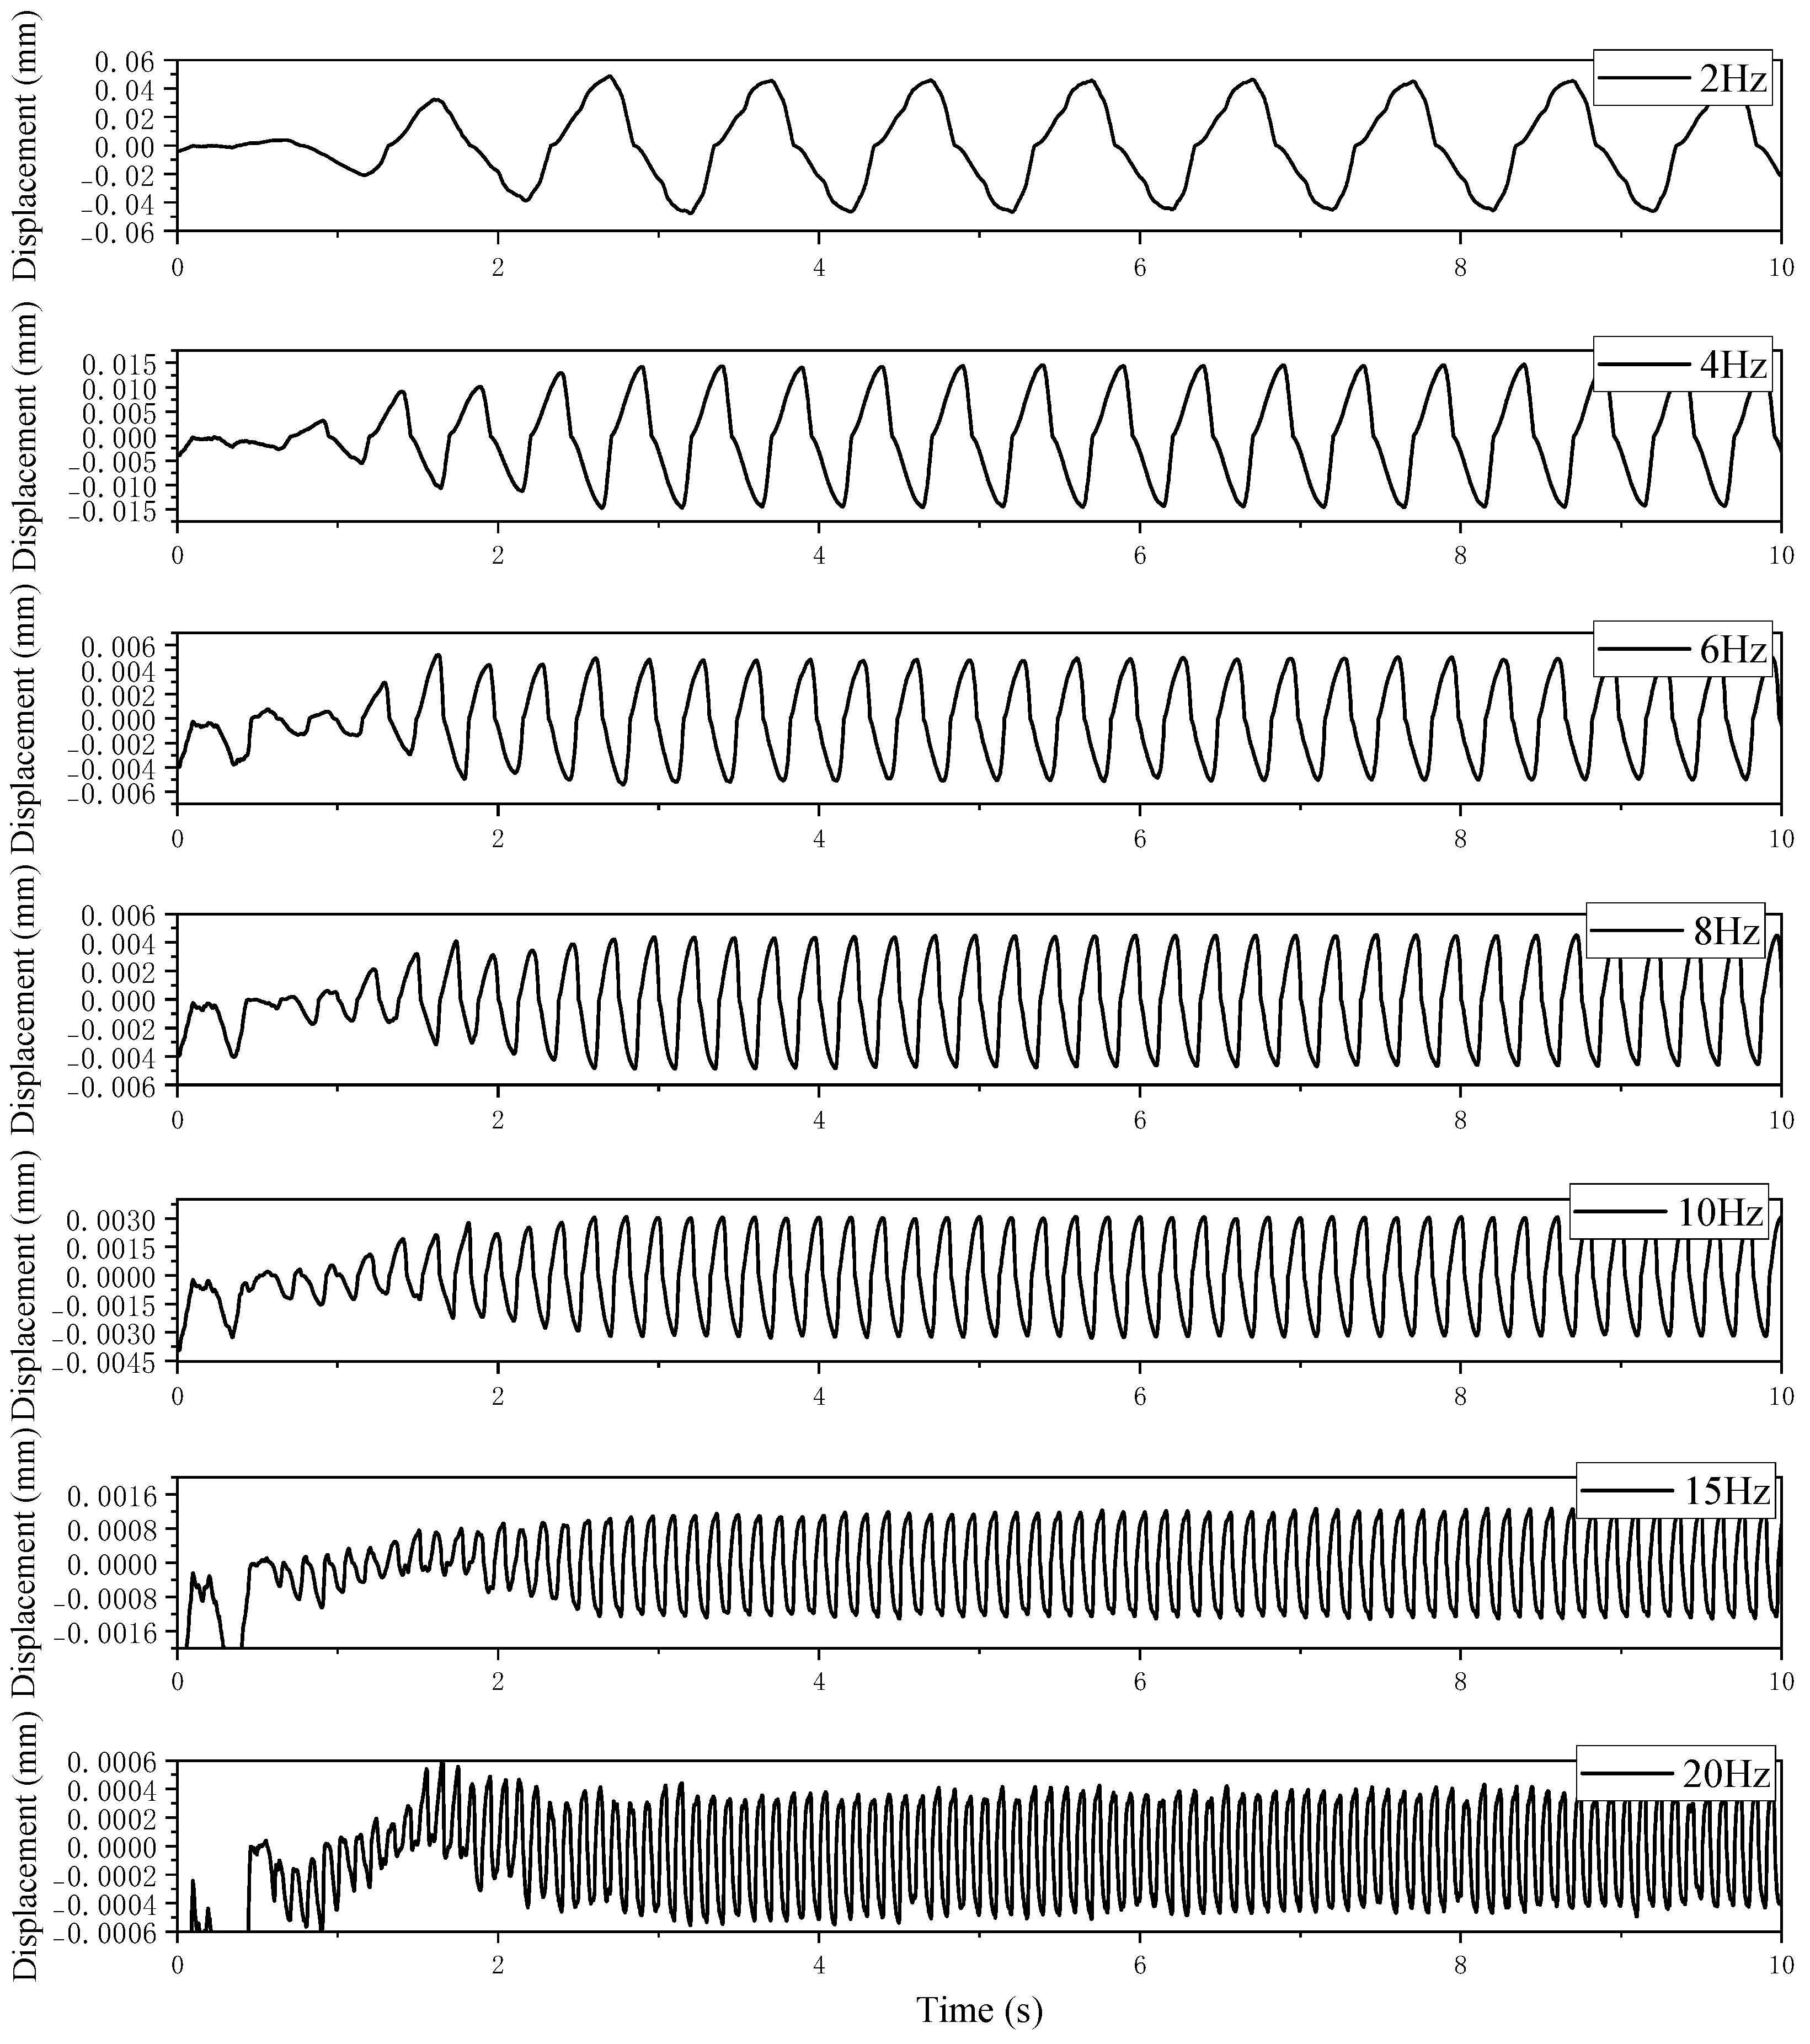
To better validate the impact of different frequencies on the vibrational response of tunnel structures, vibration sources at frequencies of 2, 4, 6, 8, 10, 15, and 20 Hz were selected for input. Monitoring was conducted at a point 3 m away from the vibration source, with the specific displacement data shown in Figure 16. From the figure, it is evident that, as the frequency increases, the vibrational response progressively weakens. At 2 Hz, the peak vibration displacement is approximately 0.05 mm, while, at 4 Hz, it reduces to 0.015 mm. Under high-frequency vibration at 20 Hz, the peak vibration displacement is only 0.0005 mm.
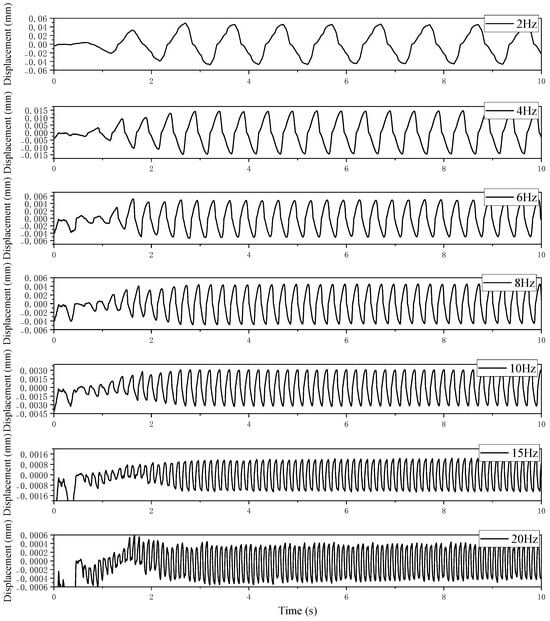
Figure 16.
Vibration displacement data at 3 m from the vibration source with different frequencies of vibration wave input.
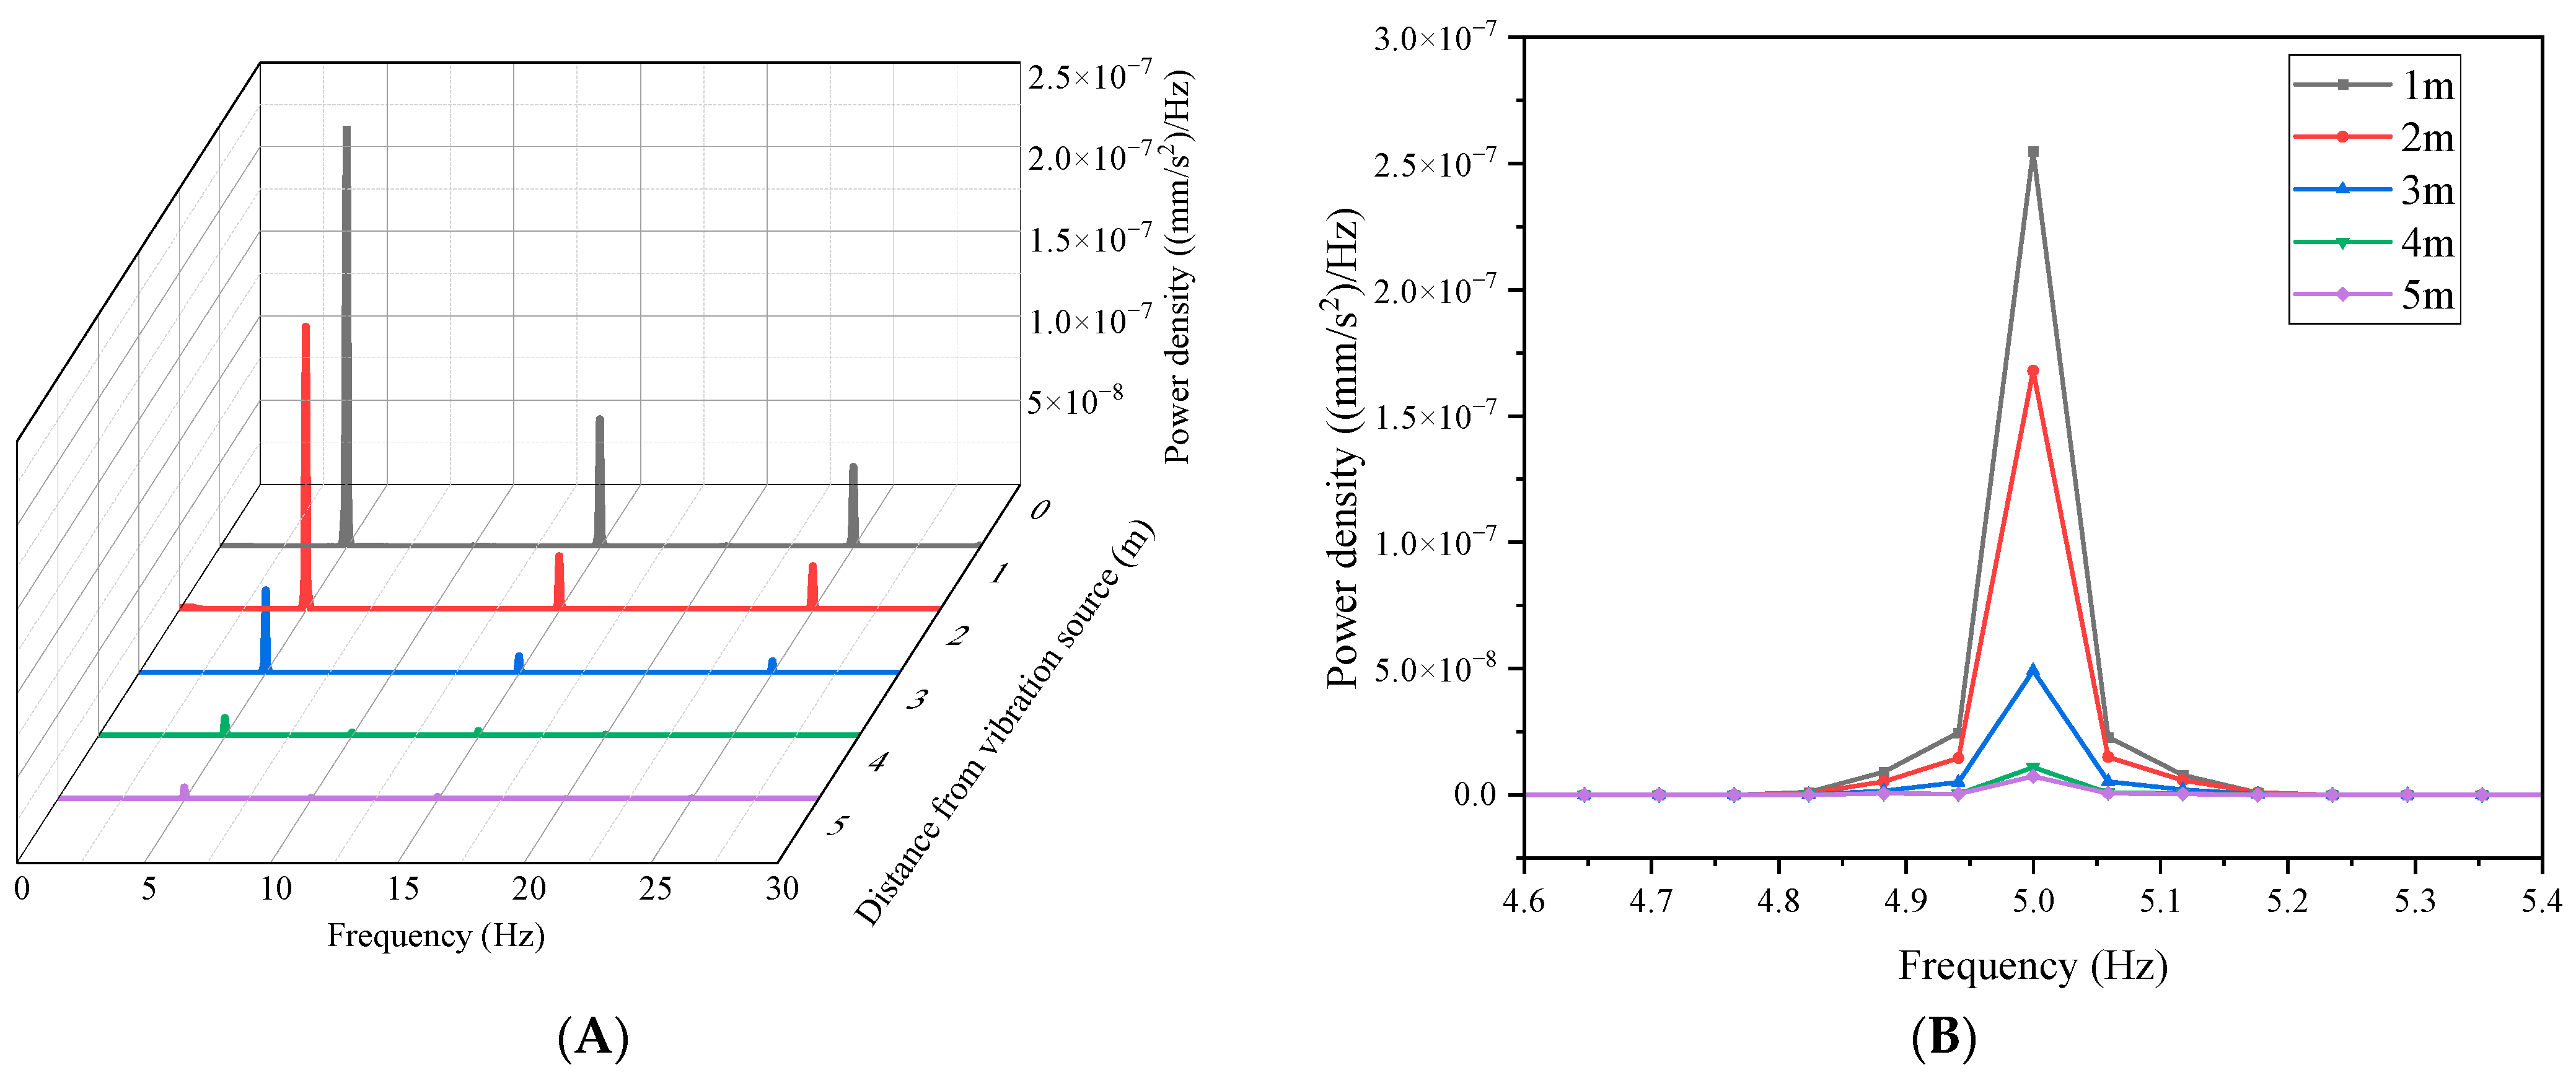
The displacement time-history data were first converted into acceleration time–history data through reverse calculation, and then Fourier transform was performed based on the formula. The acceleration, calculated using Formula (1), was used to determine the power density. The peak power density was observed at 5 Hz, with an exponential decrease as the propagation distance increased. Simulation results align with the theoretical formula, and Figure 17 illustrates the acceleration probability density curves for the 0–50 Hz and 4–6 Hz frequency ranges.
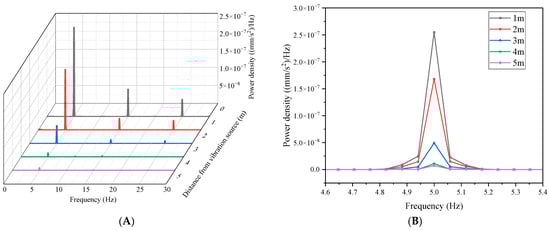
Figure 17.
Power density plot of simulation results. (A) 0–50 Hz; (B) 4.6–5.4 Hz.
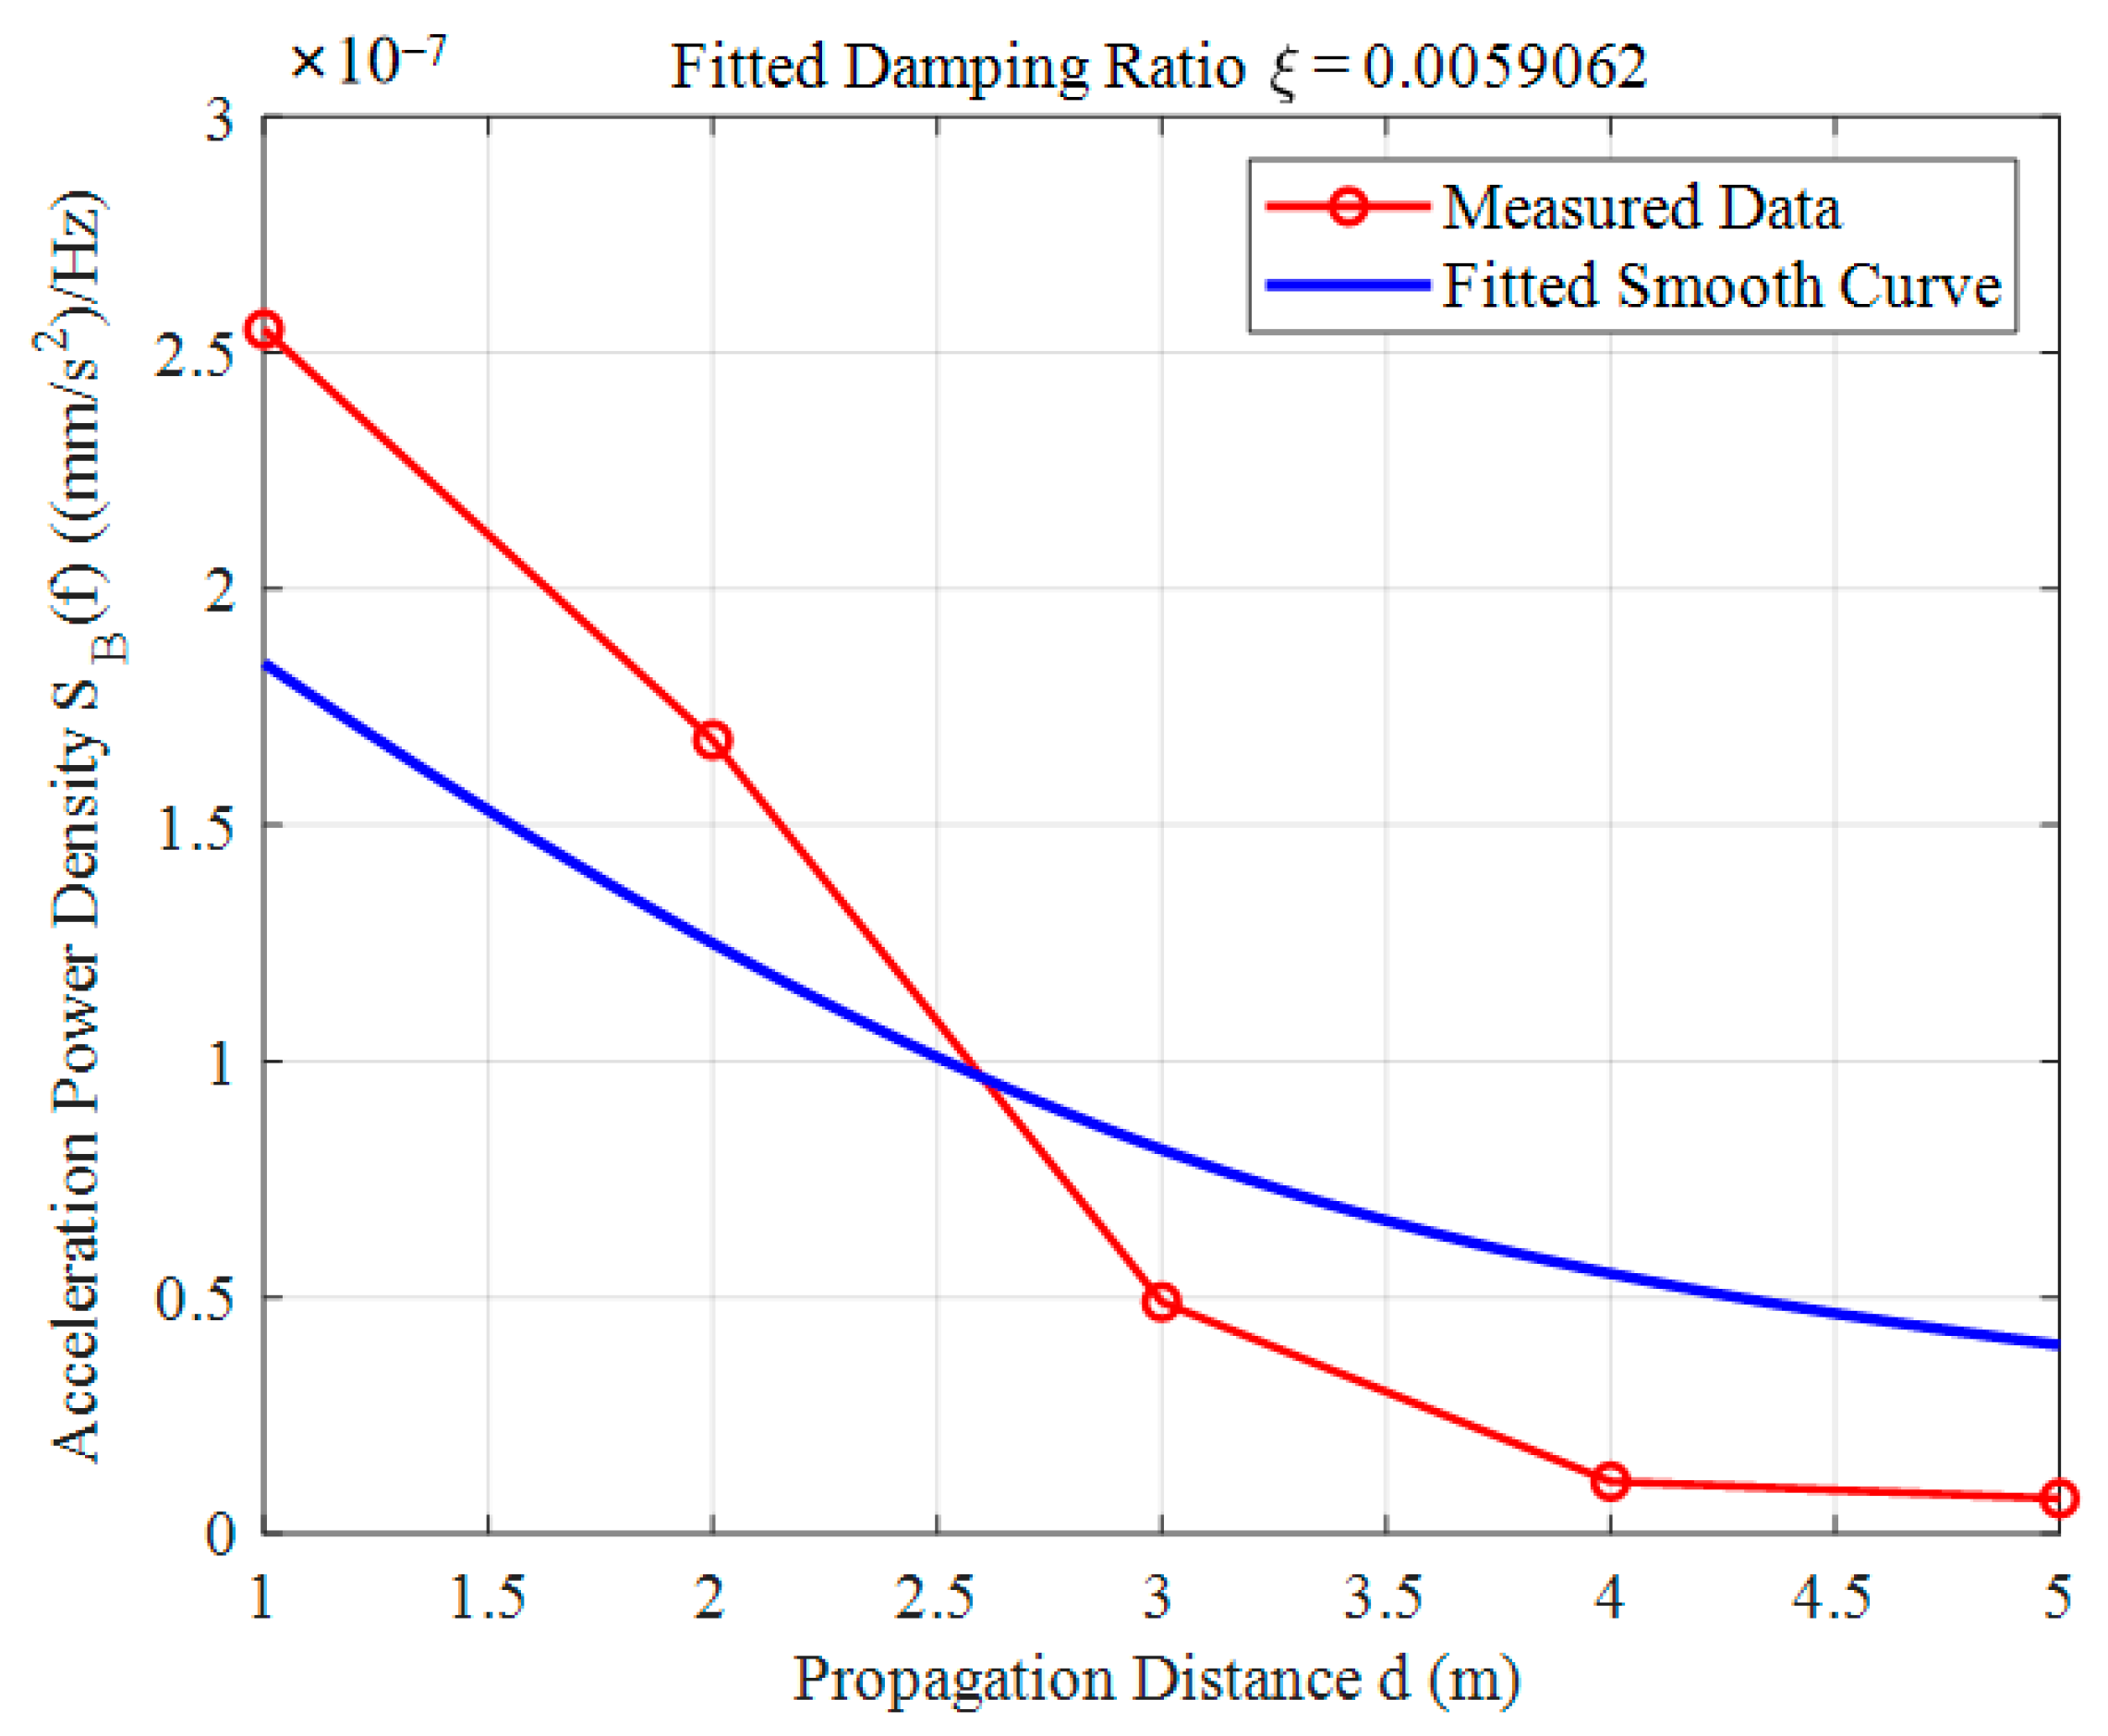
The vibration acceleration power density data were processed using the formula in Equation (2), resulting in a calculated damping ratio of 0.059062. The corresponding fitting curve is presented in Figure 18.

Figure 18.
Numerical model power density fitting curve.
This value is very close to the initial damping ratio of 0.05 set in the model parameters, indicating that the numerical simulation results are highly accurate. Furthermore, the attenuation trend of the acceleration power density generally follows an exponential decay pattern. However, a detailed analysis of the simulation results reveals that the primary deviations in the power density curve are concentrated within the 2–3 m range. Specifically, within this interval, a significant attenuation of acceleration power density is observed. For instance, at a distance of 2 m from the vibration source, the acceleration power density is 1.68 × 10⁻⁷ ((mm/s2)/Hz), while, at 3 m, this value rapidly decreases to 4.9 × 10⁻⁸ ((mm/s2)/Hz). This substantial attenuation is not observed in other distance ranges, indicating that the energy dissipation mechanism within the 2–3 m range may differ from that of other areas.
5. Discussion
This study conducts a comprehensive analysis of vibration characteristics induced by shield tunneling construction, integrating theoretical derivation, on-site monitoring, and numerical simulation. It systematically investigates the attenuation patterns of vibration energy, directional vibration responses, and validates theoretical models using numerical methods. These findings provide valuable theoretical insights and practical guidance for engineering applications. The key findings are summarized as follows:
5.1. Distribution and Attenuation Patterns of Vibration Energy
Vibration monitoring data from the Jinan Metro Line 4 project reveal that vibration energy is primarily concentrated within the low-frequency range of 3–4 Hz and follows a distinct exponential attenuation trend during propagation. The data show that vibration displacement gradually decreases outward from the shield machine head (0 m) for both the construction and adjacent tunnels. At a distance of 4.5 m from the vibration source, the acceleration power density diminishes to approximately 15%, and beyond 10 m, vibration signals become nearly undetectable, signifying complete energy dissipation. This behavior aligns with the distance effect principle, where vibration wave intensity inversely correlates with propagation distance. As the distance increases, vibration energy is progressively absorbed by soil and tunnel structures, leading to continuous attenuation of vibration displacement.
Numerical simulations further highlight this attenuation, showing that, at a 5 m distance, the acceleration power density reduces to below 10%, confirming the localized nature of vibration impact. However, high-frequency vibrations, although they are present, cause relatively weak responses compared to low-frequency waves, due to their rapid attenuation. In the higher frequency range, vibrations dissipate more quickly, resulting in a much smaller impact on the tunnel structure and surrounding areas.
On-site monitoring data may exhibit additional complexity due to interference from other vibration sources, such as shield cutterhead vibrations or construction machinery noise. These findings provide a robust scientific foundation for evaluating the effects of tunnel construction on surrounding infrastructure and for optimizing vibration monitoring and safety assessment strategies.
5.2. Axial and Radial Vibration Characteristics
An analysis of Figure 4, Figure 5 and Figure 6 reveals that, in the tunnel on the construction side, vibration displacement in the three directions follows the order of axial > radial > vertical. During shield tunneling, the majority of vibration energy propagates along the axial direction, resulting in the most intense axial vibrations. In contrast, radial and vertical vibrations, while weaker, still show noticeable responses.
For the adjacent tunnel, distinct vibration characteristics are observed. Data from Figure 8, Figure 9 and Figure 10 indicate that vibration displacement follows the order of radial > axial > vertical. Radial vibrations are particularly pronounced, especially near the vibration source. In the construction-side tunnel, vibration energy propagates further along the axial direction due to the thrust and cutting forces of the shield machine. In contrast, vibration energy in the adjacent tunnel follows a shorter radial path, leading to higher energy concentration. These findings suggest the need for differentiated vibration control measures for both the construction-side and adjacent tunnels to optimize construction planning.
5.3. Validation of Theoretical Models Through Numerical Simulation
Numerical simulation results using PFC3D further confirm the reliability and accuracy of the theoretical models. The model’s input damping ratio was set to 0.5, while the reverse-calculated damping ratio in the simulation was 0.59, showing a high degree of consistency. This agreement not only reinforces the appropriateness of the simulation model parameters but also provides valuable insights for both theoretical analysis and practical applications. Moreover, the simulated attenuation trend of vibration energy closely matches theoretical predictions and on-site monitoring data, validating the accuracy of the energy distribution patterns and establishing a strong foundation for predicting and assessing the vibration impact of shield tunneling construction.
The simulation also reveals localized anomalies in vibration propagation. Between 2 and 3 m from the vibration source, the acceleration power density shows an unexpected decrease, indicating a unique energy dissipation mechanism. This phenomenon could be linked to the propagation of localized microcracks in concrete segments or material nonlinear behaviors that dissipate energy. The presence of cracks not only weakens vibration energy transmission but may also alter the local stress field, resulting in more complex vibration response patterns. Additionally, soil heterogeneity and the effects of vibration wave reflection and scattering at the concrete–soil interface may contribute to this anomaly.
These findings underscore that localized vibration anomalies could pose potential risks during shield construction, highlighting the need for further investigation. Optimizing the crack resistance of segment materials and improving structural design can reduce the impact of crack propagation on energy dissipation. Additionally, monitoring localized vibration anomalies with high-precision sensors and dynamically adjusting construction parameters through numerical simulations can help minimize risks to structural safety.
5.4. Significance of Vibration Control and Mitigation
This research offers valuable insights and guidance for vibration control in shield tunneling construction. The spatial limitations of vibration impact highlight the need to prioritize monitoring and mitigation measures within 5 m of the vibration source, with special attention given to critical structures near the source. Furthermore, since vibration energy is predominantly concentrated in the low-frequency range of 3–5 Hz, implementing vibration filtering for this frequency range is crucial to effectively reduce its impact on the surrounding environment.
The observed directional differences in vibration responses provide important clues for optimizing vibration control strategies. In the construction-side tunnel, where axial vibration predominates, adjusting shield machine parameters—such as thrust uniformity and cutterhead design—can help reduce axial vibration intensity. For adjacent tunnels, focusing on radial vibration mitigation through stronger segment reinforcement or the use of high-damping materials can enhance vibration absorption and dissipation.
Additionally, numerical simulation validation strengthens the reliability of the theoretical model, facilitating the development of more accurate vibration control plans. Identifying localized energy dissipation anomalies through simulations enables targeted mitigation measures in critical areas, thus improving vibration control efficiency. Optimizing construction parameters—such as advancing speed, cutterhead rotation, and excavation pressure—based on simulation results can further minimize the vibration impact on surrounding structures.
These findings contribute to a deeper understanding of vibration characteristics during shield tunneling construction, providing theoretical support for the development of more effective vibration control strategies.
6. Conclusions
Through theoretical derivation, on-site monitoring, and numerical simulation, this paper systematically analyzes the tunnel vibration characteristics triggered during shield construction and draws the following main conclusions:
- (1)
- Vibration energy distribution and attenuation law: Vibration energy is mainly concentrated in the low-frequency band of 3–4 Hz, and there is an exponential attenuation trend in the propagation process. This shows that the vibration impact of shield construction on the surrounding structure has obvious spatial limitations, and the vibration energy is rapidly decaying in the area closer to the vibration source.
- (2)
- Tunnel axial and radial vibration characteristics: The axial vibration response on the construction tunnel side is the strongest, which gradually decays with increasing distance, while the radial vibration response on the neighboring tunnel side is more significant. This difference is due to the different characteristics of the vibration propagation path and the soil medium.
- (3)
- Verification of theoretical model and numerical simulation: Numerical simulation based on PFC3D verifies the correctness of the theoretical formulas, and further reveals the important role of the damping effect of the soil medium and segment structure in the vibration propagation process. The fitting results show that the variation in the damping ratio is in line with the actual situation, which provides a reliable basis for vibration energy prediction.
Author Contributions
Conceptualization, Y.W. and S.Y.; methodology, B.D. and R.W.; software, Y.W. and S.Y.; validation, S.Y. and B.D.; data curation, S.Y., B.D. and R.W.; writing—original draft, Y.W. and S.Y.; writing—review and editing, B.D. and R.W.; visualization, R.W. and S.Y.; supervision, Y.W. and B.D.; funding acquisition, Y.W. and R.W. All authors have read and agreed to the published version of the manuscript.
Funding
The research reported in this paper has been funded by the National Natural Science Foundation of China (51778633); the China Railway Construction Corporation 2022 Annual Scientific and Technological Research and Development Plan and Funding Subjects (2022-C1); and the Science and technology research and development plan topics of China Railway Second Bureau Group Co. (2022-B-4).
Institutional Review Board Statement
Not applicable.
Informed Consent Statement
Not applicable.
Data Availability Statement
The datasets generated during and/or analyzed during the current study are available from the corresponding author upon reasonable request. The data are not publicly available due to the policies adhered to in our laboratory.
Acknowledgments
We would like to acknowledge the reviewers and editors for their valuable comments and suggestions.
Conflicts of Interest
The authors declare no conflicts of interest.
References
- Zhou, C.; Feng, Q.; He, W. Research review on environmental vibrations in metro depot and over-track buildings induced by train operation. Traffic Transp. Eng. 2023, 23, 27–46. (In Chinese) [Google Scholar]
- Feng, Q.; Lei, X.; Lian, S. Review of researches on environmental vibration induced by high-speed trains. East. China Jiaotong Univ. 2008, 25, 1–5. (In Chinese) [Google Scholar]
- Ma, L.; Liu, W. Sliced finite element-infinite element coupling model for predicting environmental vibration induced by metro train. Chin. Rock Mechan. Eng. 2016, 35, 2131–2141. (In Chinese) [Google Scholar]
- Jin, Q.; Thompson, D.; Lurcock, D.; Ntotsios, E. The shadow effect on the ground surface due to vibration transmission from a railway tunnel. Transp. Geotech. 2020, 23, 100335. [Google Scholar] [CrossRef]
- Wu, K.; Zheng, Y.; Li, S.; Sun, J.; Han, Y.; Hao, D. Vibration response law of existing buildings affected by subway tunnel boring machine excavation. Tunn. Undergr. Space Technol. 2022, 120, 104318. [Google Scholar] [CrossRef]
- Wang, X.; Han, X.; Zhou, H. Numerical Simulation on Vibration Response of Surrounding Ancient Buildings Induced by Shield Tunneling: Case Study on Line 8 of Beijin el Construction. Tunn. Constr. 2013, 33, 822–827. (In Chinese) [Google Scholar]
- Wu, J.; Liu, Q.; Zhang, X.; Zhou, C.; Yin, X.; Xie, W.; Liang, X.; Huang, J. Attenuation characteristics of impact-induced seismic wave in deep tunnels: An in situ investigation based on pendulum impact test. J. Rock Mech. Geotech. Eng. 2022, 14, 494–504. [Google Scholar] [CrossRef]
- Landar, S.; Velychkovych, A.; Ropyak, L.; Andrusyak, A. A Method for Applying the Use of a Smart 4 Controller for the Assessment of Drill String Bottom-Part Vibrations and Shock Loads. Vibration 2024, 7, 802–828. [Google Scholar] [CrossRef]
- Belov, V.; Rybak, S.; Tartakovski, B. Propagation of vibrational energy in absorbing structures. Sov. Phys. Acoust.-USSR 1977, 23, 115–119. [Google Scholar]
- Nefske, D.J.; Sung, S.H. Power Flow Finite Element Analysis of Dynamic Systems: Basic Theory and Application to Beams. J. Vib. Acoust. 1989, 111, 94–100. [Google Scholar] [CrossRef]
- Wohlever, J.; Bernhard, R. Mechanical energy flow models of rods and beams. J. Sound Vib. 1992, 153, 1–19. [Google Scholar] [CrossRef]
- Wohlever, J.; Bernhard, R. Energy distributions in rods and beams. In Proceedings of the AIAA 12th Aeroacoustics Conference, San Antonio, TX, USA, 10–12 April 1989. [Google Scholar] [CrossRef]
- Bouthier, O.; Bernhard, R. Simple models of energy flow in vibrating membranes. J. Sound Vib. 1995, 182, 129–147. [Google Scholar] [CrossRef]
- Bouthier, O.; Bernhard, R. Simple models of the energetics of transversely vibrating plates. J. Sound Vib. 1995, 182, 149–164. [Google Scholar] [CrossRef]
- Bernhard, R.J.; Huff, J.E., Jr. Structural-acoustic design at high frequency using the energy finite element method. Int. Des. Eng. Tech. Conf. Comput. Inf. Eng. Conf. 1995, 97652, 565–576. [Google Scholar]
- Wang, X.; Han, X.; Zhou, H.; Lei, C. A method to predict vibration responses induced by metro shield tunneling. China Civ. Eng. J. 2015, 48, 222–227. (In Chinese) [Google Scholar]
- Gupta, S.; Stanus, Y.; Lombaert, G.; Degrande, G. Influence of tunnel and soil parameters on vibrations from underground railways. J. Sound Vib. 2009, 327, 70–91. [Google Scholar] [CrossRef]
- Suwansawat, S.; Einstein, H.H. Describing settlement troughs over twin tunnels using a superposition technique. J. Geotech. Geoenvironmental Eng. 2007, 133, 445–468. [Google Scholar] [CrossRef]
- Ivan, S.; Andrii, V. Analytical Model of Structural Damping in Friction Module of Shell Shock Absorber Connected to Spring. Shock. Vib. 2023, 2023, 4140583. [Google Scholar]
- Chehade, F.H.; Shahrour, I. Numerical analysis of the interaction between twin-tunnels: Influence of the relative position and construction procedure. Tunn. Undergr. Space Technol. 2008, 23, 210–214. [Google Scholar] [CrossRef]
- Funatsu, T.; Hoshino, T.; Sawae, H.; Shimizu, N. Numerical analysis to better understand the mechanism of the effects of ground supports and reinforcements on the stability of tunnels using the distinct element method. Tunn. Undergr. Space Technol. 2008, 23, 561–573. [Google Scholar] [CrossRef]
- Papadopoulos, M.; François, S.; Degrande, G.; Lombaert, G. The influence of uncertain local subsoil conditions on the response of buildings to ground vibration. J. Sound Vib. 2018, 418, 200–220. [Google Scholar] [CrossRef]
- Comodromos, E.M.; Papadopoulou, M.C.; Konstantinidis, G.K. Numerical assessment of subsidence and adjacent building movements induced by TBM-EPB tunneling. J. Geotech. Geoenvironmental Eng. 2014, 140, 04014061. [Google Scholar] [CrossRef]
- Ding, D. Prediction of vibrations from underground trains on Beijing metro line 15. J. Cent. South Univ. Technol. 2010, 17, 1109–1118. (In Chinese) [Google Scholar] [CrossRef]
- Oliaei, M.; Manafi, E. Static analysis of interaction between twin-tunnels using discrete element method (DEM). Sci. Iran. 2015, 22, 1964–1971. [Google Scholar]
- Kuo, K.; Verbraken, H.; Degrande, G.; Lombaert, G. Hybrid predictions of railway induced ground vibration using a combination of experimental measurements and numerical modelling. J. Sound Vib. 2016, 373, 263–284. [Google Scholar] [CrossRef]
- Gu, G.; Zhang, Z.; Huang, X.; Li, Y.; Lei, Q. A finite element-based dynamic simulation method for modeling shield-ground interactions: 3D numerical simulations with comparison to physical experiments. Comput. Geotech. 2024, 169, 106262. [Google Scholar] [CrossRef]
- Mücahit, N.; Fuat, A. Investigation of effects of dynamic loads in metro tunnels during construction and operation on existing buildings. Arab. J. Geosci. 2020, 13, 424. [Google Scholar]
- Zhang, X.; Qu, H.; Xu, Y.; Zhang, L.; Zhang, Z. Investigating the damage to masonry buildings during shield tunneling: A case study in Hohhot Metro. Eng. Fail. Anal. 2024, 160, 108147. [Google Scholar] [CrossRef]
- Yan, B.; Wang, R.; Ding, B.S.; Dai, F.; Wang, Y. Numerical simulation analysis of tunnel backfill grout based on DEM-FDM coupling and particle inle. Undergr. Space 2024, 14, 285–299. [Google Scholar] [CrossRef]
- Yan, B.; Wang, R.; Wang, Y. Deformation of adjacent buildings and ground settlement induced by shield construction of three-line small-spacing tunnels. Alex. Eng. J. 2023, 79, 237–251. [Google Scholar] [CrossRef]
- Zhang, Y.Q.; Cao, W.G.; Zhou, S.H.; Zhou, S.; Xing, J.; Huang, Y. Prediction of three-dimensional subface and subsurface settlement caused by shield tunnelling based on Peck formula. J. Railw. Sci. Eng. 2021, 18, 153–161. [Google Scholar]
- Zhang, B.; Ma, X.; Cao, W. Study on the vibration distribution law of shield construction in sand gravel layer. Constr. Technol. 2013, 42, 103–106. [Google Scholar]
- Wang, X.; Han, X.; Zhou, H. Research on environment vibration response induced by metro shield tunneling in central urban area. China Civ. Eng. J. 2015, 48, 309–314. (In Chinese) [Google Scholar]
- Ma, M.; Liu, W.; Wang, W. Analysis on the reasons of ground vibration amplification induced by railway traffic. Eng. Mech. 2013, 30, 275–280, 309. (In Chinese) [Google Scholar]


Disclaimer/Publisher’s Note: The statements, opinions and data contained in all publications are solely those of the individual author(s) and contributor(s) and not of MDPI and/or the editor(s). MDPI and/or the editor(s) disclaim responsibility for any injury to people or property resulting from any ideas, methods, instructions or products referred to in the content. |
© 2025 by the authors. Licensee MDPI, Basel, Switzerland. This article is an open access article distributed under the terms and conditions of the Creative Commons Attribution (CC BY) license (https://creativecommons.org/licenses/by/4.0/).