Article

Automated Gluten Detection in Bread Images Using Convolutional Neural Networks

1
Department of Computer Science, Shamoon College of Engineering, Be’er Sheva 8410501, Israel
2
Department of Information System, The Max Stern Yezreel Valley College, Emek Yezreel 1930600, Israel
3
Department of Electrical and Electronics Engineering, Shamoon College of Engineering, Be’er Sheva 8410501, Israel
*
Authors to whom correspondence should be addressed.
These authors contributed equally to this work.
Appl. Sci. 2025, 15(4), 1737; https://doi.org/10.3390/app15041737
Submission received: 3 January 2025 / Revised: 2 February 2025 / Accepted: 4 February 2025 / Published: 8 February 2025
(This article belongs to the Special Issue Convolutional Neural Networks and Computer Vision)

Abstract

:
Celiac disease and gluten sensitivity affect a significant portion of the population and require adherence to a gluten-free diet. Dining in social settings, such as family events, workplace gatherings, or restaurants, makes it difficult to ensure that certain foods are gluten-free. Despite the availability of portable gluten testing devices, these instruments have high costs, disposable capsules, depend on user preparation and technique, and cannot analyze an entire meal or detect gluten levels below the legal thresholds, potentially leading to inaccurate results. In this study, we propose RGB (Recognition of Gluten in Bread), a novel deep learning-based method for automatically detecting gluten in bread images. RGB is a decision-support tool to help individuals with celiac disease make informed dietary choices. To develop this method, we curated and annotated three unique datasets of bread images collected from Pinterest, Instagram, and a custom dataset containing information about flour types. Fine-tuning pre-trained convolutional neural networks (CNNs) on the Pinterest dataset, our best-performing model, ResNet50V2, achieved 77% accuracy and recall. Transfer learning was subsequently applied to adapt the model to the Instagram dataset, resulting in 78% accuracy and 77% recall. Finally, further fine-tuning the model on a significantly different dataset, the custom bread dataset, significantly improved the performance, achieving an accuracy of 86%, precision of 87%, recall of 86%, and F1-score of 86%. Our analysis further revealed that the model performed better on gluten-free flours, achieving higher accuracy scores for these types. This study demonstrates the feasibility of image-based gluten detection in bread and highlights its potential to provide a cost-effective non-invasive alternative to traditional testing methods by allowing individuals with celiac disease to receive immediate feedback on potential gluten content in their meals through simple food photography.

1. Introduction

Celiac disease is an immune-mediated disease triggered by gluten consumption in genetically susceptible individuals [1]. Gluten is a protein complex found in wheat, rye, and barley [2]. Celiac disease is estimated to affect 0.6% to 1.0% of the world’s population [3].
Gluten consumption for people with celiac disease carries significant health risks, primarily due to the malabsorption of nutrients and persistent damage to the intestines [4]. Multiple organ systems may be affected, resulting in deficiencies in vitamins and minerals, such as calcium, iron, and vitamin D [5]. This can lead to conditions, such as anemia, osteopenia, fractures, and reduced bone mineral density (BMD) [6] and an increased risk of cancer [7].
Celiac disease patients must adhere to a strict gluten-free diet throughout their lives, which is currently the only effective treatment [8]. As part of the gluten-free diet, celiac patients must pay particular attention to the food products that they consume, checking the ingredients to ensure that they do not contain gluten, as even small traces of gluten can have serious health consequences [9]. This may be a daily challenge, especially when eating out. Indivduals with celiac disease should ensure their food is entirely gluten-free when dining in social settings, such as family events, workplace gatherings, and restaurants.
Today, many restaurants offer gluten-free menu options, making it easier for individuals with celiac disease to consume gluten-free food outside their homes. However, dining out may pose a risk for individuals with celiac disease, since they must depend on restaurant staff to ensure that their meals are gluten-free. In some cases, unintentional errors can occur, making it difficult to guarantee with complete certainty that a food is gluten-free. The restaurant staff may not be aware that certain ingredients contain gluten, leading to accidental exposure to gluten. There have been cases in which severe allergic reactions have led to tragic outcomes due to unintentional mistakes made by restaurants. In one instance, a person allergic to sesame tragically died after being served a dish containing sesame despite informing the restaurant of his allergy [10]. Furthermore, a young girl with a life-threatening dairy allergy died after being exposed to cow milk, despite her mother’s instructions to avoid cow milk [11]. Consequently, celiac patients may feel anxious and uncertain about eating outside the home. The availability of accurate and reliable tools that aid in verifying the presence of gluten in food could greatly enhance their sense of safety and confidence when dining in social situations.
Currently, devices like NimaTM [12] can be used to test small samples of food for gluten, but these tools come with several limitations. Each test requires a disposable capsule, making the sensor an expensive item to purchase and maintain. Furthermore, celiac disease patients must remember to carry the sensor and its capsules. The reliability of the test devices may vary depending on the food and the user technique [13]. The sensor itself only analyzes a small portion of the food, which may not fully represent the meal, leading to gluten that can be missed in other parts of the dish. Additionally, NimaTM detects gluten only when its concentration exceeds a legal threshold, meaning it may fail to identify trace amounts below this limit [14].
Recent advancements in food safety technology leverage machine learning and computer vision to enhance food monitoring, authentication, and contamination detection [15,16]. Traditional gluten detection methods, such as Nima™ sensors, rely on chemical testing, which can be costly, time-consuming, and prone to errors due to sample size limitations. In contrast, computer vision-based approaches offer a scalable, cost-effective, and non-invasive alternative for food analysis, reducing reliance on specialized equipment and enabling real-time decision making.
Deep learning models, particularly convolutional neural networks (CNNs), have been successfully applied to various food safety applications, such as detecting food adulteration, monitoring quality control in food production, and identifying contaminants [17]. These technologies are now being explored for gluten detection, where they can analyze complex visual features in food images to assess the likelihood of gluten presence.
By harnessing these advancements, we introduce a novel method that applies deep learning to gluten detection in bread images. This approach has the potential to significantly improve accessibility for individuals with celiac disease by allowing them to verify food safety quickly and conveniently through image-based analysis.
In this study, we propose RGB(Recognition of Gluten in Bread), a novel deep learning-based method designed to support individuals with celiac disease by providing a decision-support tool for automatically detecting gluten in bread images. We collected three datasets of bread images from social media platforms, including both gluten-containing and gluten-free bread: Pinterest, Instagram, and custom bread datasets. Using the Pinterest bread dataset, we fine-tuned six pre-trained CNN models. The best-performing model was ResNet50V2, achieving 77% accuracy and recall on the testing set. To assess its generality, we then evaluated the trained ResNet50V2 model on the Instagram bread dataset. By re-training the model on images from Pinterest and Instagram, we improved the model’s performance to successfully differentiate between gluten-containing and gluten-free bread images, achieving 78% accuracy and 77% recall.
Later, using the custom bread dataset, which differed from the other two datasets sourced from social media and included information about the type of flour used in its preparation, we analyzed the performance of the ResNet50V2 model on each type of flour. The analysis indicates that the model achieved higher accuracy scores on gluten-free flours, demonstrating better performance detecting these types. This analysis not only highlights the model’s potential for detecting gluten-free flours but also opens the door to broader applications of such methods. By refining and expanding these capabilities, this work lays the groundwork for developing practical tools to enhance the quality of life for individuals with celiac disease.
This paper provides three contributions:
  • We present RGB, a novel method for detecting gluten in bread images using a deep learning model designed to support individuals with celiac disease by providing a decision-support tool, helping them make informed decisions when uncertain about whether a bread product is safe to eat;
  • We curated and annotated three unique datasets of bread images from different sources, including Pinterest, Instagram, and a custom dataset containing information about the type of flour used in bread preparation. These datasets provide a valuable resource for training and evaluating machine learning models in the context of gluten detection and could serve as a foundation for further research in this field;
  • We evaluated the generalization capability of the proposed method by testing the model trained on independent datasets collected from Pinterest and Instagram. This evaluation highlights the robustness of the model in adapting to different image sources and varying visual characteristics, providing insights into its applicability in real-world scenarios.
  • We analyzed the performance of the proposed method across different types of flours using the custom bread dataset, which includes information about the flour type used in each bread sample. This analysis revealed variability in the detection accuracy, offering deeper insights into the model’s strengths and limitations when applied to specific flour types.

2. Related Work

2.1. Classification of Food Images Using CNNs

Transfer learning is a machine learning technique that leverages a model trained on one task and adapts it to a related task [18]. As part of deep learning and specifically CNN, instead of training a CNN from scratch, which is computationally intensive and requires a large labeled dataset, existing models trained on massive datasets (e.g., ImageNet) can be used as a starting point [19]. The process typically involves freezing the model’s earlier layers, which have learned to detect basic features, such as edges, textures, and shapes, and then fine-tuning only the later layers. Using this technique, the model can retain its general image recognition capabilities while adjusting to more specific details of the new task, such as food classification [20]. Several studies have explored the application of transfer learning and CNNs for food recognition and classification.
For example, Yadav et al. [21] evaluated SqueezeNet and VGG16 for food image classification. The VGG16 achieved 85.07% accuracy by fine-tuning hyperparameters and augmenting the data. Razali et al. [22] collected a dataset called Sabah Food, which contains 11 categories of popular Sabah food. VIREO-Food172, which contains 172 food categories, was also used. Ten popular Chinese dishes were examined. EfficientNet achieved the highest classification accuracy of 94.01% on the Sabah Food dataset and 86.57% on the VIREO-Food172 dataset.
A study by Moumane et al. [23] applied the MobileNetV2 architecture to identify 190 food categories with an accuracy level of approximately 77.2%. Another study by Patel and Modi [24] applied the MobileNetV3 model to approximately 2700 images of Indian food, achieving an accuracy level of up to 93.3%. Additionally, Boyd et al. [25] compared seven CNN architectures for classifying a custom dataset of 41,949 images across 20 food classes, with DenseNet emerging as the top performer, achieving a training accuracy of 74%. In the study of Thiodorus et al. [26], 304 images from 76 tray boxes were used, categorized into four classes (blank, fried rice, egg, and cucumber). The proposed ResNet-18 model outperformed the GoogLeNet model. Lastly, Kareem et al. [27] used a modified version of ResNet-50, called MResNet-50, in conjunction with natural language processing (NLP) algorithms, such as Word2Vec and Transformers, to classify images and extract ingredient information from them. MResNet-50 outperformed ResNet-50, achieving higher accuracy.
The use of CNNs in food classification has been widely demonstrated, with high accuracy yielded across a broad range of food datasets. Despite these advancements, none of the existing studies specifically identify the presence of gluten in food.

2.2. Identification of Celiac Disease Using Images

In several studies, CNN architecture was applied to identify celiac disease. Wei et al. [28] attempted to detect celiac disease from duodenal biopsy slides. The researchers collected 1230 photographs from 1048 patients undergoing duodenal biopsies and applied a residual convolutional neural network to the data. The classification accuracy for celiac disease was 95.3%, for normal tissue was 91.0%, and for non-specific duodenitis was 89.2%. CNN was also proposed by Kowsari et al. [29] for the classification of images of duodenal biopsy taken from subjects suffering from celiac disease and environmental enteropathy. Using a cohort of 1000 biopsy images, Kowsari et al. evaluated the performance of the model, achieving an area under the ROC (receiver operating characteristic) curve of 97% for celiac disease. Additionally, Carreras [30] classified images of celiac disease, small intestinal control, duodenal inflammation, duodenal adenocarcinoma, and Crohn’s disease using ResNet-18. The researchers classified celiac disease images with high-performance metrics: accuracy 99.7%, precision 99.6%, recall 99.3%, F1-score 99.5%, and specificity 99.8%.
Keskin Bilgiç et al. [31] employed VGG16 to identify distinct facial features that distinguish celiac disease patients from healthy individuals. This study utilized a dataset containing 200 facial images of adult individuals with and without celiac disease. An accuracy of 73% was achieved during model testing.

2.3. The Identification of Gluten Presence in Food Using Images

Several studies have examined the use of deep learning to detect gluten in flour. Jossa-Bastidas et al. [32] developed a system that combines near-infrared spectroscopy technology with deep learning and machine learning algorithms to predict whether flour samples contain gluten or not. A total of 12,053 samples were collected from three different types of flour (rye, corn, and oats). The method involves shining near-infrared light on flour and measuring the light reflected back, which provides information about the chemical composition of the flour. Concerning performance, the XGBoost classifier achieved an accuracy of 94.52% and an F2-score of 92.87%, while the deep neural network achieved an accuracy of 91.77% and an F2-score of 96.06%.
Pradana-Lopez et al. [33] detected wheat flour traces in a gluten-free product, such as chickpea flour. A total of 1400 photographs were taken of pure and mixed flour samples. Using a ResNet50 model, these images were classified into 14 groups based on the concentration of wheat flour, which varied from 0 to 50 parts per million. The overall accuracy of the testing set was greater than 93%. Similarly, Pradana-López et al. [34] identifed lentil flour samples containing trace amounts of wheat (gluten) or pistachios (nuts) using the ResNet34 algorithm. Based on 2200 images, the wheat model was trained and achieved 96.4% accuracy on a testing set consisting of 25 wheat flour samples.
While previous research has focused on identifying gluten using images of various flour types, none have explored gluten content in other foods. Our study focused specifically on bread products, with the aim of developing a model that can accurately identify gluten presence from image data alone. This method offers a novel contribution by offering a non-invasive quick assessment tool that can benefit both individuals with gluten sensitivities, patients with celiac disease, and the food industry.

3. Materials and Methods

3.1. Gluten-Free and Gluten-Containing Bread
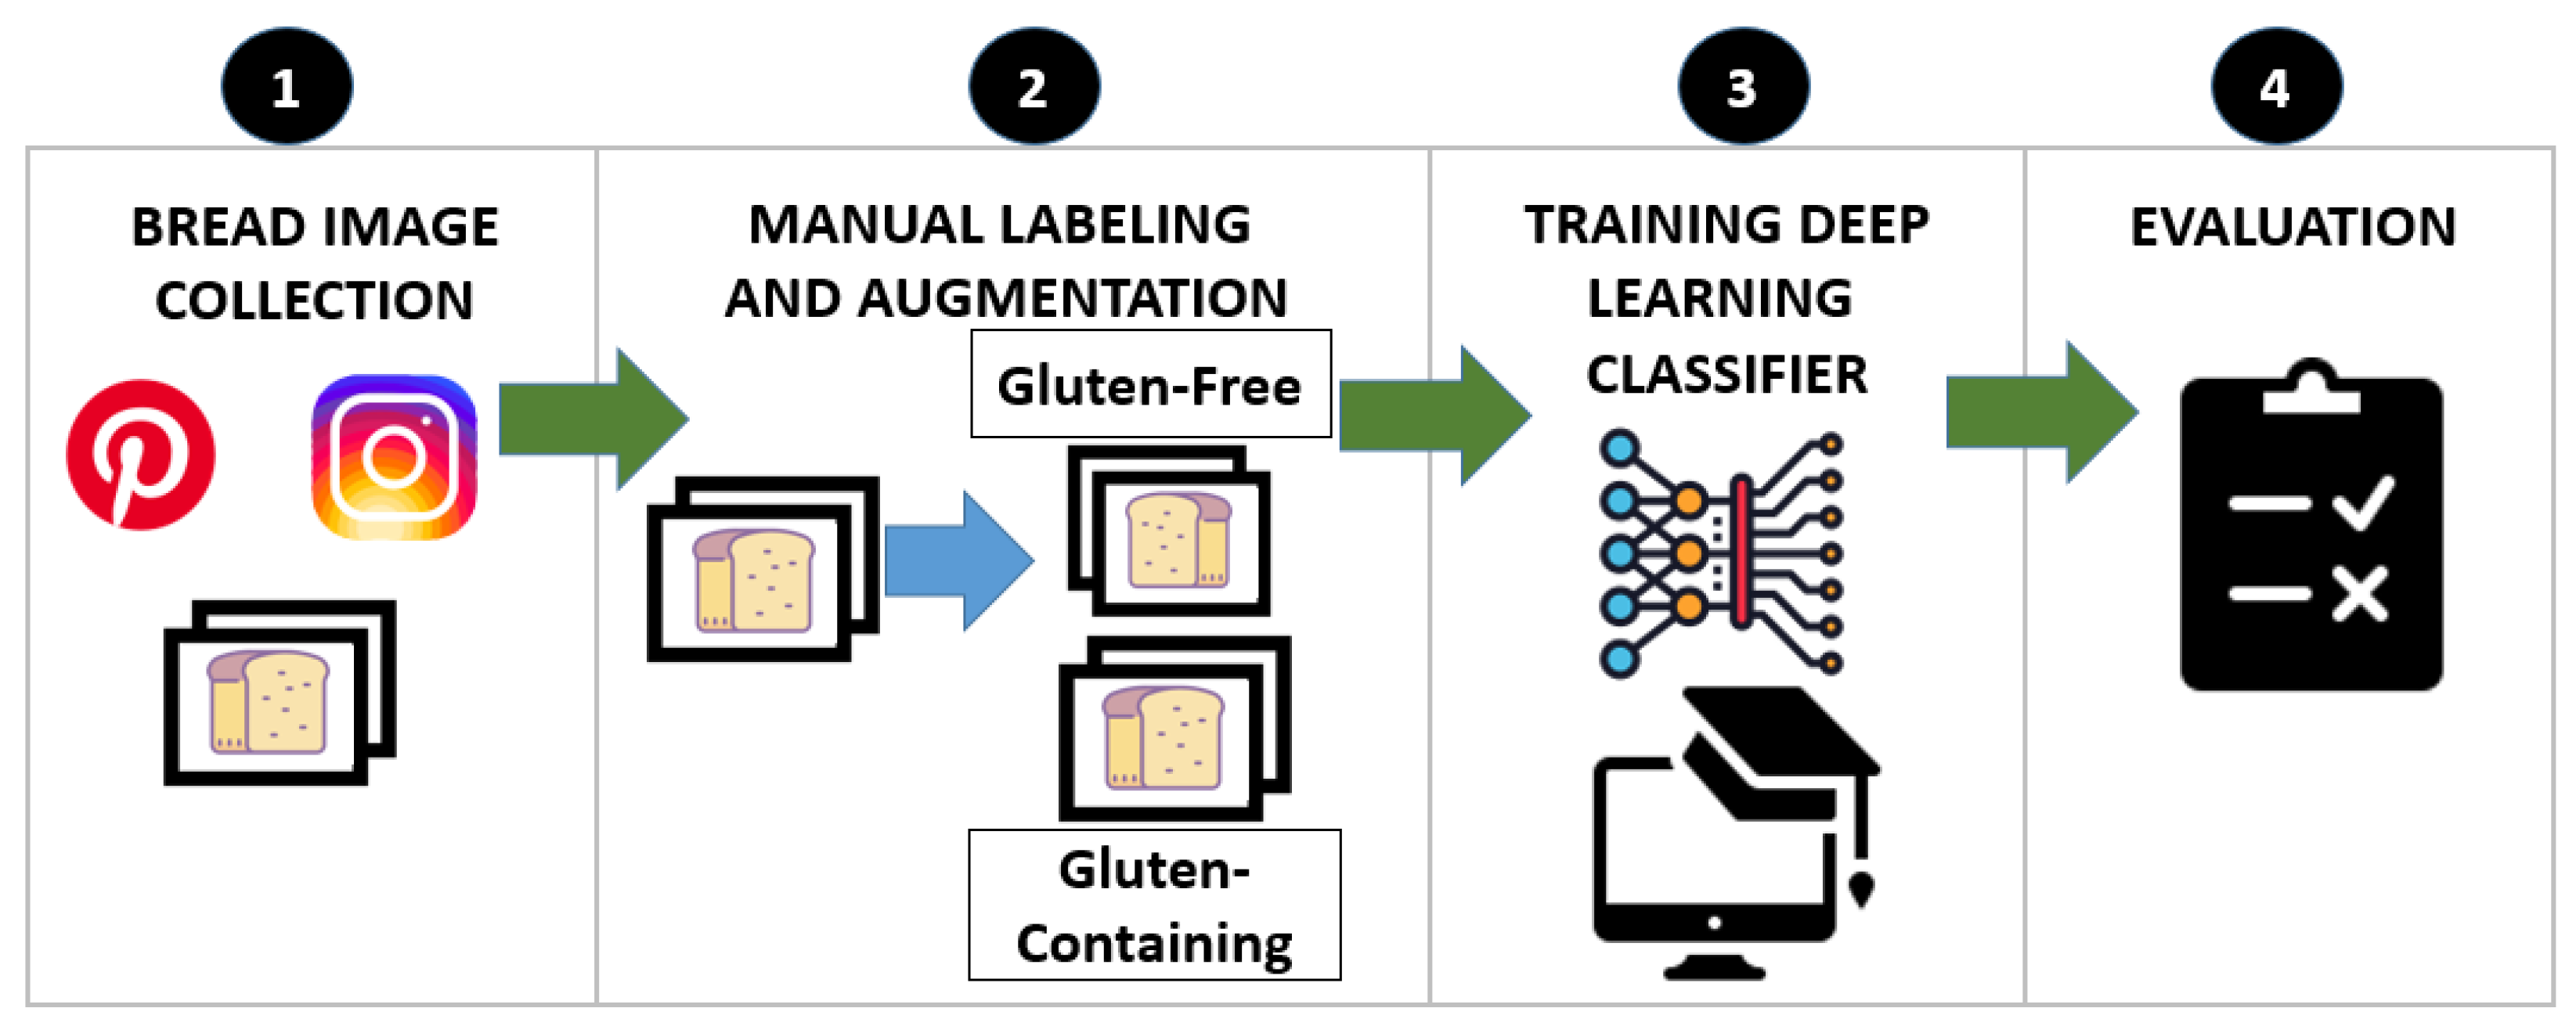
Due to the absence of gluten, gluten-free doughs differ from gluten-based doughs in terms of their structure and properties [35]. Gluten consists primarily of interstitial disordered storage proteins (glutenins and gliadins) that can form networks of megadalton size. These networks are responsible for the unique viscoelastic properties of wheat dough, which affect its elasticity and extensibility [36,37,38]. These networks enable the dough to trap gas [38,39], resulting in a foam structure in which gas cells are separated by a continuous starch–gluten matrix. This structure results in a spongy texture in the bread, resulting in a light and even crumb texture [38,39,40,41]. In contrast, gluten-free doughs, which lack this protein network, are characterized as being less cohesive, less elastic, with a more dense structure [42].
There is a noticeable difference between images of gluten-containing breads (see Figure 1(1–3)) and gluten-free breads (see Figure 1(4–6)). We can see that the gluten-free bread lacks this cohesive structure, resulting in irregular air bubbles and a less uniform texture compared to gluten-containing breads. Through the use of these imaging techniques, it is possible to effectively distinguish between gluten-based and gluten-free breads based on their visual appearance.

3.2. RGB Method

To develop an effective deep learning model for identifying the gluten presence in images of bread, we propose the following steps: (1) image collection; (2) data labeling, verification, and photo augmentation; (3) model training; and (4) evaluation (see Figure 2). This method is designed to support individuals with celiac disease by providing a tool that helps them make informed decisions about consuming bread, thereby enhancing their confidence and safety while dining.

3.2.1. Image Collection

During this study, we collected three datasets of bread images. Two datasets were manually collected from social media platforms using the keywords “gluten-free bread”, and “gluten bread”.
Pinterest bread dataset: This dataset includes 512 images retrieved from the Pinterest (https://www.pinterest.com/) platform (accessed on 6 February 2025).
Instagram bread dataset: This dataset comprises 83 images collected from Instagram (https://www.instagram.com/, accessed on 6 February 2025) using the same search terms. The research protocol was approved by the Human Research Ethics Committee of the Shamoon College of Engineering.
Custom bread dataset: The images were collected using two methods: photographs taken directly by the study’s researchers and additional images manually gathered through a Google search for gluten-free bread and gluten-containing bread. This dataset consists of 218 images. Each image of bread in this dataset is accompanied by information about the type of flour used in its preparation. The flour composition is determined by the ingredient list provided on the package or by the recipe used to bake the bread.
Table 1 provides an overview of the datasets used in this study, highlighting the platforms and the division between the images collected for gluten-free bread and gluten-containing bread.

3.2.2. Data Labeling, Verification, and Photo Augmentation

Data Labeling and Verification. A careful review of each selected image was conducted based on the number of followers, likes, and comments. Each image was verified manually to match the label it received, cross-referencing the title or content, such as associated recipes or ingredient lists, to ensure data credibility. Following verification, the images underwent a manual cropping and labeling process to isolate the bread, carefully focusing on relevant portions of the image while excluding background or non-target elements to enhance the dataset’s quality and accuracy.
Photo Augmentation. To improve the generalization and performance on unseen data, as well as to enhance the diversity of the training data [43], we applied data augmentation. Data augmentation was specifically used during the training phase for the Pinterest bread dataset and portions of the Instagram bread and custom datasets designated for training.
The following methods of data augmentation were used with Keras’ ImageDataGenerator module:
  • Rotation: rotating images up to 40 degrees randomly to simulate different viewing angles.
  • Width and Height Shifts: shifting images along the x-axis and the y-axis by up to 20% to simulate an off-center positioning of the bread.
  • Shear Transformation: using shear transformations of up to 20% to skew the image, allowing the model to learn from distorted shapes.
  • Zoom: randomly zooming images by up to 20% to simulate a closer or further away shot of the bread.
  • Horizontal Flip: flipping images horizontally to simulate different orientations.
  • Pixel Fill: filling pixels exposed by transformations with the nearest pixel value using the ’nearest’ fill mode.

3.3. Model Training

A total of six models were tested on the Pinterest bread dataset, which was divided into training (80%), validation (10%), and testing (10%) datasets:
  • VGG19: This is a convolutional neural network (CNN) architecture developed by the Visual Geometry Group (VGG) at Oxford University in 2014 and is used in a wide range of image classification tasks [44]. The VGG architecture explores the impact of increasing the depth of convolutional networks on classification accuracy. Compared to state-of-the-art configurations, it employs a design with small 3 × 3 convolution filters, which has been shown to improve performance significantly [45]. VGG19 consists of 19 layers with learnable parameters, including 16 convolutional layers and 3 fully connected layers.
  • Inception-V3: This is also a deep convolutional neural network architecture developed by Google Research as an improvement over the original Inception architecture. The Inception-V3 model is widely used for image classification. This architecture comprises several layers of convolutional and pooling operations and auxiliary classifiers at intermediate layers. It utilizes a technique known as “inception modules”, which involves parallel convolutions of different sizes followed by concatenating their output features to efficiently extract multi-scale features. As compared to VGGNets, Inception is more computationally efficient [46].
  • InceptionResNetV2: This is a CNN architecture that combines the strengths of Inception networks and ResNet architectures, developed by Google Brain to enhance image classification performance [47]. InceptionResNetV2 integrates Inception modules, which use parallel convolutional layers of different kernel sizes, with residual connections, which improve gradient flow and enable efficient training of deeper networks. This architecture consists of 164 layers, incorporating batch normalization, factorized convolutions, and scaling residual connections to optimize accuracy and computational efficiency [47]. Compared to standalone Inception or ResNet models, InceptionResNetV2 achieves superior performance while maintaining lower computational complexity.
  • NASNetLarge: This CNN architecture was developed by Google Brain using Neural Architecture Search (NAS), an automated machine learning (AutoML) technique that optimizes network design. NASNetLarge is designed to achieve high performance in image classification tasks while maintaining computational efficiency [48]. Unlike manually designed architectures, NASNet utilizes a reinforcement learning-based search algorithm to discover the most efficient network structure. The NASNetLarge model consists of 88 layers and employs separable convolution operations and batch normalization to reduce computational cost while maintaining high accuracy [49].
  • ResNet50V2: This is a CNN architecture introduced as an improved version of ResNet50, developed by Microsoft Research as part of the Residual Network (ResNet) family [50]. ResNet architectures address the vanishing gradient problem by incorporating residual connections (skip connections), which enable deeper networks to train more effectively. ResNet50V2 consists of 50 layers, including convolutional, batch normalization, and fully connected layers, and employs pre-activation residual units, which improve gradient flow during training and lead to better convergence compared to the original ResNet50 [51]. This architecture is widely used in image classification tasks due to its strong generalization capability and efficient training process.
  • EfficientNetV2L: This is a CNN architecture developed by Google Brain as an improved version of EfficientNet, designed for better efficiency and faster training in image classification tasks [52]. EfficientNetV2L builds upon EfficientNet’s compound scaling method, which optimally balances depth, width, and resolution to enhance accuracy while minimizing computational cost. Compared to its predecessor, EfficientNetV2 introduces fused MBConv layers, which reduce memory usage and improve training speed. EfficientNetV2L (Large variant) consists of approximately 120 million parameters and is optimized for high-performance classification tasks while maintaining efficiency [52].
All six models were trained with the following configuration. We excluded the top classification layer (include_top = False) and used input shapes of (150, 150, 3) for the images. This resolution was chosen to balance the computational efficiency and sufficient detail for effective feature extraction in the pre-trained models. Each model begins with a frozen convolutional base to leverage pre-trained features while preventing weight updates, ensuring faster training, and reducing the risk of overfitting. A ‘GlobalAveragePooling2D’ layer has been added to reduce dimensions, followed by a dense layer with 128 units and ReLU activation for feature extraction, and a dropout layer for regularization, where half of the neurons in the layer are randomly deactivated for each forward pass in training. Lastly, a dense layer with a sigmoid activation function was applied for binary classification. At first, the convolutional layer was frozen. However, during fine-tuning, the convolutional layer was unfrozen to update the weights and adapt the pre-trained features to the dataset. The models were compiled using the Adam optimizer with a learning rate of 0.0001 and binary cross-entropy loss. The models were trained for 300 epochs, and EarlyStopping was used to monitor the validation loss (val_loss) with a patience of 30 epochs, thereby avoiding unnecessary computations and overfitting. Additionally, ReduceLROnPlateau dynamically adjusted the learning rate by a factor of 0.2 when the validation loss did not improve for 5 consecutive epochs, with a minimum learning rate of 0.00001.

3.4. Evaluation

To evaluate the models’ performance in identifying the type of bread from the testing dataset comprised of the Pinterest bread dataset, metrics, such as the accuracy, precision, recall, and F1-score were calculated. The best-performing model, which achieved the highest accuracy scores on the Pinterest bread dataset, was selected and fine-tuned along with its optimized parameters on a combined dataset, incorporating images from both the Pinterest and Instagram bread datasets. This approach aimed to improve the model’s generalization ability by leveraging diverse image sources. For this combined fine-tuning, we split the dataset into 80% for training, 10% for validation, and 10% for testing, ensuring a balanced evaluation. The model’s performance was then assessed using the same performance measurements, allowing a comprehensive comparison of its ability to classify gluten-containing and gluten-free bread across a more diverse dataset.
Following the same approach, the custom bread dataset was also divided into an 80:10:10 training–validation–testing split. We then took the selected fine-tuned model that achieved the best performance of the combined dataset from Pinterest and Instagram and further fine-tuned it using the training portion (80%) of the combined dataset from Pinterest, Instagram, and custom. Finally, the model was evaluated on the remaining 10% testing set to assess its generalization performance on unseen data.
As part of the custom bread dataset analysis, each image included information about the flour composition used in the bread. We analyzed the frequency of each flour in the dataset. We also analyzed the average accuracy achieved for each specific flour.

4. Results

The results are divided into three subsections, reflecting the performance of the three models trained on different dataset combinations. The first model was trained solely on the Pinterest bread dataset. The second model was fine-tuned on a combined dataset of Pinterest and Instagram bread images. The third model was further fine-tuned by incorporating the custom bread dataset.

4.1. Pinterest Bread Dataset

The Pinterest bread dataset was used to train six CNN models. The models were tested on a testing set consisting of 10% of the data, which were not used during training. Table 2 presents the results, including the accuracy, precision, recall, and F1-score. The NASNetLarge and EfficientNetV2L models were found to be inferior to all other models on all measured metrics, while the ResNet50V2 and VGG19 models outperformed the others on all metrics. Among the top-performing models, ResNet50V2 was selected for further fine-tuning due to its superior balance between accuracy and computational efficiency. Compared to VGG19, ResNet50V2 demonstrated a more robust performance across all metrics while maintaining a more optimized architecture, making it a suitable choice for training on larger datasets.

4.2. Instagram Bread Dataset

To determine the best approach for utilizing the Instagram dataset, we considered whether training solely on Instagram images could lead to a model capable of generalizing to Pinterest images, or whether a model trained on Pinterest could accurately classify Instagram images.
We initially trained a model exclusively on the Instagram dataset. The results appeared promising, achieving an accuracy of 83%, precision of 87%, recall of 84%, and F1-score of 83% (see Table 3). However, due to the small number of training samples, the model failed to generalize when tested on Pinterest images, leading to significantly lower performance. While the model demonstrated strong performance on the same dataset it was trained on, its inability to adapt to a different dataset indicated that training on such a limited dataset was insufficient for robust classification.
Given these findings, we fine-tuned the existing ResNet50V2 model with additional training samples from the Instagram dataset. For this process, 80% of the dataset was used for training, while the remaining 20% was reserved for validation and testing (10% each). Fine-tuning the model on this larger dataset resulted in a modest but meaningful improvement, achieving an accuracy of 78%, precision of 80%, recall of 77%, and F1-score of 77% (see Table 3). While slightly lower than the Instagram-only model in terms of accuracy, the combined training provided a more balanced and generalized model, reducing the risk of overfitting to a small dataset and improving the overall adaptability.
These results highlight the importance of dataset diversity in deep learning-based classification tasks, especially when dealing with images from different platforms. Training on a limited dataset, even if it achieves high accuracy within its domain, does not necessarily translate into generalization. By integrating multiple data sources, the model effectively learned from diverse distributions, resulting in improved robustness in real-world classification tasks.

4.3. Custom Bread Dataset

The custom bread dataset included details about the flour composition used in baking each bread sample, provided with the corresponding images. This information enabled analysis of the results based on the flour types used. The ResNet50V2 classification model, which was trained on the Pinterest and Instagram bread datasets, was further fine-tuned on images from the custom dataset, achieving accuracy, recall, and F1-scores of 86% and a precision of 87% (see Table 4).
We can see that the ResNet50V2 model has a high recall for “Gluten Free”, as most “Gluten Free” samples are correctly identified (40 out of 43). However, the nine false negatives in the testing set of the combined dataset of Pinterest, Instagram, and custom bread datasets suggest that some “Gluten Free” items are misclassified as “Gluten Containing”. Similarly, the recall for “Gluten Containing” is good (32 out of 41), but there are three false positives, meaning a small number of “Gluten Containing” samples are incorrectly identified as “Gluten Free” (see Figure 3).
Figure 4 illustrates the distribution of all flour types across the images in the custom bread dataset. Among the most commonly used flours are white rice flour, followed by various white wheat flours, including bread and all-purpose flour. The least commonly used flours are rye flour, oat flour, and thina.
Additionally, we analyzed the average accuracy achieved for each type of flour. We examined gluten-containing flours (see Figure 5), and gluten-free flours (see Figure 6). We show the model’s accuracy in predicting gluten content, with the highest accuracy for rye flour (100%) and lower accuracies for all-purpose flour (97.5%), bread flour (93.5%), and wheat flour (85.7%). Interestingly, common flours, such as wheat flour and bread flour, despite their prevalence in the dataset, exhibited relatively lower accuracy. Several gluten-free flours, including almond, oat, thina, quinoa, chickpea, coconut, and others, were detected with 100% accuracy by the model. In contrast, the detection of chickpea, amaranth, maize, teff, and lentil flours showed the lowest accuracy, highlighting variability in the model’s performance across different flour types.

5. Discussion

After training six models on the Pinterest bread dataset, ResNet50V2 emerged as the best-performing model (see Table 2). This result aligns with findings in the literature, where ResNet architectures have demonstrated strong feature extraction capabilities due to their deep residual connections, which enhance gradient flow and improve training efficiency [53,54,55]. Compared to simpler architectures, such as traditional CNNs and even Inception-based models, ResNet50V2 provides a balanced trade-off between depth, accuracy, and computational efficiency, making it a robust choice for image classification tasks.
After selecting ResNet50V2 as the best-performing model on the Pinterest bread dataset, we tested its performance on another dataset from Instagram. However, the results on this new dataset were not as high as those achieved with the Pinterest dataset (see Table 3). Differences in the dataset characteristics may have contributed to this discrepancy; the Instagram dataset included additional types of flour, making classification more challenging.
To address this issue, we applied a fine-tuning approach by retraining the pre-trained ResNet50V2 model on combined dataset of images taken from Pinterest and Instagram datasets. This strategy proved effective, as the model showed improvement when tested on unseen data from the same dataset (see Table 3).
The improved performance highlights the importance of fine-tuning pre-trained models on images from diverse sources, demonstrating that incorporating data from different social media platforms can significantly enhance the classifier’s ability to generalize across varied datasets. This is particularly crucial for tasks involving heterogeneous image distributions, where variations in content, lighting, and composition between platforms can impact classification performance.
When applying the final model to the new custom bread dataset, the results showed an improved performance, achieving accuracy, recall and F1 scores of 86% and precision of 87%.
With respect to the trade-off between false positives and false negatives in the combined dataset of images taken from Pinterest, Instagram, and custom bread datasets, the number of false negatives (misclassifying “Gluten Free” as “Gluten Containing”) is higher than the false positives. Depending on the application’s context, this trade-off may have significant implications.
If prioritizing safety (e.g., individuals with celiac disease avoiding gluten for health reasons), minimizing false negatives is critical, as a “Gluten Free” sample misclassified as “Gluten Containing” could lead to unnecessary dietary restrictions, causing inconvenience or limiting food choices unnecessarily. However, this type of misclassification is less harmful than a false positive, where a gluten-containing item is mistakenly classified as gluten-free, potentially leading to serious health consequences.
From a user-experience perspective, a higher false negative rate may result in frustration if users frequently receive overly cautious classifications, leading them to avoid safe foods unnecessarily. Balancing model sensitivity and specificity is crucial to ensuring both safety and usability. Future work could explore strategies such as adjusting classification thresholds, incorporating uncertainty estimation, or implementing a user feedback mechanism to refine predictions and enhance reliability.
These findings highlight the need for context-aware model optimization, where different applications—such as consumer-facing mobile apps vs. industrial gluten detection tools—may require different risk tolerances when tuning model performance.
The custom bread dataset included information regarding the flour composition in each bread and provided insight into the accuracy of flour classification. The gluten-free flours commonly represented in the dataset included rice, potato, corn, tapioca, and maize flours, aligning with the literature findings [56]. However, the classification accuracy was not uniform among gluten-free flours, with chickpea, amaranth, maize, teff, and lentil flours showing the lowest accuracy rates.
Several factors may explain the low performance of these flours. First, these flour types may not have been well represented during the training phase, limiting the model’s generalization ability. Second, certain flours, such as maize flour, may share visual similarities with gluten-containing bread, especially when milled at smaller particle sizes, which enhance dough viscoelastic properties and potentially blur distinctions [57]. Finally, a notable number of misclassified images were of poor quality, both gluten-free and gluten-containing images, including low-resolution images that obscured key details necessary for accurate classification.
The findings achieved by RGB have practical implications for both individuals with celiac disease and the food industry. For individuals with celiac disease, integrating this method into mobile applications could provide real-time gluten detection, offering a non-invasive and cost-effective alternative to traditional testing methods. This could improve confidence when dining out or purchasing food products.
For the food industry, AI-driven gluten detection could enhance quality control and certification processes, helping manufacturers to ensure gluten-free compliance and reduce cross-contamination risks. Automating gluten detection could also streamline ingredient verification and improve labeling accuracy, benefiting consumers who rely on precise gluten-free information.

Limitations

While the model demonstrates promising results, it still requires improvement and has several limitations that need to be addressed. One limitation is the relatively narrow scope of the datasets used in this study. Although the model performed well on the custom bread dataset, its ability to generalize to other types of food remains uncertain. To improve the model’s robustness and applicability, it is necessary to train it on larger and more diverse datasets that include a wide variety of food items beyond bread.
In addition, the model may be affected by differences in image quality, composition, and food presentation across datasets. Including more real-world examples in the dataset, such as user-generated content, might enhance the model’s ability to handle diverse scenarios. Future work should focus on these areas to further refine the model and ensure its reliability for broader applications in food classification tasks.

6. Conclusions

In this study, we developed RGB (Recognition of Gluten in Bread), a deep learning-based method designed to support individuals with celiac disease by offering a decision-support tool for automatically detecting gluten in bread images. By fine-tuning the pre-trained ResNet50V2 CNN model on two datasets of gluten-containing and gluten-free bread, the proposed RGB method achieved accuracy scores of 77% and 78% and precision scores of 79% and 80% on the Pinterest and combined Pinterest + Instagram bread datasets, respectively.
In addition, we curated and annotated three unique datasets of bread images from Pinterest and Instagram and a custom bread dataset containing information about the type of flour used in bread preparation. These datasets not only supported the training and evaluation of our model but also provided a valuable resource for future research in gluten detection.
In addition, we analyzed the performance of the proposed RGBacross different types of flours using the custom bread dataset, offering deeper insights into the model’s strengths and limitations when applied to specific flour types.
Our analysis revealed that the ResNet50V2 CNN model performed better on gluten-free flours, achieving higher accuracy scores for these types. Furthermore, by testing the model trained on the combined dataset comprising images from Pinterest and Instagram, we assessed its generalization capability and improved its performance using fine-tuning. After fine-tuning, the model achieved an accuracy of 84% and a recall of 73% on the combined Pinterest + Instagram dataset, highlighting its robustness in adapting to new data sources.
Additionally, further fine-tuning the model on the custom bread dataset improved performance, achieving an accuracy of 86%, precision of 87%, recall of 86%, and F1-score of 86% (see Table 4). These results indicate that the model successfully adapts to new data distributions and benefits from training on diverse sources. The strong performance on the custom bread dataset, which differs from the social media datasets (Pinterest and Instagram) in terms of image quality and content, suggests that the model effectively generalizes beyond social media images to a wider range of bread samples.
This work also introduced a novel analysis of the model’s performance on specific flour types, providing insights into variability across different categories. Such targeted analyses could inspire further studies to refine and adapt the model for specific food properties and challenges.
The proposed approach has significant practical implications. By integrating this model into accessible tools, such as mobile applications, individuals with celiac disease or gluten sensitivity could receive real-time informed support when making dietary decisions. This could promote greater confidence and safety when dining out or consuming unfamiliar food products.
Future research is needed to extend this approach beyond bread to other food types. Expanding the datasets and applying similar methods to a broader range of foods will enhance the model’s versatility and reliability for gluten detection. This will contribute to developing comprehensive solutions for dietary support, ultimately improving the quality of life for individuals with gluten-related dietary restrictions.
The proposed approach has significant practical implications. Integrating this model into accessible tools, such as mobile applications, could provide individuals with celiac disease or gluten sensitivity with real-time dietary support by allowing them to quickly assess the gluten content of bread through image classification.
However, deploying deep learning models on mobile devices presents computational and resource constraints that must be addressed. Future work should focus on optimizing the model for mobile deployment through techniques such as quantization, pruning, or cloud-based inference, which can reduce computational load while maintaining classification accuracy. Additionally, ensuring a user-friendly interface and providing clear interpretable results will improve accessibility and usability in real-world applications.

Author Contributions

Conceptualization, A.E., A.P.V. and A.Z.; methodology, A.E. and A.P.V.; software, G.S. and A.K.; validation, A.E., A.P.V., G.S. and A.K.; formal analysis, A.E. and A.P.V.; investigation, A.E. and A.P.V.; resources, A.E. and A.P.V.; data curation, A.P.V., G.S. and A.K.; writing—original draft preparation, A.E. and A.P.V.; writing—review and editing, A.E. and A.P.V.; visualization, A.E. and A.P.V.; supervision, A.E. and A.P.V.; project administration, A.E. and A.P.V.; funding acquisition, A.E. and A.P.V. All authors have read and agreed to the published version of the manuscript.

Funding

This research received no external funding.

Institutional Review Board Statement

Not applicable.

Informed Consent Statement

Not applicable.

Data Availability Statement

The code for training classification models based on gluten-containing and gluten-free images, including the custom bread dataset, is available at: https://github.com/abigailparadise/Gluten (accessed on 6 February 2025). The datasets used in this study, such as the Pinterest, Instagram, and custom bread datasets are available upon request. The Pinterest and Instagram bread datasets used in this study are available upon request.

Conflicts of Interest

The authors declare no conflicts of interest.

Abbreviations

The following abbreviations are used in this manuscript:
CNNConvolutional Neural Network
RGBRecognition of Gluten in Bread

References

  1. Fasano, A.; Catassi, C. Celiac disease. N. Engl. J. Med. 2012, 367, 2419–2426. [Google Scholar] [CrossRef] [PubMed]
  2. Biesiekierski, J.R. What is gluten? J. Gastroenterol. Hepatol. 2017, 32, 78–81. [Google Scholar] [CrossRef]
  3. Fasano, A.; Berti, I.; Gerarduzzi, T.; Not, T.; Colletti, R.B.; Drago, S.; Elitsur, Y.; Green, P.H.; Guandalini, S.; Hill, I.D.; et al. Prevalence of celiac disease in at-risk and not-at-risk groups in the United States: A large multicenter study. Arch. Intern. Med. 2003, 163, 286–292. [Google Scholar] [CrossRef] [PubMed]
  4. Wieser, H.; Ciacci, C.; Soldaini, C.; Gizzi, C.; Santonicola, A. Gastrointestinal and Hepatobiliary Manifestations Associated with Untreated Celiac Disease in Adults and Children: A Narrative Overview. J. Clin. Med. 2024, 13, 4579. [Google Scholar] [CrossRef]
  5. Theethira, T.G.; Dennis, M. Celiac disease and the gluten-free diet: Consequences and recommendations for improvement. Dig. Dis. 2015, 33, 175–182. [Google Scholar] [CrossRef] [PubMed]
  6. Kamycheva, E.; Goto, T.; Camargo, C. Celiac disease is associated with reduced bone mineral density and increased FRAX scores in the US National Health and Nutrition Examination Survey. Osteoporos. Int. 2017, 28, 781–790. [Google Scholar] [CrossRef]
  7. Marafini, I.; Monteleone, G.; Stolfi, C. Association between celiac disease and cancer. Int. J. Mol. Sci. 2020, 21, 4155. [Google Scholar] [CrossRef]
  8. Niewinski, M.M. Advances in celiac disease and gluten-free diet. J. Am. Diet. Assoc. 2008, 108, 661–672. [Google Scholar] [CrossRef] [PubMed]
  9. Bascuñán, K.A.; Vespa, M.C.; Araya, M. Celiac disease: Understanding the gluten-free diet. Eur. J. Nutr. 2017, 56, 449–459. [Google Scholar] [CrossRef] [PubMed]
  10. Dave Bloom, S. Restaurant Fined $105,000 for Anaphylactic Death of Customer. Available online: https://snacksafely.com/2021/03/restaurant-fined-105000-for-anaphylactic-death-of-customer/ (accessed on 18 March 2021).
  11. Keay, L. Allergy Sufferers Tell of ’Traumatic’ Experiences Ordering Food After Mistakes Led to Teenagers’ Deaths. Sky News, 17 August 2024. [Google Scholar]
  12. Zhang, J.; Portela, S.B.; Horrell, J.B.; Leung, A.; Weitmann, D.R.; Artiuch, J.B.; Wilson, S.M.; Cipriani, M.; Slakey, L.K.; Burt, A.M.; et al. An integrated, accurate, rapid, and economical handheld consumer gluten detector. Food Chem. 2019, 275, 446–456. [Google Scholar] [CrossRef] [PubMed]
  13. Marić, A.; Scherf, K.A. A portable gluten sensor for celiac disease patients may not always be reliable depending on the food and the user. Front. Nutr. 2021, 8, 712992. [Google Scholar] [CrossRef] [PubMed]
  14. Taylor, S.L.; Nordlee, J.A.; Jayasena, S.; Baumert, J.L. Evaluation of a handheld gluten detection device. J. Food Prot. 2018, 81, 1723–1728. [Google Scholar] [CrossRef] [PubMed]
  15. Wang, Y.; Gu, H.W.; Yin, X.L.; Geng, T.; Long, W.; Fu, H.; She, Y. Deep leaning in food safety and authenticity detection: An integrative review and future prospects. Trends Food Sci. Technol. 2024, 146, 104396. [Google Scholar] [CrossRef]
  16. Gbashi, S.; Njobeh, P.B. Enhancing Food Integrity through Artificial Intelligence and Machine Learning: A Comprehensive Review. Appl. Sci. 2024, 14, 3421. [Google Scholar] [CrossRef]
  17. Voulodimos, A.; Doulamis, N.; Doulamis, A.; Protopapadakis, E. Deep learning for computer vision: A brief review. Comput. Intell. Neurosci. 2018, 2018, 7068349. [Google Scholar] [CrossRef] [PubMed]
  18. Weiss, K.; Khoshgoftaar, T.M.; Wang, D. A survey of transfer learning. J. Big Data 2016, 3, 1–40. [Google Scholar] [CrossRef]
  19. Hussain, M.; Bird, J.J.; Faria, D.R. A study on CNN transfer learning for image classification. In Proceedings of the Advances in Computational Intelligence Systems: Contributions Presented at the 18th UK Workshop on Computational Intelligence, Nottingham, UK, 5–7 September 2018; Springer: Berlin/Heidelberg, Germany, 2019; pp. 191–202. [Google Scholar]
  20. Özsert Yiğit, G.; Özyildirim, B.M. Comparison of convolutional neural network models for food image classification. J. Inf. Telecommun. 2018, 2, 347–357. [Google Scholar] [CrossRef]
  21. Yadav, S.; Alpana; Chand, S. Automated food image classification using deep learning approach. In Proceedings of the 2021 7th International Conference on Advanced Computing and Communication Systems (ICACCS), Coimbatore, India, 19–20 March 2021; Volume 1, pp. 542–545. [Google Scholar]
  22. Razali, M.N.; Moung, E.G.; Yahya, F.; Hou, C.J.; Hanapi, R.; Mohamed, R.; Hashem, I.A.T. Indigenous food recognition model based on various convolutional neural network architectures for gastronomic tourism business analytics. Information 2021, 12, 322. [Google Scholar] [CrossRef]
  23. Moumane, K.; El Asri, I.; Cheniguer, T.; Elbiki, S. Food Recognition and Nutrition Estimation using MobileNetV2 CNN architecture and Transfer Learning. In Proceedings of the 2023 14th International Conference on Intelligent Systems: Theories and Applications (SITA), Casablanca, Morocco, 22–23 November 2023; pp. 1–7. [Google Scholar]
  24. Patel, J.; Modi, K. Indian Food Image Classification and Recognition with Transfer Learning Technique Using MobileNetV3 and Data Augmentation. Eng. Proc. 2023, 56, 197. [Google Scholar] [CrossRef]
  25. Boyd, L.; Nnamoko, N.; Lopes, R. Fine-Grained Food Image Recognition: A Study on Optimising Convolutional Neural Networks for Improved Performance. J. Imaging 2024, 10, 126. [Google Scholar] [CrossRef]
  26. Thiodorus, G.; Sari, Y.A.; Yudistira, N. Convolutional neural network with transfer learning for classification of food types in tray box images. In Proceedings of the 6th International Conference on Sustainable Information Engineering and Technology, Malang, Indonesia, 13–14 September 2021; pp. 301–308. [Google Scholar]
  27. Kareem, R.S.A.; Tilford, T.; Stoyanov, S. Fine-grained food image classification and recipe extraction using a customized deep neural network and NLP. Comput. Biol. Med. 2024, 175, 108528. [Google Scholar]
  28. Wei, J.W.; Wei, J.W.; Jackson, C.R.; Ren, B.; Suriawinata, A.A.; Hassanpour, S. Automated detection of celiac disease on duodenal biopsy slides: A deep learning approach. J. Pathol. Inform. 2019, 10, 7. [Google Scholar] [CrossRef]
  29. Kowsari, K.; Sali, R.; Khan, M.N.; Adorno, W.; Ali, S.A.; Moore, S.R.; Amadi, B.C.; Kelly, P.; Syed, S.; Brown, D.E. Diagnosis of celiac disease and environmental enteropathy on biopsy images using color balancing on convolutional neural networks. In Proceedings of the Future Technologies Conference (FTC) 2019: Volume 1; Springer: Berlin/Heidelberg, Germany, 2020; pp. 750–765. [Google Scholar]
  30. Carreras, J. Celiac Disease Deep Learning Image Classification Using Convolutional Neural Networks. J. Imaging 2024, 10, 200. [Google Scholar] [CrossRef]
  31. Keskin Bilgiç, E.; Zaim Gökbay, İ.; Kayar, Y. Innovative Approaches to Clinical Diagnosis: Transfer Learning in Facial Image Classification for Celiac Disease Identification. Appl. Sci. 2024, 14, 6207. [Google Scholar] [CrossRef]
  32. Jossa-Bastidas, O.; Sanchez, A.O.; Bravo-Lamas, L.; Garcia-Zapirain, B. IoT system for gluten prediction in flour samples using nirs technology, Deep and Machine Learning Techniques. Electronics 2023, 12, 1916. [Google Scholar] [CrossRef]
  33. Pradana-Lopez, S.; Perez-Calabuig, A.M.; Cancilla, J.C.; Torrecilla, J.S. Standard photographs convolutionally processed to indirectly detect gluten in chickpea flour. J. Food Compos. Anal. 2022, 110, 104547. [Google Scholar] [CrossRef]
  34. Pradana-López, S.; Pérez-Calabuig, A.M.; Otero, L.; Cancilla, J.C.; Torrecilla, J.S. Is my food safe?–AI-based classification of lentil flour samples with trace levels of gluten or nuts. Food Chem. 2022, 386, 132832. [Google Scholar] [CrossRef] [PubMed]
  35. Cappelli, A.; Oliva, N.; Cini, E. A systematic review of gluten-free dough and bread: Dough rheology, bread characteristics, and improvement strategies. Appl. Sci. 2020, 10, 6559. [Google Scholar] [CrossRef]
  36. Anjum, F.M.; Khan, M.R.; Din, A.; Saeed, M.; Pasha, I.; Arshad, M.U. Wheat gluten: High molecular weight glutenin subunits—structure, genetics, and relation to dough elasticity. J. Food Sci. 2007, 72, R56–R63. [Google Scholar] [CrossRef]
  37. Mioduszewski, Ł.; Cieplak, M. Viscoelastic properties of wheat gluten in a molecular dynamics study. PLoS Comput. Biol. 2021, 17, e1008840. [Google Scholar] [CrossRef]
  38. Shewry, P.R.; Halford, N.G.; Belton, P.S.; Tatham, A.S. The structure and properties of gluten: An elastic protein from wheat grain. Philos. Trans. R. Soc. London. Ser. B Biol. Sci. 2002, 357, 133–142. [Google Scholar] [CrossRef]
  39. Belton, P. Mini review: On the elasticity of wheat gluten. J. Cereal Sci. 1999, 29, 103–107. [Google Scholar] [CrossRef]
  40. Gan, Z.; Angold, R.; Williams, M.; Ellis, P.; Vaughan, J.; Galliard, T. The microstructure and gas retention of bread dough. J. Cereal Sci. 1990, 12, 15–24. [Google Scholar] [CrossRef]
  41. Horstmann, S.W.; Lynch, K.M.; Arendt, E.K. Starch characteristics linked to gluten-free products. Foods 2017, 6, 29. [Google Scholar] [CrossRef] [PubMed]
  42. Correia, P.; Fonseca, M.; Guiné, R. Gluten-free bread: A case study. J. Adv. Agric. Technol. 2017, 4, 340–344. [Google Scholar] [CrossRef]
  43. Shorten, C.; Khoshgoftaar, T.M. A survey on image data augmentation for deep learning. J. Big Data 2019, 6, 1–48. [Google Scholar] [CrossRef]
  44. Tammina, S. Transfer learning using vgg-16 with deep convolutional neural network for classifying images. Int. J. Sci. Res. Publ. (IJSRP) 2019, 9, 143–150. [Google Scholar] [CrossRef]
  45. Theckedath, D.; Sedamkar, R. Detecting affect states using VGG16, ResNet50 and SE-ResNet50 networks. SN Comput. Sci. 2020, 1, 79. [Google Scholar] [CrossRef]
  46. Xia, X.; Xu, C.; Nan, B. Inception-v3 for flower classification. In Proceedings of the 2017 2nd International Conference on Image, Vision and Computing (ICIVC), Chengdu, China, 2–4 June 2017; pp. 783–787. [Google Scholar]
  47. Szegedy, C.; Ioffe, S.; Vanhoucke, V.; Alemi, A. Inception-v4, inception-resnet and the impact of residual connections on learning. In Proceedings of the AAAI Conference on Artificial Intelligence, San Francisco, CA, USA, 4–7 February 2017; Volume 31. [Google Scholar]
  48. Zoph, B.; Vasudevan, V.; Shlens, J.; Le, Q.V. Learning transferable architectures for scalable image recognition. In Proceedings of the IEEE Conference on Computer Vision and Pattern Recognition, Salt Lake City, UT, USA, 18–22 June 2018; pp. 8697–8710. [Google Scholar]
  49. Tan, M.; Le, Q. Efficientnet: Rethinking model scaling for convolutional neural networks. In Proceedings of the International Conference on Machine Learning, Long Beach, CA, USA, 9–15 June 2019; pp. 6105–6114. [Google Scholar]
  50. He, K.; Zhang, X.; Ren, S.; Sun, J. Deep residual learning for image recognition. In Proceedings of the IEEE Conference on Computer Vision and Pattern Recognition, Las Vegas, NV, USA, 27–30 June 2016; pp. 770–778. [Google Scholar]
  51. He, K.; Zhang, X.; Ren, S.; Sun, J. Identity mappings in deep residual networks. In Proceedings of the Computer Vision–ECCV 2016: 14th European Conference, Amsterdam, The Netherlands, 11–14 October 2016; Proceedings, Part IV 14. Springer: Berlin/Heidelberg, Germany, 2016; pp. 630–645. [Google Scholar]
  52. Tan, M.; Le, Q. Efficientnetv2: Smaller models and faster training. In Proceedings of the International Conference on Machine Learning, Online, 18–24 July 2021; pp. 10096–10106. [Google Scholar]
  53. Aneja, N.; Aneja, S. Transfer learning using CNN for handwritten devanagari character recognition. In Proceedings of the 2019 1st International Conference on Advances in Information Technology (ICAIT), Chikmagalur, India, 25–27 July 2019; pp. 293–296. [Google Scholar]
  54. Bensaoud, A.; Abudawaood, N.; Kalita, J. Classifying malware images with convolutional neural network models. Int. J. Netw. Secur. 2020, 22, 1022–1031. [Google Scholar]
  55. Munte, S.B.K.; Rismiyati, R. Transfer learning with VGG16 and InceptionV3 for traffic sign classification. AIP Conf. Proc. 2024, 3165, 040003. [Google Scholar]
  56. Ren, Y.; Linter, B.R.; Linforth, R.; Foster, T.J. A comprehensive investigation of gluten free bread dough rheology, proving and baking performance and bread qualities by response surface design and principal component analysis. Food Funct. 2020, 11, 5333–5345. [Google Scholar] [CrossRef]
  57. Yazar, G.; Demirkesen, I. Linear and non-linear rheological properties of gluten-free dough systems probed by fundamental methods. Food Eng. Rev. 2023, 15, 56–85. [Google Scholar] [CrossRef]
Figure 1. Gluten-free and gluten-containing bread examples. Breads 1 to 3 are gluten-containing, while breads 4 to 6 are gluten-free.
Applsci 15 01737 g001
Figure 2. Proposed RGB method. The method consists of four steps: first, image collection, where three distinct datasets were collected; second, data labeling and verification, during which images were labeled and verified as either gluten-containing or gluten-free, and image augmentation, where images were augmented to enhance the dataset; third, model training, involving the training of three different models; and finally, evaluation, where the best performing model was assessed for performance.
Applsci 15 01737 g002
Figure 3. Confusion matrix of the ResNet50V2 on the custom bread dataset.
Applsci 15 01737 g003
Figure 4. The prevalence of flours in the custom bread dataset is displayed. The x-axis represents the different flours, while the y-axis indicates the number of breads made with each flour. The columns are arranged in descending order, from the most to the least prevalent flour.
Applsci 15 01737 g004
Figure 5. The model’s average success rate in identifying each gluten-containing flour. The x-axis represents the different gluten-containing flours, while the y-axis indicates the average accuracy of each flour. The columns are arranged in descending order, showcasing predictions from the most accurate to the least accurate.
Applsci 15 01737 g005
Figure 6. The model’s average success rate in identifying each gluten-free flour. The x-axis represents the different gluten-free flours, while the y-axis indicates the average accuracy of each flour. The columns are arranged in descending order, showcasing predictions from the most accurate to the least accurate.
Applsci 15 01737 g006
Table 1. Datasets’ description.
DatasetNumber of Gluten-Free Bread ImagesNumber of Gluten-Containing Bread ImagesTotal
Pinterest bread dataset256256512
Instagram bread dataset434083
Custom bread dataset108107217
Table 2. Testing results on the Pinterest bread dataset.
ModelAccuracyPrecisionRecallF1-Score
VGG1976%80%71%75%
Inception-V368%65%76%70%
InceptionResNetV271%77%59%67%
NASNetLarge53%52%71%60%
ResNet50V277%79%77%77%
EfficientNetV2L50%50%94%65%
Table 3. Instagram bread dataset performance.
ModelTraining DatasetRecordsAccuracyPrecisionRecallF1-Score
ResNet50V2Pinterest41077%79%77%77%
ResNet50V2Instagram6683%87%84%83%
ResNet50V2Pinterest + Instagram47678%80%77%77%
Table 4. Test results.
AccuracyPrecisionRecallF1-Score
86%87%86%86%
Disclaimer/Publisher’s Note: The statements, opinions and data contained in all publications are solely those of the individual author(s) and contributor(s) and not of MDPI and/or the editor(s). MDPI and/or the editor(s) disclaim responsibility for any injury to people or property resulting from any ideas, methods, instructions or products referred to in the content.

