Abstract
VR shopping combines the advantages of both online and offline shopping, demonstrating significant potential. In online settings, where consumers cannot directly experience products, providing detailed product information is essential. However, research on the impact of product information provision methods in VR shopping on perceived product emotion and ease of product recognition is limited. Therefore, we compare the effects of the existing e-commerce product information provision method and the VR shopping method on perceived product emotion and product information recognition. We focus on shoes as a product where emotion and detailed information heavily influence the final purchase decision. The results showed that the VR shopping method delivered product emotions more consistently and demonstrated higher product information recognition ease. This study is significant as it provides practical verification of the effectiveness of product information provision methods in VR shopping and suggests directions for future research in this field.
1. Introduction
Recent advancements in digital technology have enabled the use of virtual reality (VR) to enhance the shopping experience online. In the fashion industry, VR applications, which are part of the Metaverse, are categorized into experiential, entertainment, and informational types [1]. The informational category specifically aims to provide detailed product information, such as catalogs. It has been argued that VR shopping, through three-dimensional graphics and natural expressions, can provide superior product information compared to existing 2D image-based online shopping (e-commerce) [2]. Moreover, the product information provision method in VR shopping allows products to be rotated 360° and viewed from any angle, combining the benefits of offline shopping with the advantages of online shopping, such as unrestricted access to a variety of product information, irrespective of store hours [3]. Thus, VR shopping represents an extension and fusion of offline and online shopping experiences, offering a superior shopping experience, particularly during the ‘information search’ and ‘alternative evaluation (product comparison)’ stages of the consumer decision-making process, which are the most time-consuming and critical stages for making purchase decisions [4].
Due to these advantages, global corporations, including eBay’s ‘Myer’, Alibaba’s ‘Buy+’, inVRsion’s ‘ShelfZone’, and Hyundai’s ‘VR store’ have launched VR shopping malls. Fashion-related companies like Lurkcychouette and Esquire are also introducing VR shopping through methods including VR runways and the use of VR codes in magazines [2,5,6]. Some of these initiatives are still not commercialized, and VR shopping is generally in its early stages of growth, with a focus on experiential uses. Thus, to progress toward sustainable VR shopping, product information must be better conveyed to consumers [4]. In particular, for fashion products such as shoes and clothing—where consumer emotions vary with the appearance of the product and significantly influence purchase decisions [7,8,9,10,11,12]—it is more important that product information be provided in a manner that is easily understandable by consumers. To address these requirements, the company Fibbl offers a solution in online shopping by reconstructing fashion products, including shoes and glasses in 3D graphics, making it easier for consumers to understand product information. However, research on how product information provision methods affect consumer perceptions of ‘product affect’ and the ease of recognizing product information remains inadequate. Therefore, we have moved beyond existing studies that focus on enhancing consumer immersion and the overall shopping experience using VR shopping platforms. We conducted a comparative study to examine the differences in ‘product affect’ and the ease of recognizing product information between the information provision methods used in VR shopping and existing online shopping platforms (e-commerce).
2. Related Works
2.1. Virtual Reality (VR) Shopping
As previously mentioned in Section 1, the utilization of VR (a part of the Metaverse) in the fashion industry can be categorized into experiential, entertainment, and informational types [1]. An experiential type, such as a virtual fitting system, involves content created by companies that consumers can directly experience or manipulate during the purchasing process, which enhances convenience and interest [6]. This type often employs extended reality (XR) and augmented reality (AR) technologies more so than VR. The entertainment type focuses more on amusement rather than inducing purchasing desires. Lastly, the informational type aims to provide product information. Although VR shopping integrates all three types, this study primarily focuses on the informational aspect. VR shopping is particularly strong in the “information search” and “alternative evaluation” stages of the consumer decision process (CDP), which are the most time-consuming and critically influence the final decision-making process [4,13]. This strength comes from VR shopping’s ability to combine the benefits of offline shopping—allowing products to be rotated 360° and viewed in three dimensions—with the advantages of online shopping, which include easy product comparison and access regardless of store hours [14].
Therefore, VR shopping provides a better shopping experience than traditional online shopping (e-commerce) because it makes it easier for consumers to understand product appearance information in shopping environments where direct product experience is not possible [3,15]. Moreover, various global companies (e.g., eBay, Alibaba, inVRsion, Hyundai, etc.) and fashion industry enterprises (e.g., Lurkcychouette, Esquire, etc.) aim to provide consumers with better shopping experiences and environments through VR shopping platforms and VR-based product information provision. However, some of these companies’ initiatives have not been commercialized, and VR shopping technology is still in its early stages with some deficiencies. Consequently, numerous studies are being conducted to advance VR shopping [16,17].
Previous studies have primarily focused on recreating existing malls and stores within VR, enabling consumers to immerse themselves and shop within this environment. However, there is a lack of research on how VR shopping’s information provision method impacts existing consumers. Moreover, for fashion products, where the product’s emotional appeal and appearance information significantly influence purchase decisions more than other product categories, empirical research on the effects of these information provision methods on existing consumers is needed. Therefore, this study specifically focuses on fashion products (shoes) and compares the impact of 3D graphic-based VR shopping—facilitated through head-mounted displays (HMDa)—on perceived product emotion and ease of product recognition, against the existing 2D image-based online shopping (e-commerce) method.
2.2. Kansei Engineering for Shoes
Quantitatively measuring the emotions that consumers perceive from products presents a challenging task. To address this, Kansei engineering was developed to extract customer requirements embedded in their emotions, words, and actions [10]. The Kansei engineering process begins by selecting words that can describe the emotions (Kansei) perceived by customers from a specific product. These words are known as Kansei words, and they are typically adjectives. There are various methods for collecting Kansei words. For instance, they can be gathered from popular media like magazines, previous research (related literature), and evaluations by experts [18]. These collection methods can be used independently or complement each other, either stepwise or in combination. After collecting Kansei words, the process involves eliminating duplicate words and pairing antonyms. These pairs are referred to as Kansei pairs, and they are structured as items on the semantic differential scale or Likert scale, allowing for the quantitative assessment of emotions perceived from the product.
Quantitatively evaluating the emotions perceived from a specific product can help generate new design ideas and produce products that meet customer needs [18]. Therefore, Kansei engineering is widely used in fashion products, including shoes, where aesthetic elements significantly influence purchase decisions [9,10,11,12]. Thus, we quantitatively measured the differences in perceived emotions based on the method of product information provision using Kansei engineering, targeting various physical characteristics reflected in the design of shoes, such as color, shape, texture, surface, and symmetry [19]. Such comparative studies of product information methods are necessary because, in online settings where consumers cannot directly experience the products, how customers perceive products in the digital space significantly influences their purchase intent and perception of the product [7]. Therefore, we also collected data on the ease of product recognition by measuring the perceived details of various parts of the product (shoes) alongside the collected emotions.
2.3. 3D Visualization Technology
Three-dimensional (3D) visualization technology enables the creation of realistic visual representations of objects, spaces, and data. This can be utilized across various fields, providing innovative ways to perceive digital information and interact with it [20]. There are several techniques within 3D visualization technology, including box modeling, polygon modeling, and photogrammetry. In this study, techniques that heavily depend on the designer’s capabilities and significantly impact the quality of the results, such as box modeling and polygon modeling, were excluded because it is crucial to recreate products in VR as realistically as possible. Techniques like photogrammetry—-which are less influenced by the designer’s skills and can ensure stable quality—were considered; however, they also present practical issues such as high costs for setting up 3D scanning infrastructure and the need for extensive installation space.
Therefore, we adopted AI-based 3D visualization technology. Initially, 3D visualizations were created using light fields [21,22,23], and the field of AI-based 3D visualization advanced further with the emergence of algorithms such as structure-from-motion (SfM) [24] and multi-view stereo (MVS) [25]. The introduction of NeRF [26] later integrated deep learning with existing technologies, enabling the creation of detailed and realistic scenes. However, NeRF has limitations such as complex volumetric ray marching and pixel-wise 3D space point sampling, which require significant computational resources and take a long time to generate high-resolution images in 3D [27]. In contrast, 3D Gaussian splatting [28] has garnered significant interest as it enables high-resolution real-time rendering through a 3D Gaussian representation and a tile-based splatting solution. Consequently, in this study, we visualized the subject (shoes) in VR using 3D Gaussian splatting.
3. Methods
3.1. Selection of Experimental Shoe
In this study, we selected the research subject product (shoe) by utilizing the process through which consumers derive meaning from the product’s appearance. Initially, when consumers derive meaning from a product’s appearance, they go through two stages. First, consumers observe the product’s appearance and recognize certain physical characteristics that make up the product design (e.g., color, shape, and texture). Second, they perceive the product as having specific appearance attributes based on the combination of these physical characteristics [29]. This process is also applicable to the way consumers perceive fashion products, including shoes. Additionally, the attributes of the shoes consist of two types of elements: intrinsic elements that physically constitute the shoe design and extrinsic elements that are indirectly attributed to the product, such as brand name and the presence of a quality certificate.
Therefore, this study standardized the extrinsic elements across the research subject products, focusing specifically on sneakers, a commonly used type of shoe representing a significant market segment. To ensure a valid comparison of perceived product emotions and ease of recognition through the information provision method, five sneakers were selected as research subjects. While extrinsic elements such as brand and price were kept consistent, intrinsic elements like color, material, shape, and pattern were deliberately varied to represent different types within the category (see Figure 1).
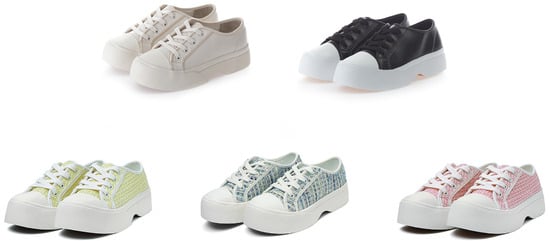
Figure 1.
Photos of the final selected research subject products (shoes). (From top left) Photos of Model 1 and Model 2. (From bottom left) Photos of Model 3, Model 4, and Model 5.
Specifically, in terms of the extrinsic elements of the shoes, Model 1 is composed of white leather with a plain, patternless design. Model 2 is also made of leather, in black, and similarly features a plain, patternless design like Model 1. Model 3 is constructed from tweed material, featuring a yellow background with repetitive white linear patterns. Model 4, unlike the others, presents a multi-colored composition in shades of blue, with tweed material and a grid pattern consisting of non-linear lines. Finally, Model 5 is designed with a red color base and repetitive white linear stripes, made of tweed material.
3.2. Implementation of Product Information Provision Methods
This study focuses on shoes and aims to compare the perceived product emotions and the ease of product recognition by different product information provision methods. Therefore, we implemented the product information provision methods of both an existing online shopping platform (e-commerce) and VR shopping for the five previously selected research subject products (shoes). To quantitatively assess product emotions and the ease of product recognition by each product information provision method, evaluation metrics were established using Kansei engineering and by categorizing specific parts of the product (shoes).
3.2.1. Product Information Provision Methods of Existing Online Shopping Platforms
We implemented the product information provision methods of existing online shopping platforms (e-commerce) using the ‘Photos’ application in Windows. This approach was chosen because, when implementing such methods through online shopping platforms that sell the research subject’s products, there are uncontrollable variables that can stimulate consumers’ emotions besides the intrinsic elements of the product (shoes), such as text information and images of fit models wearing the product. The product images (shoes) provided through the ‘Photos’ application were collected from online platforms (e-commerce) that displayed images of the product only. Ultimately, a total of 15 images were collected, three for each model (N = 5)—side, front, and back views—with each image having a resolution of 1000 × 1000 (see Figure 2).
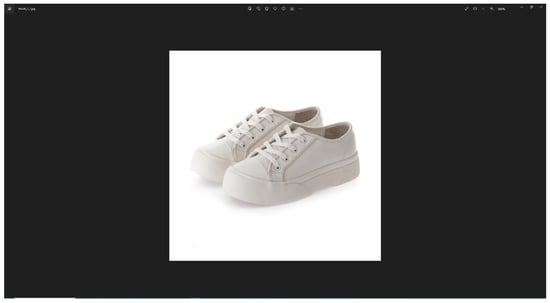
Figure 2.
Example of the implementation of product information provision methods used in existing online shopping platforms (e-commerce) in this study (side photo of Model 1).
3.2.2. Product Information Provision Methods of VR Shopping
In this study, to implement the product information provision method for VR shopping, we first went through the process of recreating the research subject products (shoes) within VR. As mentioned earlier in Section 1 and Section 2.3, we utilized 3D Gaussian splatting for 3D visualization of the research subject products (shoes) due to its high-quality output and relatively fast learning speeds. The rendering process of the research subject products (shoes) using 3D Gaussian splatting was conducted following a step-by-step tutorial and installation guide shared by the research team. Additionally, the computer specifications used for the 3D Gaussian splatting training included an 11th Gen Intel(R) Core™ i7-11700KF @ 3.60 GHz processor, 128 GB of memory, and an NVIDIA GeForce RTX 3090 GPU, with a Windows 10 Education operating system. Essential dependency software such as CUDA 11.8, Anaconda 2024.02-1, Visual Studio Code 1.86, COLMAP 3.11.1, ImageMagick 7.1.1, and FFMPEG 7.1 were installed and utilized. The input video for 3D visualization was shot using an iPhone 12 Pro at 4k resolution and 60 fps, capturing the research subject products (shoes) rotating 1260 degrees. To specifically capture the research subject product, we filmed the entire surface of the experimental product by rotating it three times while fixing the research subject product in the center. The research subject products (shoes) were filmed separately. The video was then split into 10fps increments and converted into images; after a preprocessing step using COLMAP and ImageMagick for 3D visualization, the learning process was conducted to visualize the research subject products (shoes) in 3D within VR (see Figure 3).
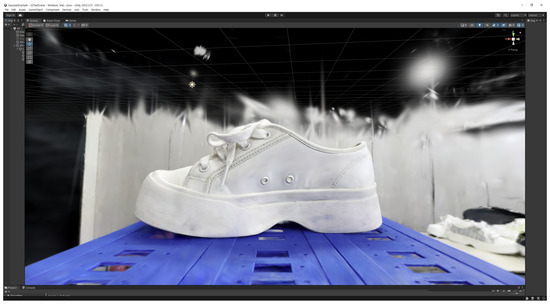
Figure 3.
Example of the implementation of product information provision methods used in VR shopping platforms in this study (Model 1).
3.3. Evaluation Index
We established quantitative evaluation metrics through Kansei engineering to perform a quantitative comparison of the product emotions perceived by consumers between the product information provision methods of the existing online platform (e-commerce) implemented in Section 3.2.1 and the VR shopping product information provision method in Section 3.2.2. Additionally, to compare the ease of product recognition, we segmented the research subject products (shoes) into specific parts and measured the understanding of the product appearance characteristics of each part to conduct comparisons between the different product information provision methods.
3.3.1. Product Emotion Evaluation Metrics
As mentioned in Section 2.2, Kansei engineering is used to derive the emotions and requirements that consumers feel toward specific products. Therefore, we used Kansei engineering to calculate the emotion evaluation metrics for the research subject products (shoes) based on what participants (consumers) felt. To derive the product emotion evaluation metrics, we first reviewed existing research [9,10,11,12] and collected Kansei words. From this process, 67 Kansei words were initially gathered; after removing duplicates with overlapping meanings, we ultimately derived 30 Kansei words (see Table 1).

Table 1.
Kansei words derived from the existing literature review.
Antonyms were paired to form Kansei pairs, and these Kansei pairs were used as evaluation metrics to derive product emotions. Participants (consumers) were asked to rate their emotions toward the products (the degree to which they felt certain words appropriately described the products) on a 7-point semantic differential scale (see Table 2).
Table 2.
Final Kansei pairs for measuring affection.
However, the nature of the results from the semantic differential survey does not indicate whether high or low scores are inherently good or bad. For example, if a participant who experienced Model 1 in a traditional e-commerce environment rated the shoes as “Luxury” with a score of 1, and another participant who experienced the same shoes in a VR shopping environment felt they were “Casual” and gave a score of 7, it does not mean that the VR shopping environment, which received a higher score, provides a better user experience. Therefore, the difference in scores relative to the middle score (4: “SoSo”) was chosen as an emotional indicator to assess how well each environment conveyed emotions to the participants.
3.3.2. Ease of Product Recognition: Metrics
To quantitatively compare the impact of product information provision methods on the recognition of the research subject products (shoes), we evaluated the ease of recognition of various parts of the shoes. For the definition of detailed shoe parts, we referred to [12] and Nike’s “Sneaker School”. Generally, a shoe (sneaker) can be divided into the upper and the sole parts, while the more specific parts include the collar, quarter, midsole, outsole, tongue, eyestay, and foxing. Among these various parts, the parts represented in the research subject products (shoes) are the quarter, toe, midsole, tongue, eyestay, and foxing (see Figure 4).
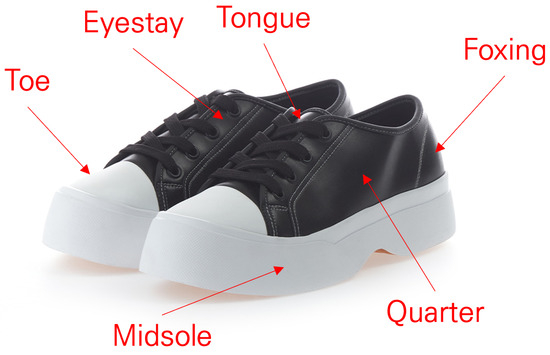
Figure 4.
Research subject products(shoes) name of each part.
4. Experiment
This experiment aimed to compare the impact of information provision methods on product emotion and ease of product information recognition in an online environment where customers cannot directly experience the product, focusing on fashion products like shoes, which significantly influence purchase decisions based on perceived product appearance information. We established the information provision method of the existing online shopping platform (e-commerce) as the control group (CG) and the VR shopping information provision method as the experimental group (EG). This experiment was designed as a between-subject study. Additionally, the order in which participants (see Figure 1) experienced the product was counterbalanced to prevent order effects and carryover effects.
4.1. Measurement
This experiment measured the impact of differences in product information provision methods online on product emotion and the ease of product information recognition. Initially, to measure the impact on product emotion, we structured the survey questions in the semantic differential method as shown in Table 2. Participants were asked to respond on a 7-point scale based on how appropriately they thought the terms described the product (shoes) after experiencing the information provision method. Next, the impact on the ease of product information recognition was measured using a 7-point Likert scale with 24 survey questions regarding the physical characteristics (color, shape, pattern, texture) of different parts of the shoe (Figure 4). For the survey responses measuring the ease of product information recognition, participants were given the actual product before responding to compare how accurately they could perceive product information about their online experience.
4.2. Participants
We recruited 30 college students (15 female and 15 male) who had experience using online shopping platforms.
4.3. Methods
The experiment utilized computers equipped with an 11th Gen Intel(R) Core™ i7-11700KF @ 3.60 GHz processor, 128 GB memory, and an NVIDIA GeForce RTX 3090 GPU. Three monitors were used as shown in Figure 5. The left monitor displayed Figure 4 to help participants recognize the specific shoe terminology defined in this study, the central monitor showed the product information presentation screens (Section 3.2.1 and Section 3.2.2), and the right monitor, set vertically, provided the questionnaire (Google Forms).
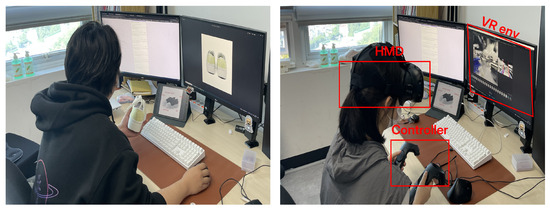
Figure 5.
Photos of the experimental setup. (Left): Example of the existing e-commerce experiment. (Right): An example of a VR shopping experiment environment, with the red box in the picture indicating the VR device used in the experiment.
4.4. Procedure
Before the experiment, we briefed the participants on the purpose of the study, how to answer the semantic differential questionnaire, and explained the names of different parts of the shoe. We also informed them that the detailed shoe terminologies could be checked on an iPad during the experiment. Participants then proceeded with product exploration according to the product information provision method in reverse order, as applied to their group (CG or EG). They were free to answer the questionnaire while exploring the products. The sequence of answering the questionnaire items was to first complete the product emotion items, followed by the product information recognition ease items. Before responding to the product information recognition ease items, the actual products were provided to the participants to assess how accurately and easily the product information perceived online was conveyed. For the EG, to control for variables related to psychological barriers from unfamiliarity with using an HMD, all participants practiced until they could operate it sufficiently before proceeding with product information exploration. After all product explorations and questionnaire responses were completed, a post-experiment survey for demographic analysis was conducted, concluding the experiment. The research protocol was reviewed and approved by the Institutional Review Board of Dong-Eui University (DIRB-202404-HR-E-17), approved on 26 April 2024.
5. Results
5.1. Descriptive Analysis of Participants’ Characteristics
The experiment analyzed results from 28 participants, after excluding 2 due to insincere or biased responses. The demographic breakdown included an equal number of males and females, with 14 in each category. The control group, consisting of eight males and six females, conducted product browsing through an existing e-commerce environment, while the experimental group, composed of six males and eight females, conducted VR shopping. All participants were aged between 20 and 25. The average usage of online shopping platforms was six times per week. While 18 participants generally purchased shoes online, 10 preferred buying shoes in physical stores. Data on VR device usage among the experimental group indicated a low usage trend, with an average of 1.7 uses (see Table 3).
Table 3.
Characteristics of participants.
5.2. Results of the Product Emotion Evaluation Questionnaire
As mentioned in Section 3.3.1, the product emotion evaluation questionnaire used the difference from the midpoint value of 4 (no appropriate description) to measure how well each environment conveyed product emotion. The analysis was performed using SPSS for Windows. We designated the product information provision method as an independent variable and performed an independent sample t-test. Each test was analyzed separately for each product under study. The combined analysis results for all shoe models showed that out of 15 items, 9 items (i.e., 1, 2, 3, 4, 6, 7, 10, 13, 15) demonstrated a larger difference in scores in favor of the VR shopping information provision method over the existing e-commerce method. However, only item 3, with a t-value of −2.786, showed a statistically significant difference in product information provision methods (see Figure 6).
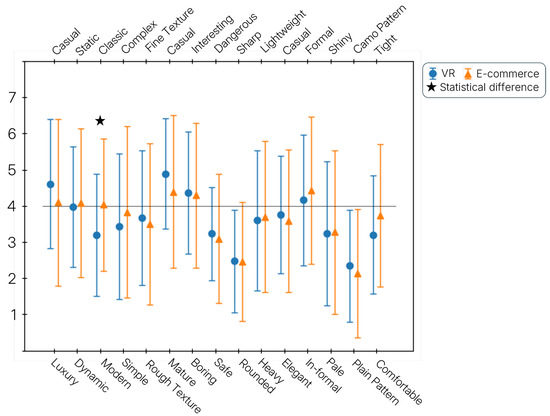
Figure 6.
t-test results of product emotion evaluation for all shoe models.
The analysis results by individual shoe models showed a different pattern compared to the consolidated results. This difference is due to the unique product emotions associated with each shoe model, which can offset the combined results. Specifically, Model 1 displayed a greater score difference in four items (i.e., 3, 6, 10, 11) favoring the VR shopping information provision method over the existing e-commerce method. In terms of standard deviation, which indicates the consistency of product emotion information delivery, VR shopping showed relatively smaller variations in nine items (i.e., 1, 2, 4, 6, 7, 8, 9, 10, 12). Similarly, Model 2 displayed significant differences in 4 items (i.e., 3, 9, 10, 11) with VR shopping and showed relatively smaller variances in 11 items (i.e., 1, 2, 3, 4, 7, 8, 9, 10, 11, 13, 15). For Model 3, the VR shopping information provision method showed considerable differences in five items (i.e., 3, 6, 13, 14, 15) relative to the median, and smaller variances in all items except 12. In Model 4, VR shopping demonstrated significant differences in five items (i.e., 2, 3, 6, 7, 9) relative to the median, with smaller variances observed in all but three items (i.e., 3, 4, 5). Lastly, Model 5’s VR shopping method revealed significant differences in 5 items (i.e., 3, 10, 11, 13, 15) relative to the median, and the standard deviation was smaller in 11 of the items, excluding 4 items (i.e., 3, 6, 9, 12). The shoe model analysis revealed that statistically significant differences were absent in all items for Model 3 except for item 1.
5.3. Results of the Product Information Recognition Ease Questionnaire
We assessed the impact of different product information provision environments on product information recognition using the results from the Product Information Recognition Ease questionnaire. As mentioned in Section 3.2.2, shoe parts were categorized into six types (i.e., quarter, toe, midsole, tongue, eyestay, foxing). For each part, we evaluated the perceived degree of four extrinsic cues: color, shape, pattern, and texture. The analysis was conducted using SPSS for Windows, with the product information provision method declared as the independent variable and employing the Mann–Whitney U test, a nonparametric test. The Mann–Whitney test results indicated statistically significant differences between the groups in the color of the quarter (U = 2931.5, p = 0.029), the shape of the quarter (U = 2977.0, p = 0.012), the color of the toe (U = 2971.5, p = 0.002), the shape of the toe (U = 3210.5, p < 0.001), the pattern of the toe (U = 2971.5, p = 0.002), the color of the midsole (U = 2966.0, p = 0.006), the shape of the midsole (U = 3139.0, p < 0.001), the pattern of the midsole (U = 2861.0, p = 0.036), the shape of the tongue (U = 2936.0, p = 0.025), the color of the eyestay (U = 3053.5, p = 0.004), the shape of the eyestay (U = 3123.5, p < 0.001), the pattern of the eyestay (U = 3049.0, p = 0.004), the color of the foxing (U = 3053.0, p = 0.004), the shape of the foxing (U = 3214.5, p < 0.001), and the pattern of the foxing (U = 2954.0, p = 0.015). These results showed that the VR shopping information provision method ranked higher than the existing e-commerce method (see Figure 7).
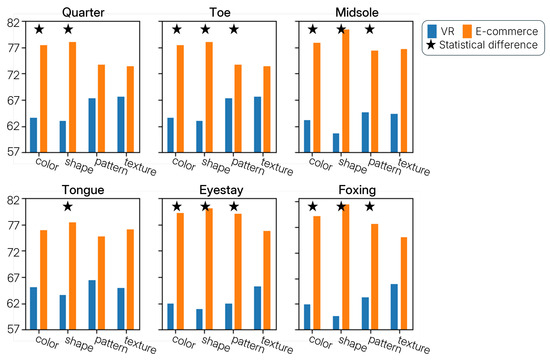
Figure 7.
Consolidated analysis results of product information recognition ease by product information provision method.
The Mann–Whitney test results for ease of product recognition by shoe model showed that, like the overall results, the VR shopping information provision method generally ranked higher. However, statistically significant differences were observed in specific items: In Model 1, three items showed significant differences (i.e., the color of the quarter (U = 60.0, p = 0.034), the shape of the toe (U = 70.0, p = 0.034), and the pattern of the foxing (U = 63.0, p = 0.016)). In Model 2, three items were significant (i.e., the pattern (U = 61.5, p = 0.027) and material (U = 54.5, p = 0.034) of the midsole, and the material of the foxing (U = 56.5, p = 0.042)). In Model 3, five items were significant (i.e., the color (U = 69.5, p = 0.038), shape (U = 61.0, p = 0.038), and pattern (U = 63, p = 0.016) of the toe, the shape of the midsole (U = 63.0, p = 0.016), and the shape of the foxing (U = 61.5, p = 0.027)). In Model 4, three items were significant (i.e., the shape (U = 56.5, p = 0.036) and pattern (U = 52.0, p = 0.026) of the eyestay, and the shape of the foxing (U = 52.0, p = 0.017)). In Model 5, seven items were significant (i.e., the shape of the quarter (U = 60.0, p = 0.043), the shape of the toe (U = 47.5, p = 0.005), the color (U = 52.5, p = 0.024) and shape (U = 57.0, p = 0.046) of the tongue, the color (U = 49.0, p = 0.014) and shape (U = 58.5, p = 0.038) of the eyestay, and the color of the foxing (U = 47.0, p = 0.011)), totaling 18 significant items.
5.4. Qualitative Survey Results
We conducted a qualitative survey on participants’ experiences with the product information provision methods, and the results were analyzed through frequency analysis to derive user opinions about these methods. The advantages cited for the VR shopping environment included “the ability to view the product from various angles” (N = 7) and “the ability to examine the product in detail” (N = 7). For the existing e-commerce environment, advantages such as “familiar controls” and “comfortable usability with a familiar UI” (N = 10) were noted. On the other hand, the disadvantages of the VR shopping environment were “unfamiliar controls leading to discomfort” (N = 10) and “dizziness after prolonged use” (N = 5), while the existing e-commerce environment was criticized for “limited product information” (N = 10).
6. Discussion
6.1. Traditional E-Commerce vs. VR Shopping
According to the results of the comparative experiment between the product information provision methods of VR shopping and e-commerce conducted in this study, the VR shopping method has shown a trend of making product recognition easier, consistently delivering product emotion better than the e-commerce method. In terms of product recognition ease, the VR shopping method has been particularly encouraging, as it enables consumers to understand product information more easily in online shopping where the actual product cannot be experienced, compared to traditional e-commerce. In particular, for shoes with various extrinsic characteristics, like Models 3, 4, and 5, the VR shopping method is expected to hold high value in product information recognition ease. Unfortunately, no statistically significant differences were proven in the delivery of product emotion, but the VR shopping method showed a higher average trend. Additionally, the relatively low standard deviation in the emotional delivery indicators for the VR method suggests that it can consistently convey product emotions compared to the e-commerce method, potentially preventing poor shopping experiences due to incorrect perceptions of product emotion in online shopping.
Therefore, through this study, we confirmed that providing product information in a VR environment can convey the emotions and details of actual products to users more consistently and accurately than traditional e-commerce methods while maintaining the existing advantages of e-commerce, such as the ability to search for products without time and space constraints.
6.2. Limitation and Future Works
This is an initial study that observes the differences in product information perceived by users according to a different information provision method in a VR environment, compared to traditional e-commerce. However, this study has several limitations.
First, we designed and conducted an experiment with 28 participants to quantitatively compare the two environments. This allowed us to confirm the differences perceived by users in each environment, but it may not have been enough for an objective factual evaluation. Therefore, in future studies, it will be necessary to conduct experiments with more participants and have diverse demographic distributions.
Second, there is the issue of dizziness that users may experience regarding the way product information is provided in VR shopping. In this study’s experiments, there were cases where some participants complained of slight dizziness in the VR shopping environment. This is still a challenge for sustainable VR shopping regardless of the richness of product information perceived by users in VR shopping and the shopping experience. In addition to the hardware development of VR, we need to study the effect of VR shopping and its product information perception on users in future studies by using a method such as a VR room other than an HMD and methods that involve rotating products rather than rotating them according to the user’s gaze in the VR environment.
Resolving these issues is possible with advancements in VR device technology and commercialization. Furthermore, future research should not only focus on sneakers but also consider a variety of shoe products. It seems pertinent to explore how an expanded platform environment, which includes single product information along with “photos of models wearing the products” and “price information”, affects consumers.
7. Conclusions
We focused on shoes to compare the impact of product information provision methods in VR shopping with those of e-commerce, focusing on perceived product emotion and ease of product recognition. The research subject products (shoes) were selected based on five types that differed in extrinsic elements while standardizing intrinsic elements. We established metrics for evaluating product emotion and ease of product recognition to quantitatively compare the effects of different product information provision methods. We conducted a comparative experiment that consisted of 30 participants. The results showed statistically significant differences in ease of recognition between the two groups, with the VR shopping method ranking higher. Although a t-test for product emotion comparison between the two groups revealed only one statistically significant item (item 3), the VR shopping method generally showed smaller standard deviations across most items, suggesting it consistently delivers product emotions to consumers.
Additionally, qualitative surveys based on participants’ user experiences in each environment confirmed the potential of VR shopping to provide a good shopping experience to consumers based on detailed and rich product information. This study identified factors that could degrade the shopping experience, such as unfamiliar controls and induced dizziness, which can be mitigated by future improvements in device performance and commercialization to enhance device accessibility. Thus, this study’s significance lies in providing practical comparisons and references for future VR-based shopping and information provision by analyzing the impact of product information provision methods on perceived product emotions and ease of product recognition.
Author Contributions
Conceptualization, methodology, formal analysis, validated H.-J.K.; data curation, H.-J.K. and S.-H.K.; writing—original draft preparation, H.-J.K. and S.-H.K.; writing—review and editing, H.-J.K. and S.-H.K.; supervision, S.-H.K.; project administration, S.C.J.; funding acquisition, S.C.J. All authors have read and agreed to the published version of the manuscript.
Funding
This work was partly supported by the Institute of Information & Communications Technology Planning & Evaluation(IITP)-Innovative Human Resource Development for Local Intellectualization program grant funded by the Korea government(MSIT) (IITP-2025-RS-2020-II201791, 100%) and the BB21plus funded by Busan Metropolitan City and Busan Techno Park.
Institutional Review Board Statement
After all product explorations and questionnaire responses were completed, a post-experiment survey for demographic analysis was conducted, concluding the experiment. The research protocol was reviewed and approved by the Institutional Review Board of Dong-Eui University (DIRB-202404-HR-E-17), approved on 26 April 2024.
Informed Consent Statement
Informed consent was obtained from all subjects involved in the study.
Data Availability Statement
The data presented in this study are available upon request from the corresponding author. The data are survey data collected while making decisions using our system.
Conflicts of Interest
The authors declare no conflicts of interest. The founders had no role in the design of the study; in the collection, analyses, or interpretation of data; in the writing of the manuscript; or in the decision to publish the results.
References
- Kim, Y.; Kim, J. Luxury fashion brands case analysis of using metaverse. J. Fash. Bus. 2022, 26, 50–71. [Google Scholar]
- Speicher, M.; Cucerca, S.; Krüger, A. VRShop: A mobile interactive virtual reality shopping environment combining the benefits of on-and offline shopping. Proc. ACM Interact. Mob. Wearable Ubiquitous Technol. 2017, 1, 102. [Google Scholar] [CrossRef]
- Speicher, M. Shopping in virtual reality. In Proceedings of the 2018 IEEE Conference on Virtual Reality and 3D User Interfaces (VR), Tuebingen/Reutlingen, Germany, 18–22 March 2018; IEEE: Piscataway, NJ, USA, 2018; pp. 1–2. [Google Scholar]
- Zheng, L.; Pan, Y.H. Integrated Shopping Experience on User Centered View: Focusing on the Shopping Phase of Exploration and Comparison. J. Digit. Contents Soc. 2019, 20, 2193–2202. [Google Scholar] [CrossRef]
- Jang, J.Y.; Chun, J. A research on the characteristics of virtual reality stores-Focused on Hyundai VR store and eBay VR department store. J. Korean Soc. Cloth. Text. 2018, 42, 671–688. [Google Scholar] [CrossRef]
- Lee, W.Y. A study of the technical tendency augmented reality and the application of fashion industry. J. Korean Soc. Des. Cult. 2010, 16, 367–377. [Google Scholar]
- Rahman, O. Online consumer choice: Footwear design and visual presentation. J. Text. Appar. Technol. Manag. 2018, 10, 1–19. [Google Scholar]
- Rahmawati, C.H.T.; Tanuwijaya, T.C.; Yuniarto, A.Y. The Influence of Product Design, Sales Promotion and Product Quality on Customer Purchase Decision at Converse Shoes (Study on Millenial Generation). Manaj. Dewantara 2022, 6, 211–224. [Google Scholar] [CrossRef]
- CHENG, S.H.; LEE, C.J. Gender Differences in Footwear Visual Perception. Int. J. Affect. Eng. 2021, 20, 257–264. [Google Scholar] [CrossRef]
- Jatmiko, H.A.; Nugroho, D.S. Implementing Kansei Engineering and Quality Function Deployment Method in Designing Shoes: Case Study at Rejowinangun Original Leather. Log. J. Ranc. Bangun Dan Teknol. 2022, 22, 70–80. [Google Scholar] [CrossRef]
- Tumewu, T.W.; Dharma, I. The Exterior Form Design of Men Formal Shoe with Kansei Engineering Through Structure of Meaning. In Proceedings of the Joint International Conference-APCHI-Ergofuture-PEI-IAIFI 2014, Bali, Indonesia, 22–25 October 2014; Udayana University Press: Bali, Indonesia, 2014. [Google Scholar]
- Shieh, M.D.; Yeh, Y.E. A comparative study on perceptual evaluations of sports shoe exterior colors in Taiwan. Color Res. Appl. 2015, 40, 178–193. [Google Scholar] [CrossRef]
- Chen, Y.C.; Lee, Y.H.; Wu, H.C.; Sung, Y.C.; Chen, H.Y. Online apparel shopping behavior: Effects of consumer information search on purchase decision making in the digital age. In Proceedings of the 2017 IEEE 8th International Conference on Awareness Science and Technology (iCAST), Taichung, Taiwan, 8–10 November 2017; IEEE: Piscataway, NJ, USA, 2017; pp. 143–148. [Google Scholar]
- Bressoud, E. Testing FMCG innovations: Experimental real store versus virtual. J. Prod. Brand Manag. 2013, 22, 286–292. [Google Scholar] [CrossRef]
- Hsu, W.C.; Chen, P.H.; Chen, C.Y. An exploration of the impact of virtual reality interfaces on online shopping. Inf. Resour. Manag. J. (IRMJ) 2020, 33, 19–39. [Google Scholar] [CrossRef]
- Carlson, P.; Kirpes, C.; Pavlik, R.A.; Vance, J.M.; Yin, L.; Scott-Cooper, T.; Lambert, T. Comparison of single-wall versus multi-wall immersive environments to support a virtual shopping experience. In Proceedings of the World Conference on Innovative Virtual Reality, Milan, Italy, 27–29 June 2011; Volume 44328, pp. 287–291. [Google Scholar]
- Dzardanova, E.; Kasapakis, V.; Gavalas, D. Affective impact of social presence in immersive 3D virtual worlds. In Proceedings of the 2017 IEEE Symposium on Computers and Communications (ISCC), Heraklion, Greece, 3–6 July 2017; IEEE: Piscataway, NJ, USA, 2017; pp. 6–11. [Google Scholar]
- Schütte, S.T.; Eklund, J.; Axelsson, J.R.; Nagamachi, M. Concepts, methods and tools in Kansei engineering. Theor. Issues Ergon. Sci. 2004, 5, 214–231. [Google Scholar] [CrossRef]
- Shokri, P. Aesthetic in Designing Shoes; a Necessity to Meet the Needs of Customers. Asian Soc. Sci. 2016, 12, 246. [Google Scholar] [CrossRef][Green Version]
- Kaledio, E.; Oloyede, J.; Lucas, D. Applications and Advancements in 3D Visualization Technology. researchgate.net. 2024. Available online: https://www.researchgate.net/profile/Kaledio-Potter/publication/377700559_Applications_and_Advancements_in_3D_Visualization_Technology/links/65b339ac34bbff5ba7c4cb9e/Applications-and-Advancements-in-3D-Visualization-Technology.pdf (accessed on 4 October 2024).
- Gortler, S.J.; Grzeszczuk, R.; Szeliski, R.; Cohen, M.F. The Lumigraph. In Seminal Graphics Papers: Pushing the Boundaries, Volume 2, 1st ed.; Association for Computing Machinery: New York, NY, USA, 2023. [Google Scholar]
- Levoy, M.; Hanrahan, P. Light field rendering. In Seminal Graphics Papers: Pushing the Boundaries, Volume 2; Association for Computing Machinery: New York, NY, USA, 2023; pp. 441–452. [Google Scholar]
- Buehler, C.; Bosse, M.; McMillan, L.; Gortler, S.; Cohen, M. Unstructured lumigraph rendering. In Proceedings of the 28th Annual Conference on Computer Graphics and Interactive Techniques, Los Angeles, CA, USA, 12–17 August 2001; pp. 425–432. [Google Scholar]
- Snavely, N.; Seitz, S.M.; Szeliski, R. Photo tourism: Exploring photo collections in 3D. ACM Trans. Graph. (TOG) 2006, 25, 835–846. [Google Scholar] [CrossRef]
- Goesele, M.; Snavely, N.; Curless, B.; Hoppe, H.; Seitz, S.M. Multi-view stereo for community photo collections. In Proceedings of the 2007 IEEE 11th International Conference on Computer Vision, Rio de Janeiro, Brazil, 14–21 October 2007; IEEE: Piscataway, NJ, USA, 2007; pp. 1–8. [Google Scholar]
- Mildenhall, B.; Srinivasan, P.P.; Tancik, M.; Barron, J.T.; Ramamoorthi, R.; Ng, R. Nerf: Representing scenes as neural radiance fields for view synthesis. Commun. ACM 2021, 65, 99–106. [Google Scholar] [CrossRef]
- Chen, G.; Wang, W. A survey on 3d gaussian splatting. arXiv 2024, arXiv:2401.03890. [Google Scholar]
- Kerbl, B.; Kopanas, G.; Leimkühler, T.; Drettakis, G. 3D Gaussian Splatting for Real-Time Radiance Field Rendering. ACM Trans. Graph. 2023, 42, 139-1. [Google Scholar] [CrossRef]
- Blijlevens, J.; Creusen, M.E.; Schoormans, J.P. How consumers perceive product appearance: The identification of three product appearance attributes. Int. J. Des. 2009, 3, 27–35. [Google Scholar]


Disclaimer/Publisher’s Note: The statements, opinions and data contained in all publications are solely those of the individual author(s) and contributor(s) and not of MDPI and/or the editor(s). MDPI and/or the editor(s) disclaim responsibility for any injury to people or property resulting from any ideas, methods, instructions or products referred to in the content. |
© 2025 by the authors. Licensee MDPI, Basel, Switzerland. This article is an open access article distributed under the terms and conditions of the Creative Commons Attribution (CC BY) license (https://creativecommons.org/licenses/by/4.0/).