
Investigation of the Layered Effect on the Tensile Fracture Characteristics of Sandstone Using Intact and Pre-Cracked Brazilian Disk Specimens


Abstract
:1. Introduction
2. Materials and Methods
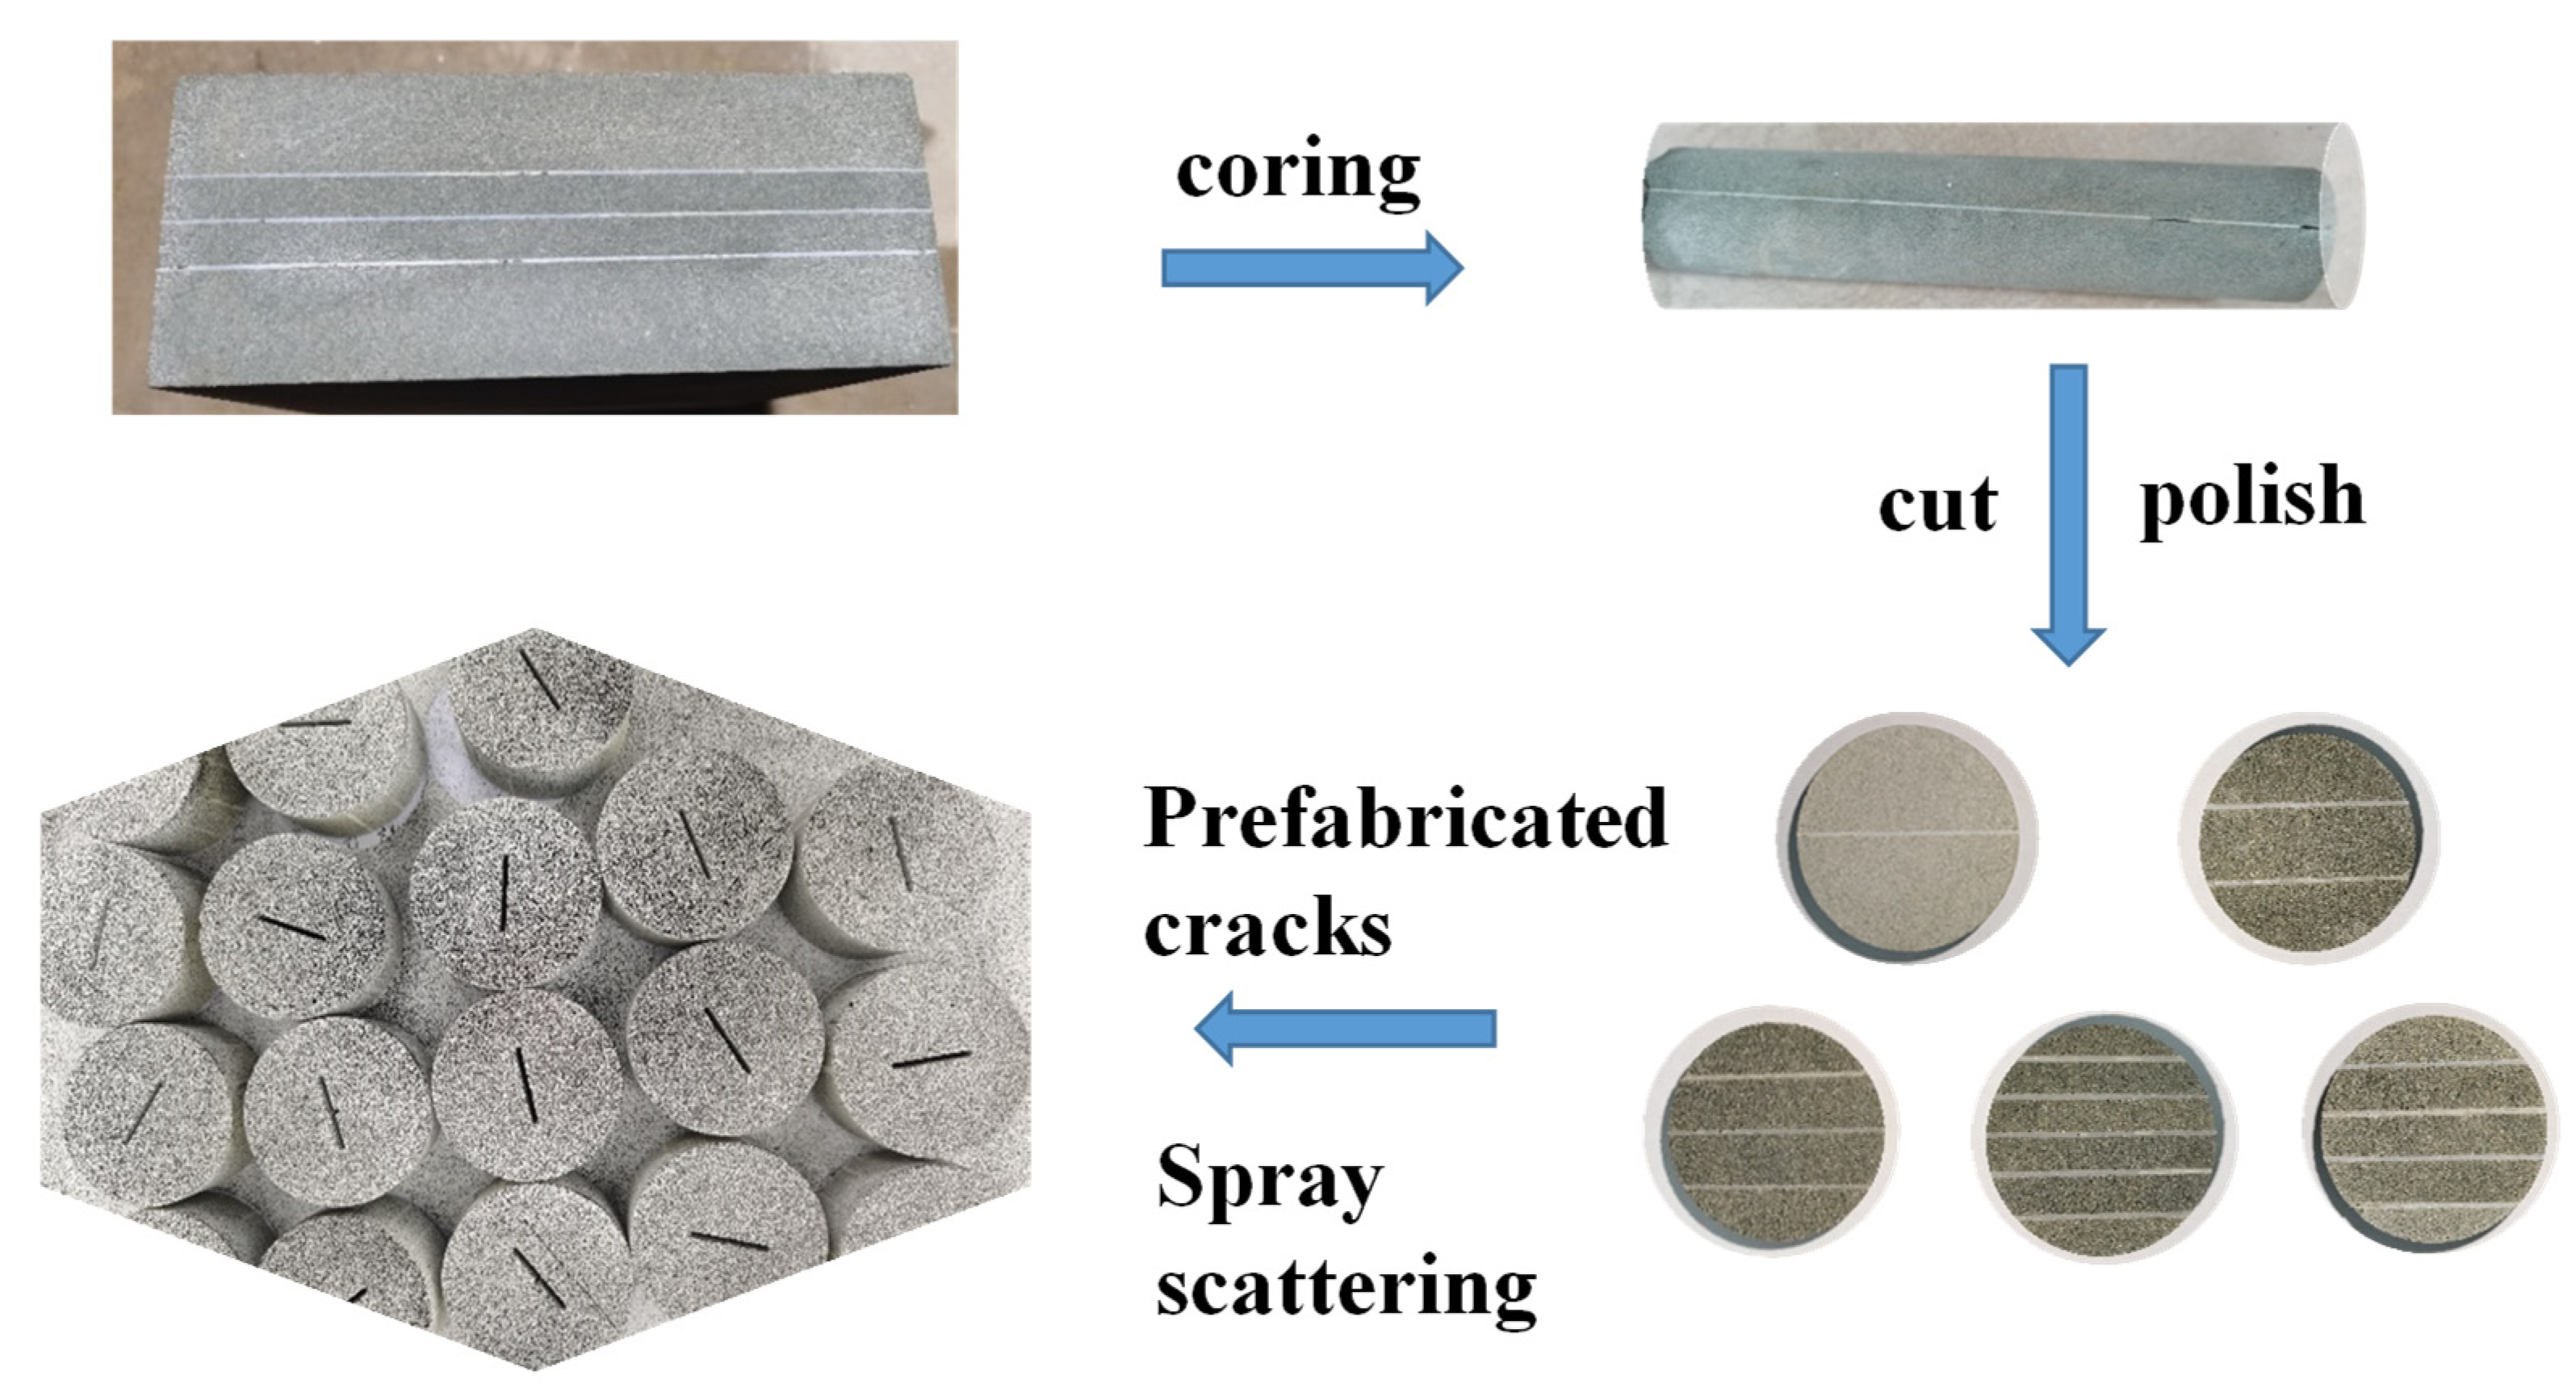
2.1. Specimen Preparation
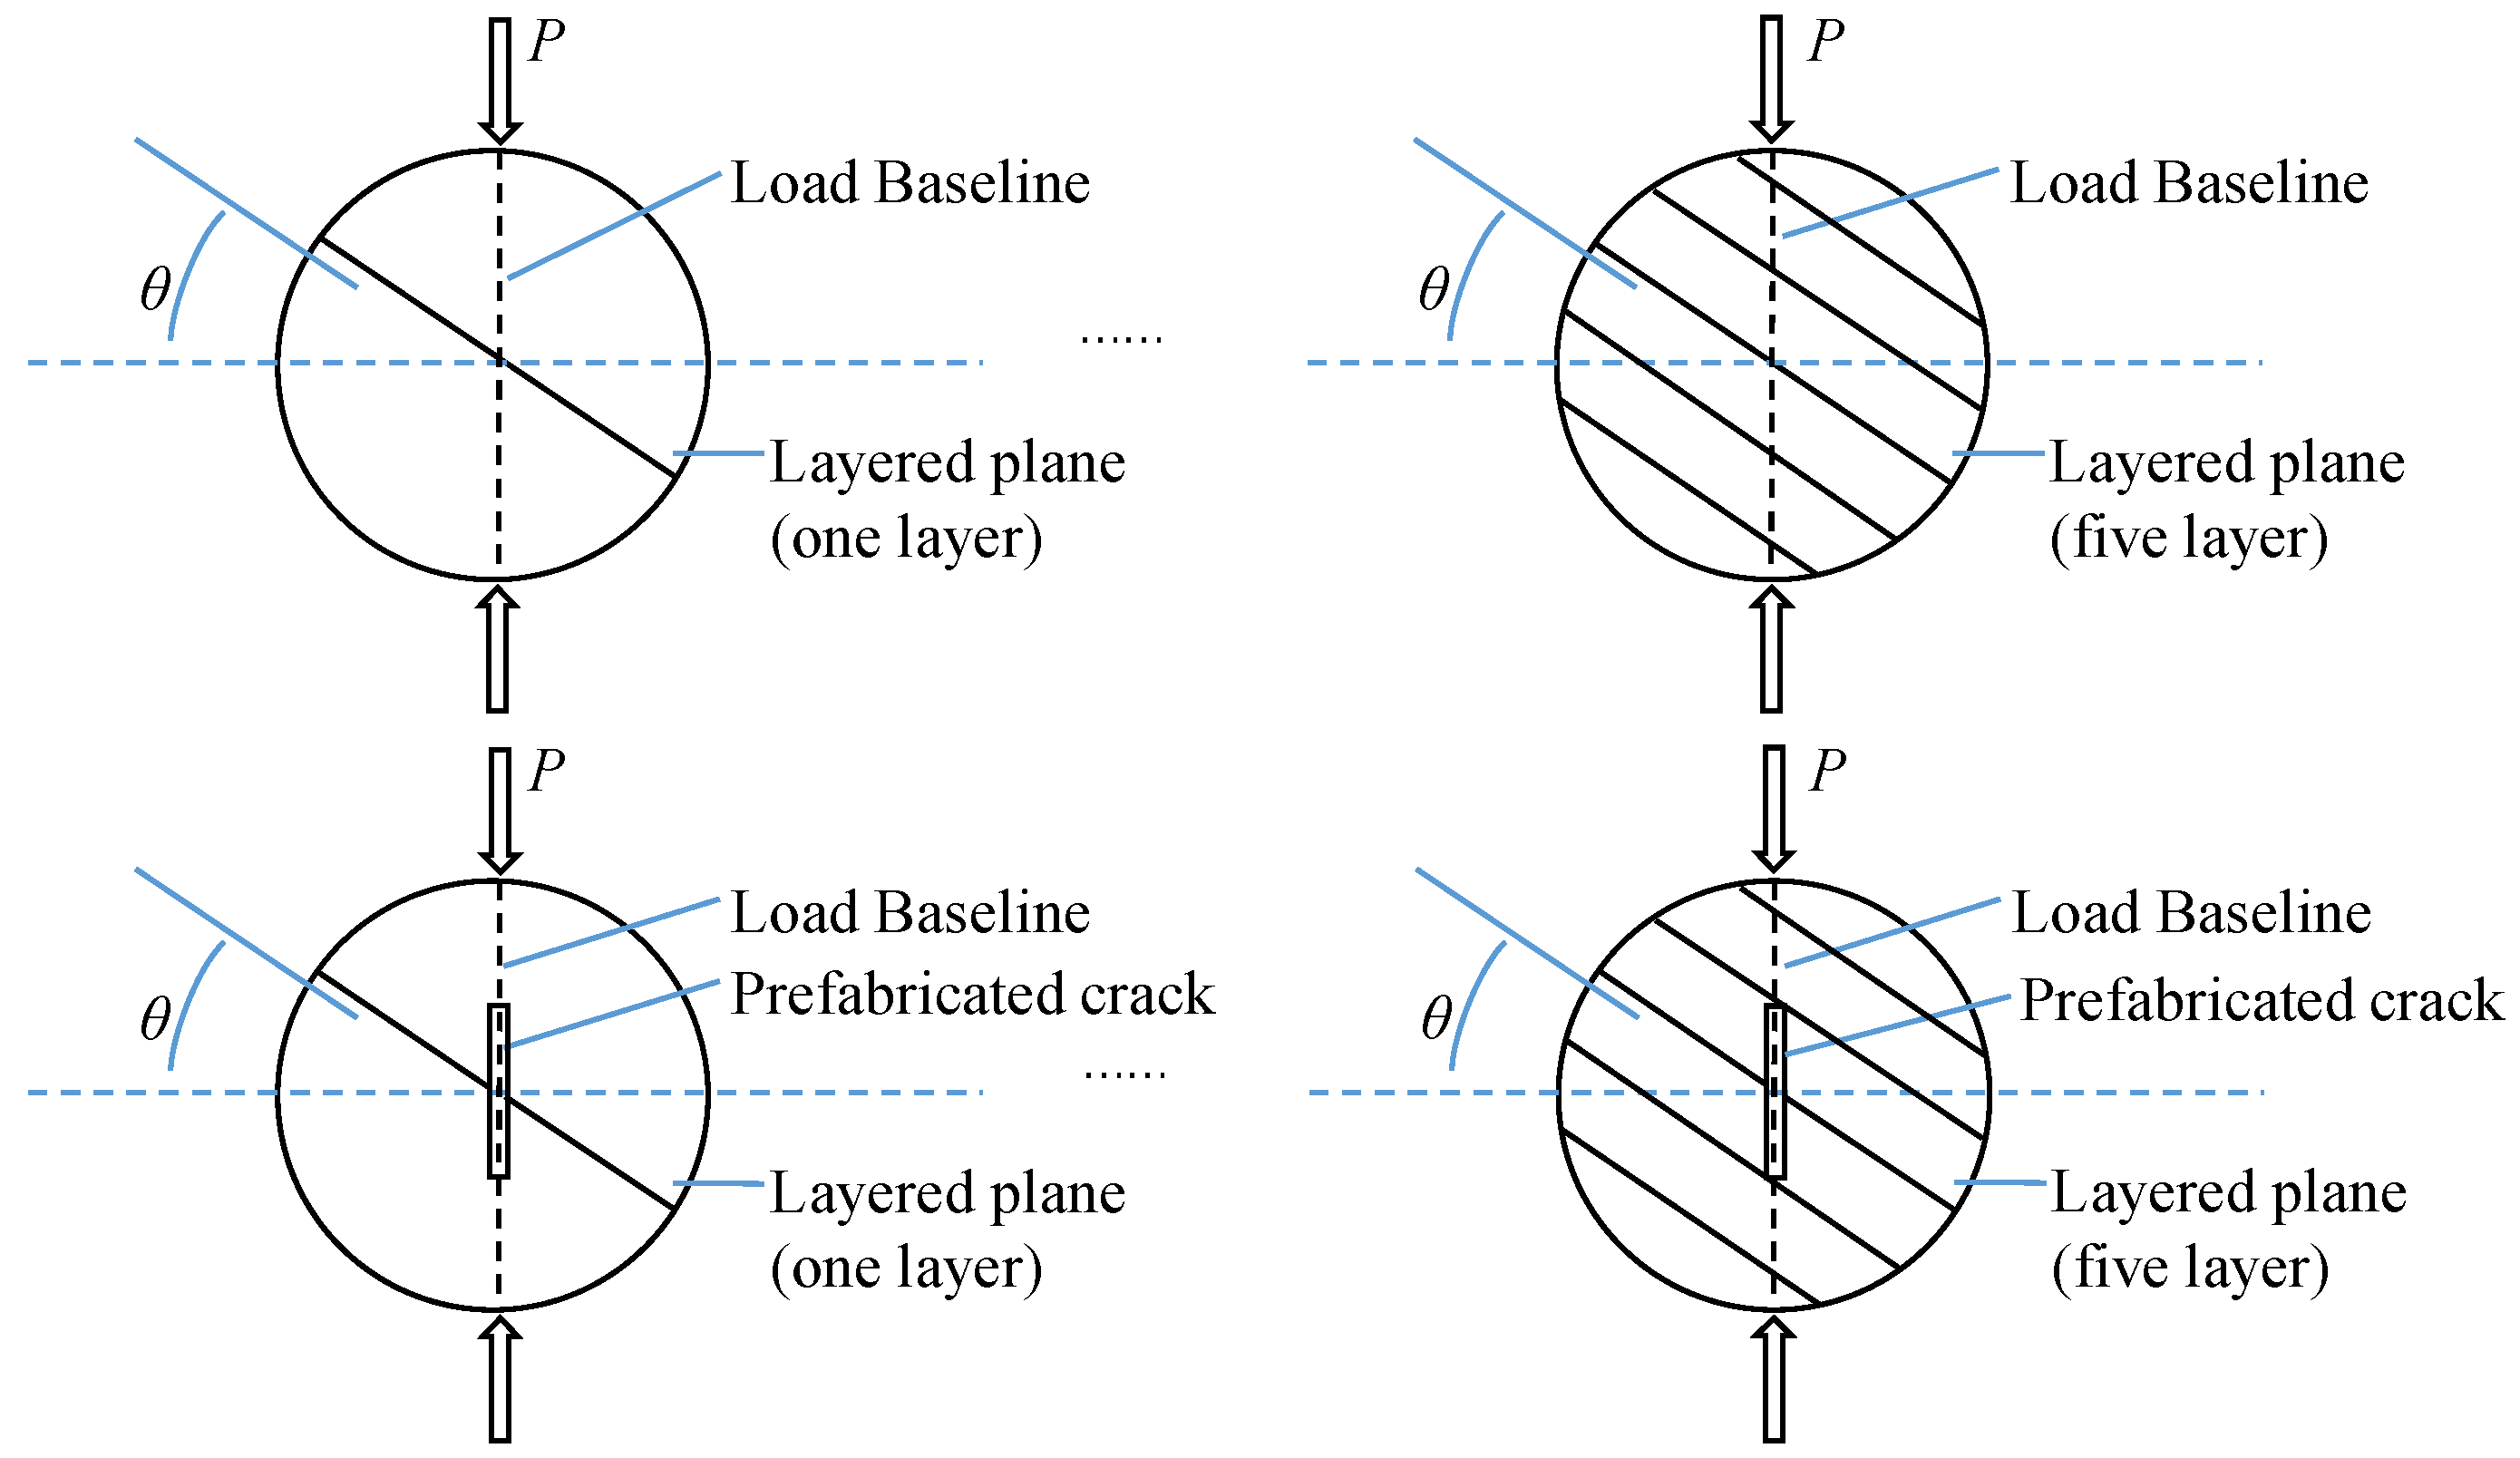
2.2. Testing Procedure for Intact and Pre-Cracked Brazilian Disk Specimens
3. Results and Discussion
3.1. The Stratification Effects of Rock’s Splitting Characteristics
3.1.1. Tensile Strength and Failure Mode Analysis
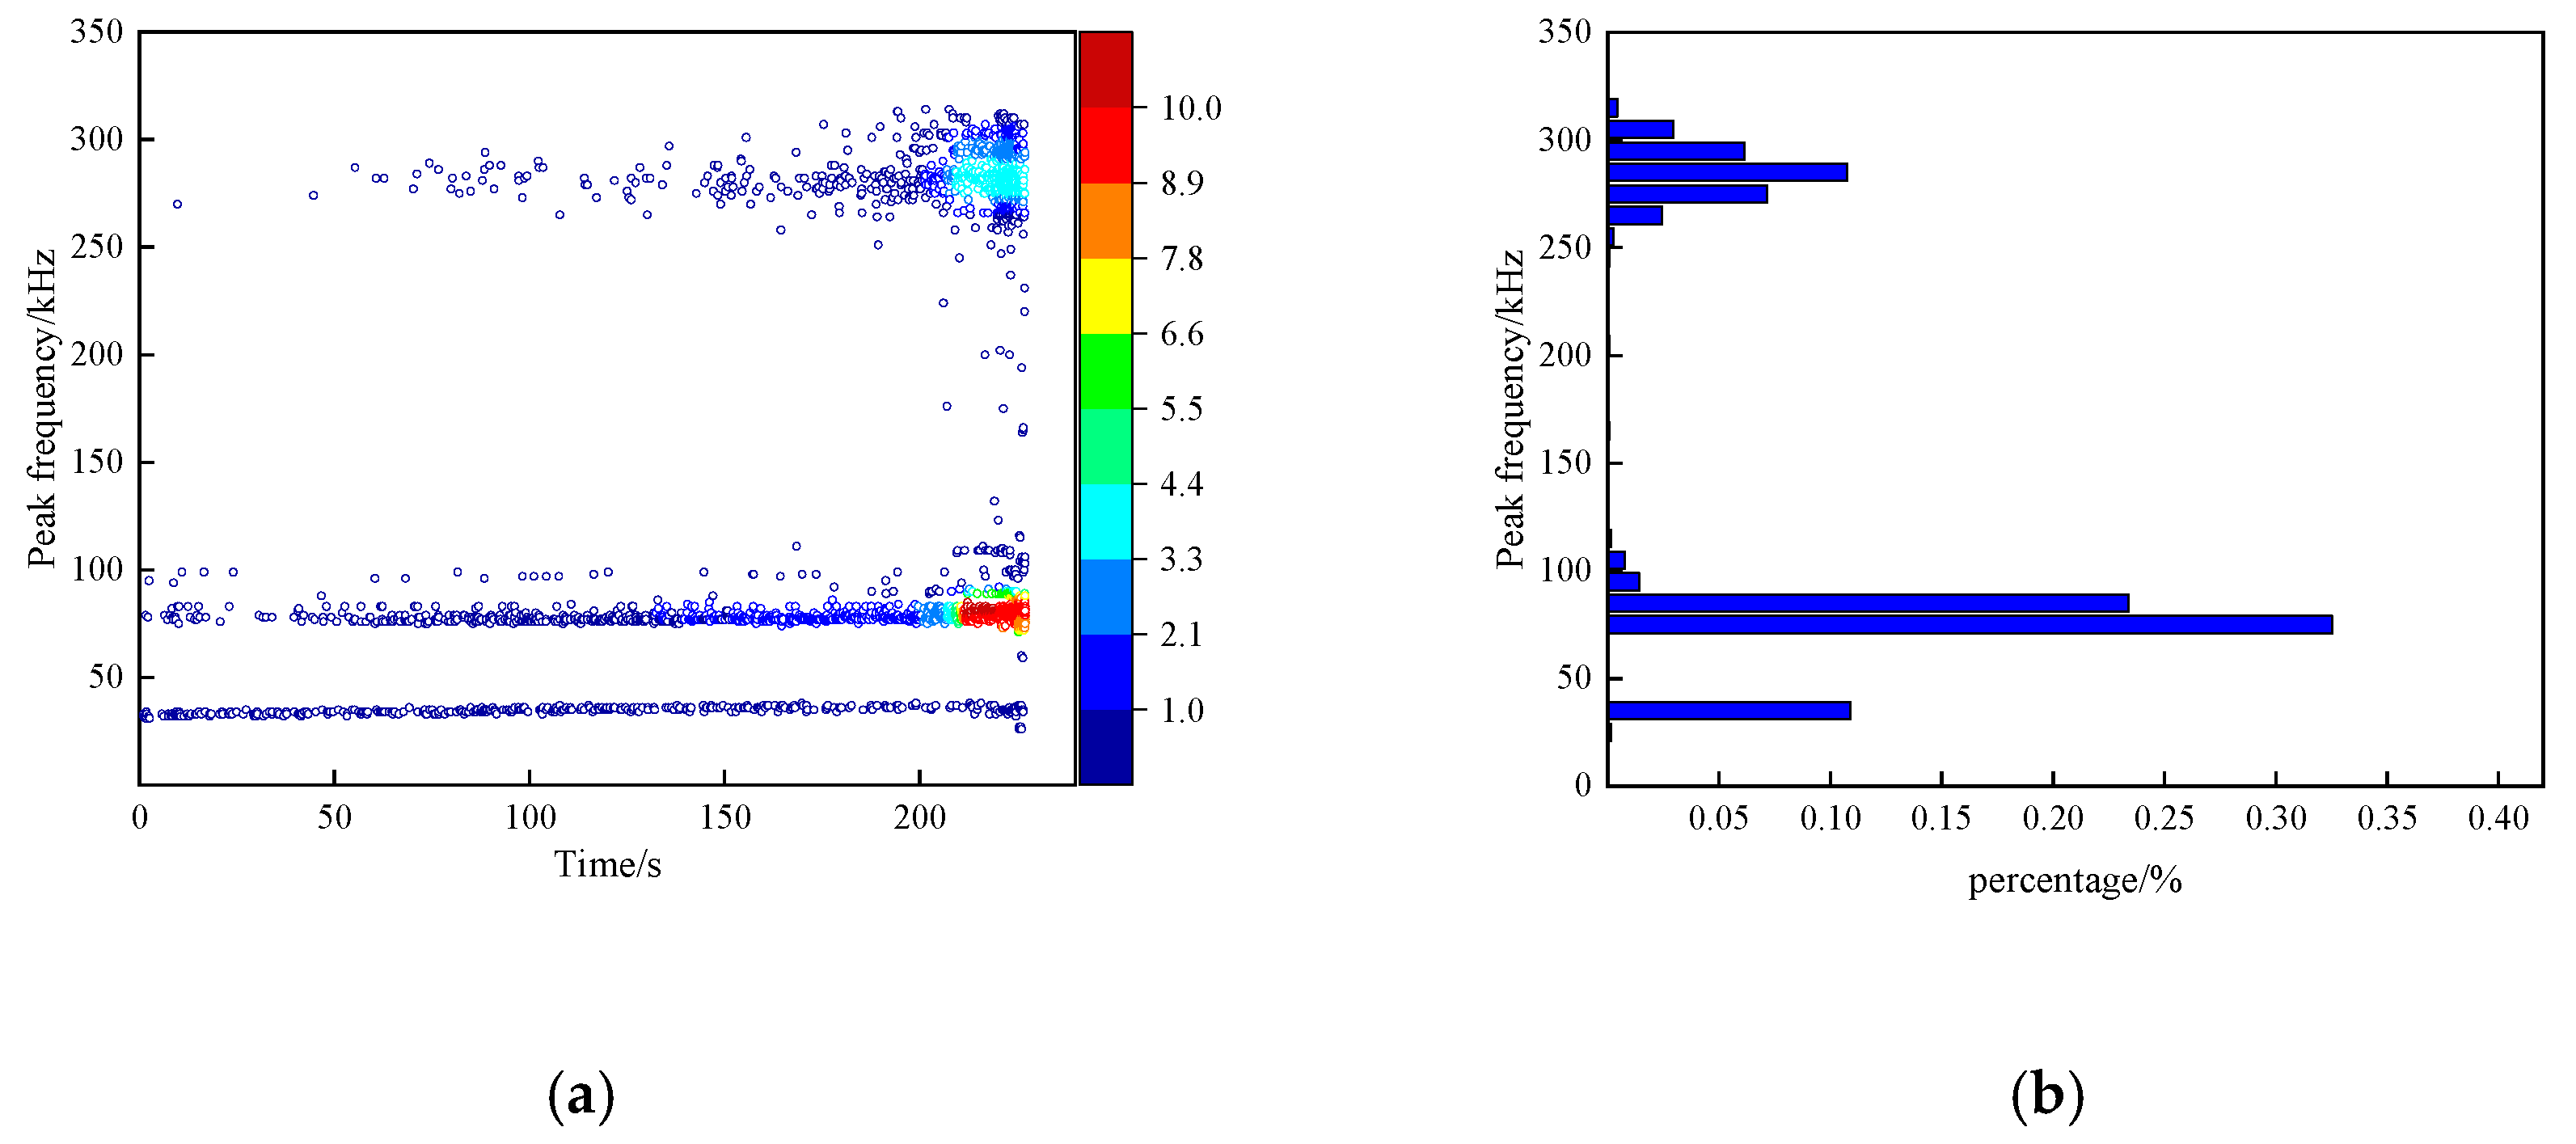
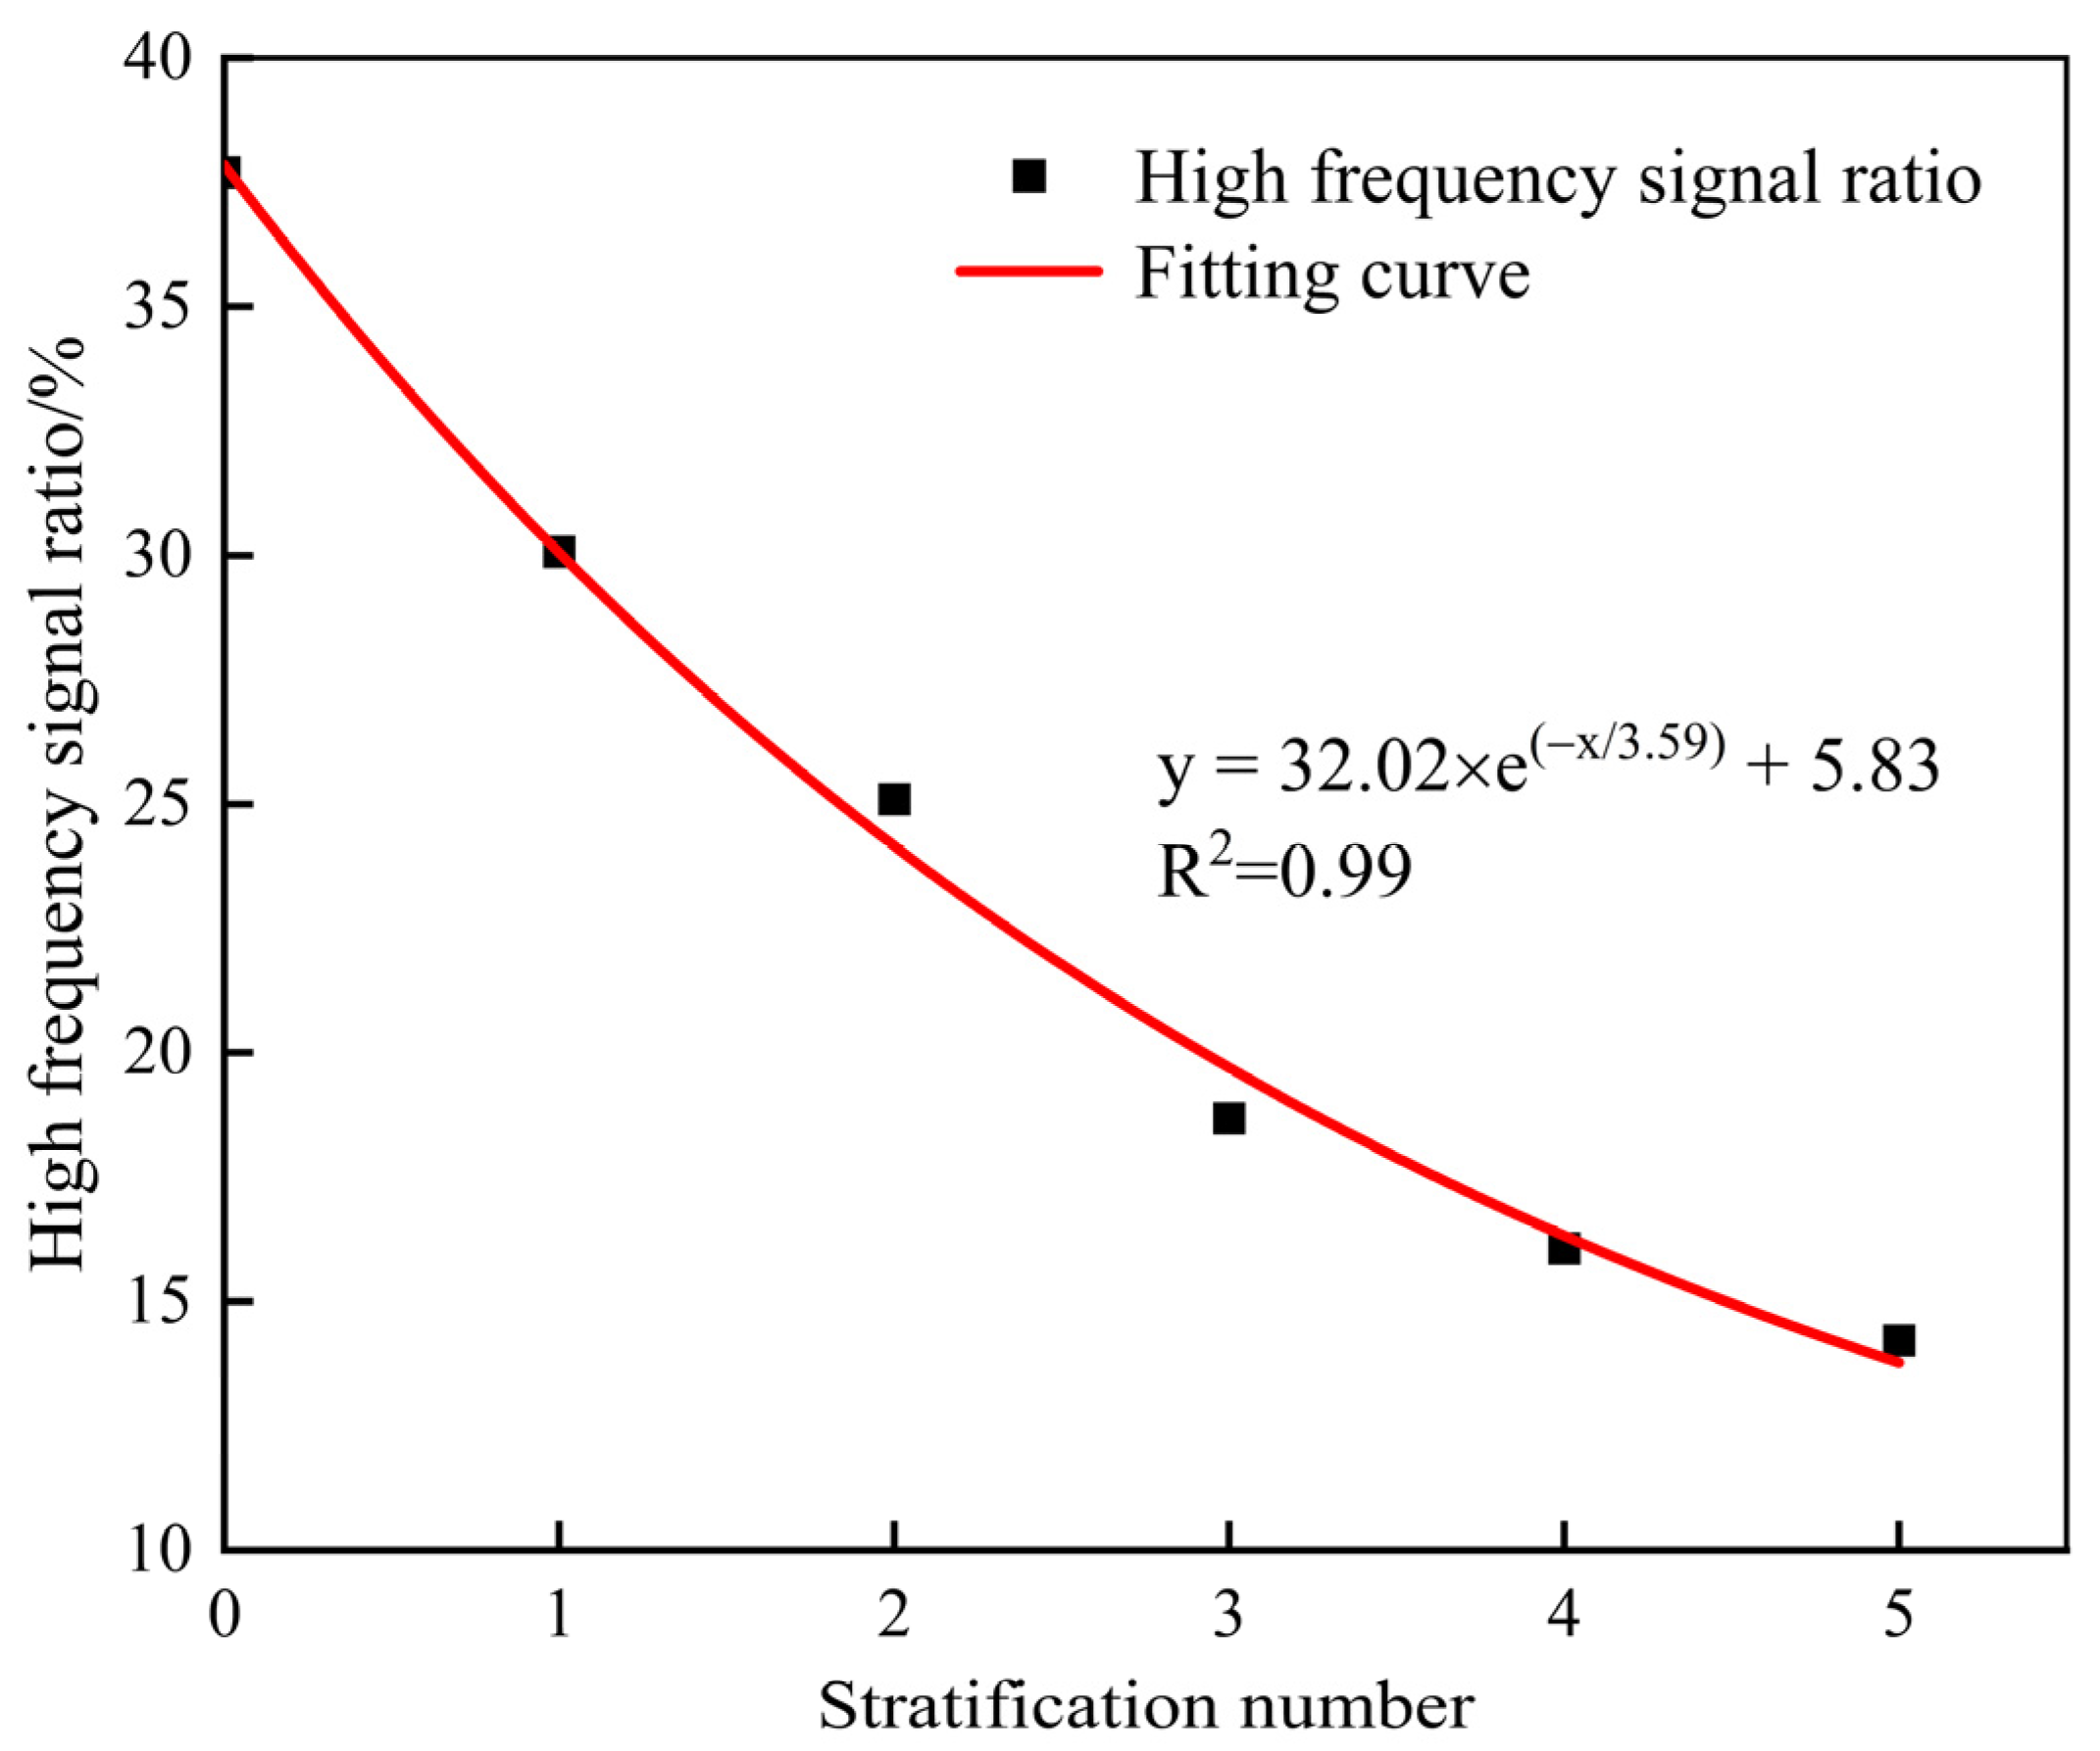
3.1.2. Contribution of AE Characteristic Parameters
3.2. The Stratification Effects of Mode I Fracture Characteristics
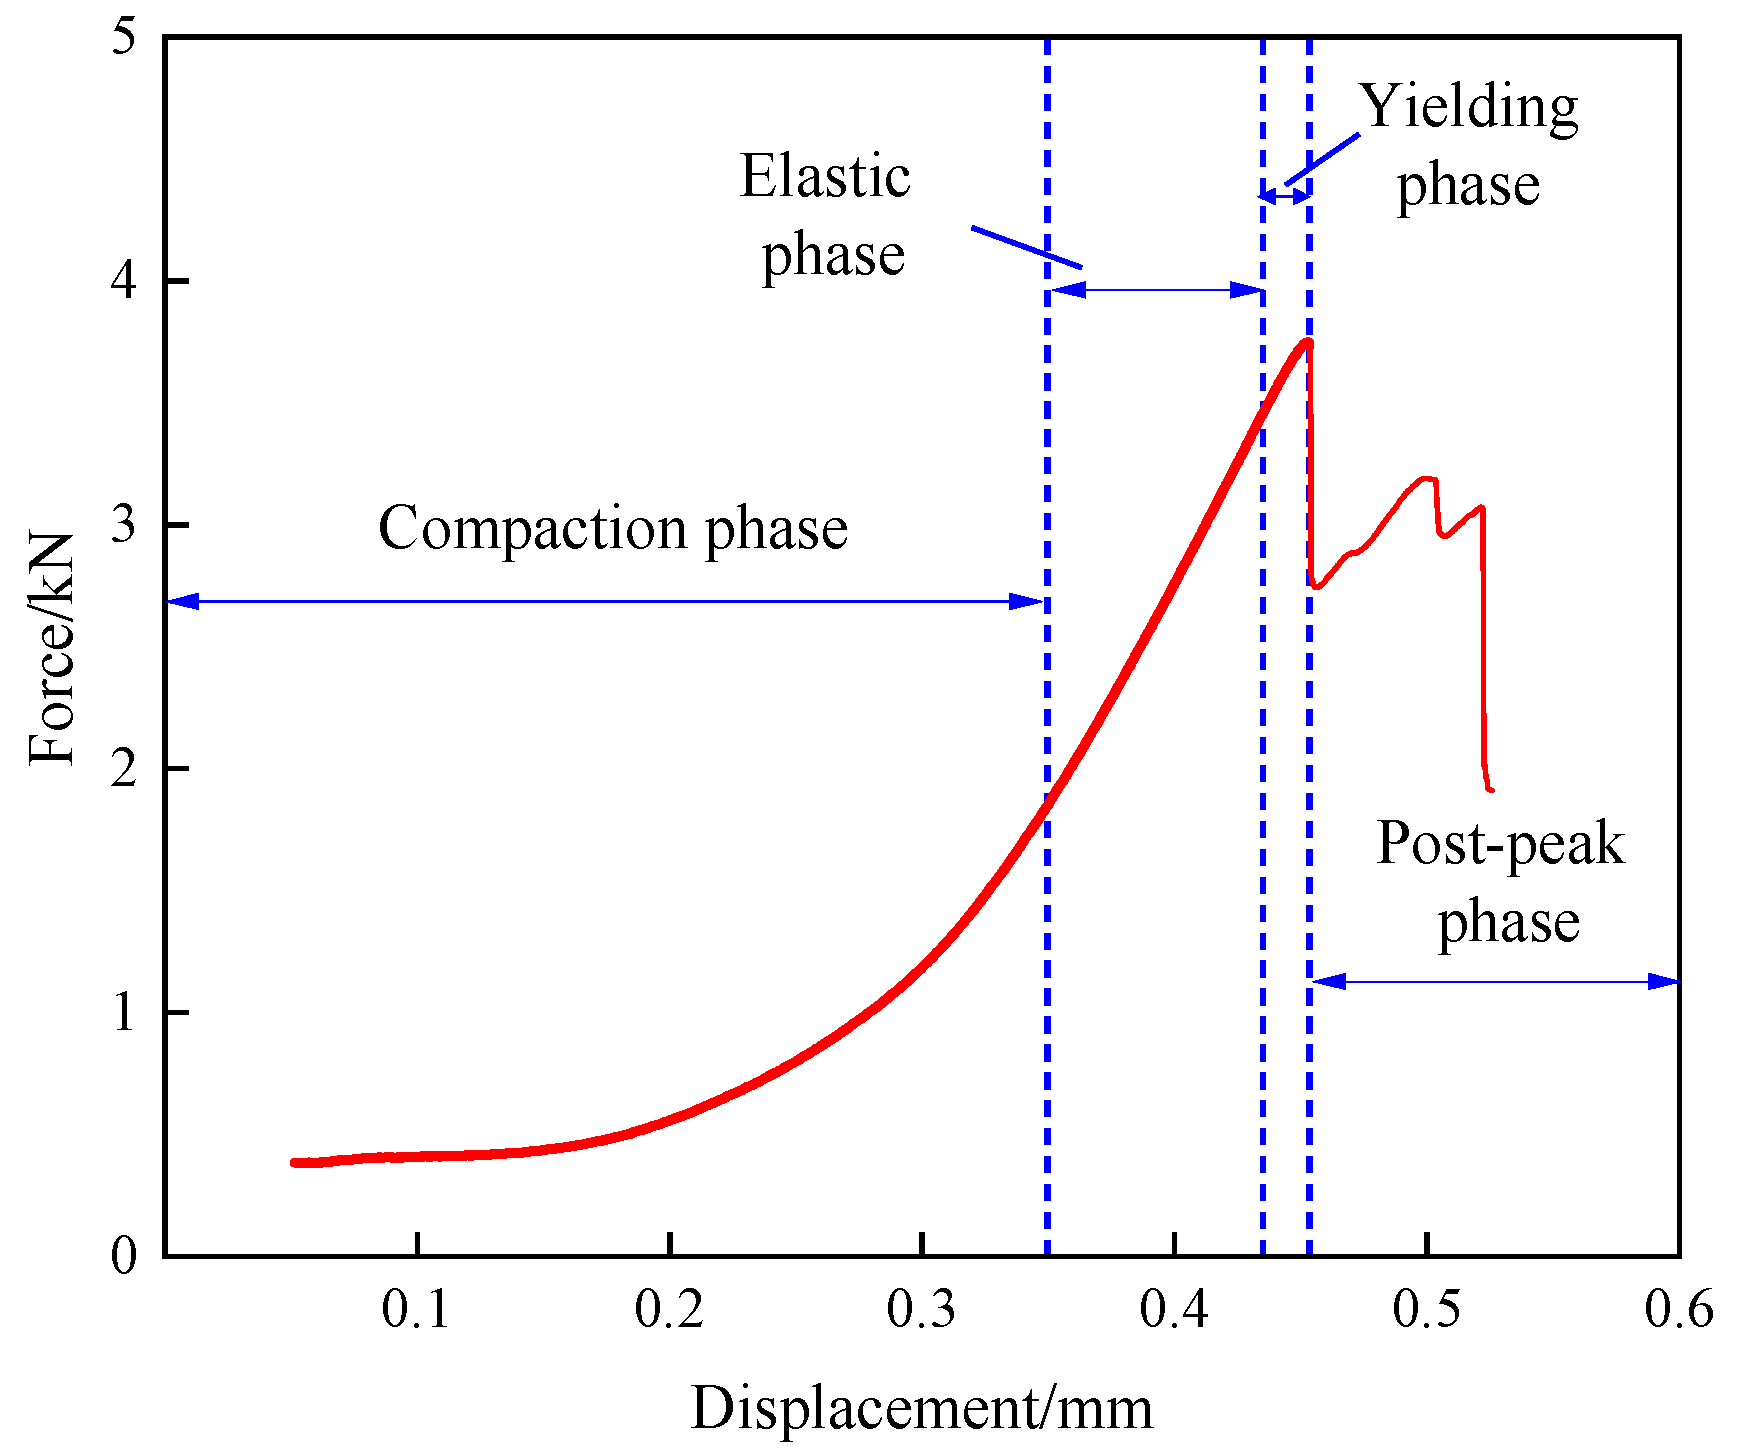
3.2.1. Load–Displacement Curves
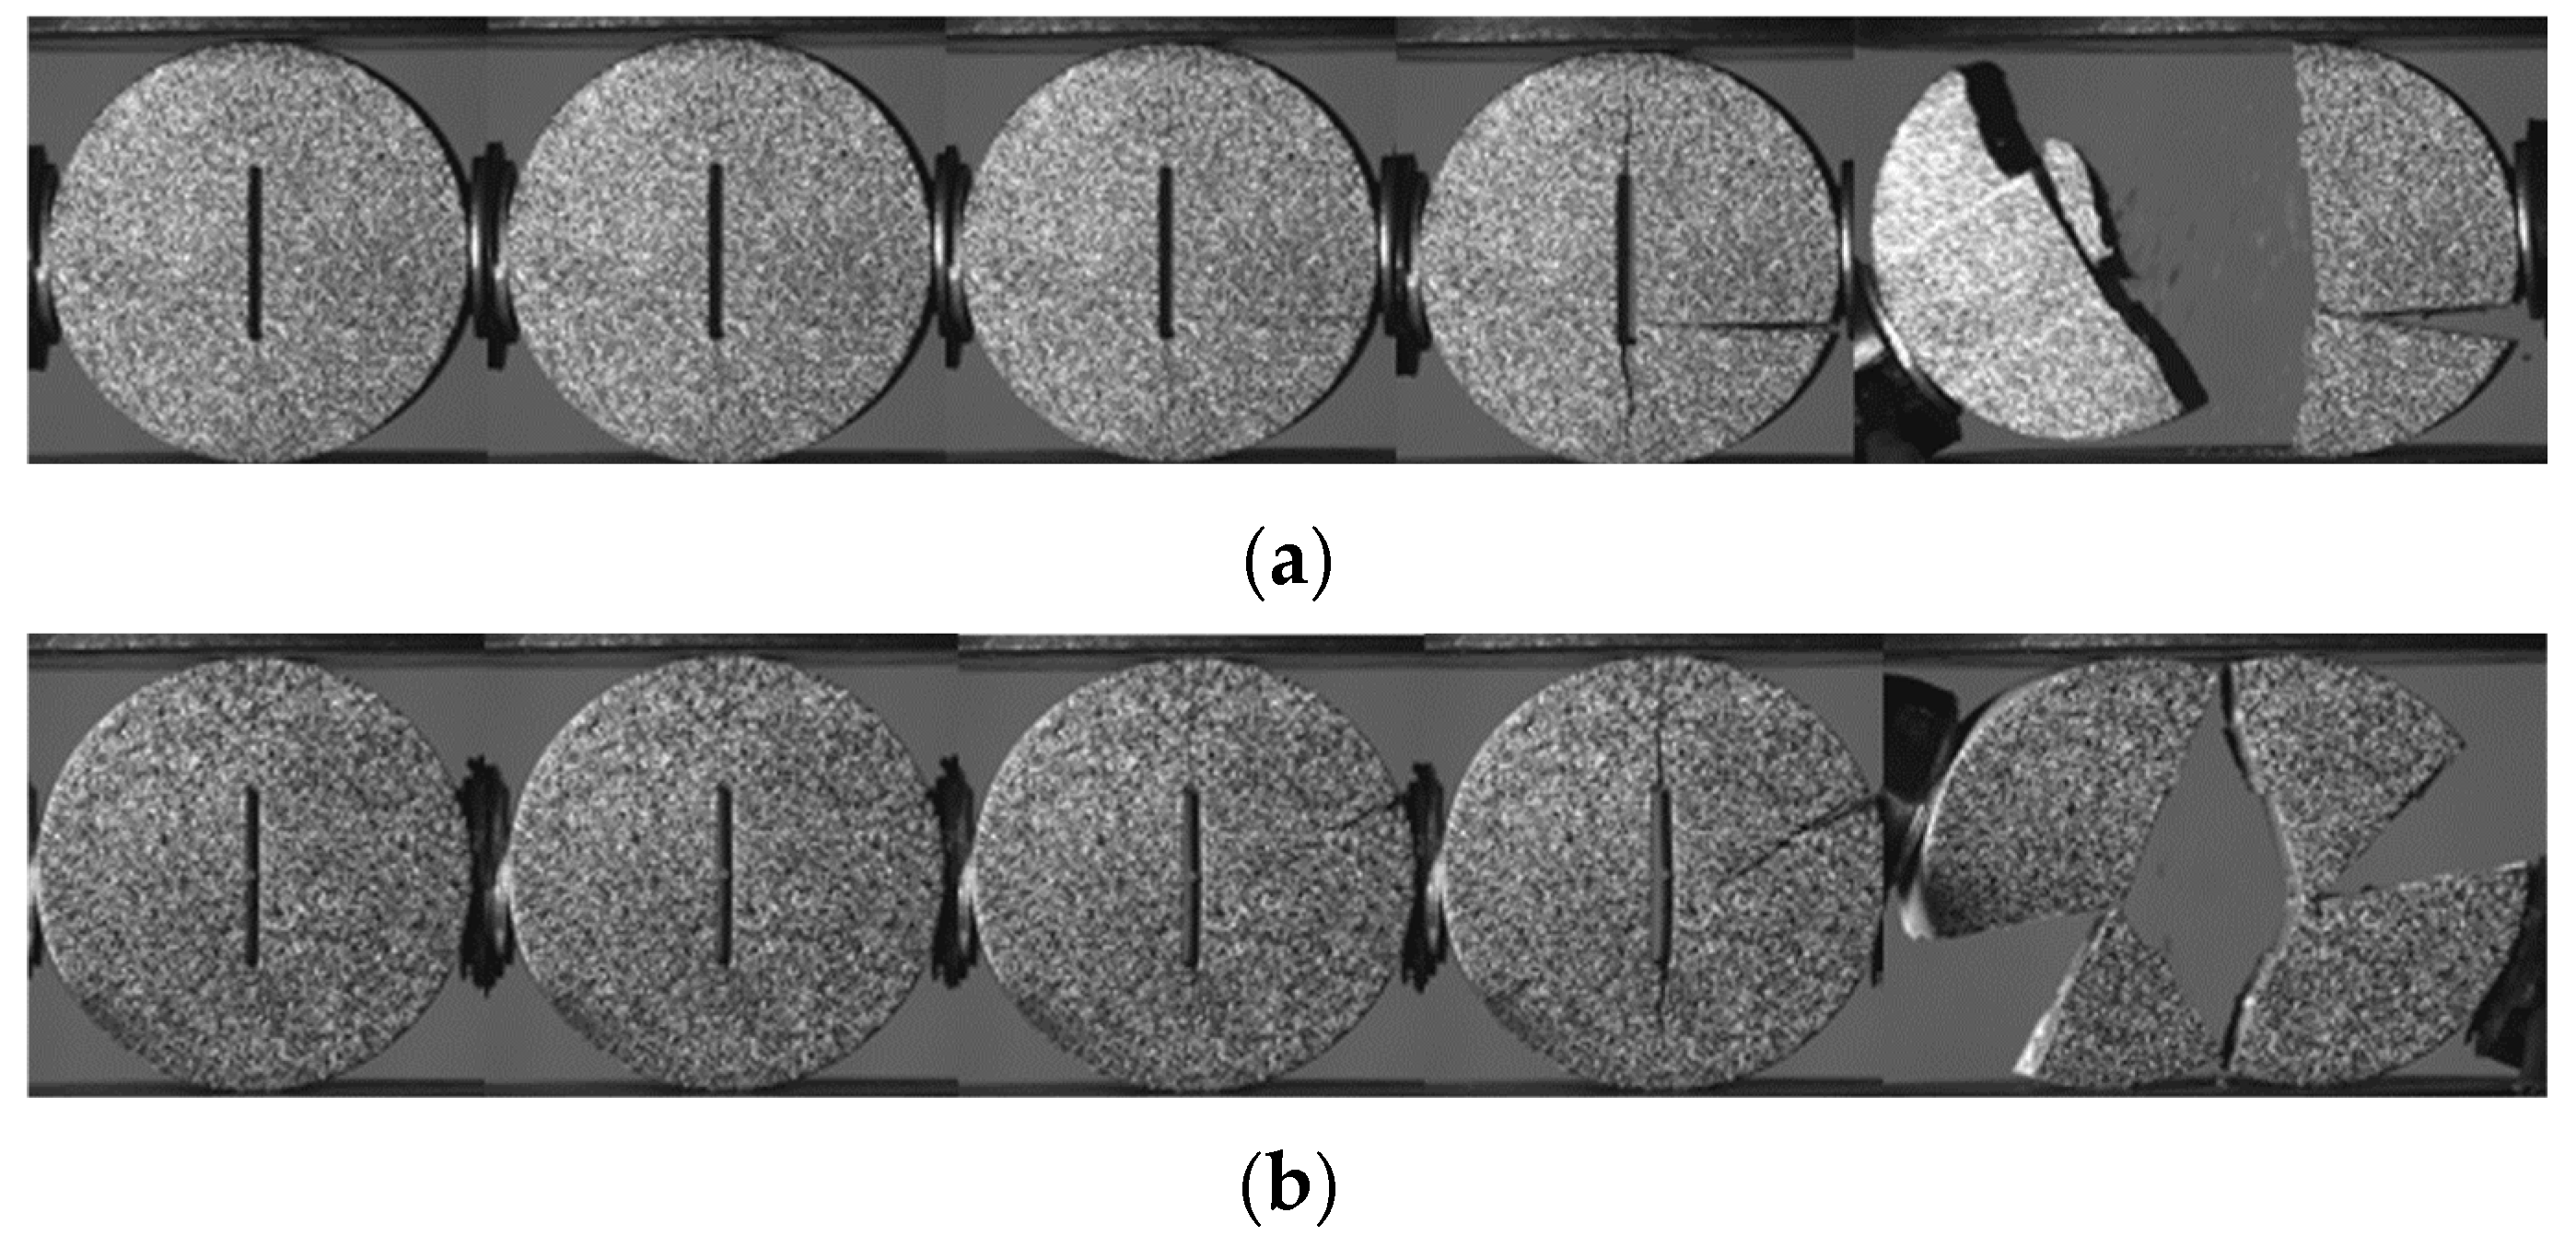
3.2.2. Fracture Modes
3.2.3. Fracture Toughness
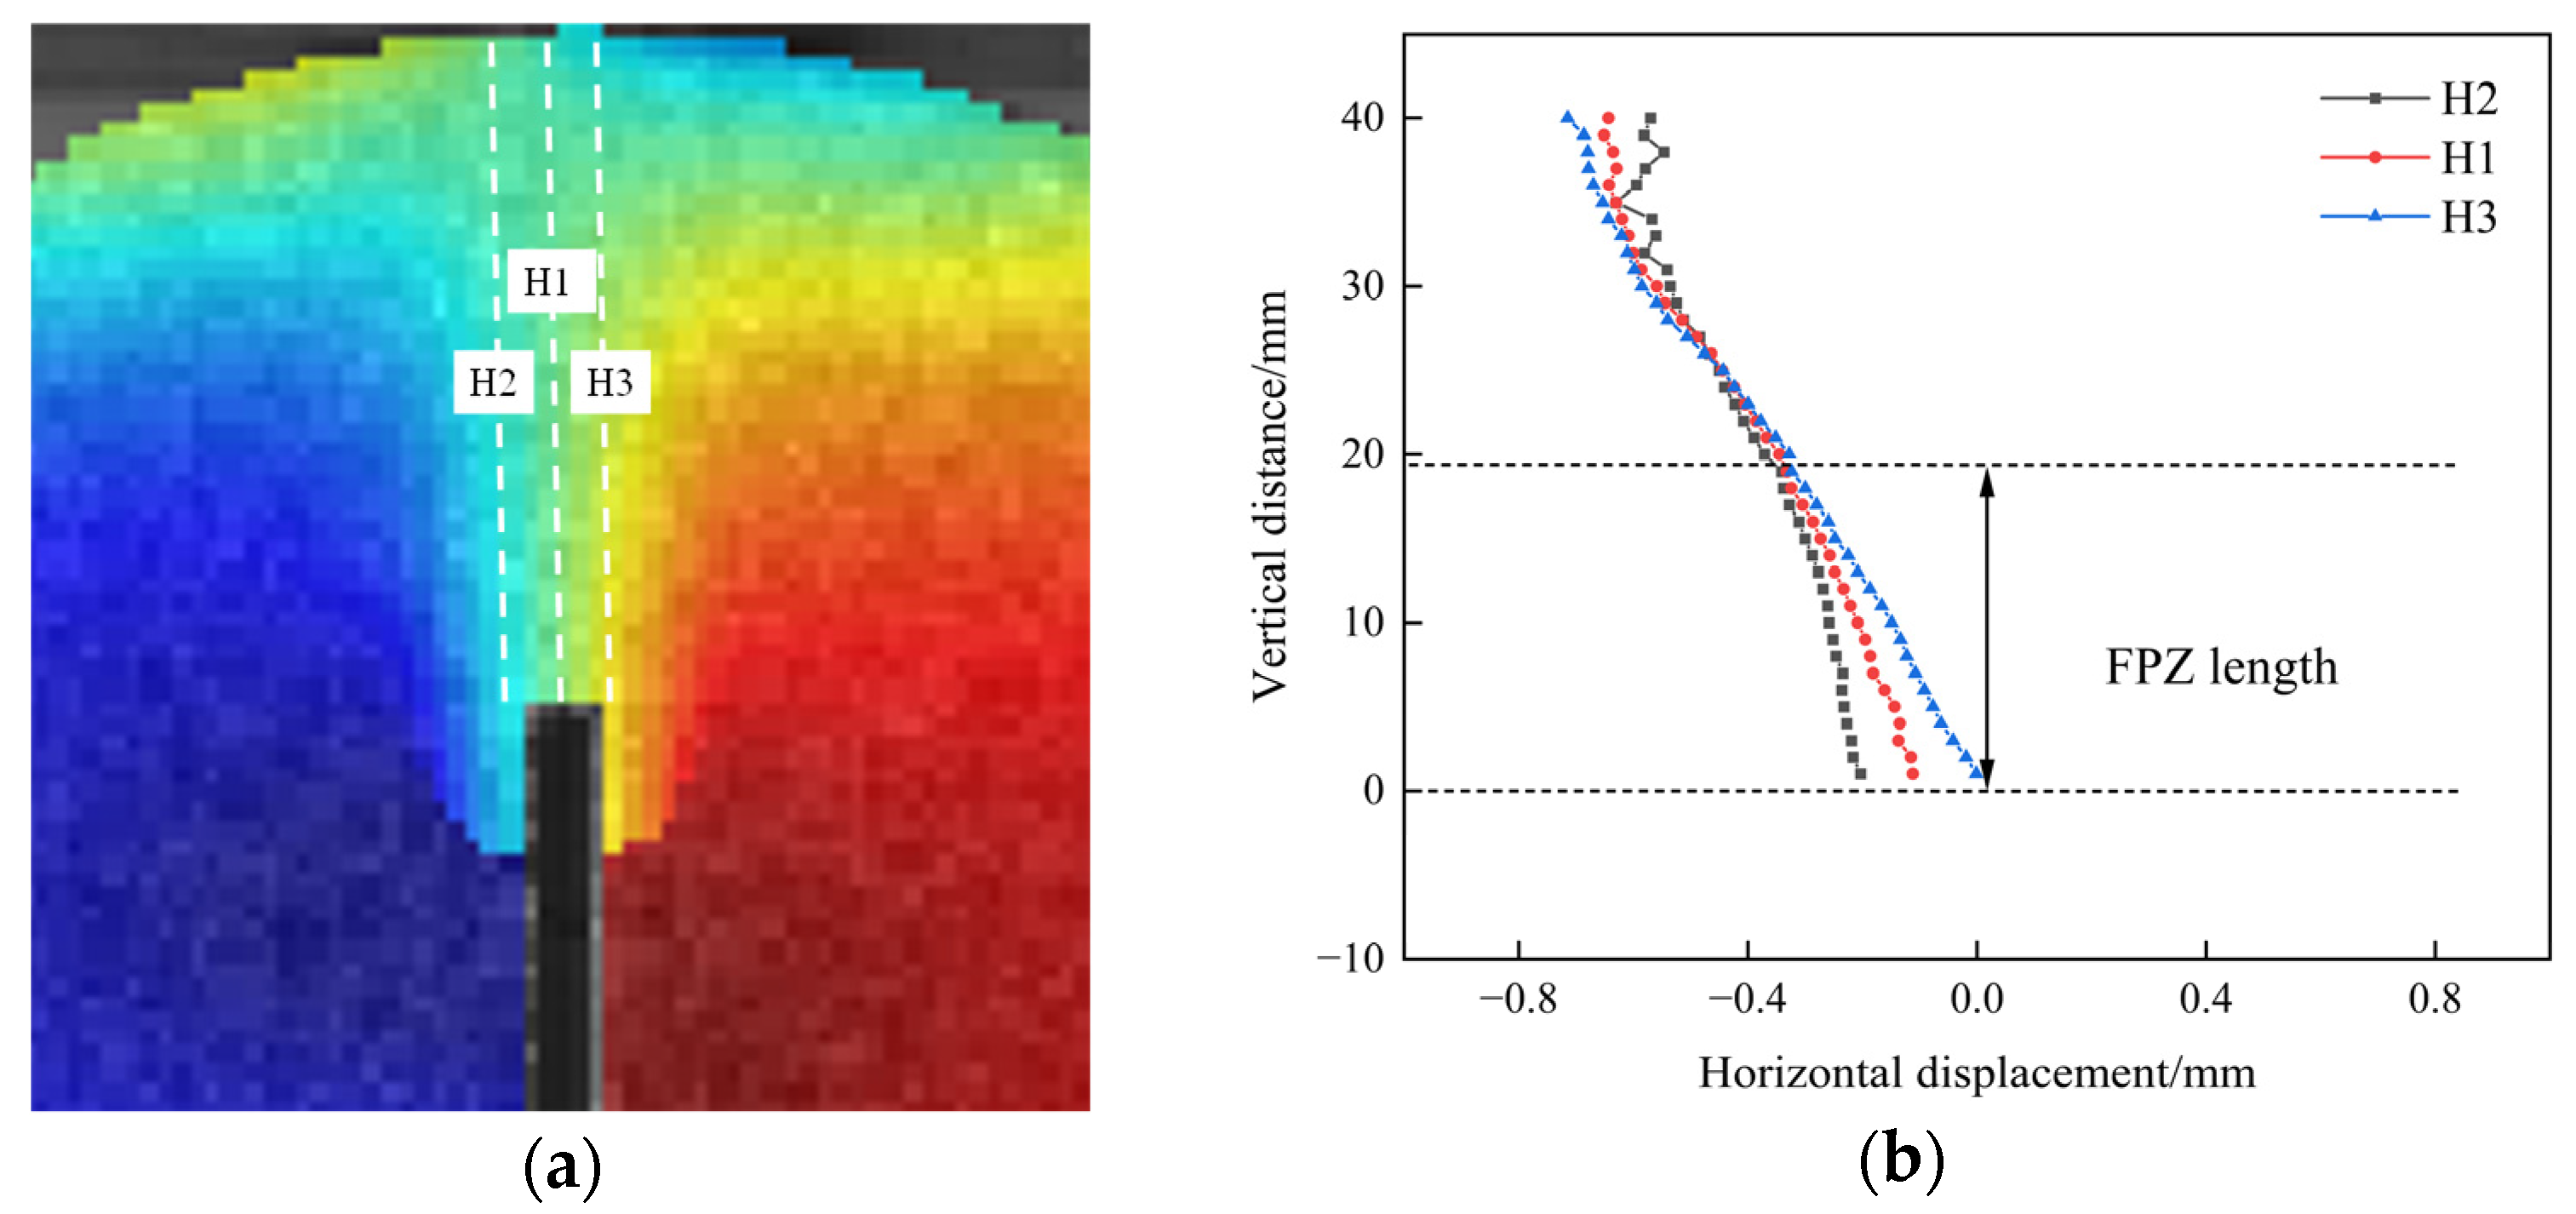
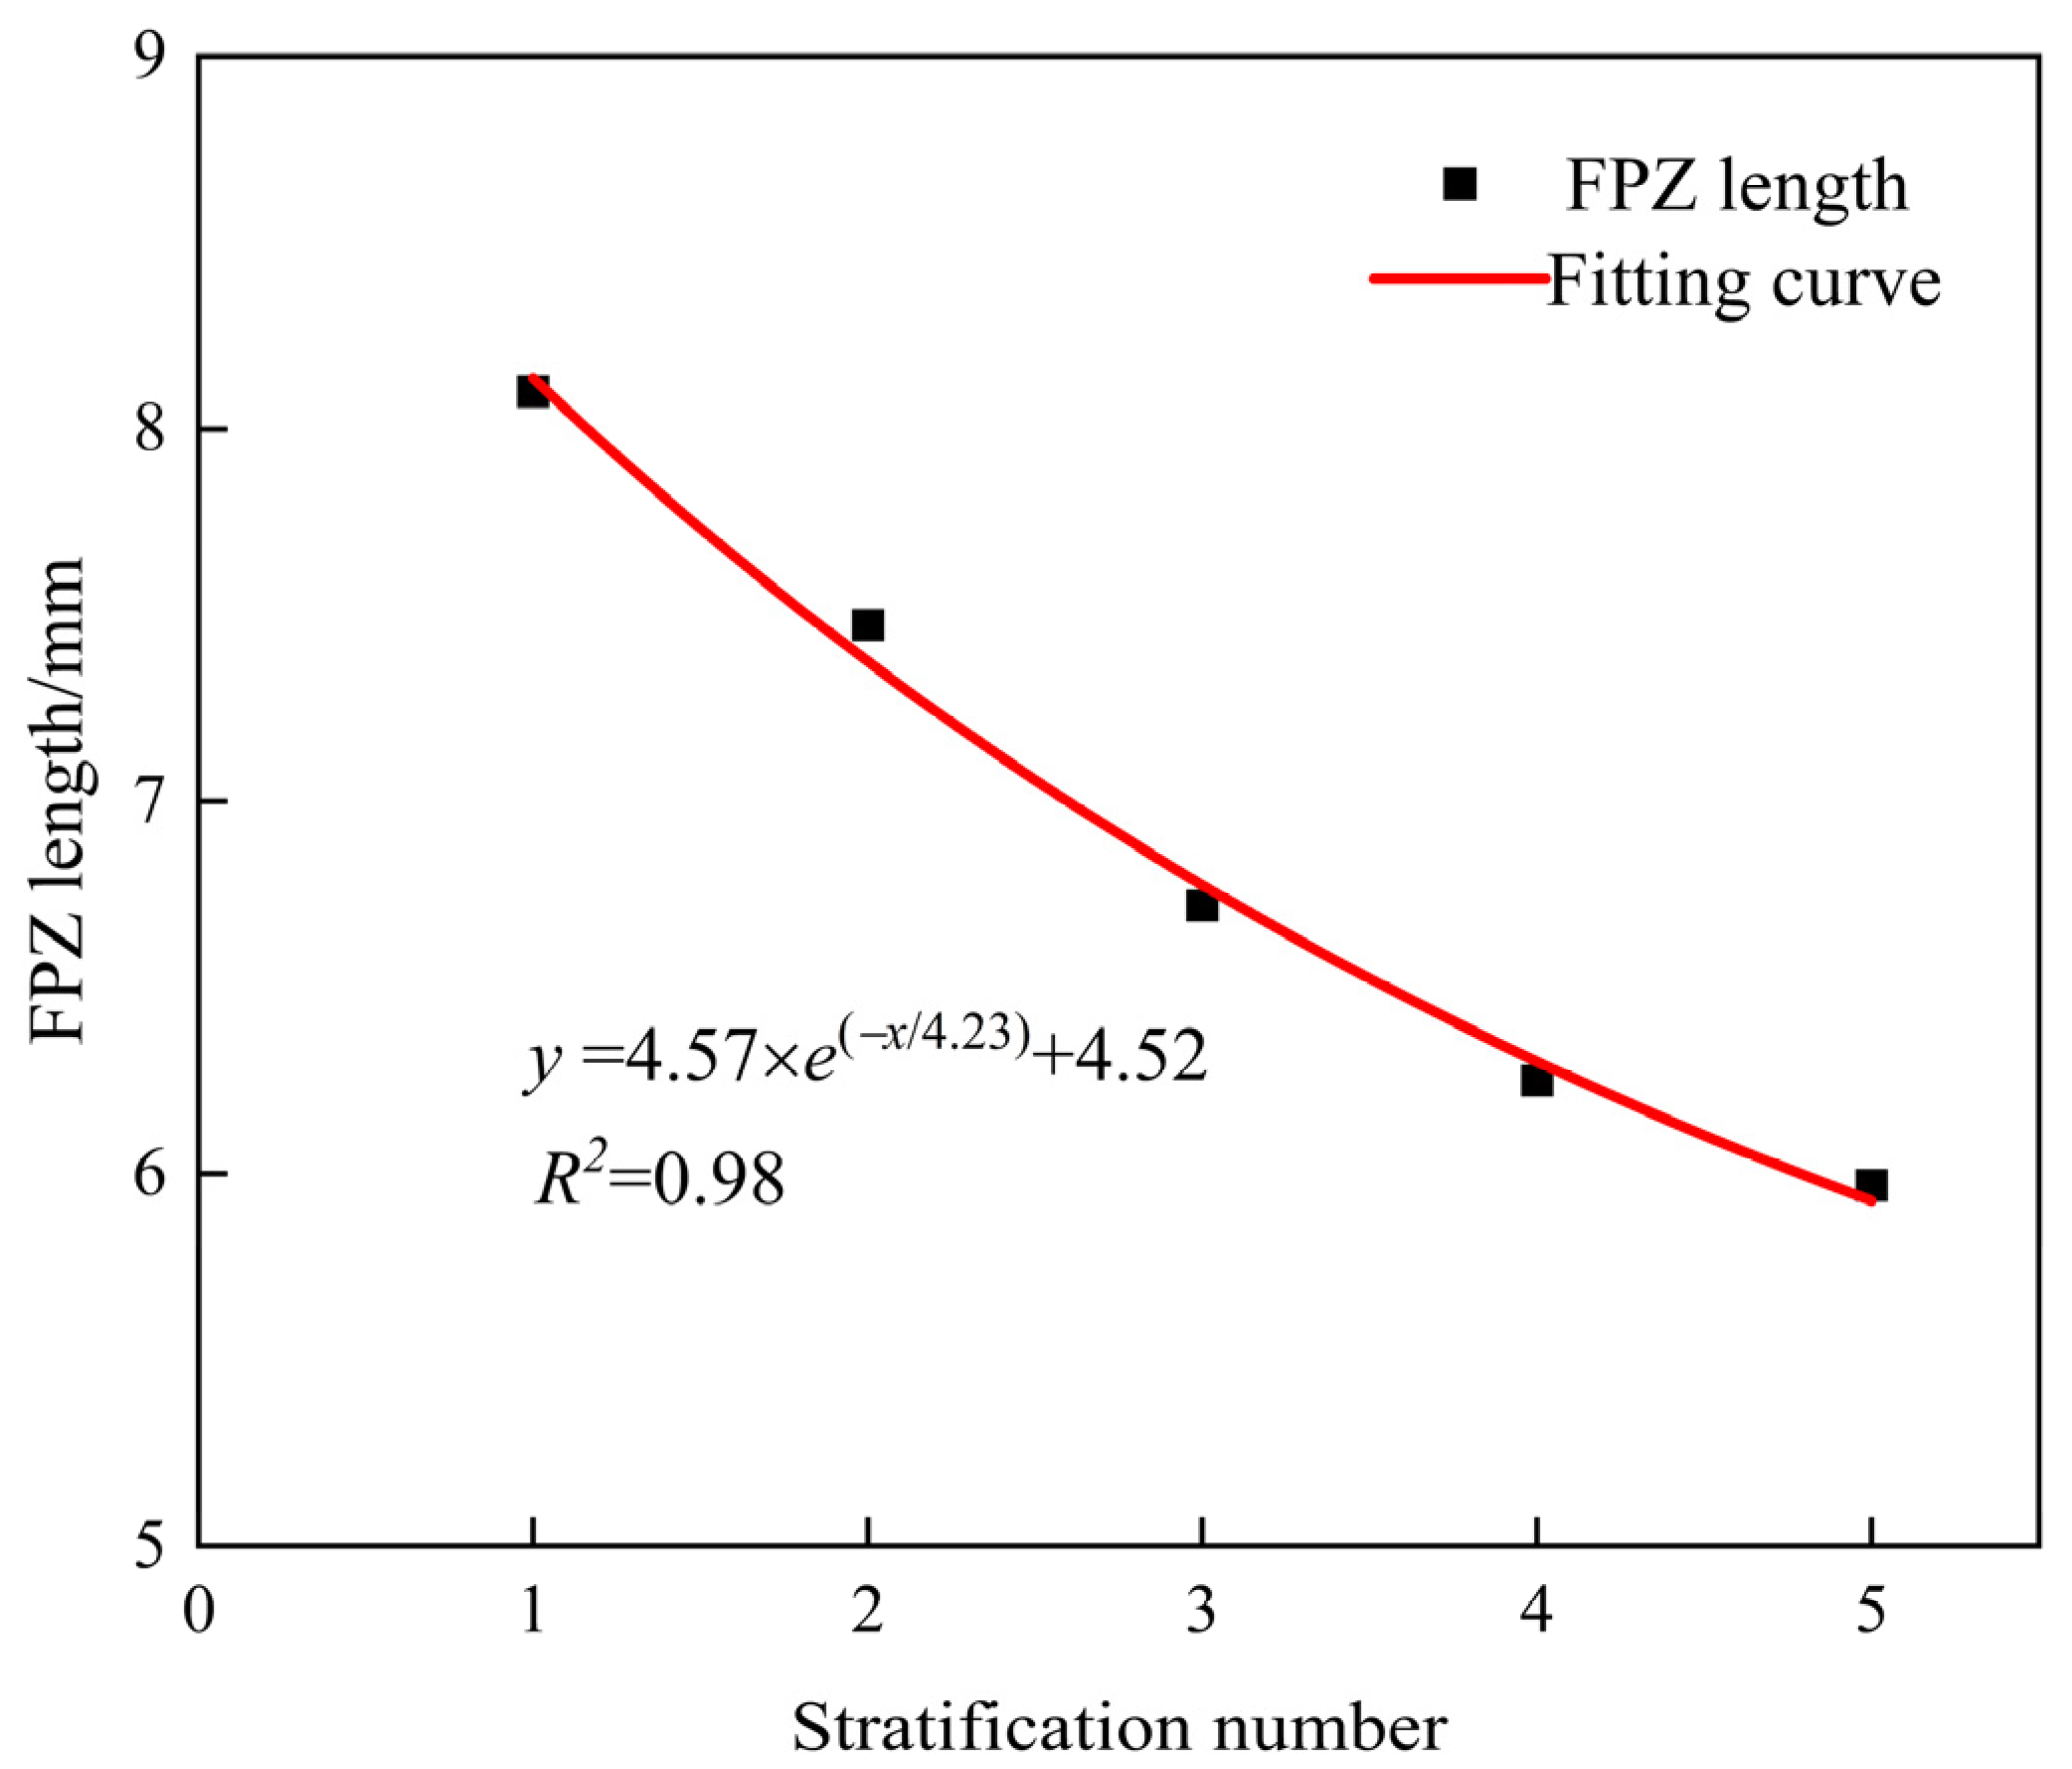
3.2.4. FPZ Length
4. Conclusions
- (1)
- The tensile strength of the layered rock exhibits a significant stratification effect, with tensile strength gradually decreasing as the number of stratification layers and the stratification angles increase. The number of stratification planes has a minimal impact on the specimen’s failure mode; instead, the diversity of failure modes of the disk specimens is mainly due to the different stratification angles.
- (2)
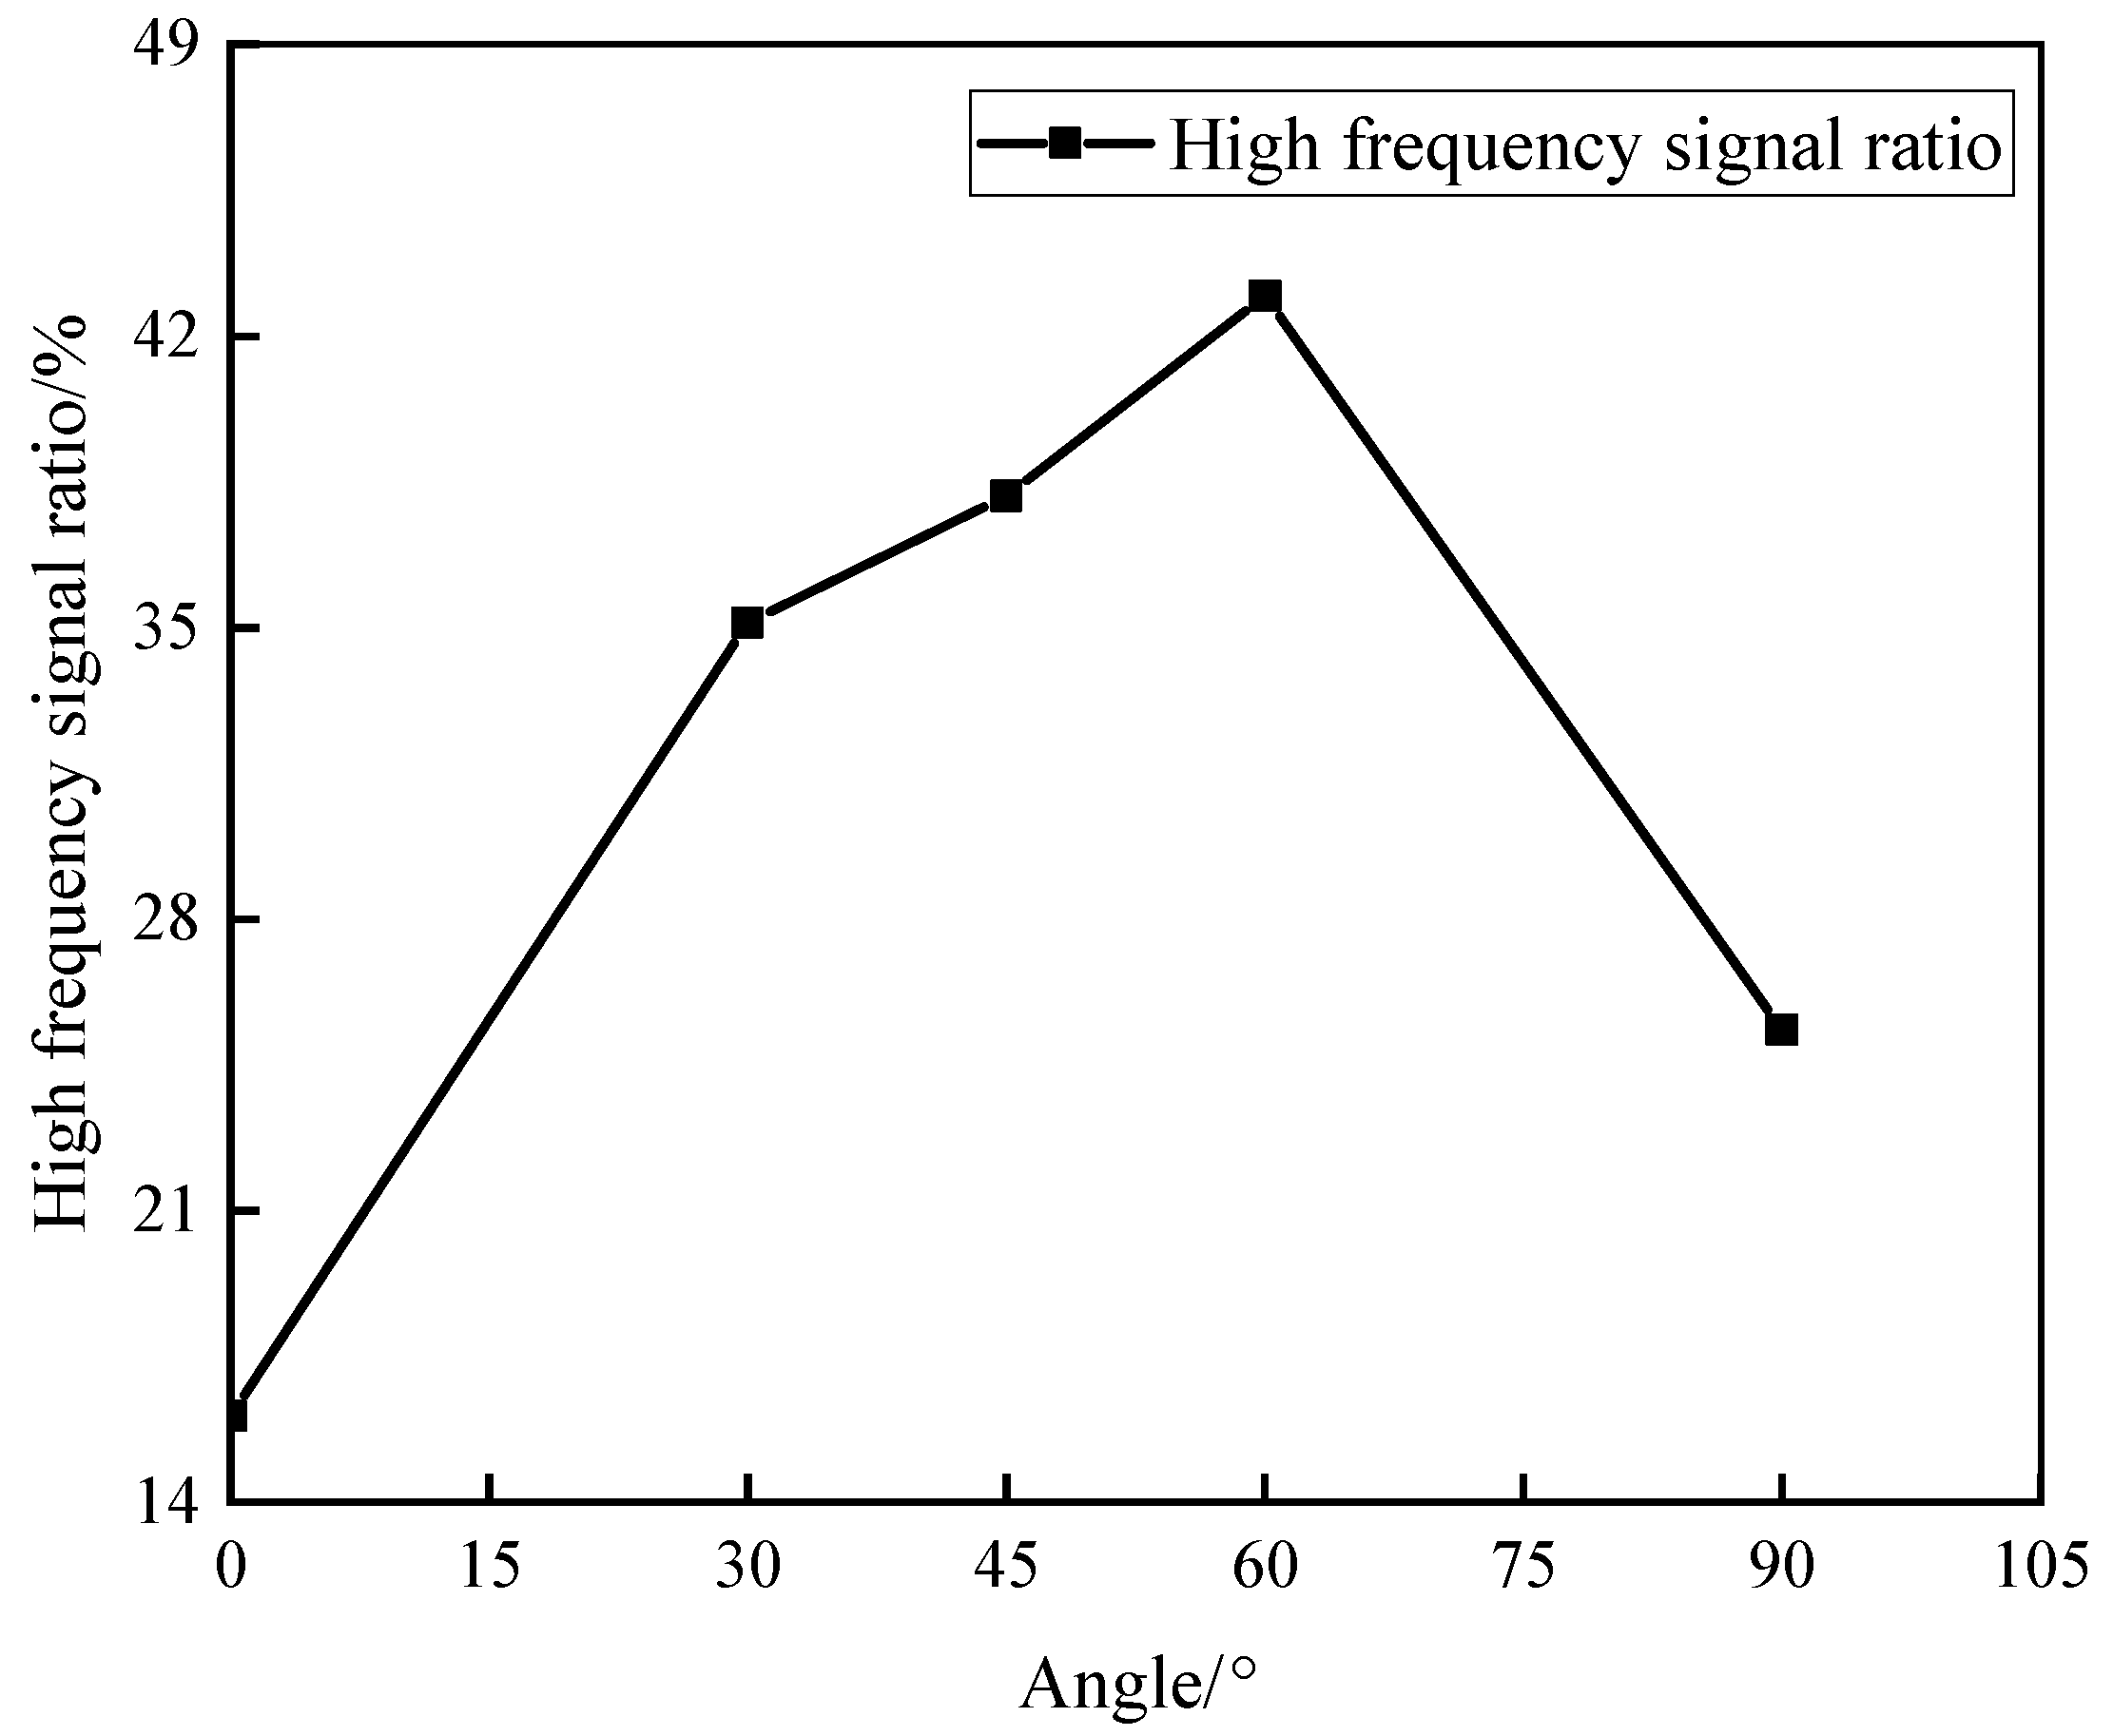
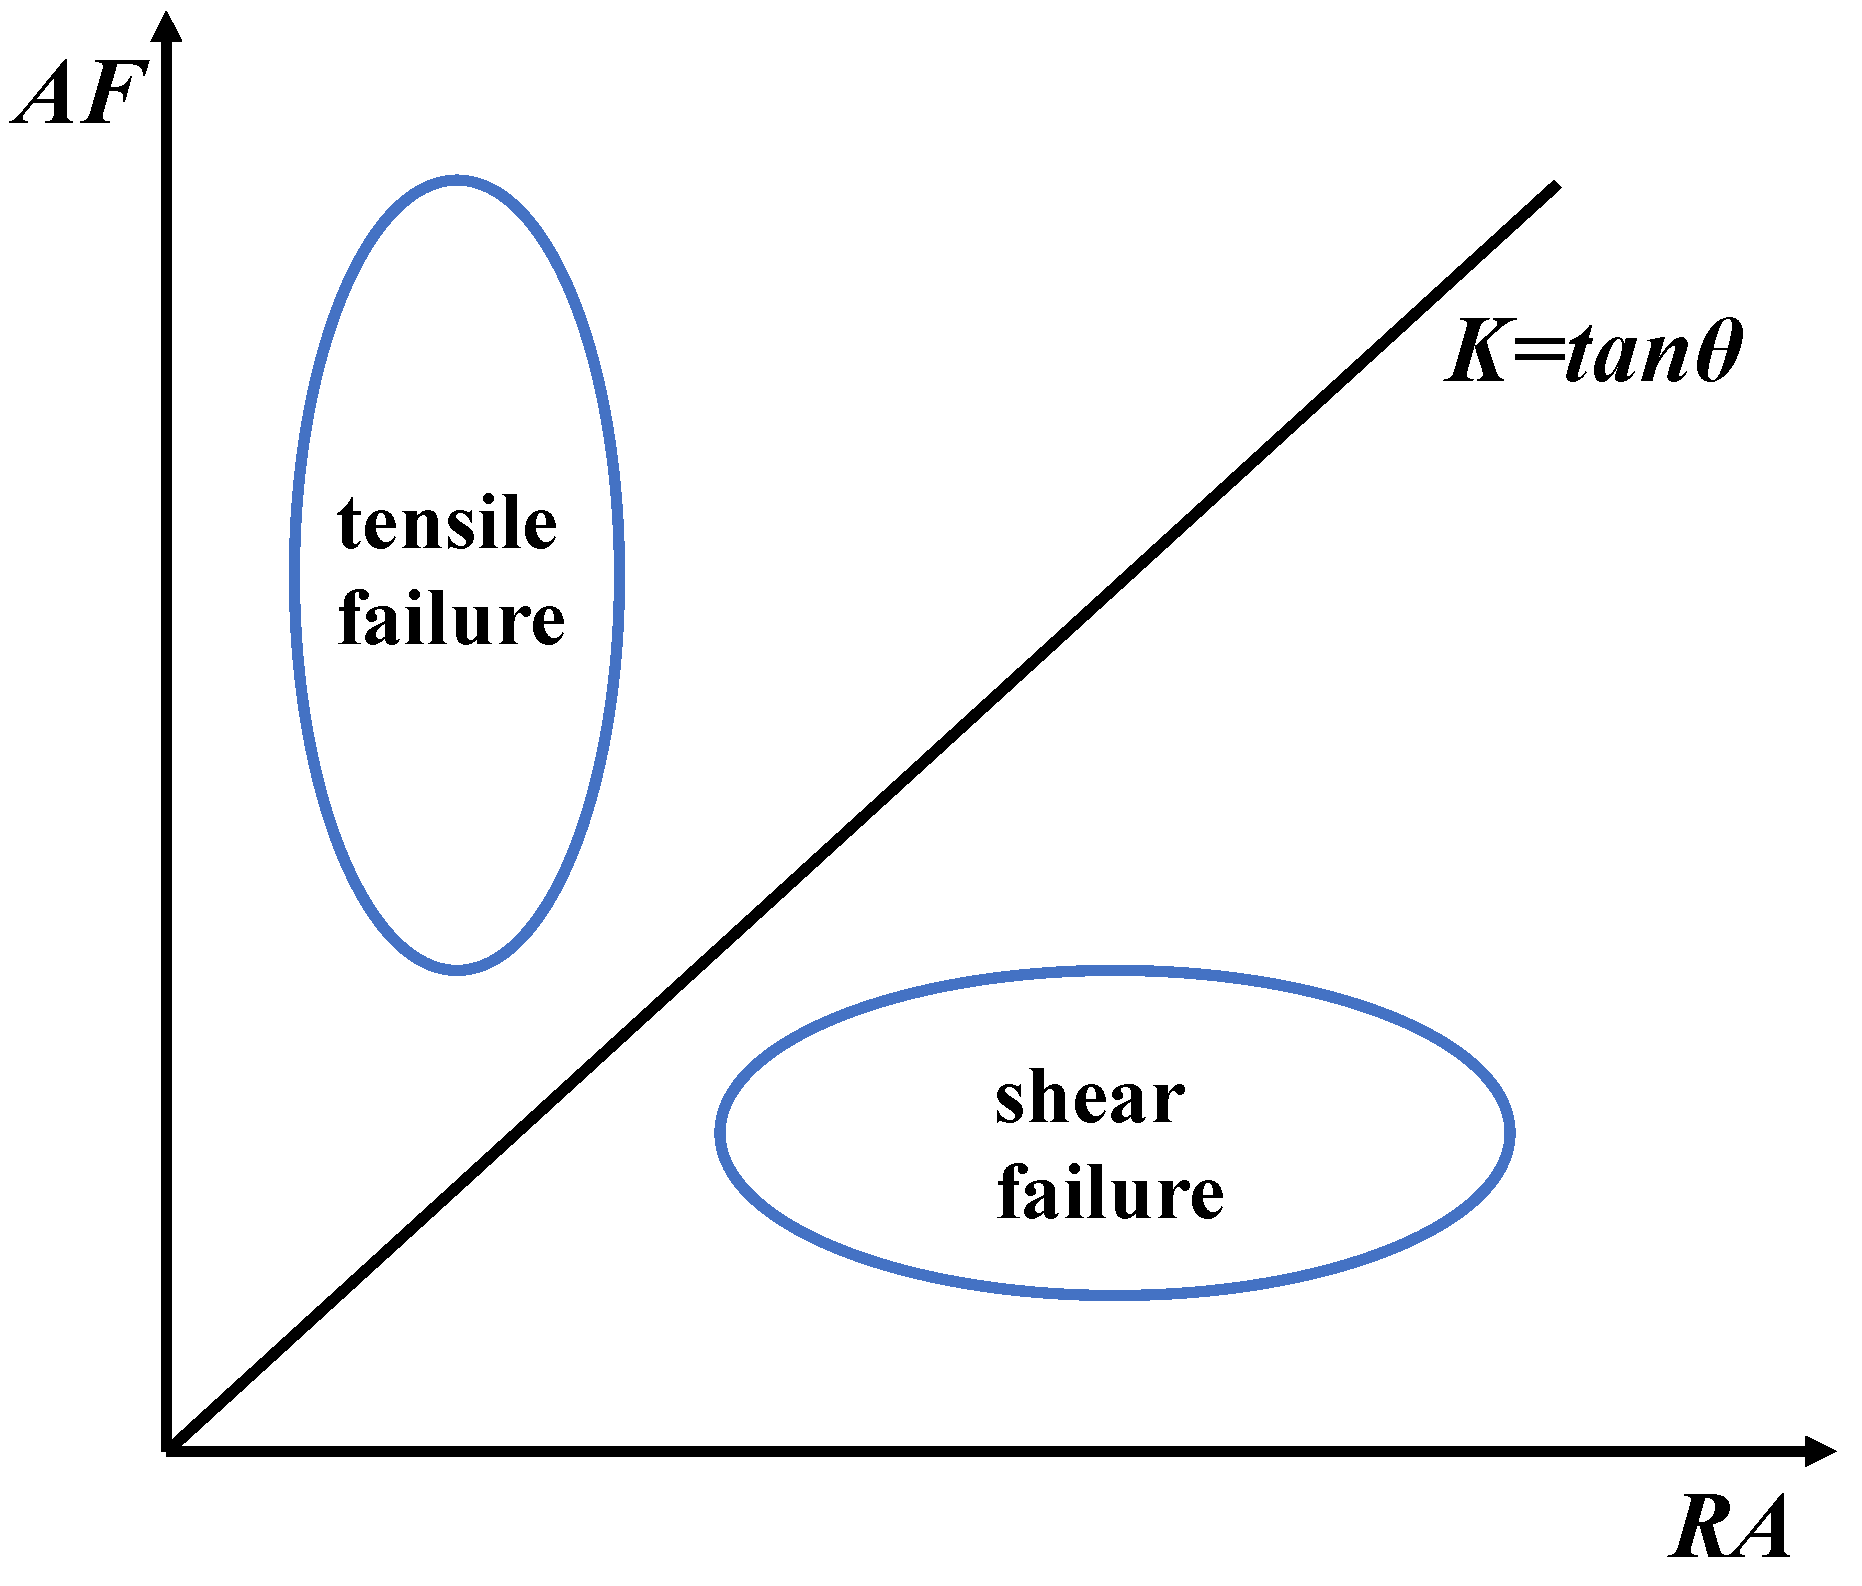
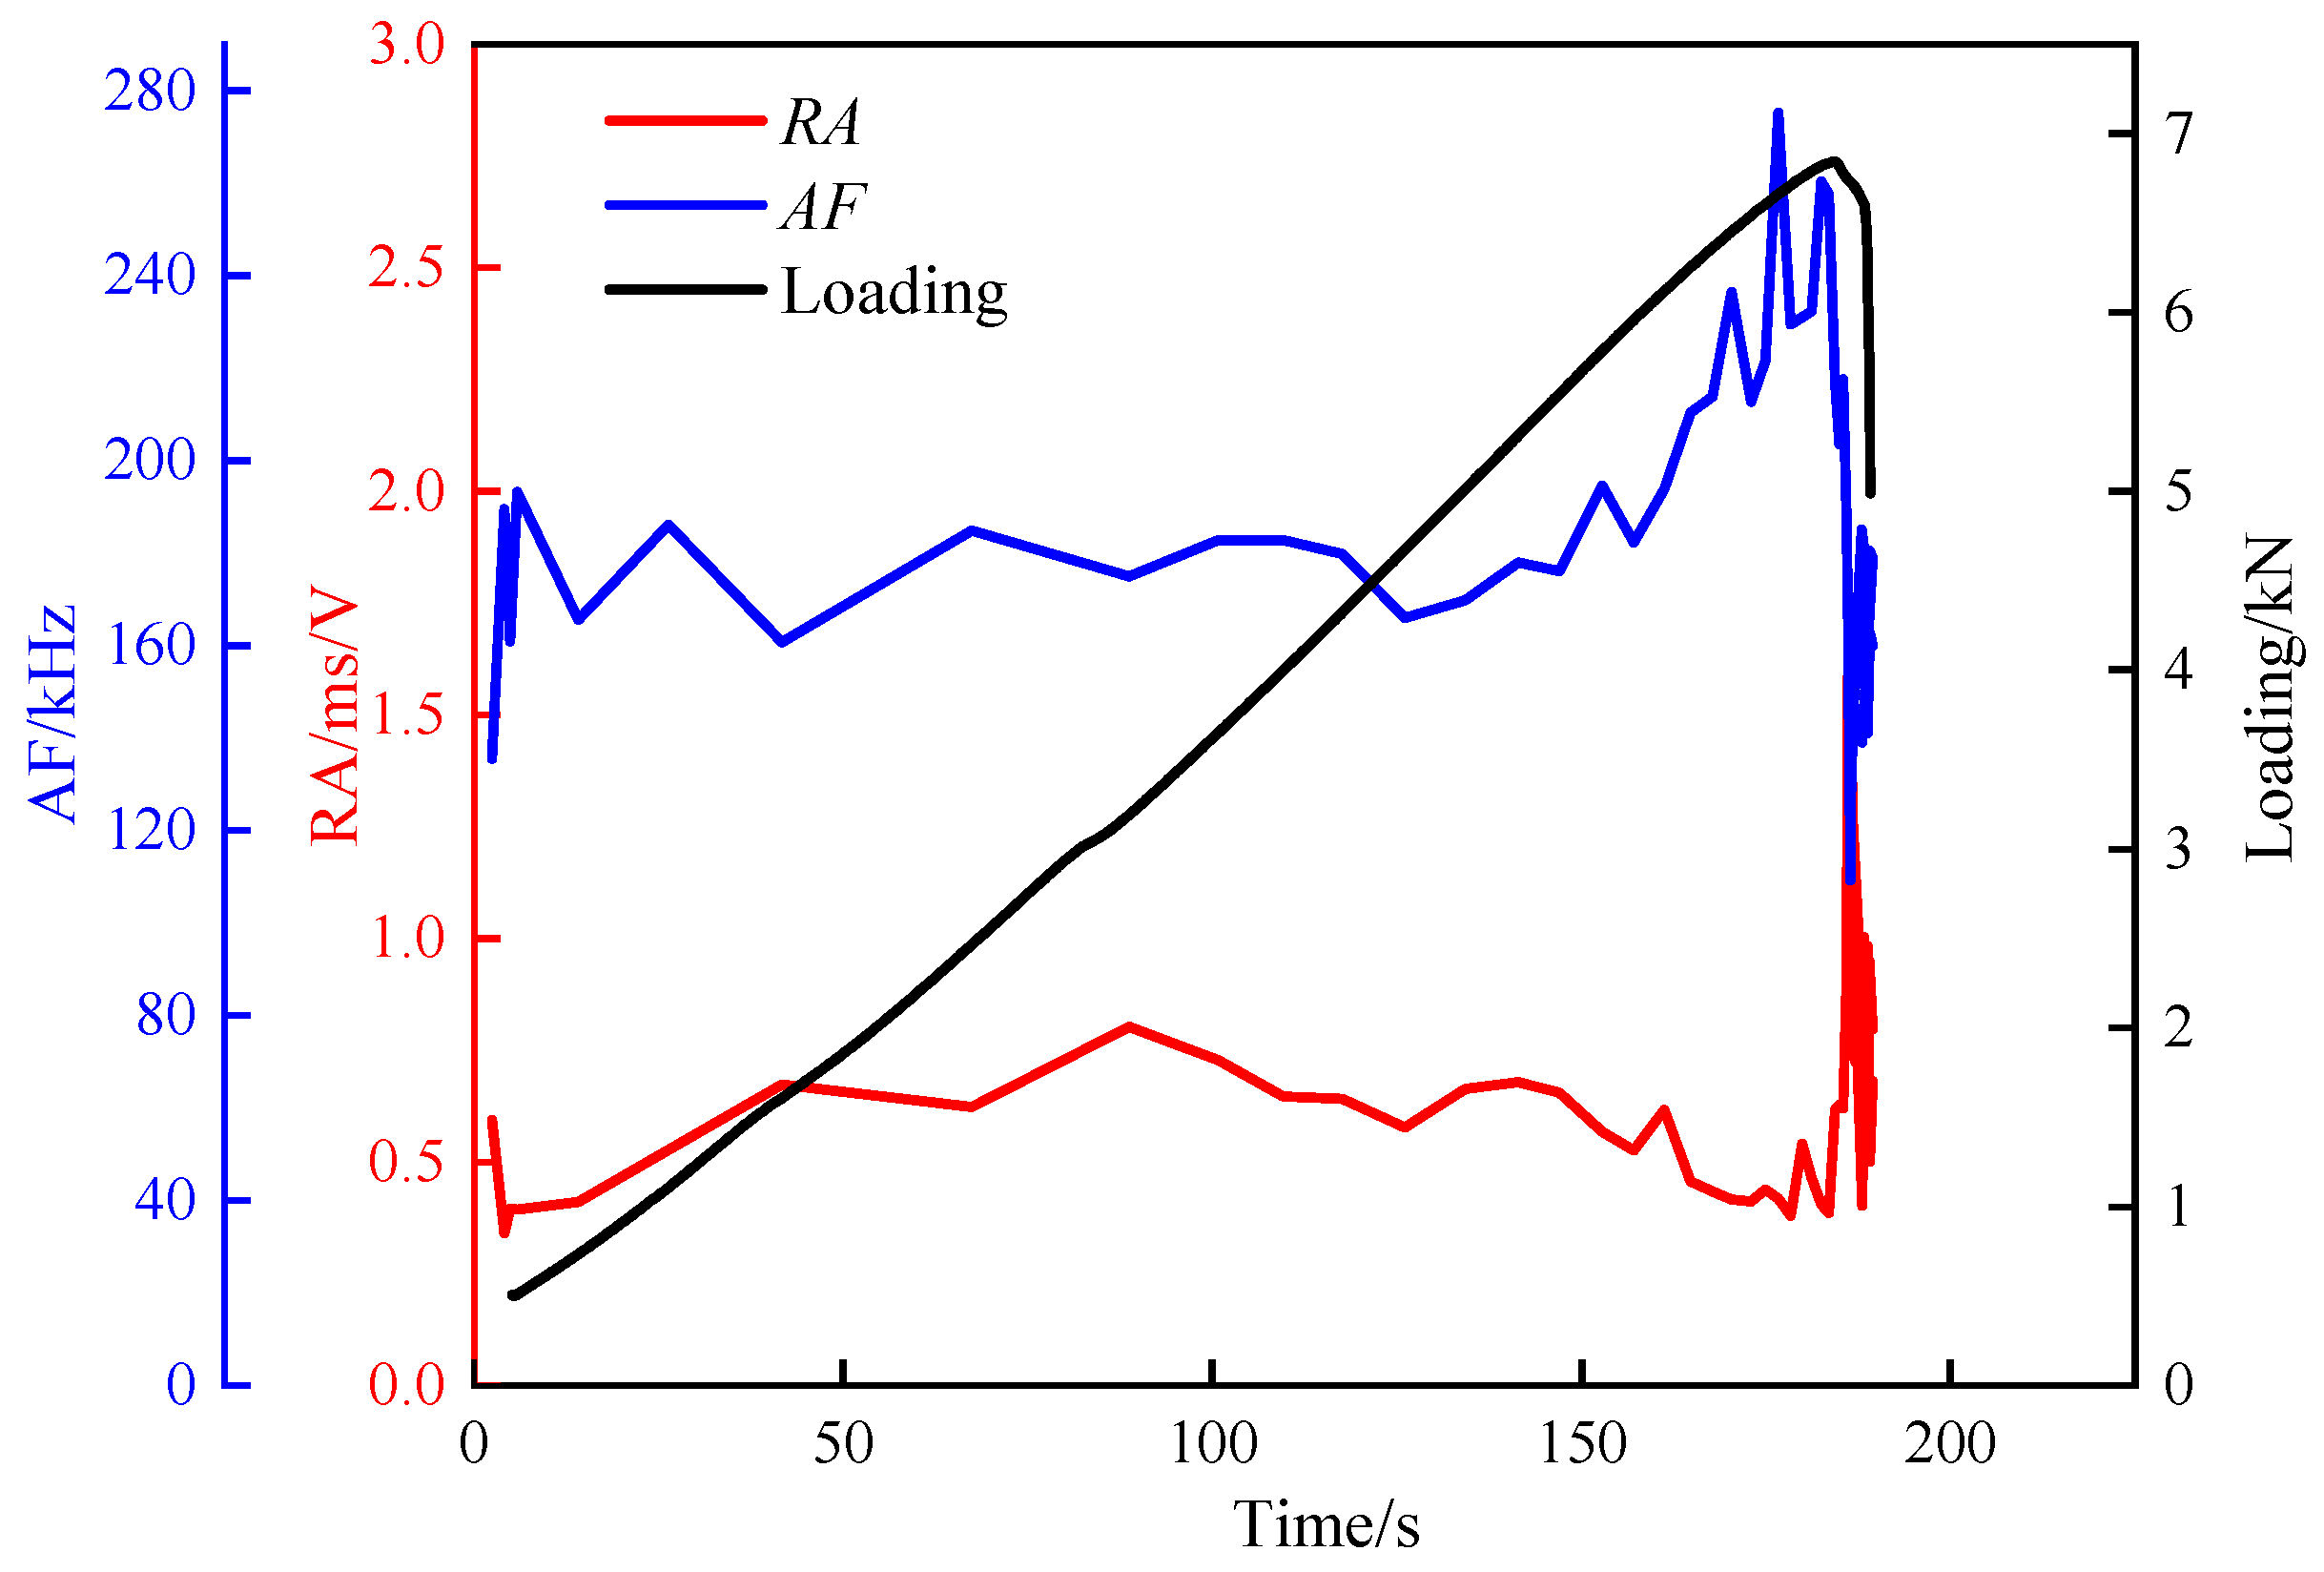
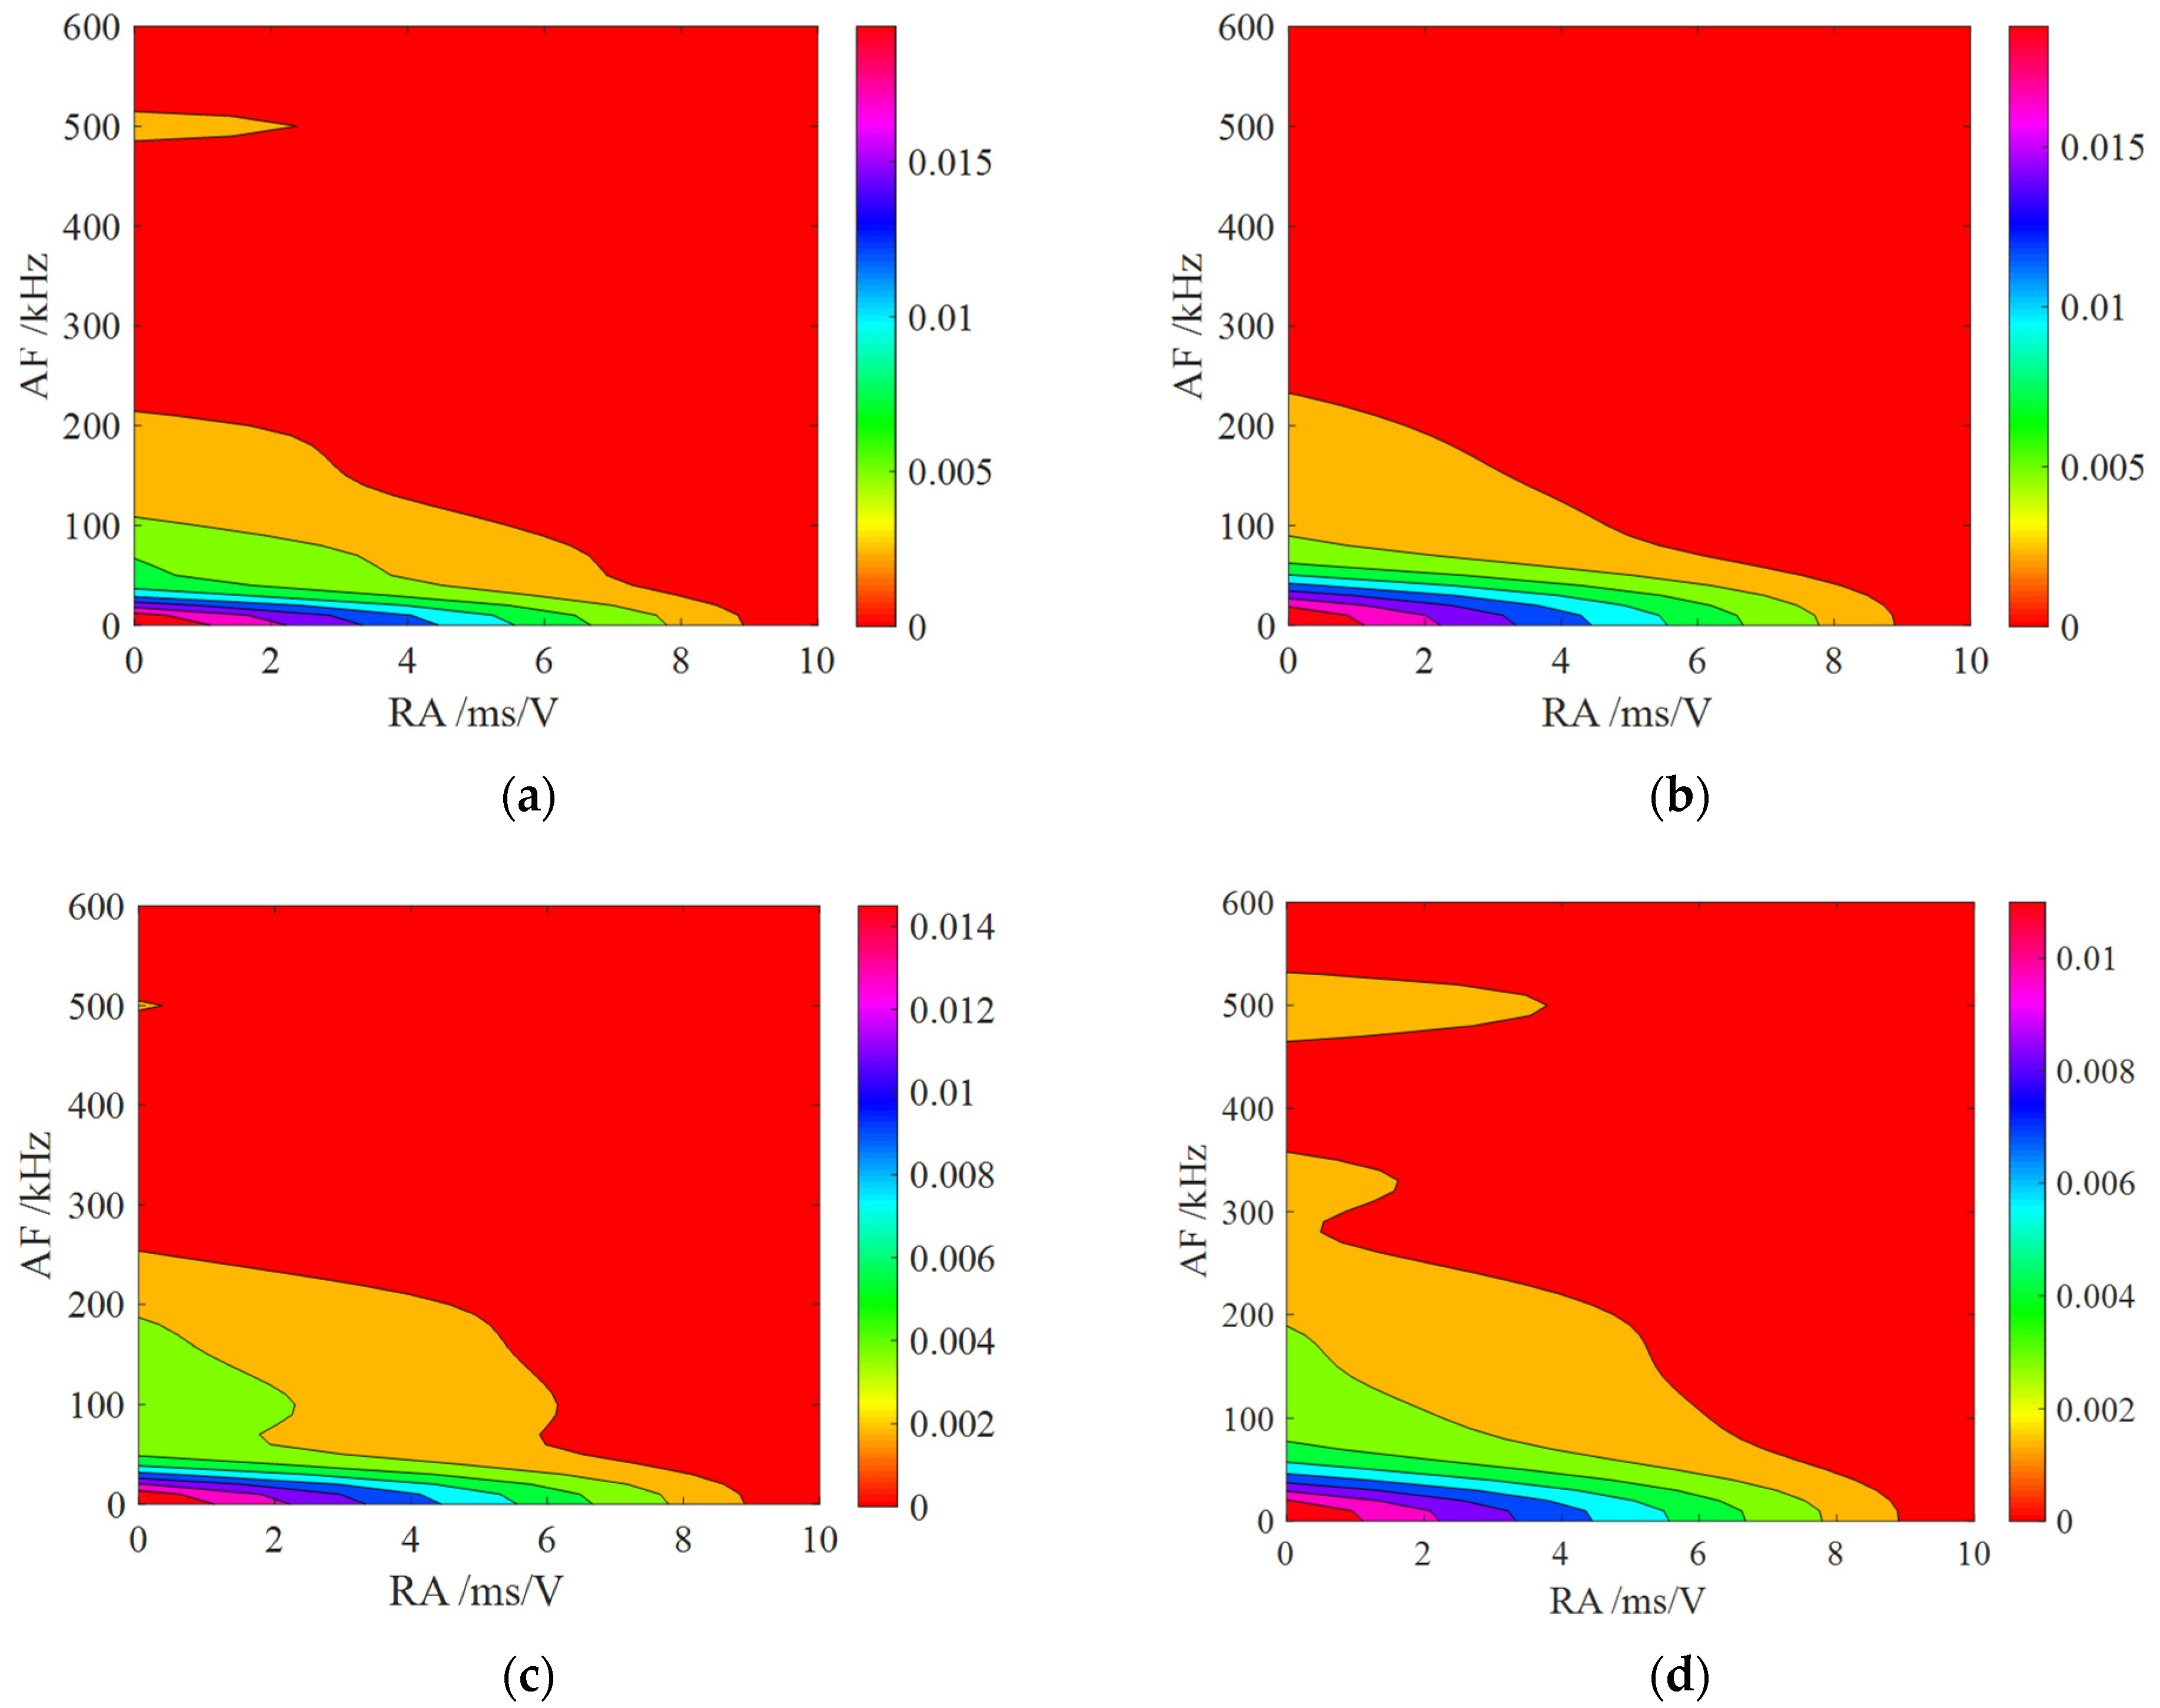
- The S-value and cumulative AE count curves during the loading process of specimens without prefabricated cracks exhibit two types: a fluctuating upward mode, and a “gentle–steep increase” mode. For specimens with five different numbers of stratification planes, high-frequency signals are significantly lower than low-frequency signals, and the proportion of high-frequency signals gradually decreases as the number of stratification planes increases. As the stratification angle increases, the proportion of high-frequency signals shows a trend of first increasing and then decreasing. During the fracture process of layered rock specimens, they consistently exhibit low RA values and high AF characteristics. As the stratification angle increases from 0° to 60°, the failure mode gradually transitions from tensile failure to shear failure.
- (3)
- For Mode I fracture, the stratification effect on fracture toughness is significant. The effect of stratification angles on fracture toughness is amplified with an increasing number of stratification planes, resulting in a more pronounced decline in fracture toughness with greater stratification angles. Additionally, the FPZ length at peak load decreases exponentially as the number of stratification planes increases. Within the stratification angle range of 0° to 60°, the FPZ length decreases linearly with increasing stratification angle.
Author Contributions
Funding
Institutional Review Board Statement
Informed Consent Statement
Data Availability Statement
Conflicts of Interest
References
- Zhao, N.; Feng, J.; Li, J. Failure and mechanical behavior of layered slate under Brazilian splitting test: Laboratory experiment and beam-particle model. Arab. J. Geosci. 2022, 15, 1370. [Google Scholar] [CrossRef]
- Zhang, S.; Wu, S.; Duan, K. Study on the deformation and strength characteristics of hard rock under true triaxial stress state using bonded-particle model. Comput. Geotech. 2019, 112, 1–16. [Google Scholar] [CrossRef]
- Sun, X.; Jiang, M.; Miao, C.; Wang, J.; Zhang, J. Study on large deformation and failure mechanism of deep buried stratified slate tunnel and control strategy of high constant resistance anchor cable. Eng. Fail. Anal. 2023, 144, 106953. [Google Scholar] [CrossRef]
- Zhang, H.; Jin, C.; Wang, L.; Pan, L.; Liu, X.; Ji, S. Research on dynamic splitting damage characteristics and constitutive model of basalt fiber reinforced concrete based on acoustic emission. Constr. Build. Mater. 2022, 319, 126018. [Google Scholar] [CrossRef]
- Zhai, M.; Xue, L.; Chen, H.; Xu, C.; Cui, Y. Effects of shear rates on the damaging behaviors of layered rocks subjected to direct shear: Insights from acoustic emission characteristics. Eng. Fract. Mech. 2021, 258, 108046. [Google Scholar] [CrossRef]
- Chen, C.-S.; Pan, E.; Amadei, B. Determination of deformability and tensile strength of anisotropic rock using Brazilian tests. Int. J. Rock Mech. Min. Sci. 1998, 35, 43–61. [Google Scholar] [CrossRef]
- Chen, S.; Pan, E.; Amadei, B. Evaluation of properties of anisotropic rocks using Brazilian tests. In Proceedings of the ARMA North America Rock Mechanics Symposium, Montreal, QC, Canada, 19–21 June 1996. [Google Scholar]
- Khanlari, G.-R.; Heidari, M.; Sepahigero, A.-A.; Fereidooni, D. Quantification of strength anisotropy of metamorphic rocks of the Hamedan province, Iran, as determined from cylindrical punch, point load and Brazilian tests. Eng. Geol. 2014, 169, 80–90. [Google Scholar] [CrossRef]
- Tavallali, A.; Vervoort, A. Effect of layer orientation on the failure of layered sandstone under Brazilian test conditions. Int. J. Rock Mech. Min. Sci. 2010, 47, 313–322. [Google Scholar] [CrossRef]
- Tavallali, A.; Vervoort, A. Failure of Layered Sandstone under Brazilian Test Conditions: Effect of Micro-Scale Parameters on Macro-Scale Behaviour. Rock Mech. Rock Eng. 2010, 43, 641–653. [Google Scholar] [CrossRef]
- Khanlari, G.; Rafiei, B.; Abdilor, Y. An Experimental Investigation of the Brazilian Tensile Strength and Failure Patterns of Laminated Sandstones. Rock Mech. Rock Eng. 2015, 48, 843–852. [Google Scholar] [CrossRef]
- Basu, A.; Mishra, D.A.; Roychowdhury, K. Rock failure modes under uniaxial compression, Brazilian, and point load tests. Bull. Eng. Geol. Environ. 2013, 72, 457–475. [Google Scholar] [CrossRef]
- Hu, J.; Zhang, L.; He, M. Investigation of the bedding effect on coal rock under Brazilian splitting tests. Front. Earth Sci. 2024, 12, 1416035. [Google Scholar] [CrossRef]
- Biedermann, A.R.; Koch, C.B.; Lorenz, W.E.; Hirt, A.M. Low-temperature magnetic anisotropy in micas and chlorite. Tectonophysics 2014, 629, 63–74. [Google Scholar] [CrossRef]
- Wenk, H.-R.; Yu, R.; Cárdenes, V.; Lopez-Sanchez, M.; Sintubin, M. Fabric and anisotropy of slates: From classical studies to new results. J. Struct. Geol. 2020, 138, 104066. [Google Scholar] [CrossRef]
- Alam, M.R. Experimental and Numerical Investigations of Impact Splitting of Naturally Bedded Layered. Ph.D. Thesis, Memorial University of Newfoundland, St. John’s, NL, Canada, 2005. Available online: http://research.library.mun.ca/id/eprint/10063 (accessed on 1 August 2005).
- Tan, X.; Konietzky, H. Brazilian split tests and numerical simulation by discrete element method for heterogeneous gneiss with bedding structure. Chin. J. Rock Mech. Eng. 2014, 33, 938–946. [Google Scholar]
- Zhang, S.; Shou, K.; Xian, X.; Zhou, J.; Liu, G. Fractal characteristics and acoustic emission of anisotropic shale in Brazilian tests. Tunn. Undergr. Space Technol. 2018, 71, 298–308. [Google Scholar] [CrossRef]
- Xie, Q.; Liu, X.; Li, S.; Du, K.; Gong, F.; Li, X. Prediction of Mode I Fracture Toughness of Shale Specimens by Different Fracture Theories Considering Size Effect. Rock Mech. Rock Eng. 2022, 55, 7289–7306. [Google Scholar] [CrossRef]
- Xie, Q.; Chen, D.; Liu, X.; Zeng, Y. Research on the effect of loading rate on the fracture characteristics of granite using cracked straight through Brazilian disc specimens. Theor. Appl. Fract. Mech. 2022, 122, 103581. [Google Scholar] [CrossRef]
- Xie, Q.; Liu, X.; Fan, L.; Peng, S.; Zeng, Y. Evaluation of equivalent crack propagation length and fracture energy of two commonly used rock fracture toughness test configurations based on Bažant’s size effect law. Eng. Fract. Mech. 2023, 281, 109067. [Google Scholar] [CrossRef]
- Awaji, H.; Sato, S. Combined Mode Fracture Toughness Measurement by the Disk Test. J. Eng. Mater. Technol. 1978, 100, 175–182. [Google Scholar] [CrossRef]
- Xie, Q.; Li, S.-X.; Liu, X.-L.; Gong, F.-Q.; Li, X.-B. Effect of loading rate on fracture behaviors of shale under mode I loading. J. Cent. South Univ. 2020, 27, 3118–3132. [Google Scholar] [CrossRef]
- Lilienthal, G.M.; Zhong, Y.; Makhnenko, R.Y. Fracture process zone in crystalline rock: Effect of specimen size and shape. Theor. Appl. Fract. Mech. 2023, 128, 104118. [Google Scholar] [CrossRef]
- Yang, R.; Li, W.; Fang, S.; Zhu, Y.; Li, Y. Experimental study on impact dynamic characteristics of layered composite rocks. Chin. J. Rock Mech. Eng. 2019, 38, 1747–1757. [Google Scholar]
- Lee, H.P.; Olson, J.E.; Holder, J.; Gale, J.F.W.; Myers, R.D. The interaction of propagating opening mode fractures with preexisting discontinuities in shale. J. Geophys. Res. Solid Earth 2015, 120, 169–181. [Google Scholar] [CrossRef]
- Chen, C.-S.; Pan, E.; Amadei, B. Fracture mechanics analysis of cracked discs of anisotropic rock using the boundary element method. Int. J. Rock Mech. Min. Sci. 1998, 35, 195–218. [Google Scholar] [CrossRef]
- Ke, C.-C.; Chen, C.-S.; Tu, C.-H. Determination of Fracture Toughness of Anisotropic Rocks by Boundary Element Method. Rock Mech. Rock Eng. 2008, 41, 509–538. [Google Scholar] [CrossRef]
- Liu, X.; Wang, J.; Li, X.; Pan, M. On the frequency characteristics of ore’s acoustic emission signal in uniaxial compression and Brazilian splitting test. J. Exp. Mech. 2018, 33, 201–208. [Google Scholar]
- Zhang, C.; Li, D.; Zhou, A.; Ru, W.; Zhu, Q.; Ma, J. Effect of loading rate on mode I fracture behavior of red sandstone: Insights from AE and DIC techniques. Theor. Appl. Fract. Mech. 2024, 131, 104364. [Google Scholar] [CrossRef]
- Liu, X.-l.; Liu, Q.-l.; Du, K.; Li, X.-b.; Xie, Q. Acoustic emission features and P-wave first-motion polarity of tensile fractures in the rock. Chin. J. Eng. 2022, 44, 1315–1323. [Google Scholar]
- Bieniawski, Z.T.; Hawkes, I. Suggested methods for determining tensile strength of rock materials. Int. J. Rock. Mech. Min. 1978, 15, 99–103. [Google Scholar]
- Claesson, J.; Bohloli, B. Brazilian test: Stress field and tensile strength of anisotropic rocks using an analytical solution. Int. J. Rock Mech. Min. Sci. 2002, 39, 991–1004. [Google Scholar] [CrossRef]
- Chen, D.; Liu, X.; He, W.; Xia, C.; Gong, F.; Li, X.; Cao, X. Effect of attenuation on amplitude distribution and b value in rock acoustic emission tests. Geophys. J. Int. 2021, 229, 933–947. [Google Scholar] [CrossRef]
- Liu, X.L.; Han, M.S.; He, W.; Li, X.B.; Chen, D.L. A New b Value Estimation Method in Rock Acoustic Emission Testing. J. Geophys. Res. Solid Earth 2020, 125, e2020JB019658. [Google Scholar] [CrossRef]
- Liu, X.; Liu, Z.; Li, X.; Gong, F.; Du, K. Experimental study on the effect of strain rate on rock acoustic emission characteristics. Int. J. Rock Mech. Min. Sci. 2020, 133, 104420. [Google Scholar] [CrossRef]
- Deng, J.; Li, L.; Chen, F.; Liu, J.; Yu, J. Twin-peak frequencies of acoustic emission due to the fracture of marble and their possible mechanism. Adv. Eng. Sci. 2018, 50, 12–17. [Google Scholar]
- Buchheim, W. Geophysical methods for the study of rock pressure in coal and potash salt mining. In Proceedings of the International Strata Control Congress, Leipzig, Germany, 14–16 October 1958; pp. 222–233. [Google Scholar]
- Yuan, G.; Zhang, M.; Zhang, K.; Tian, Z.; Duan, H.; Liu, B. Mechanical response and AE characteristics of heterogeneous rock under dynamic compression tests based on moment tensor analysis. Comput. Part. Mech. 2024, 11, 815–838. [Google Scholar] [CrossRef]
- Niu, Y.; Zhou, X.-P.; Berto, F. Evaluation of fracture mode classification in flawed red sandstone under uniaxial compression. Theor. Appl. Fract. Mech. 2020, 107, 102528. [Google Scholar] [CrossRef]
- Zhang, W.; Hua, W.; Zhou, M.; Wang, S.; Yang, H.; Dong, S. Influence of specimen configuration on mode I and mode II fracture toughness of sandstone. Theor. Appl. Fract. Mech. 2024, 133, 104551. [Google Scholar] [CrossRef]
- Golewski, G. Comparative measurements of fracture toughgness combined with visual analysis of cracks propagation using the DIC technique of concretes based on cement matrix with a highly diversified composition. Theor. Appl. Fract. Mech. 2022, 121, 103553. [Google Scholar] [CrossRef]
- Harilal, R.; Ramji, M. Adaptation of open source 2D DIC software Ncorr for solid mechanics applications. In Proceedings of the 9th International Symposium on Advanced Science and Technology in Experimental Mechanics, New Delhi, India, 1–6 November 2014. [Google Scholar]


| Rock Type | Specimen Size/mm | Quantities |
|---|---|---|
| Green sandstone | 250 × 240 × 30 | 20 |
| 250 × 240 × 18 | 2 | |
| 250 × 240 × 12.5 | 4 | |
| 250 × 240 × 10 | 6 | |
| 250 × 240 × 8.5 | 8 |
| Angle Type | 0° | 30° | 45° | 60° | 90° |
|---|---|---|---|---|---|
| One stratification |  |  |  |  |  |
| Two stratifications |  |  |  |  | |
| Three stratifications |  |  |  |  | |
| Four stratifications |  |  |  |  | 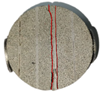 |
| Five stratifications |  |  |  |  |
| Angle Type | 0° | 30° | 45° | 60° | 90° |
|---|---|---|---|---|---|
| One stratification |  |  |  | 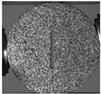 | 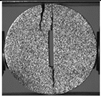 |
| Two stratifications |  |  |  |  |  |
| Three stratifications |  |  |  |  |  |
| Four stratifications |  |  |  |  |  |
| Five stratifications |  |  |  |  |  |
Disclaimer/Publisher’s Note: The statements, opinions and data contained in all publications are solely those of the individual author(s) and contributor(s) and not of MDPI and/or the editor(s). MDPI and/or the editor(s) disclaim responsibility for any injury to people or property resulting from any ideas, methods, instructions or products referred to in the content. |
© 2025 by the authors. Licensee MDPI, Basel, Switzerland. This article is an open access article distributed under the terms and conditions of the Creative Commons Attribution (CC BY) license (https://creativecommons.org/licenses/by/4.0/).
Share and Cite
Zhong, Y.; Hao, Q.; Liu, H.; Liu, X.; Wang, L.; Xie, Q. Investigation of the Layered Effect on the Tensile Fracture Characteristics of Sandstone Using Intact and Pre-Cracked Brazilian Disk Specimens. Appl. Sci. 2025, 15, 2149. https://doi.org/10.3390/app15042149
Zhong Y, Hao Q, Liu H, Liu X, Wang L, Xie Q. Investigation of the Layered Effect on the Tensile Fracture Characteristics of Sandstone Using Intact and Pre-Cracked Brazilian Disk Specimens. Applied Sciences. 2025; 15(4):2149. https://doi.org/10.3390/app15042149
Chicago/Turabian StyleZhong, Yuchen, Qi Hao, Huini Liu, Xiling Liu, Lichang Wang, and Qin Xie. 2025. "Investigation of the Layered Effect on the Tensile Fracture Characteristics of Sandstone Using Intact and Pre-Cracked Brazilian Disk Specimens" Applied Sciences 15, no. 4: 2149. https://doi.org/10.3390/app15042149
APA StyleZhong, Y., Hao, Q., Liu, H., Liu, X., Wang, L., & Xie, Q. (2025). Investigation of the Layered Effect on the Tensile Fracture Characteristics of Sandstone Using Intact and Pre-Cracked Brazilian Disk Specimens. Applied Sciences, 15(4), 2149. https://doi.org/10.3390/app15042149