
Determining a Suitable Reinforcement Strategy for TBM Advance in a Gully Fault Zone Without Jamming—A Numerical Analysis


Abstract
:1. Introduction
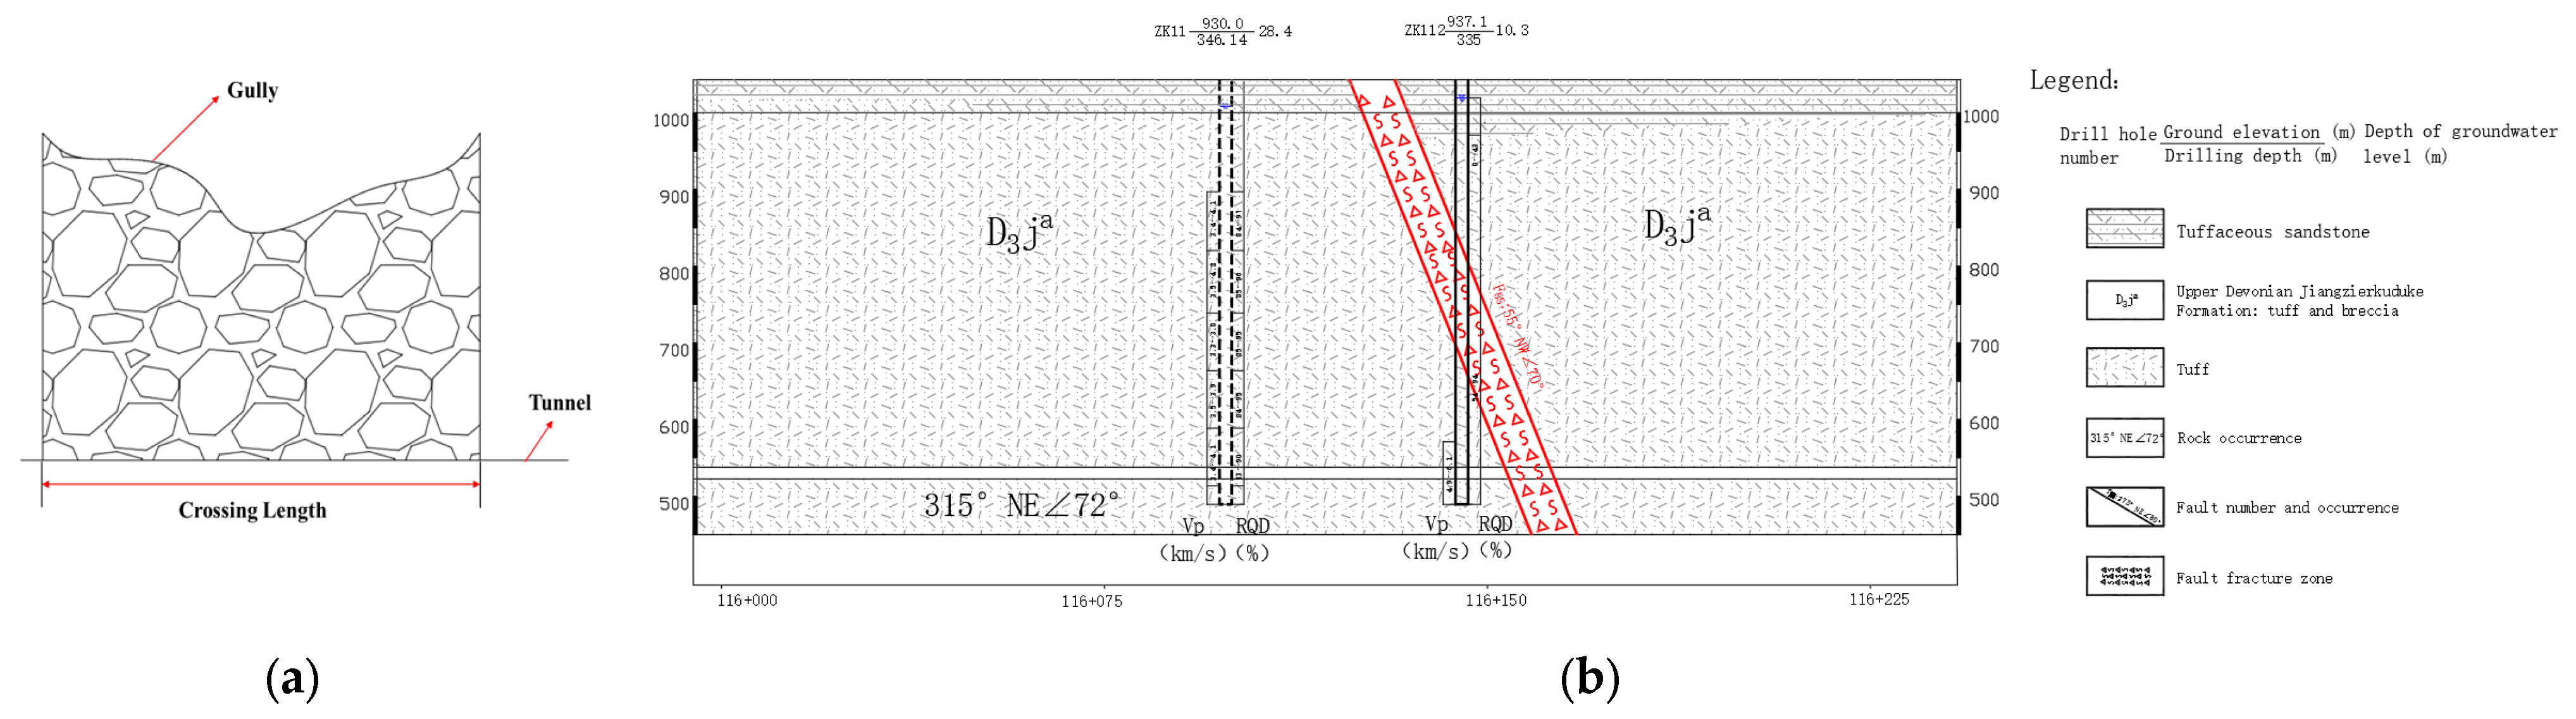
2. Project Overview
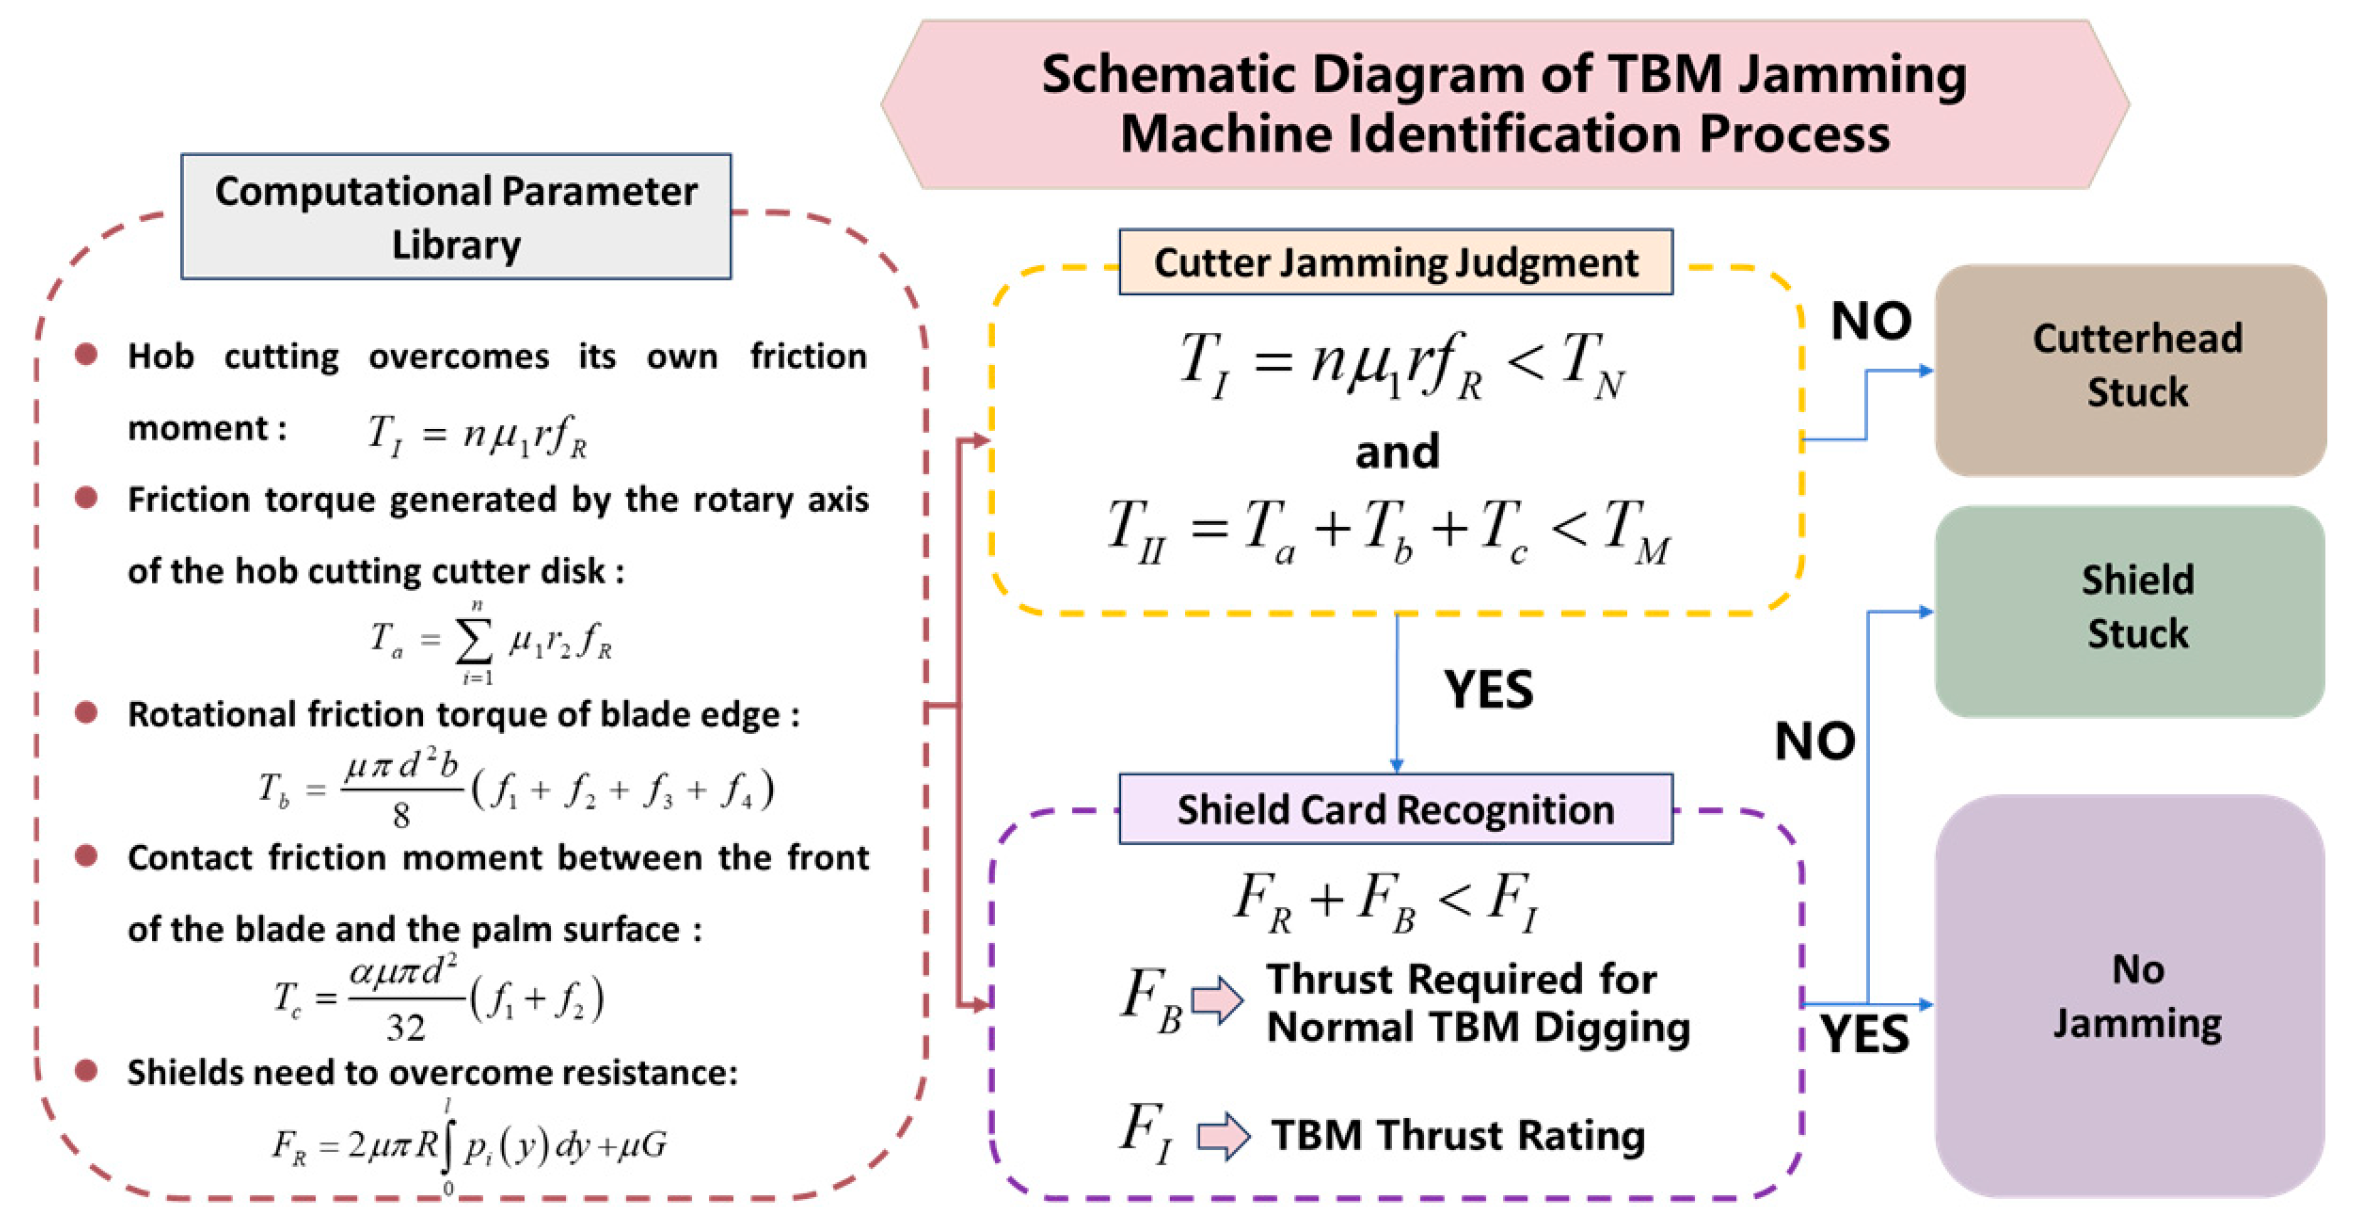
3. Analysis of the Mechanism of Cutterhead Jamming in Open-Type TBM Traversing Fault Fracture Zones
4. Analysis of the Effect of TBM Crossing Fault Fracture Zone Under Different Treatment Methods
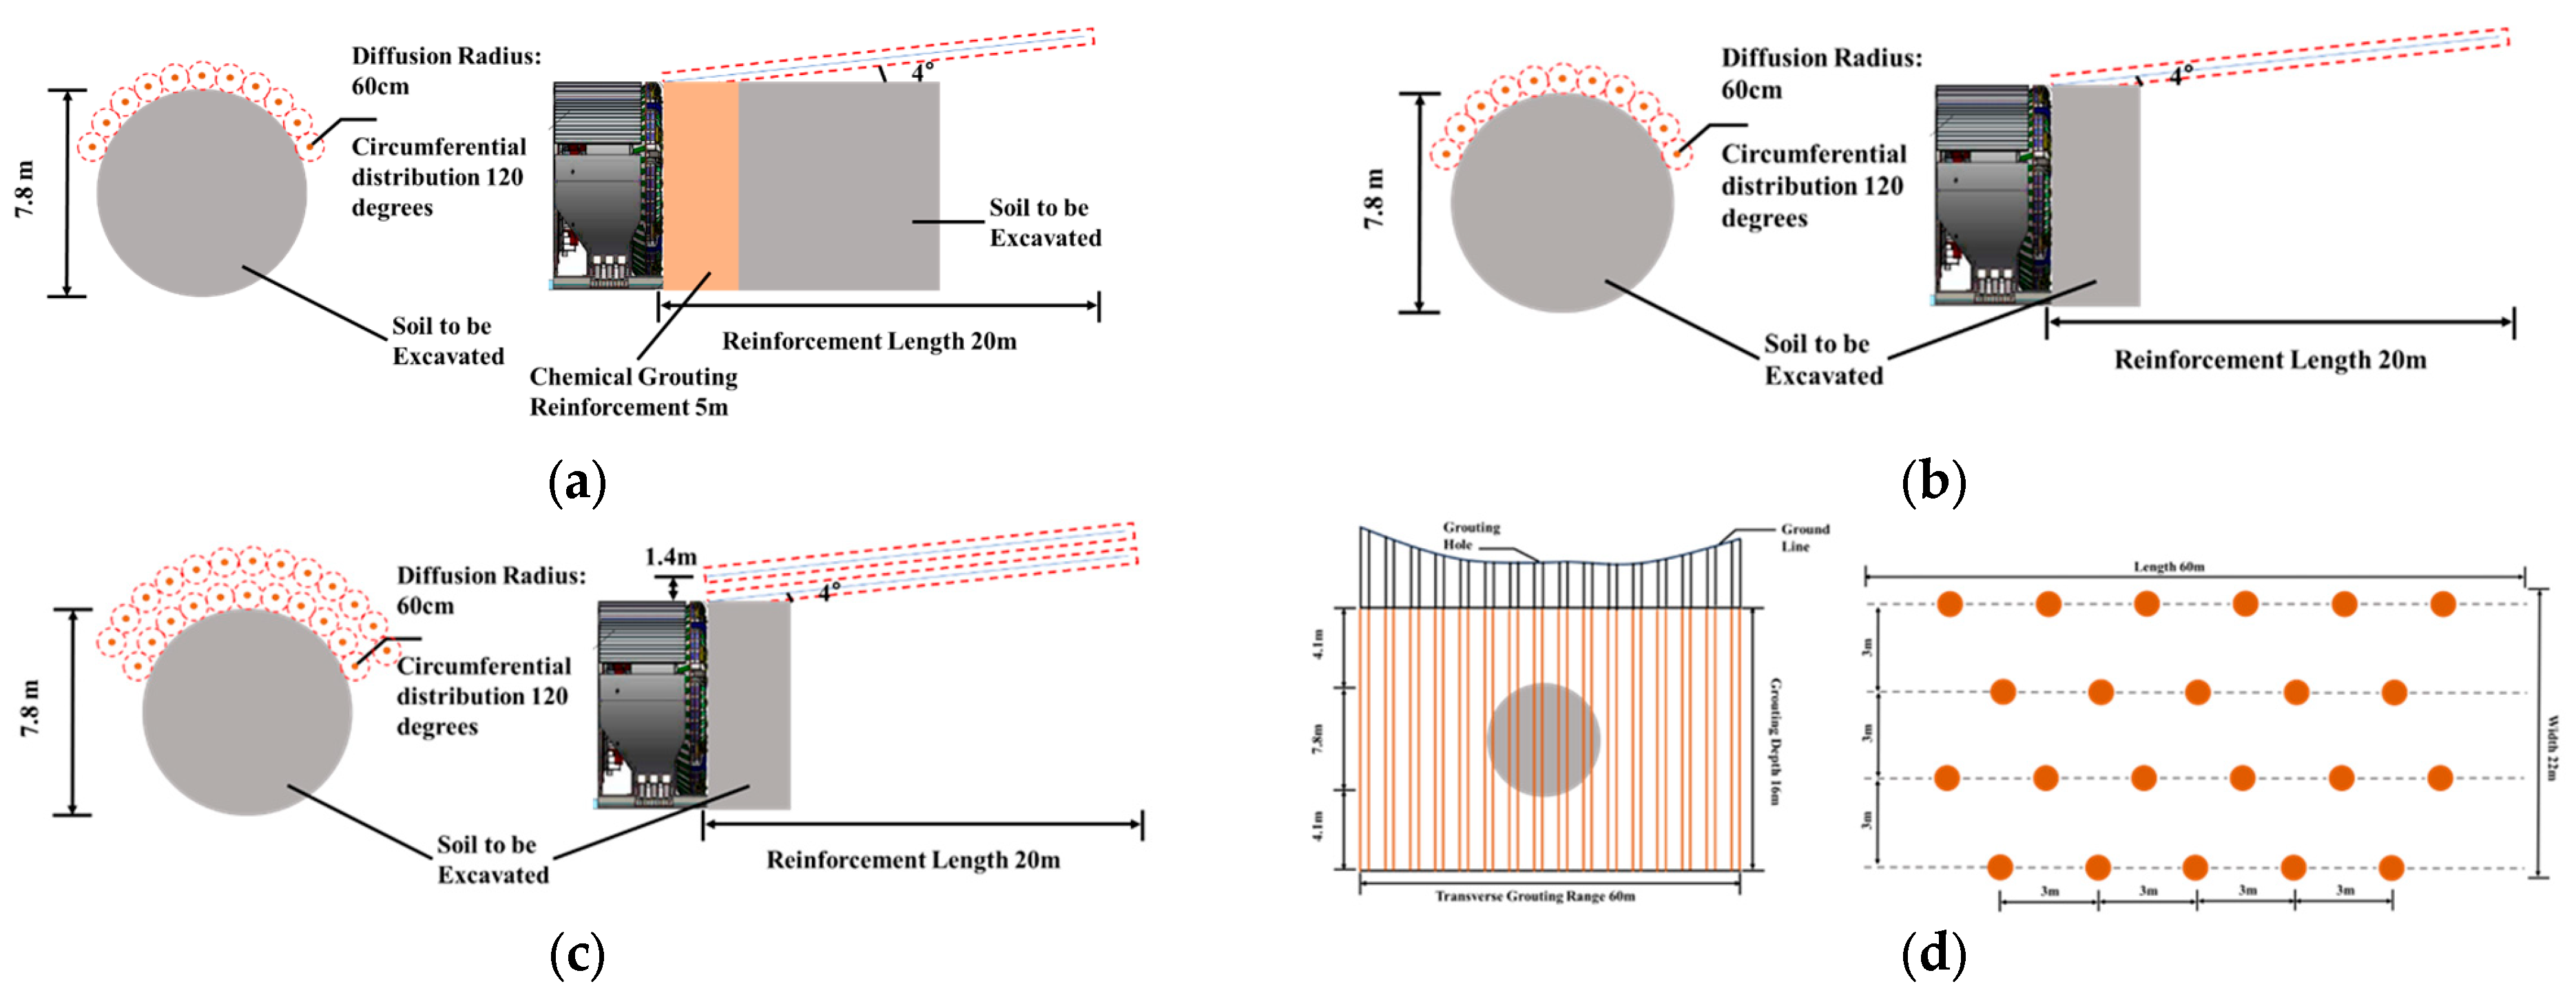
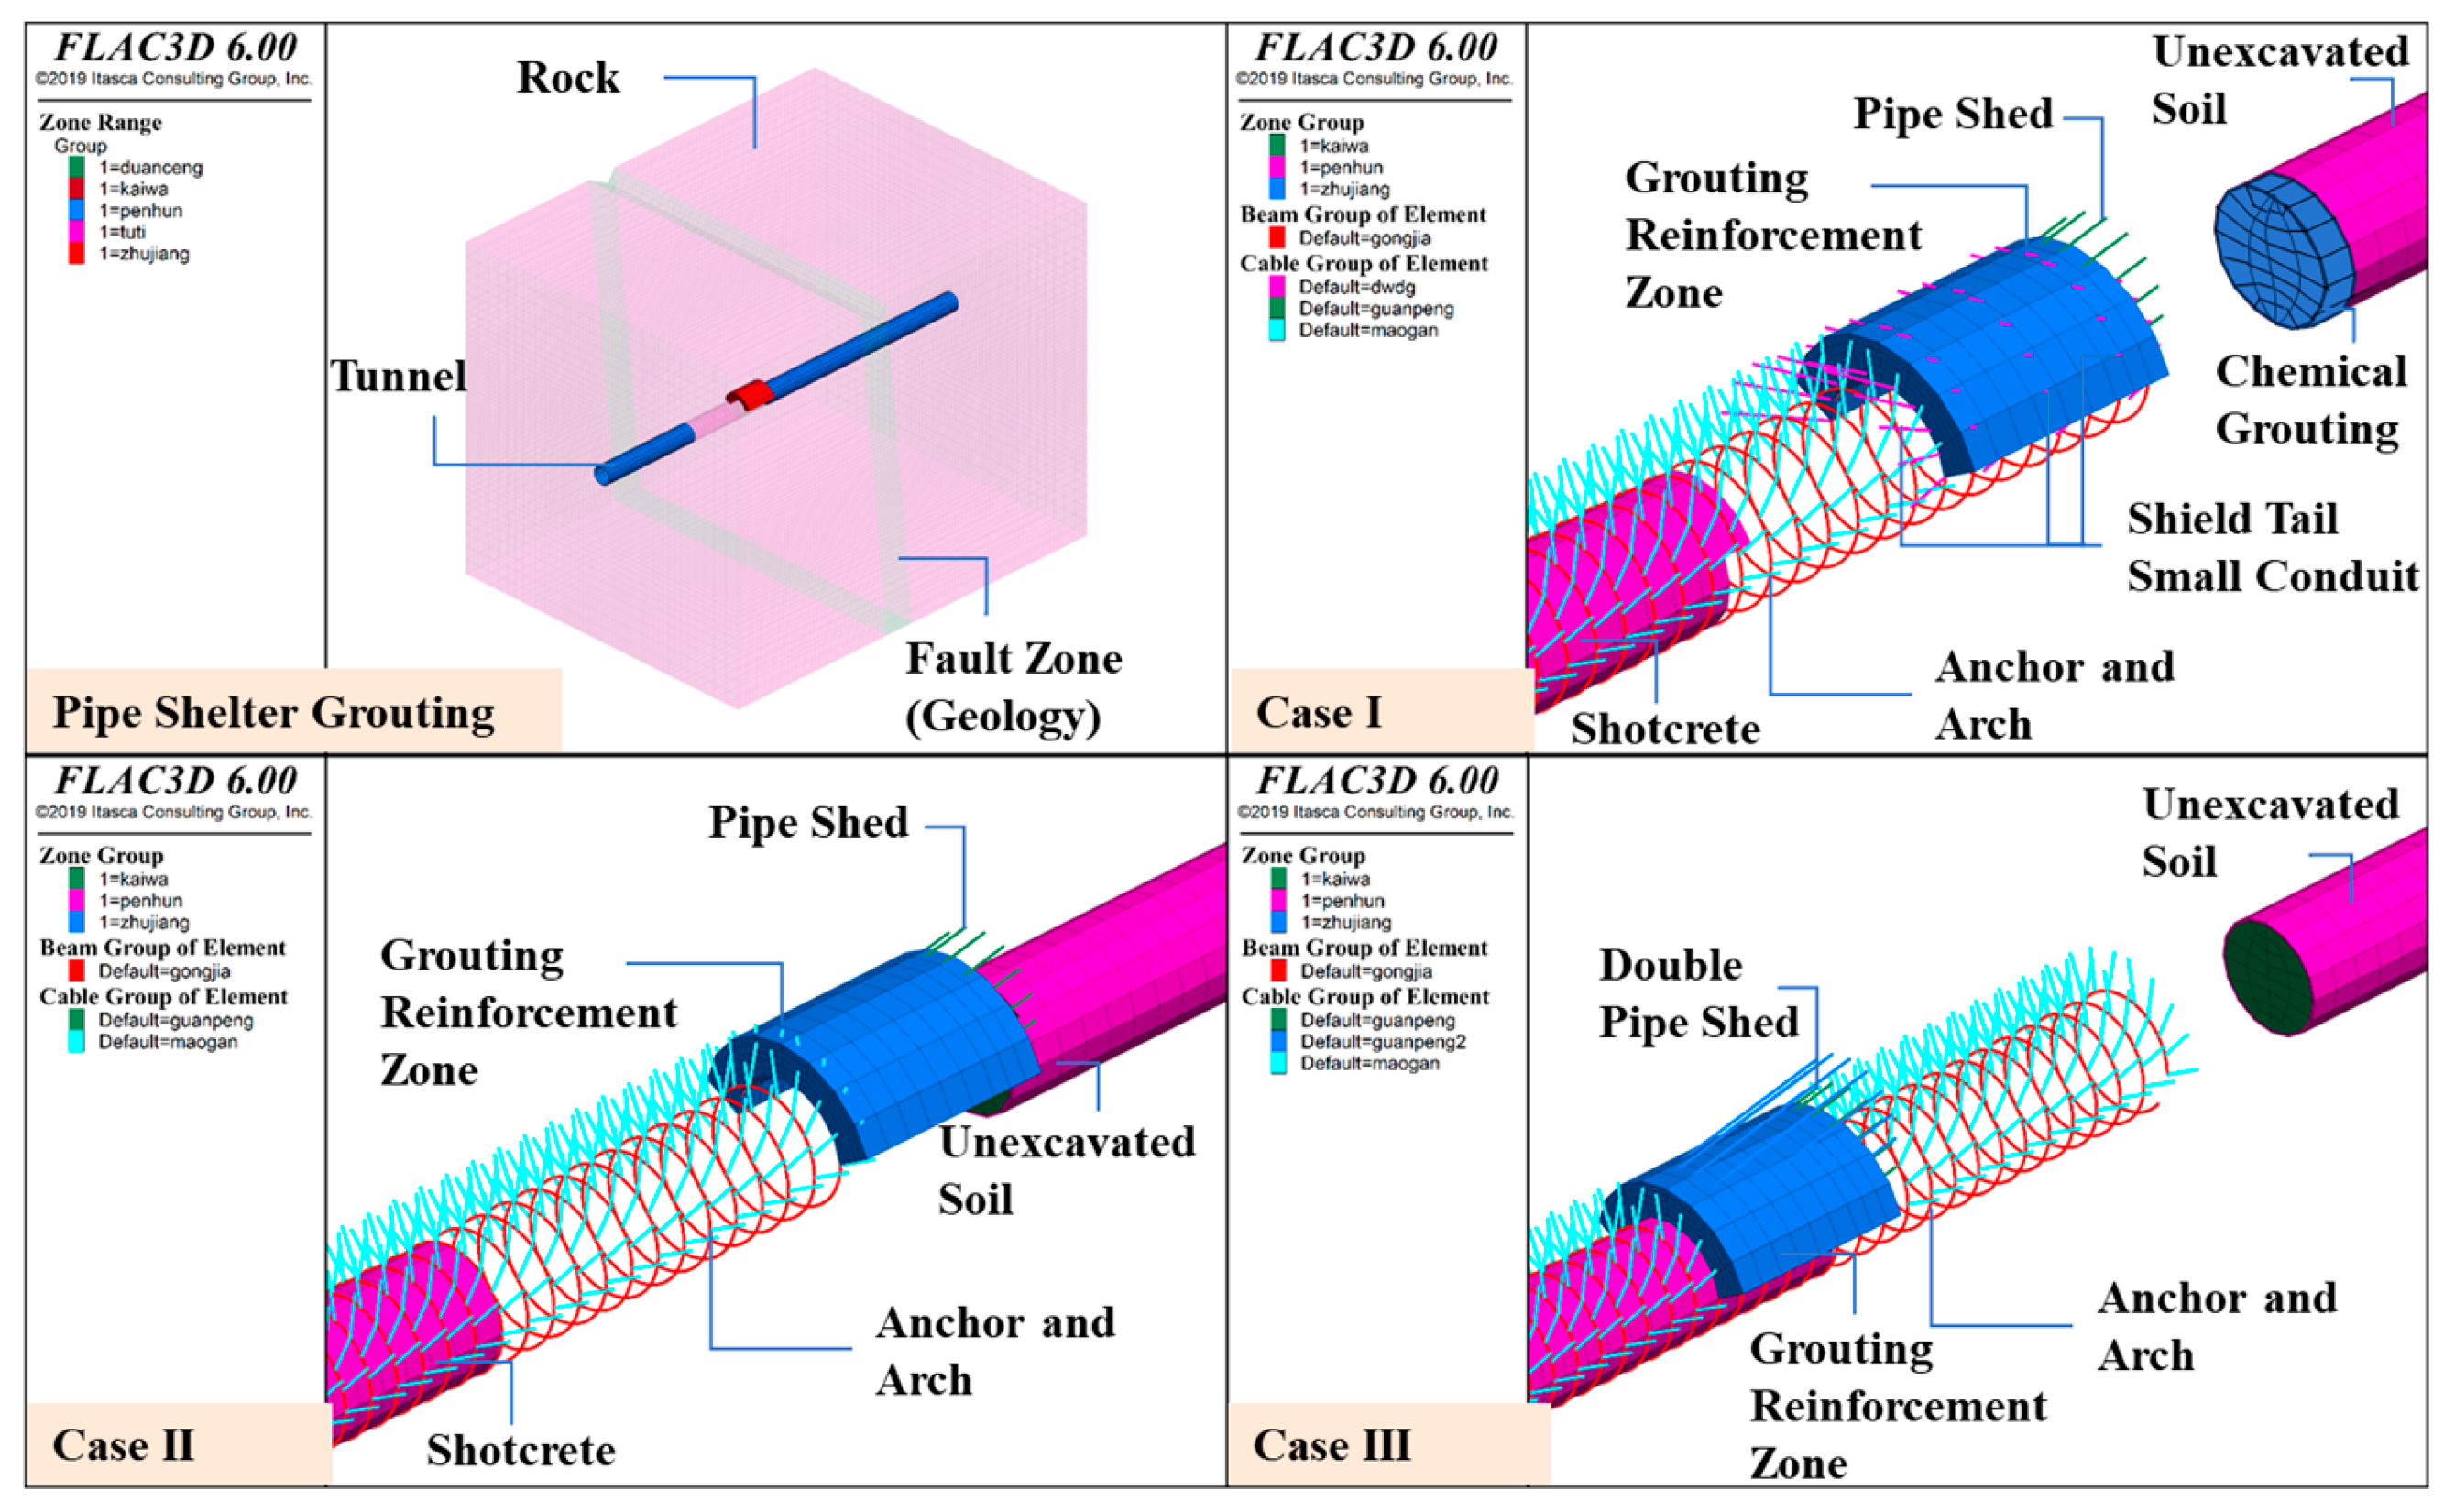
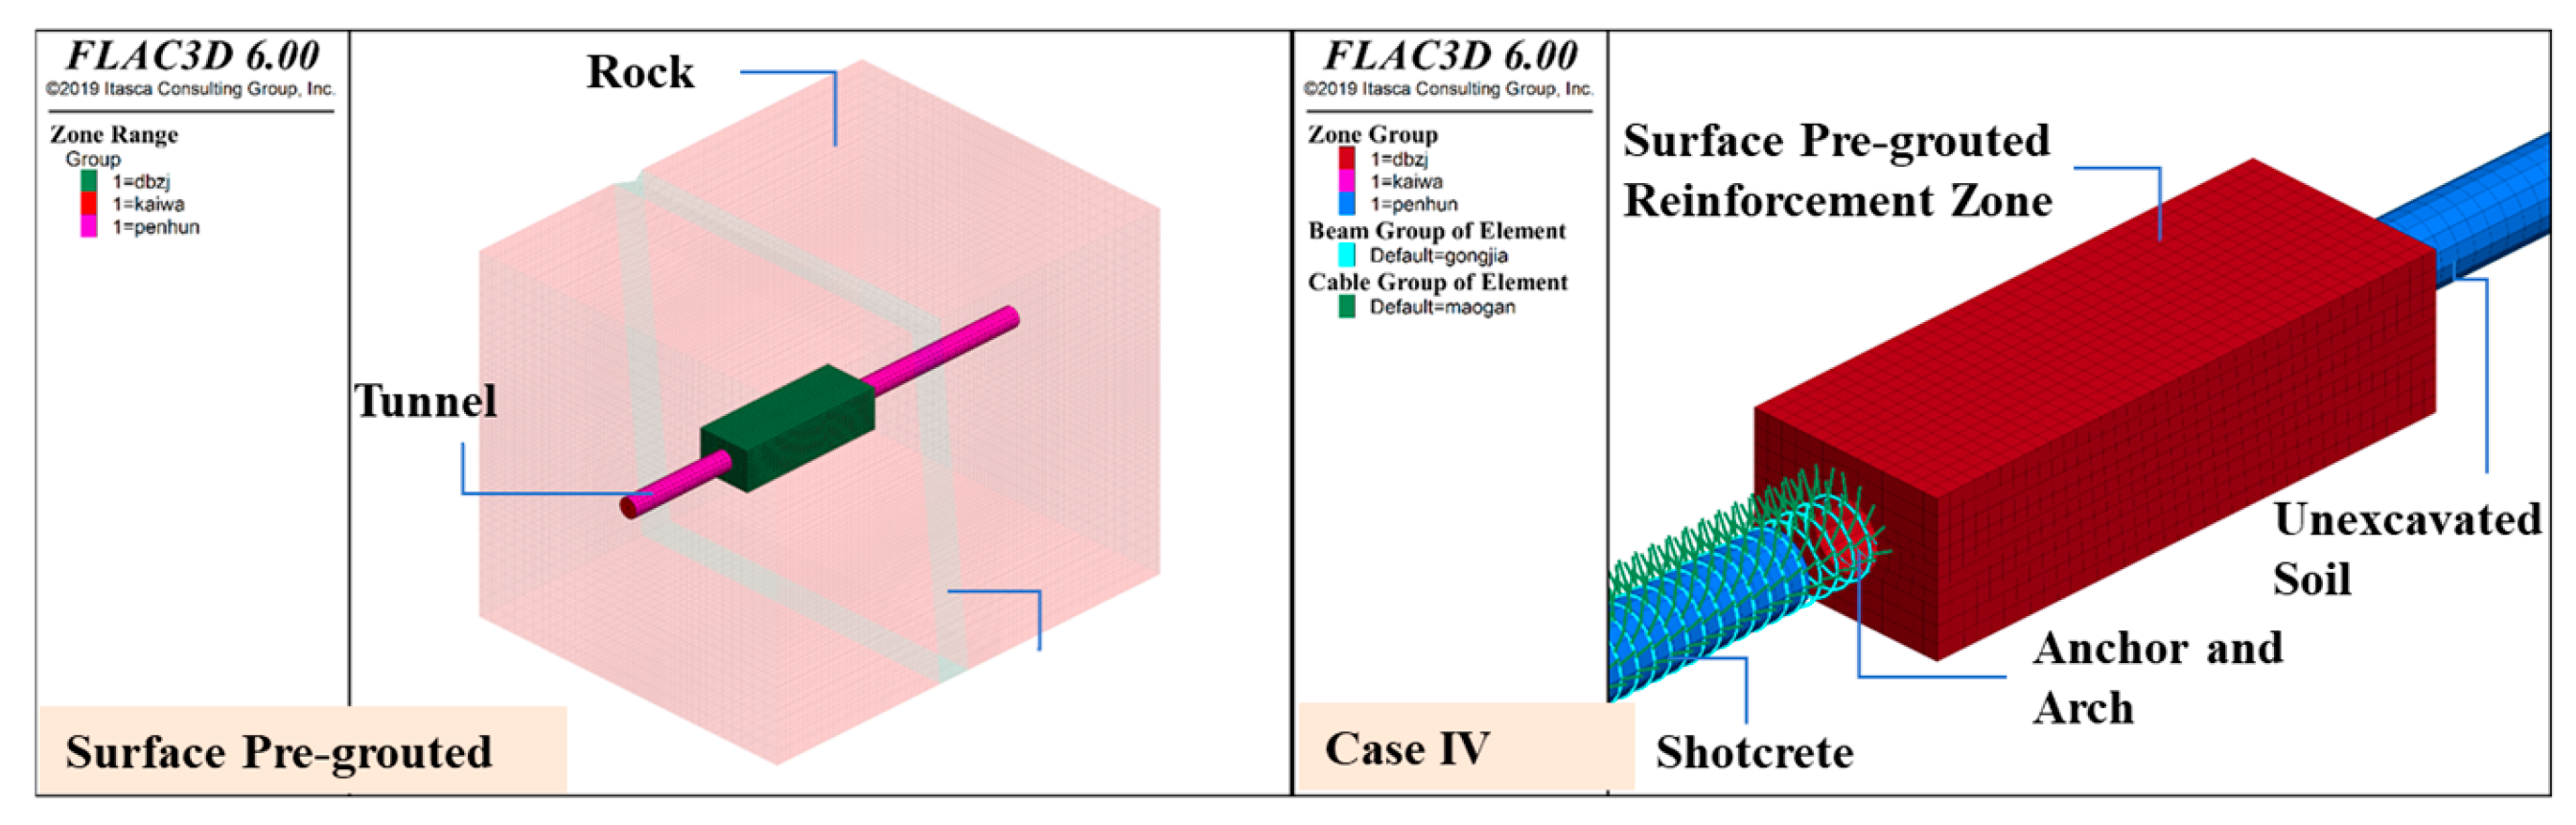
4.1. Calculation Condition Setting
4.2. Computational Models
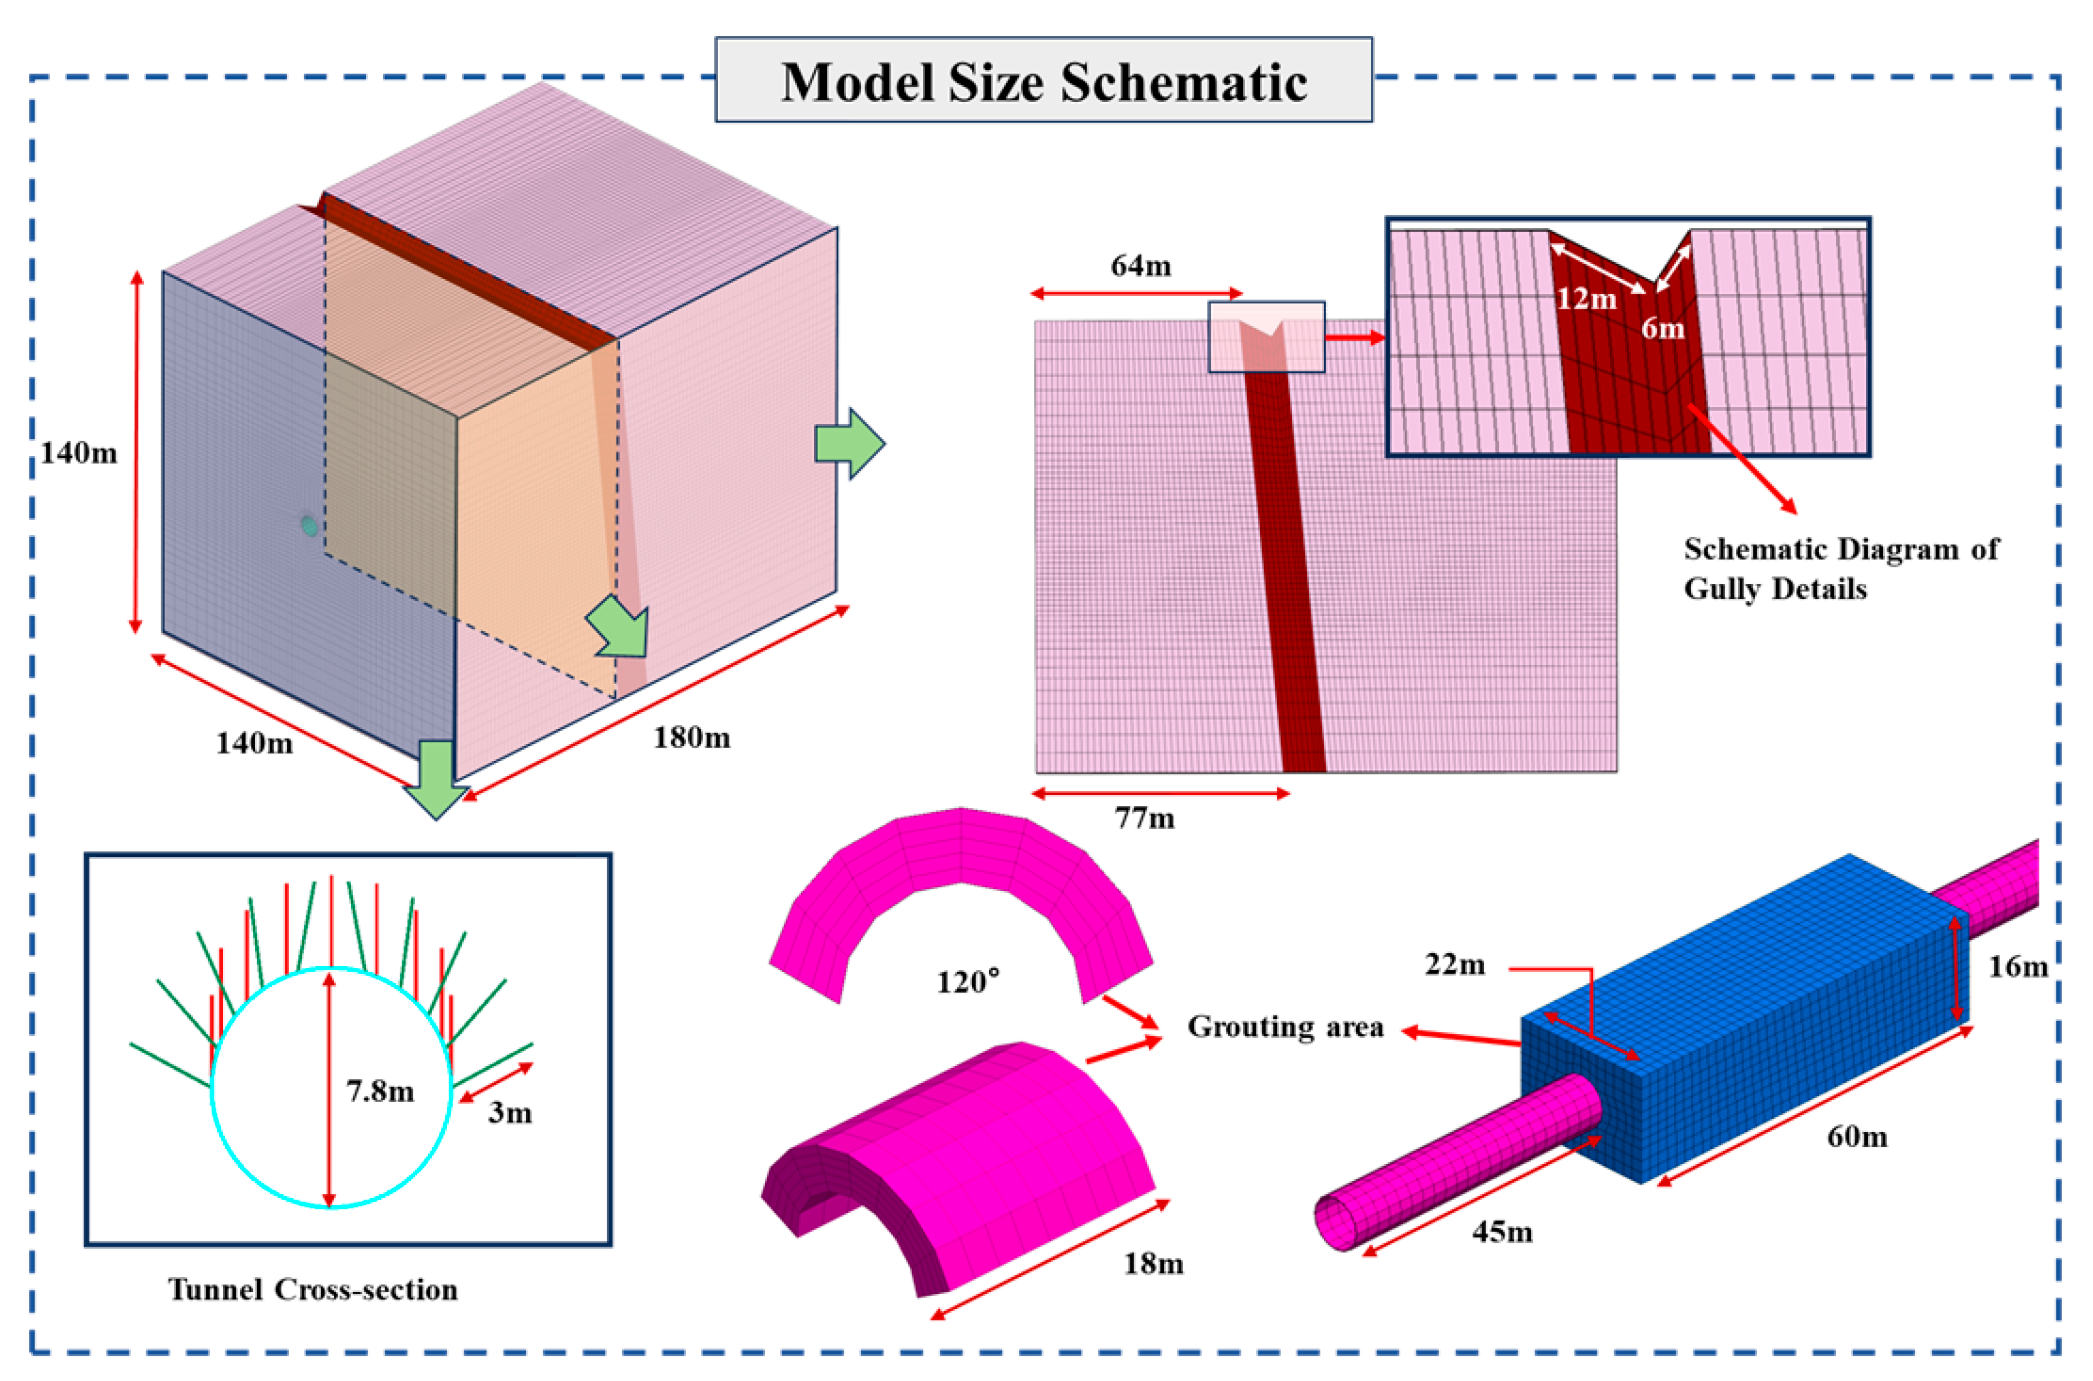
4.2.1. Establishment of Excavation Model for Gully Fault
4.2.2. Physical–Mechanical Parameters
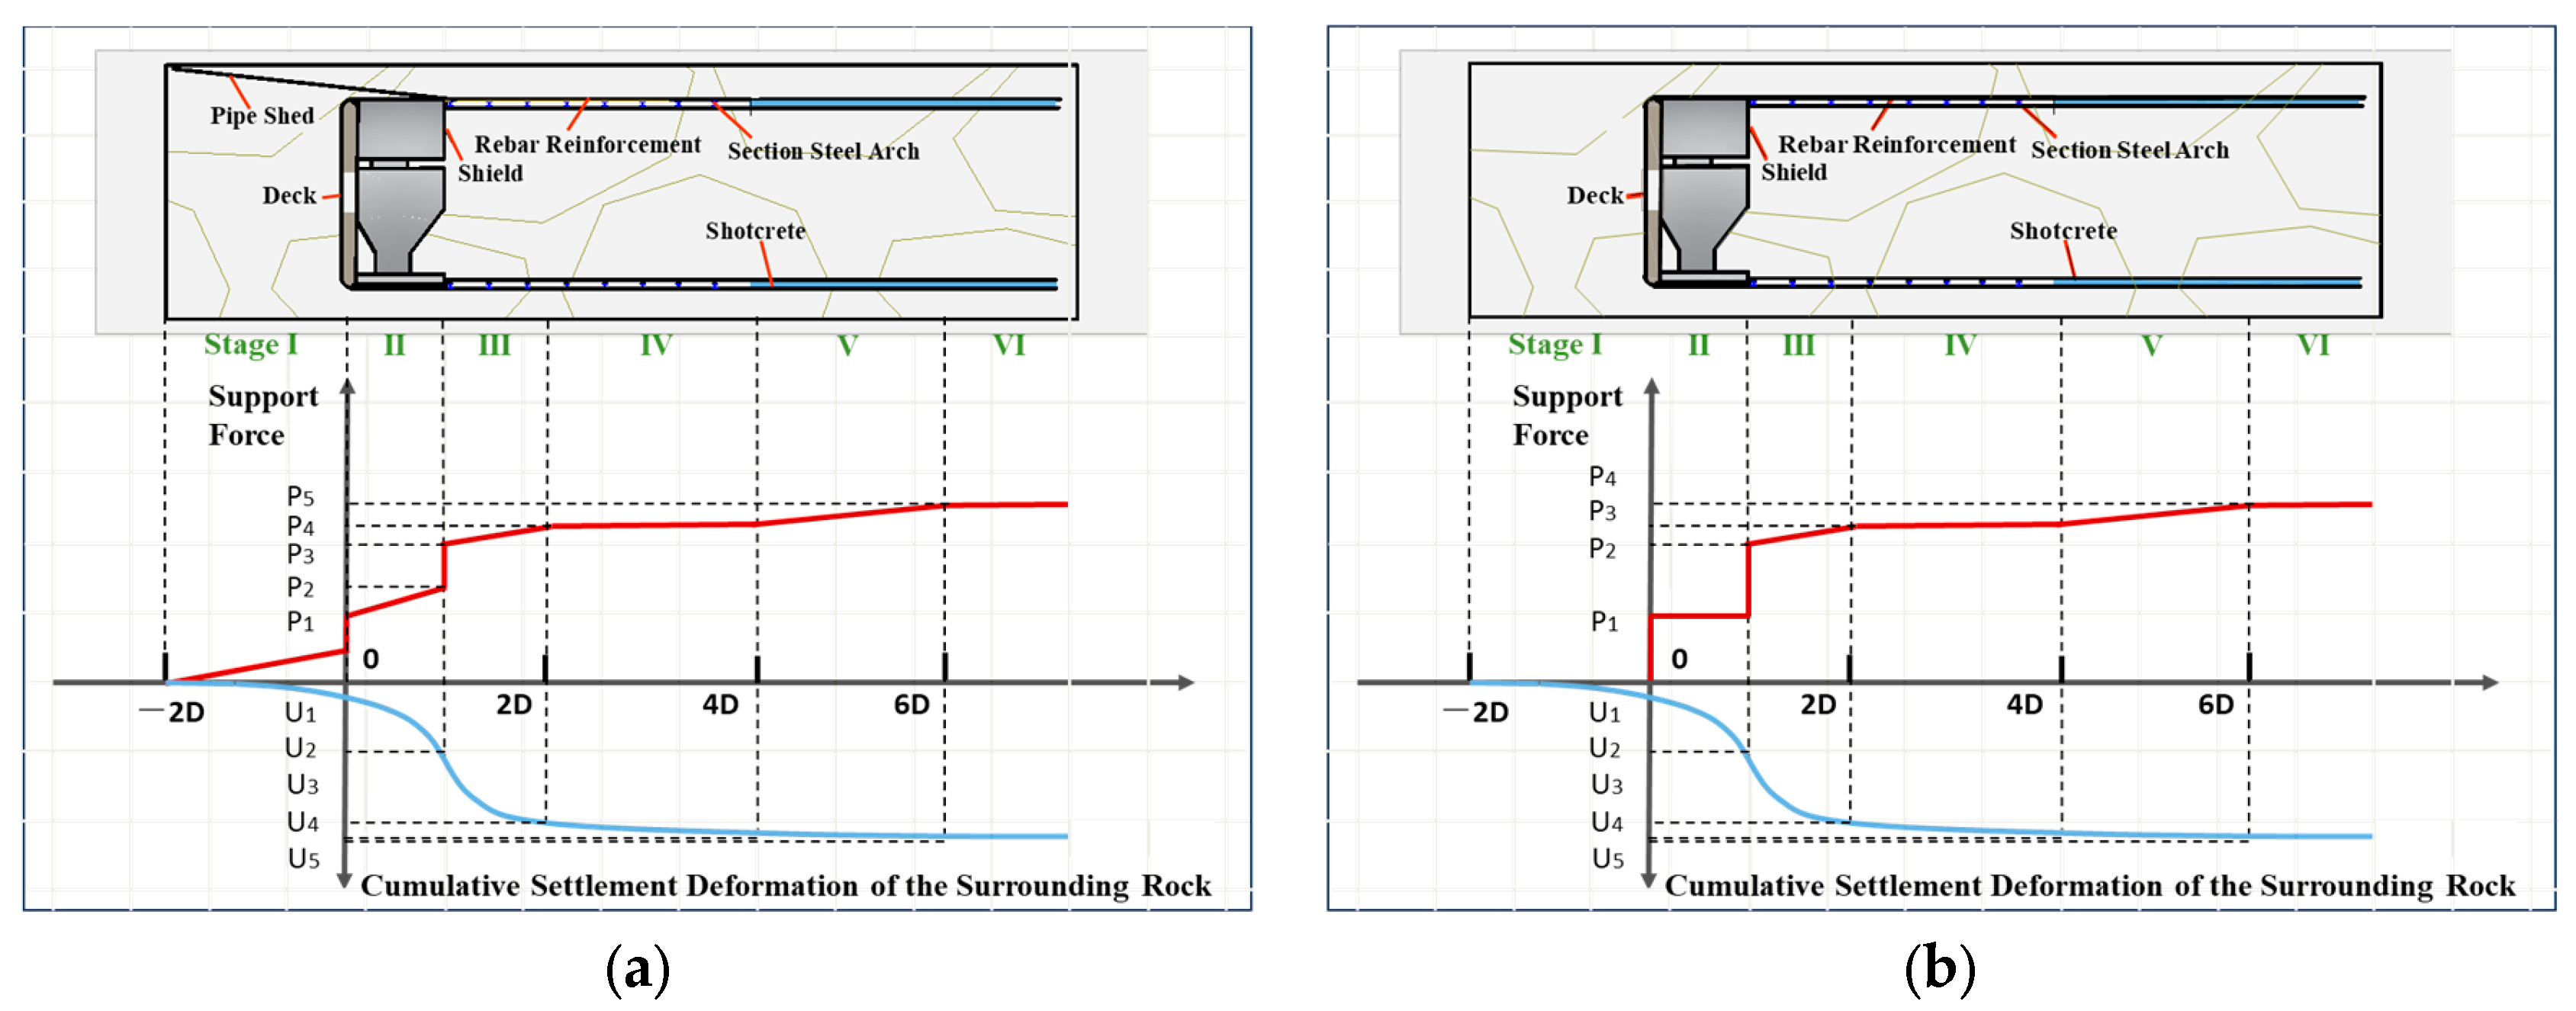
4.2.3. Division of Construction Stages
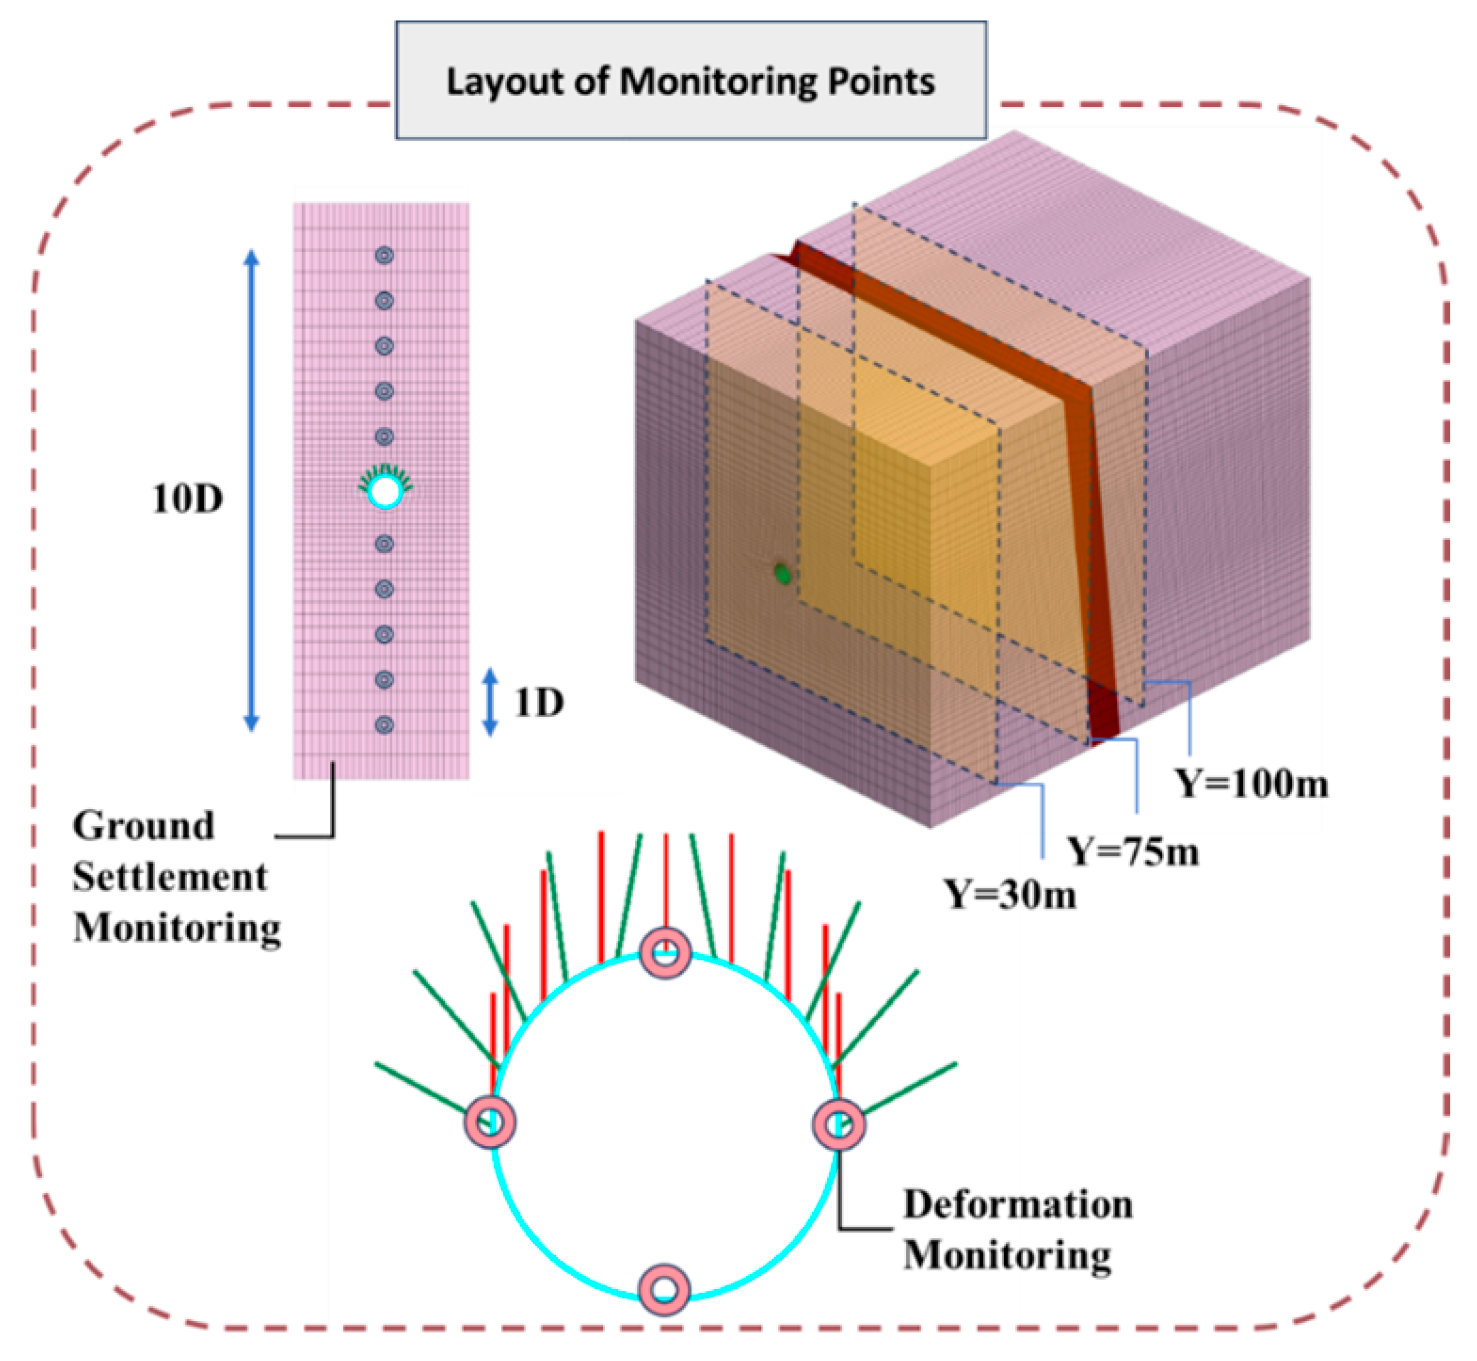
4.2.4. Arrangement of Monitoring Points
4.3. Analysis of Calculation Results
4.3.1. Study of the Distribution Pattern of Plastic Zones
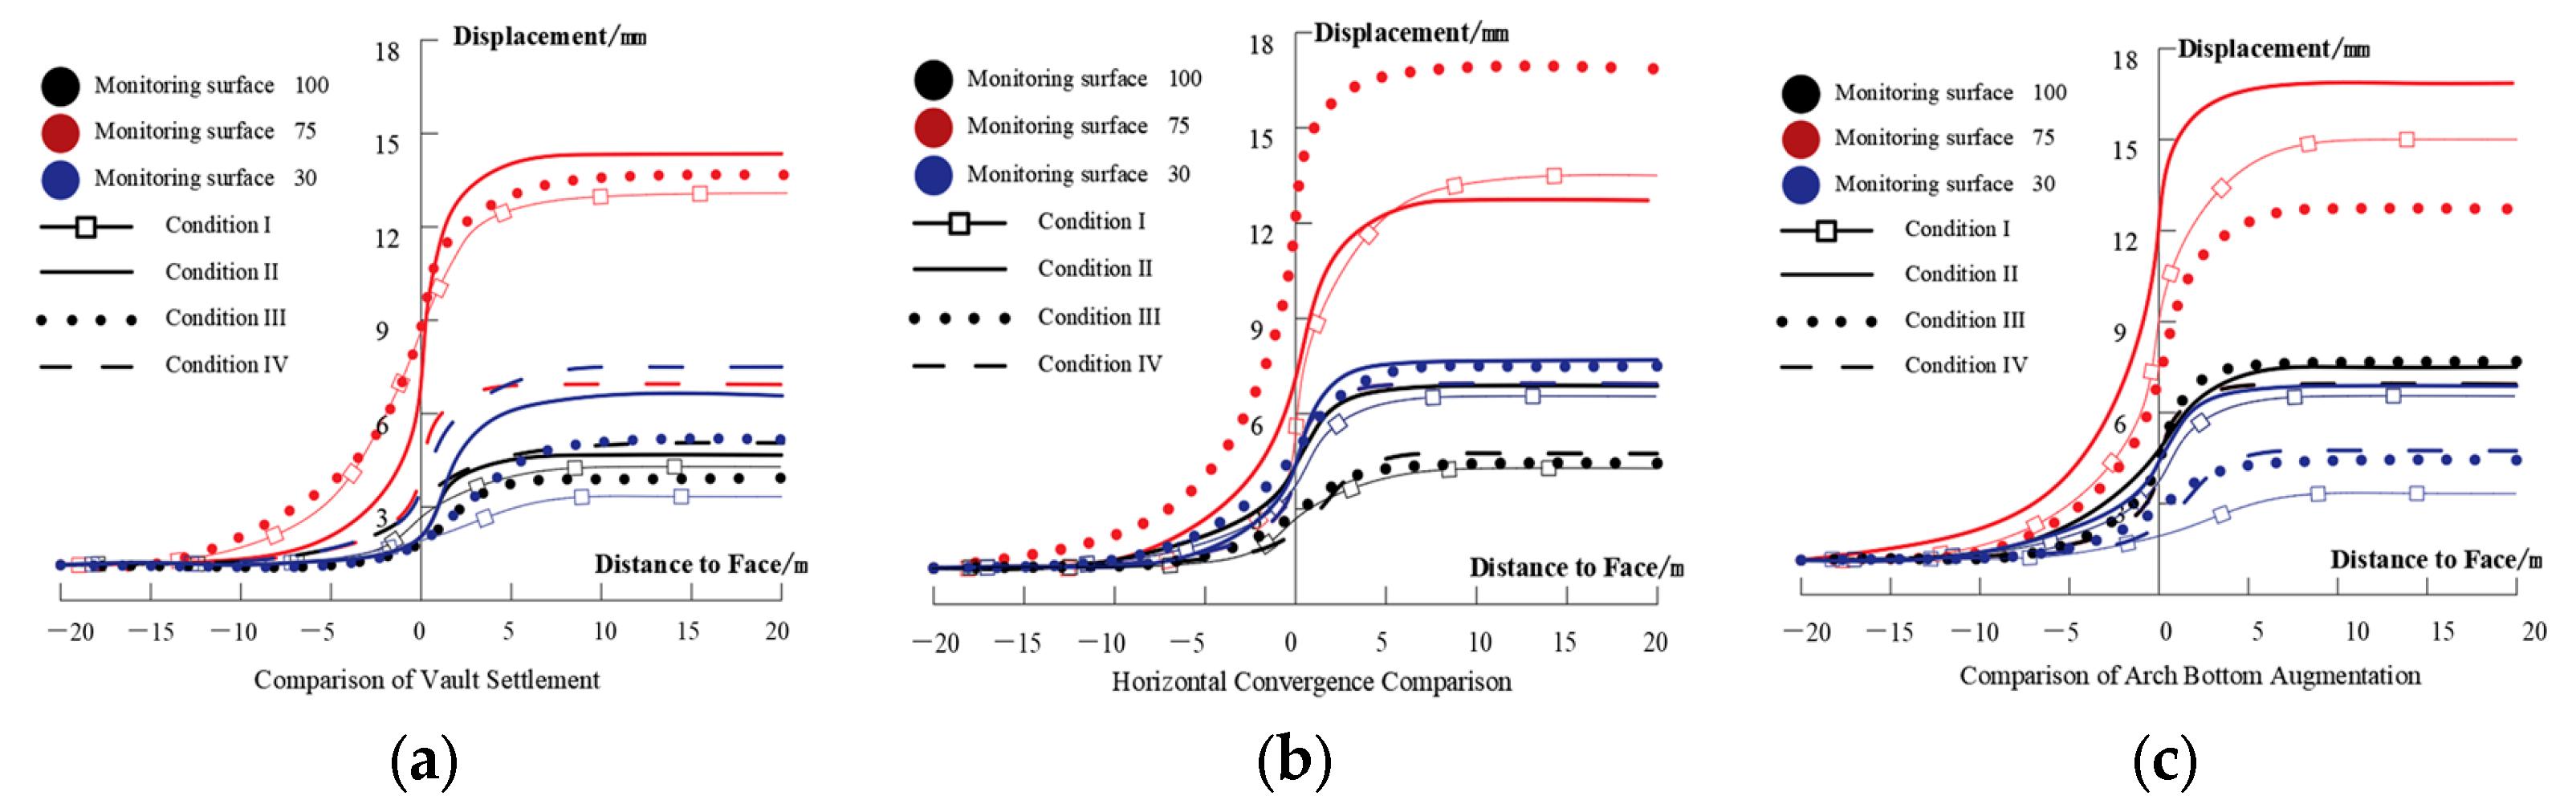
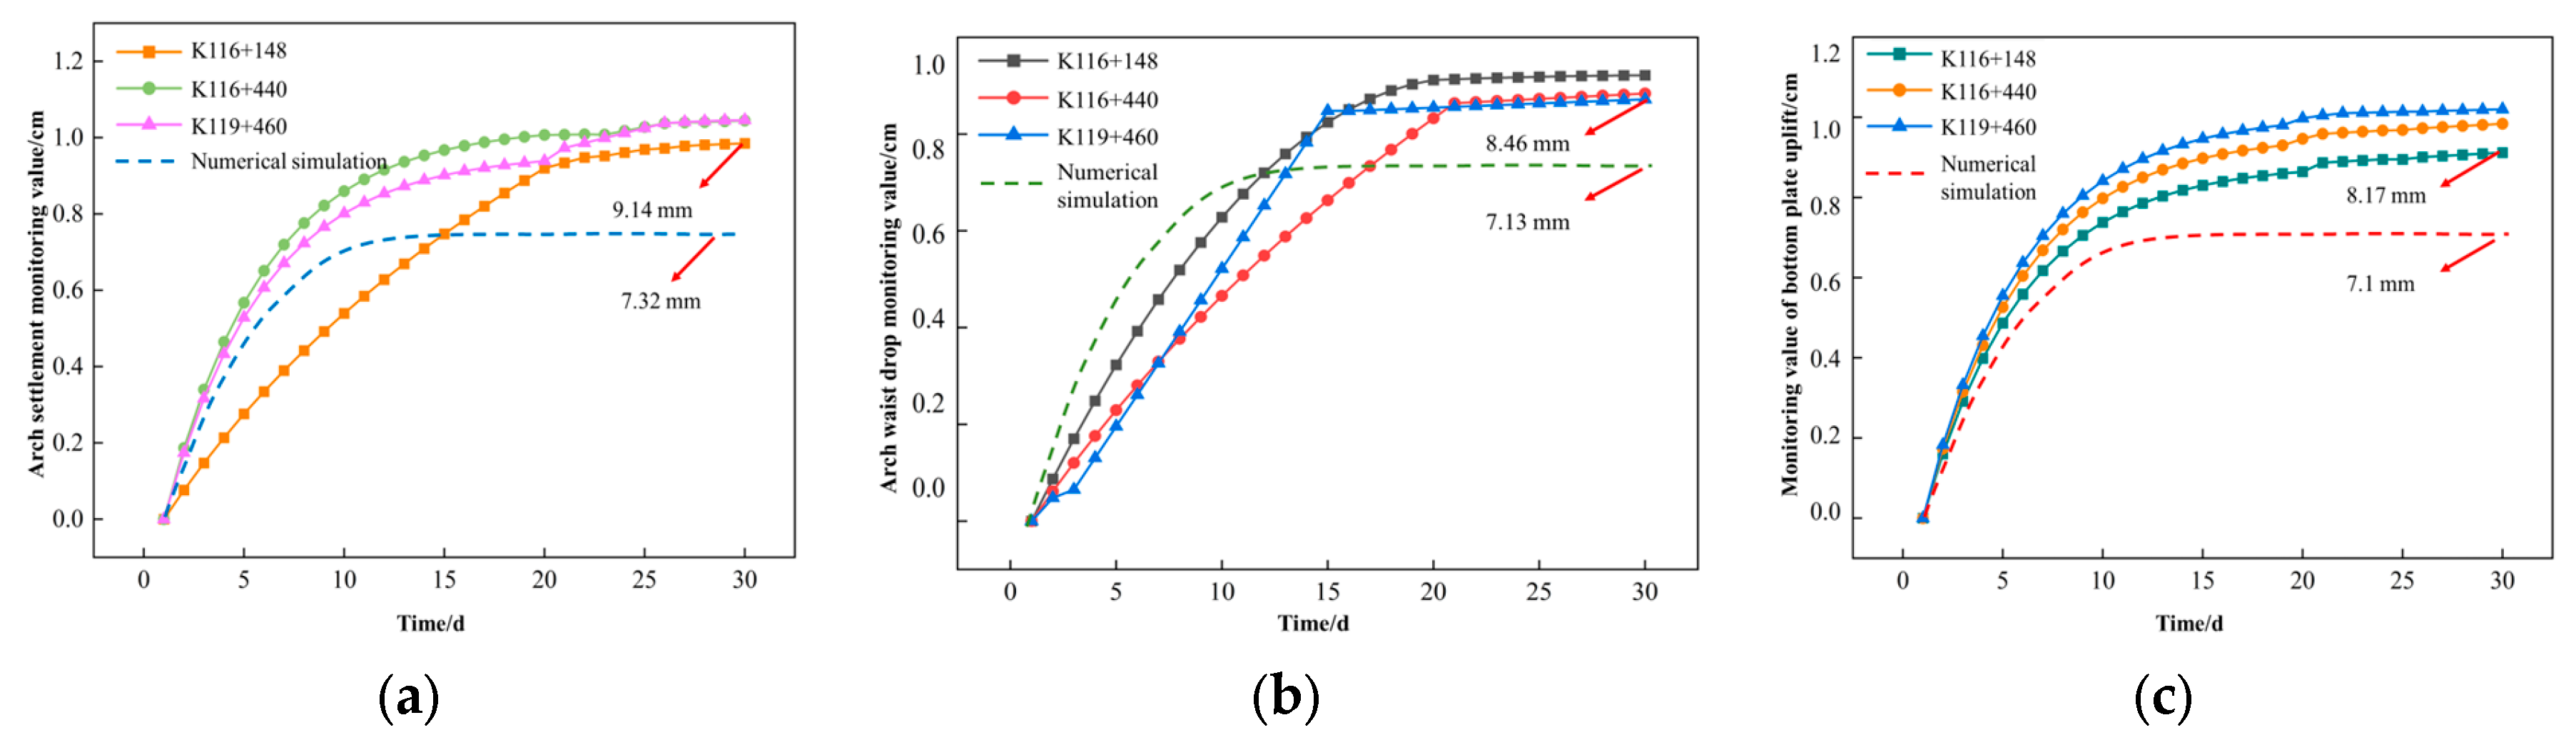
4.3.2. Analysis of Tunnel Deformation and Ground Displacement
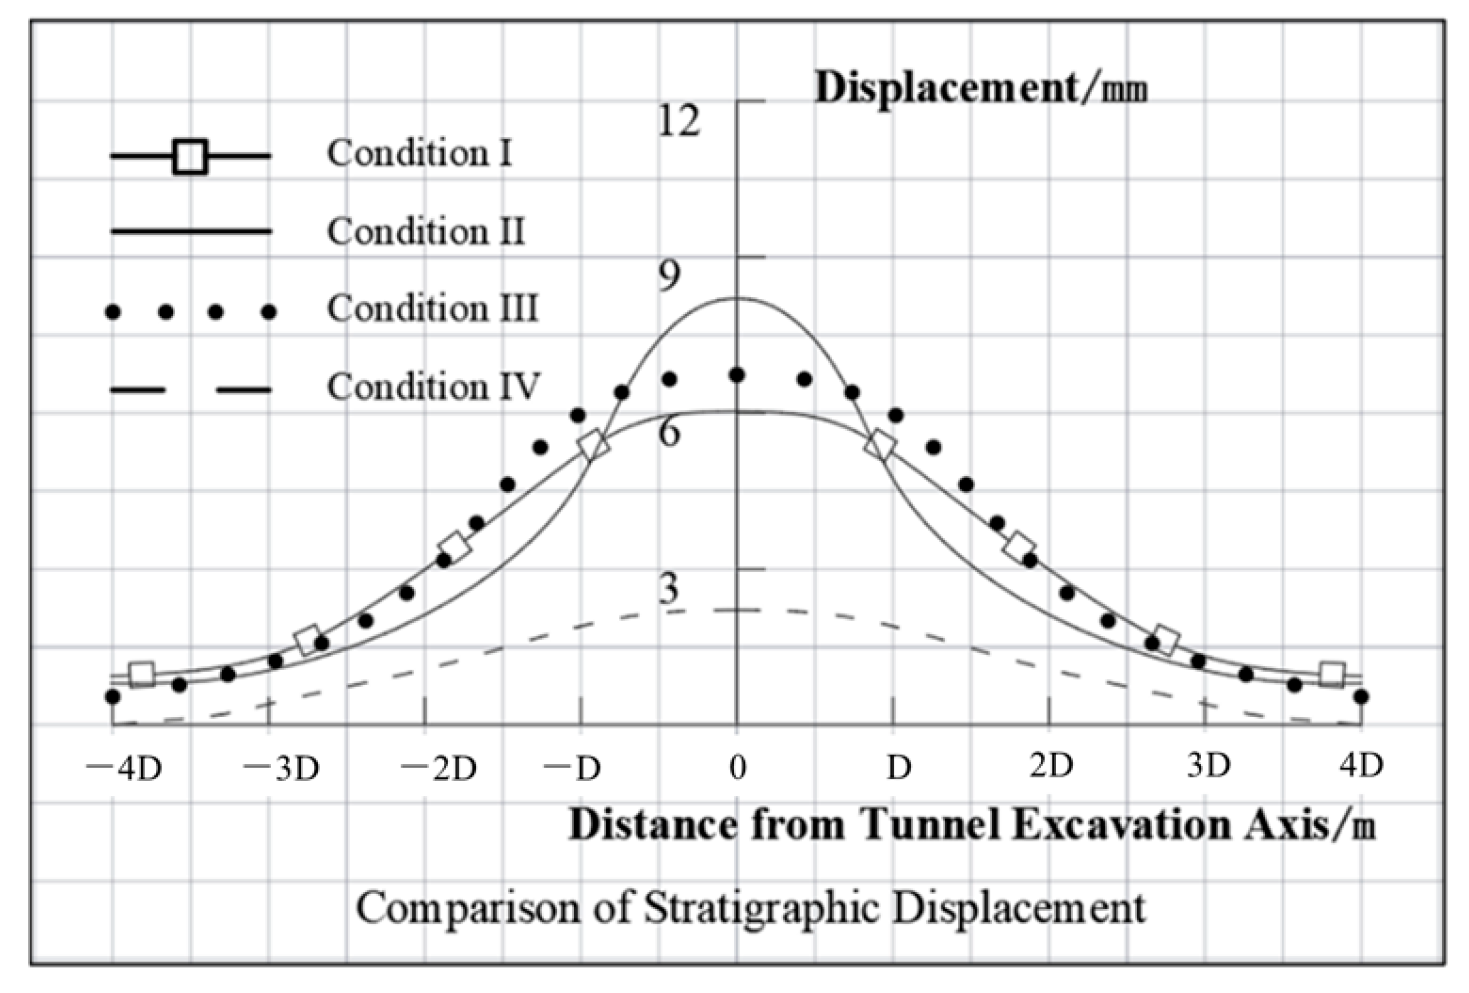
4.3.3. Analysis of Stratigraphic Displacement Patterns in Fault Fracture Zones
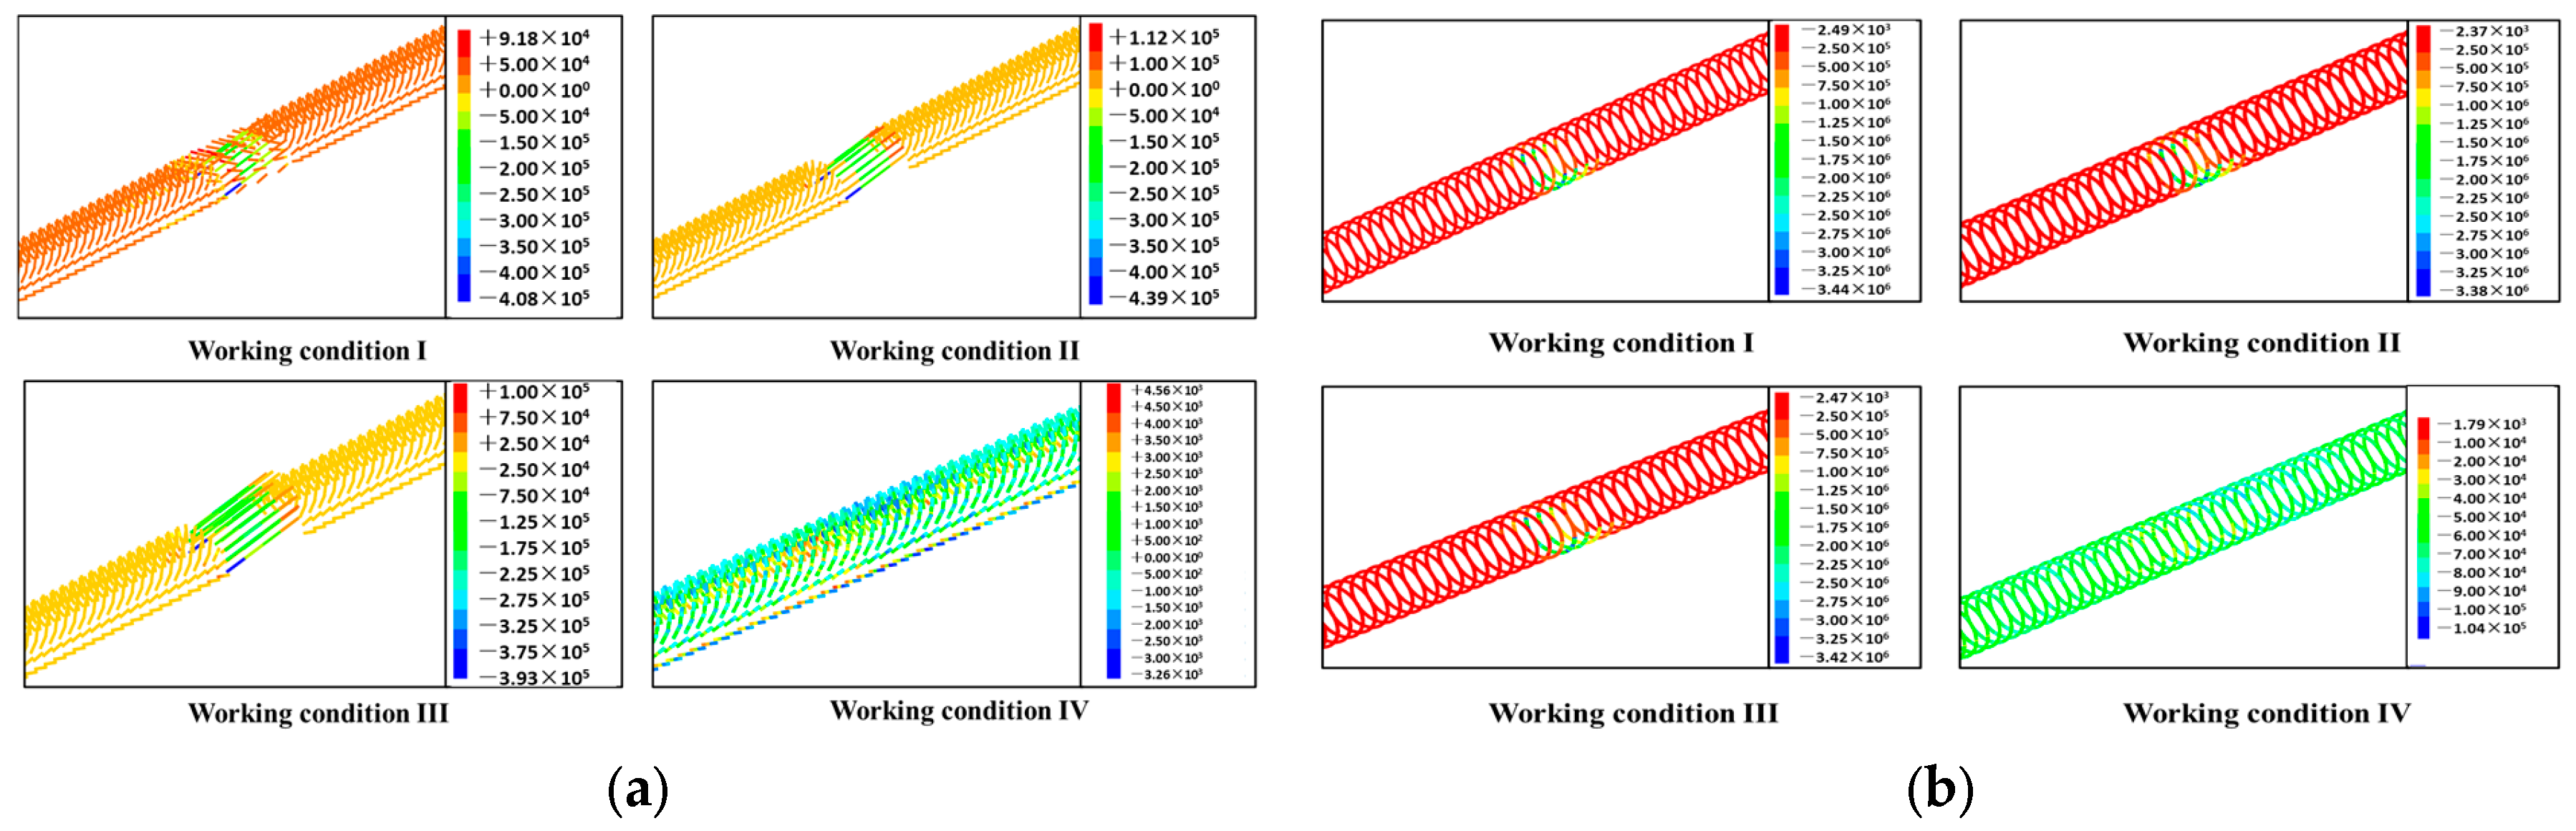
4.3.4. Support Force Analysis
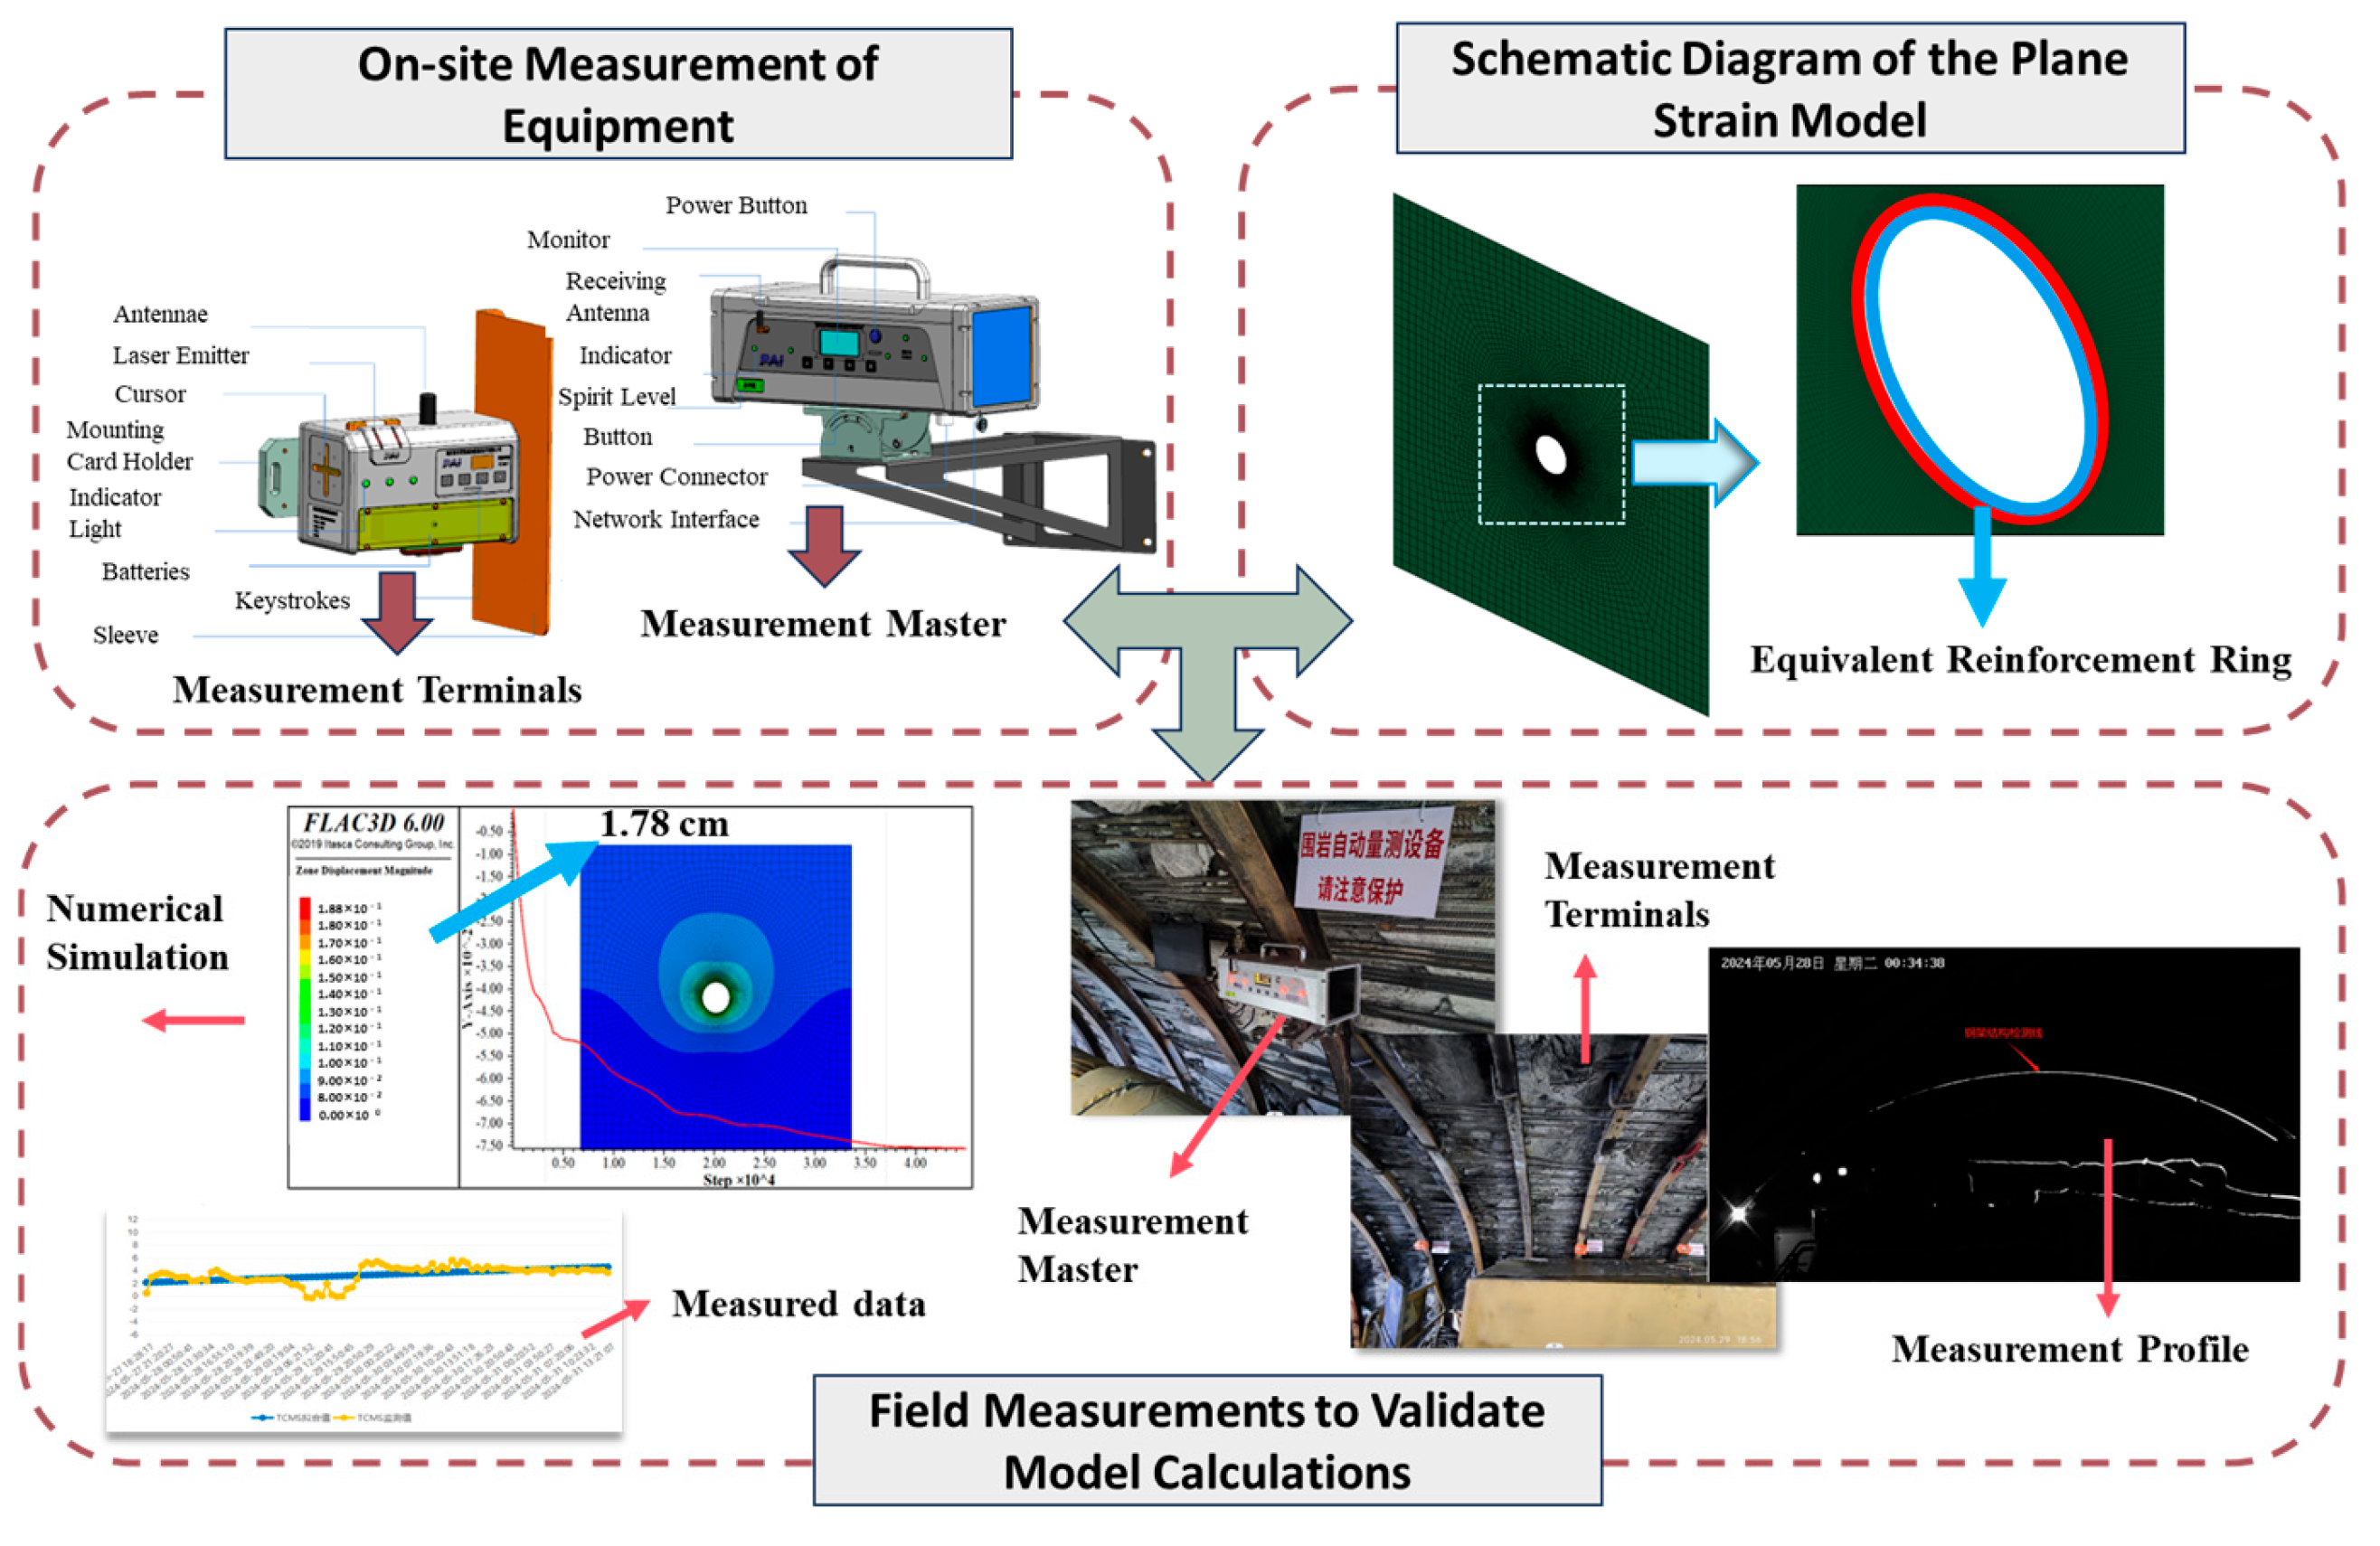
5. Field Application Cases
6. Economic Benefit Analysis of Pre-Grouting
6.1. Economic Benefits of Grouting in Pipe Shed
6.2. Economic Benefits of Surface Pre-Grouting
6.3. Economic Rationality Analysis
7. Conclusions
- (1)
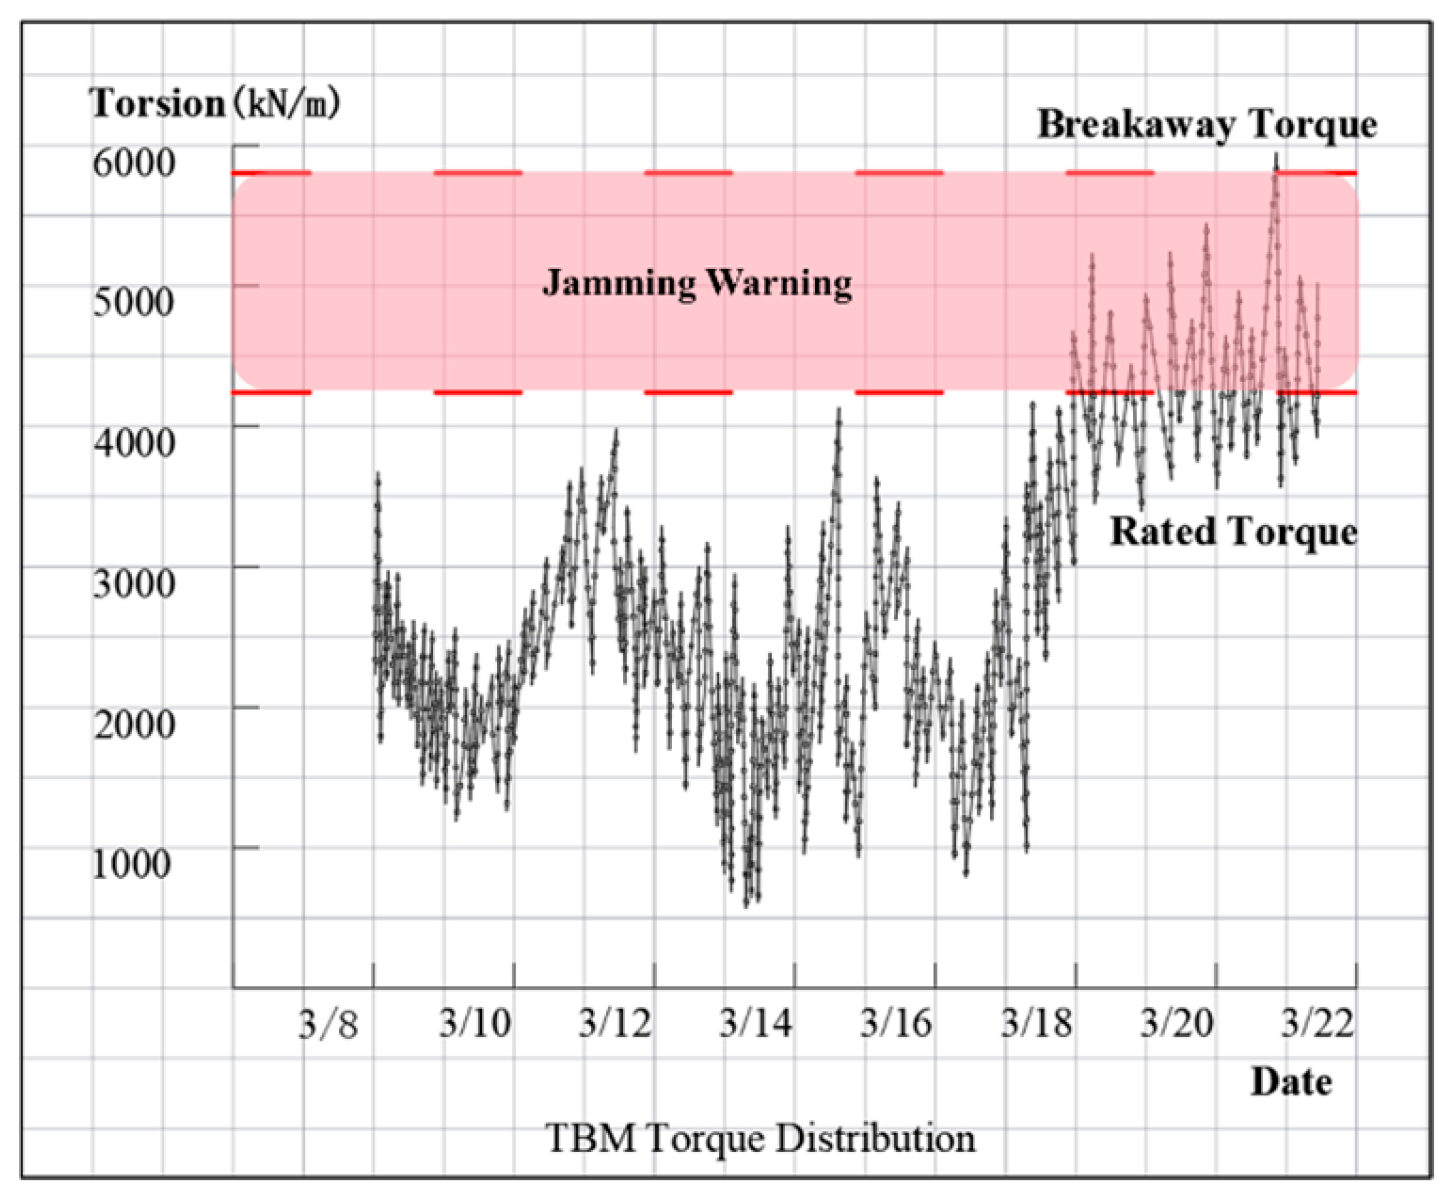
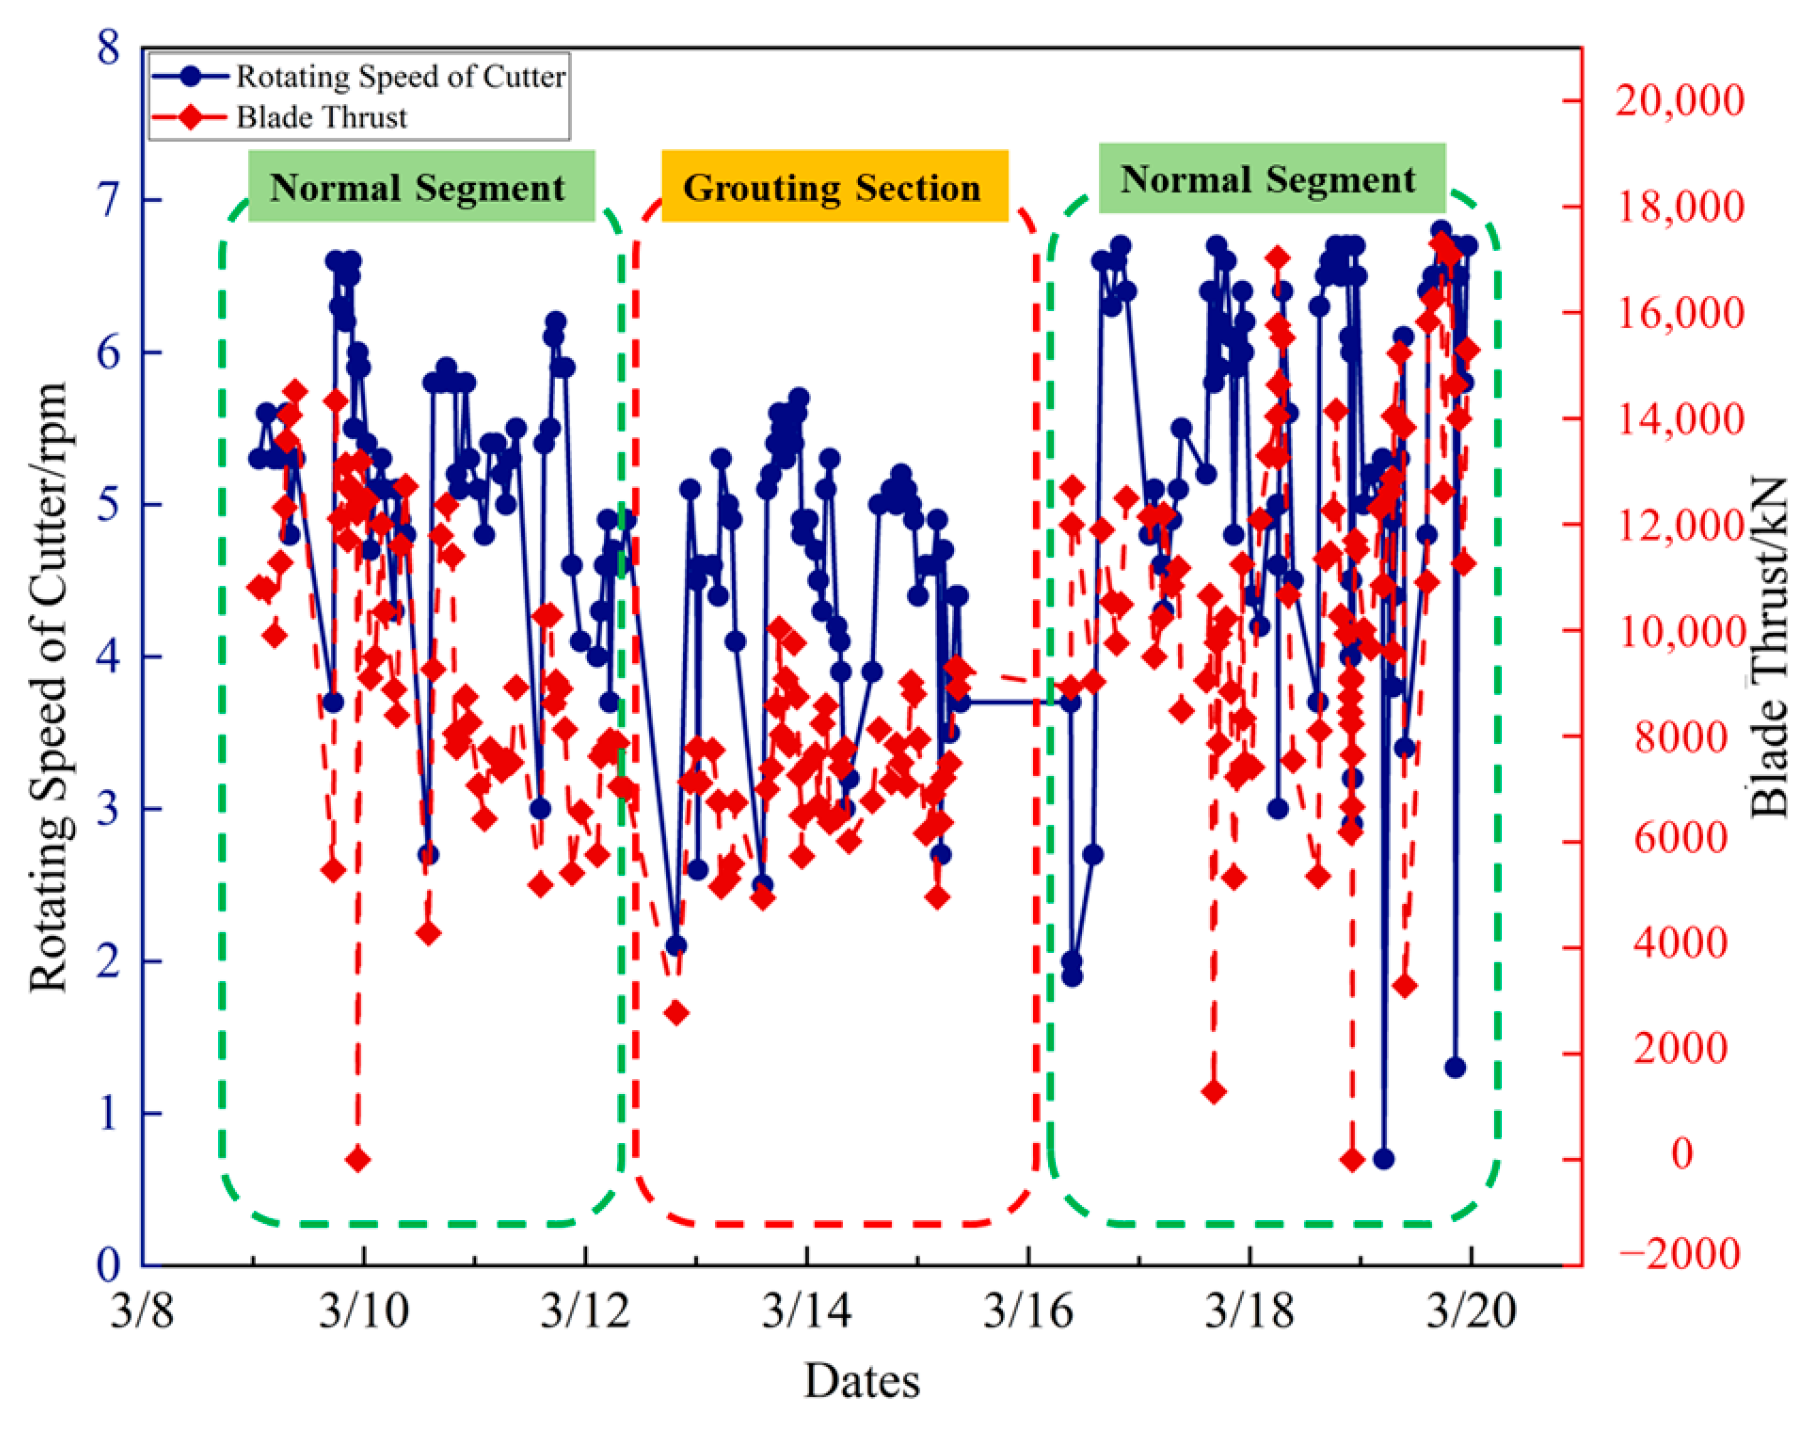
- The TBM tunnel jamming mechanism was studied, incorporating tool friction into the jamming theory. Deformation calculation before shield jamming was also analyzed, improving the efficiency of jamming detection. In working condition II (control group), it was identified that jamming occurred when passing through gullies. On-site verification showed that TBM jamming and escape took up to six months, primarily relying on manual excavation of the pilot tunnel in working condition III.
- (2)
- By analyzing the distribution of plastic zones under four working conditions, the results show that the plastic zone at the arch waist is deep, particularly under the pipe shed support conditions, where the interface between pre-grouting and soil shows significant plastic deformation. In working condition II, the plastic zone at the arch bottom expands notably. Since a single-layer pipe shed cannot effectively prevent soil collapse in the fault zone, additional support is needed to ensure smooth TBM passage. Condition I improves the support structure’s load-bearing capacity and limits fault area damage by using chemical grouting and inclined small conduits. Pre-grouting on the surface results in minimal plastic zone development, with depth significantly lower than in other conditions, indicating a strong reduction in surrounding rock disturbance. The double-layer pipe shed grouting, chemical grouting + shield tail small pipe grouting, and surface pre-grouting reduced rock deformation by 2.12%, 3.97%, and 50.78%, respectively, with surface pre-grouting showing the best results.
- (3)
- Surface pre-grouting enhances soil stability, increases strength and stiffness, reduces collapse and deformation risks, and improves soil’s physical properties and bearing capacity. This method accelerates construction, boosting efficiency and safety. Three-dimensional numerical simulations show that surface pre-grouting maintains good surrounding rock integrity, with minimal deformation and relative displacement, and effectively controls geological settlement. Therefore, it is an effective technique for fault fracture zones.
- (4)
- From an economic perspective, umbrella grouting saves approximately 6.82 million RMB in investment; however, it presents challenges such as extended construction periods, increased technical difficulty, and potential risks, particularly at greater tunnel depths where grouting quality may be compromised and the grouting process is prolonged. In contrast, surface pre-grouting allows for early ground reinforcement before the TBM reaches fault zones, ensuring smooth TBM operation and effectively preventing delays and jamming risks. Considering both economic viability and technical feasibility, surface pre-grouting proves to be more advantageous for tunnel depths of less than 70 m, as it minimizes costs, ensures construction safety, and enhances efficiency. Therefore, in tunnel construction planning and execution, the grouting method should be selected based on specific project conditions and economic considerations to achieve optimal project outcomes.
Author Contributions
Funding
Institutional Review Board Statement
Informed Consent Statement
Data Availability Statement
Conflicts of Interest
References
- Chen, Z.; Zhang, Y.; Li, J.; Li, X.; Jing, L. Diagnosing tunnel collapse sections based on TBM tunneling big data and deep learning: A case study on the Yinsong Project, China. Tunn. Undergr. Space Technol. 2021, 108, 103700. [Google Scholar] [CrossRef]
- Feng, S.; Chen, Z.; Luo, H.; Wang, S.; Zhao, Y.; Liu, L.; Ling, D.; Jing, L. Tunnel boring machines (TBM) performance prediction: A case study using big data and deep learning. Tunn. Undergr. Space Technol. 2021, 110, 103636. [Google Scholar] [CrossRef]
- Farrokh, E.; Mortazavi, A.; Shamsi, G. Evaluation of ground convergence and squeezing potential in the TBM driven Ghomroud tunnel project. Tunn. Undergr. Space Technol. 2006, 21, 504–510. [Google Scholar] [CrossRef]
- Liu, C.; Cui, J.; Zhang, Z.; Liu, H.; Huang, X.; Zhang, C. The role of TBM asymmetric tail-grouting on surface settlement in coarse-grained soils of urban area: Field tests and FEA modelling. Tunn. Undergr. Space Technol. 2021, 111, 103857. [Google Scholar] [CrossRef]
- Zhang, Q.; Zhang, X.P.; Liu, Q.; Chi, J.; Qiu, J. Microseismic characteristic and development mechanism of fault-slip rockburst in a deep-buried TBM excavated tunnel: A case study. Tunn. Undergr. Space Technol. 2023, 142, 105451. [Google Scholar] [CrossRef]
- Deng, S.; Li, J.; Jiang, H.; Wang, M. Experimental and theoretical study of the fault slip events of rock masses around underground tunnels induced by external disturbances. Eng. Geol. 2018, 233, 191–199. [Google Scholar] [CrossRef]
- Cui, G.; Ke, X. Rescue technology of the jamming accident for the double-shield TBM in complex geological conditions: A case study. Alex. Eng. J. 2023, 79, 374–389. [Google Scholar] [CrossRef]
- Lin, P.; Yu, T.; Xu, Z.; Shao, R.; Wang, W. Geochemical, mineralogical, and microstructural characteristics of fault rocks and their impact on TBM jamming: A case study. Bull. Eng. Geol. Environ. 2022, 81, 64. [Google Scholar] [CrossRef]
- Xu, Z.H.; Wang, W.Y.; Lin, P.; Nie, L.; Wu, J.; Li, Z. Hard-rock TBM jamming subject to adverse geological conditions: Influencing factor, hazard mode and a case study of Gaoligongshan Tunnel. Tunn. Undergr. Space Technol. 2021, 108, 103683. [Google Scholar] [CrossRef]
- Xue, X.; Zhang, K.; Ma, B.; Xiao, F.; Jiang, T. Numerical simulating of pre-grouting in multi-jointed rock mass in deep coalmine roadway excavated via TBM. Comput. Geotech. 2023, 154, 105166. [Google Scholar] [CrossRef]
- Cai, M. Influence of stress path on tunnel excavation response-Numerical tool selection and modeling strategy. Tunn. Undergr. Space Technol. 2008, 23, 618–628. [Google Scholar] [CrossRef]
- De Dreuzy, J.R.; Méheust, Y.; Pichot, G. Influence of fracture scale heterogeneity on the flow properties of three-dimensional discrete fracture networks (DFN). J. Geophys. Res. Solid Earth 2012, 117. [Google Scholar] [CrossRef]
- Zhu, D.; Zhu, Z.; Zhang, C.; Dai, L.; Wang, B. Numerical Simulation of Surrounding Rock Deformation and Grouting Reinforcement of Cross-Fault Tunnel under Different Excavation Methods. Comput. Model. Eng. Sci 2024, 138, 2445–2470. [Google Scholar] [CrossRef]
- Zhao, J.; Bo, L.; Juntao, C.; Ning, J. Mechanism of seepage-stress fault water inrush and grouting seal. Arab. J. Geosci. 2020, 13, 404. [Google Scholar] [CrossRef]
- Wei, Z.; Zhu, Y. Seepage in Water-Rich Loess Tunnel Excavating Process and Grouting Control Effect. Geofluids 2021, 2021, 5597845. [Google Scholar] [CrossRef]
- Li, G.; Ma, W.; Tian, S.; Hongbo, Z.; Huabin, F.; Zou, W. Groundwater inrush control and parameters optimization of curtain grouting reinforcement for the **gzhai tunnel. Geofluids 2021, 2021, 6634513. [Google Scholar]
- Zhai, X.; Bi, Y.; Hu, R.; Jiwen, W.; Hao, H. Surface pre-grouting borehole arrangement and division of the broken roof of the lower seam of a bifurcated coal seam. Energy Explor. Exploit. 2023, 41, 802–820. [Google Scholar] [CrossRef]
- Qian, D.; Zhang, N.; Zhang, M.; Shimada, H.; Cao, P.; Chen, Y.; Wen, K.; Yang, S.; Zhang, N. Application and evaluation of ground surface pre-grouting reinforcement for an 800-m-deep underground opening through large fault zones. Arab. J. Geosci. 2017, 10, 285. [Google Scholar] [CrossRef]
- Liu, Q.; Pan, Y.; Liu, J.; Kong, X.; Shi, K. Comparison and discussion on fragmentation behavior of soft rock in multi-indentation tests by a single TBM disc cutter. Tunn. Undergr. Space Technol. 2016, 57, 151–161. [Google Scholar] [CrossRef]
- Zhao, K.; Janutolo, M.; Barla, G. A completely 3D model for the simulation of mechanized tunnel excavation. Rock Mech. Rock Eng. 2012, 45, 475–497. [Google Scholar] [CrossRef]
- Ramoni, M.; Anagnostou, G. Thrust force requirements for TBMs in squeezing ground. Tunn. Undergr. Space Technol. 2010, 25, 433e55. [Google Scholar] [CrossRef]
- Wen, S.; Yang, S.; Dong, Z.; Zhao, L. Research on the Mechanism and Control Measures of TBM Jamming in Deep Buried Tunnels. J. Geotech. Eng. 2015, 37, 1271–1277. [Google Scholar]


| Name | Gully Alignment | Lithology | Compressive Strength of Rock (MPa) | Gully Area (m2) | Crossing Length with Tunnel (m) |
|---|---|---|---|---|---|
| Gully 2 | 116 + 158–119 + 495 | Granitic Gneiss | 5–65 | 27.3 | 54 |
| Gully 3 | 119 + 495–119 + 769 | Granitic Gneiss | 5–60 | 15.8 | 140 |
| Gully 4 | 119 + 769–120 + 427 | Granite | 5–51 | 21.3 | 130 |
| Pipe Shelter Grouting | Case I | Reinforcement depth | Grouting Pipe Diameter | Spacing | Note |
| Shallow hole chemical grouting on palm face | 5 m | 40 mm | / | ||
| Deep pipe shed grouting | 20 m | 100 mm | 60 cm | Vault 120 degrees | |
| Shield tail small conduit grouting | 5 m | 40 mm | 1.2 m | Vault 150 degrees | |
| Case II (control group) | Reinforcement depth | Diffusion Radius | Spacing | Note | |
| Pipe Shelter Grouting | 20 m | 0.6 m | 60 cm | Vault 120 degrees | |
| Case III | Number of layers of pipe scaffolding | Diffusion Radius | Spacing | Note | |
| Hand-expanded double-layer pipe shed | 2-story | 0.6 m | 60 cm | Vault 120 degrees | |
| Surface Grouting | Case IV | Reinforcement area (H × L × W) | Grouting Pipe Diameter | spacing | diffusion radius |
| Surface pre-grouting | 16 m × 60 m × 22 m | 90 mm | 1 m | 0.65 m |
| Geologic Situation | Weight Capacity γ (kN/m3) | Modulus of Elasticity E (GPa) | Cohesion (MPa) | Friction Angle ψ (°) | Tensile Strength (MPa) | Poisson Ratio |
|---|---|---|---|---|---|---|
| Geologic fault | 19.30 | 1.30 | 0.30 | 25.00 | 1.92 | 0.31 |
| Gully II | 23.50 | 1.67 | 0.37 | 30.00 | 2.21 | 0.32 |
| Structural Component | Strength Grade | Weight Capacity γ (kN/m3) | Modulus of Elasticity (GPa) | Poisson Ratio |
|---|---|---|---|---|
| Mix by Spraying | C30 concrete | 25.00 | 30.00 | 0.25 |
| Anchor | Q235 | 78.50 | 210.00 | 0.30 |
| Steel arch | Q235 | 78.50 | 210.00 | 0.30 |
| Cement paste | C25 | 22.00 | 25.00 | 0.20 |
| Name | Gully Mileage | Crossing Length with Tunnel/m | Tunnel Depth/m | Lithology | Rock Compressive Strength/MPa | Note |
|---|---|---|---|---|---|---|
| SY-II | K116 + 148 | 108 | 72 | granite gneiss | 5–51 | Test I |
| SY-II | K116 + 440 | 54 | 68 | granite gneiss | 5–65 | Test II |
| SY-II | K119 + 460 | 140 | 76 | granite gneiss | 5–60 | Test III |
| Project | Unit | Quantity/Quantity of Works | Total Price/10,000 RMB |
|---|---|---|---|
| Drill depth | m | 14,580 | 29.2 |
| Cement paste | m3 | 132.3 | 75.4 |
| Drilling and injection integrated machine | 4 | 260.32 | |
| Number of boreholes | 486 | 21.87 | |
| Grouting pipe | 486 | 5.23 | |
| Total | 392.02 |
| Project | Quantity of Work | Unit Price/RMB | Total Price/10,000 RMB |
|---|---|---|---|
| Surface cleaning | 6576/m3 | 5.3 | 3.5 |
| Deep drilling | 45,055/m | 110 | 495.6 |
| Cement paste | 4546/m3 | 950 | 431.9 |
| Bushing | 212 | 13.2 | |
| Drilling machine | 325,700 | 130.28 | |
| Total | 1074.48 |
Disclaimer/Publisher’s Note: The statements, opinions and data contained in all publications are solely those of the individual author(s) and contributor(s) and not of MDPI and/or the editor(s). MDPI and/or the editor(s) disclaim responsibility for any injury to people or property resulting from any ideas, methods, instructions or products referred to in the content. |
© 2025 by the authors. Licensee MDPI, Basel, Switzerland. This article is an open access article distributed under the terms and conditions of the Creative Commons Attribution (CC BY) license (https://creativecommons.org/licenses/by/4.0/).
Share and Cite
Li, Y.; Li, Q.; Tan, Z.; Li, L.; Zhang, B. Determining a Suitable Reinforcement Strategy for TBM Advance in a Gully Fault Zone Without Jamming—A Numerical Analysis. Appl. Sci. 2025, 15, 2258. https://doi.org/10.3390/app15052258
Li Y, Li Q, Tan Z, Li L, Zhang B. Determining a Suitable Reinforcement Strategy for TBM Advance in a Gully Fault Zone Without Jamming—A Numerical Analysis. Applied Sciences. 2025; 15(5):2258. https://doi.org/10.3390/app15052258
Chicago/Turabian StyleLi, Yuanzhuo, Qinglou Li, Zhongsheng Tan, Linfeng Li, and Baojin Zhang. 2025. "Determining a Suitable Reinforcement Strategy for TBM Advance in a Gully Fault Zone Without Jamming—A Numerical Analysis" Applied Sciences 15, no. 5: 2258. https://doi.org/10.3390/app15052258
APA StyleLi, Y., Li, Q., Tan, Z., Li, L., & Zhang, B. (2025). Determining a Suitable Reinforcement Strategy for TBM Advance in a Gully Fault Zone Without Jamming—A Numerical Analysis. Applied Sciences, 15(5), 2258. https://doi.org/10.3390/app15052258