Abstract
This paper deals with one of the methods for protecting against an electrostatic charge by using a conductive coating. We focus on methyl-silicone resin with the addition of a conductive polymer. The individual electrical parameters of these coatings are studied because these parameters determine the ability of charge leakage. The purpose of this study was to find out if the coating would change its electrical parameters after some time and if the antistatic protection purpose of the coating would deteriorate. We used the dielectric spectroscopy method for the measurements. This method was chosen because conductive polymers are basically semiconductors, and the insulation parameters were measured by this method. After aging, another set of measurements was made, and the results were compared. We found that the electrical parameters of the antistatic coating were considerably changed by the aging process. The reliability of antistatic paints was proven in these experiments. The paints presented had high values of conductivity in general, and after our experiments, the most reliable conductive paintings appeared to be the ones with the PANI polymer. For reliable electrostatic charge elimination on non-conductive surfaces, the BISIL paint proved to be the best choice. Our experiments also proved the influence of the underlying surface material on the electrical parameters of the paintings. Furthermore, we proved that the aging process influenced the loss factor of the paintings.
1. Introduction
One of the protection methods against an electrostatic charge is the usage of conductive coatings. Methyl-silicone resin, with the addition of a conductive polymer, is one such material that is suitable for this type of coating. Individual electrical parameters need to be studied on these coatings because these parameters determine the charge leakage ability. The focus of this study was to find out if the coating would change its electrical parameters after some time and if the antistatic protection purpose of the coating would deteriorate. For our study, we chose coatings based on a single-component paint, which was dissolved in xylene. Xylene is a solvent used for methyl-silicone resin in which white titanium pigment is added. We chose coating samples that had been spread on both the conductive and insulation materials.
Conductive polymers (CPs), sometimes referred to as organic semiconductors, have a wide range of potential applications due to their properties; therefore, there is a high interest of scientific teams around the world. They are recommended as alternative materials for a wide range of practical applications [1,2,3,4,5,6,7]. These materials have a possibility of changing their specific electrical conductivity from values typical of insulators to values typical of metallic materials. Thus, a combination of electrical properties typical to semiconductors with material properties that allow for easy processing provides many advantages. Not only can the structure of these materials be changed but also their physical properties are modified according to the external environment. Therefore, they are sometimes referred to as smart materials [1,8]. Unlike traditional polymers, CPs show so-called intrinsic electrical conductivity.
Examples of such known CPs are polyacetylene (PA), polypyrrole (PPy), polythiophene (PTs), polyaniline (PANI), polyphenylene (PPE), or poly(p-phenylenevinylene) (PPV), poly(p-phenylenediamine) (PPDA), etc. [9,10]. The simplest CP in terms of structure is polyacetylene PA, whose conductivity by iodine vapor is increased very significantly (up to 5 × 10³ S·m−1). However, this material is not very suitable for technological applications due to its low stability in case of contact with air [3]. Therefore, attention has been paid to more stable CPs since the late 1980s, especially polyaniline PANI and polypyrrole PPy [1]. PANI and PPy belong to p-type semiconducting polymers with relatively high conductivity and environmental and chemical stability in acidic environments. Its synthesis in the forms of powder, film, and composite materials is easily reproducible [11,12,13,14,15,16]. If an inorganic or organic acid is used as the proton donor, the specific conductivity of these materials increases in the range of eight to ten orders of magnitude [9,17].
The electric conductivity of these conductive polymer materials is based on the regular alternation of single and double bonds, i.e., by conjugation and by the presence of charge carriers. Carriers are created by a process analogous to conventional semiconductors called doping, while the increase or optimization of conductivity can also be achieved by doping [1,9,17]. The nature of the dopant affects not only the electrical, mechanical, and physical but also the morphological properties of the polymer. The conductivity of these substances varies within the range from ×10−4 to ×10 S·m−1 [1,9]. Another common feature of CPs is their electrical activity and the possibility of their existence in several stable oxidation states. The transition between these oxidation states is generally possible, which results in changes in the electrical, mechanical, chemical, and morphological properties of the material [18,19].
The application areas for conductive polymer materials lie in the variability of the CP properties, allowing them to be used in a wide range of applications. Conventional conductive composites consist of a non-conductive polymer matrix in which a conductive component—carbon black, graphite, or carbon fibers—is dispersed. This also includes the use of anti-corrosion coatings [8,20]. CPs, in which electrical conductivity is considered as the main property, are used to produce, e.g., electrostatic and conductive materials [21,22,23,24,25,26] and a wide variety of other applications [27,28,29,30,31,32].
The salts of polyaniline (PAN) and polypyrrole (PPY) have found their important application in anticorrosive paints [33,34,35,36,37,38,39,40,41,42]. The application of paints containing corrosion-inhibiting pigments, which fundamentally and directly affect the properties of protective coatings, is one of the ways to protect these metallic materials [43]. Powdered CP salts, when applied to paints, cause problems with the stability of the paint in the liquid state. It is necessary to ensure the efficient dispersion and stabilization of the CP powders in the binder and the coating film. The coating then has a lower resistance to osmotic blisters or lower adhesion in high humidity environments, high cost, etc. [44]. For applications in paints and organic coatings, whether electrically conductive, anticorrosive, antistatic, or antimicrobial, among others, it is, therefore, more advantageous to apply CPs as a layer deposited on a suitable inorganic pigment particle. The pigment particles, in this case, serve as a CP carrier, ensuring its even distribution in the coating film. Thus, the pigment coating—CP [45]—is particularly active. Chemically inert materials such as TiO2, various silicates, pigments of mineral origin (kaolin), or particles based on conductive C-graphite, C nanotubes, etc., are most used as pigments, which are treated with different types of CPs [46]. Coating the particles of chemically and/or anticorrosive active pigments (AP) of a semiconducting nature with CPs, for example, with polyaniline phosphate, allows us to obtain a pigment with synergistic properties of the two materials used (AP/PANI salt). The particles of the resulting CP-coated pigments should exhibit conductive polymer properties, higher electrical conductivity due to active protection of the metal substrate in electrochemical corrosion of metals, and, at the same time, anticorrosive activity in organic coatings when exposed to acidic corrosive substances and passivating the metal surface [47].
The main objective of this research was to investigate how the electrical properties of coatings with different admixtures change during the aging process. We assumed that the electrical properties would deteriorate after the aging process. The main role of coatings is to protect metallic materials against corrosion. Conventional coatings have low conductivity, and this causes a problem for devices where surface charge collects, as this charge is not reliably conducted to ground. For such cases, special coatings are used that have a higher conductivity. The electrical properties of such materials change during aging, and various parameters affect them. In normal practice, coatings are exposed to different weather conditions. Dry and warm weather prevails in summer, and cold and wet weather prevails in winter. Our measurements were carried out in the winter period, so the samples were placed outdoors under realistic conditions. The summer period was simulated in a dryer where we had a constant temperature and low humidity. We assumed that the conductivity of the coatings would decrease in both cases and our goal was to find out how. Another assumption was that dry and warm weather would significantly degrade conductivity compared to wet and cold weather. We proved this assumption.
2. Materials and Methods
Several paint samples were prepared on different surfaces. Initial measurements were made on all samples in order to determine the electrical properties of these materials before aging. The dielectric spectroscopy method was used to measure the electrical properties. Conductive polymers are semiconductors, and the insulation parameters were measured by this method, making the first set of measurements by the Keithley 6517B electrometer, and we measured the charge and discharge current. Then, the capacitance measurement and the loss factor measurement were made by the IDAX-300 insulation diagnostic analyzer (Megger Ltd., Markham, ON, Canada) and Agilent E4980A precision LCR meter (Agilent, Santa Clara, CA, USA) at different frequencies.
Subsequently, a part of the samples was exposed to an aging process in a dry and warm environment, and the rest of the samples were placed and aged in a cold and wet environment. After a specific time, we made electrical property measurements on the coating samples again. After aging, another set of measurements was made, and the results were compared.
2.1. Material Type for Measurement
The aim of the experimental part of our work was to test experimentally prepared paints based on solvent-type silicone acrylate binder containing CaTiO3 (calcium titanate) and TiO2 (titanium dioxide) pigments coated with a layer of CPs based on PANI and PPY salt by chemical oxidative polymerization in terms of their electrical conductivity. The electrical properties of the formed protective coatings were compared with a protective coating without active pigments, which contained only an uncoated neutral limestone filler CaCO3 (calcium carbonate).
We focused on how the antistatic paints were able to conduct the generated charge to earth potential. As mentioned above, tested antistatic materials/paints differ in their chemical composition and this influences the particular surface conductivity of these paints.
We painted coatings based on single-component paint that are soluble in xylene onto laboratory samples. Xylene is a solvent used for methyl-silicone resin in which white titanium pigment is added. This pigment is titanium dioxide TiO2, which is the most commonly used compound of titanium. Typically, it has the highest covering capability among all other pigments. The filler of these paints is Omyacarb 2VA. It is a carbonate in the form of white marble powder. Our coatings contain zinc; therefore, they have the paint form, as the weight of the zinc is considerably high. The paints have the same consistency as one-component paints.
We used the paints on the following samples:
- BISIL (Borosilicate Glass);
- CaTiO3;
- CaTiO3/PANI;
- CaTiO3/PPY;
- TiO2/PANI;
- TiO2/PPY;
- PANI.
The paints were applied to two different materials:
- A dielectric surface—ordinary sheet glass with 0.25 m × 0.10 m dimensions and a thickness of 3 mm;
- A conductive surface—steel plate S 235 JRG2 with 0.10 m × 0.10 m dimensions and a thickness of 2 mm.
For all of the paints, 4 samples were prepared: 2 on the dielectric surface and 2 on the conductive surface. The coatings that we used in our experiments are primarily designed for metallic constructions, so we focused on the volume resistance of that material with the coating. All the samples with coating were prepared by the same method and the same process, thus, the thickness of the coating on all samples used in our experiments was equal to 0.18 mm, and it had no effect during comparison validation of the samples.
However, when using a dielectric material surface for a coating application, a few questions have to be discussed. The coating should be carefully grounded to make it work effectively in a particular application. Furthermore, if the conductivity of the coating is too high, there is a higher risk of spark discharge caused by the electrostatic charge accumulated on a dielectric pad. The appropriate coating material selection should also take into account the material type of the surface on which the coating is applied.
2.2. Measurement Conditions
We conducted dielectric tests on antistatic paints in three different environmental conditions in order to observe the degradation degree of material conductivity:
- The initial measurement without any influence of the outer environment—the samples were in the measurement process 2 months after we received them from the supplier so that the sample material had time to stabilize;
- The influence of a higher temperature—the samples were exposed to a higher temperature of 70 °C for 2 months in a degradation chamber with stable air circulation;
- The influence of the outer environment—the samples were exposed to unfavorable outer environmental conditions with combined physical parameter influence for 2 months.
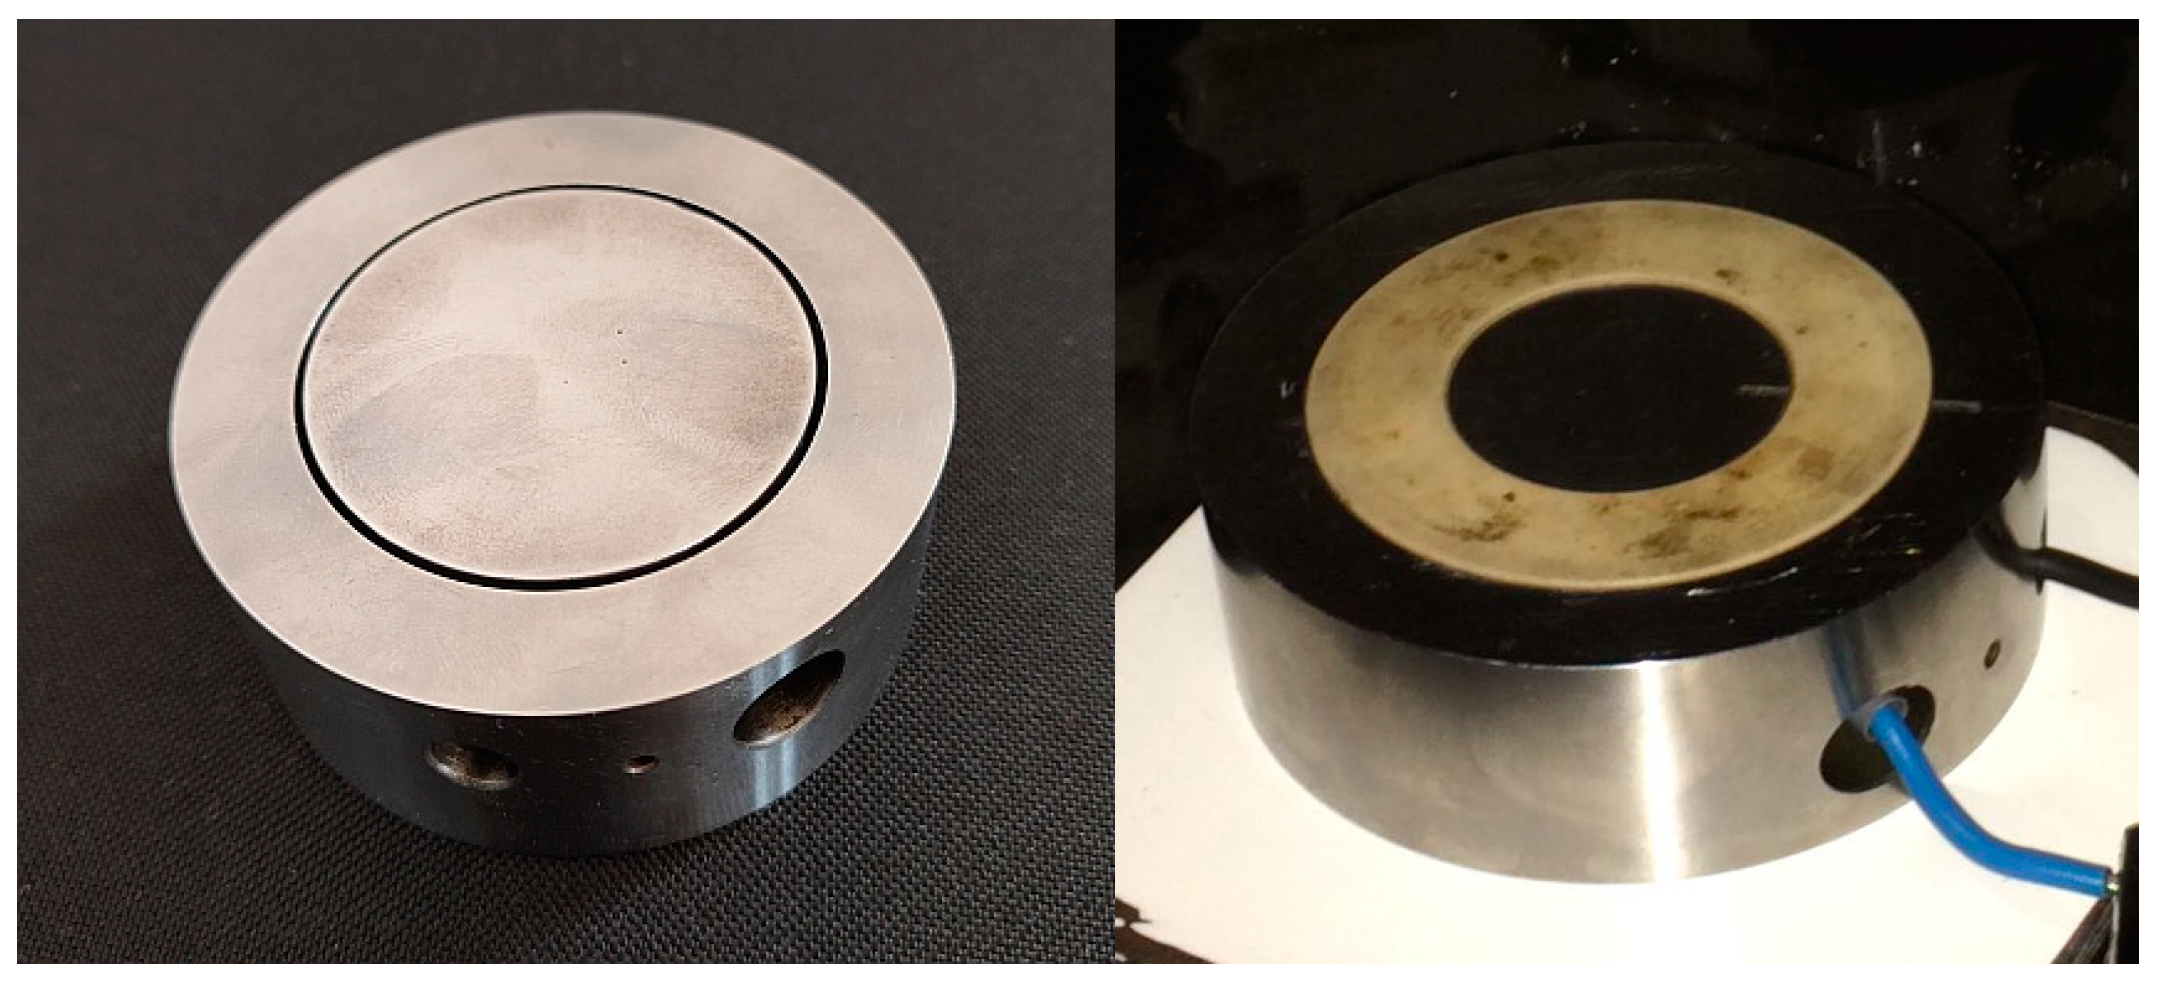
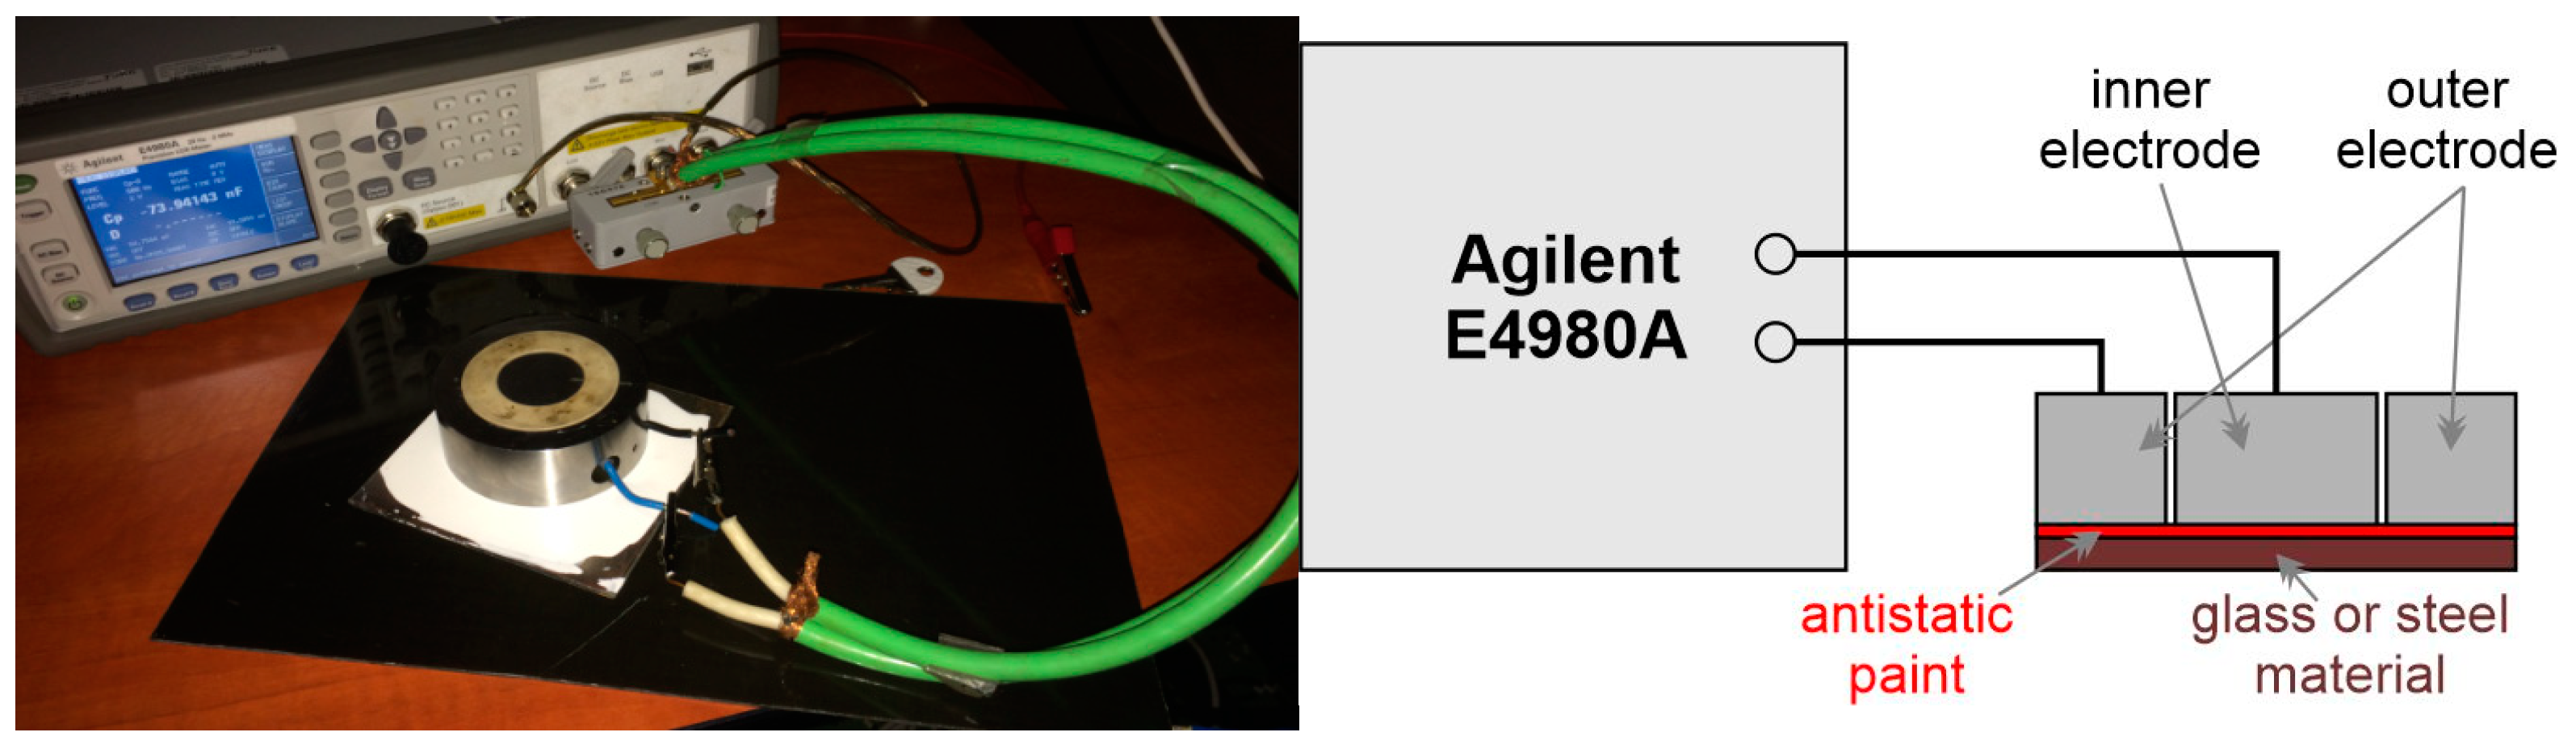
The electrode system has the form of coaxial rings (Figure 1) with a moderate homogenous electric field. The outer radius of the inner electrode ring in our experiments was r = 24.5 mm; for the outer electrode ring, the inner radius was R = 25.5 mm.

Figure 1.
Measurement electrodes—coaxial rings.
2.3. Measurements Without Outer Environment Influence
In this measurement setup, we have measured charging and discharging currents, capacitance values, and the loss factor 2 months after delivery from the supplier. The samples were placed in a dark environment in a laboratory with closed doors and windows at a stable room temperature. These conditions ensured the most realistic electric parameters of the materials, which differ in chemical composition and production methods.
2.4. The Measurement of Charging and Discharging Currents
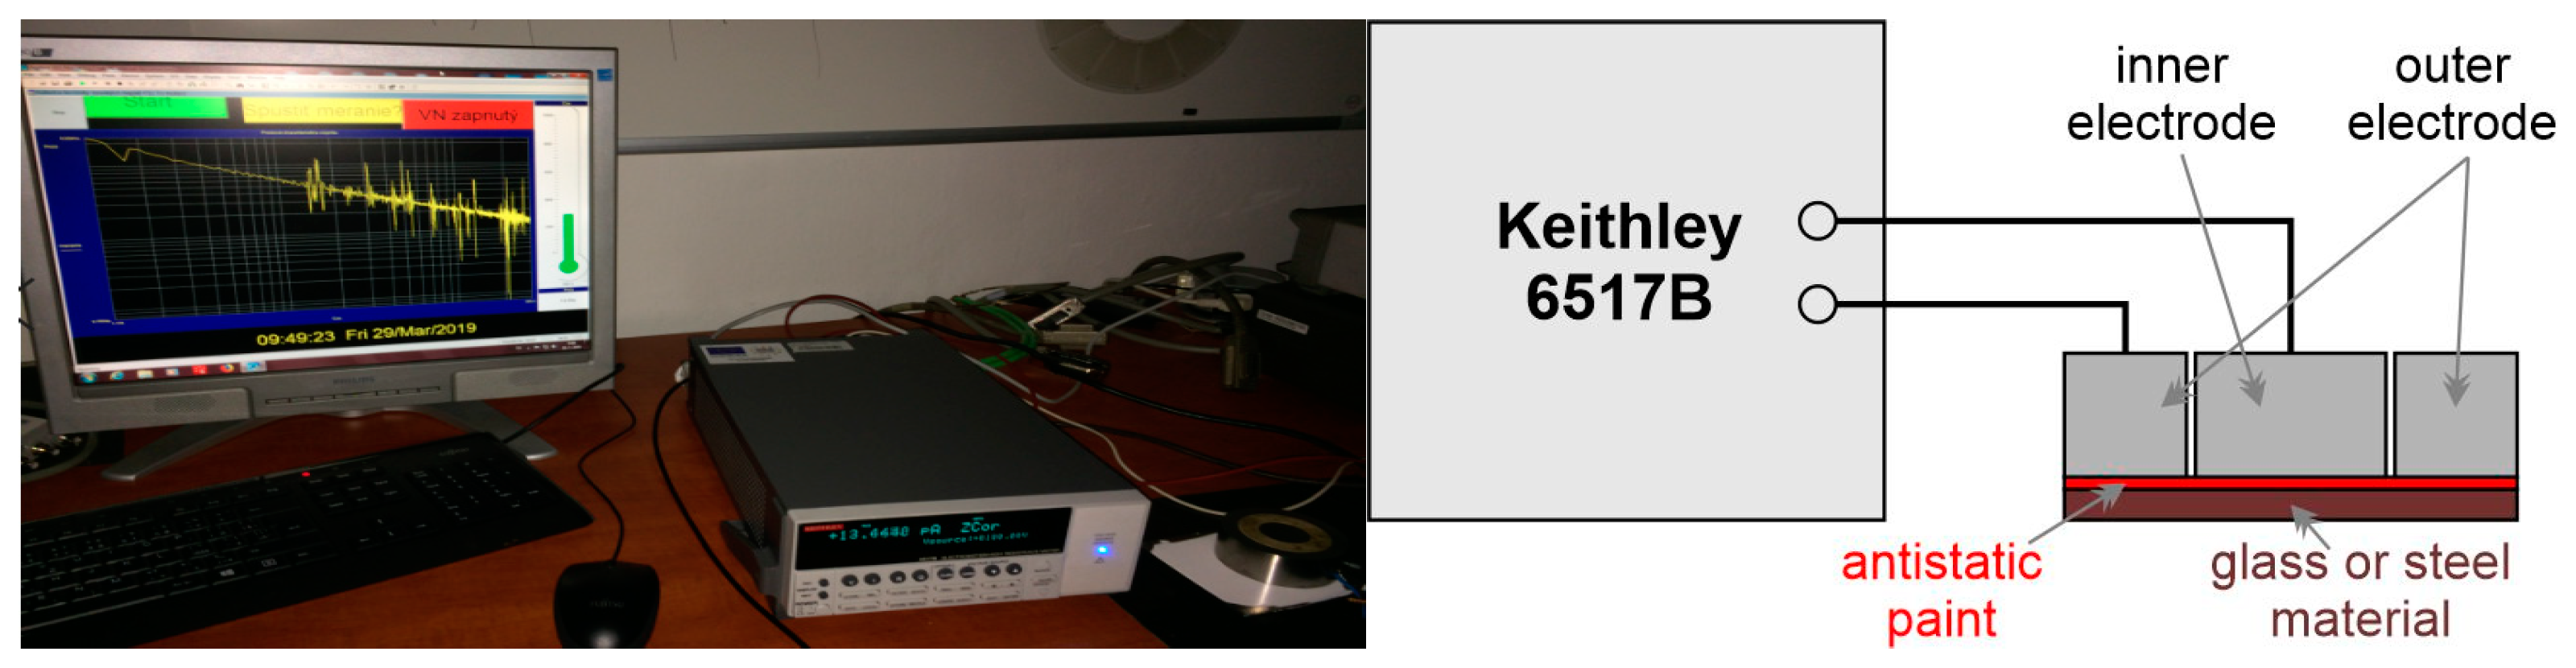
The first measurement was made with the Keithley 6517B electrometer, shown in Figure 2. This method is a DC method. For current generation, it is important to connect the electrodes correctly.
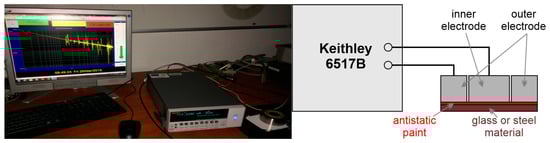
Figure 2.
Measurement setup with Keithley 6517B electrometer and connection diagram.
During the 1000 s long measurement, the sample was inserted between the pad and measurement electrode. Thus, the charging and discharging each took 500 s. The generator supplied current at a constant voltage of 10 V. We wanted to obtain the values of conductive currents IG. The IG (insulation (leakage) current) value was read from interpolations. The value of the conductivity current directly determines the degree of conductive polymer representation in paint. All the acquired current values are compared with currents that flow through the dielectric material. For dielectric materials, this type of current is unwanted as it represents the losses in insulation material, thus degrading the insulation capability.
We examined seven painting types and we had four samples from each painting type. For time-demanding reasons, the charging and discharging currents were measured 5 times, and the capacity and loss factor were measured at each frequency in the frequency range 25 times. However, in this paper, only the selected results are mentioned due to the paper’s extent.
3. Results and Discussion
3.1. Charging Current Measurement
Looking at Table 1, where the charging currents are listed, we can say that the least conductive paints on a glass sheet were those containing CaTiO3.

Table 1.
Measured and calculated data on the Keithley 6517B electrometer.
The following values for particular coating types are conductive currents with measured resistance and calculated surface resistivity (according to ANSI/ESD STM11.11-2006 Surface Resistance Measurement of Static Dissipative Planar Materials standard) [48] (Table 1).
We can also say that perovskite CaTiO3 with a combination of conductive polymers behaves as an absorber. A decrease in IG value can be observed; thus, clean perovskite has a higher value than the one with a conductive addition. The paints on glass containing TiO2 without additions of calcium oxide have approximately the same value of conductivity currents as well as the commercially available paint BISIL (Table 2).
Table 2.
Measured and calculated data on the Keithley 6517B electrometer.
The exception is a PANI polymer. This sample did show conduction capability, as the IG current value was a 10 times higher value than the current of non-conductive paint: PANI: IG = 350 µA, where the charging current on conductive paint PANI before the aging process on a glass sheet is presented.
For paints on steel pads, we measured higher value currents in general due to the pad material. There is also a considerably higher effect of conductive polymers (Table 3).
Table 3.
Measured and calculated data on the Keithley 6517B electrometer.
We can also observe an opposite effect of CaTiO3 in combination with metallic material compared to the expectations. The constant current flowing through the paints on a glass sheet increased by 90 µA. The most conductive paints were those that contained PANI polymer, this time in combination with TiO2. In this case, the conductive current was 1000 times higher in comparison with the clean PANI polymer case.
3.2. Capacitance and Loss Factor Measurement
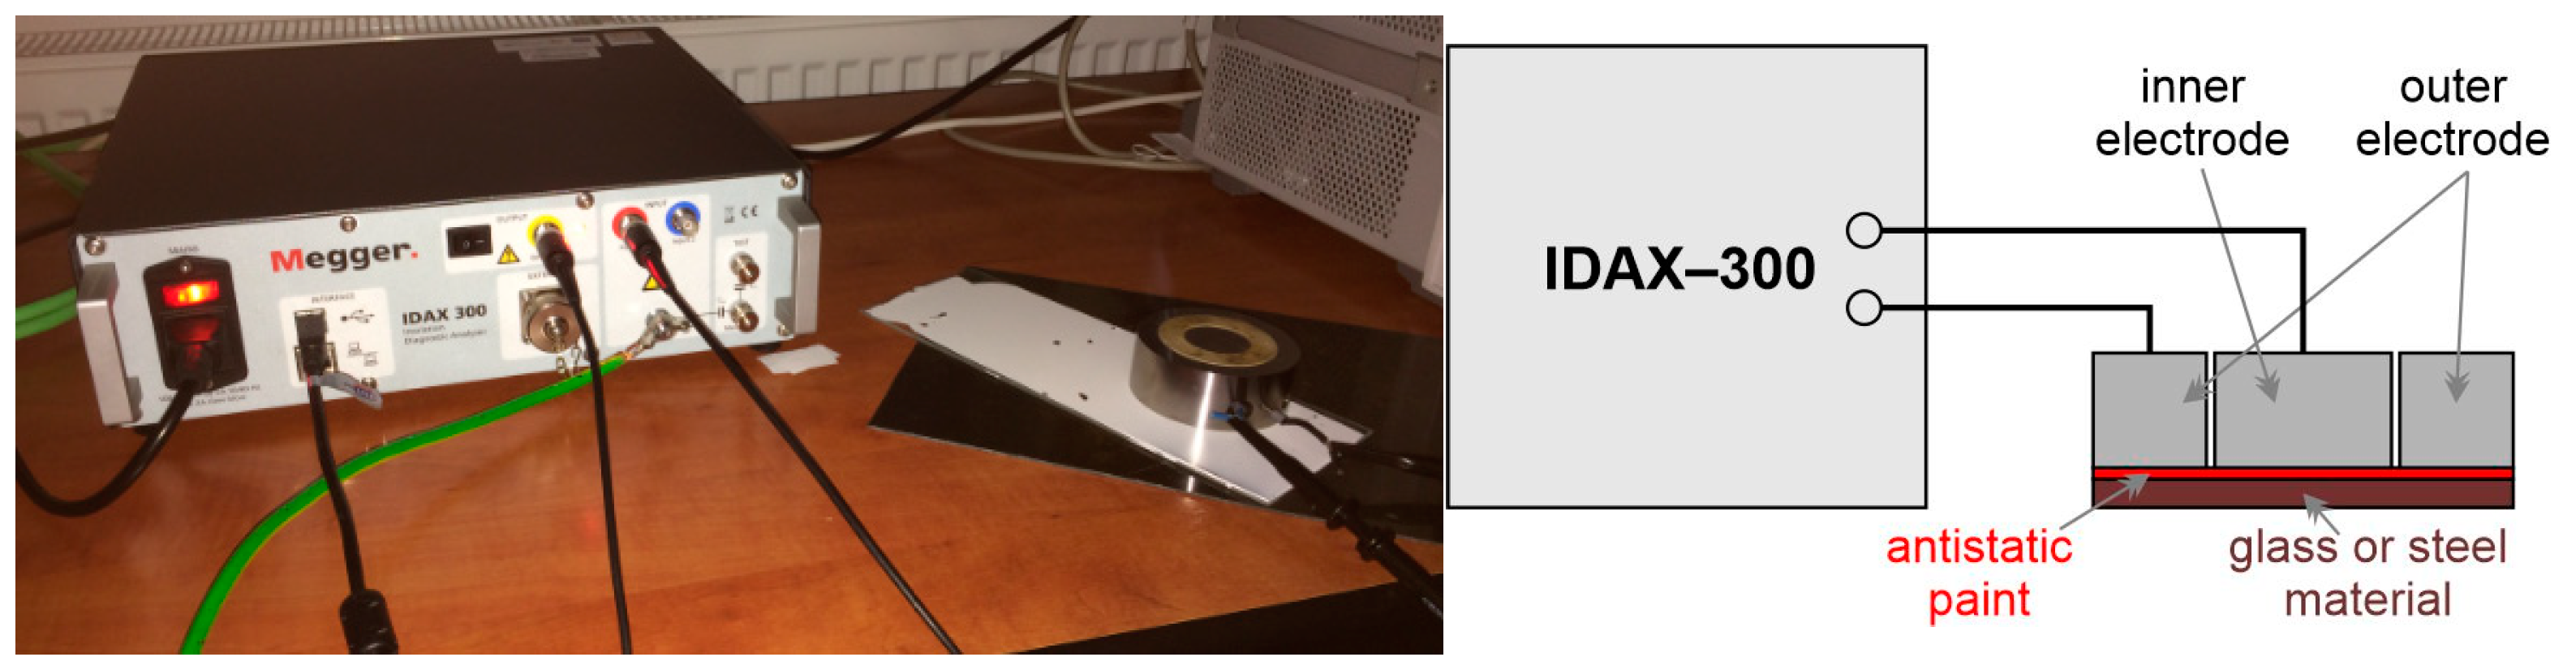
The second set of measurements focused on paint capacitance and loss factor measurements depending on the frequency. The capacitance and loss factors measured before and after aging show that the electrical parameters of the painting changed. The measurement methods used in our experiments are usually applied in dielectric spectroscopy for electric parameter measurements, in general, and they can be applied for the measurement of antistatic material electric parameters. They are AC (alternating current) methods, and they were made by the IDAX-300 insulation diagnostic analyzer (Figure 3) in the following frequency ranges:
- 10,000 Hz, 9000 Hz–1000 Hz;
- 900 Hz, 800 Hz–100 Hz;
- 90 Hz, 80 Hz–10 Hz;
- 9 Hz, 8 Hz–1 Hz;
- 9 × 10⁻¹ Hz, 8 × 10⁻¹ Hz–1 × 10⁻¹ Hz;
- 9 × 10⁻² Hz, 8 × 10⁻² Hz–1 × 10⁻² Hz;
- 9 × 10⁻³ Hz, 7 × 10⁻³ Hz, 5 × 10⁻³ Hz, 3 × 10⁻³ Hz, 2 × 10⁻³ Hz, 1 × 10⁻³ Hz.
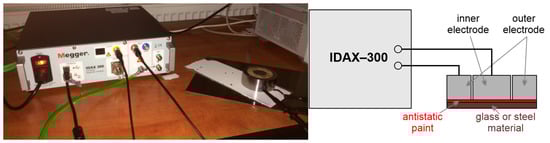
Figure 3.
Measurement setup by IDAX-300 insulation diagnostic analyzer.
Figure 3.
Measurement setup by IDAX-300 insulation diagnostic analyzer.
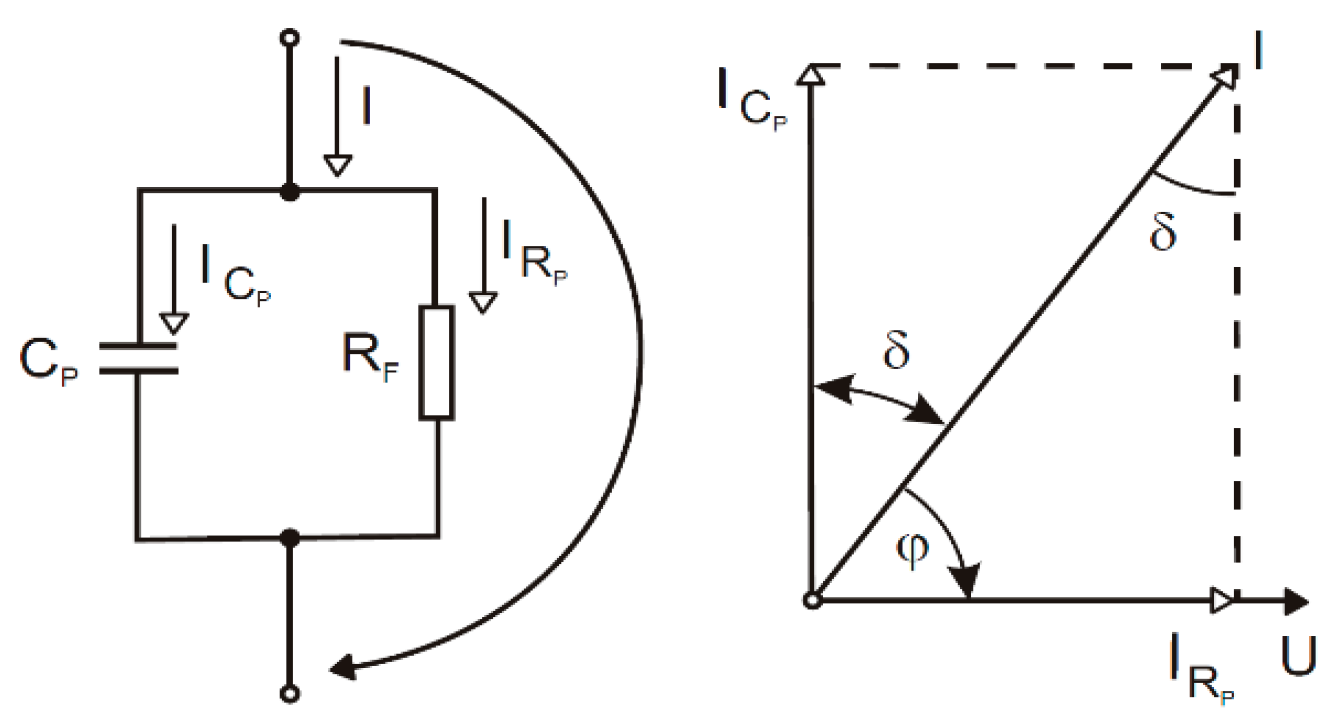
According to the simplified model of our samples shown in Figure 4 and Equations (3) and (4), the capacitance and loss factor influence the coating’s capability to eliminate the charge because the resistance of the coating is inversely proportional to the capacitance and loss factor measured.
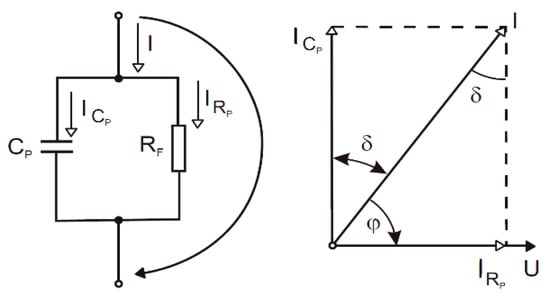
Figure 4.
Simplified model of samples.
The ICp current and the IRp current can be calculated as in Equations (1) and (2). Then, we can substitute these currents in Equation (3), indicating the calculation of the loss factor, and Equation (4) calculates the corresponding resistivity.
The measurements were made at a constant voltage of 10 V on a dielectric pad. These measurements are very time-consuming, as at f = 1 mHz, the measurement period lasts 1000 s. In our case, the measurement took approximately 58 min.
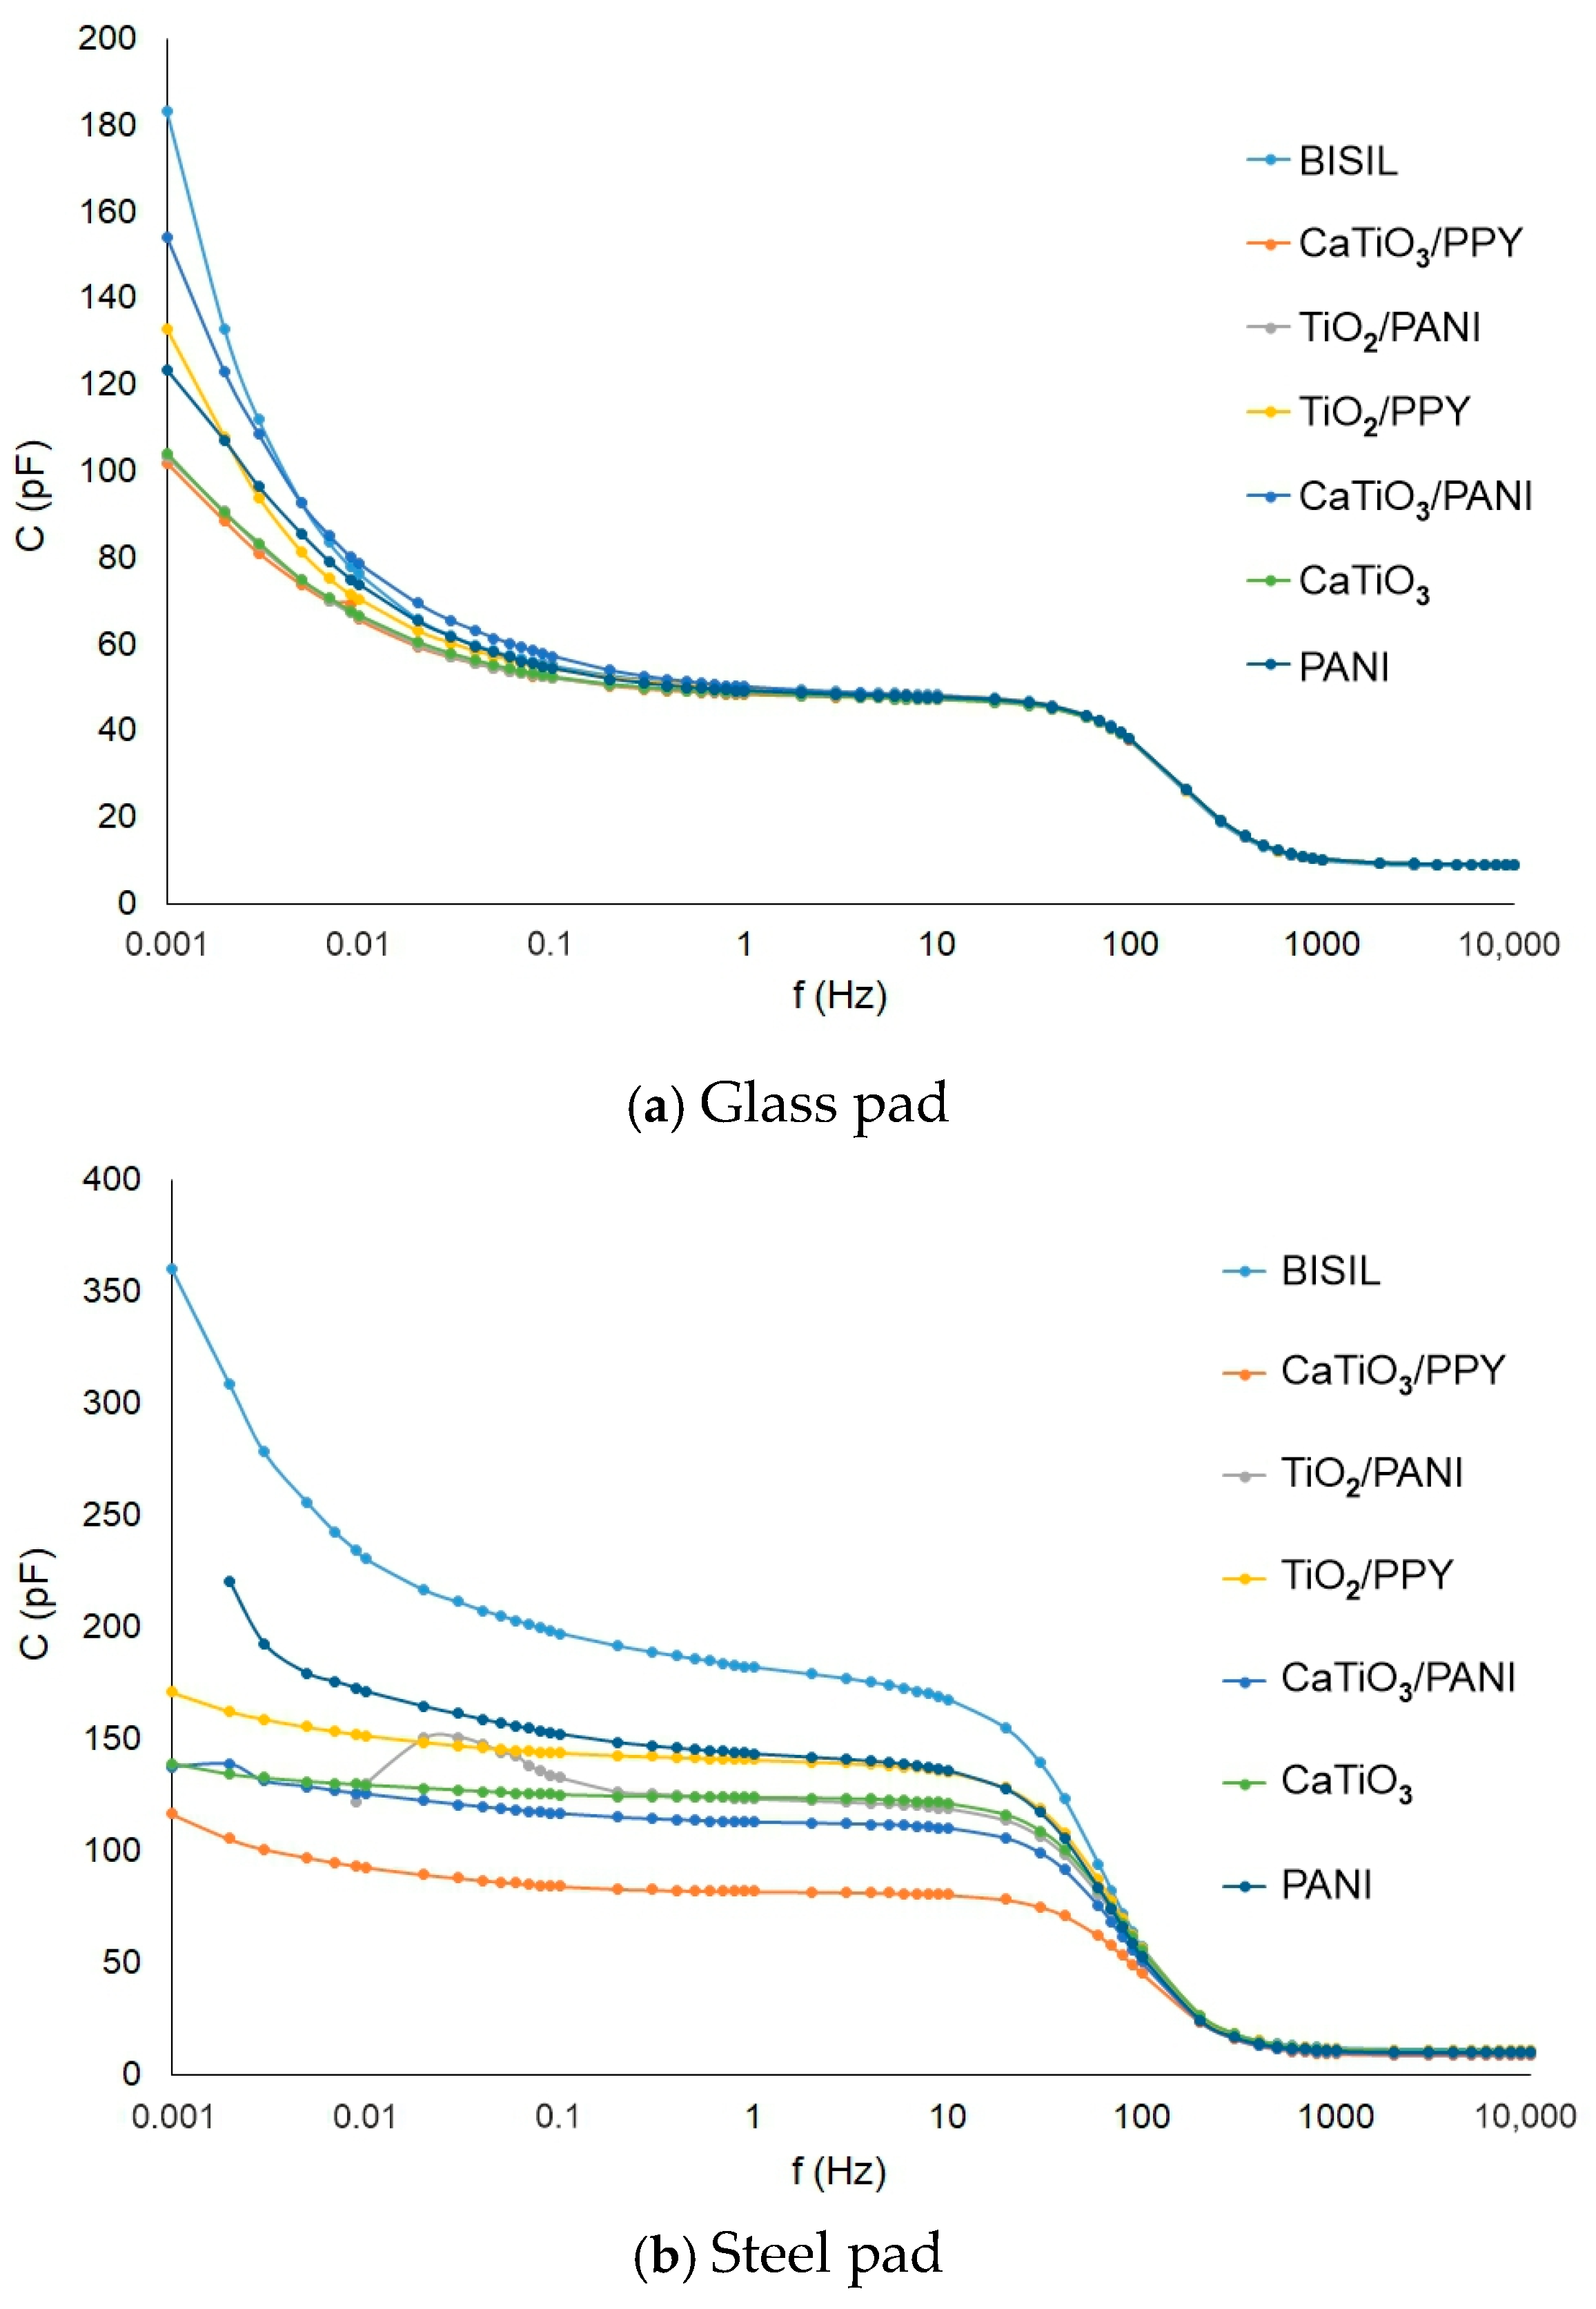
The capacitance between electrodes (without sample) during the AC measurement methods was compensated by the measuring device itself (it has a built-in compensation), so this capacitance was not measured in our experiments. The capacitance values of the samples on both pad materials were in the range of hundreds of pF. The highest capacitance was observed on BISIL paint; on the other hand, CaTiO3 had, in both cases, the lowest capacitance. TiO2/PANI and PANI conductive polymer paints were exceptions, which had a capacitance value range of tens of pF at mHz frequency values on steel pad.
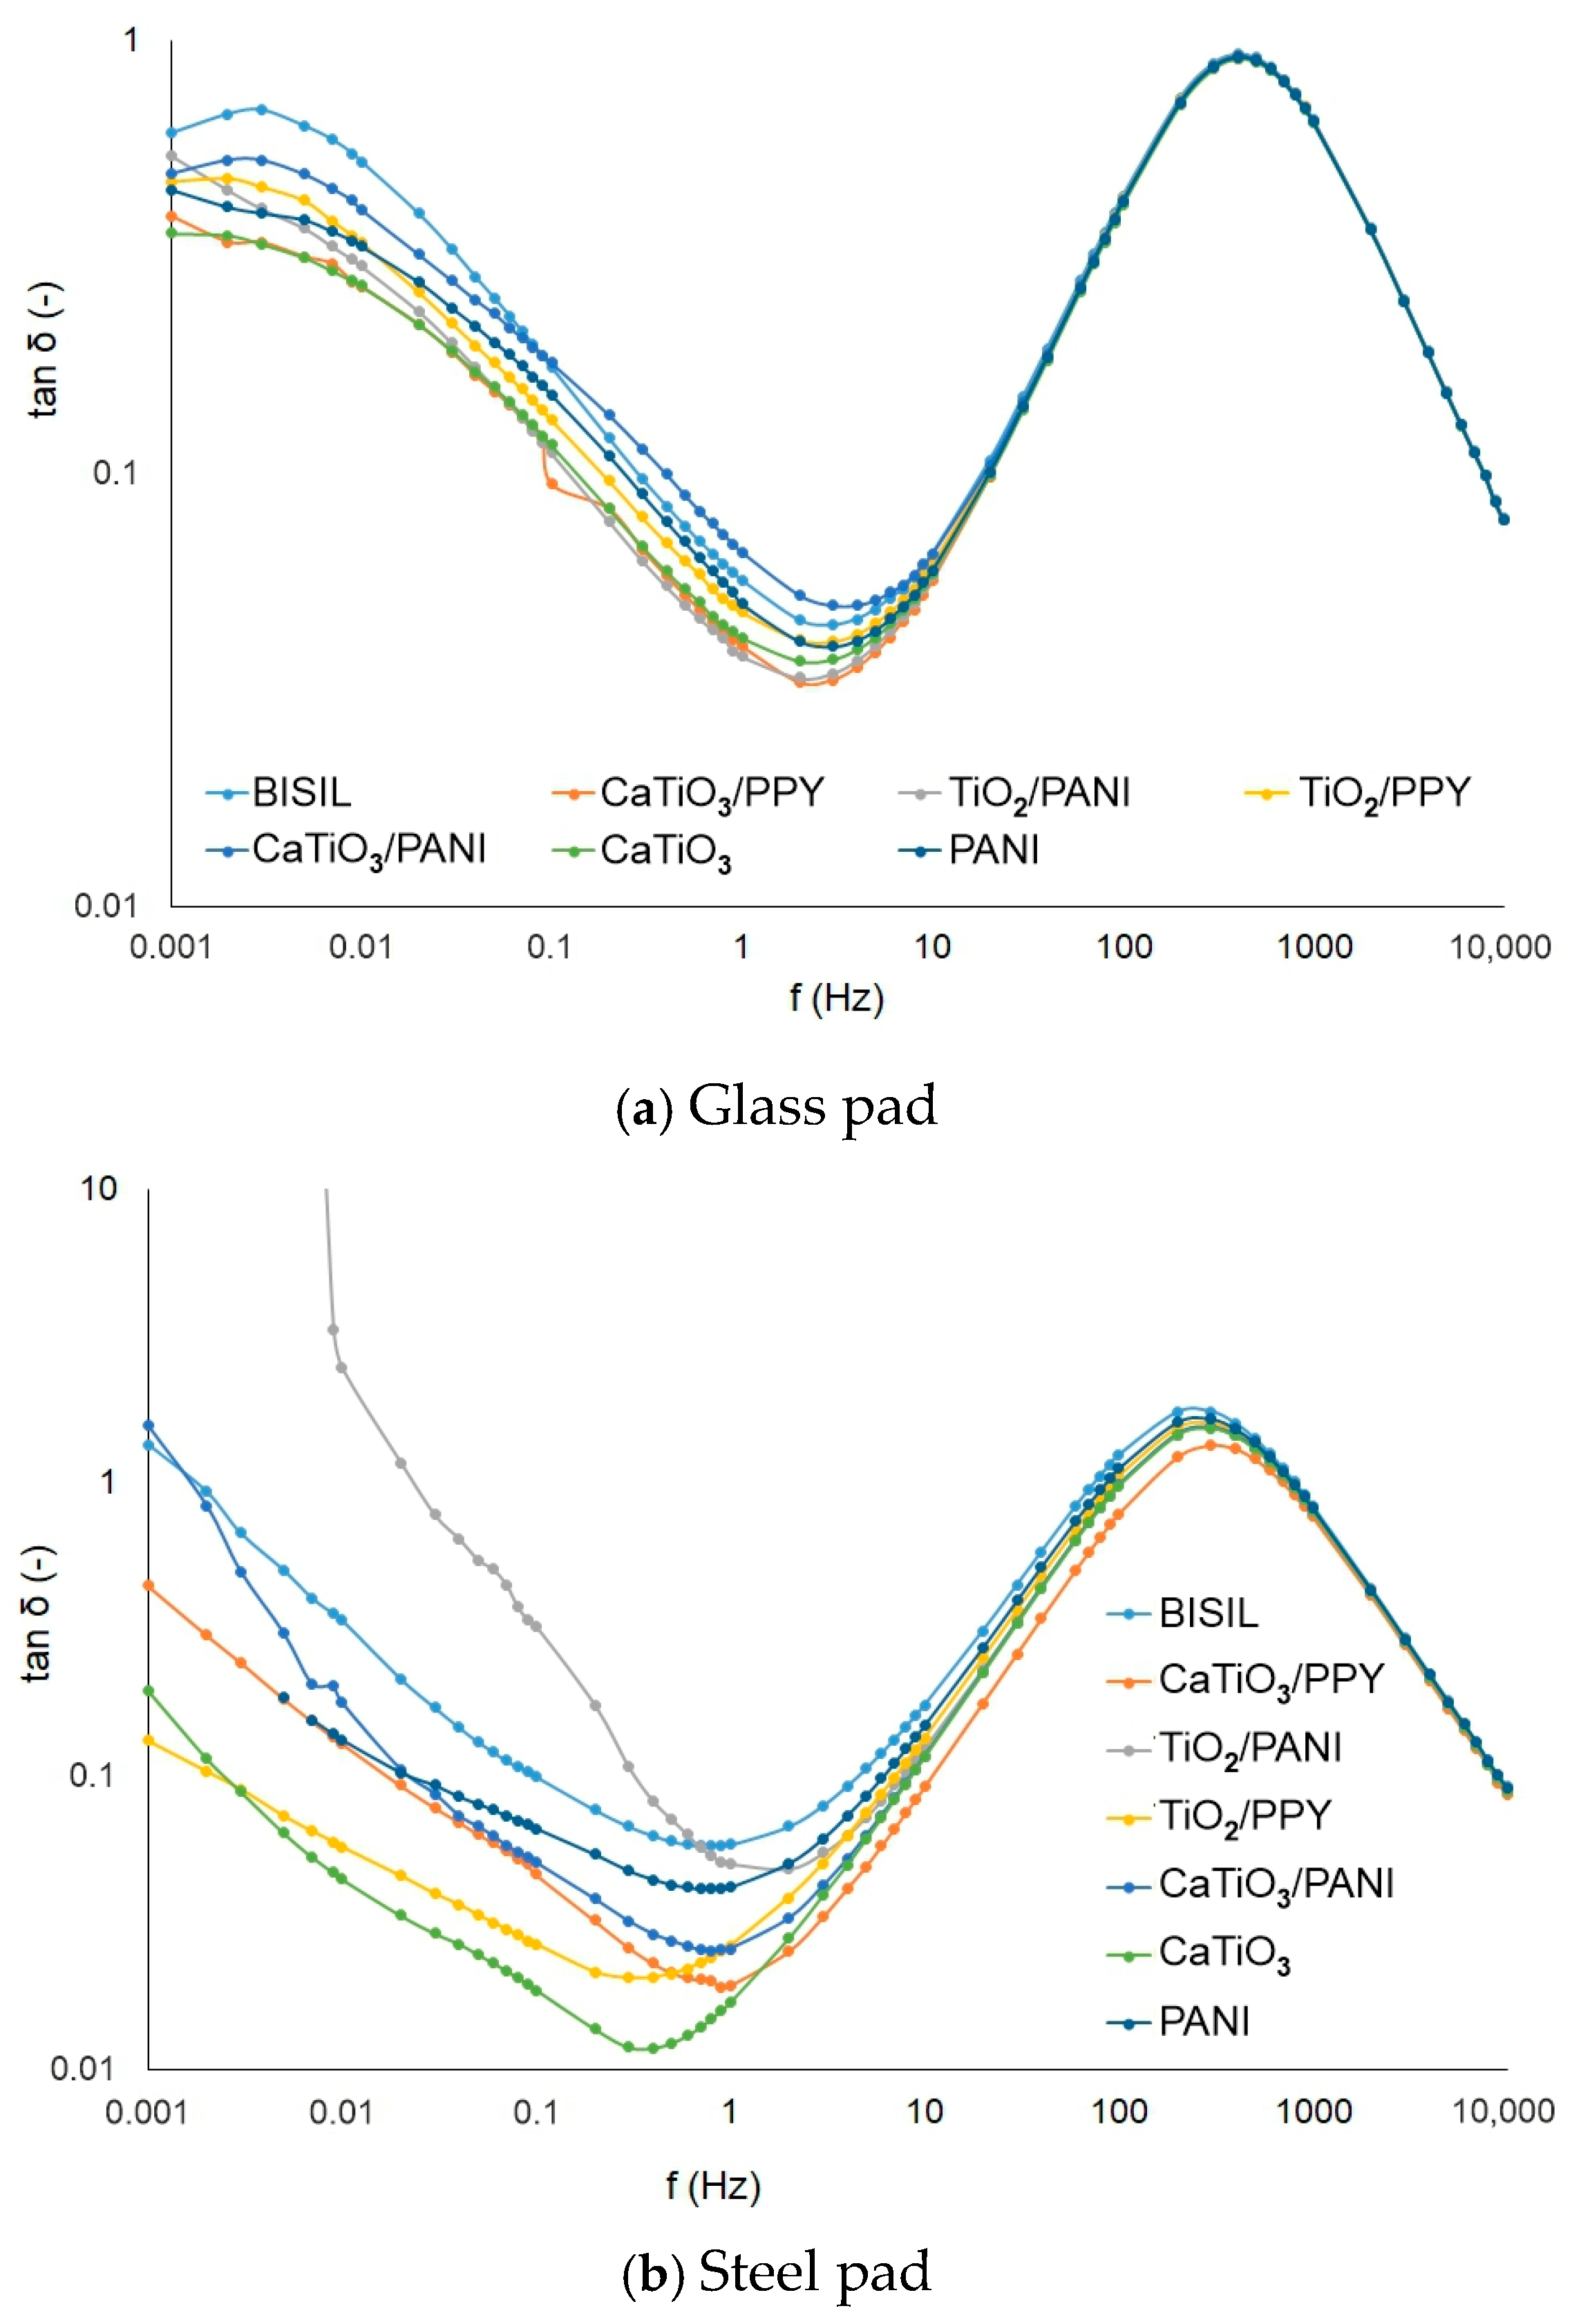
The measurement of the loss factor quantifies the paint’s conductivity. We found that the non-conductive paints on glass sheets have greater values of the loss factor. The influence of conductive polymers can be observed in the case of steel pads. In these cases, for TiO2/PANI paint and at frequencies near 1/100 Hz, the loss factor had a value of tg δ ≈ 52. For PANI paint at mHz range frequencies, the tg δ ≈ 11, and for CaTiO3/PANI at low frequencies, the loss factor was tg δ ≈ 1.7. In addition, the BISIL paint had a higher loss factor value: tg δ ≈ 1.4 at lower frequencies. In comparison with other cases, these loss factor values can be considered as high values, as normally they are in the range of 1/10 units.
3.3. Capacitance and Loss Factor Measurement with Agilent E4980A Device
In the third set of measurements, we used the Agilent E4980A precision LCR meter (Agilent, Santa Clara, CA, USA) shown in Figure 5, which is ready to make measurements using the dielectric spectroscopy method. We used this set for comparison reasons with one difference: frequency range. For this set, we applied frequencies between 2 Hz and 2 MHz. Two different types of equipment for the AC method were used due to the different frequency ranges of both equipment types. Our aim was to cover a wider frequency range in our experiments.
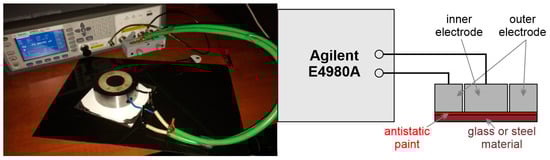
Figure 5.
Agilent E4980A precision LCR meter measurement setup.
The particular measurements were made at frequencies:
- 10 Hz, 20 Hz–90 Hz;
- 100 Hz, 200 Hz–900 Hz;
- 1 kHz, 2 kHz–9 kHz;
- 10 kHz, 20 kHz–90 kHz;
- 100 kHz, 200 kHz–900 kHz;
- 1 MHz; 1.1 MHz–2 MHz.
Principally, this device makes the parameter measurement 25 times at the same frequency, and the arithmetical average is then calculated from these values.
The lowest capacitance was observed again for the TiO2/PANI coating in comparison with other paints. On the other side, the highest capacitance was measured on a TiO2 coating with PPY polymer.
The loss factor has a decreasing tendency in this case. In the higher frequency range, the most conductive coating was PANI in comparison with other samples. The maximal value tg δ ≈ 0.5 was observed at a 40 Hz frequency.
3.4. Samples After Aging Process by Increased Temperature in Oven
The increased temperature was applied to the samples on the Memmert UF55plus oven (Memmert GmbH + Co. KG, Büchenbach, Germany). This oven is programmable, and it has forced air circulation in the chamber. For this measurement set, we wanted to compare the conductivity and capacitance changes after the aging process. The aging process lasted 60 days at a constant 70 °C temperature and constant hot air circulation. The sample parameter change was supposed to be caused by chemical structure changes of the antistatic paints. Thus, the paint degradation can cause the deterioration of the paint’s capability to conduct the charge to earth. The measurement sets previously described were repeated with the same samples after the aging process with the same methods, devices, and frequency ranges.
After the aging process, the conductive currents were lower. This is caused by the fact that the paint had dried and had lower humidity. The samples with the highest conductivity values before the aging process appeared to be the most influenced by aging. For e.g., PANI paint, which had an IG = 350 µA conductive current value for the glass sheet case before aging, the value decreased to IG = 20 µA after aging.
The aging process also decreased the capacitance values of the samples on a glass sheet. Before aging, these values were in the range of 100–150 pF. After aging, the capacitance decreased to approximately 100 pF for the BISIL paint on a glass sheet and had the highest capacitance at 1 mHz: CBISIL ≈ 110 pF. The same effect could be observed with the sample on a steel plate: 350 pF before aging and 200 pF after aging for the BISIL paint sample.
The loss factor tgδ also decreased after the aging process, especially in the case of the samples with conductive polymer PANI. This is caused by sample drying. For the TiO2/PANI sample on a steel plate, the maximum of tg δ was 1.75 at 1 mHz.
3.5. Samples After Aging Process in Outer Environmental Conditions
This aging process took place in outer environmental conditions during the winter months of December and January (60 days). We can consider these months as the coldest on average and they have the highest volume of precipitation in the form of snow or rain. In addition, foggy weather with low air pressure appears often in these months.
The conductive currents were measured, and they were significantly higher in comparison to the samples with the aging process in the oven. This is caused by high humidity in the environment. The typical conductive current value for PANI samples on a steel plate was IG ≈ 25 µA, with TiO2/PANI IG ≈ 12 µA, and with other coatings, it was IG ≈ 10 µA. In cases with a glass sheet, the current had values in the range from 2 to 10 µA, with the highest value for perovskite containing CaTiO3.
The capacitance was similar to the samples with oven aging; they had values between 150 and 200 pF for steel plate samples and 50 to 110 pF for the glass sheet. The TiO2/PPY coating had the highest capacitance value on steel plate and BISIL on glass.
The difference between both aging processes can be observed in the loss factor parameter tg δ. This parameter was higher in comparison to the samples without aging, especially for PANI paints. This set of measurements showed that the most suitable paint type for electrostatic charge elimination is the PANI polymer or the composite TiO2/PANI.
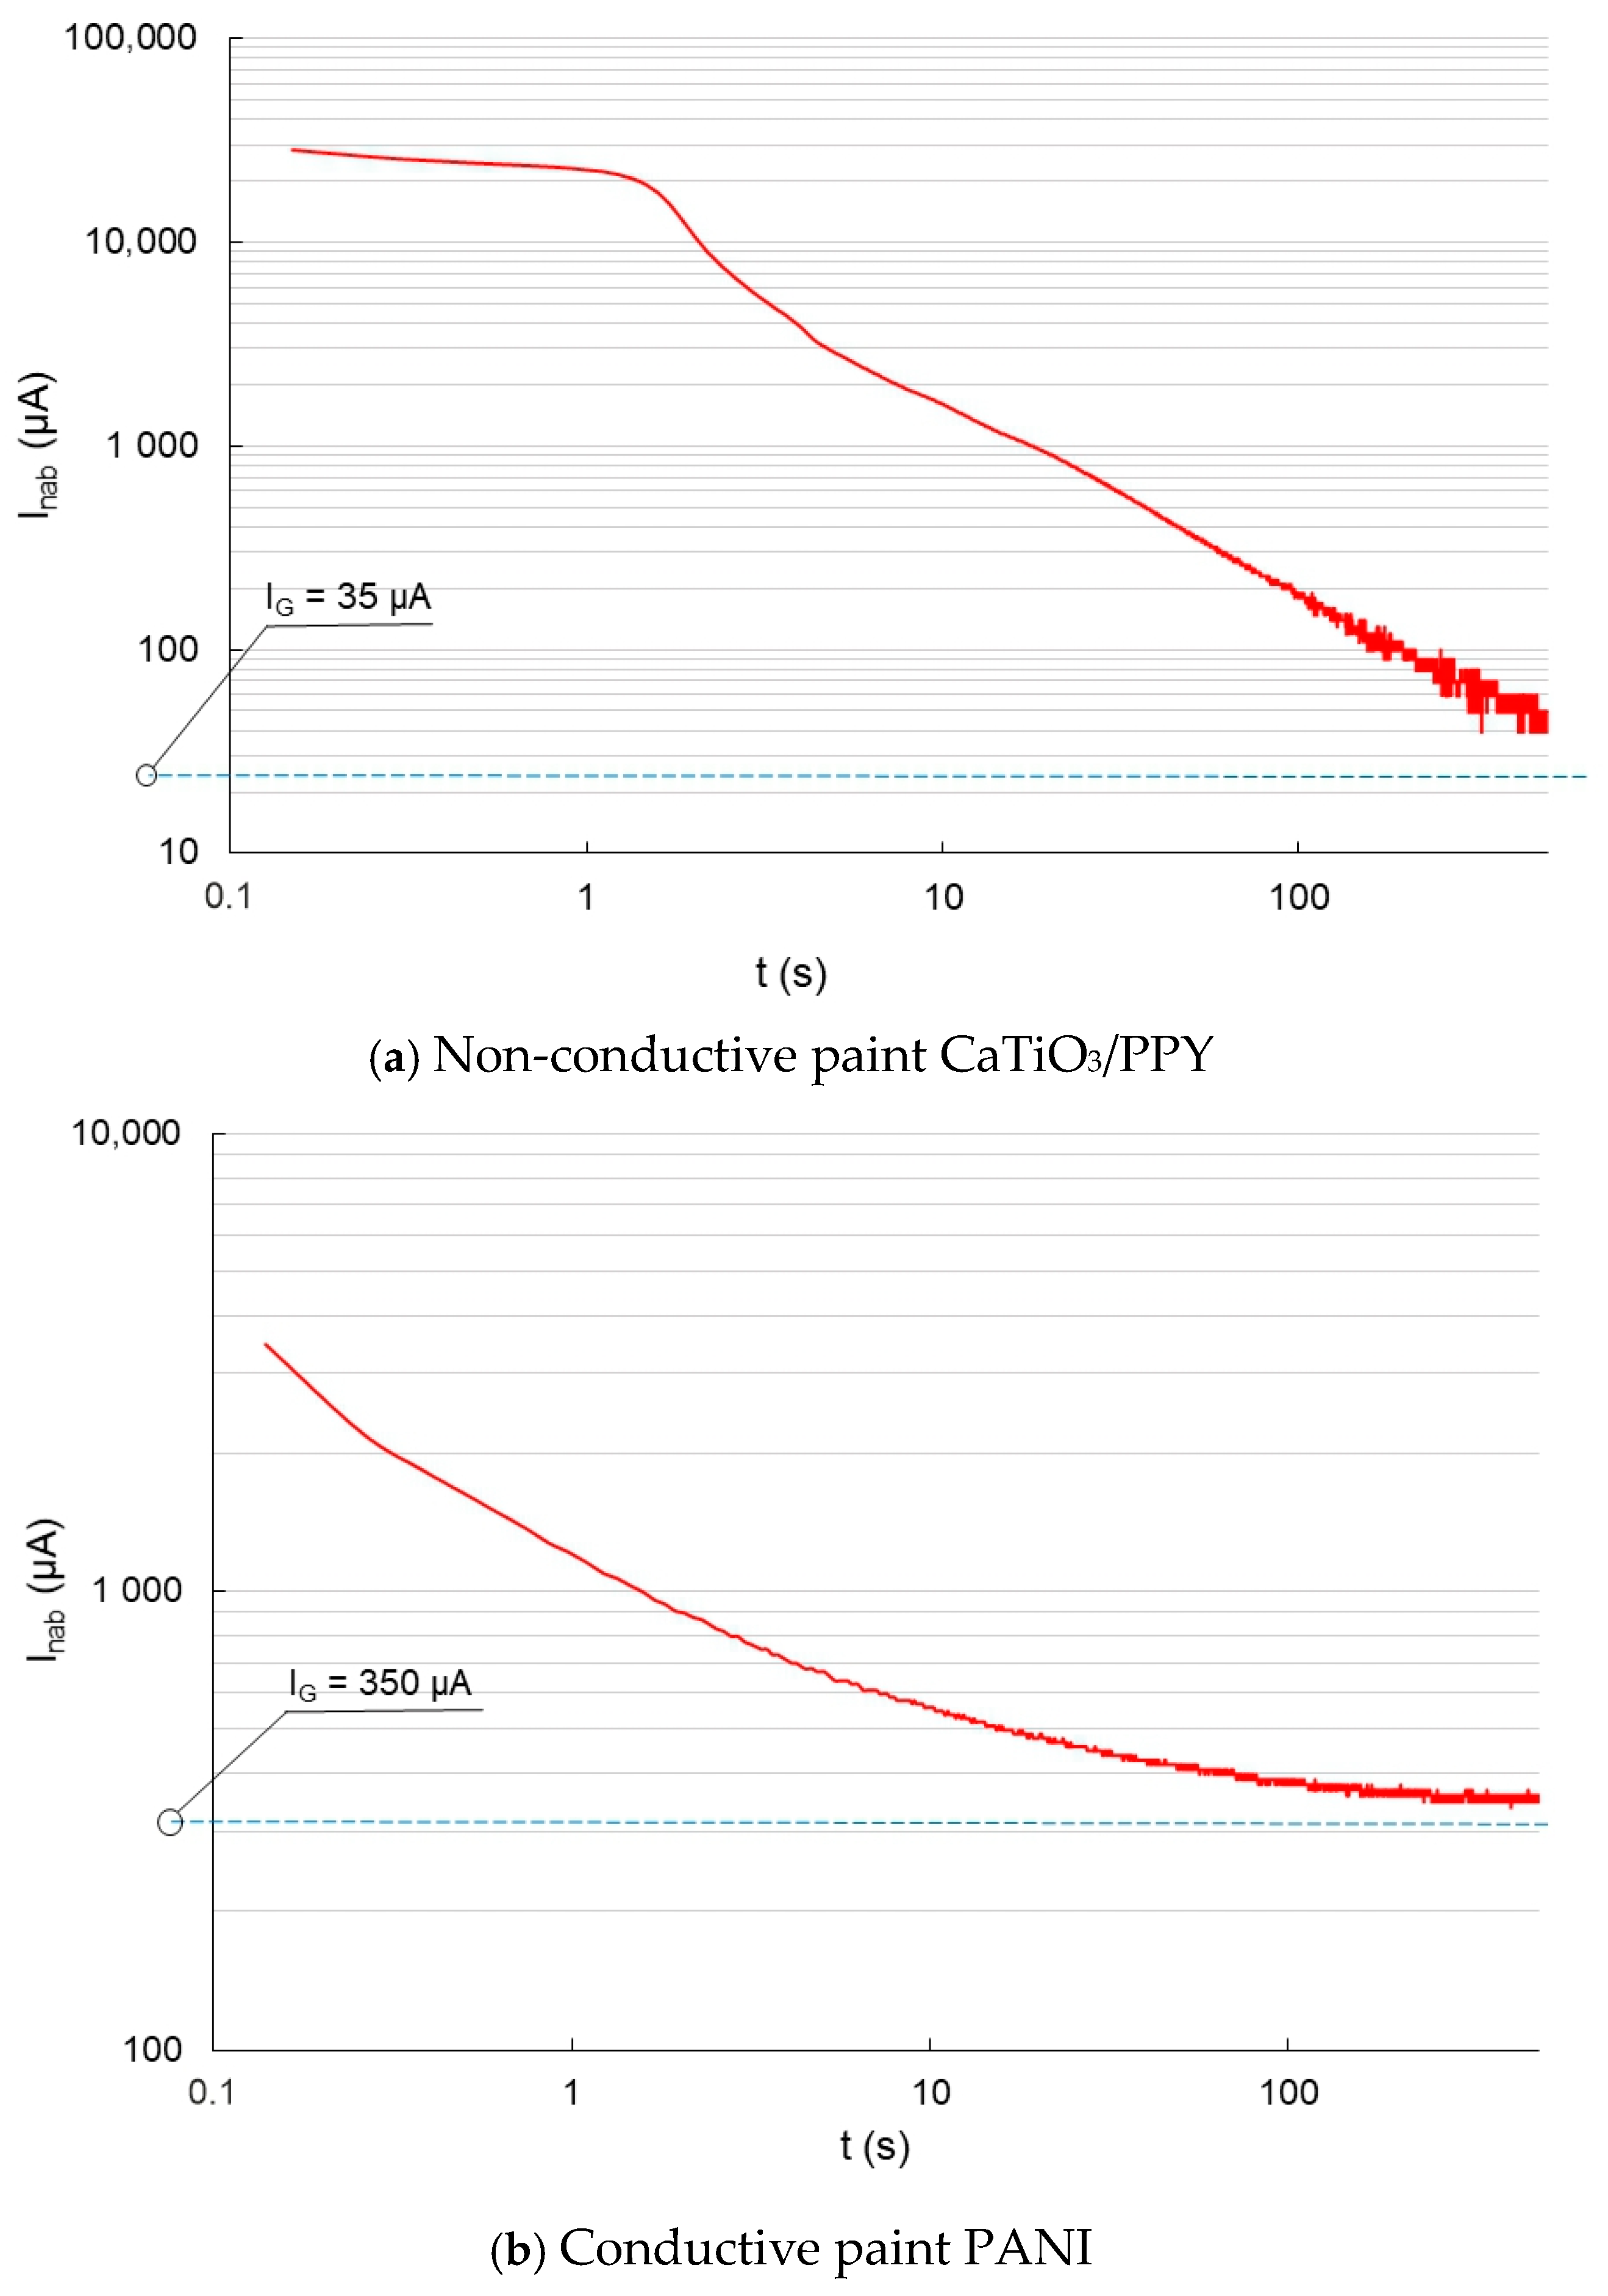
In the following graphs in Figure 6, the charging currents are depicted on non-conductive vs. conductive coatings.
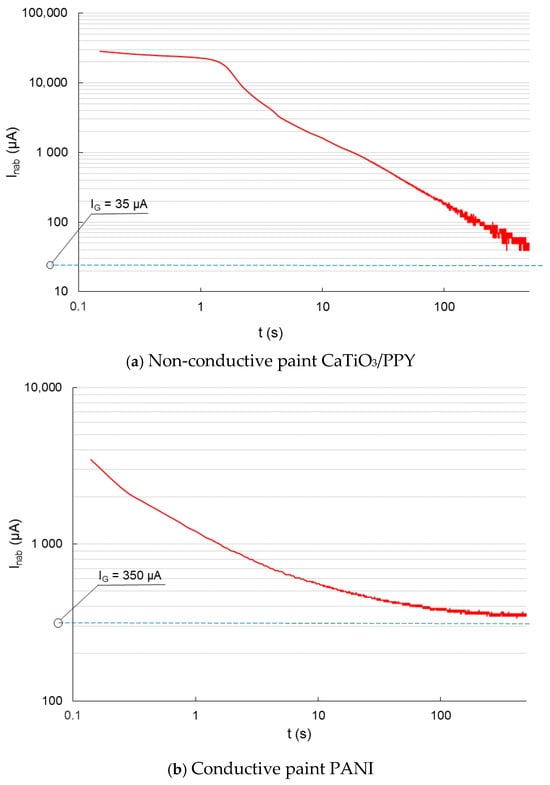
Figure 6.
Charging current before the aging process—glass sheet.
Figure 6a shows the charging current waveform of a non-conductive coating on a glass substrate. When measuring the charging current of a coating on a glass substrate (non-conductive material), the surface conductivity of the coating is more apparent. The charging current initially decreases gradually, and later, the decrease is more abrupt. The charging current for this semi-conductive coating converts to a conduction current approaching 35 µA. Figure 6b shows the charge current waveform for the semiconducting material. The current decreases exponentially and tends to a conduction current value of 350 µA, which is ten times larger than that of the non-conductive material.
In Figure 7, we can see the capacitance values for different frequencies in comparison between two situations—before the aging process and between glass and steel plates. When measuring the coating capacitance on the conductive substrate, the bulk capacitance is more apparent than the surface capacitance. When measuring it, we actually have a series-parallel connection of three capacitors. In one parallel branch is the surface capacitance of the coating, and in the other branch, there is a series connection of the two bulk capacitances (outer electrode—metal and metal—inner electrode). Therefore, the resulting coating capacitance for a metal substrate is significantly different from that for a glass substrate, where the bulk capacitance is not very evident.
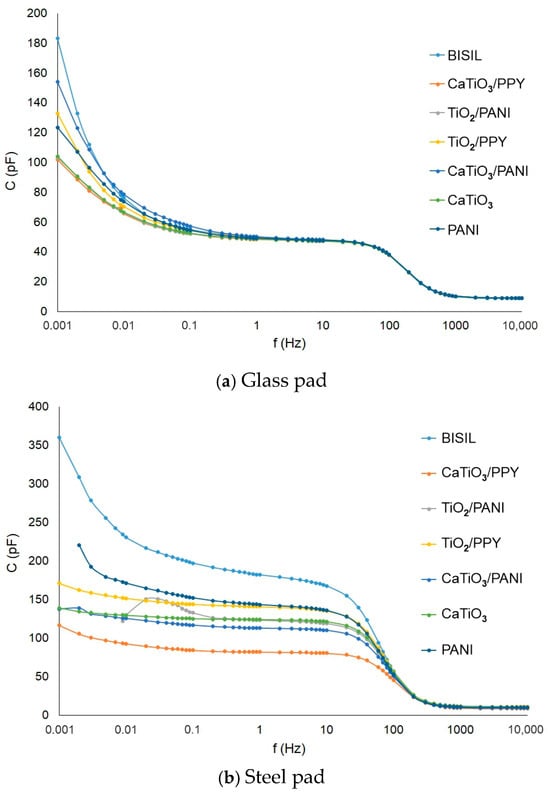
Figure 7.
IDAX insulation diagnostic analyzer: Paint capacitance before the aging process—steel pad.
Figure 8 shows the difference in loss factor values between steel and glass plates for different painting types. When measuring the loss factor, the same assumptions apply as when measuring capacity. For a glass substrate, the surface conductivity is more apparent and for a metallic item, the bulk conductivity.
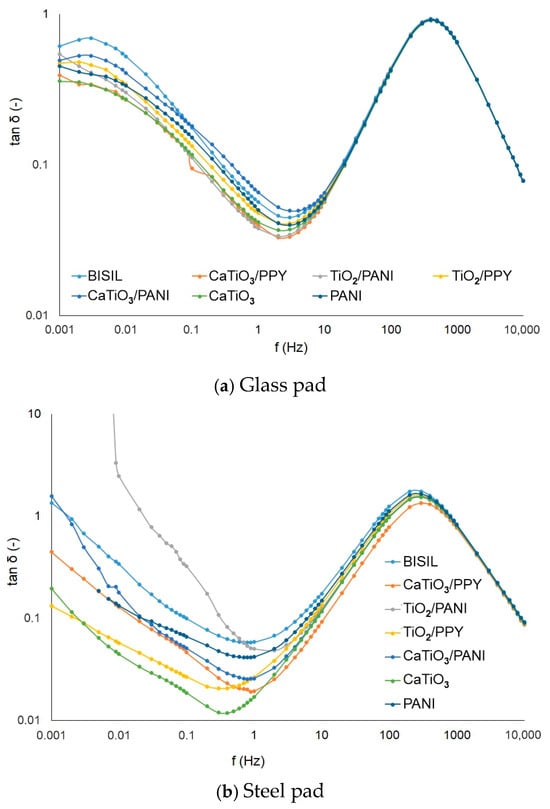
Figure 8.
IDAX insulation diagnostic analyzer: The loss factor of paints before the aging process.
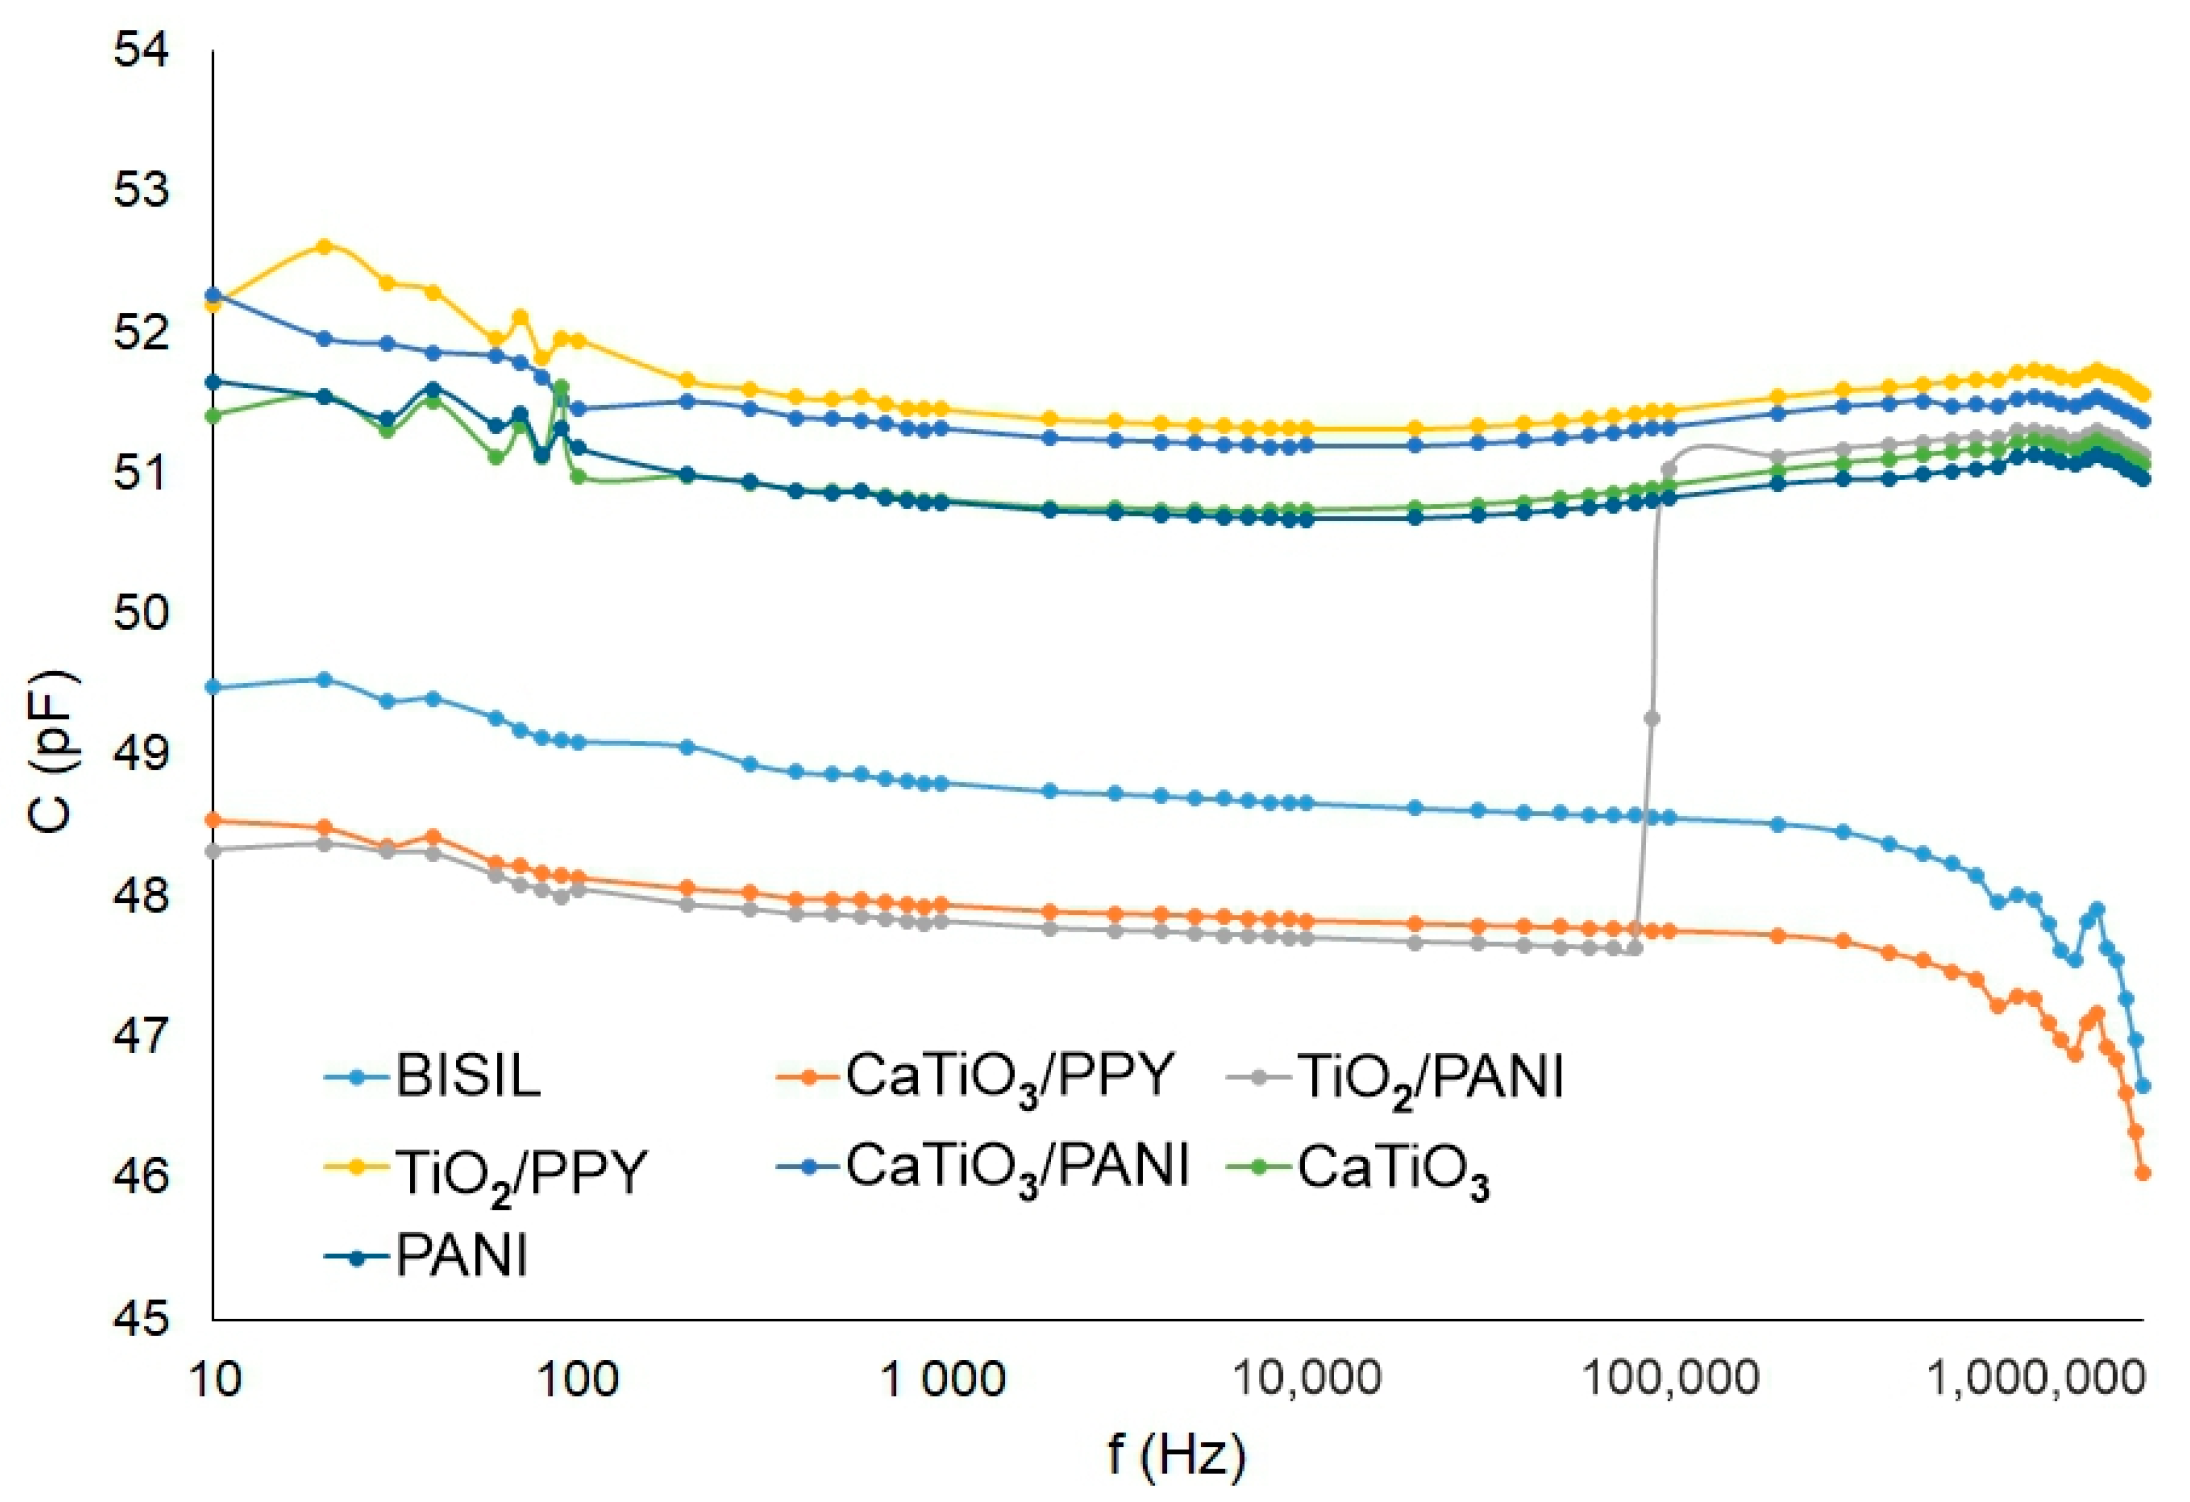
Figure 9 shows the capacitance of different painting types on a glass sheet.
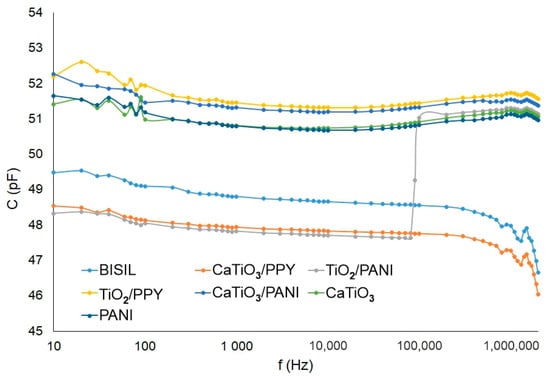
Figure 9.
Agilent precision LCR meter—capacitance of the paint—glass sheet.
The BISIL coatings had the highest capacitance for the steel plate case. Other capacitance values for other samples were evenly distributed in the 90–170 pF range.
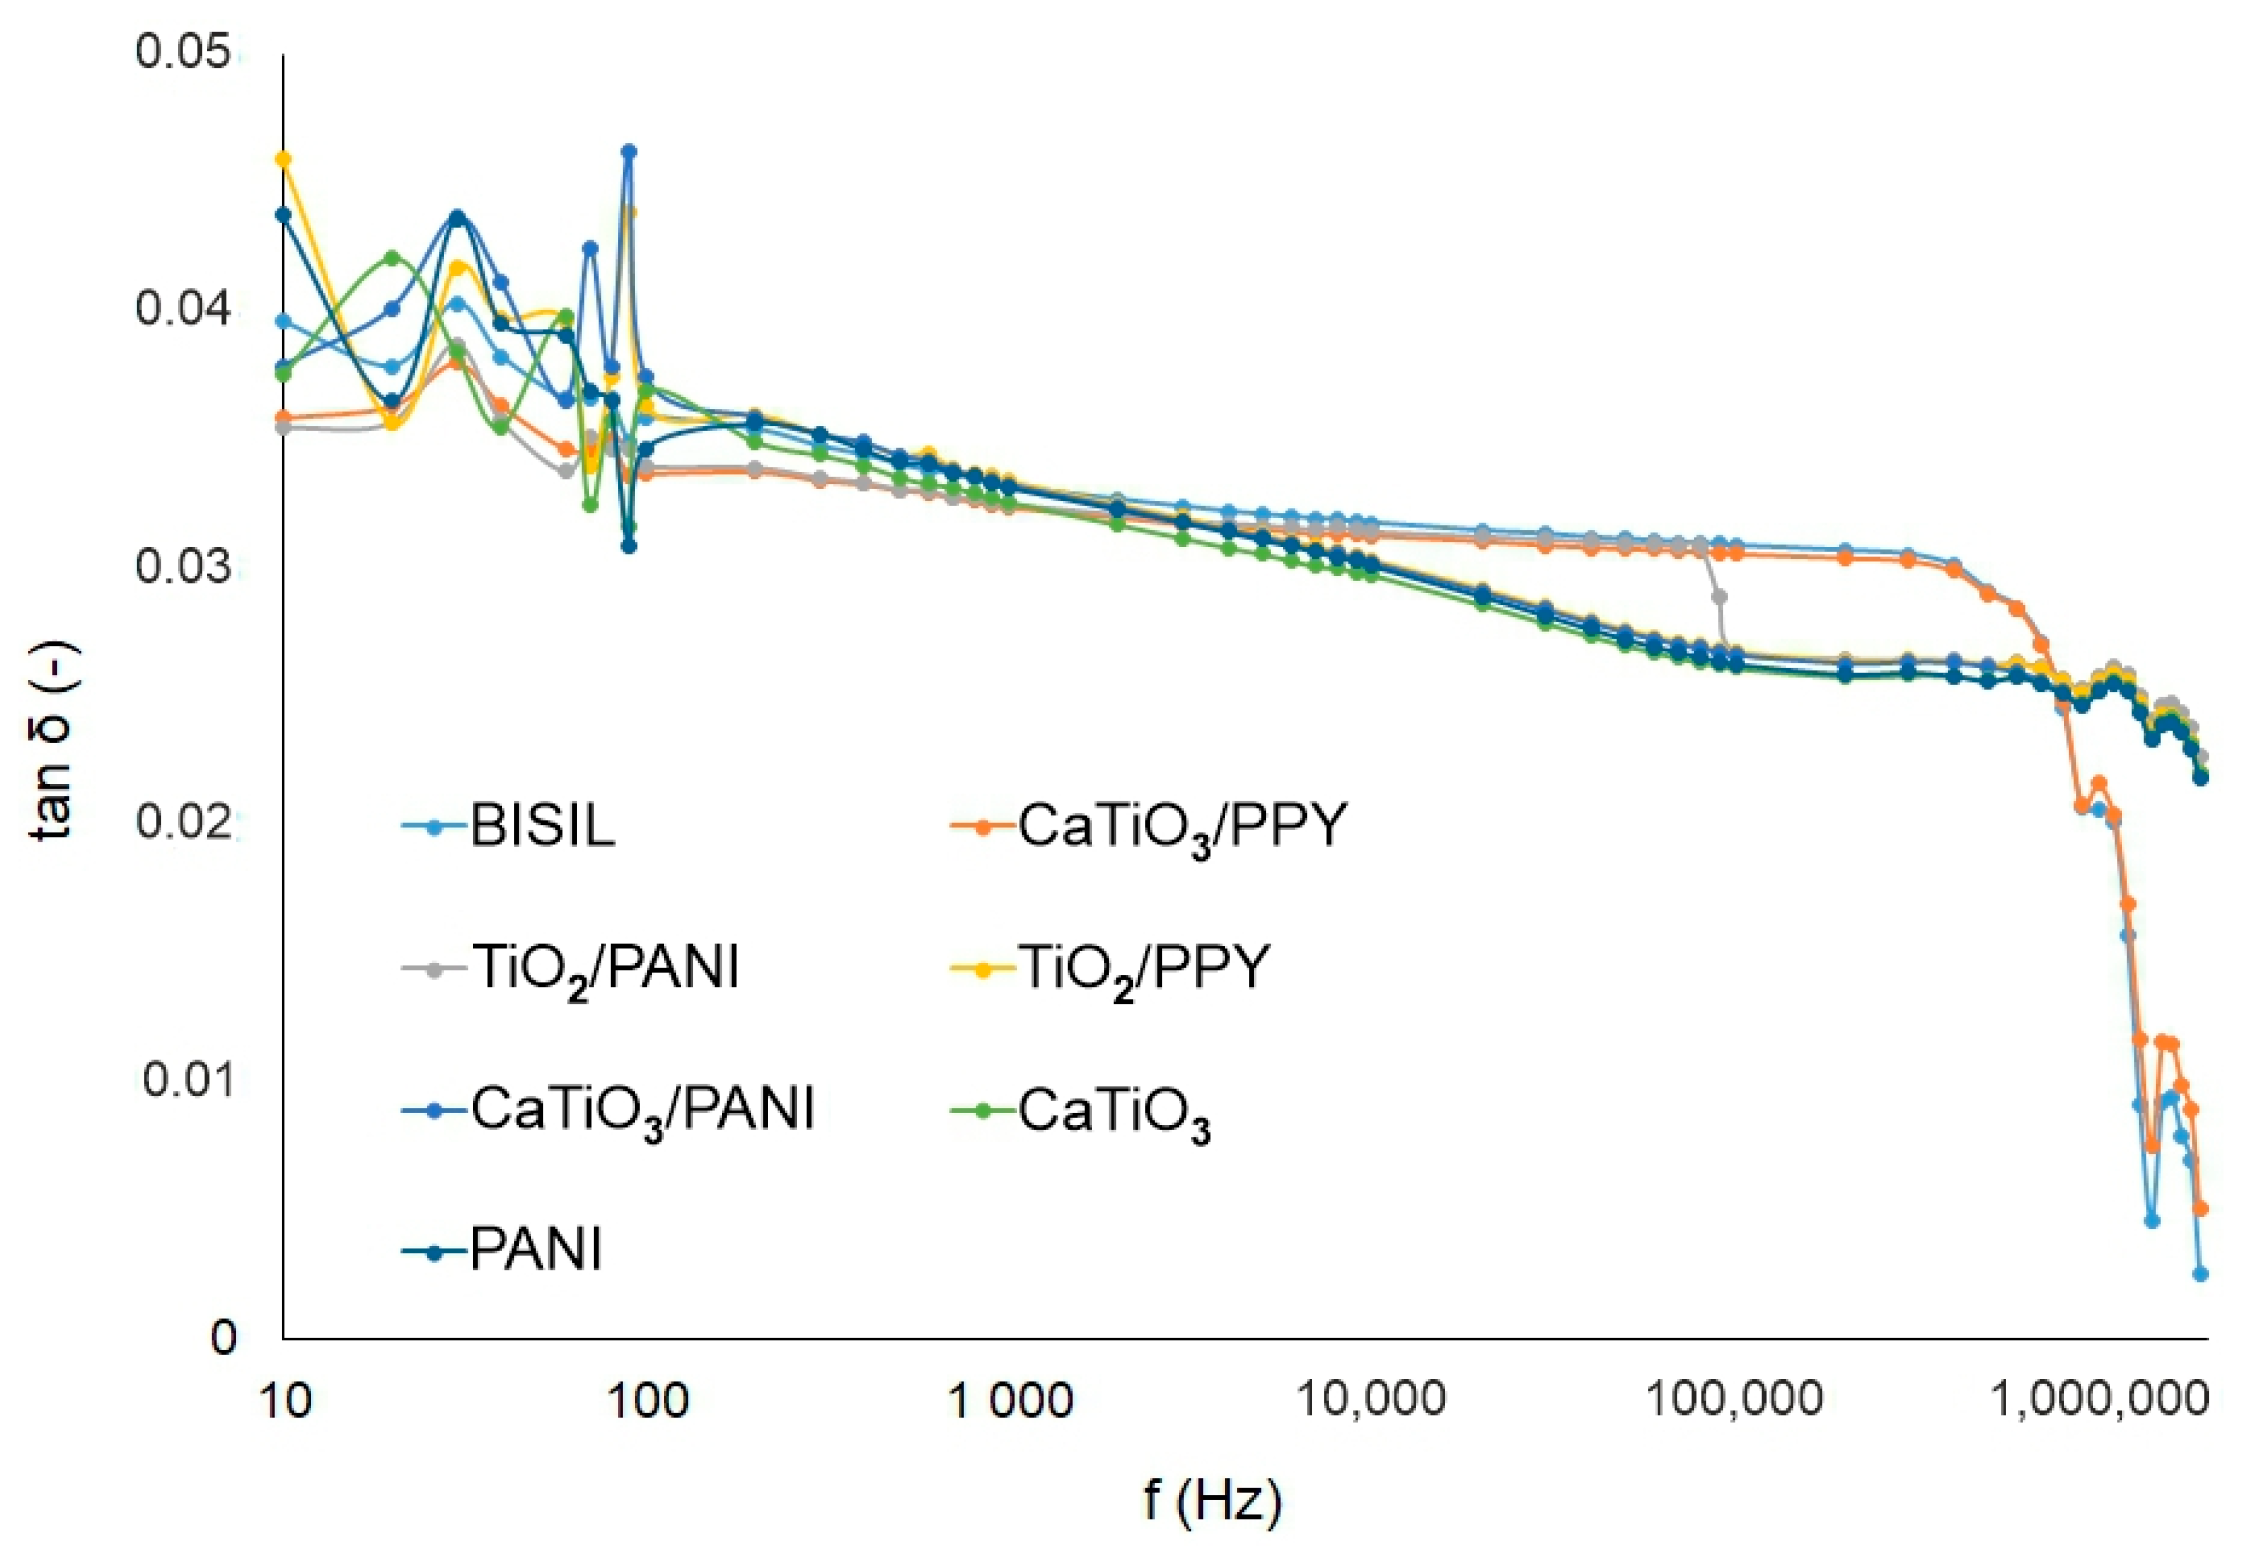
The loss factor has a decreasing tendency in this case. In the higher frequency range, the most conductive coating was PANI in comparison with other samples. The maximal value tg δ ≈ 0.5 was observed at 40 Hz frequency (Figure 10).
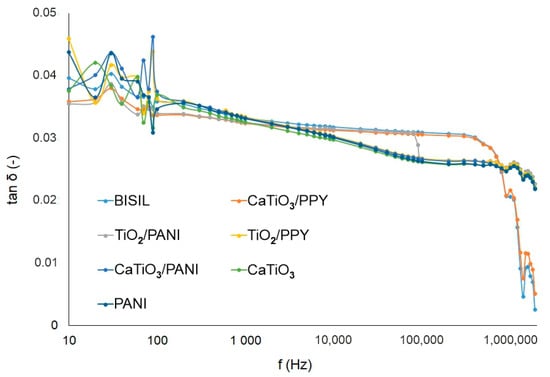
Figure 10.
Agilent precision LCR meter—loss factor of the paint—steel plate.
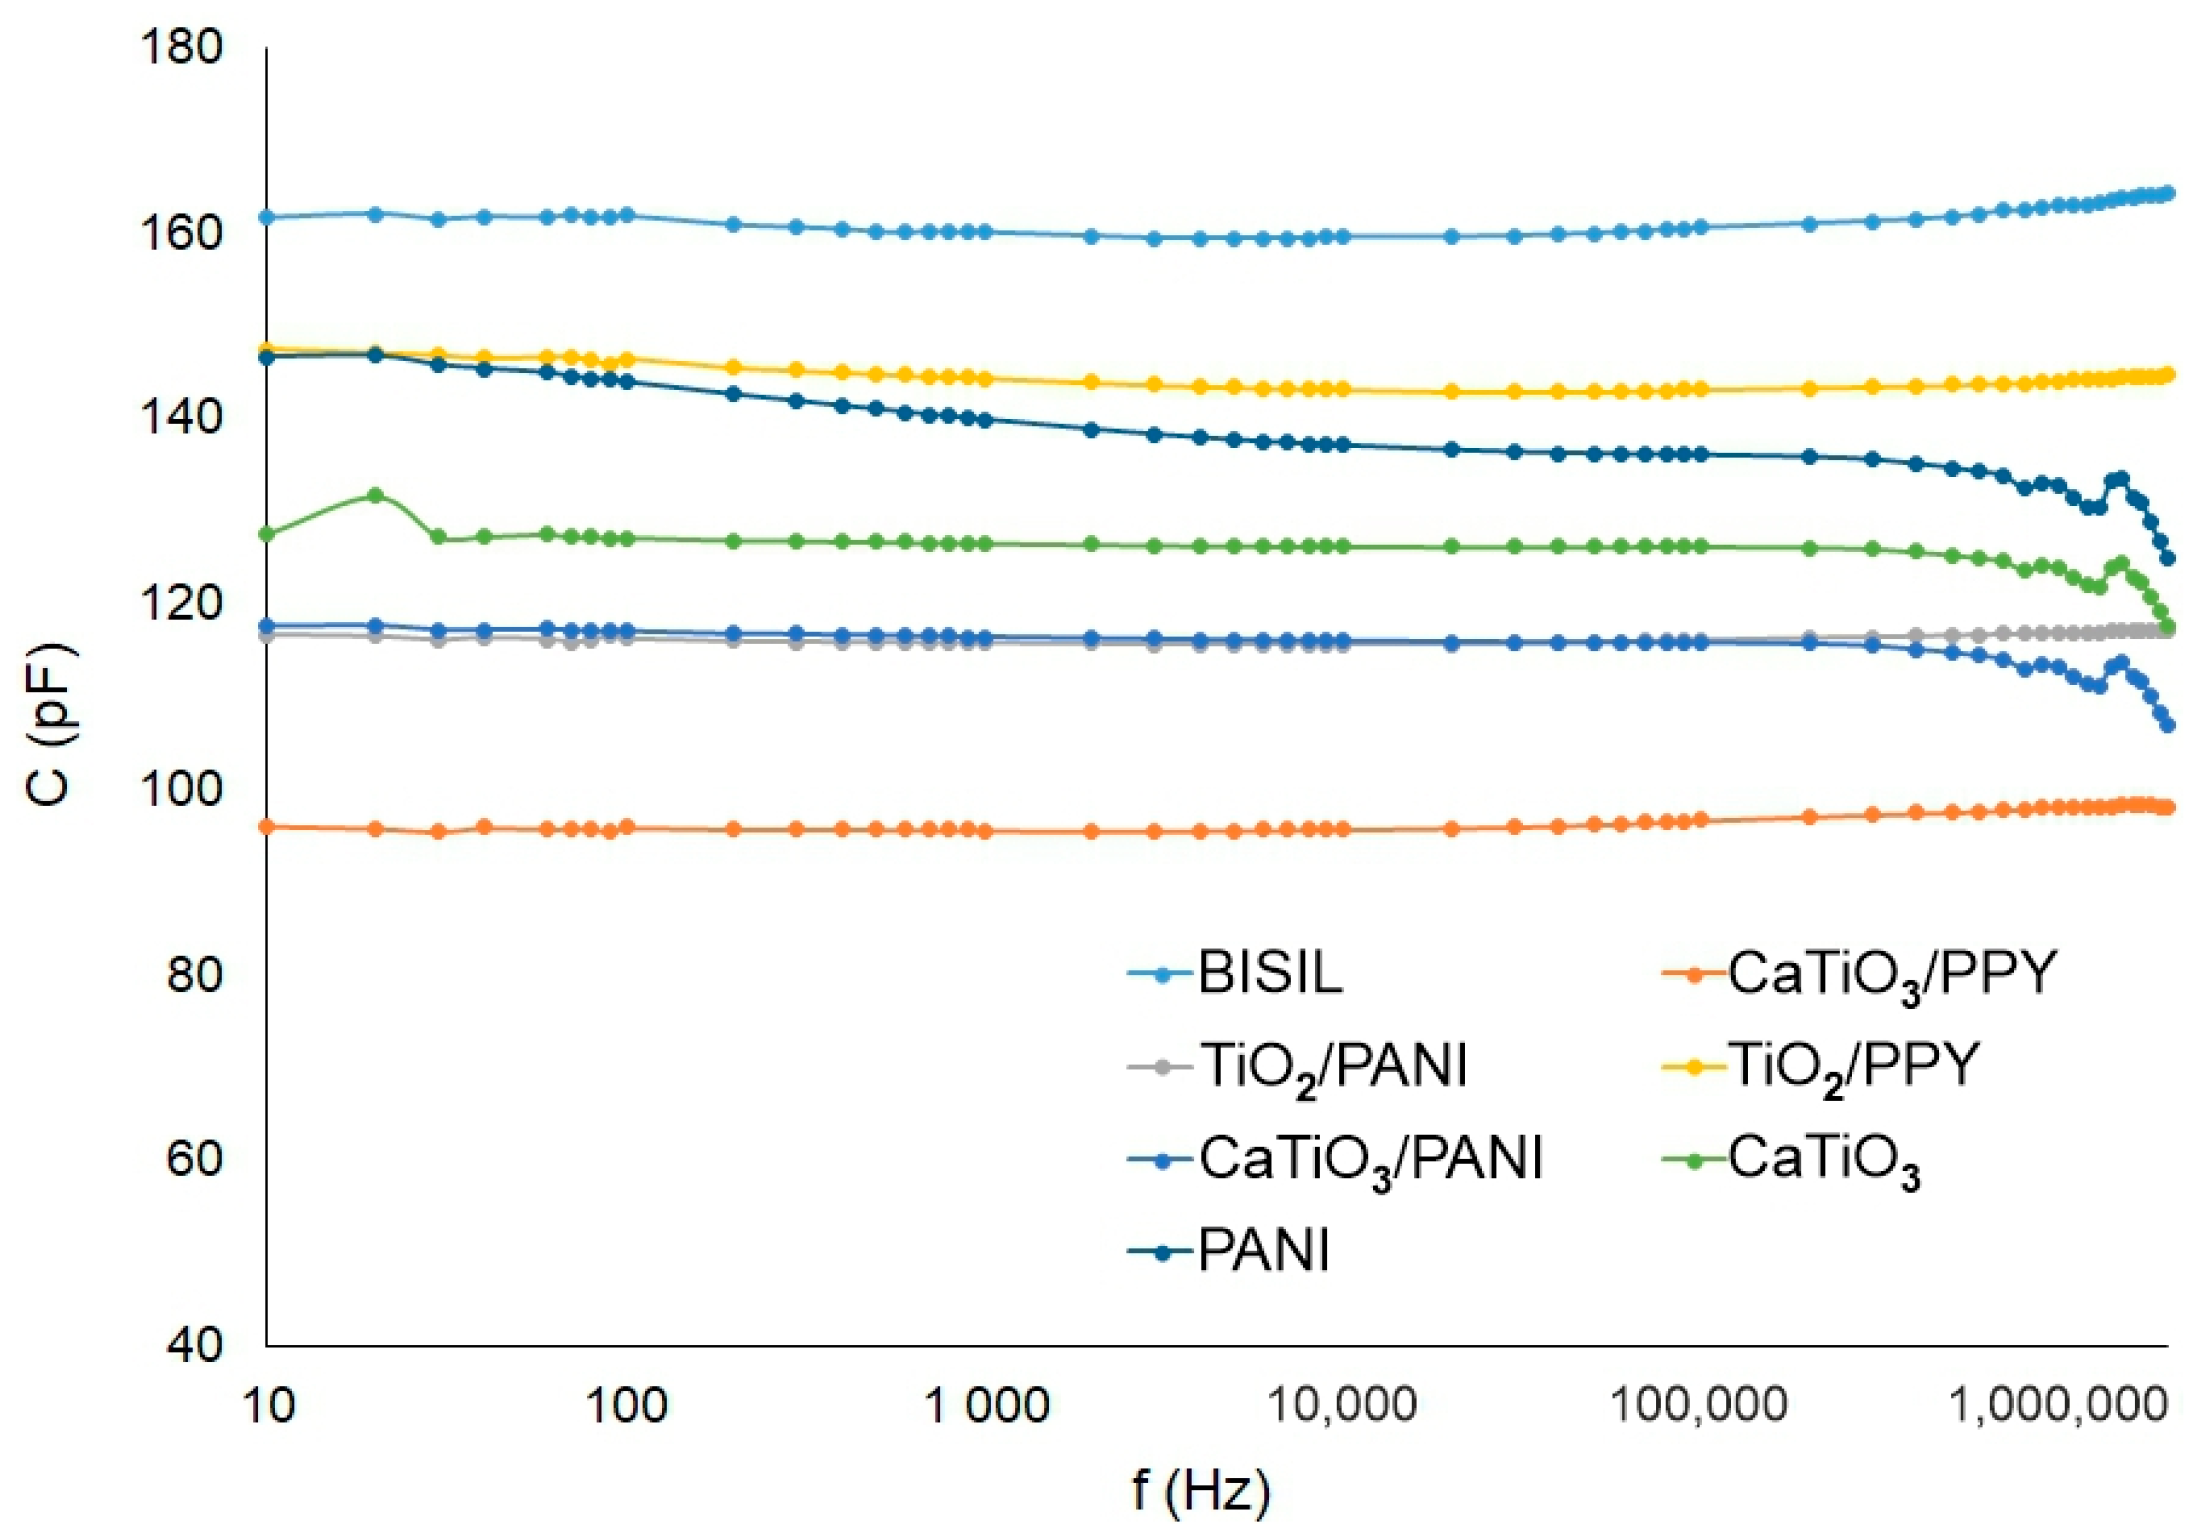
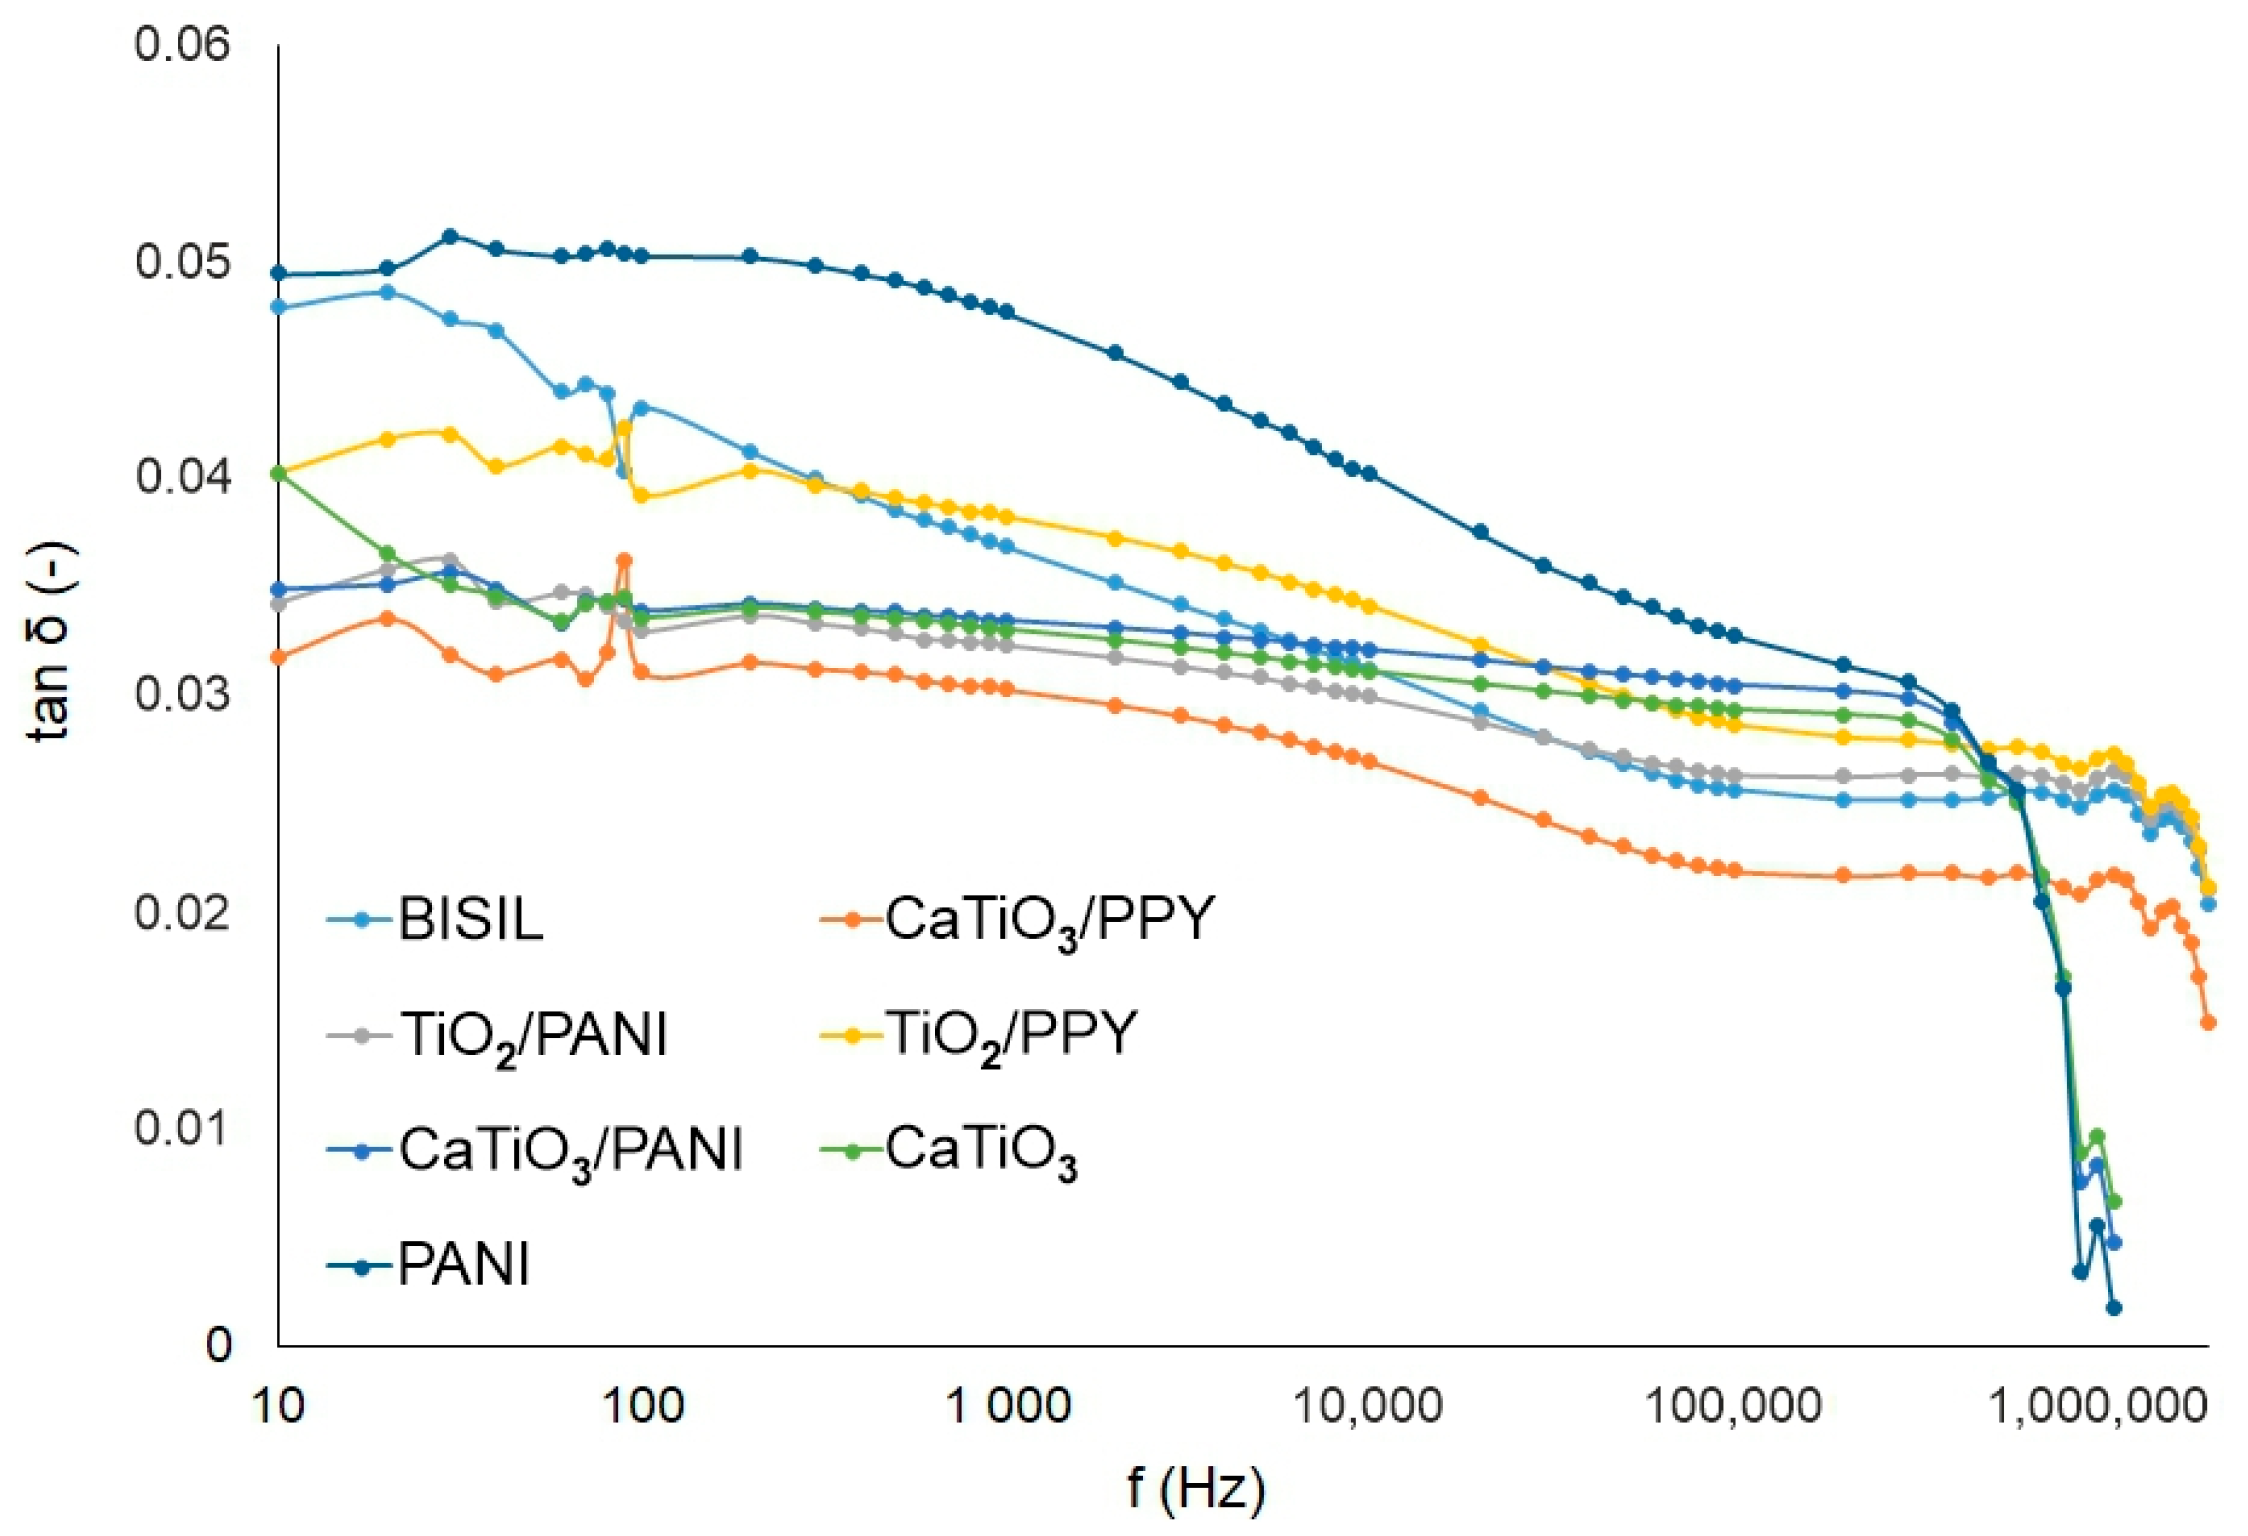
In the summary graphs in Figure 11 and Figure 12, the differences in capacitance changes and loss factor changes are depicted.
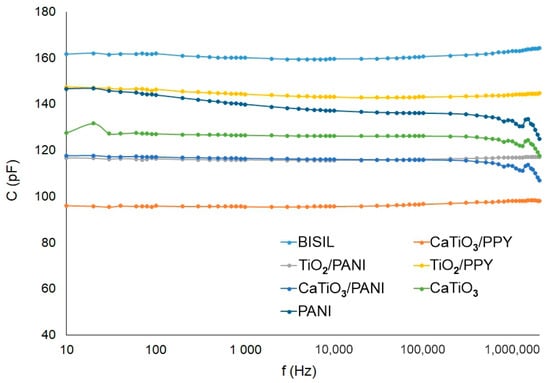
Figure 11.
Agilent precision LCR meter—sample capacitance after the aging process—steel plate.
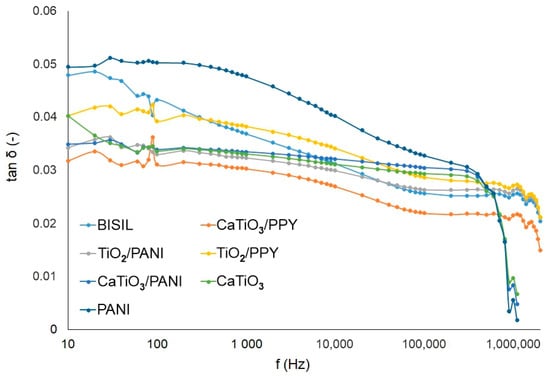
Figure 12.
Agilent precision LCR meter—Loss factor of the samples after the aging process—steel plate.
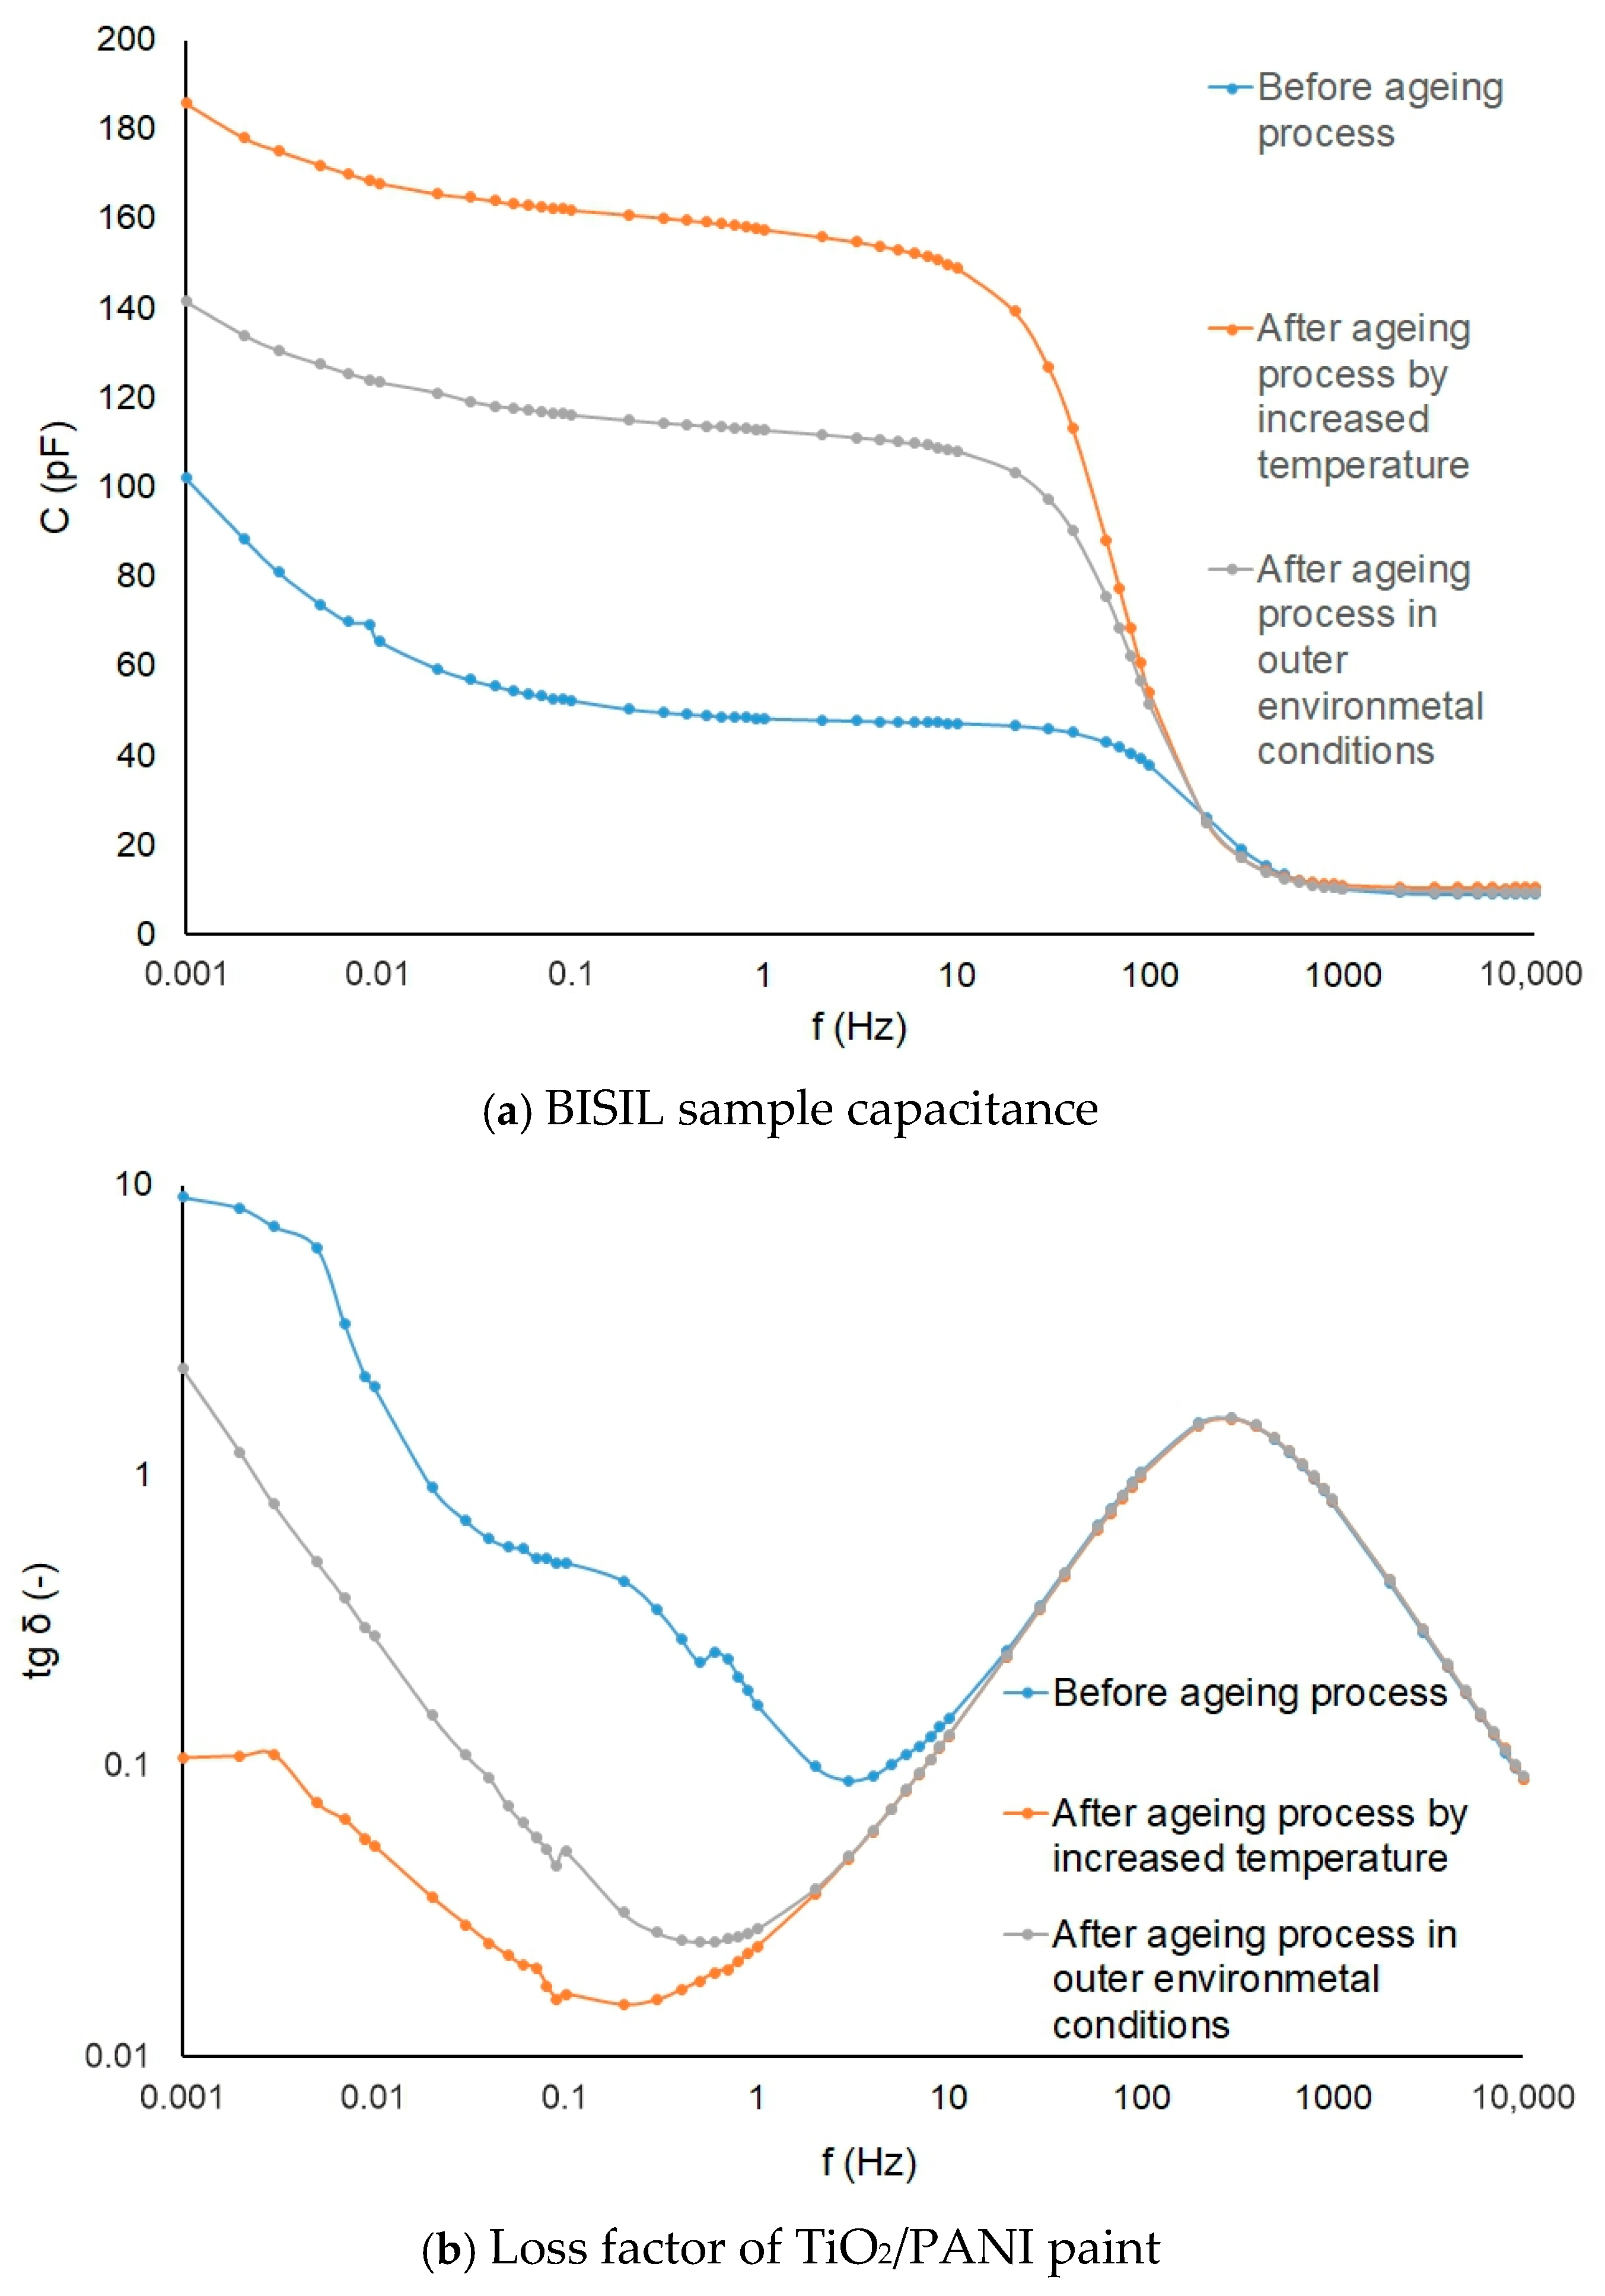
The aging process influence is shown on BISIL paint (Figure 13a), and the loss factor changes are depicted on the TiO2/PANI coating samples (Figure 13b).
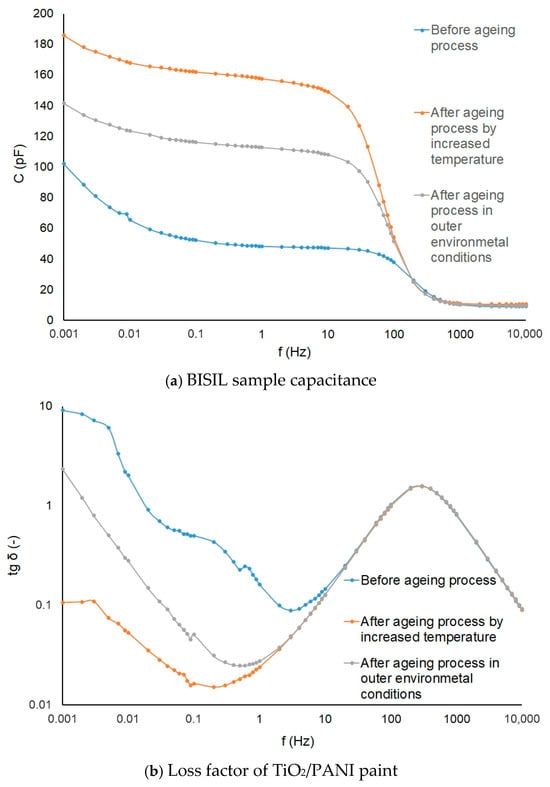
Figure 13.
Capacitance and lost factor of samples before and after the aging process.
The graphs in Figure 13a show that aging causes chemical changes in the material. Since the geometrical dimensions of the samples examined did not change, the relative permittivity of the coatings must have changed. Greater changes occur when aging in a hot, dry environment than in a cold, wet environment. There was probably a gradual release of volatiles from the coatings, but this could be determined by chemical analysis of the coatings.
The loss factor is proportional to the conductivity of the material. The graph in Figure 13b shows that the loss factor, and hence the conductivity, decreased slightly more when aging in a moist, cold environment. When aging is in progress in a warm, dry environment, the loss factor at low frequencies drops a hundredfold. The reason for the conductivity decrease lies probably in the chemical components of the paintings. The aging time was relatively short, and the aging process could not significantly change the electrical properties of the paintings. In the material, there were chemical properties in progress even after aging, but this was not the aim of our research.
It is obvious that the capacitance increases during the aging process in the oven. The loss factor tg δ had the highest value in the initial state.
In a dry and hot environment, first, the painting drying was manifested, and probably some chemical components evaporated. In an external humid and cold environment, the degradation of the painting manifested.
4. Conclusions
We found that the aging process causes chemical changes in the material, and also, the relative permittivity of the coating materials changes. In a hot and dry environment, the changes are more significant than in a cold and wet environment.
The loss factor and, hence, the conductivity decreased more slightly when aging in a moist, cold environment in opposite to the aging in a warm, dry environment when the loss factor at low frequencies dropped much more. It is obvious that the capacitance increases during the aging process in the oven.
In a dry and hot environment, in comparison to the external humid and cold environment, the degradation of the painting manifested significantly.
The reliability of antistatic paints was proven in these experiments. Presented paints have a high value of conductivity in general. After the experiments, the most reliable conductive paintings appeared to be the ones with PANI polymer. The high conductivity of this polymer was proven by high conductive current values and higher loss factor values.
For reliable electrostatic charge elimination on non-conductive surfaces, the BISIL paint can be used. This paint had the highest capacitance value under various conditions. Our experiments also showed the influence of the underlying material on the electrical parameters of the paints. The aging process influenced the loss factor and, at the same time, the quality of the paint material. The paints in our experiments are also suitable for metallic underlying materials due to their anti-corrosion protection in extreme conditions because they contain zinc.
Author Contributions
Conceptualization, J.D. and J.P.; methodology, J.D. and J.P.; validation, J.D. and J.P.; formal analysis, J.D. and J.P.; investigation, J.D. and J.P.; resources, J.D., J.P., A.G. and A.K.; data curation, J.D. and J.P.; writing—original draft preparation, J.D., J.P., A.G. and A.K.; writing—review and editing, J.D. and J.P.; visualization, J.D. and J.P.; supervision, A.G. and A.K.; funding acquisition, J.D., J.P., A.G. and A.K. All authors have read and agreed to the published version of the manuscript.
Funding
This research was funded by the Slovak Academy of Sciences and the Ministry of Education in the framework of project VEGA 2/0011/20, 1/0154/21, 1/0340/18, Slovak Research and Development Agency under contract Nos. APVV-18-0160 and APVV-15-0438.
Institutional Review Board Statement
Not applicable.
Informed Consent Statement
Not applicable.
Data Availability Statement
The raw data supporting the conclusions of this article will be made available by the authors upon request.
Acknowledgments
This publication is the result of the project implementation: Innovative Testing Procedures for 21st Century Industry ITMS: 313011T565.
Conflicts of Interest
The authors declare no conflicts of interest.
References
- Prokeš, J.; Stejskal, J.; Omastová, M. Polyaniline and polypyrrole—Two representatives of conductive polymers. Chem. Lett. 2001, 95, 484–492. [Google Scholar]
- Schultze, J.W.; Karabulut, H. Application potential of conducting polymers. Electrochim. Acta 2005, 50, 1739–1745. [Google Scholar] [CrossRef]
- Somboonsub, B.; Srisuwan, S.; Invernale, M.A.; Thongyai, S.; Praserthdam, P.; Scola, D.A.; Sotzing, G.A. Comparison of the thermally stable conducting polymers PEDOT, PANi, and PPy using sulfonated poly(imide) templates. Polymer 2010, 51, 4472–4476. [Google Scholar] [CrossRef]
- Király, F.R. Temperature dependence of electrical properties in conductive polymer composites. Polym. Test. 2015, 43, 154–162. [Google Scholar] [CrossRef]
- AL-Oqla, F.M.; Sapuan, S.M.; Anwer, T.; Jawaid, M.; Hoque, M.E. Natural fiber reinforced conductive polymer composites as functional materials: A review. Synth. Met. 2015, 206, 42–54. [Google Scholar] [CrossRef]
- Balinta, R.; Cassidy, N.J.; Cartmell, S.H. Conductive polymers: Towards a smart biomaterial for tissue engineering. Acta Biomater. 2014, 10, 2341–2353. [Google Scholar] [CrossRef] [PubMed]
- Guimard, N.K.; Gomez, N.; Schmidt, C.E. Conducting polymers in biomedical engineering. Prog. Polym. Sci. 2007, 32, 876–921. [Google Scholar] [CrossRef]
- Abu-Thabit, N.Y.; Makhlouf, A.S.H. 17-Recent Advances in Polyaniline (PANI)-Based Organic Coatings for Corrosion Protection. In Handbook of Smart Coatings for Materials Protection; Woodhead Publishing: Cambridge, UK, 2014; pp. 459–486. [Google Scholar]
- Stejskal, J. Polymers of phenylenediamines. Prog. Polym. Sci. 2015, 41, 1–31. [Google Scholar] [CrossRef]
- Abaci, U.; Guney, H.Y.; Kadiroglu, U. Morphological and electrochemical properties of PPy, PAni bilayer films and enhanced stability of their electrochromic devices (PPy/PAni–PEDOT, PAni/PPy–PEDOT). Electrochim. Acta 2013, 95, 214–224. [Google Scholar] [CrossRef]
- Sanches, E.A.; Silva, J.M.S.; Ferreira, J.M.O.; Soares, J.C.; Santos, A.L.; Trovati, G.; Fernandes, E.G.R.; Mascarenhas, Y.P. Nanostructured Polyaniline Emeraldine-base form (EB-PANI), a structural investigation for different neutralization times. J. Mol. Struct. 2014, 1074, 732–737. [Google Scholar] [CrossRef]
- Vernitskaya, T.V.; Efimov, O.N. Polypyrrole a conducting polymer; its synthesis, properties and Applications. Ossian Chem. Rev. 1997, 66, 446–449. [Google Scholar] [CrossRef]
- Kang, E.T.; Neoh, K.G.; Tan, K.L. Polyaniline: A polymer with many interesting intrinsic redox states. Prog. Polym. Sci. 1998, 23, 277–324. [Google Scholar] [CrossRef]
- Li, X.G.; Huang, M.R.; Duan, W. Novel Multifunctional Polymers from Aromatic Diamines by Oxidative Polymerizations. Chem. Rev. 2002, 102, 2925–3030. [Google Scholar] [CrossRef] [PubMed]
- Blinova, N.V.; Stejskal, J.; Trchová, M.; Prokeš, J. Polyaniline prepared in solutions of phosphoric acid, Powders, thin films, and colloidal dispersions. Polymer 2006, 47, 42–43. [Google Scholar] [CrossRef]
- Stejskal, J.; Kratochvíl, P.; Helmstedt, M. Polyaniline Dispersions. 5. Poly(vinyl alcohol) and Poly(N-vinylpyrrolidone) as Steric Stabilizers. Langmuir 1996, 12, 3389–3392. [Google Scholar] [CrossRef]
- Campos, T.L.A.; Kersting, D.F.; Ferreira, C.A. Chemical synthesis of polyaniline using sulphanilic acid as dopant agent into the reactional medium. Surf. Coat. Technol. 1999, 122, 3–5. [Google Scholar] [CrossRef]
- Stejskal, J.; Riede, A.; Hlavatá, D.; Prokeš, J.; Helmstedt, M.; Holler, P. The effect of polymerization temperature on molecular weight, crystallinity, and electrical conductivity of polyaniline. Synth. Met. 1998, 96, 55–61. [Google Scholar] [CrossRef]
- Trchová, M.; Matějka, P.; Brodinová, J.; Kalendová, A.; Prokeš, J.; Stejskal, J. Structural and conductivity changes during the pyrolysis of polyaniline base. Polym. Degrad. Stab. 2006, 91, 114–121. [Google Scholar] [CrossRef]
- Gedela, V.R.; Srikanth, V.V.S.S. Electrochemically active polyaniline nanofibers (PANi NFs) coated graphene nanosheets/PANi NFs composite coated on different flexible substrates. Synth. Met. 2014, 193, 71–76. [Google Scholar] [CrossRef]
- Jamadade, V.S.; Dhawale, D.S.; Lokhande, C.D. Studies on electrosynthesized leucoemeraldine, emeraldine and pernigraniline forms of polyaniline films and their supercapacitive behavior. Synth. Met. 2010, 160, 955–960. [Google Scholar] [CrossRef]
- Kulkarni, M.V.; Kale, B.B. Studies of conducting polyaniline (PANI) wrapped-multiwalled carbon nanotubes (MWCNTs) nanocomposite and its application for optical pH sensing. Sens. Actuators B Chem. 2013, 187, 407–412. [Google Scholar] [CrossRef]
- Huang, M.-R.; Peng, Q.-Y.; Li, X.-G. Rapid and Effective Adsorption of Lead Ions on Fine Poly(phenylenediamine) Microparticles. Chem. Eur. J. 2006, 12, 4342–4350. [Google Scholar] [CrossRef]
- Gustavo, M.; do Nascimento, R.; Sestrem, H.; Marcia, L.A. Temperini: Structural characterization of poly-para-phenylenediamine–montmorillonite clay nanocomposites. Synth. Met. 2010, 160, 2397–2403. [Google Scholar]
- Siva, T.; Kamaraj, K.; Sathiyanarayanan, S. Epoxy curing by polyaniline (PANI)—Characterization and self-healing evaluation. Prog. Org. Coat. 2014, 77, 1095–1103. [Google Scholar] [CrossRef]
- Pereira, V.R.; Isloor, A.M.; Bhat, U.K.; Ismail, A.F. Preparation and antifouling properties of PVDF ultrafiltration membranes with polyaniline (PANI) nanofibers and hydrolysed PSMA (H-PSMA) as additives. Desalination 2014, 351, 220–227. [Google Scholar] [CrossRef]
- Ding, L.; Wang, X.; Gregory, R.V. Thermal properties of chemically synthesized polyaniline (EB) powder. Synth. Met. 1999, 104, 73–78. [Google Scholar] [CrossRef]
- Bhadra, S.; Khastgir, D. Degradation and stability of polyaniline on exposure to electron beam irradiation (structure–property relationship). Polym. Degrad. Stab. 2007, 92, 1824–1832. [Google Scholar] [CrossRef]
- Shumakovich, G.; Kurova, V.; Vasil’eva, I.; Pankratov, D.; Otrokhov, G.; Morozova, O.; Yaropolov, A. Laccase-mediated synthesis of conducting polyaniline. J. Mol. Catal. B Enzym. 2012, 77, 105–110. [Google Scholar] [CrossRef]
- Wessling, B. Scientific and commercial breakthrough for organic metals. Synth. Met. 1997, 85, 1313–1318. [Google Scholar] [CrossRef]
- Trchová, M.; Stejskal, J. Polyaniline, The infrared spectroscopy of conducting polymer nanotubes (IUPAC Technical Report). Pure Appl. Chem. 2011, 83, 1803–1817. [Google Scholar] [CrossRef]
- Al-Ahmed, A.; Mohammad, F.; Rahman, M.Z.A. Preparation, characterization, thermooxidative degradation, and stability of polyaniline/polyacrylonitrile composites in terms of direct-current electrical conductivity retention. J. Appl. Polym. Sci. 2006, 99, 437–448. [Google Scholar] [CrossRef]
- Armelin, E.; Alemán, C.; Iribarren, J.I. Anticorrosion performances of epoxy coatings modified with polyaniline: A comparison between the emeraldine base and salt forms. Prog. Org. Coat. 2009, 65, 88–93. [Google Scholar] [CrossRef]
- Akbarinezhad, E.; Ebrahimi, M.; Sharif, F.; Attar, M.M.; Faridi, H.R. Synthesis and evaluating corrosion protection effects of emeraldine base PAni/clay nanocomposite as a barrier pigment in zinc-rich ethyl silicate primer. Prog. Org. Coat. 2011, 70, 39–44. [Google Scholar] [CrossRef]
- Armelin, E.; Pla, R.; Liesa, F.; Ramis, X.; Iribarren, J.I.; Alemán, C. Corrosion protection with polyaniline and polypyrrole as anticorrosive additives for epoxy paint. Corros. Sci. 2008, 50, 721–728. [Google Scholar] [CrossRef]
- Armelin, E.; Martí, M.; Liesab, F.; Iribarren, J.I.; Alemán, C. Partial replacement of metallic zinc dust in heavy duty protective coatings by conducting polymer. Prog. Org. Coat. 2010, 69, 26–30. [Google Scholar] [CrossRef]
- Ozyilmaz, A.T.; Akdag, A.; Karahan, I.H.; Ozyilmaz, G. The influence of polyaniline (PANI) coating on corrosion behaviour of zinc–cobalt coated carbon steel electrode. Prog. Org. Coat. 2013, 76, 993–997. [Google Scholar] [CrossRef]
- Mahato, N.; Cho, M.H. Graphene integrated polyaniline nanostructured composite coating for protecting steels from corrosion: Synthesis, characterization, and protection mechanism of the coating material in acidic environment. Constr. Build. Mater. 2016, 115, 618–633. [Google Scholar] [CrossRef]
- Sathiyanarayanan, S.; Azim, S.S.; Venkatachari, G.G. Corrosion resistant properties of polyaniline–acrylic coating on magnesium alloy. Appl. Surf. Sci. 2006, 253, 2113–2117. [Google Scholar] [CrossRef]
- Samui, A.B.; Patankar, A.S.; Rangarajan, J.; Deb, P.C. Study of polyaniline containing paint for corrosion prevention. Prog. Org. Coat. 2003, 47, 1–7. [Google Scholar] [CrossRef]
- Zhao, Y.; Zhang, Z.; Yu, L. Corrosion protection of carbon steel by electrospun film containing polyaniline microfibers. React. Funct. Polym. 2016, 102, 20–26. [Google Scholar] [CrossRef]
- Rout, T.K.; Jha, G.; Singh, A.K.; Bandyopadhyay, N.; Mohanty, O.N. Development of conducting polyaniline coating: A novel approach to superior corrosion resistance. Surf. Coat. Technol. 2003, 167, 16–24. [Google Scholar] [CrossRef]
- Kohl, M.; Kalendová, A. Effect of polyaniline salts on the mechanical and corrosion properties of organic protective coatings. Prog. Org. Coat. 2015, 86, 96–107. [Google Scholar] [CrossRef]
- Kalendová, A.; Sapurina, I.; Stejskal, J.; Veselý, D. Anticorrosion properties of polyaniline-coated pigments in organic coatings. Corros. Sci. 2008, 50, 3549–3560. [Google Scholar] [CrossRef]
- Kalendová, A.; Veselý, D. Study of the anticorrosive efficiency of zincite and periclase-based core–shell pigments in organic coatings. Prog. Org. Coat. 2009, 64, 5–19. [Google Scholar] [CrossRef]
- Stejskal, J.; Trchová, M.; Brodinová, J.; Kalenda, P.; Fedorova, S.V.; Prokeš, J.; Zemek, J. Coating of zinc ferrite particles with a conducting polymer, polyaniline. J. Colloid Interface Sci. 2006, 298, 87–93. [Google Scholar] [CrossRef] [PubMed]
- Kalendová, A.; Veselý, D.; Kohl, M.; Stejskal, J. Anticorrosion efficiency of zinc-filled epoxy coatings containing conducting polymers and pigments. Prog. Org. Coat. 2015, 78, 1–20. [Google Scholar] [CrossRef]
- ANSI/ESD STM11.11-2006; Surface Resistance Measurement of Static Dissipative Planar Materials. Electrostatic Discharge Association: Rome, Italy, 2006.
Disclaimer/Publisher’s Note: The statements, opinions and data contained in all publications are solely those of the individual author(s) and contributor(s) and not of MDPI and/or the editor(s). MDPI and/or the editor(s) disclaim responsibility for any injury to people or property resulting from any ideas, methods, instructions or products referred to in the content. |
© 2025 by the authors. Licensee MDPI, Basel, Switzerland. This article is an open access article distributed under the terms and conditions of the Creative Commons Attribution (CC BY) license (https://creativecommons.org/licenses/by/4.0/).