Review

Redefining Archaeological Research: Digital Tools, Challenges, and Integration in Advancing Methods

by
Stella Sylaiou
1,*,
Zoi-Eirini Tsifodimou
2,
Konstantinos Evangelidis
1,
Aikaterini Stamou
2,
Ioannis Tavantzis
2,
Alexandros Skondras
2 and
Efstratios Stylianidis
2
1
Department of Geoinformatics and Surveying Engineering, International Hellenic University, 62124 Serres, Greece
2
School of Spatial Planning and Development, Laboratory of Geoinformatics, Aristotle University of Thessaloniki, 54124 Thessaloniki, Greece
*
Author to whom correspondence should be addressed.
Appl. Sci. 2025, 15(5), 2495; https://doi.org/10.3390/app15052495
Submission received: 13 November 2024 / Revised: 22 December 2024 / Accepted: 26 December 2024 / Published: 26 February 2025
(This article belongs to the Special Issue Advanced Technologies in Cultural Heritage)

Abstract

:
This paper explores the diverse array of digital tools utilized for data acquisition in archaeology. This abstract outlines the various categories of digital tools commonly employed, including geographic information systems (GISs), global positioning systems (GPSs), remote sensing technologies, 3D scanning and photogrammetry, drones and aerial photography, as well as mobile applications and digital recording systems. Each category is elucidated with examples of their application in archaeological research, emphasizing their roles in site mapping, spatial data collection, artefact documentation, and landscape analysis. Furthermore, it discusses the advancements, challenges, and best practices associated with the integration of digital tools into archaeological fieldwork. It also highlights the potential for future developments in digital technologies to enhance data acquisition capabilities further, ultimately contributing to a deeper understanding of human history and cultural heritage.

1. Introduction

Archaeological research relies on accurate data collection to uncover and interpret past human behaviors and environments. Data acquisition has always been essential in practice. Traditional methods, while effective, have limitations in terms of precision, efficiency, and data management. In response, researchers have increasingly turned to digital tools to enhance data acquisition processes. In recent decades, digitization in data collection has reshaped archaeological fieldwork, impacting both traditional methods and the interpretation of sites and findings. Digital photogrammetry and laser scanning have revolutionized how data are captured, making documentation faster and more precise. Over the last two decades, tools like photogrammetry, laser scanning, and unmanned aerial vehicles (UAVs) have greatly enhanced the documentation of cultural heritage [1]. These techniques now provide detailed 3D models of sites, artefacts, and monuments and are becoming increasingly accessible and user-friendly. This paper explores documentation methods for cultural heritage and considers how different approaches affect archaeologists’ workflows and the broader field of archaeology. The shift to digital methods has also brought challenges, such as the management of large volumes of information, loss of valuable on-site insight, and necessity of effective data management solutions. In our study, we discuss traditional methods of data acquisition versus the advantages of the digital tools used currently, from GISs and remote sensing to 3D photogrammetry and mobile applications, presenting selected case studies of their application found in the literature and providing the latest trends, advances, and challenges in the field.

2. Traditional Methods vs. Digital Tools

2.1. Traditional Data Acquisition Methods in Archaeology

The data acquisition methods used in archaeology have historically relied on field observations and measurements that often involved manual drawing on paper. Data collection, analysis, and visualization included a manual survey in the field to record site locations and features, drawing site plans and excavation details, and keeping records with notes, sketches, and photographs. Excavation-based methods such as trial excavations were invasive, costly, and often risked damage to archaeological features. Moreover, they were able to provide detailed information for only small areas. The use of topographic instruments such as theodolites usually accompanied on-site excavations, offering archaeologists data with geographic references [2]. A common practice, alongside topographic measurements, was the analysis and interpretation of aerial photographs for archaeological purposes. Early aerial photography improved the research processes, but the images were often qualitative and lacked detailed analysis. This process relies on individual observation and depends primarily on the user’s level of expertise [3]. In general, these approaches were time-consuming, prone to inaccuracy, and, more significantly, made it difficult to analyze large datasets or integrate multiple data sources. Any statistical analysis of the spatial relationships among sites used basic tools that often limited the scope and precision of interpretations.
Three-dimensional visualizations included hand-drawn illustrations and physical models. Detailed drawings and cross-sections were created to represent artefacts and structures, but these methods often lacked consistency. Physical models, such as plaster casts, provided three-dimensional representations but were fragile, labor-intensive, and difficult to relocate. Overlayed photos, either terrestrial or aerial, resulted in 3D models that offered a limited sense of depth. In addition, manual measurements were prone to errors and could only provide partial data on the three-dimensional aspects of features.
Finally, traditionally, archaeologists kept their records in notebooks, often accompanied by sketches and measurements. Site locations and features were plotted on paper maps using tools like a compass and basic topographic instruments like a theodolite, but this process was slow and prone to errors. Data from field surveys were manually logged and later transferred to databases, a time-consuming task that introduced potential transcription errors.

2.2. Advantages of Digital Tools in Data Acquisition

Digital data acquisition tools have undoubtedly enhanced the level of accuracy in collecting useful information on archaeological sites or artefacts and helped archaeologists conduct more comprehensive analyses and precise surveys of historical sites. First, digital tools have the advantage of performing large-scale analyses not only across regions but also time periods, as they can recollect and provide information retrospectively [4]. Moreover, recently, in various studies, low-cost instruments have successfully provided accurate results, especially in areas where on-site measurements are difficult [5]. In addition, web-based applications used for archaeological purposes provide researchers the opportunity to conduct quantitative and statistical analyses of the historical information [6]. Finally, recent advancements in Artificial Intelligence (AI) have introduced a new era for collecting and analyzing data [7]. The following paragraphs describe the most employed digital tools, from geographic information systems (GISs) and global positioning systems (GPSs) to remote sensing technologies, 3D photogrammetry, and drones. To provide a comprehensive understanding, selected case studies and practical applications of these tools are also presented.

3. Types of Digital Tools

3.1. Geographic Information Systems (GISs)

Geographic information systems (GISs) have been utilized in archaeology since the 1980s [8]. Traditional methods involved manually creating site plans and recording excavation details by hand, with physical documentation—such as notes, drawings, and photographs—being the primary means of storing site information. Spatial relationships between sites were typically analyzed using manual calculations or simple tools.
GISs revolutionize this process by enabling the integration of spatially related data from various sources within a user-friendly environment. They allows researchers to monitor the spatial distribution of archaeological sites, detect patterns, and compare historical features. This technology provides an effective means of organizing and maintaining archaeological data. Using advanced GIS tools, archaeologists can identify potential archaeological sites based on factors such as topography, land use, and historical records. GISs also help researchers gain deeper insights into the spatial context of sites, facilitating more informed decisions about excavation strategies [9,10,11]. Moreover, GISs support exploration and analysis in both 2D and 3D formats, focusing on visualization, querying, and data analysis to enhance research processes. A 2D GIS integrates vector, raster, and textual data, while advances in the field have introduced 3D and even 4D applications to meet evolving users’ needs [12].
Several studies demonstrate how digital tools can enhance archaeological documentation, proving that GISs facilitate more accurate data collection and efficient site location analysis [13]. Representative works include the study in [14], which used GIS applications for the comprehensive mapping of Khirbat al-Jariya’s features in Jordan. Similarly, Luo et al. [15] utilized a GIS to map the locations of the Miran site and ancient Charkhlik in China (Figure 1). In another study, early Roman sites in the Kromme Rijn area of the Netherlands were analyzed using GIS tools, providing a reliable basis for detailed site mapping and significantly improving outcomes compared to traditional mapping methods [16] (Figure 2) [16].
Katsamudanga’s research [17] applied GIS tools to visualize prehistoric settlement patterns in southern Africa, produce 3D cave formations, and develop information systems for heritage management. These applications demonstrated the versatility of GISs in archaeological research. In Sauer’s study [11], the digital documentation of the Upper Paleolithic site of Bad Kösen-Lengefeld was developed using a GIS. Orthophotos derived from structure-from-motion processing were integrated into the GIS to define the source of the findings. This research showed that GIS tools enhanced recording accuracy, minimized transcription errors and excavator mistakes, and reduced post-processing time.

3.2. Global Positioning Systems (GPSs)

The first global navigation satellite system (GNSS), commonly known as a GPS, provides efficient, precise, and accurate measurements [18]. By employing real-time kinematic positioning (RTK), archaeologists can record the exact locations of artefacts with high precision and detail [19,20]. However, the effectiveness of a GPS is sometimes limited in environments with dense vegetation, urban areas with obstructed sky views, or deep trenches that can block or weaken GPS signals [21]. Typically, two devices are used in RTK setups, a base station and a receiver rover, which work together to ensure accurate positioning data (Figure 3).
Before the advent of GPSs, researchers relied on manual surveying, which required significant time and effort and was prone to inaccuracies. Printed topographic maps were often used to identify and mark locations, but these often lacked the precision needed for archaeological work. The introduction of GPSs revolutionized this process, allowing researchers to easily acquire precise coordinates at any point within an excavation or archaeological site. GPSs are also highly valuable when combined with other techniques, serving as a complementary tool for establishing ground control points (GCPs) and aiding in georeferencing processes, as demonstrated in the works of [22] (Figure 4) and [20].
In most cases, the coordinates provided by GPSs are based on a global reference system and must be converted to a local reference system to meet specific project requirements [23]. For example, in the Galilee Prehistory Project (Israel) [24], researchers used a GNSS to set up excavation areas and record control points for drone surveys. However, limitations such as the need for stable Bluetooth or Wi-Fi connections can occasionally affect its functionality.
Another noteworthy application of GNSS techniques can be found in the restoration of Pasha’s Bridge, one of Greece’s largest stone bridges [25]. Researchers employed a GNSS to obtain precise location coordinates in both the national reference system and the World Geodetic System 1984 (WGS84), including ellipsoidal heights, to create the digital terrain model (DTM) and contour lines for the site.

3.3. Remote Sensing Technologies

The use of remote sensing technologies in the archaeological process has become a favored approach within the scientific community. Traditionally, archaeologists relied on field surveys or subsurface investigations, which posed a risk of damaging archaeological remains. While early aerial images supported their research, they were often qualitative and lacked detailed analysis.
By definition, remote sensing refers to the science of observing, interpreting, and measuring objects or surfaces without direct physical contact [26,27]. Spatial data derived from image processing techniques using remotely sensed data offer advantages over conventional site-monitoring procedures in terms of speed and efficiency. These technologies enable the surveying of extensive areas within short timeframes and provide valuable products, such as orthophotos, digital elevation models, and 3D models, which have been proven to be exceedingly beneficial to researchers.
In their review, Luo et al. [28] (Figure 5) categorized the remote sensing technologies employed in archaeological studies into four main types: (a) photography, (b) multispectral and hyperspectral imaging, (c) synthetic aperture radar (SAR), and (d) light detection and ranging (LiDAR). Photography mainly focuses on interpreting archived aerial photographs of sites using various image processing techniques [29,30]. For example, photography can be instrumental in identifying buried archaeological features, as experienced observers can detect changes in terrain relief or variations in the color of overlying soils or crops [28] (Figure 6) [31,32].
Multispectral and hyperspectral imaging, on the other hand, leverage the spectral information provided by satellite imagery. A multispectral image comprises multiple layers, each capturing the same scene but each layer recording different portions of the electromagnetic spectrum. The most common high-spatial-resolution multispectral images contain four (4) bands that capture the radiation in the following wavelength bands: blue at 450–515 and 520 nm; near infrared (NIR) at 750–900 nm; green at 515, 520–590, and 600 nm; and red at 600–630–680 and 690 nm [33]. The variation in spectral reflectance captured in these multispectral images offers archaeologists valuable insights into areas with significant archaeological potential.
Hyperspectral images, in contrast, consist of spectral bands capturing radiation over an extended spectral range, typically from the visible and near infrared (VNIR) regions up to the short-wave near-infrared (SWIR) region for an examined area [34]. This abundance of spectral information allows for the enhanced differentiation of artifacts from the surroundings and provides detailed insights into their condition based on the spectral signature of the examined features.
A notable example of the advancements offered by hyperspectral imaging can be seen in the work of Cucci et al. [34], where mural paintings in Pompeii were non-invasively examined for pigment identification. Hyperspectral imaging also proved effective in retrieving faded characters in mural inscriptions (Figure 7). Another example is the work of Doneus et al. [35], which highlighted how the visualization of differences between stressed and healthy vegetation enhanced the detection of Roman road traces in Carnuntum, Lower Austria (Figure 8).
The low spatial resolution of hyperspectral satellite data can limit its application to fine-scale studies of archaeological sites.
While multispectral and hyperspectral images naturally capture radiation occurring over an examined area, SAR (synthetic aperture radar) and LiDAR (light detection and ranging) systems generate and capture their own radiation. The primary advantage of SAR systems lies in their capability to detect objects regardless of the time of day or weather conditions. Additionally, SAR can partially penetrate soil and vegetation, making it effective for detecting archaeological features in challenging landscapes, including areas with ice or dense canopy cover [36,37]. This capability is especially valuable in surveys of landscapes where conventional on-site surveys struggle to access and identify archaeological remains or where tools like GPS and total stations face operational challenges due to surface characteristics.
Airborne LiDAR methodology offers similar benefits and has been increasingly used in the past decade [37]. LiDAR is a laser profiling and scanning system used across various topographic studies, and it has become a vital tool in archaeological research. LiDAR’s main contribution is its ability to provide 3D topographic information about the examined archaeological site, producing high-resolution point cloud data. Recent publications have demonstrated how airborne LiDAR has facilitated the identification, recording, and unveiling of archaeological features and artifacts, particularly in regions where traditional aerial photography or in situ measurements are limited—for example, in areas with dense vegetation (Figure 9) [38,39]. However, the main drawback of LiDAR is the high cost associated with data collection, as it requires the deployment of planes equipped with expensive technology.
Numerous scientific studies have employed increasingly advanced remotely sensed methods to detect, analyze, and dynamically monitor archaeological sites and their surroundings [10,40,41]. For example, Anschuetz et al. [42] explored the relationships between humans and natural and built environments using remotely sensed data with a focus on landscape archaeology. Similarly, Saturno et al. [43] successfully detected ancient Maya sites using Thematic Mapper, IKONOS, and QuickBird satellite images. Vaughn and Crawford [44] used Landsat TM5 satellite imagery to identify areas of high archaeological potential. In another example, Szymański et al. [45] applied remote sensing techniques to map the visible remains of the pre-Hispanic site of San Isidro in El Salvador, calculating the extent of the ancient settlement.

3.4. Three-Dimensional Scanning and Photogrammetry

Creating 3D models for analyzing and visualizing historical records is highly beneficial in the archaeological process. This approach facilitates decision-making, enhances real-time collaboration among archaeologists regardless of their location, allows remote visualization and inspection, and increases the accuracy and realism of documentation [46].
Traditionally, researchers created detailed drawings and cross-sections of artefacts. While these were thorough, they were time-consuming and required significant expertise. Physical models were also constructed to replicate artefacts or features, providing a three-dimensional representation. However, these models were labor-intensive to produce, delicate, and difficult to transport or share.
Today, three-dimensional data acquisition can be achieved through terrestrial 3D laser scanning with photogrammetric procedures. This methodology is non-invasive and enables digital documentation and visualization in three dimensions. Terrestrial laser scanners collect point cloud data to generate precise 3D models of archaeological sites, while close-range photogrammetry offers realistic rendering of texture and imagery of the same scene [19] (Figure 10). These technologies support rapid and efficient data collection, significantly improving the workflow and accuracy of archaeological documentation (Figure 11) [47].
The produced 3D models can be utilized for various tasks, such as maintenance, conservation, and restoration activities [48]. More recently, they have been used to create photorealistic 3D representations of archaeological features or sites in the form of virtual museums. A virtual museum allows visitors to embark on virtual tours through the museum halls and collections, allowing them to immerse themselves in three-dimensional spaces. Furthermore, 3D scanning provides highly accurate models of the structure and the shape of buildings [49]. Additionally, visitors can enhance their experience by accessing supplementary information, such as images, audio, or text, adding a fourth dimension to their virtual visit [50].
Nevertheless, managing 3D archaeological data presents several challenges. Beyond visualization, standalone 3D models often offer limited information [51]. Therefore, the documentation process necessitates integrating heterogeneous data, including text fields, photographs, drawings, etc., to enrich the models [52]. Similar to airborne LiDAR techniques, specialized and costly equipment remains essential, as does the contribution of highly trained personnel [53].
Croix et al. [54] compared the 3D digital image reconstruction of a Viking warrior woman and found that high-precision laser scanners excelled in capturing fine details and ensuring uniform quality across the model. Similarly, Vieira et al. [55] surveyed the José de Alencar Theatre in Fortaleza, Brazil, using an integrated approach of laser scanner and photogrammetry. Their results demonstrated that combining these techniques generates accurate 3D representations of historical structures with complex geometry, architecture, and shapes.
In 2023, Di Maida et al. [56] explored whether 3D models of lithic artefacts could potentially replace drawings or photographs for conveying techno-morphological and typological data. Their findings showed that certain types of remote analyses could be conducted solely using 3D models produced through 3D scanning. Gutierrez et al. [57] employed terrestrial laser scanning to produce a tomb catalogue for the Mycenaean cemetery of Aidonia in Greece (Figure 12). Their work highlighted the significance and effectiveness of these techniques in permanently documenting endangered cultural heritage sites.
All the aforementioned case studies underscore another key point: the laser scanner method is remarkably effective, providing detailed representations across various scales. It can capture anything from highly precise details, such as the 3D image of the Viking warrior woman [54], to architectural features of a Mycenaean tomb [57], to monuments [58] or even entire areas. The scale and detail of the output depend on the equipment used and the study’s objectives.

3.5. Drones and Aerial Photography

Another emerging technique increasingly employed in archaeological documentation processes involves the use of unmanned aerial platforms, commonly referred to as drones. In recent years, numerous studies have demonstrated the effectiveness of drones for documentation purposes [58,59]. Drones offer distinct advantages over traditional airborne or spaceborne methods for capturing photographs of archaeological sites. They are compact, portable, cost-effective, and relatively easy to operate [60,61] (Figure 13).
A drone is a system consisting of an aerial platform equipped with a sensor and a ground station that communicates with the platform’s flight controller. The flight controller is equipped with components for orientation and navigation, such as gyroscopes, magnetic compasses, triaxial accelerometers, and other sensors [62]. Archaeologists increasingly favor them over traditional aerial imaging techniques due to their cost effectiveness and highly maneuverable nature as documentation platforms.
Recently, consumer-grade drones have been equipped with sensors capable of capturing visible, near-infrared, and thermal imaging data. Additionally, low-cost LiDAR sensors can now be mounted on standard drones, enabling the production of high-quality 3D data. These advancements provide archaeologists with the ability to acquire highly reliable three-dimensional data, ideal for archaeological surveys and mapping [63].
Over the past decade, various studies have demonstrated the effectiveness of drone-based aerial photography in archaeological research [59,64,65,66] (Figure 14, Figure 15 and Figure 16). In 2016, Stek [60] discussed the use of drone-acquired aerial imagery for site recognition in a complex rural area from the Classical Roman period in Molise, Southern Italy. Previous surveys in the region, including pedestrian field surveys, small-scale excavations, and geophysical studies, had limited success. However, drones identified a complex system of features, likely associated with subsurface remnants of multiple interconnected complexes.
Orengo and Garcia-Molsosa [67] explored the automated recording of material culture dispersion across large areas using high-resolution drone imagery. Salgado Carmona et al. [63] explored the potential of multispectral and thermal infrared imaging with drones to study complex historical zones. Their research demonstrated that semi-automatic detection techniques could identify many buried structures in the surveyed areas. Szymański et al. [45] created a drone-based map of visible mounds of anthropogenic origin at the pre-Hispanic site of San Isidro in El Salvador. Materazzi and Pacifici [68] analyzed drone-acquired aerial imagery using vegetation indices, successfully identifying crop marks indicative of buried remains.

3.6. Mobile Applications and Digital Recording Systems

Mobile applications have significantly transformed archaeological studies by providing user-friendly interfaces and time-efficient solutions that enhance data collection, analysis, and communication among researchers [69,70]. These technological advancements streamline workflows, improve accuracy, and promote collaboration in the field.
Traditionally, researchers documented their observations in field notebooks, recording detailed descriptions of the landscape and the artefacts by hand. These notes were later transcribed into formal reports. Site locations and features were marked on paper maps, and photographs were manually stored. This approach often hindered the analysis of large datasets, integration of multiple data sources, and effectiveness of field data with other information.
Mobile devices now enable the direct digital recording of archaeological finds and precise mapping of artefact locations using built-in GPSs (Figure 17) [70,71]. This process significantly increases the volume of data collected and allows for immediate integration into ongoing projects. Such capabilities are critical for the digital documentation of cultural sites. As highlighted in Austin’s study [9]: “Archaeological recording must allow excavating archaeologists to draw reliable inferences about the site and to facilitate the use of those observations by others for future research”.
A new method for digitally recording features and artefacts during field surveys integrates advanced geospatial tools, mobile devices, and data management software, significantly streamlining and enhancing data collection [71,72]. An example of this technique, using modern mobile devices and Internet connectivity, is demonstrated in the MapFarm project [73]. This method was developed and tested at prehistoric sites in Aegean Thrace (Figure 18), yielding significant improvements in both the fieldwork process and the subsequent analysis of collected data.
Each team member uses their own phone, allowing the system to scale seamlessly for teams of any size. These applications export data in formats compatible with archaeological software, facilitating smooth transitions to analysis workflows. Additionally, they use the phone’s GPS to record locations and display the user’s position on a digital map. This approach not only streamlines data collection but also promotes transparency and efficient data sharing among researchers.

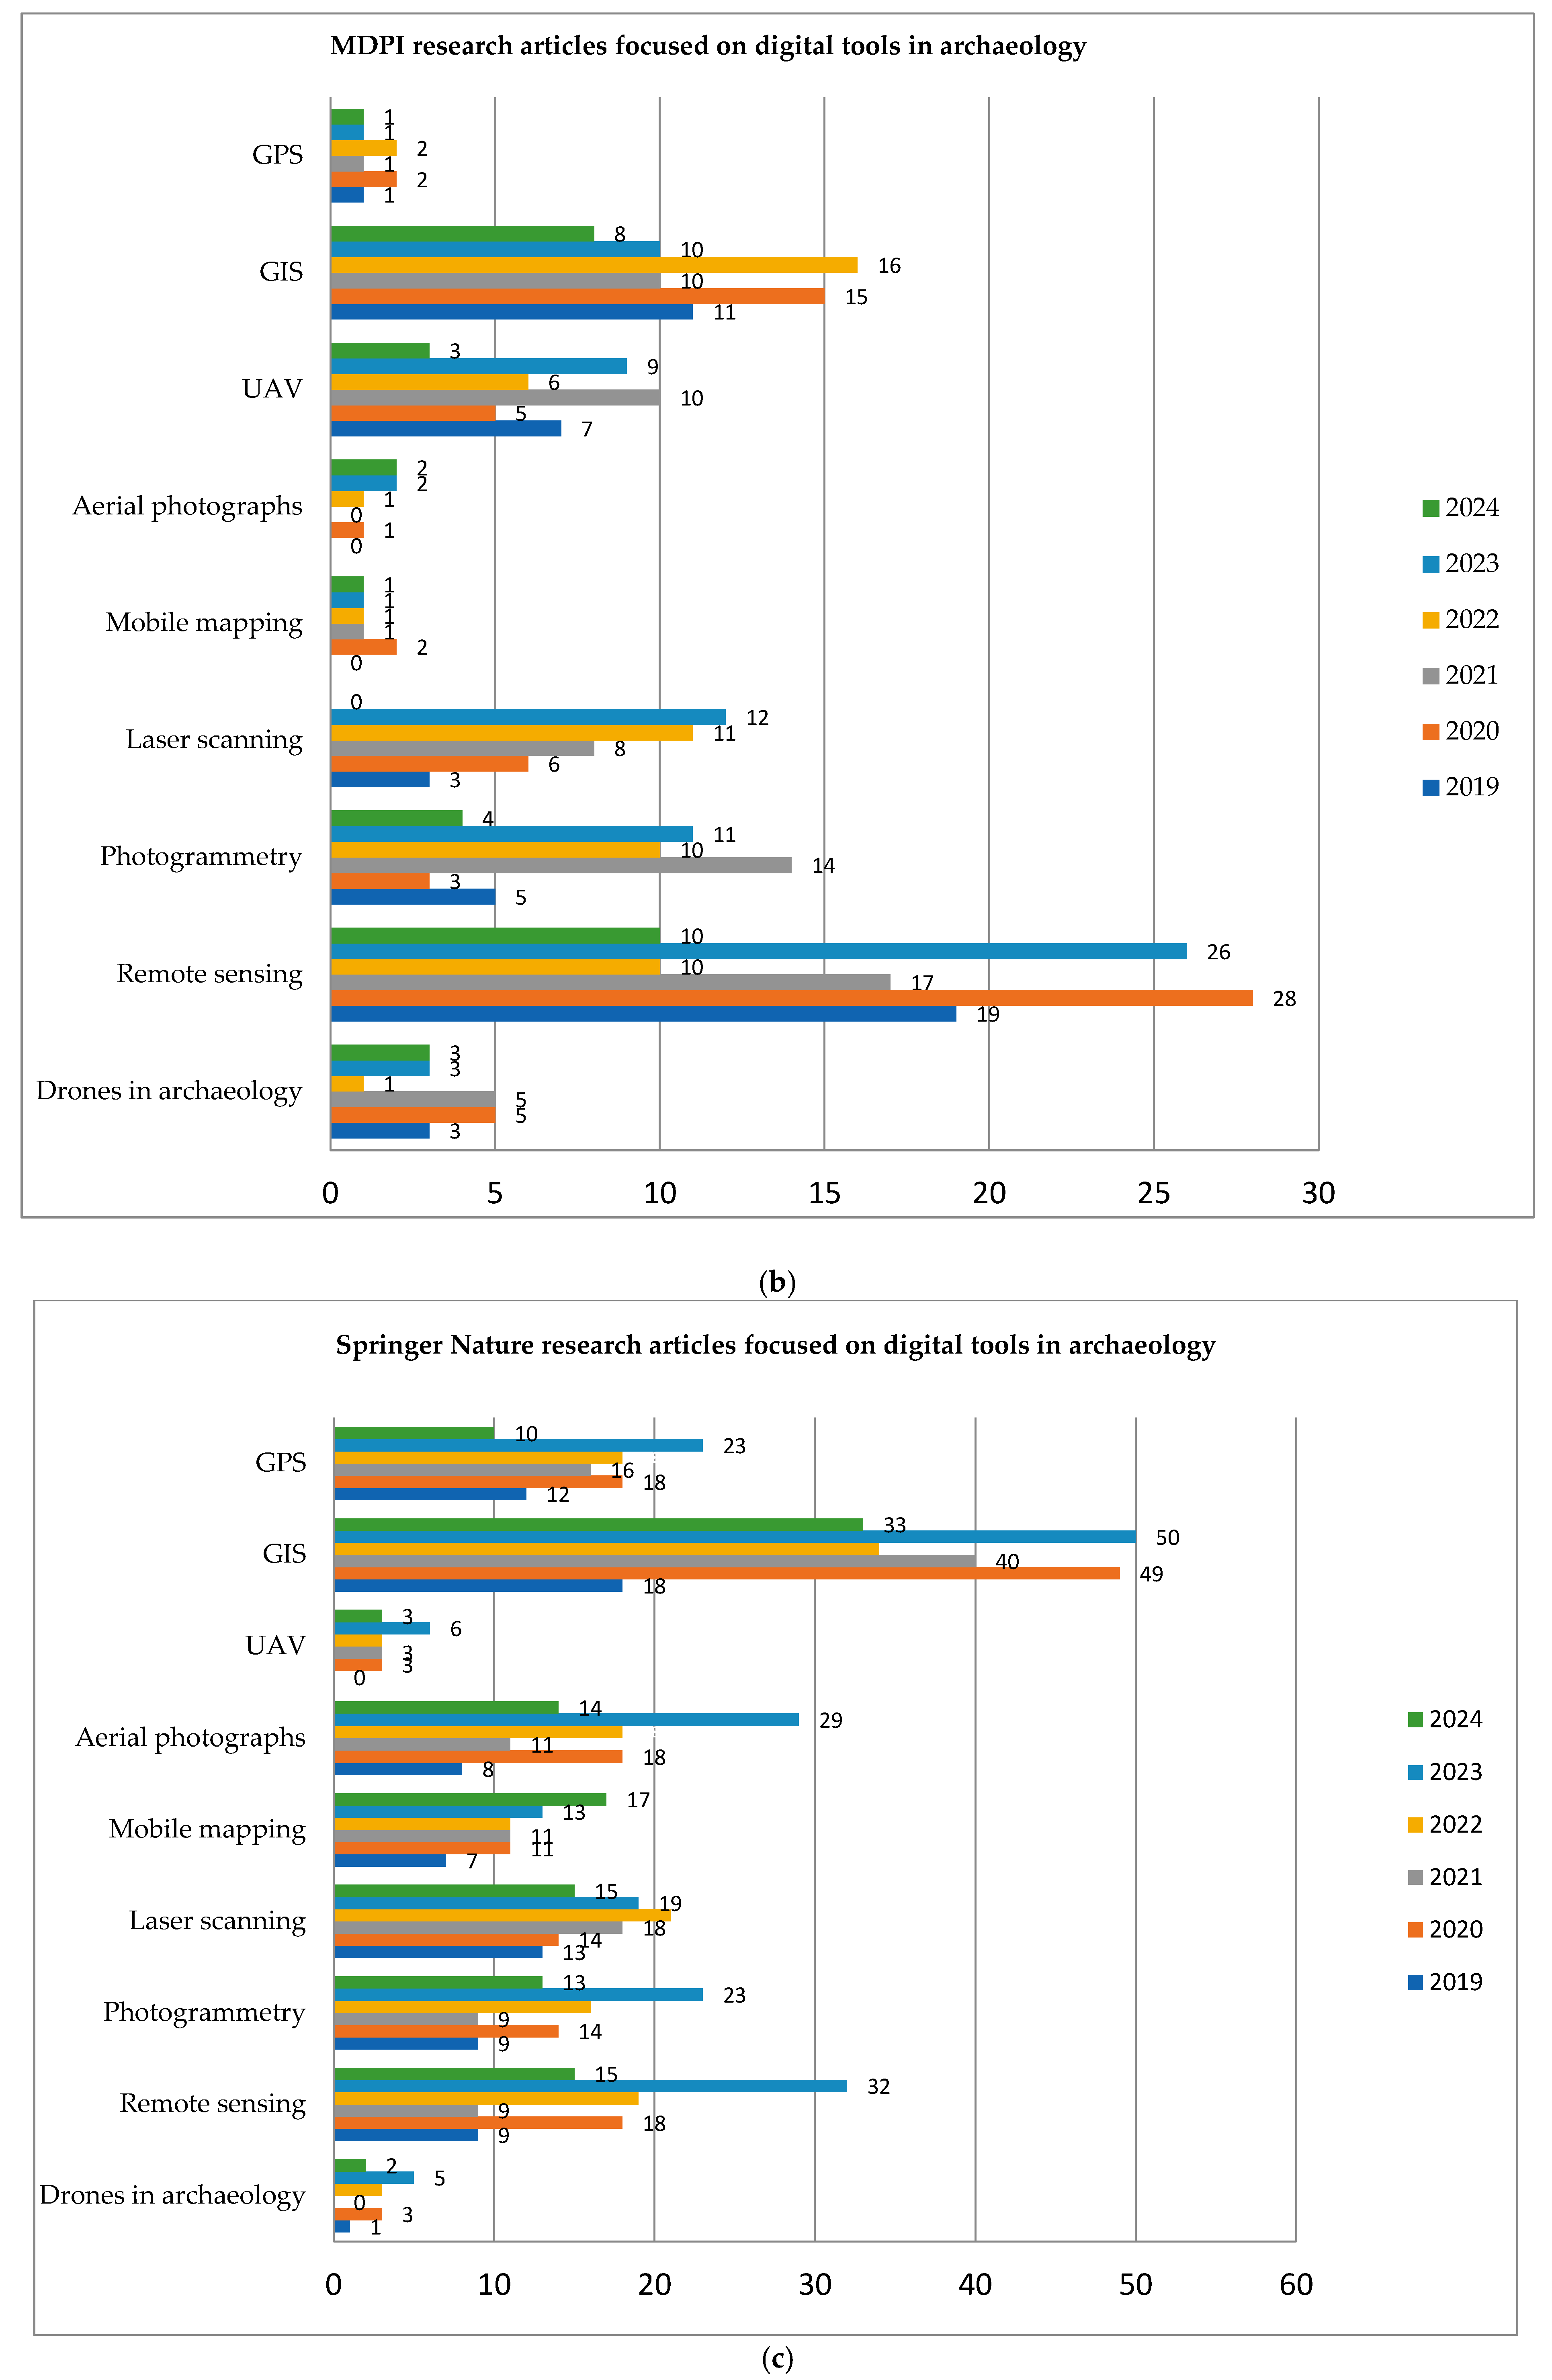
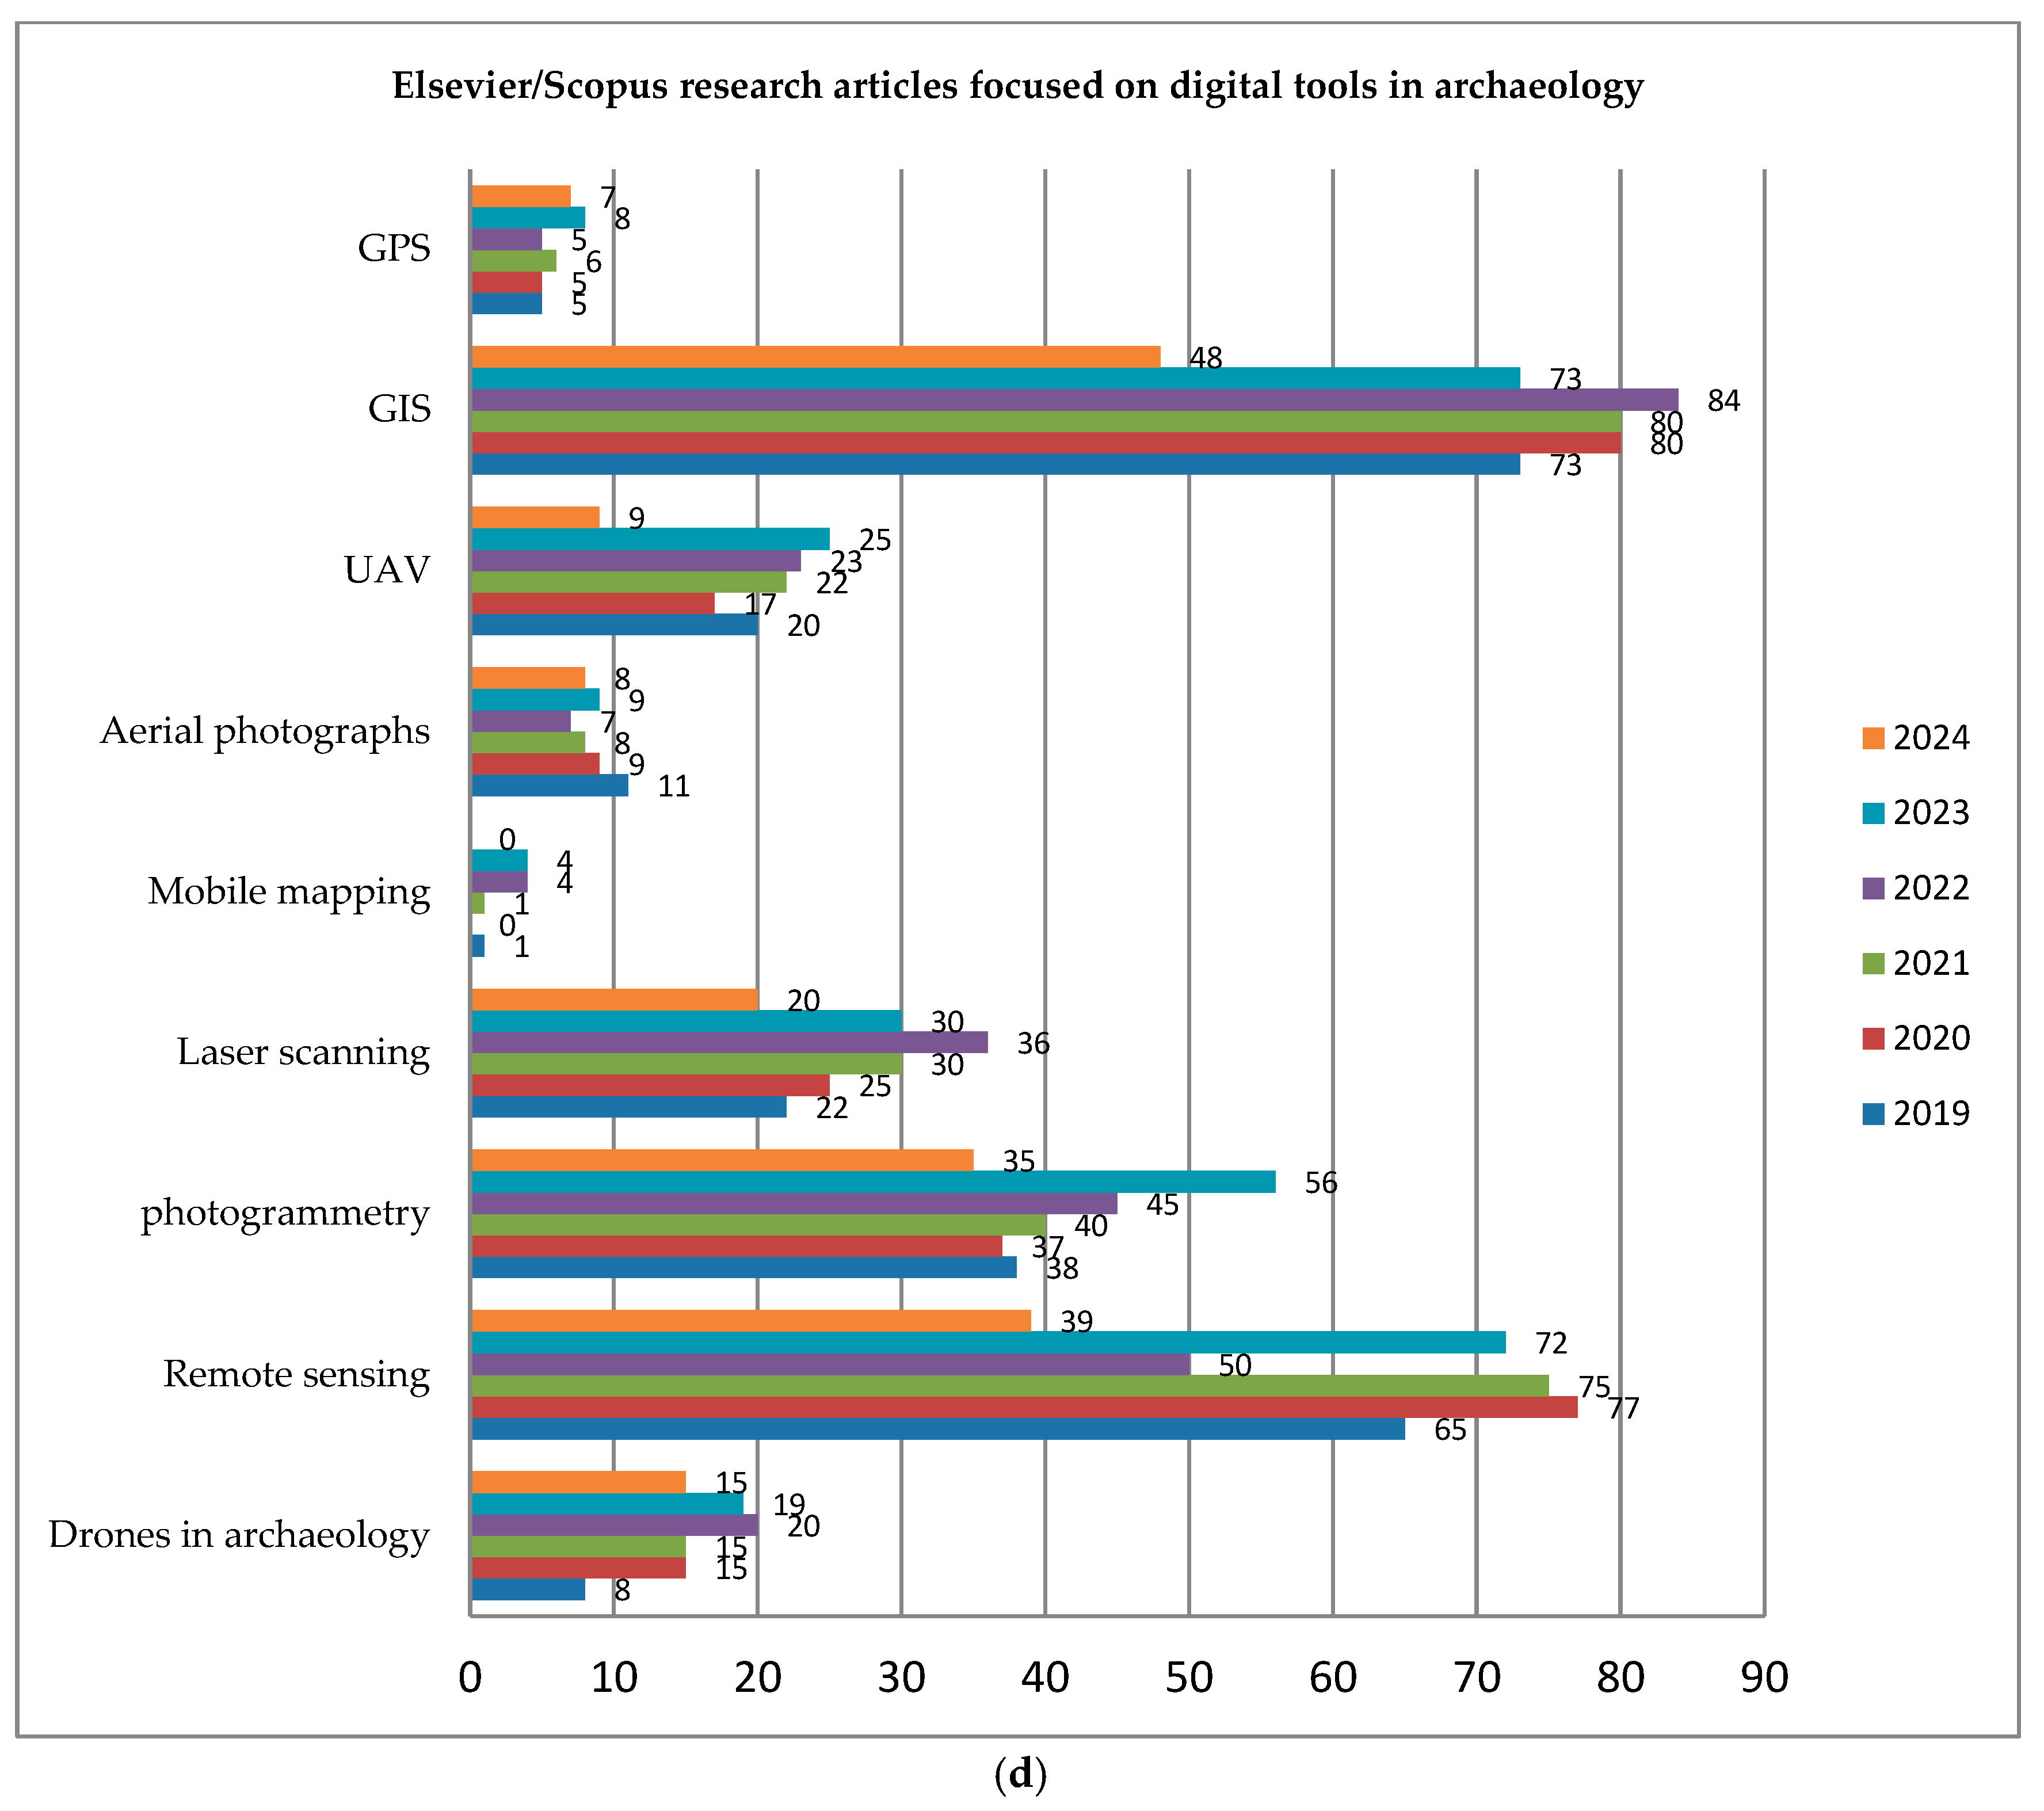
4. Trends in Digital Tools in Archaeology

A good indicator of trends in archaeological studies using digital tools is the analysis of peer-reviewed publications. Such an analysis synthesizes the current state of the field, helping to identify key trends in the adoption and application of digital tools within archaeology. This article aims to provide a systematic review of the academic landscape concerning the use of these technologies in the field.
To achieve this, we examined four major scientific databases: ScienceDirect, MDPI, Springer Nature, and Elsevier/Scopus. These are well-respected sources within the academic community, where a significant portion of archaeological research is published. Our search focused on peer-reviewed articles from the last five years (2019–2024), using the keyword “archaeological studies” in combination with terms related to digital tools such as GIS, GPS, remote sensing, 3D scanning, photogrammetry, drones, UAVs, aerial photography, and mobile mapping. We chose to exclude other types of publications, such as books, conference proceedings, and reviews, to maintain a focus on peer-reviewed articles. The results of this systematic review are illustrated in Figure 19.
The analysis results reveal a clear preference for publications in archaeological studies utilizing remote sensing and GISs across all four databases in the last five years. The use of drones has also shown a remarkable increase, with the ScienceDirect database showing 57 publications featuring drones in 2019, rising to 104 publications by 2024. It is important to note that the 2024 figures only account for publications up to September, so the numbers are expected to increase by the year’s end.
Conversely, there has been a noticeable decline in publications related to laser scanning from 2019 to 2024, with a similar downward trend observed for GPS-focused publications during the same period. Meanwhile, papers focusing on photogrammetric tools, aerial photographs, and GPSs have maintained a consistent presence in archaeological studies.
A significant trend is the increase in publications using mobile mapping, particularly in ScienceDirect, which recorded an increase from 76 in 2019 to 96 publications in 2024. Similarly, the Springer Nature database showed growth in mobile-mapping-related publications, rising from 7 in 2019 to 17 publications in 2024.
These trends highlight a growing emphasis on technology’s transformative role in uncovering, analyzing, and preserving historical artifacts and sites. The focus has shifted toward the development of more user-friendly and accessible tools such as remote sensing, GIS, and mobile mapping, making technology an integral component of modern archaeology.

5. Advancements and Challenges

5.1. Emerging Technologies and Innovations

With the integration of all the above-mentioned digital tools into the archaeological process, it is evident that emerging technologies such as remote sensing and GIS, mobile applications, and drone surveying are revolutionizing data acquisition processes in research studies. However, in our rapidly evolving world, the rise of Artificial Intelligence (AI) and Cloud Computing has introduced new approaches to addressing challenges in the field [74].
As Küçükdemirci and Sarris [75] highlight, the cultural heritage community has recognized the significance of AI-enabled tools, including Machine Learning (ML) and Deep Learning (DL) techniques, for predictive modeling, site analysis, and data analysis in archaeological research. Meanwhile, Cloud Computing has experienced exponential growth, opening up novel possibilities for leveraging cutting-edge technologies such as AI, the Internet of Things (IoT), and Big Data [76]. The integration of these technologies is anticipated to define the future of the field, enabling scenarios previously deemed impossible [76].
Several studies demonstrate the effectiveness of AI techniques in archaeology for identifying and classifying artifacts, significantly reducing human error and contributing to more efficient cataloguing processes [77]. These advancements highlight the transformative potential of AI and Cloud Computing in reshaping the methodologies of modern archaeology.

5.2. Integration of Digital Tools with Traditional Methods

In archaeological studies, it is common practice to combine digital tools and traditional methods. This integration provides researchers with valuable datasets essential for the documentation process, particularly during excavation activities [78,79]. By utilizing both digital data and in situ excavation data, researchers can compare newly acquired information with previous datasets, enabling a more comprehensive and holistic analysis of the sites under study. This approach facilitates the interpretation and analysis of archaeological sites, leading to more reliable findings [80,81].
Building Information Modeling (BIM) is an effective tool for managing existing buildings and monitoring construction and restoration projects. It is a holistic approach that integrates a variety of data types, represents physical objects, and enables systematic monitoring [82]. Historic Building Information Modeling (HBIM), often described as an evolution of GISs [83], allows for data integration from different sources and continues to evolve [84]. As a cloud-based solution, HBIM incorporates spatial data and dimensions ranging from 3D to 7D [85] information. It ensures interoperability, enhances usability for professionals across disciplines (archaeologists, restorers, and engineers), and facilitates communication between multidisciplinary teams [86].
The HBIM process integrates data from terrestrial laser scanning (TLS), GPSs, aerial photography, and conventional topographic methods to create intelligent 3D models through specialized software [86] (Figure 20). These models can be further enhanced with plugins tailored for specific services. In their work, Diara and Rinaudo [85] (Figure 21) demonstrated the platform ARK-BIM for archaeological documentation and analysis. This platform requires only a browser, offering a user-friendly and functional interface that simplifies collaboration and data accessibility.
Establishing clear and consistent data protocols is becoming increasingly important in archaeology, as digital technologies generate vast amounts of information. Initiatives like MIDAS Heritage, the UK Historic Environment Data Standard, play a key role in addressing this need. By providing a structured framework for recording and managing heritage data, MIDAS Heritage ensures that information is accurate, easy to share, and preserved in the long term, ensuring consistency and reliability across diverse projects.
Standards like MIDAS promote interoperability, enabling different datasets and systems to work together, which is especially important for large-scale projects and interdisciplinary research. Such efforts improve collaboration among researchers, simplify the integration of diverse datasets, and facilitate their reuse in future projects. In addition to enhancing the quality of archaeological work, these standards streamline workflows, reduce the duplication of effort, and bridge the gap between fieldwork, digital documentation, and long-term heritage conservation. By fostering consistency and collaboration, data standards are vital for advancing the field of archaeology in an increasingly data-driven era.

5.3. Challenges and Limitations

The integration of digital tools with traditional methods, however, faces several challenges and limitations that must be addressed. As this process needs to combine several methodologies regarding data acquisition and registration, mistakes and disagreements in interpretation can easily occur. The lack of comprehensive training and the absence of standardization further intensify these challenges [87]. Technological limitations are another challenge; the capabilities and reliability of digital tools and equipment used in fieldwork, such as GPS accuracy, drone operation, the spatial analysis of imagery, or 3D scanning resolution, can limit the level of accuracy and precision that is critical for reliable analysis and interpretation. Another emerging issue could be the difficulty of archiving large data sizes generated from large-scale sites, for example, when combining both indoor and outdoor scenes [88]. In any case, the digital documentation of large-scale projects requires robust storage infrastructure and effective data management strategies. All the above-mentioned challenges highlight that digital documentation is a crucial process that must be conducted meticulously. Careful planning, technological proficiency, and adherence to best practices are crucial in digital archaeological data acquisition.

5.4. Future Directions

These days, we are witnessing a shift toward novel concepts in archaeology, as digital methodologies increasingly utilize advanced methods and tools [89,90]. The transition from traditional methodologies to novel approaches is progressing well. However, it is crucial that all these diverse data that archaeologists now have at their disposal are utilized and managed wisely to interpretate the past more effectively. The need to establish uniform standards, professional guidelines, and educational initiatives within the archaeological community is becoming increasingly important [91,92]. These measures are essential to ensure that the digital documentation of historical data is both effective and capable of being reused for future research and conservation efforts.

6. Conclusions

Digital tools provided by information science and technology are transforming various aspects of archaeology, offering new approaches to researching and interpreting the past. The findings of this study highlight how digital tools are fundamentally reshaping archaeological research, addressing the limitations of traditional methods and opening up new possibilities for exploration and preservation.
Today, technologies such as GISs and global positioning systems (GPSs), photo interpretation, LiDAR, drones, and mobile applications are becoming standard tools in the field of archeology. These advancements are extensively used for site recording, artefact distribution mapping, and terrain analysis. For instance, GISs have greatly enhanced archaeological research by improving data collection, management, and spatial analysis. They integrate diverse datasets, such as maps and field data, into a digital environment, enabling the efficient organization and retrieval of vast amounts of information [12,13,14]. GISs also facilitate sophisticated analyses, such as proximity, density, and pattern recognition, which help researchers identify relationships between sites, environmental factors, and cultural phenomena.
Similarly, GPSs provide precise, efficient, and globally accessible tools for locating and documenting historical sites. They ensure the accurate georeferencing of artefacts and features while facilitating seamless integration with drone surveys and other digital tools. By overcoming the limitations of traditional methods, they enable archaeologists to conduct more accurate and comprehensive analyses, saving time and effort while enhancing the precision of their work [22,25].
With the advancement of remote sensing, researchers have access to non-invasive, efficient, and highly accurate tools for site analysis and monitoring. These technologies overcome the limitations of traditional methods, offering a broader and deeper understanding of archaeological landscapes while preserving the integrity of sites for future study [28,36,37]. Techniques like multispectral and hyperspectral imaging have revealed buried structures and artefacts, while LiDAR and synthetic aperture radar (SAR) have been proven particularly effective in dense or inaccessible terrains. These tools provide insights that ground-based surveys alone could not achieve.
Three-dimensional documentation methods have produced highly accurate 3D models that are now used for preservation, restoration, and even public education. Three-dimensional scanning with photogrammetric techniques has revolutionized three-dimensional studies in archaeology by providing precise, efficient, and non-invasive documentation methods, enabling archaeologists to analyze, preserve, and share data with unprecedented accuracy and versatility [48,54]. This development and advancement allow many people across the globe to engage in archaeological practices—the exploration of past eras in the digital age—by navigating through virtual museums [50] and by dealing with historical artefacts in a meaningful form of participation, enhancing deeper understanding and meaning-making.
Mobile applications and digital recording systems have contributed significantly to the efficient, real-time data collection and organization of data. These applications not only improve the accuracy of the analysis but also facilitate collaboration across disciplines, expand access to archaeological features, and help save time while reducing errors in the documentation and analysis process. Mobile applications and digital recording systems have also played a transformative role, making field data collection faster, more accurate, and collaborative. For example, the MapFarm project, which utilized a mobile GIS to document prehistoric sites in Aegean Thrace, demonstrated how these tools streamline workflows and enhance data integration. By allowing real-time updates and coordination, they reduce errors and promote transparency, fundamentally changing how fieldwork is conducted. As such, archeologists are, with the resulting precision of such surveys, not only achieving better results but also probing aspects that were previously hidden and consequently disseminating information on the find wherever they are without any hindrances. Traditional methods are sometimes not sufficiently productive, and in such cases, the present methods play a different role.
While digital technologies have brought significant advancements to archaeology, their adoption is not without challenges. One of the primary obstacles is the need for specialized expertise. The integration of digital tools with traditional techniques requires a skilled and well-trained team, while managing the enormous amount of data collected, which calls for robust storage and organization systems. Tools like GISs, remote sensing, 3D scanning, and drones require not only technical knowledge to operate but also the ability to interpret the complex data they produce. For many archaeologists, particularly those working in resource-constrained environments, accessing this level of training can be difficult, potentially limiting the widespread use of these technologies. Another hurdle is the variability of field conditions. Dense vegetation, urban environments, or extreme weather can interfere with the accuracy and reliability of tools like GPSs, drones, or remote sensing devices. These limitations can lead to incomplete datasets or require additional efforts to compensate for environmental factors.
Cost is another significant barrier. High-end equipment such as laser scanners, drones with advanced sensors, and hyperspectral imaging systems can be prohibitively expensive for smaller projects or heritage institutions. Additionally, the software needed for processing and analyzing the data often comes with high-cost licensing fees. These financial constraints can create a digital divide within the archaeological community, with well-funded teams having access to cutting-edge tools while others remain reliant on traditional methods.
Data management poses its own set of challenges. The sheer volume of data generated by technologies like LiDAR or 3D photogrammetry can be overwhelming, requiring robust storage solutions and effective data organization systems. Without proper infrastructure, data may be lost, underutilized, or difficult to access for future research.
To fully realize the potential of digital archaeology, investments in standardized methods and comprehensive training are essential. Achieving this potential in digital archeology can only be possible by adopting common practices, conducting inclusive education, and effective data management. However, despite the continuous emergence of technologies such as Virtual and Mixed Reality (VR and MR), the full potential of these technologies in excavation and archaeological research is restricted, as these advanced technologies require intensive efforts in terms of time and resources. Despite these challenges, digital technologies hold transformative potential for the field of archaeology. Addressing these barriers through targeted training, cost-sharing initiatives, improved data management strategies, and a balanced approach to integrating traditional and digital methods can pave the way for a more inclusive and effective future in archaeological research.

Author Contributions

Conceptualization, S.S.; methodology, S.S.; investigation, S.S., K.E., Z.-E.T. and A.S. (Aikaterini Stamou); resources, S.S., Z.-E.T. and A.S. (Aikaterini Stamou); writing—original draft preparation, S.S.; writing—review and editing, S.S., K.E., Z.-E.T., A.S. (Aikaterini Stamou), I.T., A.S. (Alexandros Skondras) and E.S.; visualization, S.S., K.E., Z.-E.T., A.S. (Aikaterini Stamou), I.T. and A.S. (Alexandros Skondras); supervision, E.S. All authors have read and agreed to the published version of the manuscript.

Funding

This research project is implemented in the framework of H.F.R.I call “Basic research Financing (Horizontal support of all Sciences)” under the National Recovery and Resilience Plan “Greece 2.0” funded by the European Union—NextGenerationEU (FIREFLY-Fostering vIrtual heRitage Experience For eLderlY, H.F.R.I. Project Number 15497).

Conflicts of Interest

The authors declare no conflicts of interest.

References

  1. Moullou, D.; Vital, R.; Sylaiou, S.; Ragia, L. Digital Tools for Data Acquisition and Heritage Management in Archaeology and Their Impact on Archaeological Practices. Heritage 2024, 7, 107–121. [Google Scholar] [CrossRef]
  2. Ferreira, V.; Mateus, L.; Aguiar, J. In Archaeology in the Digital Era Volume II. In Proceedings of the 40th Conference on Comput-er Applications and Quantitative Methods in Archaeology, Southampton, UK, 26–29 March 2012; Amsterdam University Press: Amsterdam, The Netherlands, 2012; Volume 2, p. 22, ISBN 978 90 4852 728 1. [Google Scholar]
  3. Liu, Y.; Shi, Z.; Wang, B.; Yu, T. GPR Impedance Inversion for Imaging and Characterization of Buried Archaeological Remains: A Case Study at Mudu City Cite in Suzhou, China. J. Appl. Geophys. 2018, 148, 226–233. [Google Scholar] [CrossRef]
  4. Garstki, K. Digital Innovations in European Archaeology; Cambridge University Press: Cambridge, UK, 2020. [Google Scholar]
  5. Pechunov, N.; Taipova, E. Digital tools in a clil context of teaching english to archaeology students. In Proceedings of the ADVED 2022- 8th International Conference on Advances in Education, Istanbul, Turkey, 10–12 October 2022. [Google Scholar] [CrossRef]
  6. Perfetti, L.; Fassi, F.; Rossi, C. Low-Cost Digital Tools for Archaeology; Springer: Cham, Switzerland, 2020; pp. 137–148. [Google Scholar] [CrossRef]
  7. Kanaeva, Z.; Hochschild, V.; Märker, M.; Sommer, C. Digital Data and Tools in Archaeology: The ROCEEH Out of Africa Database (ROAD). GI_Forum 2018, 6, 3–12. [Google Scholar] [CrossRef]
  8. Menéndez-Marsh, F.; Al-Rawi, M.; Fonte, J.; Dias, R.; Gonçalves, L.J.; Seco, L.G.; Hipólito, J.; Machado, J.P.; Medina, J.; Moreira, J.; et al. Geographic Information Systems in Archaeology: A Systematic Review. J. Comput. Appl. Archaeol. 2023, 6, 40–50. [Google Scholar] [CrossRef]
  9. Austin, A. Mobilizing Archaeologists: Increasing the Quantity and Quality of Data Collected in the Field with Mobile Technology. Adv. Archaeol. Pract. 2014, 2, 13–23. [Google Scholar] [CrossRef]
  10. Luo, L.; Wang, X.; Liu, C.; Guo, H.; Du, X. Integrated RS, GIS and GPS approaches to archaeological prospecting in the Hexi Corridor, NW China: A case study of the royal road to ancient Dunhuang. J. Archaeol. Sci. 2014, 50, 178–190. [Google Scholar] [CrossRef]
  11. Sauer, F. A GIS-Based Digital Documentation Protocol for High-Resolution Documentation of Paleolithic Sites. J. Paleolit. Archaeol. 2023, 6, 21. [Google Scholar] [CrossRef]
  12. Dell’Unto, N.; Landeschi, G. Archaeological 3D GIS; Routledge: London, UK, 2022. [Google Scholar] [CrossRef]
  13. Verhagen, P. Spatial Analysis in Archaeology: Moving into New Territories. In Digital Geoarchaeology: New Techniques for Interdisciplinary Human-Environmental Research; Siart, C., Forbriger, M., Bubenzer, O., Eds.; Springer International Publishing: Cham, Switzerland, 2018; pp. 11–25. [Google Scholar] [CrossRef]
  14. Howland, M.D.; Liss, B.; Najjar, M.; Levy, T.E. GIS-based mapping of archaeological sites with low-altitude aerial photography and structure from Motion: A case study from Southern Jordan. In 2015 Digital Heritage; IEEE: Piscataway, NJ, USA, 2015; pp. 91–94. [Google Scholar] [CrossRef]
  15. Luo, L.; Wang, X.; Lasaponara, R.; Xiang, B.; Zhen, J.; Zhu, L.; Yang, R.; Liu, D.; Liu, C. Auto-Extraction of Linear Archaeological Traces of Tuntian Irrigation Canals in Miran Site (China) from Gaofen-1 Satellite Imagery. Remote Sens. 2018, 10, 718. [Google Scholar] [CrossRef]
  16. Groenhuijzen, M.R.; Verhagen, P. Exploring the dynamics of transport in the Dutch limes. eTopoi J. Anc. Stud. 2015, 4. Available online: https://www.topoi.org/wp-content/uploads/2015/09/eTopoi_Sp4_Verhagen_etal.pdf (accessed on 25 December 2024).
  17. Katsamudanga, S. GIS Applications in Southern African Archaeology; Oxford University Press: Oxford, UK, 2022. [Google Scholar] [CrossRef]
  18. Buławka, N.; Chyla, J. Mobile GIS—Current Possibilities, Future Needs. Position Paper. In Digital Archaeologies, Material Worlds (Past and Present), Proceedings of the 45rd Annual Conference on Computer Applications and Quantitative Methods in Archaeology, Atlanta, GA, USA, 14–16 March 2017; Tübingen University Press: Tübingen, Germany, 2020; pp. 99–113. [Google Scholar] [CrossRef]
  19. Baiocchi, V.; Del Pizzo, S.; Pugliano, G.; Onori, M.; Robustelli, U.; Troisi, S.; Vatore, F.; Trujillo, F.L. Use of the sensors of a latest generation mobile phone for the three-dimensional reconstruction of an archaeological monument: The survey of the Intihuatana stone in Machu Picchu (Peru’). IOP Conf. Ser. Mater. Sci. Eng. 2020, 949, 012106. [Google Scholar] [CrossRef]
  20. Marín-Buzón, C.; Pérez-Romero, A.; López-Castro, J.L.; Jerbania, I.B.; Manzano-Agugliaro, F. Photogrammetry as a New Scientific Tool in Archaeology: Worldwide Research Trends. Sustainability 2021, 13, 5319. [Google Scholar] [CrossRef]
  21. Limp, W.F.; Barnes, A. Solving the Grid-to-Ground Problem when Using High Precision GNSS in Archaeological Mapping. Adv. Archaeol. Pract. 2014, 2, 138–143. [Google Scholar] [CrossRef]
  22. Fábrega-Álvarez, P.; Lynch, J. Archaeological Survey Supported by Mobile GIS: Low-Budget Strategies at the Hualfín Valley (Catamarca, Argentina). Adv. Archaeol. Pract. 2022, 10, 215–226. [Google Scholar] [CrossRef]
  23. Topouzi, S.; Tripolitsiotis, A.; Sarris, A.; Mertikas, S. Errors & Inaccuracies in Repositioning of Archaeological Sites. In Computer Applications and Quantitative Methods in Archaeology, Proceedings of the 29th Conference, Gotland, Sweden, 25–29 April 2001; Archaeopress: Oxford, UK, 2001; pp. 559–566. [Google Scholar]
  24. Rowan, Y.M.; Kersel, M.M.; Hill, A.C.; Urban, T.M. Late Prehistory of the Lower Galilee: Multi-Faceted Investigations of Wadi el-Ashert. Bull. Am. Sch. Orient. Res. 2021, 385, 1–32. [Google Scholar] [CrossRef]
  25. Tavantzis, I.; Tsifodimou, Z.E.; Skalidi, I.; Karachaliou, E.; Giannaris, I.; Bakousi, A.; Skondras, A.; Katakalos, K.; Stylianidis, E. Restoration workflows by means of photogrammetry: The case study of pashas bridge. Int. Arch. Photogramm. Remote Sens. Spat. Inf. Sci. 2023, 48, 1543–1548. [Google Scholar] [CrossRef]
  26. Schowengerdt, R.A. Remote Sensing: Models and Methods for Image Processing; Elsevier Science: Amsterdam, The Netherlands, 2006; Available online: https://books.google.gr/books?id=KQXNaDH0X-IC (accessed on 25 December 2024).
  27. Campana, S. Remote Sensing in Archaeology. In Encyclopedia of Geoarchaeology; Gilbert, A.S., Ed.; Springer: Dordrecht, The Netherlands, 2017; pp. 703–725. [Google Scholar] [CrossRef]
  28. Luo, L.; Wang, X.; Guo, H.; Lasaponara, R.; Zong, X.; Masini, N.; Wang, G.; Shi, P.; Khatteli, H.; Chen, F.; et al. Airborne and spaceborne remote sensing for archaeological and cultural heritage applications: A review of the century (1907–2017). Remote Sens. Environ. 2019, 232, 111280. [Google Scholar] [CrossRef]
  29. Lasaponara, R.; Masini, N. (Eds.) Remote Sensing in Archaeology: From Visual Data Interpretation to Digital Data Manipulation. In Satellite Remote Sensing: A New Tool for Archaeology; Springer: Dordrecht, The Netherlands, 2012; pp. 3–16. [Google Scholar] [CrossRef]
  30. Agapiou, A.; Alexakis, D.D.; Lysandrou, V.; Sarris, A.; Cuca, B.; Themistocleous, K.; Hadjimitsis, D.G. Impact of urban sprawl to cultural heritage monuments: The case study of Paphos area in Cyprus. J. Cult. Herit. 2015, 16, 671–680. [Google Scholar] [CrossRef]
  31. Bewley, R.H. Aerial survey for archaeology. Photogramm. Rec. 2003, 18, 273–292. [Google Scholar] [CrossRef]
  32. Verhoeven, G.; Sevara, C. Trying to Break New Ground in Aerial Archaeology. Remote Sens. 2016, 8, 918. [Google Scholar] [CrossRef]
  33. Nicolis, O.; Gonzalez, C. 19—Wavelet-based fractal and multifractal analysis for detecting mineral deposits using multispectral images taken by drones. In Methods and Applications in Petroleum and Mineral Exploration and Engineering Geology; Gaci, S., Hachay, O., Nicolis, O., Eds.; Elsevier: Amsterdam, The Netherlands, 2021; pp. 295–307. [Google Scholar] [CrossRef]
  34. Cucci, C.; Picollo, M.; Chiarantini, L.; Uda, G.; Fiori, L.; De Nigris, B.; Osanna, M. Remote-sensing hyperspectral imaging for applications in archaeological areas: Non-invasive investigations on wall paintings and on mural inscriptions in the Pompeii site. Microchem. J. 2020, 158, 105082. [Google Scholar] [CrossRef]
  35. Doneus, M.; Verhoeven, G.; Atzberger, C.; Wess, M.; Ruš, M. New ways to extract archaeological information from hyperspectral pixels. J. Archaeol. Sci. 2014, 52, 84–96. [Google Scholar] [CrossRef]
  36. Moore, E.; Freeman, T.; Hensley, S. Spaceborne and Airborne Radar at Angkor: Introducing New Technology to the Ancient Site. In Remote Sensing in Archaeology; Wiseman, J., El-Baz, F., Eds.; Springer: New York, NY, USA, 2007; pp. 185–216. [Google Scholar] [CrossRef]
  37. Balz, T.; Caspari, G.; Fu, B.; Liao, M. Discernibility of Burial Mounds in High-Resolution X-Band SAR Images for Archaeological Prospections in the Altai Mountains. Remote Sens. 2016, 8, 817. [Google Scholar] [CrossRef]
  38. Casana, J.; Laugier, E.J.; Hill, A.C.; Reese, K.M.; Ferwerda, C.; McCoy, M.D.; Ladefoged, T. Exploring archaeological landscapes using drone-acquired lidar: Case studies from Hawai’i, Colorado, and New Hampshire, USA. J. Archaeol. Sci. Rep. 2021, 39, 103133. [Google Scholar] [CrossRef]
  39. Opitz, R.S.; Ryzewski, K.; Cherry, J.F.; Moloney, B. Using Airborne LiDAR Survey to Explore Historic-Era Archaeo-logical Landscapes of Montserrat in the Eastern Caribbean. J. Field Archaeol. 2015, 40, 523–541. [Google Scholar] [CrossRef]
  40. Brivio, P.A.; Pepe, M.; Tomasoni, R. Multispectral and multiscale remote sensing data for archaeological prospecting in an alpine alluvial plain. J. Cult. Herit. 2000, 1, 155–164. [Google Scholar] [CrossRef]
  41. Lindsay, I.; Mkrtchyan, A. Free and Low-Cost Aerial Remote Sensing in Archaeology. Adv. Archaeol. Pract. 2023, 11, 164–183. [Google Scholar] [CrossRef]
  42. Anschuetz, K.F.; Wilshusen, R.H.; Scheick, C.L. An archaeology of landscapes: Perspectives and directions. J. Archaeol. Res. 2001, 9, 157–211. [Google Scholar] [CrossRef]
  43. Saturno, W.; Sever, T.L.; Irwin, D.E.; Howell, B.F.; Garrison, T.G. Putting Us on the Map: Remote Sensing Investigation of the Ancient Maya Landscape. In Remote Sensing in Archaeology; Wiseman, J., El-Baz, F., Eds.; Springer: New York, NY, USA, 2007; pp. 137–160. [Google Scholar] [CrossRef]
  44. Vaughn, S.; Crawford, T. A predictive model of archaeological potential: An example from northwestern Belize. Appl. Geogr. 2009, 29, 542–555. [Google Scholar] [CrossRef]
  45. Szymański, J.; Misiewicz, K.; Mieszkowski, R.; Martecki, J. Regional patterns, local techniques. Remote sensing and archaeology at prehispanic site of San Isidro, El Salvador. J. Archaeol. Sci. Rep. 2022, 45, 103628. [Google Scholar] [CrossRef]
  46. Galeazzi, F.; Callieri, M.; Dellepiane, M.; Charno, M.; Richards, J.; Scopigno, R. Web-based visualization for 3D data in archaeology: The ADS 3D viewer. J. Archaeol. Sci. Rep. 2016, 9, 1–11. [Google Scholar] [CrossRef]
  47. Stylianidis, E.; Evangelidis, K.; Vital, R.; Dafiotis, P.; Sylaiou, S. 3D Documentation and Visualization of Cultural Heritage Buildings through the Application of Geospatial Technologies. Heritage 2022, 5, 2818–2832. [Google Scholar] [CrossRef]
  48. Mandelli, A.; Achille, C.; Tommasi, C.; Fassi, F. Integration of 3D models and diagnostic analyses through a conservation-oriented information system. Int. Arch. Photogramm. Remote Sens. Spat. Inf. Sci. 2017, 42, 497–504. [Google Scholar] [CrossRef]
  49. Galantucci, R.A.; Fatiguso, F. Advanced damage detection techniques in historical buildings using digital photogrammetry and 3D surface anlysis. J. Cult. Herit. 2019, 36, 51–62. [Google Scholar] [CrossRef]
  50. Tsakoumaki, M.C.; Lala, D.M.; Tsaroucha, A.; Psalti, A. Advanced Digitization Methods for the Protection and Dissemination of Cultural Heritage towards Digital transformation: The Archaeological Museum of Delphi. Procedia CIRP 2023, 118, 1056–1060. [Google Scholar] [CrossRef]
  51. Hernández-Ibáñez, L.A.; Barneche-Naya, V. Assisted navigation and natural interaction for virtual archaeological heritage. implementation of an attractor-based approach using a game engine. Mediterr. Archaeol. Archaeom. 2016, 16, 43–51. [Google Scholar] [CrossRef]
  52. Calzado-Martínez, A.; García-Fernández, Á.-L.; Ortega-Alvarado, L.M. Accessing interactively the spatio-temporal data-model of an archaeological site through its 3D virtual reconstruction. Digit. Appl. Archaeol. Cult. Herit. 2022, 26, e00235. [Google Scholar] [CrossRef]
  53. Vital, R.; Sylaiou, S. Digital survey: How it can change the way we perceive and understand heritage sites. Digit. Appl. Archaeol. Cult. Herit. 2022, 24, e00212. [Google Scholar] [CrossRef]
  54. Croix, S.; Deckers, P.; Sindbæk, S.M. Recasting a Viking warrior woman from Ribe: 3D digital image reconstruction compared. J. Archaeol. Sci. Rep. 2020, 32, 102455. [Google Scholar] [CrossRef]
  55. Vieira, M.M.; Ribeiro, G.; Paulo, R.; Bessa, M.; Sousa, F.R.; Moreira, E.; Mesquita, E. Strategy for HBIM implementation using high-resolution 3D architectural documentation based on laser scanning and photogrammetry of the José de Alencar theatre. Digit. Appl. Archaeol. Cult. Herit. 2023, 30, e00287. [Google Scholar] [CrossRef]
  56. Di Maida, G.; Hattermann, M.; Delpiano, D. 3D models of lithic artefacts: A test on their efficacy. Digit. Appl. Archaeol. Cult. Herit. 2023, 30, e00279. [Google Scholar] [CrossRef]
  57. Gutierrez, I.; Lindenbergh, R.; Watson, L.; Shelton, K. Building a Mycenaean chamber tomb catalogue from terrestrial laser scan data. Digit. Appl. Archaeol. Cult. Herit. 2024, 32, e00319. [Google Scholar] [CrossRef]
  58. Chiabrando, F.; Nex, F.; Piatti, D.; Rinaudo, F. UAV and RPV systems for photogrammetric surveys in archaelogical areas: Two tests in the Piedmont region (Italy). J. Archaeol. Sci. 2011, 38, 697–710. [Google Scholar] [CrossRef]
  59. Casana, J.; Fowles, S.; Montgomery, L.M.; Mermejo, R.; Ferwerda, C.; Hill, A.C.; Adler, M. Multi-sensor drone survey of ancestral agricultural landscapes at Picuris Pueblo, New Mexico. J. Archaeol. Sci. 2023, 157, 105837. [Google Scholar] [CrossRef]
  60. Stek, T.D. Drones over Mediterranean landscapes. The potential of small UAV’s (drones) for site detection and heritage management in archaeological survey projects: A case study from Le Pianelle in the Tappino Valley, Molise (Italy). J. Cult. Herit. 2016, 22, 1066–1071. [Google Scholar] [CrossRef]
  61. Fiz, J.I.; Martín, P.M.; Cuesta, R.; Subías, E.; Codina, D.; Cartes, A. Examples and Results of Aerial Photogrammetry in Archeology with UAV: Geometric Documentation, High Resolution Multispectral Analysis, Models and 3D Printing. Drones 2022, 6, 59. [Google Scholar] [CrossRef]
  62. Canicattì, M.; Vallone, M. Drones in vegetable crops: A systematic literature review. Smart Agric. Technol. 2024, 7, 100396. [Google Scholar] [CrossRef]
  63. Carmona, J.Á.S.; Quirós, E.; Mayoral, V.; Charro, C. Assessing the potential of multispectral and thermal UAV imagery from archaeological sites. A case study from the Iron Age hillfort of Villasviejas del Tamuja (Cáceres, Spain). J. Archaeol. Sci. Rep. 2020, 31, 102312. [Google Scholar] [CrossRef]
  64. Thomas, H. Quantitative Analysis of Two Low-Cost Aerial Photography Platforms: A Case Study of the Site of Zagora, Andros, Greece. J. Field Archaeol. 2016, 41, 660–670. [Google Scholar] [CrossRef]
  65. Campiani, A.; McAvoy, S.; Lercari, N.; Stuardo, R.L.; Delgado, G.J.; Mejía, J.L.; Rissolo, D.; Kuester, F. Developing an interoperable cloud-based visualization workflow for 3D archaeological heritage data: The Palenque 3D Archaeological Atlas. Digit. Appl. Archaeol. Cult. Herit. 2023, 31, e00293. [Google Scholar] [CrossRef]
  66. Lercari, N.; Tanasi, D.; Sonnemann, T.; Hassam, S.; Calderone, D.; Trapani, P.; Ruider, L.; Lanteri, R. Archaeology of Archaeology at Heloros: Re-Interpreting the Urban Layout of a Complex Greek Settlement in Sicily Using Prox-imal Sensing and Data Fusion. Digit. Appl. Archaeol. Cult. Herit. 2024, 33, e00327. [Google Scholar] [CrossRef]
  67. Orengo, H.A.; Garcia-Molsosa, A. A brave new world for archaeological survey: Automated machine learning-based potsherd detection using high-resolution drone imagery. J. Archaeol. Sci. 2019, 112, 105013. [Google Scholar] [CrossRef]
  68. Materazzi, F.; Pacifici, M. Archaeological crop marks detection through drone multispectral remote sensing and vegetation indices: A new approach tested on the Italian pre-Roman city of Veii. J. Archaeol. Sci. Rep. 2022, 41, 103235. [Google Scholar] [CrossRef]
  69. Perera, K. Heritage at risk: Digital preservation of traditional cultural heritage (TCH) in Sri Lanka. Int. Arch. Photogramm. Remote Sens. Spat. Inf. Sci. 2023, 48, 1197–1207. [Google Scholar] [CrossRef]
  70. Sgouropoulos, K.; Urem-Kotsou, D.; Chrysafakoglou, P. Application of mobile digital recording and GIS analysis of archaeological surface survey finds in the MapFarm project. J. Archaeol. Sci. Rep. 2024, 53, 104331. [Google Scholar] [CrossRef]
  71. Ross, S.; Ballsun-Stanton, B.; Cassidy, S.; Crook, P.; Klump, J.; Sobotkova, A. FAIRer Data through Digital Recording: The FAIMS Mobile Experience. J. Comput. Appl. Archaeol. 2022, 5, 271–285. [Google Scholar] [CrossRef]
  72. Ballsun-Stanton, B.; Ross, S.A.; Sobotkova, A.; Crook, P. FAIMS Mobile: Flexible, open-source software for field research. SoftwareX 2018, 7, 47–52. [Google Scholar] [CrossRef]
  73. Urem-Kotsou, D.; Sgouropoulos, K.; Kotsos, S.; Chrysafakoglou, P.; Chrysaphi, M.; Skoulariki, D. Surveying the Neolithic farmers in Aegean Thrace with digital technologies. Stud. Praehist. 2022, 16, 117–132. [Google Scholar] [CrossRef]
  74. Argyrou, A.; Agapiou, A. A Review of Artificial Intelligence and Remote Sensing for Archaeological Research. Remote Sens. 2022, 14, 6000. [Google Scholar] [CrossRef]
  75. Küçükdemirci, M.; Sarris, A. GPR Data Processing and Interpretation Based on Artificial Intelligence Approaches: Future Perspectives for Archaeological Prospection. Remote Sens. 2022, 14, 3377. [Google Scholar] [CrossRef]
  76. Venditti, C.P.; Mele, P. Digital Transformation and Archaeology. In Developing Effective Communication Skills in Archaeology; IGI Global: Hershey, PA, USA, 2020; pp. 224–244. [Google Scholar] [CrossRef]
  77. Karamitrou, A.; Sturt, F.; Bogiatzis, P.; Beresford-Jones, D. Towards the use of artificial intelligence deep learning networks for detection of archaeological sites. Surf. Topogr. Metrol. Prop. 2022, 10, 044001. [Google Scholar] [CrossRef]
  78. Ortega-Alvarado, L.M.; García-Fernández, Á.L.; Conde-Rodríguez, F.-A.; Jurado-Rodríguez, J.M. Integrated and interactive 4D system for archaeological stratigraphy. Archaeol. Anthropol. Sci. 2022, 14, 203. [Google Scholar] [CrossRef]
  79. Katsianis, M.; Kalayci, T.; Sarris, A. Bridging Digital Approaches and Legacy in Archaeology. Digital 2022, 2, 538–545. [Google Scholar] [CrossRef]
  80. Fletcher, E.C. Creating a Software Methodology to Analyze and Preserve Archaeological Legacy Data. Adv. Archaeol. Pract. 2023, 11, 139–151. [Google Scholar] [CrossRef]
  81. Reinhard, A. Archaeology of Digital Environments: Tools, Methods, and Approaches. Doctoral Dissertation, University of York, York, UK, 2019. [Google Scholar]
  82. Giuliani, F.; Gaglio, F.; Martino, M.; De Falco, A. A HBIM pipeline for the conservation of large-scale architectural heritage: The city Walls of Pisa. Herit. Sci. 2024, 12, 35. [Google Scholar] [CrossRef]
  83. Delpozzo, E.; Balletti, C. Bridging the gap: An open-source gis+bim system for archaeological data. the case study of altinum, Italy. Int. Arch. Photogramm. Remote Sens. Spat. Inf. Sci. 2023, 48, 491–498. [Google Scholar] [CrossRef]
  84. Lovell, L.J.; Davies, R.J.; Hunt, D.V.L. The Application of Historic Building Information Modelling (HBIM) to Cultural Heritage: A Review. Heritage 2023, 6, 6691–6717. [Google Scholar] [CrossRef]
  85. Diara, F.; Rinaudo, F. ARK-BIM: Open-Source Cloud-Based HBIM Platform for Archaeology. Appl. Sci. 2021, 11, 8770. [Google Scholar] [CrossRef]
  86. Fiorenza, J.; Rimella, N.; Calandra, D.; Osello, A.; Lamberti, F. Enhancing HBIM-to-VR workflows: Semi-automatic generation of virtual heritage experiences using enriched IFC files. Digit. Appl. Archaeol. Cult. Herit. 2025, 36, e00391. [Google Scholar] [CrossRef]
  87. Klehm, C.E. The Use and Challenges of Spatial Data in Archaeology. Adv. Archaeol. Pract. 2023, 1, 104–110. [Google Scholar] [CrossRef]
  88. Pervolarakis, Z.; Zidianakis, E.; Katzourakis, A.; Evdaimon, T.; Partarakis, N.; Zabulis, X.; Stephanidis, C. Three-Dimensional Digitization of Archaeological Sites—The Use Case of the Palace of Knossos. Heritage 2023, 6, 904–927. [Google Scholar] [CrossRef]
  89. Lauro, V.; Lombardo, V. The Cataloging and Conservation of Digital Survey in Archaeology: A Photogrammetry Protocol in the Context of Digital Data Curation. Heritage 2023, 6, 3113–3136. [Google Scholar] [CrossRef]
  90. Morgan, C.L. Current Digital Archaeology. Annu. Rev. Anthropol. 2022. [CrossRef]
  91. Kansa, E.; Kansa, S.W. Digital Data and Data Literacy in Archaeology Now and in the New Decade. Adv. Archaeol. Pract. 2021, 9, 81–85. [Google Scholar] [CrossRef]
  92. Nicholson, C.; Fernandez, R.; Irwin, J. Digital Archaeological Data in the Wild West: The challenge of practising responsible digital data archiving and access in the United States. Internet Archaeol. 2021, 58, 1–11. [Google Scholar] [CrossRef]
Figure 1. GIS mapping of the archaeological Miran site (China): (a) the locations of the Miran site and ancient Charkhlik in Stein’s archaeological map, which can be downloaded from http://dsr.nii.ac.jp/ (accessed on 25 December 2024) (b) the conservation area of the Miran site where LATTICs can be seen in the GF-1 PAN image; and (c) the Miran Fort. Source: [15].
Applsci 15 02495 g001
Figure 2. Thematic map of least-cost paths calculated for mule cart transport in Early Roman sites in the Kromme Rijn area, the Netherlands, derived from GIS. The map presents the Betweenness centrality measurements of all sites in the Middle Roman mule cart network. Source: [16].
Applsci 15 02495 g002
Figure 3. Measurement of control points with GPS RTK for photogrammetric flight in the city of Utica (Tunisia). Source: [20].
Applsci 15 02495 g003
Figure 4. Reviewing information in the QField app: navigation and editing tasks (blue and red dots display location spots). The GPS smartphone application QField is a mobile optimized version of the QGIS desktop app. This application, using the GPS of a smartphone, has the ability to navigate the entire site area and create, localize, and delimit any archaeological entity in a coordinated space. Source: [22].
Applsci 15 02495 g004
Figure 5. Dura Europos, eastern Syria, as it appears in VHR satellite images (© 2019 Digital Globe) from August 2011 (A) and April 2014 (B). The VHR satellite image from 2011 is displayed with detected looting changes in red (C). In the sub-image corresponding to the area marked by the blue box in (A), dozens of old looting pits are visible around the Palmyrene Gate (D). In the sub-image corresponding to the area marked by the blue box in (B), a renewed phase of severe, war-related looting with fresh pits is clearly visible in the same area (E). Ground views (© AAAS (2014)) of looting at the Dura Europos site (FH). (For interpretation of the references to color in this figure legend, the reader is referred to the web version of this article). Source: [28].
Applsci 15 02495 g005
Figure 6. Airborne hyperspectral data (64 spectral channels and 0.4 m GSD) from Carnuntum, Austria, acquired on May 262,011 (data source: LBI-ArchPro and ABT GmbH): (A) true-color image; (B) false-color composite created by the PCA (R = PC1, G = PC2, and B = PC3); (C) NDVI; (D) false-color composite created by the REIP (R = band 1 (wavelength), G = band 2 (slope), and B = band 3 (reflectance value)); (E) gamma distribution fitting (R = none, G = band 2 (shape parameter α), and B = band 1 (rate parameter β)); (F) normal distribution fitting (R = band 4 (the upper bound of the confidence interval for mean (μ)), G = band 2 (standard deviation (σ)), and B = band 2); (G) unsupervised k-means classification results with 10 classes; (H) visual interpretations of archaeological traces (Roman road) from (D) covering the area enclosed by the red box in (A). Source: [28].
Applsci 15 02495 g006
Figure 7. (Top) false-color image obtained as a combination of Principal Component Channels in the RGB channels after image processing; the arrow indicates the positions of garlands no longer visible in the painting. (Bottom) the visible image of the same scene. Source: [34].
Applsci 15 02495 g007
Figure 8. (A) conventional orthorectified aerial image acquired in the visible spectrum where healthy and stressed vegetation is visible. (B) false-color composite highlighting the Roman road traces. Source: [35].
Applsci 15 02495 g008
Figure 9. Profile of a wall at Bugby Hole Estate. Eastern Caribbean. Profile depth = 1 m. Post-fieldwork LiDAR classifications revealed the existence of a building platform and the height of surviving structures at the site. Source: [39].
Applsci 15 02495 g009
Figure 10. Three-dimensional reconstruction of an archaeological monument using close-range photogrammetry: The Survey of the Intihuatana Stone in Machu Picchu (Peru). Source: [19].
Applsci 15 02495 g010
Figure 11. Laser scanning and 3D reconstruction of an Ottoman Bath located in Nea Apollonia in northern Greece, possibly dating to the 18th or 19th century. Source: [47].
Applsci 15 02495 g011
Figure 12. Perspective view of the chamber of tomb 3 in the Mycenaean cemetery of Aidonia in Greece. Point cloud visualization using calculated illuminance. Source: [57].
Applsci 15 02495 g012
Figure 13. The Cosa site (Ansedonia, Italy): (a) textured 3D model made from aerial photos obtained in 2012 with a hydrogen balloon; (b) 3D textured model of the Capitoline temple of Cosa made from a video sequence, taken in 2013, with a GoPro Hero 2 camera installed on a DJI Phantom I UAV; (c) frame of the video captured with the GoPro Hero 2 camera. The lens distortion of this type of camera can be observed. In the first versions of the Agisoft Photoscan program, it was necessary to carry out previous work to correct the distortion. Source: [61].
Applsci 15 02495 g013
Figure 14. Analysis of Heloros site in Sicily using drones: (a) Heloros’ Digital Surface Model derived from drone-based photogrammetry data and (b) Heloros’ DSM Local Relief Model visualization. Visualizations (a) by Dario Calderone and (b) by Gerardo Jiménez Delgado. Source: [66].
Applsci 15 02495 g014
Figure 15. Orthomosaic of Castle of Didymoteichon, Greece, derived from drone images in 2024. Retrieved from the project “Investigation of possibilities and methods of restoration of Didymoteichon Castle—Research for analysis and documentation—Integration of the monument into the city environment”, funded by the Greek Ministry of Culture and implemented by Aristotle University of Thessaloniki, Greece. Source: https://qa.auth.gr/en/project/75958 (accessed on 25 December 2024), unpublished data—own processing, 2024.
Applsci 15 02495 g015
Figure 16. Facade of Castle of Didymoteichon, created with drone images, 2024. Retrieved from the project “Investigation of possibilities and methods of restoration of Didymoteichon Castle – Research for analysis and documentation—Integration of the monument into the city environment”, funded by the Greek Ministry of Culture and implemented by Aristotle University of Thessaloniki, Greece. Source: https://qa.auth.gr/en/project/75958 (accessed on 25 December 2024), unpublished data—own processing, 2024.
Applsci 15 02495 g016
Figure 17. A user-friendly mobile application for digitally recording archaeological sites. As the team members walk across the field, each time they spot an archaeological find, they can mark the location on the application. Screenshots of the mobile app: (a) home screen, (b) available forms for download in the MapFarm project, (c) main recording form rendered in the fieldwalker’s smartphone, (d) dynamic digital map during fieldwalking. Source: [70].
Applsci 15 02495 g017
Figure 18. Testing prehistoric sites in Aegean Thrace in Greece. Map showing the distribution of surface finds dating to different periods. Source: [73].
Applsci 15 02495 g018
Figure 19. Graphs depicting numbers of peer-reviewed publication articles using digital tools in archaeology from 2019 to 2024: (a) in ScienceDirect, (b) in MDPI, (c) in Springer Nature, (d) in Elsevier/Scopus.
Applsci 15 02495 g019aApplsci 15 02495 g019bApplsci 15 02495 g019c
Figure 20. Workflow of HBIM creation. Source: [86].
Applsci 15 02495 g020
Figure 21. Interface of ARK-BIM with specific functionalities for archaeological data. Source: [85].
Applsci 15 02495 g021
Disclaimer/Publisher’s Note: The statements, opinions and data contained in all publications are solely those of the individual author(s) and contributor(s) and not of MDPI and/or the editor(s). MDPI and/or the editor(s) disclaim responsibility for any injury to people or property resulting from any ideas, methods, instructions or products referred to in the content.

