Article

Human Health Risk Associated with As, Cu, Pb, and Zn in Soils of the Aconcagua and Casablanca River Basins, Valparaíso Region, Chile

1
Department Biologia Evolutiva, Ecologia i Ciències Ambientals, Facultat de Biologia, Universitat de Barcelona, Av. Diagonal 643, 08023 Barcelona, Spain
2
Facultad de Ingeniería, Universidad Católica de la Santísima Concepción, Concepción 4090541, Chile
3
Centro de Investigación en Biodiversidad y Ambientes Sustentables (CIBAS), Universidad Católica de la Santísima Concepción, Concepción 4090541, Chile
4
Centro Regional de Investigación y Desarrollo Sustentable de Atacama (CRIDESAT), Universidad de Atacama, Copiapó 1532297, Chile
*
Author to whom correspondence should be addressed.
Appl. Sci. 2025, 15(5), 2581; https://doi.org/10.3390/app15052581
Submission received: 5 October 2024 / Revised: 20 February 2025 / Accepted: 21 February 2025 / Published: 27 February 2025
(This article belongs to the Section Chemical and Molecular Sciences)

Abstract

:
Chile is an important producer of copper, and it has serious soil contamination problems, mainly related to mining activities. A typical example is the Aconcagua River basin, which has been the scene of large-scale mining operations throughout history, making it critical to analyze due to the high concentrations of heavy metals in its soils. The objectives of this study are (1) to assess the level of As, Cu, Pb, and Zn contamination in the surface soil ecosystem based on different environmental indexes and (2) to determine the health risks of adults and children located in watersheds of the Aconcagua and Casablanca Rivers. A database of the Aconcagua River and Casablanca River basins is used to achieve the objectives. From the Aconcagua River basin, 20 topsoil samples from agricultural sectors without mining activity and 127 topsoil samples from sectors with mining activity were selected. On the other hand, thirty-five topsoil samples of the Casablanca River basin, without mining activity, were analyzed. The evaluation of soil contamination was done using environmental indexes. Finally, carcinogenic and noncarcinogenic risks to humans were calculated using the USEPA model. The mean concentration of chemical elements in the Aconcagua River basin for samples without mining presence was As 10.55 mg kg−1, Cu 85.75 mg kg−1, Pb 26.65 mg kg−1, and Zn 139.5 mg kg−1. The correlations show that the elements As, Cu, Pb, and Zn come from anthropogenic sources, which are also enhanced by the geogenic origin of Cu and Zn. The spatial distribution of the analyzed elements shows a spatial pattern that extends across industrial areas and emission sources, with higher concentrations of As, Cu, Pb, and Zn identified near mining areas of the Aconcagua River basin. The upper limit of the geogenic values determined by the MAD (median absolute deviation) method for the Aconcagua River basin without mining presence was 14.5 mg kg−1 for As, 94 mg kg−1 for Cu, 37.5 mg kg−1 for Pb, and 194 mg kg−1 for Zn. Finally, the geoaccumulation index, contamination factor, integrated contamination index, and potential ecological risk registered exceptionally high contamination in some soil samples, especially in areas with mining influence. It is essential to highlight that there are non-carcinogenic risks related to As, Cu, and Pb, a hazard quotient (HQ) higher than 1, and acceptable carcinogenic risks between 1.0 × 10⁻⁶ and 1.0 × 10⁻⁴ to As and Pb in children and adults in the Aconcagua River basin.

1. Introduction

Soil pollution is defined as the presence of elements that can change the quality and function of the soil and the water cycle, altering the habitat of various organisms and even becoming harmful to humans if found in high concentrations [1]. The soil is essential as a mechanical support and a source of nutrients, but it is degraded and contaminated due to anthropogenic interactions. In Chile, a wide range of economic activities with the potential to contaminate the soil, such as forestry, agriculture, and especially mining activity, produce severe environmental impacts due to the large amount of waste generated [2]. Copper mining is one of Chile’s most important economic activities. However, it has a high potential to produce environmental impacts of different kinds, such as soil pollution. These impacts are mainly due to the large amount of waste generated both in the extraction processes and in the processing stage of the mineral, which a liquid medium can disperse, as is the case in the lixiviation of mining waste arranged in landfills or tranches or by air through atmospheric emissions of castings and particulate material from the various mining operations and the relief tranches [2]. Pesticides to control plant diseases have also increased the Cu levels in agricultural soils. Soil pollution levels were also detected in urban soils due to the road transport of mining materials. Soil pollution levels in urban systems range from almost imperceptible to extremely high. Currently, metals which presence reaches worrying levels in urban soils are lead (Pb), arsenic (As), barium (Ba), cadmium (Cd), copper (Cu), mercury (Hg), nickel (Ni), and zinc (Zn). All these potentially toxic elements (PTEs) in urban systems can originate from different sources, such as emissions from road transport and industrial spills (fossil fuels, agrochemicals, mining, and casting) [3,4,5,6].
The present study analyzes soil samples from the Aconcagua and Casablanca River basins to distinguish potentially toxic environmental and human health elements. Few studies have been published on watershed soil contamination in Chile. This study addresses the need to investigate the human health risk in the Aconcagua and Casablanca River basins affected by mining and agriculture activities. Scientific literature databases contain very little research on soil contamination in river basin areas where mining and agriculture coexist.
The objectives of this study are (1) to assess the level of contamination in the surface soil ecosystem based on different environmental indexes and (2) to determine the health risks of adults and children in watersheds of the Aconcagua and Casablanca Rivers.

2. Materials and Methods
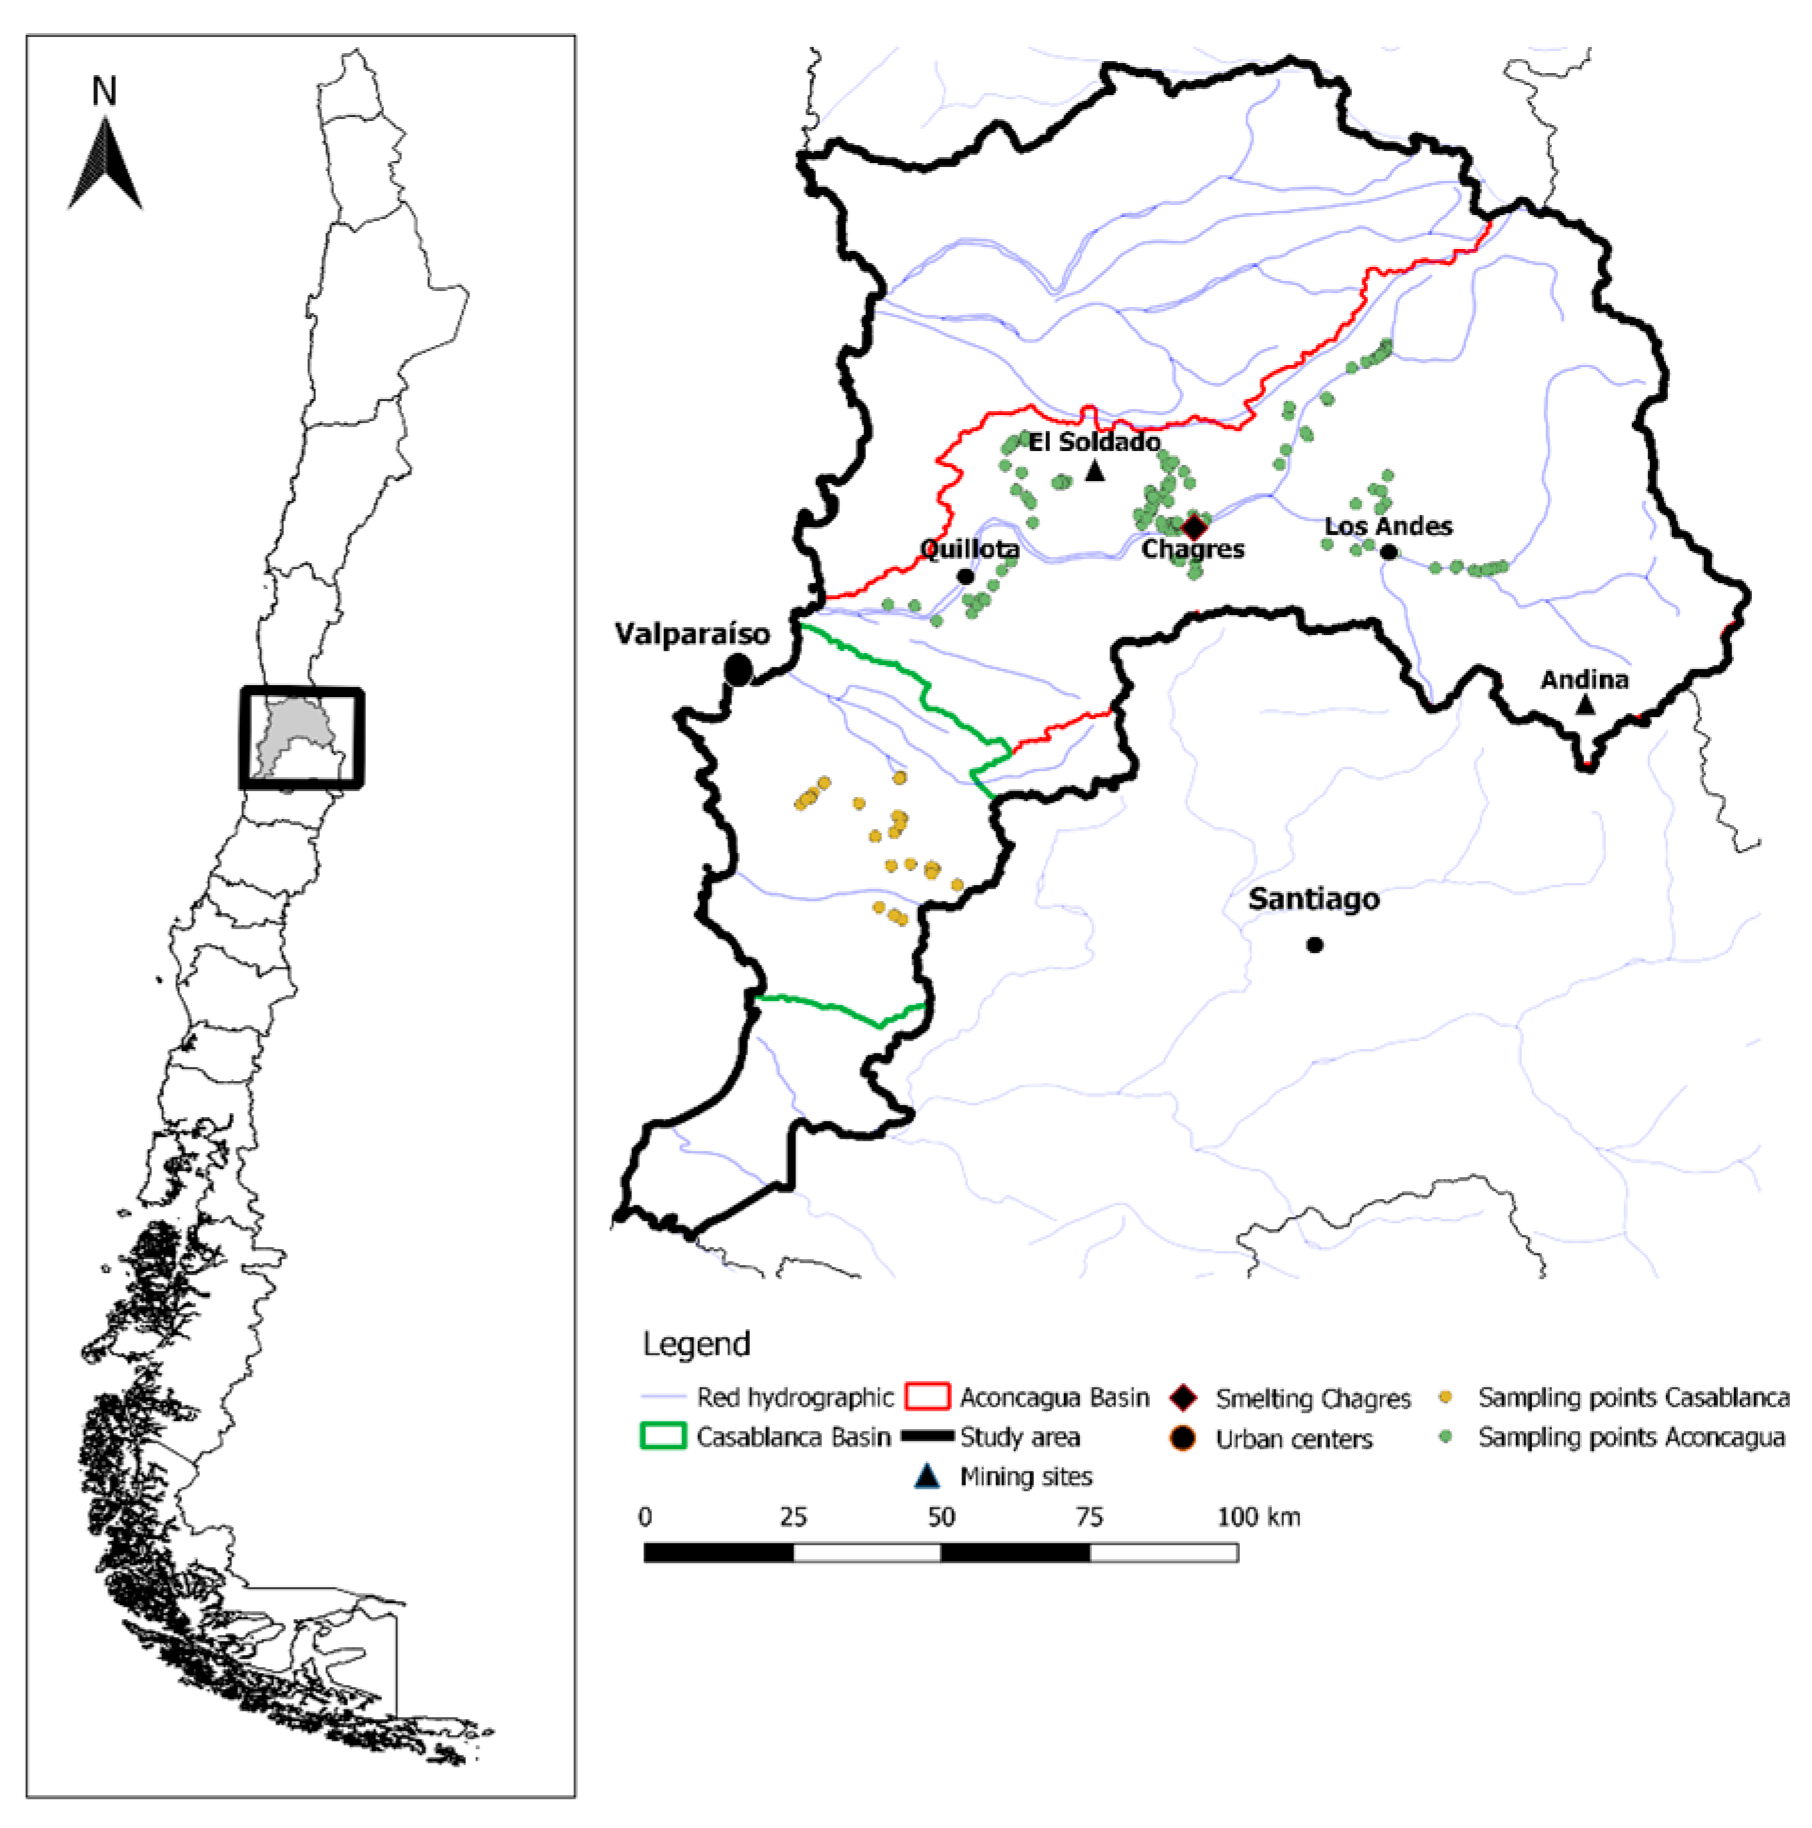
2.1. Study Area

The Aconcagua River and Casablanca River basins are located in the Valparaíso Region (Figure 1) in Chile’s central zone. This region is bordered by the coast and Andes Mountain range, which results in variations in temperatures and precipitation, leading to a climate transition from semi-arid to temperate Mediterranean [7]. This climate, characterized by higher humidity, allows the development of hydrographic systems of both Andean and coastal types [8].
In the southernmost part of the region lies the Aconcagua River basin, an area of transverse valleys with a temperate Mediterranean climate with a prolonged dry season and high-altitude cold in the Andes Mountains [9]. This is the largest river basin in the Valparaíso region, with approximately 7300 km2 [10], inhabited by about 732,000 people [11], making it the most relevant hydrographic network in the central zone of Chile. Three main economic activities are observed in the basin: agriculture, mining, and the service sector [12]. This study focuses on the area’s mining activity, particularly mining operations [13].
The Casablanca River basin is located on the western slope of the coastal range and covers an area of 953 km2 [8]. According to the latest population and housing census conducted by the National Congress Library in 2017, its population is 26,867 [14]. It is characterized by a Mediterranean climate, droughts between September and April, and rainfall from May to August [15]. In this basin, agricultural activities dominate, followed by forestry plantations, and no mining activity is recorded, making it an appropriate area to be used as a reference for comparison with the Aconcagua River basin to assess the degree of soil contamination due to mining [13].

2.2. Geology

In the studied area, there is a great diversity of lithologies with different geotechnical and mechanical behavior involving rigid rock units (igneous and metamorphic rocks), weathered rock units, semi-consolidated to unconsolidated sands and deposits, and units affected by the presence of geological faults [16]. The Aconcagua River basin is mainly influenced by volcanic rocks interstratified with marine and continental sediments, which ages fluctuate between the Upper Triassic (237–208 Ma) and the Upper Miocene (11.63–5.3 Ma). In the high-altitude sector, with greater slopes in the Andes Mountains, it is possible to find sulfur rocks and vitreous volcanic materials of coarse textures. In the sector of the Aconcagua River, in the town of San Felipe, there is an influence of acid rocks [9]. Partially eroded volcanic complexes with andesitic-basaltic to dacitic pyroclastic rocks were identified from the Lower-Middle Miocene (M3i). The Upper Miocene-Pliocene lithology was characterized by sedimentary sequences, including alluvial, colluvial, or fluvial piedmont clastic sedimentary sequences (MP1c). The Aconcagua River basin has sedimentary rocks of the Pleistocene-Holocene (Q1) with alluvial, colluvial and landslide deposits (Qf) [17]. Different volcanic complexes and intrusive rocks have been identified in the Cordillera Principal. Both the Cretaceous (123–85 Ma) (Kiag) and Miocene (22–7 Ma) intrusive rocks were granodiorites, monzogranites, monzodiorites, monzonites, and diorites. Upper Cretaceous volcanic sequences and acidic volcanic complexes (Ks3a) with ignimbrites and dacitic to rhyolitic intrusions were linked with collapsed calderas. The Coastal Cordillera is characterized by Jurassic volcanic and marine sedimentary sequences (J2m and Js2c); continental sedimentary; coastal marine sedimentary sequences such as limestones, sandstones, calcareous shales, and upper evaporitic levels (Js1m); and volcanic sequences and volcano-sedimentary sequences of the Upper Lower Cretaceous-Lower Upper Cretaceous (Kia2) with marine epiclastic, pyroclastic rocks and andesitic and basaltic lavas with lacustrine intercalations. An important Fe-Cu-Au (Candelaria) and Cu-Au (Andacollo) mineralization was associated with the east of the Atacama-El Romeral Fault System. The lithology of Oligocene-Miocene was characterized by volcano-sedimentary sequences (OM2c) with basaltic to dacitic lavas and epiclastic and pyroclastic rocks. In the Precordillera and Coastal Cordillera, regions III to Metropolitan, the Cretaceous lithologies were characterized by sedimentary and volcanic continental sequences with volcanic breccias, andesitic lavas (Ki2C), and basaltic to andesitic lavas and breccias; andesitic to rhyolitic pyroclastic rocks (Kia3 and Ki2m); and scarce sedimentary intercalations such as conglomerates, sandstones, lacustrine calcareous siltstones with fossil flora, and locally marine fossiliferous limestones (Figure S2).
The Casablanca River basin has Carboniferous-Permian (328–235 Ma) and middle-Upper Jurassic (180–142 Ma) intrusive rocks (CPg and Jsg, respectively); Jurassic volcanic and marine sedimentary sequences (J2m); Upper Miocene-Pliocene sedimentary rocks (MP1m); and Pleistocene-Holocene sedimentary rocks with alluvial, colluvial (Q1 and Qa), or fine to medium sands with bioclastic intercalations wind deposits (Qe) in active and inactive dunes and mudflats [16] (Figure S3).

2.3. Data Selection and Statistical Analysis

The trace elements data (As, Cu, Pb, and Zn) from the “Chilean regulations on metal-polluted soils: The need to advance from adapting foreign laws towards developing sovereign legislation” paper by Neaman et al. [13] were analyzed. One hundred and forty-seven and thirty-five topsoil samples (0–20 cm) from the Aconcagua and Casablanca Rivers, respectively, were selected. In the Aconcagua River basin, 127 samples were collected from various locations, including mining areas, and only 20 topsoil samples were from agricultural areas with no mining activity. The Casablanca River basin samples were sampled from fruit and vegetable agriculture areas without mining activity.
The Spearman correlation coefficient is a nonparametric measure of the strength and direction of the association between two ranked variables, and the database in this study is not normally distributed. Principal component analysis (PCA) simplifies multidimensional data while retaining the underlying trends and patterns of the original dataset. PCA can identify relationships among the analyzed geochemical patterns, providing insight into the characteristics of the environment. Cluster analysis is a statistical technique used to group a set of objects, observations, or variables into clusters (groups), such that the objects in the same cluster are more similar to each other than to those in other clusters. Correlation, principal component analysis, and cluster analysis are commonly used in various fields, including soil contamination studies, to identify patterns, classify data, and make data-driven decisions.
The kriging method using ArcGIS v.10.5 software was applied to show the spatial distribution of soil trace element concentrations. The software allows the user to locate each observed concentration geographically and to generate a map of hotspots to compare the distribution of different elements in the studied area [1]. This functionality was used to present the concentrations of As, Cu, Pb, and Zn using the ordinary Kriging method in ArcGIS version 10.5. In this study, several theoretical variogram functions, including linear, exponential, and spherical models, were evaluated. Table S3 presents the variogram parameters used for kriging modeling. The ranges were divided into 25th, 50th, 75th, 90th, and 95th percentiles using IBM SPSS Statistics v.21 software [18].

2.4. Threshold Values

The geochemical baseline of a chemical element is the sum of the natural geochemistry of the soil and its pedogeochemical processes, including the input of moderate diffuse sources of a contaminant. These values provide information on the natural geochemical state of an area and the range of concentrations before anthropogenic activity at a more localized level [19]. Tume et al. [20] presented several methods for determining baseline levels in various environments: median + 2MAD (median absolute deviation), upper whisker (UW), and percentile. Neamn et al. [13] established the Aconcagua and Casablanca River basins’ background by applying the percentile method, one of the most commonly used methods for determining background values in soil studies [21]. In this work, the median + 2MAD, upper whisker methods, and 90th and 95th percentiles methods were applied in soil data from Aconcagua with and without mining activity and Casablanca to evaluate the geochemical variability. All values that fall within the established range median + 2MAD were considered acceptable. Values above the upper limit of the box plot obtained with the UW method were considered outliers [22]. Finally, the 90th and 95th percentiles were applied to define the threshold.

2.5. Positive Matrix Factorization

Positive matrix factorization (PMF) is a powerful method for studying soil contamination, providing valuable information about the origins, levels, and distribution patterns of pollutants [1]. In addition to PMF, the following models are often used for source identification and quantification: chemical mass balance (CMB), Unmix models, and receptor models.
Positive matrix factorization (PMF) allows for identifying the various factors that may be causing the variability in the observations and assigning a percentage of the incidence of each element in each factor. This way, it is possible to characterize and attribute a specific source to it through the most prevalent metals [1]. A specified dataset can be viewed as a bidimensional data matrix X, which represents the number of samples and the chemical species that were measured, with uncertainties referring to the level of uncertainty or error associated with the measurement of each chemical species in each sample. These uncertainties are essential to environmental data, as they reflect the confidence and reliability of the observed concentrations. Receptor models aim to solve for chemical mass balance (CMB) between measured species concentrations and source profiles [20], a critical component of receptor models used to analyze environmental pollution data, particularly in chemical mass balance modeling. It shows how the concentration of measured pollutants at a receptor (like a sampling station) can be expressed as a sum of contributions from different pollution sources. Equation S1 shows the mathematical formulation of positive matrix factorization.
The evaluation was divided according to the basins to be studied, Aconcagua and Casablanca, where the latter was also separated according to the type of crops present in the study areas, such as vegetables and fruits. Therefore, three matrices were prepared with their respective uncertainties, which were determined to be 10% for all cases. For the construction of the model, the relationship between concentration and uncertainty was analyzed for the three cases. All S/N ratios (signal-to-noise ratio indicating whether the variability of the measurements is natural or within the noise of the data) were above 1.0 and were therefore categorized as “strong”.
In the execution of the model, a seed value of “100” was used in all cases and many iterations of 20. The Qtrue/Qstrong values were evaluated, and for the three cases, it was determined that the number of adequate factors corresponded to 3. The residual values were analyzed with this, which were between −3 and 3. Three samples of the Aconcagua basin presented anomalies, so they were extracted from the database so they did not contaminate the model.

2.6. Environmental Indexes

Environmental indexes were calculated to characterize the potential soil contamination in the Aconcagua and Casablanca River basins. The geoaccumulation index (IGEO) and contamination factor (CF) were selected, because these indices have been used in numerous studies on soil contamination [23].
The geoaccumulation index provides a numerical value that indicates a range within which the soil can be considered contaminated by organic and inorganic substances [24,25]. According to Loska et al. [24], this index is calculated using the following formula:
I g e o = log 2 ( C i C b )
where C i is the measured concentration of the specific element in the soil (mg/kg), and C b is the background value (mg/kg). According to Loska et al. [24], the geoaccumulation index considers the seven classes indicated in Table S1.
The contamination factor proposed by Hakanson [26] is the ratio between the contaminant concentration and the reference concentration value. The following equation is used:
C F = C i C b
where C i is the measured concentration of the specific element in the soil (mg/kg), and C b is the background value (mg/kg). Table S2 shows the contamination factor categories defined by Hakanson et al. [26] and Diami et al. [11].

2.7. Human Health Risk Assessment

Human health risk assessment is a hypothetical basis for determining the probability of risks occurring to individuals after exposure to various hazardous elements [12]. Understanding the pathways and risks of trace metal exposure in contaminated soils, the distribution of their sources, and the physical differences between exposed individuals are fundamental prerequisites for preventing and controlling soil contamination [27]. This study considers three pathways of trace metal exposure: ingestion, dermal absorption, and inhalation, as well as whether the subjects are adults or children. Therefore, it is necessary to start by determining human intake through ingestion (DEing), dermal absorption (DEder), and inhalation (DEinh). Following the health risk assessment model proposed by USEPA [14] and USEPA [15], non-carcinogenic risk (HQ) and carcinogenic risk (CR) were evaluated for the elements As, Cu, Pb, and Zn. Copper toxicity is generally not an important concern for human health due to homeostatic mechanisms that control Cu excretion [16,17]. However, Bost et al. [19] argued that there are still unresolved issues regarding understanding the effects of Cu exposure on human health. It is important to note that HQ values < 1 indicate no significant risk of non-carcinogenic effects, while HQ values > 1 suggest that adverse effects may occur [18,28]. For cancer risk, values indicating no risk fall within the range of 10−6 to 10−4 [23], meaning that CR > 1.0 × 10⁻⁴ indicates a significant cancer risk to human health, while values below 1.0 × 10⁻⁶ suggest that the exposure is not harmful [24,25,26,29]. Only cancer risks associated with As and Pb have been evaluated in this study since USEPA has updated the slope factor values for these elements. USEPA [21] has not established slope factors for Cu and Zn, as standard values are still unavailable. The risks are evaluated and calculated according to Moreira et al. [25] as shown in the equations in Equation S2 and Table S3.

Noncarcinogenic Risk Characterization

The noncarcinogenic risk for each element in the sample can be obtained according to USEPA [12] following the equation given in Equation S3. Cancer risk ( C R S I ) is given by the equation in Equation S4 and Table S4, which also considers the three exposure pathways according to the USEPA [21].

3. Results and Discussion

3.1. Exploratory Data Analysis

Histograms for both catchments show that the distributions of As, Pb, Cu, and Zn are asymmetric to the right, with longer tails at higher concentrations due to a relatively small fraction of high values (Figures S1 and S2). Box plot analysis shows some outliers in the higher concentration tails, indicating that external sources affect the natural concentrations [4]. High dispersion reflects that several point sources contribute to these concentrations and diffuse contamination of these elements within the urban sector.
The summary statistics for the elements As, Cu, Pb, and Zn are presented in Table 1 for the Aconcagua and Casablanca Rivers. The first thing to consider is the coefficient of variation: in the Aconcagua River basin, soil samples from the whole basin present extremely high CV values (CV > 100%) for As and Pb and are considered high (50% < CV < 100%) for Cu and Zn. The Casablanca River catchment has a low CV for Cu, Pb, and Zn and an extremely high value for As. Elements with a lower CV are expected to be dominated by natural sources. In comparison, those with a higher CV are more likely to be affected by anthropogenic sources [23]. Industrial activity is considered an anthropogenic source for the Aconcagua River basin, which would explain the high CV values observed. For the Casablanca River basin, it is concluded that the total As concentration in soil may be affected by applications of fungicides or pesticides containing As [24]. However, the contribution of As-containing fungicides to soil As concentrations is expected to be similar at all sampling sites in both river basins, because fungicide application is not attributed to a specific crop or crop type. Instead, fungicide application is common for several vegetable and fruit crops in Chile [25].
The big differences between the minimum and maximum values indicate spatial heterogeneity of potentially toxic elements in soils [26]. For both watersheds, a high heterogeneity is observed. This is because soil in the same sector does not have the same characteristics, and as the samples were taken from different areas of the watersheds, it is correct to state that they have a high variability. Regarding the average concentration of potentially toxic elements, we are guided by the “world soil average” [29], which tells us that the world average concentration per soil of the elements As, Cu, Pb, and Zn is 6.83 (mg kg1), 38.9 (mg kg−1), 27 (mg kg−1), and 70 (mg kg−1), respectively. Thus, the concentrations of potentially toxic elements in all the soil samples of the Aconcagua River basin are well above the world average for soils (in order of highest to lowest are Cu, Zn, Pb, and As), which indicates that these elements contaminate the area. On the other hand, the average concentrations of the Casablanca River basin are below the world average, which suggests that the area is not contaminated. The comparison is made with the world average because Chile still has no regulation or reference values for potentially toxic soil elements. This is a problem, since soils do not have geochemical similarities even in the same country. In addition, it should be considered that soils in Chile are enriched in Cu and Zn, so it is urgent to pass laws that can provide optimal reference values for potentially toxic elements in Chilean soils. Finally, from the perspective of asymmetry, the values of these elements vary in the order Zn > As > Cu > Pb for soil samples without mining activity in the Aconcagua basin, Pb > Cu > Zn > As for random soil samples from the Aconcagua basin, and As > Pb > Zn > Cu for soil samples from the Casablanca basin. This is consistent with the coefficient of variation of trace elements, indicating that human activity may affect the elements, resulting in a significant positive skewness.
Shayler et al. [30] proposed toxicity thresholds for humans in residential areas with As, Cu, Pb, and Zn, which are 16 mg/kg, 270 mg/kg, 400 mg/kg, and 2200 mg/kg, respectively. For As, the maximum concentration in samples from the Aconcagua River basin without mining activity and in samples including mining activity from the same basin is 24 mg/kg and 44 mg/kg, respectively, indicating toxic levels for humans. On the other hand, in the Casablanca River basin, the maximum concentration of this element is 14 mg/kg, slightly below the threshold. The concentration of Cu in the soil samples, including mining activity, reached a value of 5581 mg/kg, far above the allowed limit. The maximum concentrations in soil samples from the Aconcagua River basin without mining activity and from the Casablanca River basin are 160 mg/kg and 66 mg/kg, respectively. Regarding Zn and Pb, the risk of human exposure in the Aconcagua and Casablanca River basins is of minor importance, as their total maximum concentration in the soil of the Aconcagua River basin without mining activity is 395 mg/kg for Zn and 36 mg/kg for Pb. For soil samples from the same basin, including mining activity, the concentrations are 579 mg/kg for Zn and 309 mg/kg for Pb. In samples from the Casablanca River basin, the values are 139 mg/kg for Zn and 41 mg/kg for Pb, all well below the proposed human toxicity threshold. It should be noted that children playing outdoors can ingest soil contaminated with metals [31], which becomes dangerous and harmful if consumed in large quantities.

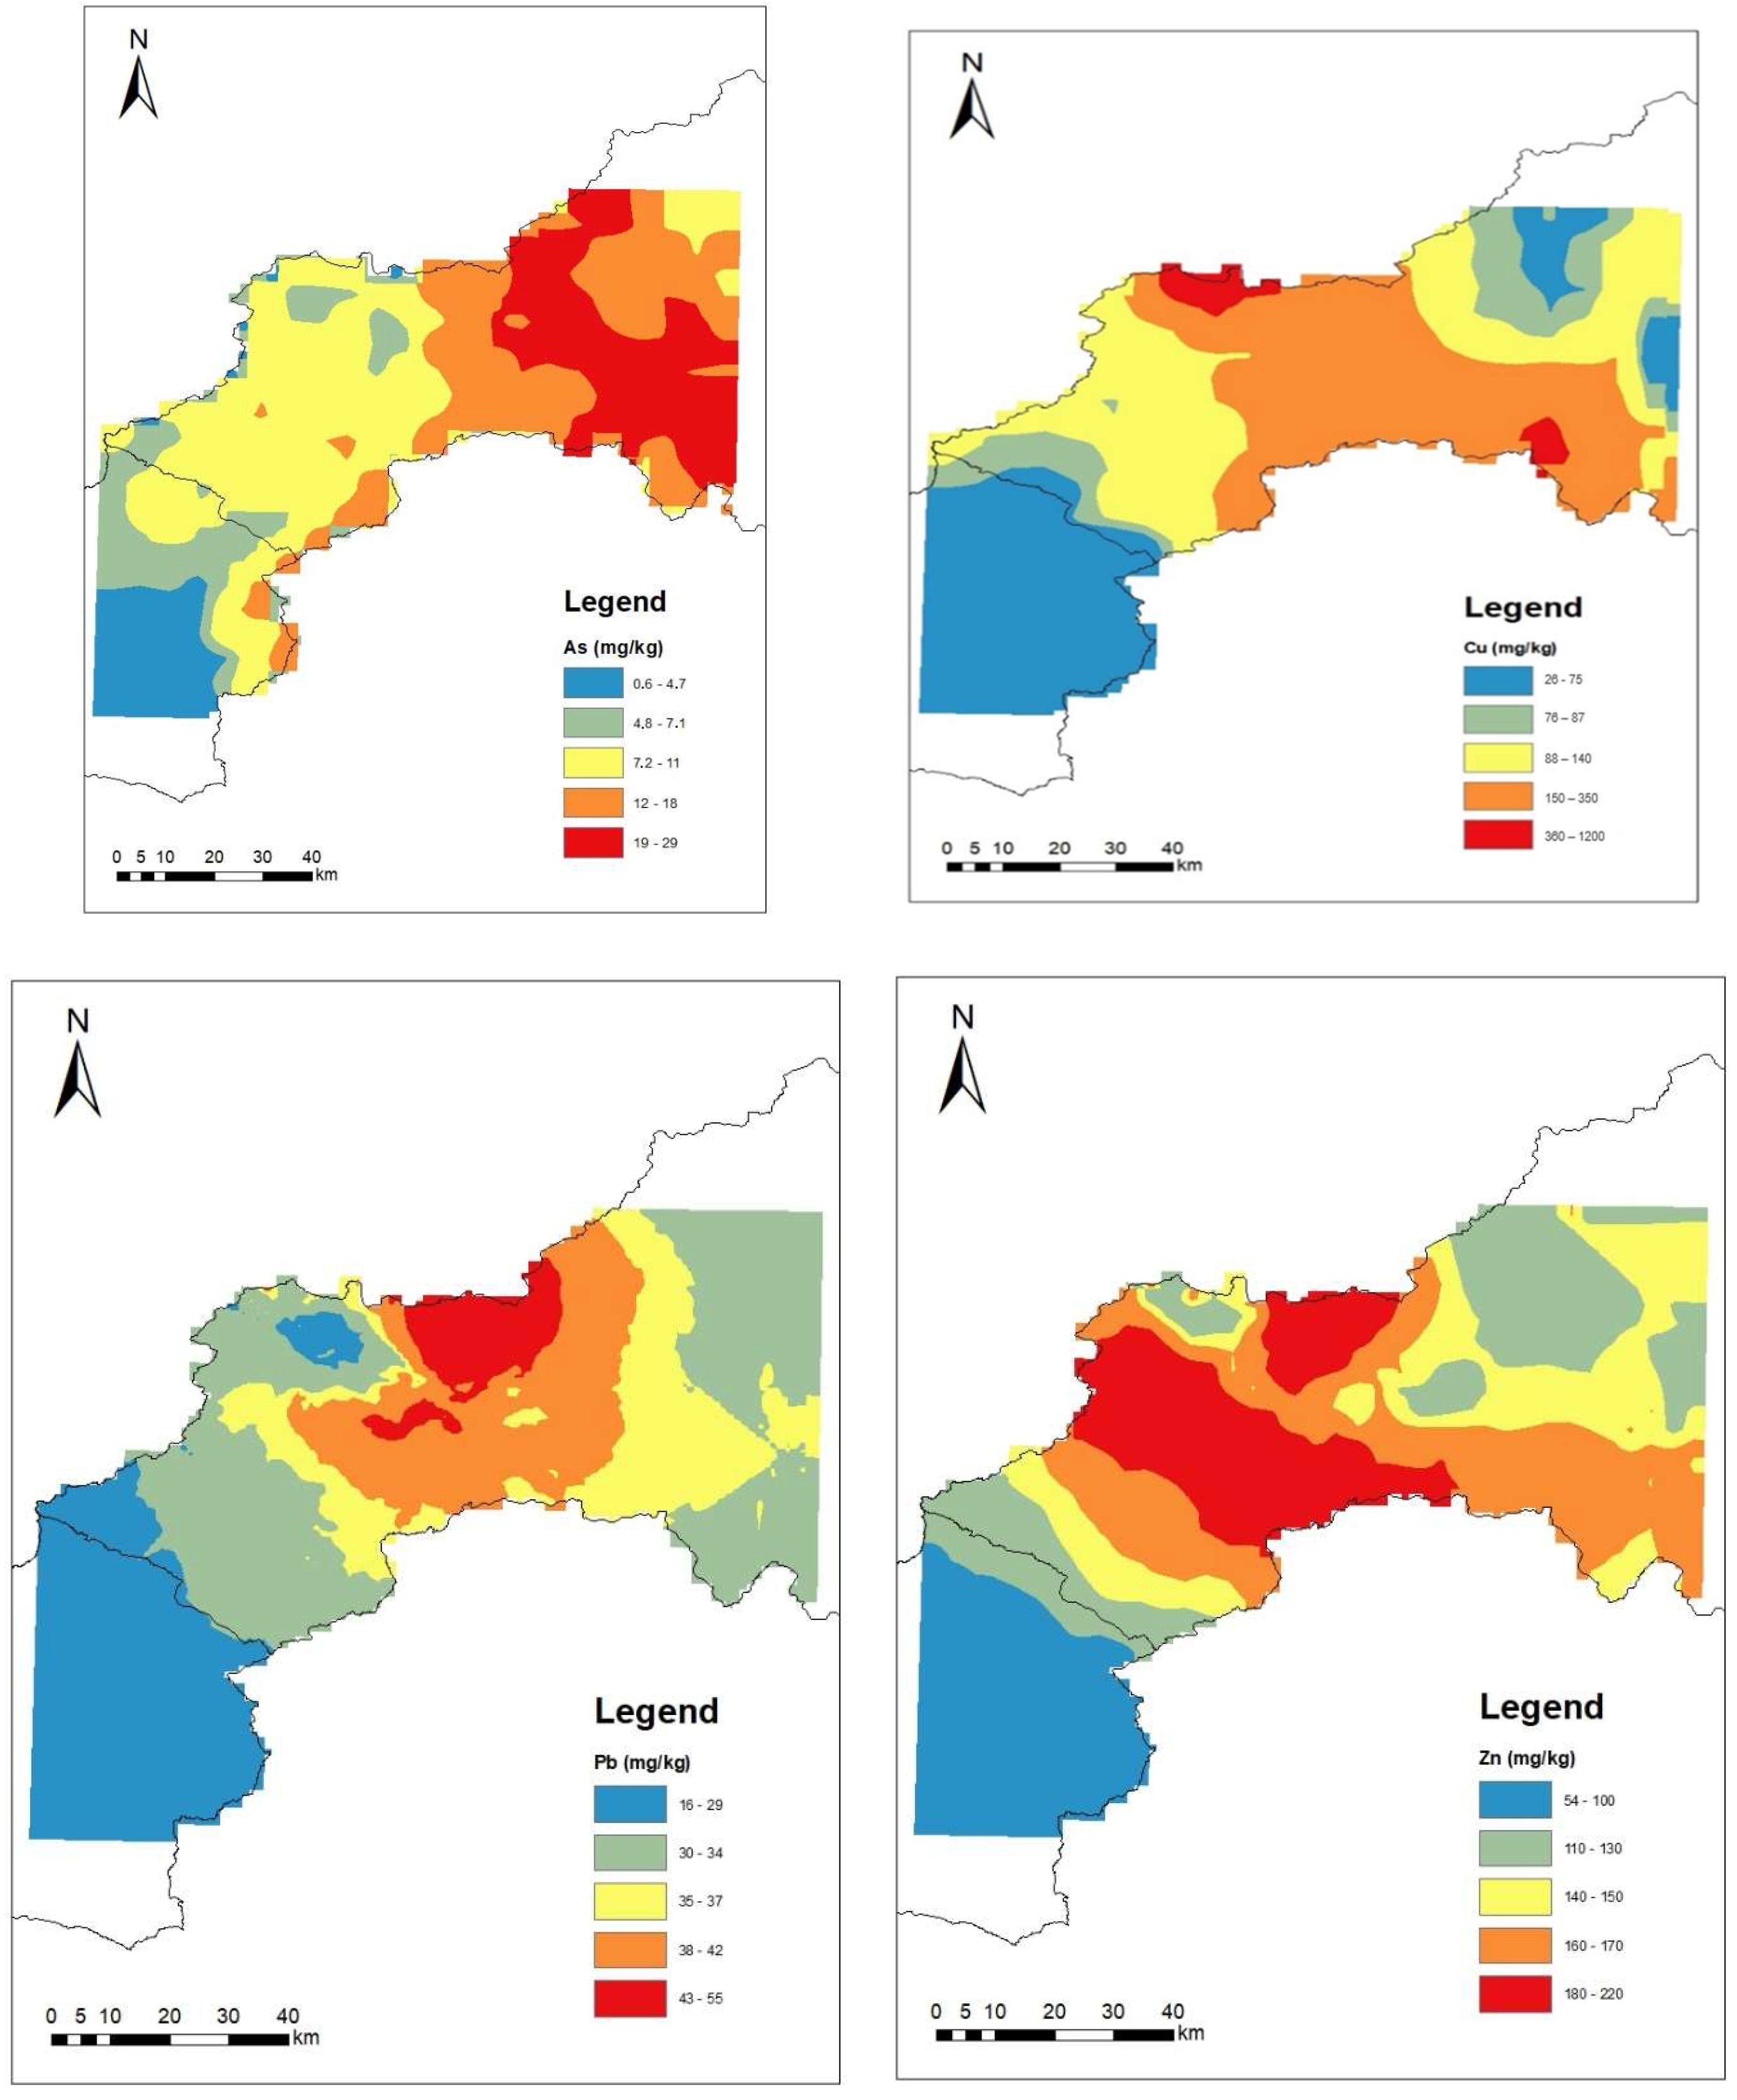
3.2. Spatial Distribution

The spatial variability of the As, Cu, Pb, and Zn concentrations within the study area was investigated through the analysis of experimental variograms. The data processing and visualization were performed using ArcGIS v. 10.5. Various theoretical variogram models, including linear, exponential, and spherical functions, were assessed, considering nugget effects. The technical aspects of this modeling are described in detail in classical geostatistical literature, such as Isaaks et al. [32].
In the Aconcagua River basin, sampling points with mining activity show high levels of As, Cu, Pb, and Zn, potentially toxic and harmful to human and animal health [33]. Sampling points in areas without mining activity also recorded high concentrations of these elements due to mobility and transport processes. On the other hand, the Casablanca River basin did not show high distribution values for these elements (Figure 2).
Figure 2 illustrates the spatial distribution modeling of As, Cu, Pb, and Zn in the area where the sampling points are located. In Figure 2, a higher concentration of arsenic is observed in the northeastern part of the Aconcagua River basin, where the mining activities are located, which extracts refined copper and arsenic. In contrast, this concentration is lower in the Casablanca basin. The figure shows that copper has a distribution similar to lead, with higher concentrations towards the north of the Aconcagua River basin, while the values decrease in the Casablanca basin. This is due to the presence of mining activities in the area of higher concentration, while there is no mining activity in the Casablanca basin. Regarding zinc, its highest concentrations are found in the northern part of the Aconcagua River basin. In addition, these values have remained stable since 2004, implying that there have been no relevant changes in the sources of discharge into the Aconcagua River.

3.3. Geochemical Baseline

Table 2 shows the threshold values obtained in calculating each method analyzed. The threshold values differ between the three methods; the distributions are altered and skewed towards higher values in the upper whisker method and the percentiles. The MAD method gives intermediate values about the other methods. This is why it was decided to opt for the MAD method to generate the geochemical background value, as this method tends to show intermediate values that are more representative of the various populations observed and will allow us not to overestimate or underestimate the posterior section.
The geochemical baseline concentrations of the elements As, Cu, Pb, and Zn were approximately twice as high in the Aconcagua River basin as in the Casablanca River basin. This difference in soil element concentrations can be explained by the difference in rock types in these two river basins. Specifically, the Casablanca River basin comprises predominantly plutonic (intrusive) and sedimentary rocks, while the Aconcagua River flows through terrain covered mainly by volcanic (effusive) and sedimentary rocks [13]. It is important to note that volcanic rocks (basalts, andesites, and dacites) tend to be enriched in Cu and Zn compared to plutonic rocks (gabbro, diorites, and granodiorites). Thus, the difference in the predominant rock types (volcanic and plutonic) defines the Cu and Zn contents in the soils of the Aconcagua River basin (volcanic rocks) and the Casablanca River basin (plutonic rocks) [13].
Spearman correlations were analyzed to process the data and identify possible trace metal contamination sources (Table 3). The element pairs As/Pb and Cu/Zn in the Aconcagua River basin without mining activity indicated that these elements have a common source. One level for the element pairs Cu/Zn and Pb/Zn was detected in the Aconcagua River basin in random sectors, including mining activity; in addition, a level of significance was observed for the elements As/Cu and Cu/Pb, indicating that their levels were from the same source. Finally, a significant level for Cu/Zn and Pb/Zn was observed in the Casablanca River basin. Moreover, a significant level was observed for the Cu/Pb elements, indicating that their levels were similar or came from the same source.
Principal component analysis (PCA) in the Aconcagua River basin reveals two components. Principal component 2 may be associated with the mining activities (Table 4a and Figure 3a), while PC1 appears to be influenced by both activities: mining and agriculture activities. Table 4b and Figure 3b present PCA results for the Casablanca River basin. Principal component 1 is likely related to agricultural activity, and PC2 is attributed to a geogenic origin.
Cluster analysis was performed using the Ward method with Euclidean distance squared. Figure 4 shows the dendrogram generated for the Aconcagua River basin (a) and Casablanca River (b). The As-Pb-Zn group can be attributed to more than one source of origin, while Cu is at the second level in the Aconcagua River basin. However, in the Casablanca River basin, two groups are observed: one formed by As-Pb-Cu, which indicates that they come from more than one source, and the second by Zn, which suggests that they come from a single source.

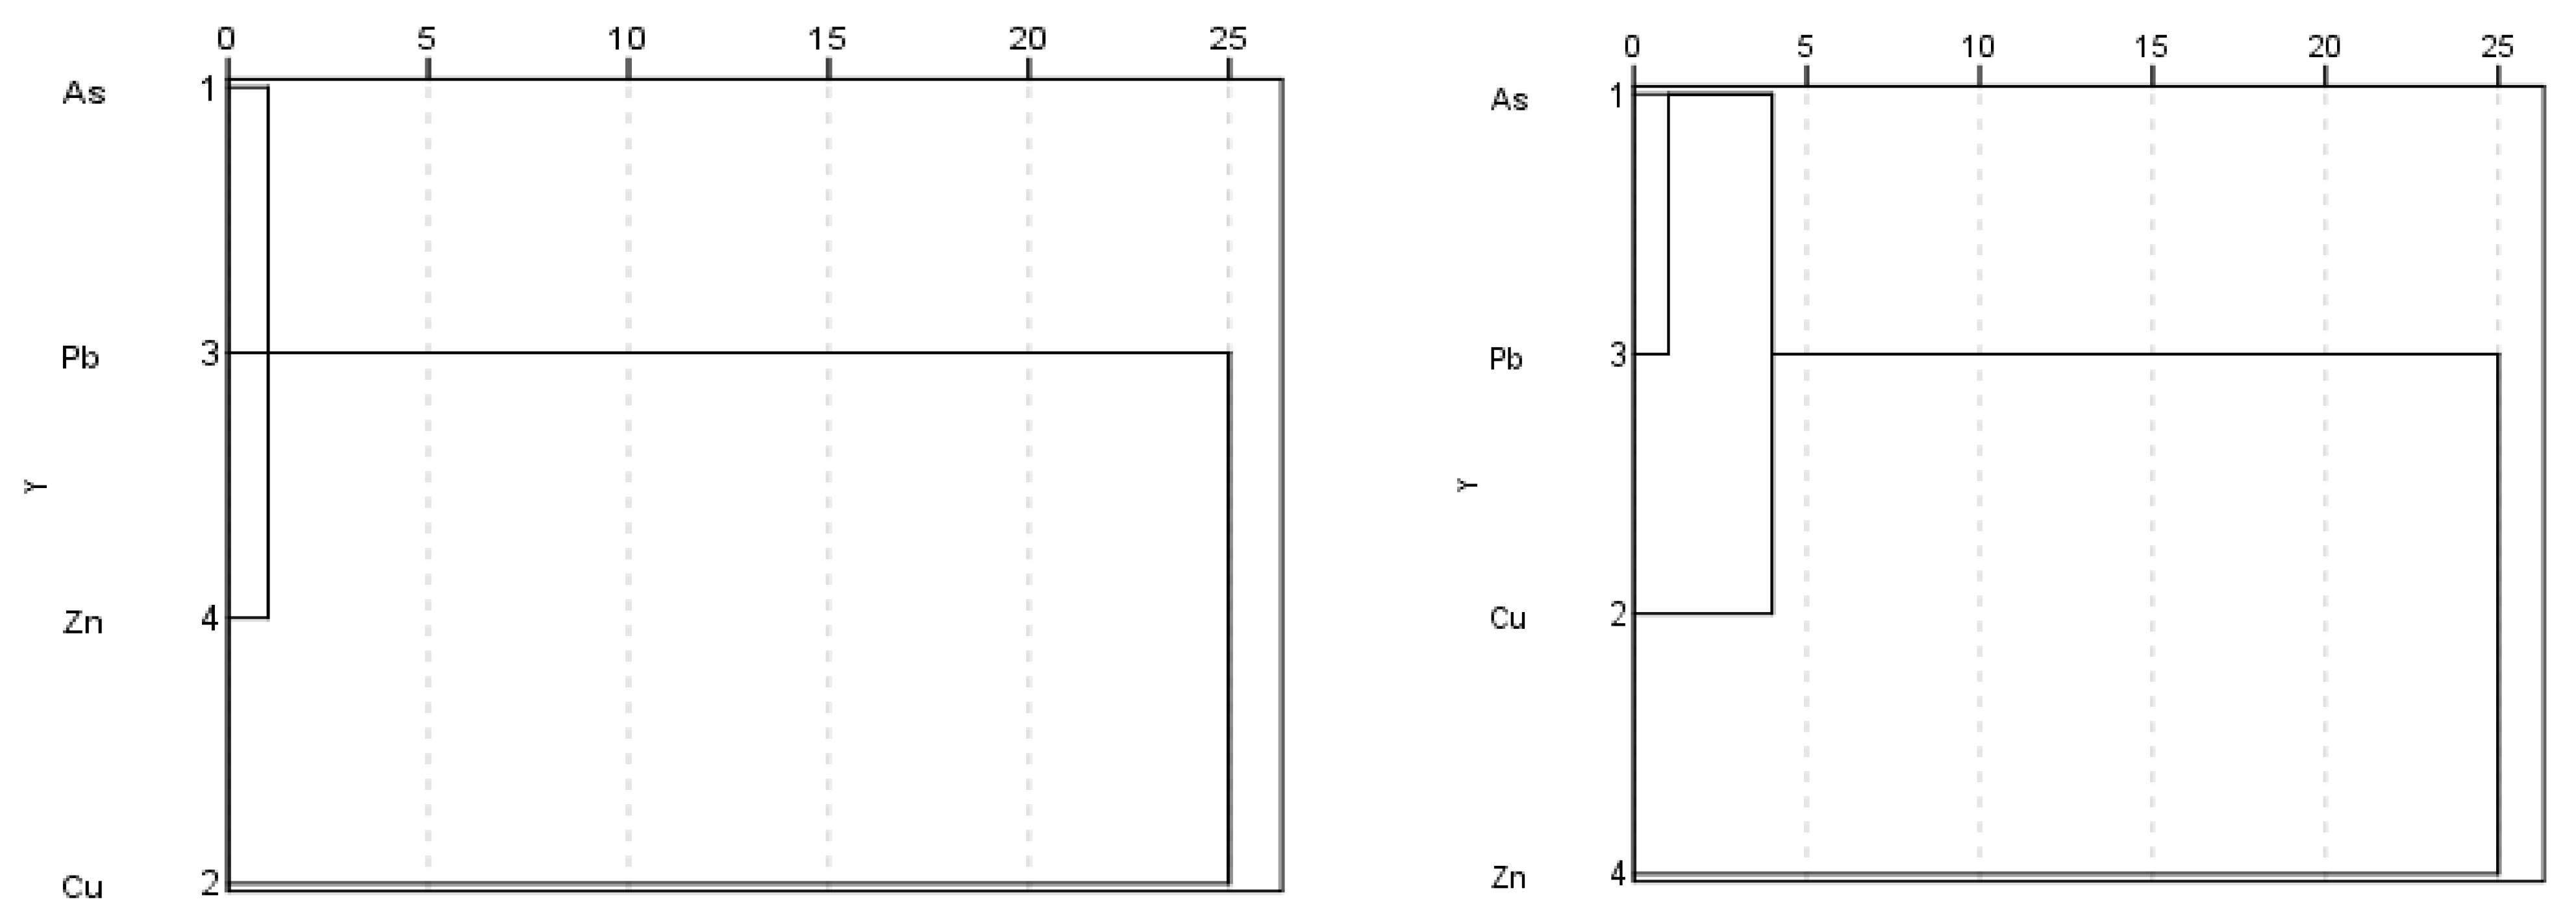
3.4. Grouping of the Elements

Samples extracted in places close to mining activity in the Aconcagua basin and vegetable and fruit crop areas in the Casablanca River basin are evaluated (Table 5). It is evident that arsenic contributes largely to Factor 1 (90.5%), copper entirely to Factor 3 (100%), and lead with zinc, to a large extent, to Factor 2 (59.0% and 73.5%, respectively) in the Aconcagua basin. In the Casablanca River basin, unlike in the previous case, arsenic contributes largely to Factor 2 (79.3%), and copper, lead, and zinc contribute to Factor 1 (86.2%, 68.6%, and 68.7%, respectively), leaving Factor 3 as a residual of the four metals. Finally, the data associated with fruit crop areas showed that arsenic contributes to Factor 1 (81.9%), copper, to a large extent, to Factor 3 (82.1%), accompanied by lead in smaller quantities (44.5%), and finally, lead to Factor 2 (64.1%).
Regarding the source of origin of the heavy metals influencing each factor (summarized in Table 6), in the case of arsenic, although the dominant source in soils is geological and therefore depends, to some extent, on the concentration in the parent rock material, additional contributions can be derived locally from industrial sources, such as smelting and fossil fuel combustion products, and agricultural sources, such as pesticides and phosphate fertilizers. Arsenic concentrations well above the background values have been found in sediments and soils contaminated by the products of mining activity, including mine tailings and effluents [34]. Copper’s origin lies in the effect of mining on soils in the country, where numerous studies have revealed a high degree of heavy metal contamination in areas near tailings and smelters. It is essential to mention the presence of mining activity in the Aconcagua basin, where the primary extraction material is copper. It also stands out as one of the areas with the soil most contaminated by the mining industry [35].
In the case of lead, its presence can be important even decades after the polluting source has been eliminated, for example, the content in paints and fuels before the 1990s or irrigation with sewage water, which has been treated 100% since 2013 but which toxic residues will remain in the soil for a long time. Although there are no direct studies in the country, soils surrounding roads and railways are expected to have high levels of contamination due to combustion, spills, and activities associated with transport routes [35].
Regarding zinc, it is estimated that its presence in the topsoil is, on the one hand, of natural origin, resulting from the contributions of the soil’s parent materials, and, on the other hand, from the intensity of soil formation factors, especially rainfall.
Finally, vegetables can absorb heavy metals through the roots or leaves. Therefore, contamination of growing soils and irrigation waters can result in the uptake of these metals by vegetables and their subsequent entry into the food chain. Leafy vegetables, such as spinach and lettuce, tend to accumulate high concentrations from the soil in which they are grown [36].

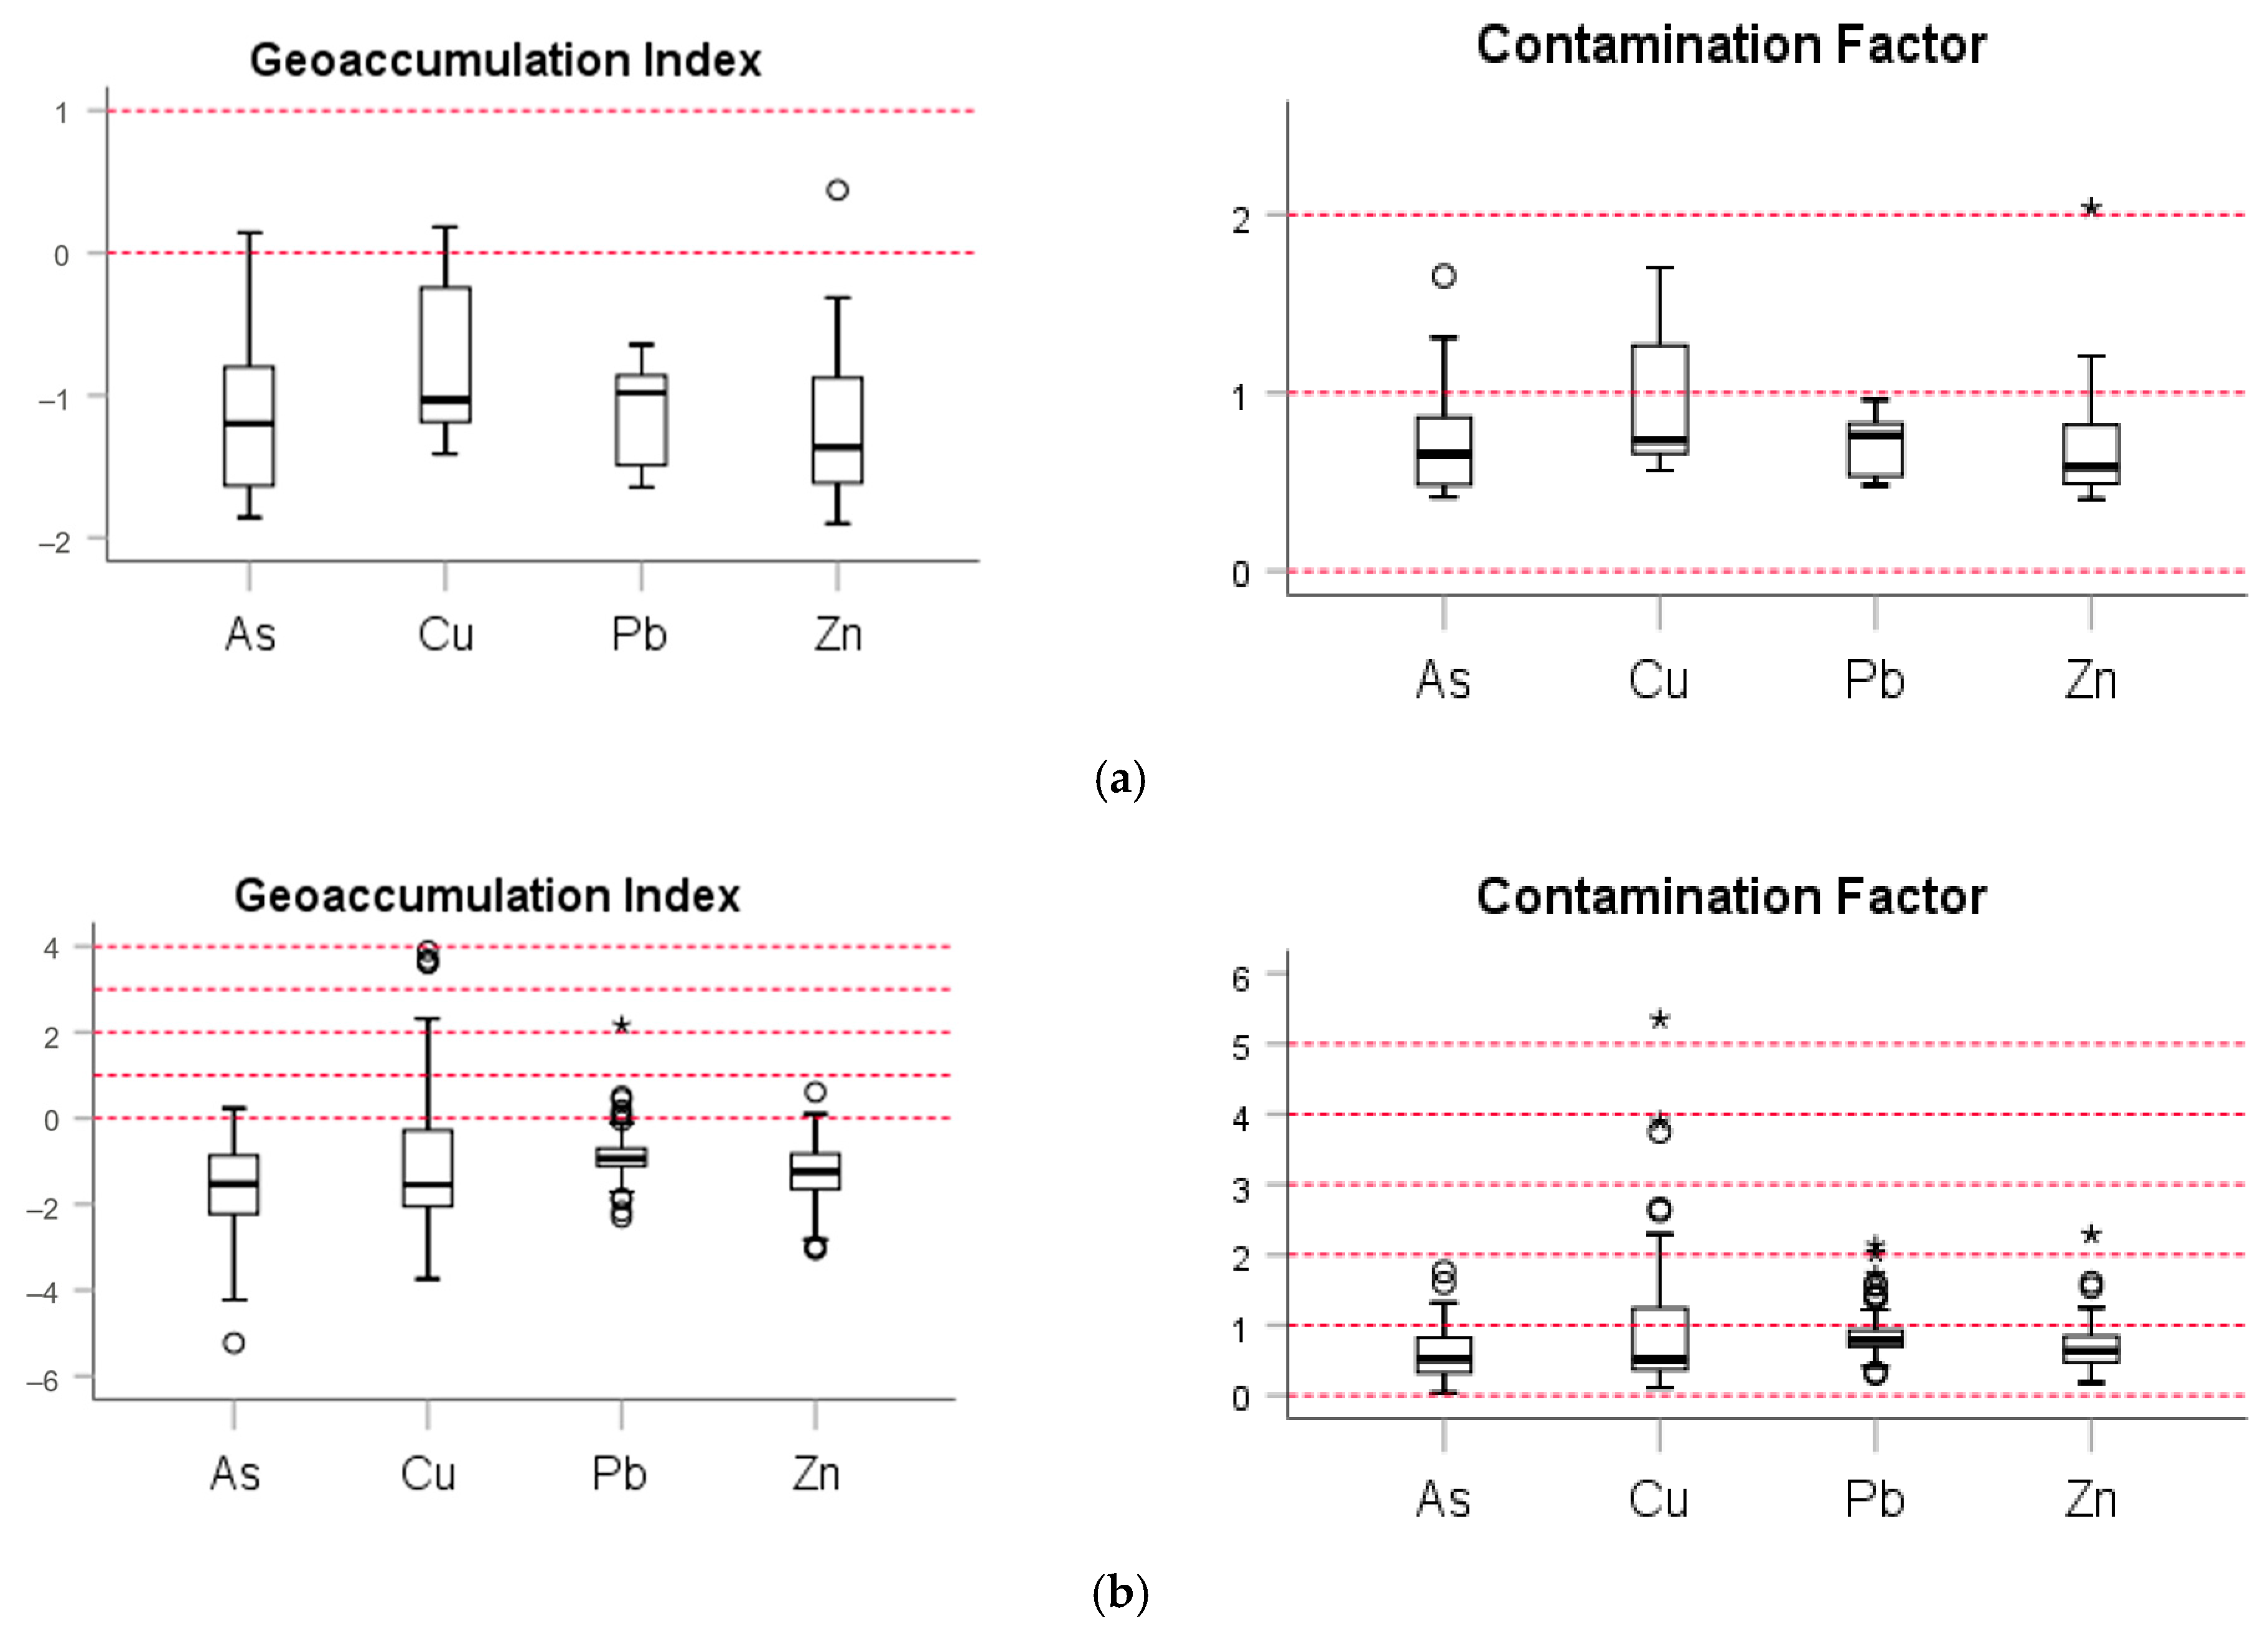
3.5. Environmental Indexes
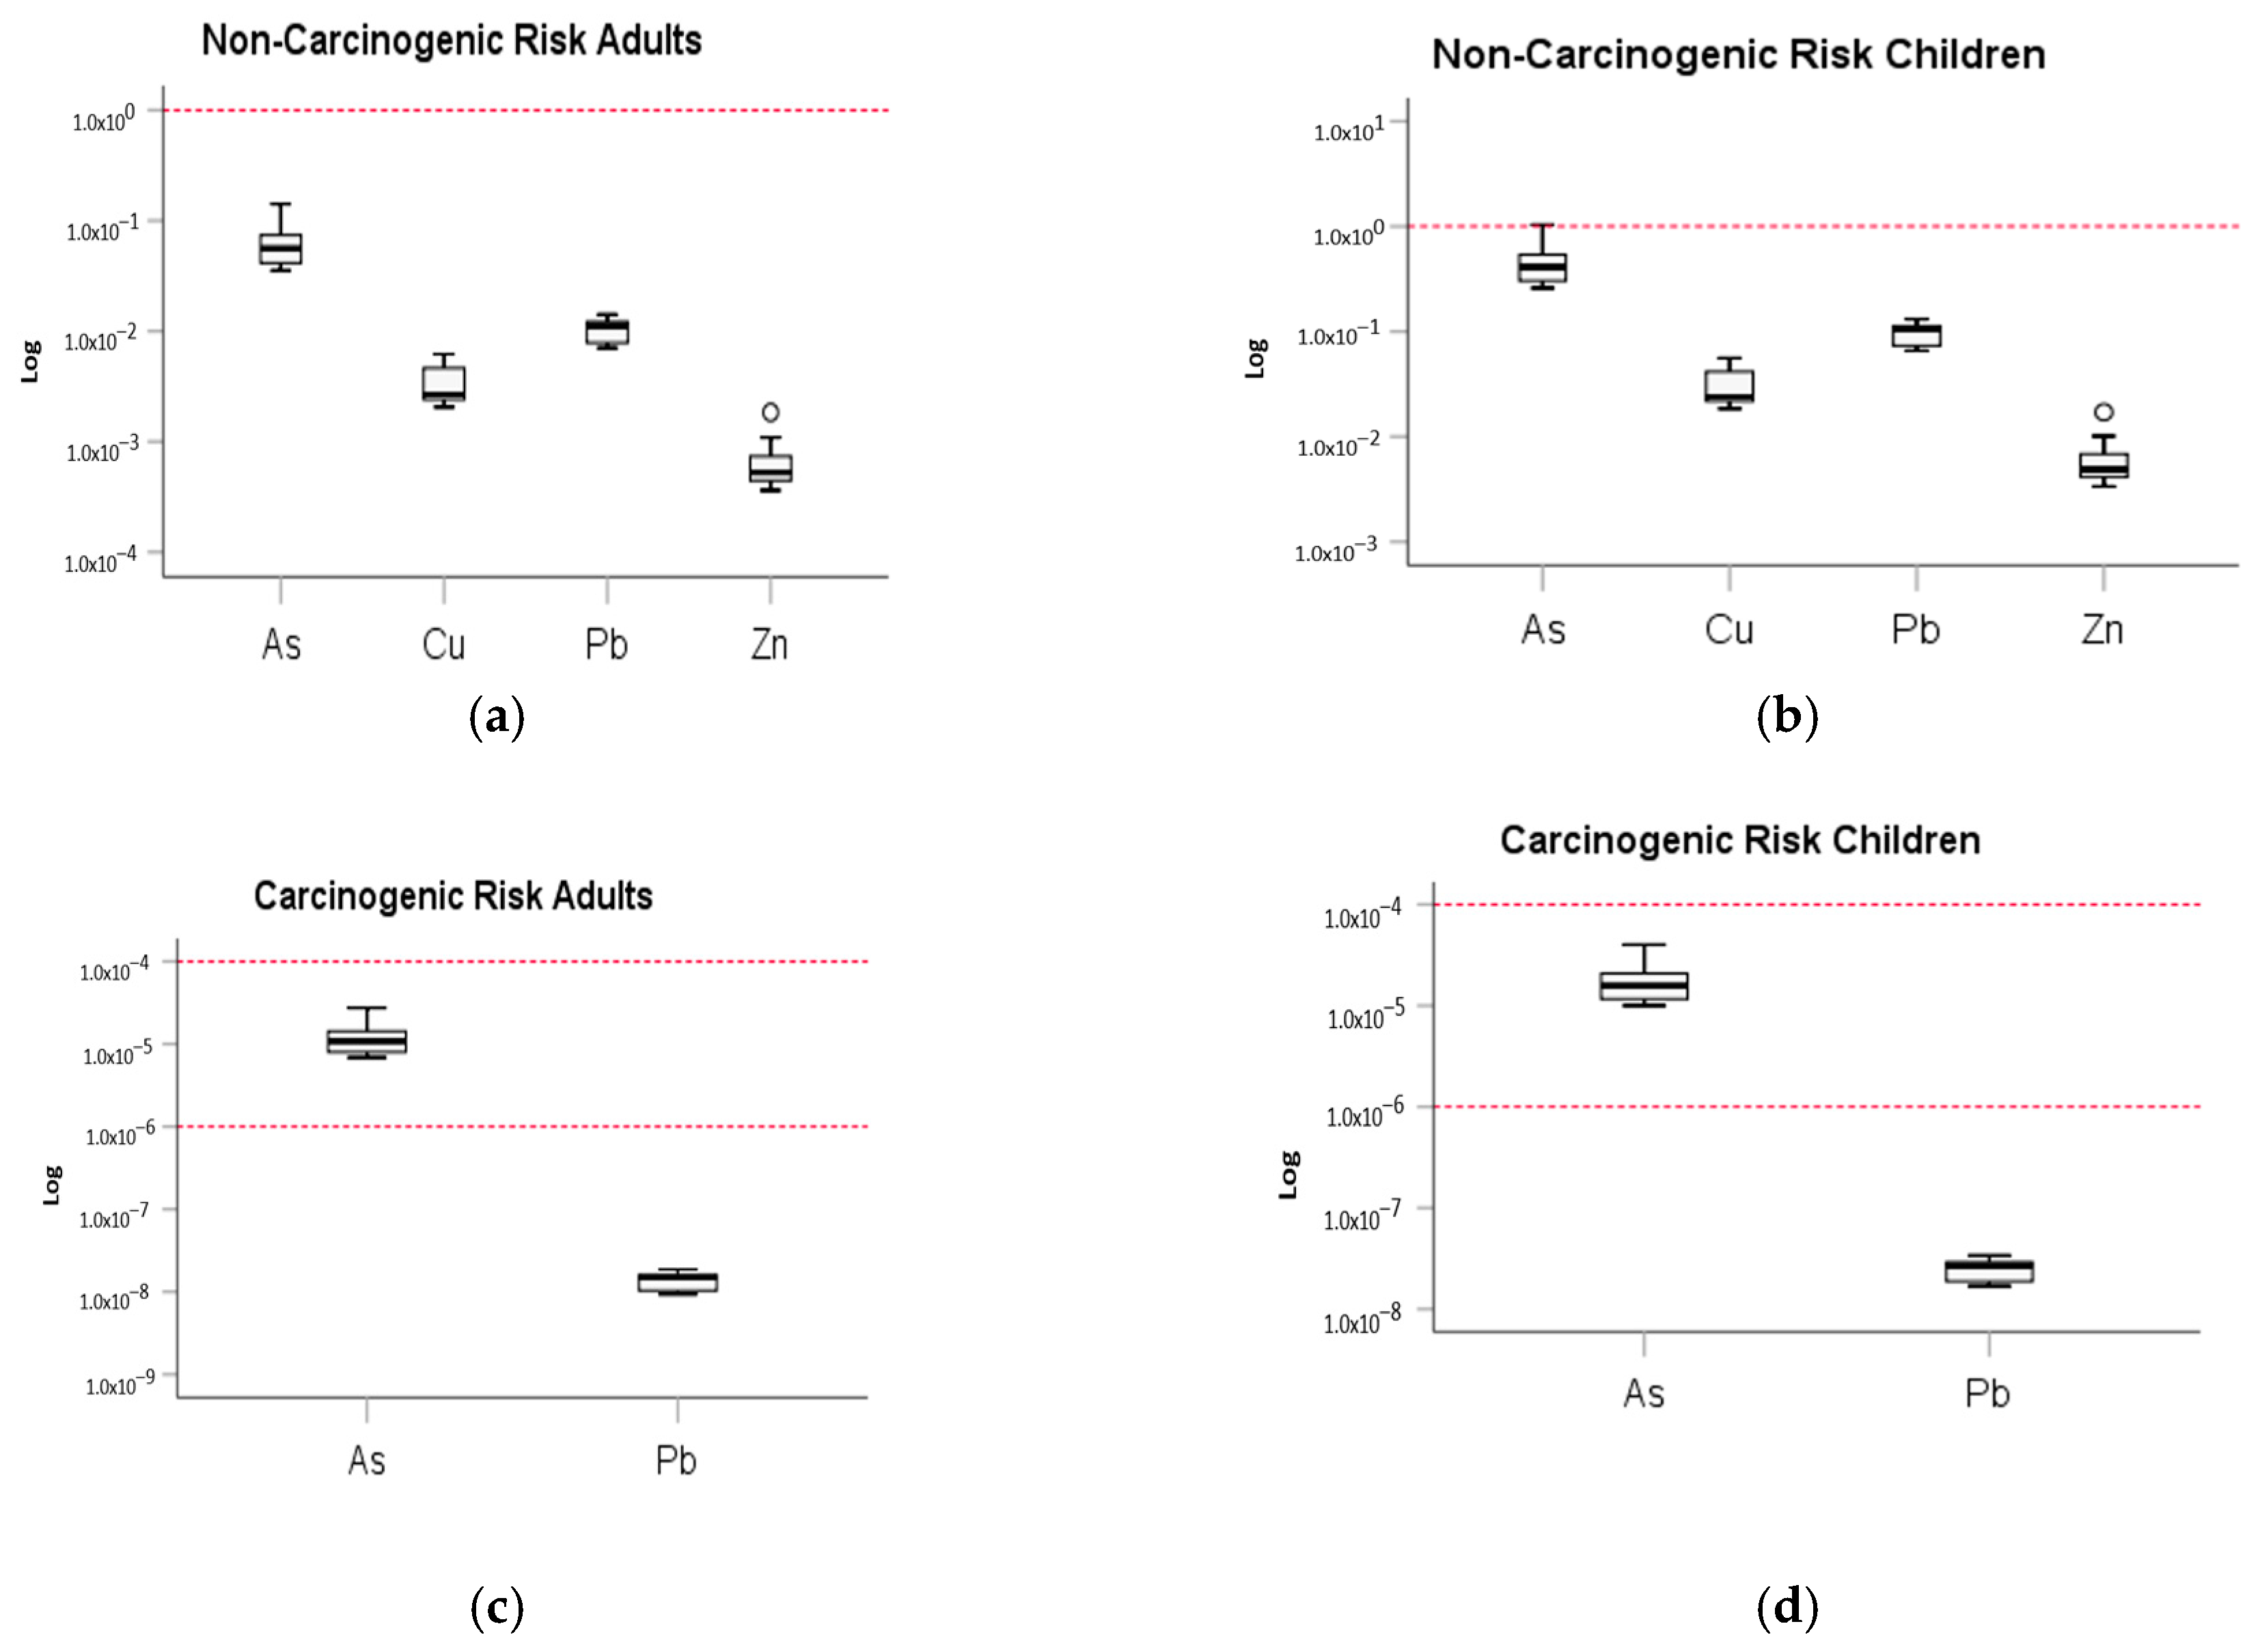
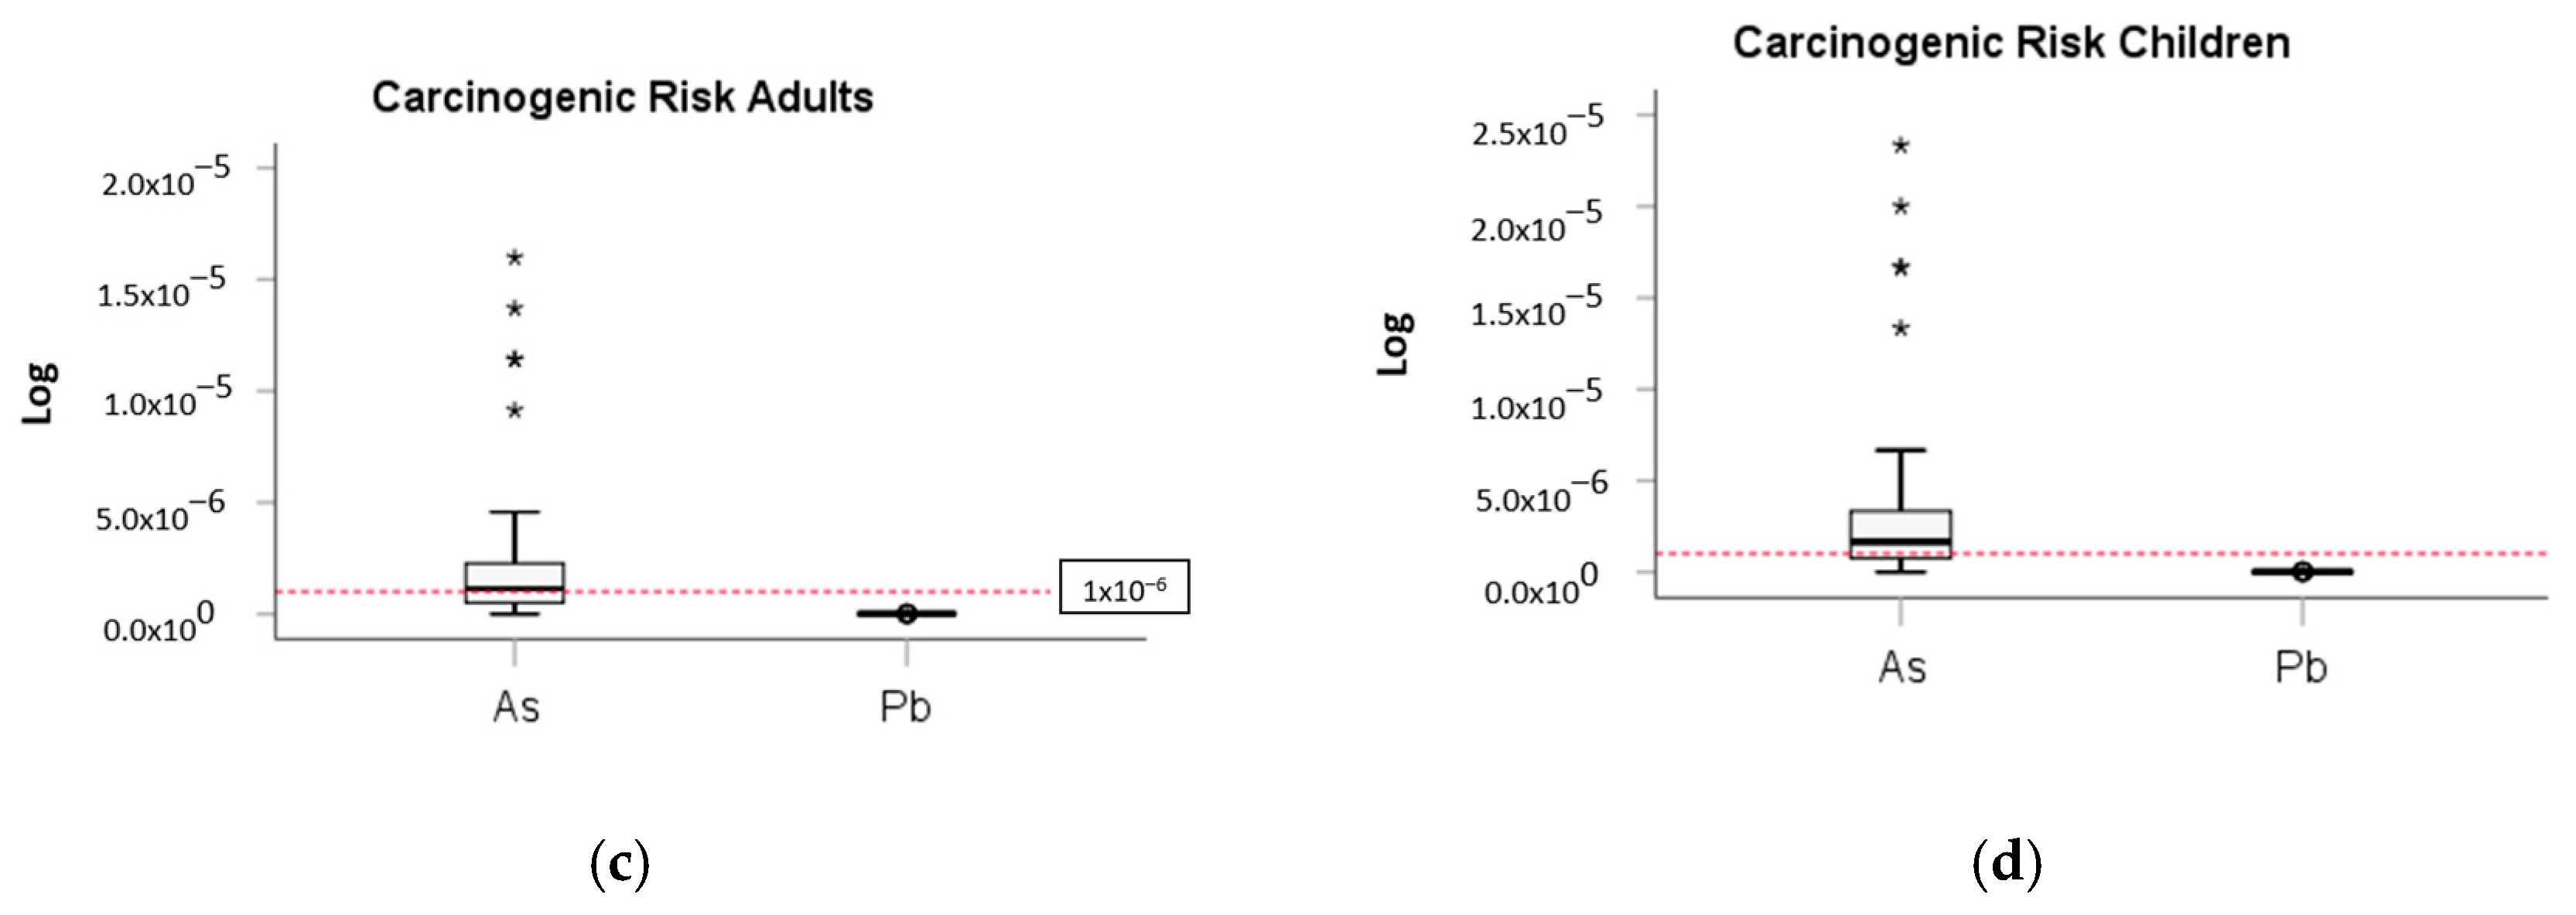
Figure 5 shows the results of the environmental indexes. The geoaccumulation index for samples obtained from the non-mining sector in the Aconcagua River basin indicates no contamination, except for one sample each of As, Cu, and Zn, which show low contamination levels. For soil samples from mining areas in the Aconcagua River basin, 2 samples of As, 13 of Cu, 5 of Pb, and 3 of Zn are slightly contaminated; 2 samples of Cu and 1 of Pb are moderately to heavily contaminated; and 4 samples of Cu are highly contaminated. The rest of the samples are not contaminated. In contrast, five samples of As were found with a moderate degree of contamination for the Casablanca River basin and one sample of As, two of Pb, and one of Zn with a slight degree of contamination.
For the contamination factor, in the Aconcagua River basin, samples from areas without mining activity showed 12 samples of As, 6 of Cu, and 3 of Zn with moderate contamination. For soil samples including mining activity, 14 samples of As, 32 of Cu, 22 of Pb, and 12 of Zn were highly contaminated. In contrast, the Casablanca River basin showed five samples of As with considerable contamination, while the rest were shallowly to moderately contaminated for all elements.

3.6. Health Risks

Figure 6, Figure 7 and Figure 8 show the health risks of potentially toxic elements in the Aconcagua River basin. For soil samples from the Aconcagua River basin without mining activity, the non-carcinogenic risk for adults and children (Figure 5a,b, respectively) indicates that all elements are within the safe limits, except for arsenic, in which 6% of the samples present a health risk for children. Regarding carcinogenic risk for adults and children (Figure 5c,d, respectively), they fall within the acceptable limits.
Soil samples that include mining activity in the Aconcagua River basin contain elements within the safe limits for adults (Figure 6a, b). However, for children, 13% of the arsenic samples, 3% of the copper samples, and 1% of the lead samples present non-carcinogenic risks. They are within the acceptable limits regarding carcinogenic risk for adults and children (Figure 6c,d).

4. Conclusions

The degree of contamination varies according to the index used. The contamination of topsoil of the Aconcagua River basin ranges from uncontaminated to significantly contaminated with the geoaccumulation index. In contrast, samples of the Casablanca River basin range from uncontaminated to lightly contaminated. The most restrictive pollution factor varies from moderate to highly contaminated in the Aconcagua River basin. In contrast, the Casablanca River basin predominantly ranges from very low to moderate contamination. Therefore, future studies in Chile are needed to establish national soil threshold values to protect human health, and this study should contribute to those works. The human health risk assessment, which is essential in pollution studies, reveals that there are no carcinogenic risks in the Casablanca River basin; however, there is an acceptable risk for children in the samples from the Aconcagua River basin, which is worrying, because they are the most vulnerable. This is particularly alarming, as children are the most susceptible population to heavy metal exposure. Addressing this issue through targeted public health interventions and regulatory frameworks is essential to safeguard their well-being. Future research in the Aconcagua and Casablanca River basins should include a soil sampling with a large number of samples. A larger database would allow another type of modeling like stochastic models.
These findings should serve as the basis for developing environmental protection policies establishing national thresholds for soil contamination in Chile, protecting human health and ecological systems. Such regulations would ensure that areas with important contamination, such as the Aconcagua River basin, receive priority in remediation efforts and stricter environmental controls, especially in regions near mining operations. Addressing these contamination risks requires governmental intervention and strategic investments in pollution control technologies, sustainable mining practices, and soil remediation projects. These investments would help reduce the long-term costs associated with health care and environmental degradation. Furthermore, public–private partnerships can play a vital role in ensuring that industries, such as mining, contribute to preserving ecological health through sustainable practices and contributions to remediation efforts.

Supplementary Materials

The following supporting information can be downloaded at https://www.mdpi.com/article/10.3390/app15052581/s1: Figure S1: Graphical representation of the concentrations of heavy metals As, Cu, Pb, and Zn (mg/kg) using a histogram, box plot, and CDF diagrams, respectively, for the soil of the Aconcagua River basin; Figure S2: Graphical representation of the concentrations of heavy metals As, Cu, Pb, and Zn (mg/kg) using a histogram, box plot, and CDF diagrams, respectively, for the soil of the Casablanca River basin; Figure S3: Geological map of the Aconcagua River basin; Equation (S1): Positive matrix factorization; Table S1: Classification of geoaccumulation; Table S2: Classification of the soil contamination factor; Equation (S2). Human intake through ingestion (DEing), dermal absorption (DEder), and inhalation (DEinh); Equation (S3): The noncarcinogenic risk for each element in the sample can be obtained according to [12]; Equation (S4): Cancer risk ( ) is given by the following equation, which also considers the three exposure pathways according to [12]; Table S3: Values of the factors used in the equations referred to as intake; Table S4: Factors used to calculate carcinogenic and no carcinogenic risks.

Author Contributions

Conceptualization, P.T., D.P., Ó.C. and N.R.; methodology, P.T., D.P., Ó.C. and N.R.; software, P.T., D.P. and N.R.; investigation, P.T., Ó.C., D.P., J.P. and N.R.; data curation, P.T., D.P. and Ó.C.; writing—original draft preparation, D.P., J.P., C.C. and S.T.; writing—review and editing, J.B., P.T., Ó.C., B.S. and N.R.; project administration, P.T., D.P., Ó.C. and N.R. All authors have read and agreed to the published version of the manuscript.

Funding

This research received no external funding.

Institutional Review Board Statement

Not applicable.

Informed Consent Statement

Not applicable.

Data Availability Statement

The data are available in ref. [37].

Acknowledgments

The authors sincerely appreciate the support provided by the editor and reviewers in enhancing the quality of the article.

Conflicts of Interest

The authors declare no conflicts of interest.

References

  1. Bost, M.; Houdart, S.; Oberli, M.; Kalonji, E.; Huneau, J.F.; Margaritis, I. Dietary copper and human health: Current evidence and unresolved issues. J. Trace Elem. Med. Biol. 2016, 35, 107–115. [Google Scholar] [CrossRef]
  2. USEPA. METHOD 6020B-Inductively Coupled Plasma Mass Spectrometry; United States Environmental Protection Agency: Washington, DC, USA, 2014. [Google Scholar]
  3. Riquelme, C. Análisis Estadístico de Doncentraciones y Distribuciones de Metales Pesados para el Municipio de Sentmenat, España. Ph.D. Dissertation, Universidad Católica de la Santísima Concepción, Concepción, Chile, 2015. [Google Scholar]
  4. Tume, P.; King, R.; González, E.; Bustamante, G.; Reverter, F.; Roca, N.; Bech, J. Trace element concentrations in schoolyard soils from the port city of Talcahuano, Chile. J. Geochem. Explor. 2014, 147, 229–236. [Google Scholar] [CrossRef]
  5. Reimann, C.; Garrett, R. Geochemical background—Concept and reality. Sci. Total Environ. 2005, 350, 12–27. [Google Scholar] [CrossRef]
  6. Ander, E.L.; Johnson, C.C.; Cave, M.R.; Palumbo-Roe, B.; Nathanail, C.P.; Lark, R.M. Method-ology for the determination of normal background concentrations of contaminants in English soil. Sci. Total Environ. 2013, 454, 604–618. [Google Scholar] [CrossRef]
  7. Kowalska, J.B.; Mazurek, R.; Gąsiorek, M.; Zaleski, T. Pollution indices as useful tools for the comprehensive evaluation of the degree of soil contamination–A review. Environ. Geochem. Health 2018, 40, 2395–2420. [Google Scholar] [CrossRef] [PubMed]
  8. Loska, K.; Cebula, J.; Pelczar, J.; Wiechula y Kwapilinski, D. Use of Enrichment and Contamination Factors Together with Geoaccumulation Indexes to Evaluate the Content of Cd, Cu, and Ni in the Rynik Water Reservoir in Poland. Water Air Pollut. 1997, 93, 347–365. [Google Scholar] [CrossRef]
  9. Moreira, A.C.; Boaventura, R.Y.R.G. Referencia geoquímica regional, para la interpretación de las concentraciones de elementos químicos nos sedimentos da Bacia do lago Paranoá-DF. Química Nova 2003, 6, 812–820. [Google Scholar] [CrossRef]
  10. Hakanson, L. An ecological risk index for aquatic pollution control: A sedimentological approach. Water Res. 1980, 14, 975–1001. [Google Scholar] [CrossRef]
  11. Diami, S.M.; Kusin, F.M.; Madzin, Z. Potential ecological and human health risks of heavy metals in surface soils associated with iron ore mining in Pahang, Malaysia. Environ. Sci. Pollut. Res. 2016, 23, 21086–21097. [Google Scholar] [CrossRef]
  12. Antoniadis, V.; Shaheen, S.M.; Levizou, E.; Shahid, M.; Niazi, N.K.; Vithanage, M.; Ok, Y.S.; Bolan, N.; Rinklebe, J. A critical prospective analysis of the potential toxicity of trace element regulation limits in soils worldwide: Are they protective concerning health risk assessment?-A review. Environ. Int. 2019, 127, 819–847. [Google Scholar] [CrossRef]
  13. Ministry of Environment, CORFO, Fundación Chile. 2012. Available online: https://mma.gob.cl/estructura-organizacional/ (accessed on 1 May 2023).
  14. USEPA. Supplemental Guidance for Developing Soil Screening Levels for Superfund Sites; United States Environment Protection Agency: Washington, DC, USA, 2002. [Google Scholar]
  15. USEPA. Regional Screening Levels (RSLs): Generic Tables; USEPA: Washington, DC, USA, 2020. [Google Scholar]
  16. Scheinberg, I.H. Human Health Effects of Copper. In Copper in the Environment: Part II: Health Effects; Nriagu, J.O., Ed.; John Wiley & Sons: New York, NY, USA, 1979; pp. 17–31. [Google Scholar]
  17. Turnlund, J.R.; Keyes, W.R.; Kim, S.K.; Domek, J.M. Long-term high copper intake: Effects on copper absorption retention homeostasis in men. Am. J. Clin. Nutr. 2005, 81, 822–828. [Google Scholar] [CrossRef] [PubMed]
  18. USEPA. Renewable Fuel Standard Program (RFS2) Regulatory Impact Analysis; US Environmental Protection Agency: Washington, DC, USA, 2010. [Google Scholar]
  19. Pan, Y.; Peng, H.; Xie, S.; Zeng, M.; Huang, C. Eight elements in soils from a typical light industrial city, China: Spatial distribution, ecological assessment, and the source apportionment. Int. J. Environ. Res. Public Health 2019, 16, 2591. [Google Scholar] [CrossRef] [PubMed]
  20. Lim, H.; Lee, J.; Chon, H.; Sager, M. Heavy metal contamination and health risk assessment in the vicinity of the abandoned Songcheon Au-Ag mine in Korea. J. Geochem. Explor. 2008, 96, 223–230. [Google Scholar] [CrossRef]
  21. USEPA (United States Environment Protection Agency). Exposure Factors Handbook 2011 Edition (Final); EPA/600/R-09/052F; US Environmental Protection Agency: Washington, DC, USA, 2011. [Google Scholar]
  22. Kan, S.; Cao, Q.; Zheng, Y.; Huang, Y.; Zhu, Y. Health risks of heavy metals in contaminated soils and food crops irrigated with wastewater in Beijing, China. Environ. Pollut. 2008, 152, 686–692. [Google Scholar] [CrossRef] [PubMed]
  23. Manta, D.S.; Angelone, M.; Bellanca, A.; Neri, R.; Sprovieri, M. Heavy metals in urban soils: A case study from the city of Palermo (Sicily), Italy. Sci. Total Environ. 2002, 300, 229–243. [Google Scholar] [CrossRef]
  24. Schoffer, J.T.; Sauvé, S.; Neaman, A.; Ginocchio, R. Role of leaf litter on the incorporation of copper-containing pesticides into soils under fruit production: A review. J. Soil Sci. Plant Nutr. 2020, 20, 990–1000. [Google Scholar] [CrossRef]
  25. AFIPA. Manual Fitosanitario; Asociación Nacional de Fabricantes e Importadores de Productos Fi-tosanitarios Agrícolas (AFIPA): Santiago, Chile, 2002–2003. [Google Scholar]
  26. Tume, P.; Gonza’lez, E.; Reyes, F.; Fuentes, J.P.; Roca, N.; Bech, J.; Medina, G. Sources analysis and health risk assessment of trace elements in urban soils of Hualpen, Chile. CATENA 2019, 175, 304–316. [Google Scholar] [CrossRef]
  27. Ministry of Environment, CORFO, Fundación Chile. 2024. Available online: https://www.gob.cl/ministerios/ministerio-del-medio-ambiente/ (accessed on 1 May 2023).
  28. Li, Z.; Ma, Z.; van der Kuijp, T.J.; Yuan, Z.; Huang, L. A review of soil heavy metal pollution from mines in China: Pollution and health risk assessment. Sci. Total Environ. 2014, 468, 843–853. [Google Scholar] [CrossRef]
  29. Kabata-Pendias, A. Trace Elements in Soils and Plants, 4th ed.; CRC Press; Taylor & Fran-cis Group: Boca Raton, FL, USA, 2010; p. 548. [Google Scholar]
  30. Shayler, H.; McBride, M.; Harrison, E. Guide to Soil Testing and Interpreting Results; Cornell Waste Management Institute: Ithaca, NY, USA, 2009; pp. 1–6. [Google Scholar]
  31. Mielke, H.W. Nature and extent of metal-contaminated soils in urban environments (keynote talk). Environ. Geochem. Health 2016, 38, 987–999. [Google Scholar] [CrossRef]
  32. Isaaks, E.H.; Mohan Srivastava, R. Applied Geostatistics; Oxford University Press: Oxford, UK, 1989; 561p. [Google Scholar]
  33. Londoño-Franco, L.F.; Londoño-Muñoz, P.T.; Muñoz-García, F.G. Los riesgos de los me-tales pesados en la salud humana y animal. Biotecnol. Sect. Agropecu. Agroind. 2016, 14, 145–153. [Google Scholar] [CrossRef]
  34. Smedley, P.L.; Kinniburgh, D.G. Source and behavior of arsenic in natural waters. In United Nations Synthesis Report on Arsenic in Drinking Water; World Health Organization: Geneva, Switzerland, 2001; pp. 1–61. [Google Scholar]
  35. Santibañez, F. Atlas Agroclimático de Chile: Estado Actual y Tendencias del Clima; Centro Agrimed: Santiago, Chile, 2017. [Google Scholar]
  36. Anaya Raymundo, M.A.; Rangel Morales, F.M.; Iannacone Óliver, J.A.; Romero Echevarría, L.M. Metales pesados en hortalizas y suelos agrícolas irrigados con aguas superficiales: Una revi-sión sistemática. Idesia 2022, 40, 33–41. [Google Scholar] [CrossRef]
  37. Neaman, A.; Valenzuela, P.; Tapia-Gatica, J.; Selles, I.; Novoselov, A.A.; Dovletyarova, E.A.; Yañez, C.; Krutyakov, Y.A.; Stuckey, J.W. Chilean regulations on metal-polluted soils: The to advance from adapting foreign laws towards developing sovereign legislation. Environ. Res. 2020, 185, 109429. [Google Scholar] [CrossRef] [PubMed]
Figure 1. The Aconcagua River and Casablanca River basins in the Valparaíso Region.
Applsci 15 02581 g001
Figure 2. Spatial distribution of heavy metals As, Cu, Pb, and Zn (mg/kg) for soils of the Aconcagua and Casablanca River basins.
Applsci 15 02581 g002
Figure 3. Biplots for two main components of the Aconcagua (a) and Casablanca (b) Rivers, respectively.
Applsci 15 02581 g003
Figure 4. Cluster analysis plot for heavy metals As, Cu, Pb, and Zn (mg/kg) for the soils of the studied areas: (left) Aconcagua River basin and (right) Casablanca River basin.
Applsci 15 02581 g004
Figure 5. Environmental indexes for soil in the Aconcagua River basin without mining activity (a), in random sectors including mining activity (b), and the Casablanca River basin (c). The red lines are the classification for each environmental index. * Difference is significant at the 0.05 level. ** Difference is significant at the 0.01 level. *** Difference is significant at the 0.001 level.
Applsci 15 02581 g005aApplsci 15 02581 g005b
Figure 6. Healthy risk in the Aconcagua River basin without mining activity: (a) non-carcinogenic risk in adults, (b) non-carcinogenic risk to children, (c) carcinogenic risk in adults, and (d) carcinogenic risk in children. The red dotted lines show the risk values.
Applsci 15 02581 g006
Figure 7. (a) Non-cancer risk in adults in the Aconcagua River basin, including mining activity. (b) Carcinogenic risk in children in the Aconcagua River basin, including mining activity. (c) Carcinogenic risk in adults in the Aconcagua River basin, including mining activity. (d) Carcinogenic risk in children in the Aconcagua River basin, including mining activity. The red dotted lines show the risk values. * Difference is significant at the 0.05 level.
Applsci 15 02581 g007
Figure 8. (a) Non-cancer risk in adults in the Casablanca River basin. (b) Non-cancer risk in children in the Casablanca River basin. (c) Adult carcinogenic risk in the Casablanca River basin. (d) Carcinogenic risk in children in the Casablanca River basin. The red dotted lines show the risk values. * Difference is significant at the 0.05 level. **** Difference is significant at the 0.0001 level.
Applsci 15 02581 g008aApplsci 15 02581 g008b
Table 1. Statistical summary of potentially toxic elements for soil samples from the Aconcagua River basin with and without mining activity and the Casablanca River basin.
Aconcagua River Basin
(Including Mining Activities)
Aconcagua River Basin
(Without Mining Activities)
Casablanca River Basin
(Only Agricultural Activities)
AsCuPbZnAsCuPbZnAsCuPbZn
Mean14.3382.140.9170.310.685.826.7139.52.533.118.766.7
SD a8.6868.827.376.74.632.65.973.73.613.35.920.5
CV (%) b337.521363.445.1457.1948.897.255.1146.840.131.730.8
Min.128144665318780101030
Max.4455813095792416036395146641139
Percentile258903212076220950.4241556
5013128361619.56928.51131311769
75213164321612.811931159.32422080
Skewness0.774.77.81.61.60.95−0.162.42.10.442.020.97
a Standard deviation, and b coefficient of variation.
Table 2. Comparison of statistical methods for the geochemical threshold value for soil samples from the Aconcagua River basin with and without mining activities and the Casablanca River basin.
Geochemical BaselineAconcagua River Basin
(Including Mining Activity)
Aconcagua River Basin
(Without Mining Activity)
Casablanca River Basin
(Only Agricultural Activities)
AsCuPbZnAsCuPbZnAsCuPbZn
9026.254555253.218.4133.533230.61051.82884.4
9529.61610.669.629023.8158.735.9386.912.461.233.8105.4
MAD c6.29271.16.8148.714.59437.1941311769
Upper Whisker a40.565559.536021.4204.547.5255.64.46927.5116
a Upper whisker or upper limit, c Median absolute deviation
Table 3. Spearman correlation coefficients for soil samples from the Aconcagua River basin without mining activity and the Casablanca River basin.
Aconcagua River Basin
(Including Mining Activity)
Aconcagua River Basin
(Without Mining Activity)
Casablanca River Basin
(Only Agricultural Activities)
ElementsAsCuPbZnAsCuPbZnAsCuPbZn
As1−0.225 *0.163−0.1211−0.1860.593 **0.01210.038−0.1690.333
Cu 10.222 *0.368 ** 1−0.2590.662 ** 10.383 *0.511 **
Pb 10.358 ** 1−0.045 10.472 **
Zn 1 1 1
** Correlation is significant at the 0.01 level (bilateral). * Correlation is significant at the 0.05 level (bilateral).
Table 4. (a) Principal components for the Casablanca River basin. (b) Principal components for the Aconcagua River basin.
(a)
Elements Main Components
PC1 PC2
As 0.12 0.85
Cu 0.57 −0.06
Pb 0.47 −0.48
Zn 0.66 0.23
Variance (%) 42.7 29.7
Cumulative Variance (%) 42.7 72.4
(b)
Elements Main Components
PC1 PC2
As 0.026 0.740
Cu −0.263 −0.642
Pb 0.677 −0.113
Zn 0.687 −0.162
Variance (%) 41.6 30.9
Cumulative Variance (%) 41.5 72.5
Table 5. Percentage contribution of heavy metals to each factor in the Aconcagua River basin and Casablanca River basin.
Aconcagua River BasinCasablanca River Basin
Mining ActivitiesVegetable CropsFruit Crops
Factor 1Factor 2Factor 3Factor 1Factor 2Factor 3Factor 1Factor 2Factor 3
As90.5%8.4%1.1%8.1%79.3%12.6%81.9%18.1%0%
Cu0%0%100%86.2%13.8%0.0%17.9%0%82.1%
Pb37.2%59.0%3.7%68.6%0%31.4%0%64.1%35.9%
Zn24.0%73.5%2.5%68.7%7.3%24.0%13.4%42.1%44.5%
Table 6. Summary of the metals contributing to each factor at each location.
Factor 1Factor 2Factor 3
Location/Basin ArsenicLead and ZincCopper
Vegetables from CasablancaCooper, Lead, and ZincArsenicAll (residually)
Fruits from CasablancaArsenicLeadCopper and Zinc
Disclaimer/Publisher’s Note: The statements, opinions and data contained in all publications are solely those of the individual author(s) and contributor(s) and not of MDPI and/or the editor(s). MDPI and/or the editor(s) disclaim responsibility for any injury to people or property resulting from any ideas, methods, instructions or products referred to in the content.

