
Geochemical Survey in Mojiang Area of Yunnan Province, China: Geochemical Map and Geochemical Anomaly Map


Abstract
1. Introduction
2. Materials and Methods
2.1. Geological Settings
2.2. Analytical Method
3. The Fixed-Value Method on Ni Geochemical Map
4. Results and Discussion
4.1. Geochemical Map on the 19-Level Fixed-Value Method
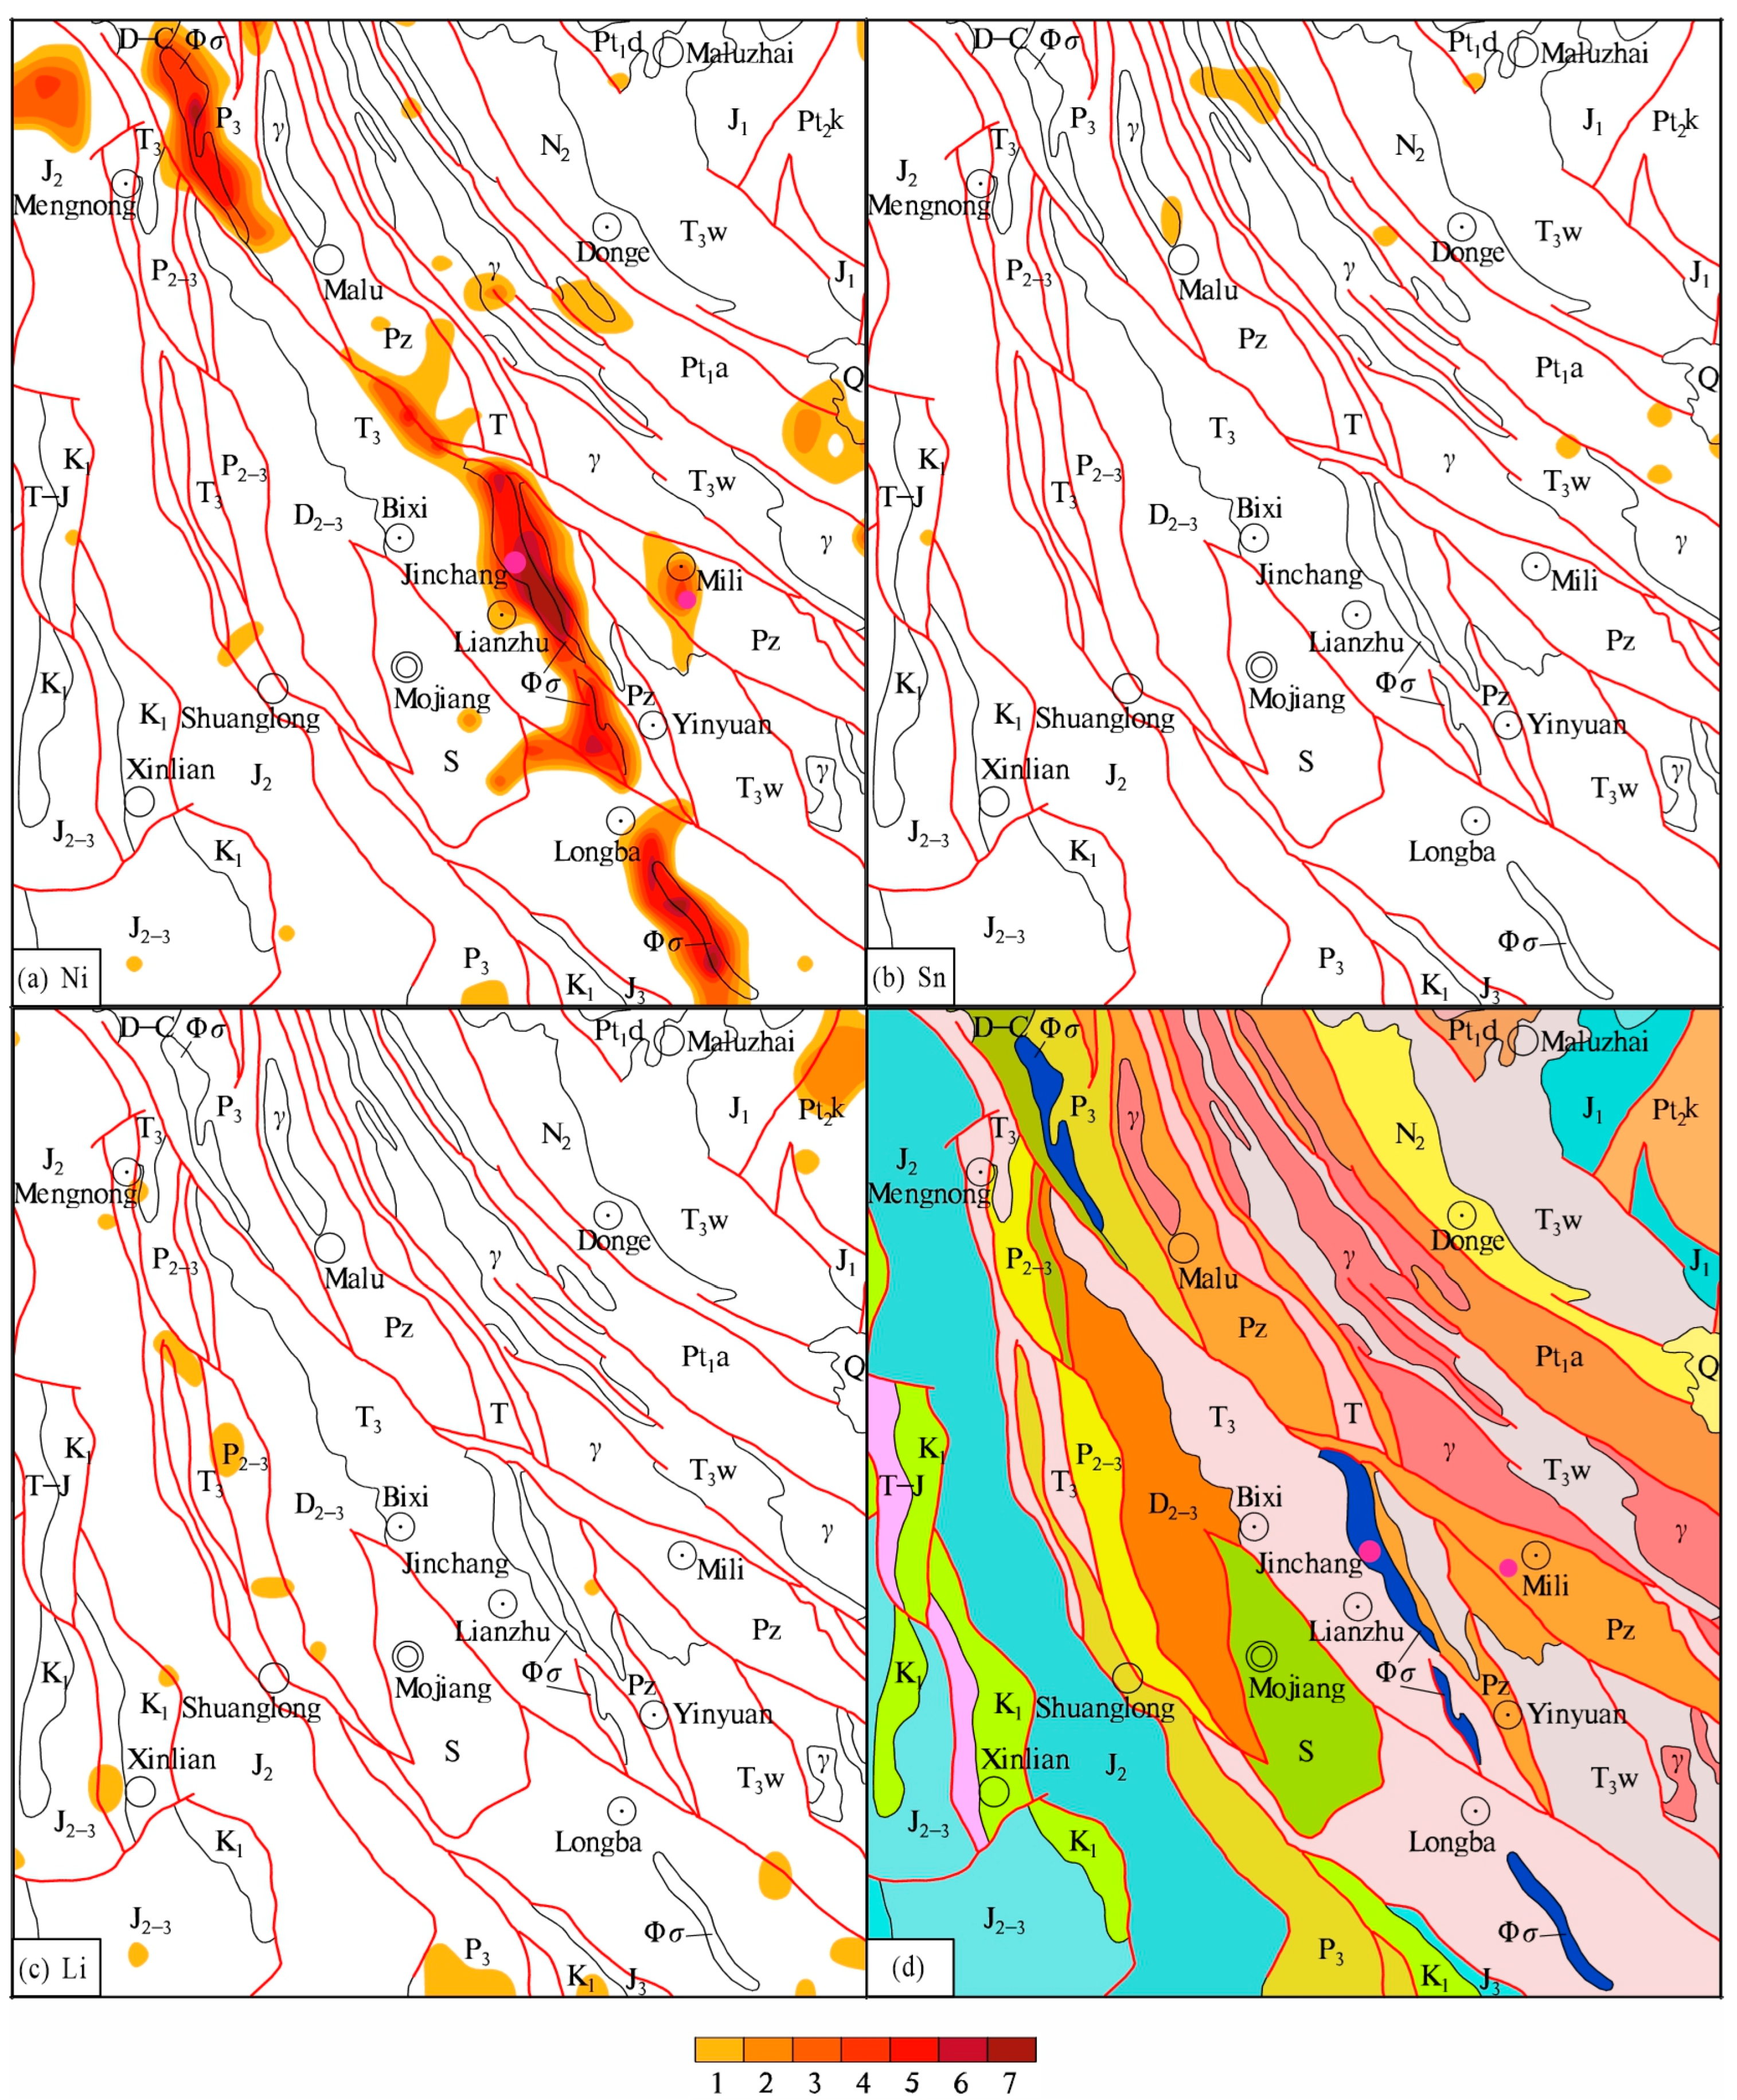
4.2. Geochemical Anomaly Map on Seven Levels Classification Method
5. Conclusions
- (1)
- The 18 fixed values are proposed on the 19-level fixed-value method to classify the Ni concentrations for geochemical mapping.
- (2)
- The geochemical maps on the 19-level fixed-value method and the geochemical anomaly maps on the seven levels classification method can be compared among different elements, which are illustrated on the Ni, Sn, and Li in the Mojiang area.
- (3)
- Three regions of Ni resource potential are predicted on the geochemical map and geochemical anomaly map in the Mojiang area.
Author Contributions
Funding
Institutional Review Board Statement
Informed Consent Statement
Data Availability Statement
Acknowledgments
Conflicts of Interest
References
- Xie, X.; Cheng, H. Sixty years of exploration geochemistry in China. J. Geochem. Explor. 2014, 139, 4–8. [Google Scholar] [CrossRef]
- Xie, X.; Mu, X.; Ren, T. Geochemical mapping in China. J. Geochem. Explor. 1997, 60, 99–113. [Google Scholar]
- Hosseini-Dinani, H.; Mokhtari, A.R.; Shahrestani, S.; Vivo, B.D. Sampling Density in Regional Exploration and Environmental Geochemical Studies: A Review. Nat. Resour. Res. 2019, 28, 967–994. [Google Scholar] [CrossRef]
- Chen, S.; Gong, Q.; Li, P.; Xu, S.; Liu, N. Describing geochemical backgrounds of lithium in rock-soil-sediment systems. Appl. Geochem. 2024, 162, 105908. [Google Scholar] [CrossRef]
- Cheng, Z.; Xie, X.; Yao, W.; Feng, J.; Zhang, Q.; Fang, J. Multi-element geochemical mapping in Southern China. J. Geochem. Explor. 2014, 139, 183–192. [Google Scholar] [CrossRef]
- Li, M.; Xi, X.; Xiao, G.; Cheng, H.; Yang, Z.; Zhou, G.; Ye, J.; Li, Z. National multi-purpose regional geochemical survey in China. J. Geochem. Explor. 2014, 139, 21–30. [Google Scholar] [CrossRef]
- Xiang, Y.; Mu, X.; Ren, T.; Liu, R.; Wu, X. China regional geochemical exploration database. Geol. China 2018, 45, 41–57. [Google Scholar]
- Xie, X. Geochemical Mapping-Evolution of Its Aims, Ideas and Technology. Acta Geol. Sin. 2008, 82, 927–937. [Google Scholar]
- Yousefi, M.; Carranza, E.J. Prediction–area (P–A) plot and C–A fractal analysis to classify and evaluate evidential maps for mineral prospectively modeling. Comput. Geosci. 2015, 79, 69–81. [Google Scholar] [CrossRef]
- Zuo, R.; Xiong, Y.; Wang, J.; Carranza, E.J. Deep learning and its application in geochemical mapping. Earth Sci. Rev. 2019, 192, 1–14. [Google Scholar] [CrossRef]
- Xu, S.; Li, J.; Zhang, X.; Huang, Z.; Huang, Y.; Long, Y.; Xu, Y.; Song, X.; Chen, Z.; Li, Y.; et al. Tin (Sn) geochemical mapping based on fixed-value method: A case illustration in Gejiu area, Southwest China. Appl. Sci. 2024, 14, 1765. [Google Scholar] [CrossRef]
- Li, P.; Gong, Q.; Chen, S.; Li, P.; Li, J.; Wu, X.; Li, X.; Wang, X.; Liu, N. Regional Geochemical Characteristics of Lithium in the Mufushan Area, South China. Appl. Sci. 2024, 14, 1978. [Google Scholar] [CrossRef]
- An, Y.; Yan, T.; Gong, Q.; Wang, X.; Huang, Y.; Zhang, B.; Yin, Z.; Zhao, X.; Liu, N. Chromium (Cr) geochemical mapping based on fixed-values’ method: Case studies in China. Appl. Geochem. 2022, 136, 105168. [Google Scholar] [CrossRef]
- Jia, G.; Gu, W.; Gong, Q.; Xu, S.; Liu, Y.; Lv, Z. A 19-level fixed-value method to classify the Mo concentrations in Jianshui area of Yunnan province, China. Appl. Geochem. 2025, 180, 106289. [Google Scholar] [CrossRef]
- Ouchchen, M.; Boutaleb, S.; Abia, E.H.; El Azzab, D.; Miftah, A.; Dadi, B.; Echogdali, F.Z.; Mamouch, Y.; Pradhan, B.; Santosh, M.; et al. Exploration targeting of copper deposits using staged factor analysis, geochemical mineralization prospectivity index, and fractal model (Western Anti-Atlas, Morocco). Ore Geol. Rev. 2022, 143, 104762. [Google Scholar] [CrossRef]
- Gong, Q.; Li, J.; Xiang, Y.; Liu, R.; Wu, X.; Yan, T.; Chen, J.; Li, R.; Tong, Y. Determination and classification of geochemical anomalies based on backgrounds and cutoff grades of trace elements: A case study in South Nanling Range, China. J. Geochem. Explor. 2018, 194, 44–51. [Google Scholar] [CrossRef]
- Zuo, R.; Wang, J.; Xiong, Y.; Wang, Z. The processing methods of geochemical exploration data: Past, present, and future. Appl. Geochem. 2021, 132, 105072. [Google Scholar] [CrossRef]
- Xiong, Y.; Yang, L.; Shao, Y.; Zhao, K.; Li, P.; Lu, Y.; Du, D. Discussion on the occurrence status and mineralization process of gold and nickel in the Mojiang Jinchang gold nickel deposit in southwestern Yunnan. Acta Petrogr. 2015, 31, 3309–3330. [Google Scholar]
- Ying, H.; Wang, D.; Liu, H. Geological characteristics and formation time of nickel mineralization in the Jinchang nickel gold deposit in Mojiang, Yunnan. Depos. Geol. 2005, 24, 44–51. [Google Scholar]
- Qiao, F.; Zhu, J.; Tian, Y.; Liu, Y. Global distribution of nickel resources and nickel deposits in Yunnan. Yunnan Geol. 2005, 24, 395–401. [Google Scholar]
- Yang, L.; Deng, J.; Zhao, K.; Liu, J. Discussion on the metallogenic sequence and dynamic background of gold deposits in the Ailaoshan orogenic belt. Acta Petrogr. 2011, 27, 2519–2532. [Google Scholar]
- Xu, Z.; Chen, Y.; Wang, D. Classification Scheme of Mineral Regions in China; Geological Publishing House: Beijing, China, 2008. [Google Scholar]
- Zhou, K.; Zhang, H.; Chai, P.; Zhang, H.; Cheng, X.; Yang, S. Discussion on the occurrence status and genesis relationship of gold and nickel in the Mojiang Jinchang deposit in Yunnan Province. Geol. Miner. Depos. 2020, 39, 97–110. [Google Scholar]
- Liu, J.; Tang, Y.; Song, Z.; Tran My, D.; Zhai, Y.; Wu, W.; Chen, W. Ailaoshan tectonic belt in western Yunnan: Structure and evolution. J. Jilin Univ. Geosci. Ed. 2011, 41, 1285–1303. [Google Scholar]
- Wang, X.; Deng, J.; Wang, Q.; Yang, L.; Li, H.; Yu, H.; Wang, P.; Song, Y. Contrast between Metamorphic and Ore-Forming Fluids in the Ailaoshan Belt, Southeastern Tibet: New Constraints on Ore-Fluids Source for its Oregenic Gold Deposit. Ore Geol. Rev. 2021, 131, 103933. [Google Scholar] [CrossRef]
- Jiang, Y. Mineral genesis and material sources of Jinchang gold deposit in Mojiang, Yunnan Province. Miner. Resour. Geol. 2013, 27, 177–184. [Google Scholar]
- Li, H.; Wang, Q.; Groves, D.; Dong, C.; Weng, W.; Ma, W.; Yang, L.; Zhu, Z.; Deng, J. The Jinchang deposit, Ailaoshan belt: Overprint of Miocene orogenic gold mineralization on Triassic hydrothermal nickel sulfide mineralization. Miner. Depos. 2025, 60, 145–163. [Google Scholar] [CrossRef]
- Hou, Q.; Yang, Z.; Yu, T.; Xia, X.; Cheng, H.; Zhou, G. Soil Geochemical Parameters in China; Geological Publishing House: Beijing, China, 2020. [Google Scholar]
- Li, Q.; Su, B.; Li, S. Trace elements cobalt and nickel and human health. Guangdong J. Trace Elem. Sci. 2008, 15, 66–70. [Google Scholar]
- Zhang, X.; Zhang, F.; Li, C. Essential Trace Nutrients for Plant Growth—Nickel. Soil 1996, 28, 176–179. [Google Scholar]
- GB15618-2018; Soil Environmental Quality and Agricultural Land Soil Pollution Risk Control Standards (Trial). China Environment Press: Beijing, China, 2018.
- DZ/T 0214-2002; Geological Exploration Specification for Copper, Lead, Zinc, Silver, Nickel, and Molybdenum Mines. Ministry of Land and Resources: Beijing, China, 2002.
- DZ/T 0200-2020; Mineral Geological Exploration Specification Iron, Manganese, Chromium. Ministry of Land and Resources: Beijing, China, 2020.


| Level No. | 1 | 2 | 3 | 4 | 5 | 6 | 7 | 8 | 9 | 10 | 11 | 12 | 13 | 14 | 15 | 16 | 17 | 18 | 19 | References |
|---|---|---|---|---|---|---|---|---|---|---|---|---|---|---|---|---|---|---|---|---|
| Ni | 2 | 6 | 10 | 18 | 25 | 32 | 39 | 48 | 60 | 70 | 100 | 190 | 245 | 495 | 1000 | 1260 | 1590 | 2000 | ≥2000 | This study |
| lgNi | 0.301 | 0.778 | 1.000 | 1.255 | 1.389 | 1.505 | 1.591 | 1.681 | 1.778 | 1.845 | 2.000 | 2.279 | 2.389 | 2.695 | 3.000 | 3.100 | 3.201 | 3.301 | - | |
| ΔlgNi | - | 0.477 | 0.222 | 0.255 | 0.143 | 0.107 | 0.086 | 0.090 | 0.097 | 0.067 | 0.155 | 0.279 | 0.110 | 0.305 | 0.305 | 0.100 | 0.101 | 0.100 | - | |
| Sn | 1 | 1.3 | 1.8 | 2.7 | 3.4 | 4.3 | 6.0 | 7.9 | 10 | 13 | 17 | 28 | 50 | 100 | 200 | 400 | 600 | 1000 | ≥1000 | [11] |
| Li | 5 | 8 | 17 | 29 | 34 | 40 | 50 | 62 | 70 | 78 | 88 | 99 | 132 | 175 | 232 | 460 | 930 | 1858 | ≥1858 | [12] |
| Mo | 0.3 | 0.37 | 0.45 | 0.55 | 0.68 | 1 | 1.43 | 2.07 | 3 | 3.8 | 4.8 | 6.1 | 9.1 | 20 | 100 | 144 | 208 | 300 | ≥300 | [14] |
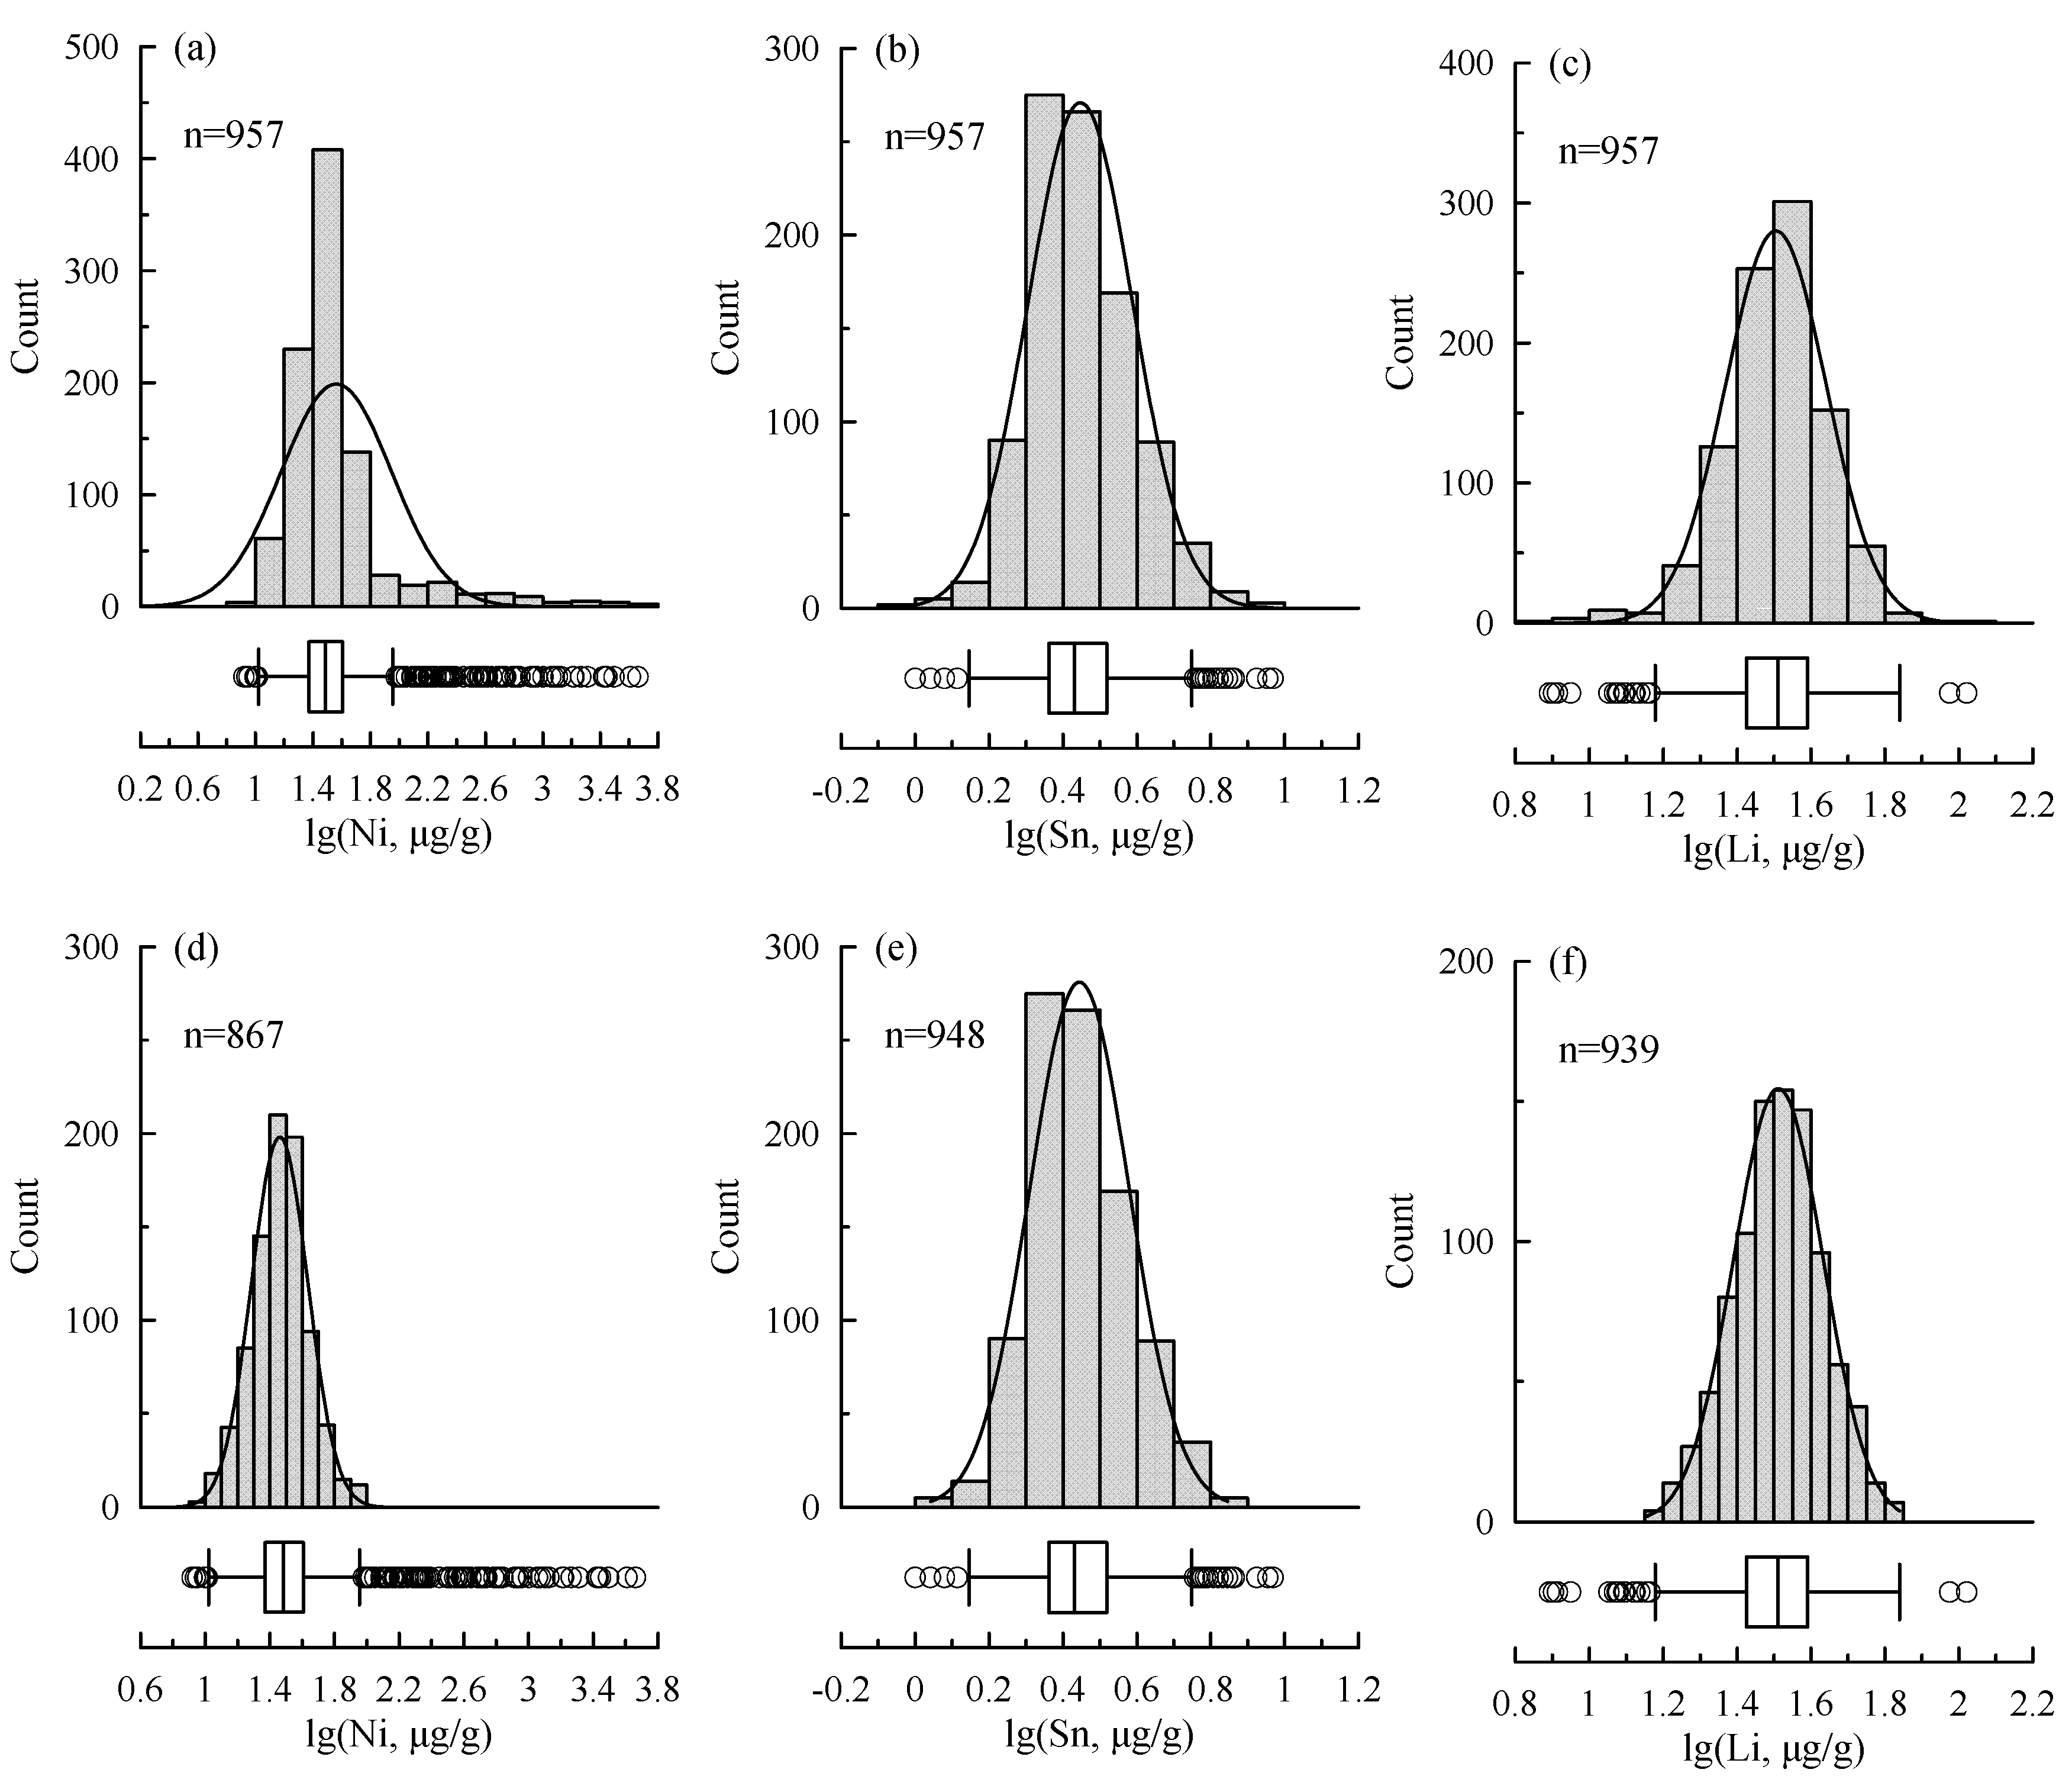
| Statistical Parameters | Data Count | Minimum | Q1: Lower Quartile | Q2: Median Quartile | Q3: Upper Quartile | Maximum | Mean | Standard Deviation |
|---|---|---|---|---|---|---|---|---|
| Ni (a) | 957 | 8.3 | 23.5 | 30.5 | 40.4 | 4580 | 36.6 | 2.4 |
| lgNi (a) | 957 | 0.919 | 1.371 | 1.484 | 1.606 | 3.661 | 1.563 | 0.380 |
| lgNi (b) | 867 | 0.940 | 1.358 | 1.462 | 1.568 | 2.939 | 1.461 | 0.175 |
| Ni (b) | 867 | 8.7 | 22.8 | 29.0 | 37 | 868 | 28.9 | 1.5 |
| Sn (a) | 957 | 1.0 | 2.3 | 2.7 | 3.3 | 9.3 | 2.8 | 1.4 |
| lgSn (a) | 957 | 0.000 | 0.362 | 0.431 | 0.519 | 0.968 | 0.447 | 0.146 |
| lgSn (b) | 948 | 0.041 | 0.362 | 0.431 | 0.519 | 0.845 | 0.445 | 0.135 |
| Sn (b) | 948 | 1.1 | 2.3 | 2.7 | 3.3 | 7.0 | 2.8 | 1.36 |
| Li (a) | 957 | 7.8 | 26.6 | 32.4 | 39 | 105 | 32.0 | 1.4 |
| lgLi (a) | 957 | 0.892 | 1.425 | 1.511 | 1.591 | 2.021 | 1.505 | 0.146 |
| lgLi (b) | 939 | 1.155 | 1.433 | 1.513 | 1.591 | 1.840 | 1.512 | 0.121 |
| Li (b) | 939 | 14.3 | 27.1 | 32.6 | 39 | 69.2 | 32.5 | 1.32 |
| SiO2 (a) | 957 | 37.4 | 63.2 | 68.6 | 73.4 | 87.0 | 68.1 | 7.7 |
| Al2O3 (a) | 957 | 3.6 | 11.6 | 13.3 | 15.0 | 23.5 | 13.2 | 2.7 |
| TFe2O3 (a) | 957 | 1.7 | 4.0 | 4.7 | 5.6 | 17.8 | 5.0 | 1.8 |
| K2O (a) | 957 | 0.3 | 1.8 | 2.4 | 2.8 | 4.9 | 2.3 | 0.7 |
| Na2O (a) | 835 | 0.1 | 0.1 | 0.4 | 0.7 | 4.3 | 0.6 | 0.6 |
| CaO (a) | 922 | 0.1 | 0.2 | 0.6 | 1.3 | 14.8 | 1.0 | 1.3 |
| MgO (a) | 957 | 0.3 | 0.7 | 1.0 | 1.4 | 20.5 | 1.4 | 1.8 |
| Ti (a) | 957 | 1347 | 3520 | 4115 | 4773 | 16789 | 4333 | 1285 |
| P (a) | 957 | 145 | 344 | 420 | 525 | 1647 | 462 | 178 |
| Mn (a) | 957 | 245 | 580 | 682 | 822 | 2357 | 725 | 240 |
Disclaimer/Publisher’s Note: The statements, opinions and data contained in all publications are solely those of the individual author(s) and contributor(s) and not of MDPI and/or the editor(s). MDPI and/or the editor(s) disclaim responsibility for any injury to people or property resulting from any ideas, methods, instructions or products referred to in the content. |
© 2025 by the authors. Licensee MDPI, Basel, Switzerland. This article is an open access article distributed under the terms and conditions of the Creative Commons Attribution (CC BY) license (https://creativecommons.org/licenses/by/4.0/).
Share and Cite
Zhu, X.; Li, P.; Gong, Q.; Gu, W.; Xu, S.; Yan, T. Geochemical Survey in Mojiang Area of Yunnan Province, China: Geochemical Map and Geochemical Anomaly Map. Appl. Sci. 2025, 15, 2592. https://doi.org/10.3390/app15052592
Zhu X, Li P, Gong Q, Gu W, Xu S, Yan T. Geochemical Survey in Mojiang Area of Yunnan Province, China: Geochemical Map and Geochemical Anomaly Map. Applied Sciences. 2025; 15(5):2592. https://doi.org/10.3390/app15052592
Chicago/Turabian StyleZhu, Xianfu, Peiyu Li, Qingjie Gong, Weixuan Gu, Shengchao Xu, and Taotao Yan. 2025. "Geochemical Survey in Mojiang Area of Yunnan Province, China: Geochemical Map and Geochemical Anomaly Map" Applied Sciences 15, no. 5: 2592. https://doi.org/10.3390/app15052592
APA StyleZhu, X., Li, P., Gong, Q., Gu, W., Xu, S., & Yan, T. (2025). Geochemical Survey in Mojiang Area of Yunnan Province, China: Geochemical Map and Geochemical Anomaly Map. Applied Sciences, 15(5), 2592. https://doi.org/10.3390/app15052592