Abstract
Artificial intelligence has increasingly taken over various aspects of daily life, resulting in the proliferation of smart devices and the development of smart living and working environments. One significant domain within this technological advancement is human activity recognition, which includes a broad spectrum of applications such as patient monitoring and supervision of children’s activities. In this research, we endeavor to design a human activity recognition system that effectively analyzes multi-user data through a machine learning framework centered on graphical plot images. The proposed methodology uses a PIR sensor-based system. This system uses a two-stage process; the first one involves generating new image datasets as density map images and graphical representations based on the Kyoto CASAS multi-user dataset. In the second stage, the generated data are provided to a sequential convolutional neural network, which predicts the 16 activities developed by two users. To generate the new datasets, we only used data from ambient sensors, which were organized in windows. We tested many types of window dimensions and extra features such as temporal aspect and the limitation of two activities in one window. The neural network was optimized by increasing the deconvolutional layers and adding the AdamW optimizer. The results demonstrate the viability of this method, evidencing an accuracy rate of 83% for multi-user activity and an accuracy rate of 99% for single-user activity. This study successfully achieved its objective of identifying an efficient activity recognition methodology and a data image representation. Furthermore, future enhancements are anticipated by integrating data sourced from PIR sensors, with information gathered from user-personal devices such as smartphones. This approach is also applicable to real-time recognition systems.
1. Introduction
Human activity recognition has found applications in many different fields such as homes and offices [1]. Due to the emergence of intelligent environments like homes and offices, human activity recognition has become increasingly necessary. This is motivated by the desire to transform the environment in which a person performs day-to-day activities to improve the quality of life. In [2], it was mentioned that these intelligent environments can help monitor disabled or elderly people who need permanent supervision. The system can be enabled to detect unusual activities that do not align with the monitored patient’s routine.
Human activity recognition, or HAR, can be divided into two large categories based on the types of sensors involved:
- Ambiental sensors;
- Wearable sensors.
Human activity can be described as a sequence of intended actions since we define human activities as actions that are intentional and not just a reaction to environmental impulse [3,4,5]. Also, when we consider multi-user activities, we look at activities where we have more than one participant. Activities that are executed at the same time are defined as an activity group [6]. Activities that are performed independently at the same time, and there are no intersections between them, are considered multi-individual activities. If the activities intersect, they are considered hybrid activities, a mix between multi-individual activities and group activities. These hybrid activities can be further classified into three subcategories based on the interaction between activities:
- Simultaneous activities;
- Collaborative activities;
- Concurrent activities.
The simultaneous activities category requires each user to perform an activity that is not related to other activities and takes place at different locations in an environment such as a house. Collaborative activities specifically involve identical actions in the same location. The category of concurrent activities requires users to perform different actions in the same location. In the same activity, each individual has a potentially different behavior. Ambient sensors generate data that do not provide direct information about user identification. Wearable sensors present a disadvantage, especially for certain activities, even if they would be the best solution for identifying users. The compromise solution would be to extract each user’s behavior based on the ambient sensors’ data and then identify the users according to the behaviors [7]. The activity recognition and person localization/identification come with their own set of problems. Locating people requires a high-precision interpretation of the sensor data. Also, between locations without sensor coverage, an approximation of the user’s position must be used with as much accuracy as possible [8].
In the past, only RFID (radiofrequency identification) was used as a stable method for identifying users; today, several types of devices can be used. For example, devices can communicate via Bluetooth, Ultra-Wideband (UWB), and ZigBee, but the major disadvantage of these devices is that they have to be worn at all times [9]. Fixed ambient motion detection devices have their disadvantages; for example, infrared sensors are sensitive to heat sources or strong light, and surveillance cameras have reduced performance in some poor visibility conditions [10]. Most people own a smartphone and carry it for extended periods; this can be a motion detection solution. Although the activities, which can be recognized with the data obtained from these devices, are limited, they can play an important role in the identification of the user. The adopted solution must be a compromise, neither too uncomfortable for the user nor too complex for the environment, and it must also respect privacy rules [11]. The human activity recognition process involves activities carried out at home or in indoor spaces, as well as activities outside of residential spaces. Geospatial location data are also needed for outdoor activities, not just human action-specific data [12].
This research aims to develop an efficient way of recognizing human activity for daily tasks based on a continuous activities dataset. The main objectives are the following:
- Validating the proposed method by testing with plot images, which were generated on the basis of the Aruba CASAS dataset from our previous study, and comparing the results with our research described in [13].
- Generating new images based on the proposed method from our study [13] but using the Kyoto Multiresident ADL Activities dataset provided by the Center for Advanced Studies in Adaptive Systems (CASAS).
- Using a new data representation method and comparing the results with the previous method.
- Optimizing the activity recognition neural network and testing several parameters to increase the activity recognition accuracy.
- Recognizing daily activities through a method capable of interpreting continuous data flows and creating a method compatible with real-time systems.
The improved results of the neural network were validated using the study’s single-user dataset [13] to assess the recognition rate. The recognition rate obtained was 84.54%. Our method achieved a 99% result on the same dataset. In this way, we have the confirmation that the network structure is a performant one for recognizing images that contain information about the user’s activity. Having confirmed the operation of the method chosen in this study, we generated images for the multi-user dataset, using two methods of graphic data representation from the datasets made available by the CASAS project. The graphic method was chosen for the following reasons:
- Image recognition algorithms are very efficient.
- The graphic representation can take into account the spatial aspect of the activity by depicting it in the form of a map.
- New features can be introduced to improve the graphic representation, including the temporal spectrum and not the actual activity execution time.
A fixed-size data window was chosen for each image (graphical representation). These data are represented by two methods. The first is to represent data using density maps in which, for each sensor activation, the representation color will intensify. Regarding the location where the state of a sensor is represented in the image, it corresponds to the location on the map of the residential space. The second representation option is the graphical representation option of the data from a data window. Data representation involved plotting coordinates and connecting consecutive points to observe temporal changes in sensor activations by comparing shifted coordinates. These generated images were uploaded to a cloud location and then fed to a sequential convolutional neural network, using the Google Colab platform. Details related to the dataset, the window generation process in Section 3, and the structure of the neural network can be found in Section 4.
Given this way of representing data using fixed-size windows, the method can also be used in real-time recognition systems. For each window, a time-related dimension is used, and all sensor activations at that moment are taken into account. For the real-time method, these windows can retrieve the data (sensor activation status) directly from the active CASAS system. The problem of recognizing multi-user activities is very different from those of single users. A single-user activity is easier to represent both graphically and using a set of numerical data. When we talk about the recognition of multi-user activities, the problem of collaborative activities and the interleaving of data from sensors come into play. Another issue is represented by user identification in the context of multi-user activities. In this study, we analyze the recognition of activities at a given time, without trying to recognize the identity of the users involved.
2. Related Works
2.1. Sources of Data Acquisition
The evolution of technology has driven researchers to advance more and more in the field of HAR for both residential and medical environments [12]. In some applications, real-time recognition of human activity can be much more efficient and with satisfying results for the end user [14]. Data used to determine activities can be derived from multiple sources [15,16,17], such as wearable sensors or even smartphones [11]. These devices can be positioned in different locations on the user’s body, such as the pants pocket or the chest pocket of the shirt. The data used for activity recognition can also be collected from ambient sensors, even from a network of these ambient sensors that cover the entire residential space [18]. Another HAR idea is based on acoustic and sound signals [19]. A hybrid approach, which uses multimodal data, seems to be increasingly popular since it brings together data from ambient and wearable sensors [12,20]. Mechatronic devices can be used as an actuation device. An exoskeleton device attached to the finger that can be used in the medical field for patients with speech problems or immobilized [21].
2.2. Image Representation of Dataset
Image recognition techniques were initially based on transforming temporal sensor data into spatial representation in the form of images. This allows data features to be represented by colors or textures; thus, the data are represented in the form of a scalogram. Generated scalograms contain vertical stripes, reflecting the frequency components and energy differences between bands. Texture information improves classification and captures fine details, resulting in the high accuracy of the wavelet scalogram-based method. The method obtained a recognition rate of 99.11% compared to the recognition rate of 94.58% obtained with the classical numerical representation [22].
The two-dimensional representation of one-dimensional data, such as the amplitudes, nonlinearity, and local temporal relationships of the data, is another method of graphical representation. Each characteristic is represented with a color, and then these three color channels are represented in a single multicolor image. With this method, a recognition rate of 99.40% [23] was obtained.
For gesture recognition, a method was used to represent the raw data obtained from the electromyographic system. These data were represented in the image in grayscale, where these values were distributed. The recognition rate obtained with this method is 99.95% [24].
2.3. Image Recognition Methods
A method for determining multi-user human activities using wireless signals. The data were collected for 16 different activities, including individual and group activities. Three automatic activity recognition algorithmic methods were tested. The input data provided to the neural networks were matrices that contained the values of the wireless signals transmitted and received by the antenna, as well as the response frequency. The method based on the Extra Trees (ET) algorithm obtained an average accuracy of 98%, which is the best performing among the evaluated models. The Random Forest (RFo) method had an average accuracy of 97%. The lowest recognition rate method was the one based on the Decision Tree (DT) algorithm with an accuracy result of 90% [25].
The hybrid data representation method combines existing data with future data, which are represented in the form of monochrome thermal maps. The recognition algorithm is based on a convolutional neural network (CNN) combined with Gated Recurrent Unit (GRU) technology. The optimal approach for data graphic representation, which gave the best results, was to use a mix of a 30 min data window containing data already collected (past) and 15 min of future data (assumed). The recognition rate varies from 98% to 100% depending on the complexity of the activities. The study included eight static and dynamic activities: toileting, resting, exit, cooking, shower, PC, sleep, and kitchen [18].
The dataset provided by the Center for Advanced Studies in Adaptive Systems (CASAS) at Washington State University is described in the article [13]. It uses both single-user and multi-user data. The tested model is based on the Markov model using the recorded data. For single-user data, the recognition rate was 83%. When it comes to the presence of pets in the residential space, the recognition rate drops between 3 and 6%. For data taken from the multi-user residential space, the recognition rate with this method is 11%.
An innovative method that can be used to improve the HAR rate is a multi-agent model, called Hydra-TS, used for data augmentation. It proposes a multidimensional representation and the relationships between events. Even if this method is still at the beginning stages, the results are quite promising. With a recognition rate of about 67%, this method can determine the relationships between individuals, which can improve multi-user recognition [26].
The multi-user Kyoto dataset from CASAS was processed by adding features based on the most frequent activity. Two algorithms are tested, namely long-short-term memory (LSTM) and BiLSTM. The accuracy results for multi-users were 39% in the case of LSTM and 37% in the case of BiLSTM [27].
An efficient method of recognizing multi-user activities uses a dataset collected with data taken from two users. The users had 16 independent and collaborative activities. The recognition method is in two stages; the first stage involves the recognition of individual activities, and then, in the second stage, the generated data are provided to a network that predicts the following activities. A DNN network was used, and a recognition rate of 66.7% was obtained [28].
In Table 1, the results obtained by other studies in the field are presented. The results from studies using the CASAS multi-user dataset serve as references for this study. Although the results for other datasets are better, they use a dataset collected specifically for that study.

Table 1.
Results from related works.
3. Dataset and Data Representation
3.1. Dataset Information
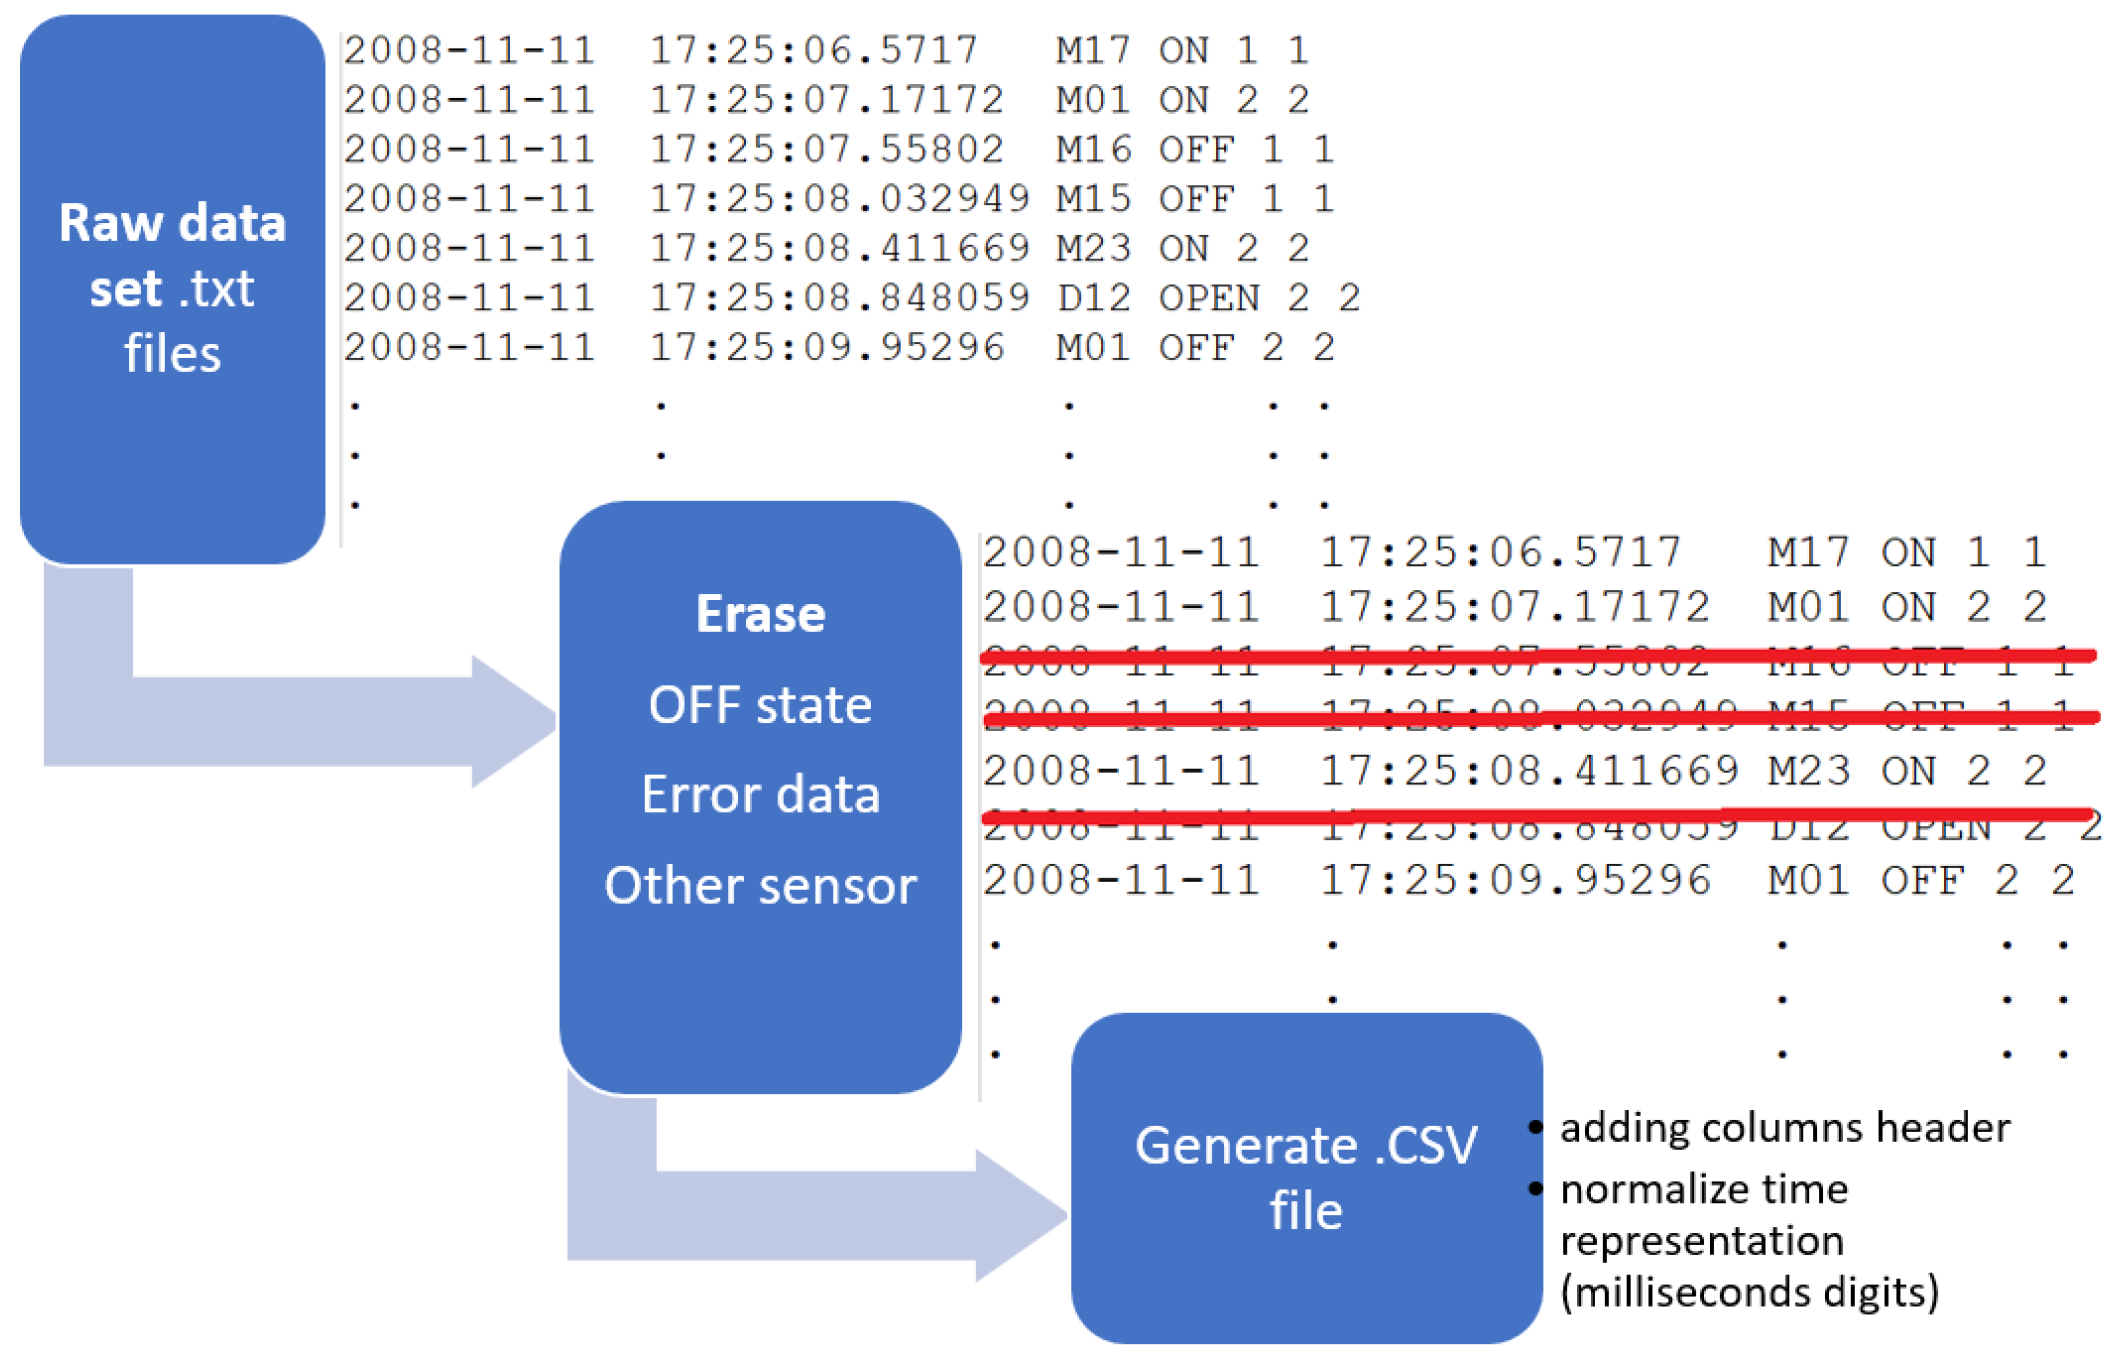
This study utilized the Kyoto Multiresident ADL Activities dataset created by the Center for Advanced Studies in Adaptive Systems at Washington State University. The dataset is freely available and can be downloaded from [30]. The Aruba single-user dataset was also used to prove the concept and is freely available and can be downloaded from [31]. For this study, two methods of data graphical representation were used. For the first method, the data were represented as density maps, and for the second method, the data were represented as a temporal perspective graph. The raw dataset includes the activation and deactivation status of the PIR sensors that are part of the main data acquisition system. In order to be able to represent the data, the dataset was first cleaned of redundant data such as sensor inactivity status states. The main dataset used for this study is the Kyoto Multiresident ADL Activities set, provided by the Center for Advanced Studies in Adaptive Systems (CASAS) at Washington State University. In order to generate this dataset, 40 people participated and followed a list of activities they had to perform. Table 2 presents the list of activities, which is also mentioned in the article [32], the number of persons and the activity type. The activities were carried out in sets of two people and the activities were both individual and collaborative. This means that at one point in time, one or two people carried out activities, some of whom intersected with each other. The study that describes the data acquisition system, activities, and raw data representation is described in the article [32]. In addition, the dataset is annotated from the point of view of the activities and the people who actually performed the activities. The data are stored in text type files, where the states of the sensors recorded during the data collection are saved and structured as one record per row. A single recording contains the recording date, time, sensor name, sensor status, the label with the people performing the activity, and the activity number as presented in Table 2. The reason is that the “OFF” state of the sensor does not represent the end of the activity in the sensor’s action area but rather its state of inactivity. This state is inserted automatically after a period of time specific to each type of sensor. In the dataset, there are data that were incorrectly recorded or did not appear labeled, and they were removed so as not to negatively influence the recognition of the activities. For the current study, only the data from the motion sensors (marked with M) and those placed on the doors of the rooms (marked with D) were taken into account. In the pre-processing phase, only the chosen sensor type data were retrieved and used further. Although not used, the dataset also contains raw and labeled data from other sensor types, but since they are more uncommon than the PIR-based sensors, they were discarded. Figure 1 shows the steps that were followed to clean the raw data.
Table 2.
Detailed activities scenario [32].

Figure 1.
Initial data cleaning from redundant data.
3.2. Density Map Graphic Representation Method
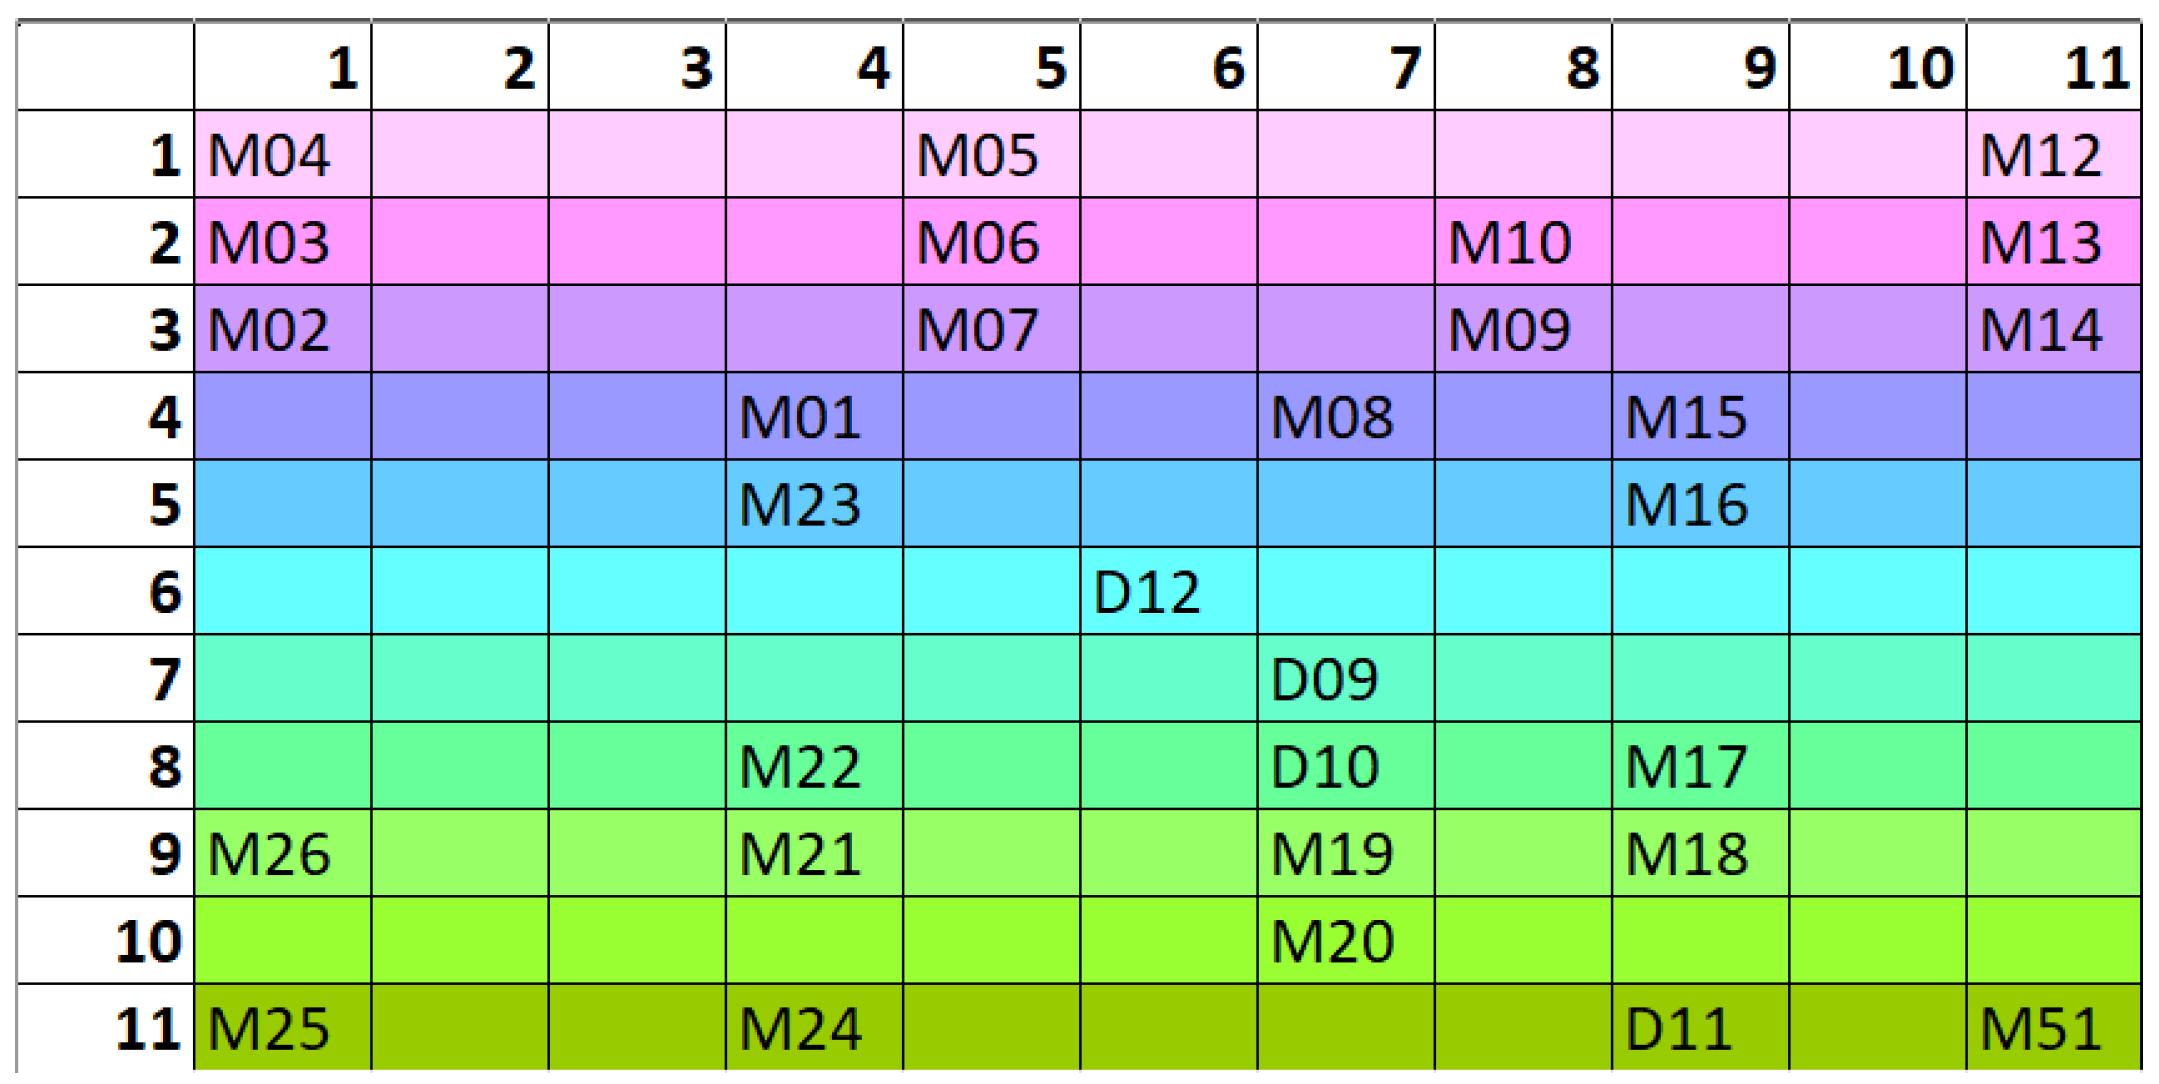
The graphic representation method used in our study [13] involves the creation of a density map based on the sensor activation signals. In order to represent the map as close as possible to reality, a matrix was created that contains the sensors and the locations where they are installed. As can be seen in Figure 2, this matrix was created by superimposing it on the house map and determining the matrix point where each mounted sensor is displayed.

Figure 2.
Matrix of positioning sensor on map.
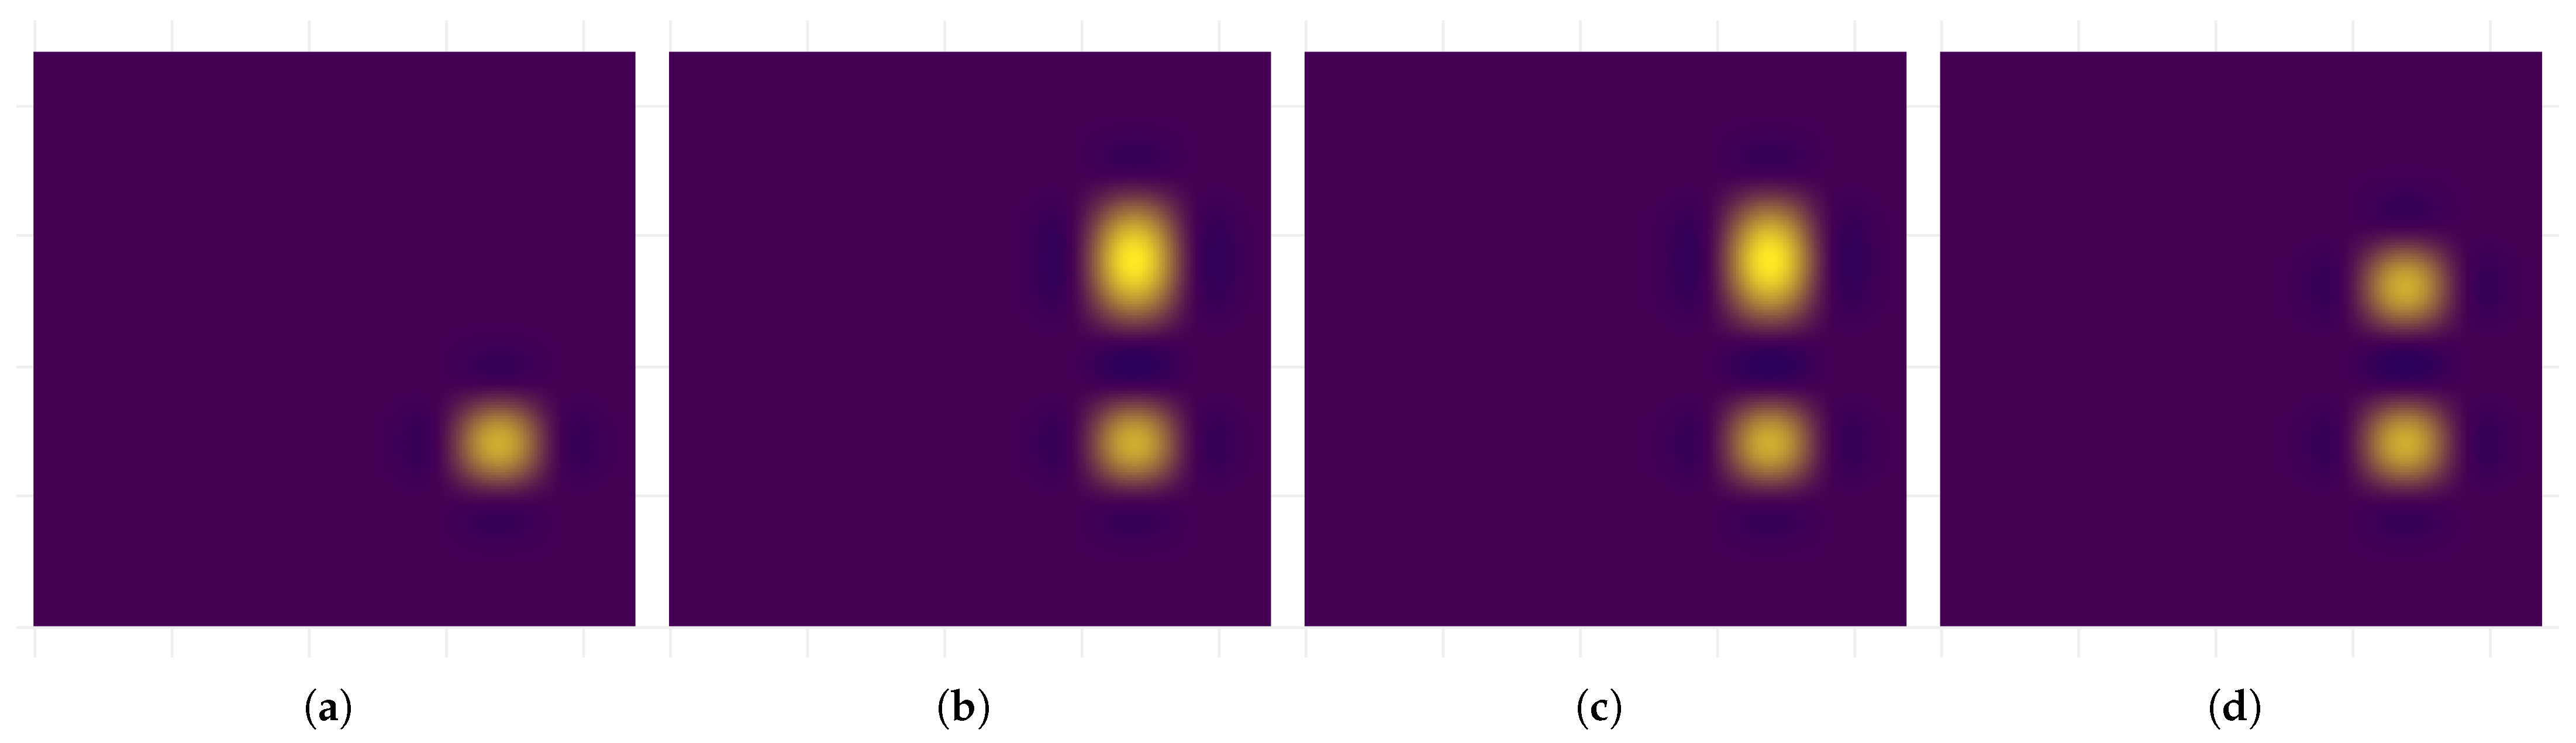
The more active a sensor is, the more intensely it is represented on the map, where it is highlighted by a different shade. Using this method, we generated images of 227 × 227 pixels using data from the Kyoto Multiresident ADL Activities set.
In Algorithm 1, the pseudocode used to generate images using the density map method is presented. The first step is to read the input dataset file and initialize the activity group. For each line item in the dataset file, we check if we have a condition called activity begin. If an activity is starting, we add the current data item to the activity group. If we do not have an activity begin scenario, we create the target folder and path, map activity group items to a matrix after we plot the heat map plot type, and save the resulting PNG image. In the end, we also need to clear the activity group. The data window process was handled using the following Formula (1), where t represents the time and S represents the sensor identification and the graphical coordinates.
An example of generated images can be seen in Figure 3. Several window variants were generated for testing. The figure shows the data for activity 1, which is an individual activity. In Figure 3a, a data graphical representation based on nonoverlapping data window frames was used. In Figure 3b, we can see that for the same activity, the generated image has an overlapped larger data window frame. For Figure 3c,d, the generation of superimposed windows with data window frames of 5 s and 10 s was analyzed. The difference compared to the previous version is that it was limited to only two activities per represented image.
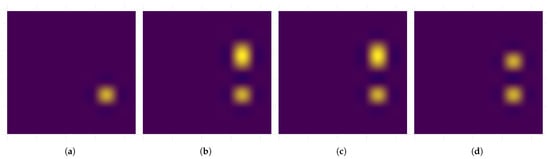
Figure 3.
Density map generated from Kyoto dataset Multiresident ADL Activities: (a) window of 3 s without overlapping; (b) window of 8 s with 5 s overlapping; (c) window of 8 s with 5 s overlapping and limitation to 2 activities; (d) window of 13 s with 10 s overlapping and limitation to 2 activities.
| Algorithm 1 Generating density map plot algorithm |
| Require: ▹Data item count from input dataset file
Ensure: ▹ Activity group for n do is activity begin if b = true then else Create target path and folder Map activityGroup g items to matrix PlotMatrix using Heatmap plot type and save PNG image end if end for |
3.3. Coordinates of Sensor Locations Graphical Representation Method
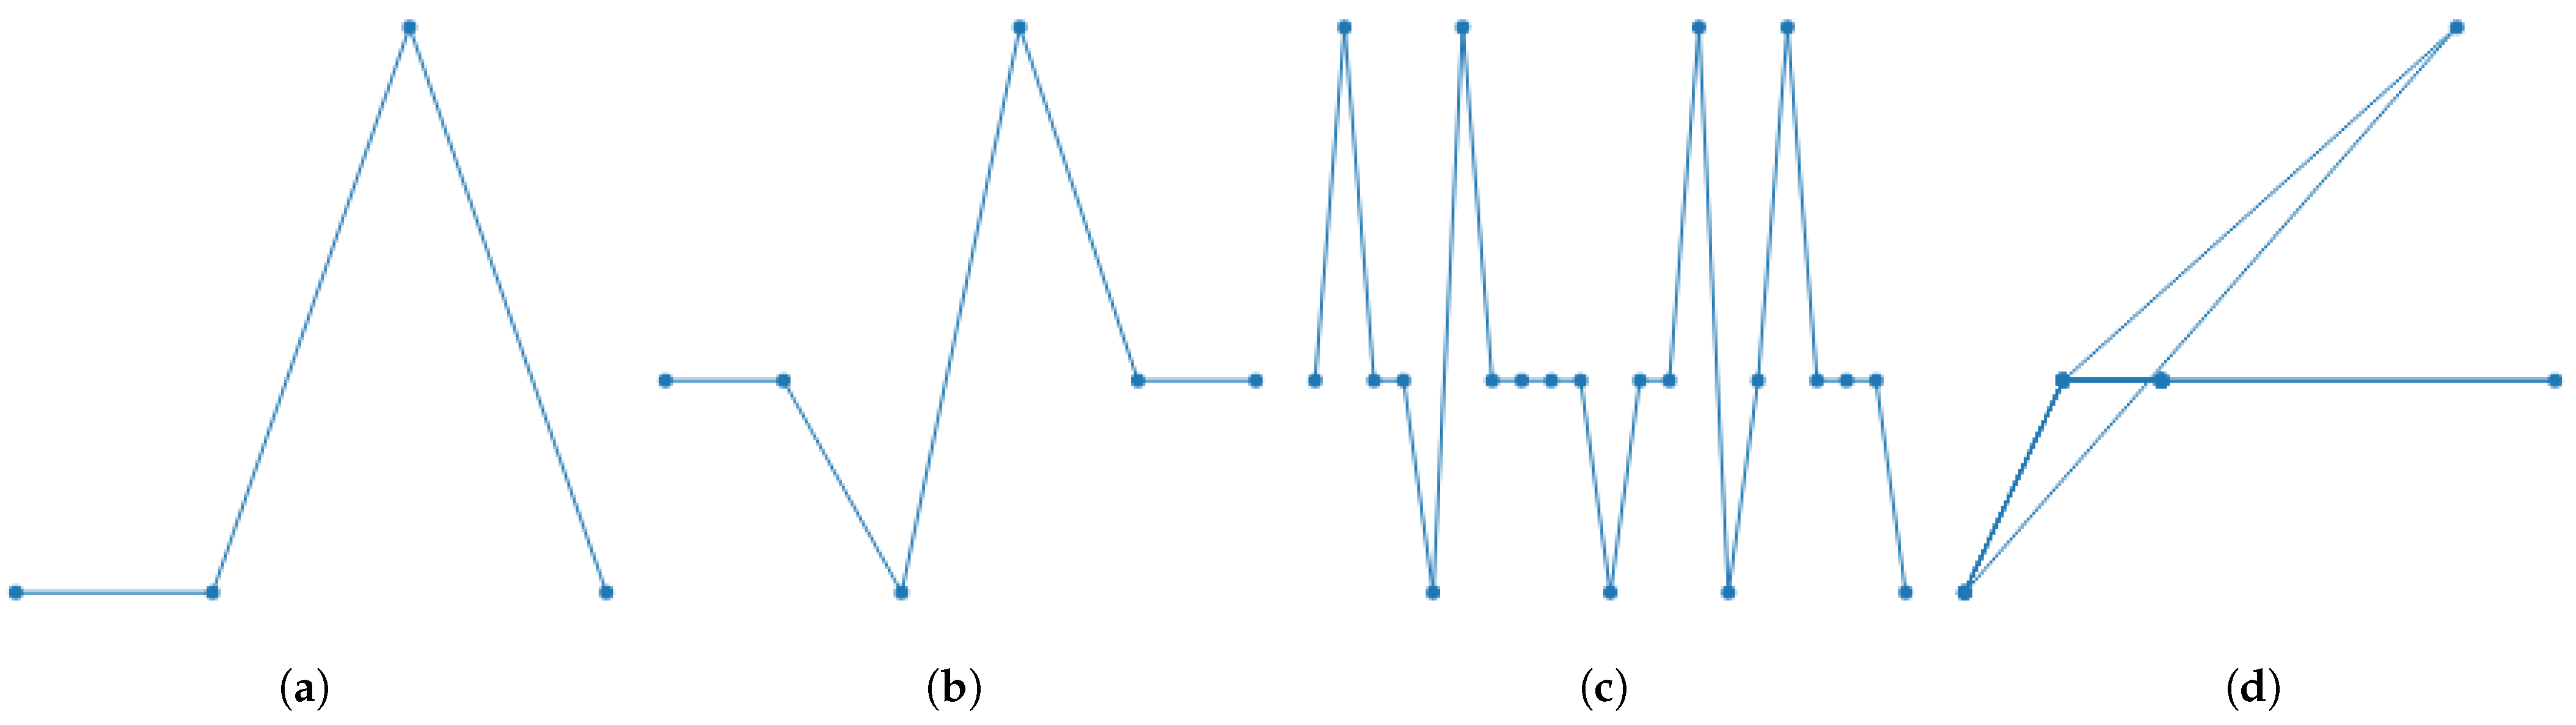
For the method analyzed in this study, the same dataset and sensor location matrix were used. The Scatter Plot style was used for graphic representation. An image is 227 × 227 in size. A graph represents a window of data from the time set. Each active sensor in the window is graphically represented by a point whose coordinates represent the sensor’s location in the matrix. To create a linear relationship of activities, the next displayed active point is joined to the previous one by a line. Several sets were generated with different data window parameters, but also the introduction of a normalized temporal side, more precisely using the data order to normalize the temporal one. The temporal aspect was introduced by scaling the coordinates on the x-axis with a constant value of 3 units. The exact time value was not used because some activities may last longer and others less so, and the data window limits the activity in time. An example of generated images can be seen in Figure 4.
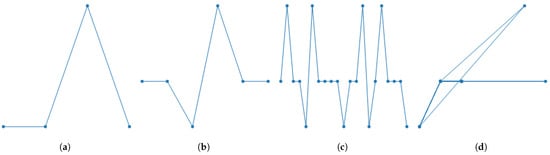
Figure 4.
Graphical representation of data generated from Kyoto dataset Multiresident ADL Activities: (a) window of 10 s without overlapping; (b) window of 30 s without overlapping; (c) window of 50 s without overlapping; (d) window of 50 s without overlapping without temporal normalization.
In Algorithm 2, the pseudo-code used to generate images using the scatter plot is presented. The first step is to read the input dataset file. For each line item in the dataset file, we initialize the activity group that will store multiple line items. We then add the current data item to the activity group. Then for each item, from the current position to any item inside the defined data window (using the time in seconds), we add the next rows to the activity group. When the activity group is full of items, more than two, we create the target folder and path, map the activity group items to a list of 2D points, and leverage the ScottPlot library to plot the scatter image type and save a PNG image.
| Algorithm 2 Generating scatter plot algorithm |
| Require: ▹ Data item count from input dataset file
Ensure: ▹ Activity group for n do for do end for if then Create target path and folder Map Activity group g items to list of 2D points Plot matrix using Scatter plot type and save PNG image end if end for |
3.3.1. Scatter Plot Data Image Generation
From the main CASAS dataset, a comma-separated value file was extracted, which contains basic activity information such as timestamp, sensor activation state, user ID, and activity type. These data were imaged by the .Net DataSetProcessor application. This process involved overlapping logic as for each record in the initial input data file, we gathered a data window and created a plot image. Multiple data window values were used for tests, with the following values: 3, 5, 10, 20, 30, and 50 s. Based on this data window group of sensor activations, a list of two-dimensional points is created using the house map matrix as a coordinate source. Once the list of points is generated, the ScotPlot library is leveraged to create a corresponding scatter plot image. Thus, the image will contain a graphical representation of the points and links between the points.
3.3.2. Temporal Scatter Plot Data Image Generation
The logic for the generation of the temporal Scatter plot data image is similar to the generation of the basic Scatter plot data image. We still use data windows to generate a list of two-dimensional points. The main difference is that we introduce a temporal aspect to displaying the data but in a normalized form without relying on the actual timestamp of the raw sensor data. This is achieved by replacing the X axis in the list of two-dimensional points with an incremental index, simulating the temporal aspect but without taking into account the actual time between the sensor events. The index is incremented with a constant value of 3 to ensure that the plot generation is optimal. This generates a plot image that represents a graphical sensor activation path.
The ScottPlot.NET library is showcased here together with sample code [33]. More details can be found on this project’s GitHub page here [34] version 5.0.53 and on the Nuget package here [35]. Multiple versions of this “ScottPlot” library were used, including 4.1.71 and 5.0.53.
The source code for the proposed multi-user human activity recognition system is available in a public git repository [36].
4. Image Recognition Method
The Google Colab platform was used to develop the project. It is a tool that allows you to upload data and create machine learning models using a cloud infrastructure. This platform allows for working with industry standard libraries such as Keras and TensorFlow [37]. In addition to CPU processors, Google Colab also provides GPU graphics processors that allow for higher speeds. This platform was chosen because the project needed image processing. Using the Keras library, a sequential network was modeled. As can be seen in the Figure 5 diagram, the first step was to load the images from a Google Drive. With the help of the Dataset.cache and Dataset.prefetch functions, the images were loaded into the Google Cloud Drive. In this way, the neural network will be able to process the images much better and faster. Once loaded, these images are normalized using parameters [0, 1] and rescaling with parameters [0, 255]. The next step was to create the neural model.
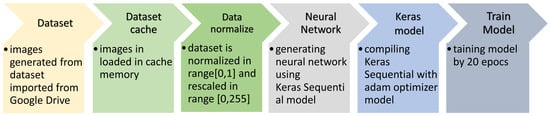
Figure 5.
Flow diagram in developing the convolutional neural network using the Google Colab platform.
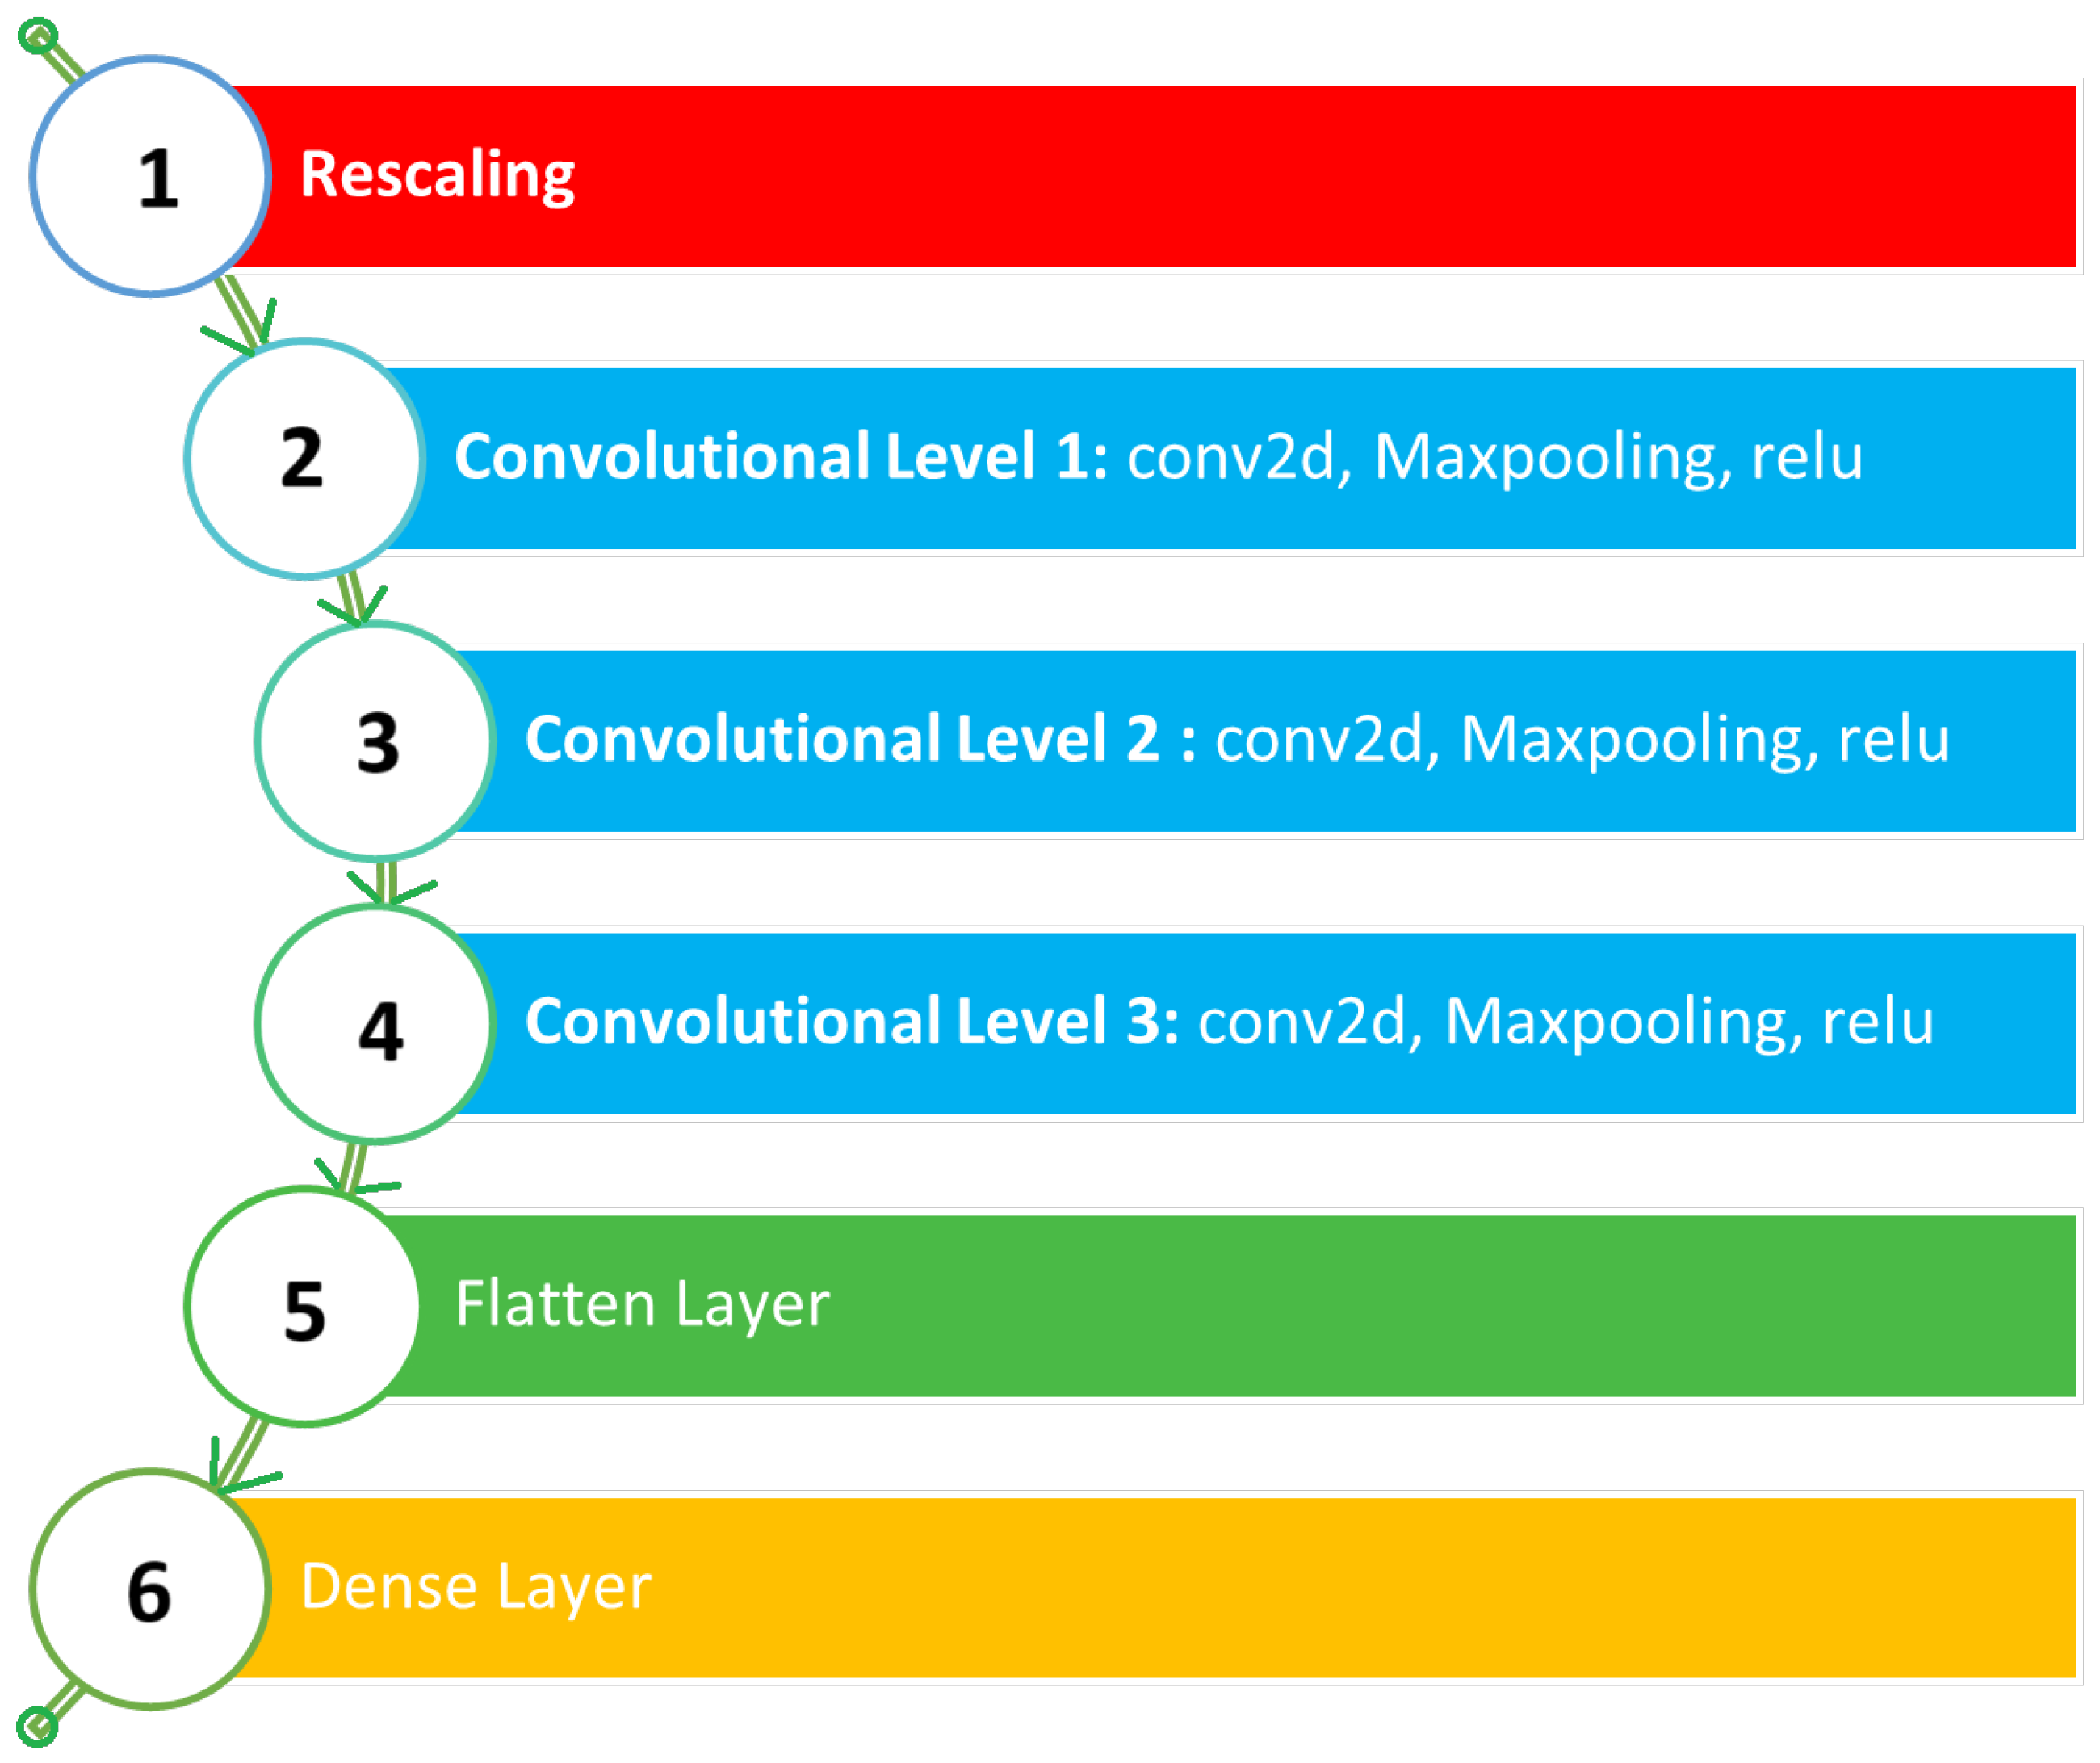
The chosen model was the sequential model that is suitable for image recognition. The model contains, as can be seen in the Figure 6 diagram, an image rescaling layer, followed by three convolutional layers, each with a Conv2D, MaxPooling2D and ReLU function. The last two layers include the flatten layer and the connection layer using the Dense function, which is a fully connected layer. As an optimization property, the Adam algorithm was used, which is optimal from a computational point of view and uses few computational resources. It works very well for problems such as large volumes of data and complex parameters. Table 3 presents the layers of the convolutional network and the values of the test parameters. To optimize the recognition rate, several convolutional layers were added. The pooling parameter for the pooling layer was adjusted. The results obtained are described in the Section 5. From the complete dataset, 70% training and 30% validation were used.
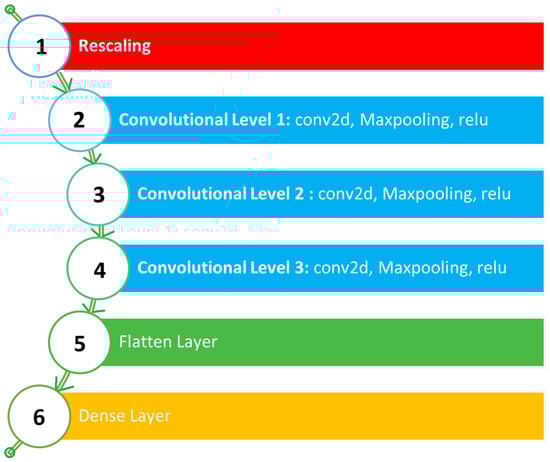
Figure 6.
Sequential model architecture block diagram.
Table 3.
Sequential neural network parameters.
5. Results
The results obtained using standard parameters proved to be effective within the scope of this study. Table 4 presents the results for different types of tests. The best result was obtained using data windows of 50 s with a scatter plot representation. Unlike the temporal spectrum version, this method also gave very good results for validation. This data representation method also works for continuous data flows, so this method can also be used to recognize real-time activities. Also, from this table, it can be seen that the recognition algorithm works very well on the dataset with a single user, the recognition rate being 99%.
Table 4.
Results obtained.
To validate the dataset, a T-test was implemented in the Google Colab platform. Based on the recognition rate and the standard deviation coefficient, the T-test values and the probabilistic value were calculated. Table 5 shows the results for the sets tested. For the type of graphic representation of scatter plots, the introduction of the temporal spectrum did not bring any positive benefit. Instead, the differences between the representation with density map and scatter plot can be observed both from the recognition rate and from the t-test value. The scatter plot representation type is clearly superior to the density map type.
Table 5.
Results obtained by applying T-test to compare datasets.
To improve the method, several parameter values were tested. In Table 6, the recognition results value rate is highlighted, as well as the parameter values. The convolutional layer pooling value was modified because it has a direct effect on the features that are extracted in the learning process. In addition, additional convolutional layers were added. The best result was obtained with four additional convolutional layers. The optimization algorithm was modified, and AdamW and Adadelta had the best results. Unlike the initial version, the recognition rate improved by 4%. The proposed implementation trains an image classification model using a batch size of 32; these images are processed before the model weights are updated. Input images are resized to 227 × 227 pixels before being fed into the model. A validation split of 0.3 is used, which means that 30% of the dataset is reserved for evaluating the performance of the model during training and prevent overfitting. The model is trained for 20 epochs, giving it multiple passes through the entire dataset to learn the patterns in the data. The Adam optimizer, known for its efficiency, is employed to update the model’s weights and guide the learning process. This optimizer helps in achieving faster convergence and potentially better accuracy.
Table 6.
Results with different parameters.
In Table 7, we compared the results obtained in this study with studies that use the CASAS multi-user database. We noticed that this proposed model is efficient at recognizing multi-user activities.
Table 7.
Our result compared to other related work.
6. Conclusions
Recognizing multi-user activities requires complexity and diversity. User actions can be individual or collaborative. The targeted activities can be simple and involve little action, including reading or recreational activities, but also complex, including cooking or cleaning. Recognizing activities in residential spaces not only helps to identify activities but also improves everyday life. These intelligent residential spaces contribute to energy efficiency, optimizing the environment to meet the user’s needs. It can even help identify negative habits and behaviors that can affect health.
Any intelligent activity recognition system or intelligent residential space must respect data confidentiality and respect the users’ personal space without interfering with their lives or trying to control them. One of the problems with the smart environment is that a user feels under surveillance and that he no longer has the freedom to carry out his activity without reasoning for each action he takes. That is why this type of system should use noninvasive electronic data recording systems and compensate for the missing information by using even more intelligent recognition methods. This study aimed to find a graphical representation method, which is as efficient as possible with the data obtained from a PIR sensor-based system. From the graphical representation methods tested, we conclude that the most efficient method was using generated windows based on coordinates. The length of the windows with a good result was 50 s. The tests in which this value was used obtained a recognition rate of 79%. We improved the recognition rate by 4% by finding parameter values that help in this regard. This was achieved by completing the initial architecture of the sequential neural network with four more convolutional layers and using the AdamW and Adadelta optimizer. With an accuracy result of 83%, this study met its objective of finding an efficient method of activity recognition. At the same time, the use of data windows proved to have a positive effect on the representation of chronological data. From the tests performed, it was proven that the window overlap did not have a positive result in the case of this method; moreover, it led to the creation of too much information data, which led to a decrease in recognition rate.
Recognizing activities in a multi-user residential space is a complex process that involves, first and foremost, an understanding of the activities performed and the need for space adaptability and flexibility. Secondly, it also involves the integration of technologies for improving the housing experience. It also requires a careful approach to montoring the users and protecting their privacy rights. Taking into account the good results obtained with this method, we will, in a future study, create a real-time system that recognizes activities and anticipates, based on future behaviors, the possible health problems that the users of the smart residential space could experience. The study method successfully identified multi-user activities at specific moments. Users cannot be identified, and activities are detected only as they occur individually or collaboratively. The dataset’s existing data make solving this problem challenging. In addition, for user identification, we can improve this method by combining the data taken by the PIR sensors with data taken from a user’s gadgets such as smartphones. These data can bring about new information about the user’s location and behavior. Using a wearable device that the user is likely to have, such as a smartphone or a smart watch, the user does not feel invaded by technology. This new modal dataset will represent the input from which the algorithm will be able to extract new features, resulting in a better recognition rate. We have managed to obtain a better recognition rate, as compared with other studies, due to the chosen graphical image representation. This representation uses small images, takes into account the physical layout of a house, and highlights the links between activated sensors.
Author Contributions
Conceptualization, A.R.A., A.I.A. and S.O.; Data curation, S.O.; Formal analysis, S.O.; Investigation, A.R.A. and A.I.A.; Methodology, A.R.A. and S.O.; Project administration, S.O.; Software, A.I.A.; Supervision, S.O.; Validation, A.R.A., A.I.A. and S.O.; Visualization, A.R.A.; Writing—original draft, A.R.A. and S.O.; Writing—review and editing, A.R.A. and A.I.A. All authors have read and agreed to the published version of the manuscript.
Funding
This research received no external funding.
Institutional Review Board Statement
Not applicable.
Informed Consent Statement
Not applicable.
Data Availability Statement
Data available in a publicly accessible repository. The data presented in this study are the CASAS datasets that are openly available and can be downloaded from [30,31].
Acknowledgments
The Intelligent Embedded Systems research laboratories supported this work at the Technical University of Cluj-Napoca, North University Center of Baia Mare and all authors consented to the acknowledgment.
Conflicts of Interest
The authors declare no conflict of interest.
Abbreviations
The following abbreviations are used in this manuscript:
| CASAS | Center for Advanced Studies in Adaptive Systems |
| HAR | Human Activity Recognition |
| UWB | Ultra-Wideband |
| RFID | Radio-Frequency Identification |
| DT | Decision Tree |
| RFo | Random Forest |
| ET | Extra Trees |
| GRU | Gated Recurrent Unit |
| CNN | Convolutional Neural Network |
| DNN | Deep Neural Network |
| LSTM | Long Short-Term |
| CPU | Central Processing Unit |
| GPU | Graphics processing unit |
| CSV | Comma-separated values |
References
- Pavliuk, O.; Mishchuk, M.; Strauss, C. Transfer Learning Approach for Human Activity Recognition Based on Continuous Wavelet Transform. Algorithms 2023, 16, 77. [Google Scholar] [CrossRef]
- Webber, J.; Mehbodniya, A.; Arafa, A.; Alwakeel, A. Improved Human Activity Recognition Using Majority Combining of Reduced-Complexity Sensor Branch Classifiers. Electronics 2022, 11, 392. [Google Scholar] [CrossRef]
- Park, H.; Kim, N.; Lee, G.H.; Choi, J.K. MultiCNN-FilterLSTM: Resource-efficient sensor-based human activity recognition in IoT applications. Future Gener. Comput. Syst. 2023, 139, 196–209. [Google Scholar] [CrossRef]
- Czekaj, Ł.; Kowalewski, M.; Domaszewicz, J.; Kitłowski, R.; Szwoch, M.; Duch, W. Real-Time Sensor-Based Human Activity Recognition for eFitness and eHealth Platforms. Sensors 2024, 24, 3891. [Google Scholar] [CrossRef]
- Li, Q.; Gravina, R.; Li, Y.; Alsamhi, S.H.; Sun, F.; Fortino, G. Multi-user activity recognition: Challenges and opportunities. Inf. Fusion 2020, 63, 121–135. [Google Scholar] [CrossRef]
- Bernardo, J.B.L.; Taparugssanagorn, A.; Miyazaki, H.; Pati, B.M.; Thapa, U. Robust Human Activity Recognition for Intelligent Transportation Systems Using Smartphone Sensors: A Position-Independent Approach. Appl. Sci. 2024, 14, 10461. [Google Scholar] [CrossRef]
- Li, Y.; Yang, G.; Su, Z.; Li, S.; Wang, Y. Human activity recognition based on multienvironment sensor data. Inf. Fusion 2023, 91, 47–63. [Google Scholar] [CrossRef]
- Rizk, H.; Elmogy, A.; Rihan, M.; Yamaguchi, H. MultiSenseX: A Sustainable Solution for Multi-Human Activity Recognition and Localization in Smart Environments. AI 2025, 6, 6. [Google Scholar] [CrossRef]
- Herfandi, H.; Sitanggang, O.S.; Nasution, M.R.A.; Nguyen, H.; Jang, Y.M. Real-Time Patient Indoor Health Monitoring and Location Tracking with Optical Camera Communications on the Internet of Medical Things. Appl. Sci. 2024, 14, 1153. [Google Scholar] [CrossRef]
- Dang, X.; Fan, K.; Li, F.; Tang, Y.; Gao, Y.; Wang, Y. Multi-Person Action Recognition Based on Millimeter-Wave Radar Point Cloud. Appl. Sci. 2024, 14, 7253. [Google Scholar] [CrossRef]
- Papadakis, A.; Spyrou, E. A Multi-Modal Egocentric Activity Recognition Approach towards Video Domain Generalization. Sensors 2024, 24, 2491. [Google Scholar] [CrossRef] [PubMed]
- Javadi, S.; Riboni, D.; Borzì, L.; Zolfaghari, S. Graph-Based Methods for Multimodal Indoor Activity Recognition: A Comprehensive Survey. IEEE Trans. Comput. Soc. Syst. 2025; Early Access. [Google Scholar] [CrossRef]
- Alexan, A.; Alexan, A.; Oniga, Ş. Single user activity recognition with Density Activity Abstraction Graphics Algorithm. In Proceedings of the 2022 IEEE 2nd Conference on Information Technology and Data Science (CITDS), Debrecen, Hungary, 16–18 May 2022; pp. 7–12. [Google Scholar] [CrossRef]
- Najeh, H.; Lohr, C.; Leduc, B. Real-Time Human Activity Recognition on Embedded Equipment: A Comparative Study. Appl. Sci. 2024, 14, 2377. [Google Scholar] [CrossRef]
- Ronao, C.A.; Cho, S.B. Human activity recognition with smartphone sensors using deep learning neural networks. Expert Syst. Appl. 2016, 59, 235–244. [Google Scholar] [CrossRef]
- Manjarres, J.; Narvaez, P.; Gasser, K.; Percybrooks, W.; Pardo, M. Physical Workload Tracking Using Human Activity Recognition with Wearable Devices. Sensors 2020, 20, 39. [Google Scholar] [CrossRef] [PubMed]
- He, Z.; Sun, Y.; Zhang, Z. Human Activity Recognition Based on Deep Learning Regardless of Sensor Orientation. Appl. Sci. 2024, 14, 3637. [Google Scholar] [CrossRef]
- Anguita-Molina, M.Á.; Cardoso, P.J.S.; Rodrigues, J.M.F.; Medina-Quero, J.; Polo-Rodríguez, A. Multi-Occupancy Activity Recognition Based on Deep Learning Models Fusing UWB Localisation Heatmaps and Nearby-Sensor Interaction. IEEE Internet Things J. 2025; Early Access. [Google Scholar] [CrossRef]
- Lee, J.S.; Choi, S.; Kwon, O. Identifying multiuser activity with overlapping acoustic data for mobile decision making in smart home environments. Expert Syst. Appl. 2017, 81, 299–308. [Google Scholar] [CrossRef]
- Jain, V.; Gupta, G.; Gupta, M.; Sharma, D.K.; Ghosh, U. Ambient intelligence-based multimodal human action recognition for autonomous systems. ISA Trans. 2023, 132, 94–108. [Google Scholar] [CrossRef] [PubMed]
- Iqbal, J.; Tsagarakis, N.; Caldwell, D. Design of a Wearable Direct-driven Optimized Hand Exoskeleton Device. In Proceedings of the International Conference on Advances in Computer-Human Interactions (ACHI), Gosier, Guadeloupe, France, 23–28 February 2011. [Google Scholar]
- Lian, C.; Zhao, Y.; Sun, T.; Shao, J.; Liu, Y.; Fu, C.; Lyu, X.; Zhan, Z. Incorporating image representation and texture feature for sensor-based gymnastics activity recognition. Knowl.-Based Syst. 2025, 311, 113076. [Google Scholar] [CrossRef]
- Zhao, Y.; Shao, J.; Lin, X.; Sun, T.; Li, J.; Lian, C.; Lyu, X.; Si, B.; Zhan, Z. CIR-DFENet: Incorporating cross-modal image representation and dual-stream feature enhanced network for activity recognition. Expert Syst. Appl. 2025, 266, 125912. [Google Scholar] [CrossRef]
- Qingzheng, C.; Qing, T.; Muchao, Z.; Luyao, M. CNN-based gesture recognition using raw numerical gray-scale images of surface electromyography. Biomed. Signal Process. Control 2025, 101, 107176. [Google Scholar] [CrossRef]
- Saeed, U.; Shah, S.Y.; Shah, S.A.; Liu, H.; Alotaibi, A.A.; Althobaiti, T.; Ramzan, N.; Jan, S.U.; Ahmad, J.; Abbasi, Q.H. Multiple Participants’ Discrete Activity Recognition, Well-Controlled Environment Using Universal Software Radio Peripheral Wireless Sensing. Sensors 2022, 22, 809. [Google Scholar] [CrossRef] [PubMed]
- DeSmet, C.; Greeley, C.; Cook, D.J. Hydra-TS: Enhancing Human Activity Recognition with Multiobjective Synthetic Time-Series Data Generation. IEEE Sens. J. 2025, 25, 763–772. [Google Scholar] [CrossRef]
- Singh, D.; Merdivan, E.; Kropf, J.; Holzinger, A. Class imbalance in multi-resident activity recognition: An evaluative study on explainability of deep learning approaches. Univ. Access Inf. Soc. 2024. [Google Scholar] [CrossRef]
- Matsui, T.; Misaki, S.; Sato, Y.; Fujimoto, M.; Suwa, H.; Yasumoto, K. Multi-person Daily Activity Recognition with Non-contact Sensors based on Activity Co-occurrence. In Proceedings of the 2021 Thirteenth International Conference on Mobile Computing and Ubiquitous Network (ICMU), Tokyo, Japan, 17–19 November 2021; pp. 1–8. [Google Scholar] [CrossRef]
- Wang, T.; Cook, D.J.; Fischer, T.R. The Indoor Predictability of Human Mobility: Estimating Mobility with Smart Home Sensors. IEEE Trans. Emerg. Top. Comput. 2023, 11, 182–193. [Google Scholar] [CrossRef] [PubMed]
- Kyoto Multi-User CASAS Dataset. Available online: https://casas.wsu.edu/datasets/adlmr.zip (accessed on 30 January 2025).
- Aruba Single-User CASAS Dataset. Available online: https://casas.wsu.edu/datasets/aruba.zip (accessed on 30 January 2025).
- Singla, G.; Cook, D.J.; Schmitter-Edgecombe, M. Recognizing Independent and Joint Activities Among Multiple Residents in Smart Environments. J. Ambient. Intell. Humaniz. Comput. 2010, 1, 57–63. [Google Scholar] [CrossRef]
- ScottPlot.NET. Available online: https://scottplot.net/ (accessed on 30 January 2025).
- ScottPlot on GitHub. Available online: https://github.com/scottplot/scottplot/ (accessed on 30 January 2025).
- ScottPlot Nuget Package. Available online: https://www.nuget.org/packages/ScottPlot/ (accessed on 30 January 2025).
- Research Source Code. Available online: https://github.com/AncaAlexan/mpdiCASAS (accessed on 30 January 2025).
- Ketkar, N. Deep Learning with Python: A Hands-On Introduction; Apress: Bangalore, India, 2017; ISBN 978-1-4842-2766-4. [Google Scholar] [CrossRef]

Disclaimer/Publisher’s Note: The statements, opinions and data contained in all publications are solely those of the individual author(s) and contributor(s) and not of MDPI and/or the editor(s). MDPI and/or the editor(s) disclaim responsibility for any injury to people or property resulting from any ideas, methods, instructions or products referred to in the content. |
© 2025 by the authors. Licensee MDPI, Basel, Switzerland. This article is an open access article distributed under the terms and conditions of the Creative Commons Attribution (CC BY) license (https://creativecommons.org/licenses/by/4.0/).