Abstract
Non-Protective Personal Equipment (PPE) detection is crucial on construction sites. Although deep learning models are adept at identifying such information from on-site cameras, their success relies on large, diverse, and high-quality datasets. Image augmentation offers an alternative for artificially broadening dataset diversity. However, its impact on non-PPE detection in construction environments has not been adequately examined. This study introduces a methodology applying eight distinct augmentation techniques—brightness, contrast, perspective, rotation, scale, shearing, translation, and a combined strategy incorporating all methods. Model performance was assessed by comparing accuracy across different classes and architectures, both with and without augmentation. While most of these augmentations improved accuracy, their effectiveness was found to be task-dependent. Moreover, the most beneficial augmentation varied by non-PPE class and architecture, suggesting that augmentation strategies should be tailored to the unique features of each class and model. Although the primary focus here is on non-PPE, the evaluated techniques could also extend to related tasks on construction sites, such as detecting heavy equipment or identifying hazardous worker behavior.
1. Introduction
On construction sites, Personal Protective Equipment (PPE)—including safety helmets, vests, and other protective gear—is crucial for preventing accidents. Nevertheless, many workers choose not to wear PPE due to discomfort or limited awareness of safety measures [1]. Ensuring that all workers follow PPE guidelines is, therefore, paramount to reducing risks. Traditionally, site inspections rely on surveillance footage reviews and physical patrols—methods that are both time-intensive and labor-intensive. Moreover, inspectors who monitor multiple screens for extended periods may miss violations due to fatigue [2].
A promising approach to identify non-PPE use involves deep-learning–based object detection applied to images captured by surveillance or body-worn cameras. By employing bounding boxes, this technique localizes and classifies pertinent objects within each image [3]. Training these models on extensive, labeled datasets encompassing diverse conditions—such as varying lighting or object sizes—automates most of the inspection process and delivers robust generalization [4]. However, acquiring a broad selection of non-PPE images from real construction sites can be difficult since regulations typically enforce adherence, making actual non-PPE instances relatively scarce.
To overcome this data limitation, image augmentation serves as an effective method to expand the training set without collecting additional images. Through transformations like rotations, flips, scaling, and color adjustments, it is possible to simulate real-world variations and create a wider range of training examples. This strategy addresses the insufficient diversity in the original dataset and significantly boosts model generalization.
Nonetheless, if augmented data are too detached from realistic conditions, they can increase computational costs during training and may degrade performance [5]. Inappropriate features within the dataset can distract the model from focusing on essential features, thereby reducing accuracy [6]. Consequently, it is vital to select augmentation techniques that accurately represent real-world situations.
This paper introduces image augmentation strategies, grounded in deep learning, that aim to enhance the accuracy of non-PPE detection. Although previous research has not thoroughly investigated the influence of augmentation for detecting non-PPE, multiple datasets—both original and augmented—were developed to assess the efficacy of these techniques. Model performance was then compared with and without the proposed augmentations, demonstrating how well-chosen augmentation strategies can improve non-PPE detection.
2. Literature Review
Over the last few decades, deep learning—particularly Convolutional Neural Networks (CNNs)—has been extensively applied to non-PPE detection. For instance, Fang et al. [7] adopted Faster R-CNN to automatically detect non-safety helmets, attaining accuracy rates of 90.1–98.4% in diverse scenarios. Gu et al. [8] enhanced Faster R-CNN with multi-scale training and expanded anchor strategies, elevating helmet detection accuracy by 7%. Yan and Wang [9] integrated densely connected convolutional networks into YOLOv3’s backbone, preserving detection time while boosting speed by 52% and accuracy by 5.7%. Shen et al. [10] utilized a single-stage face detector to recognize safety helmets, followed by a face-to-helmet regression model. Nath [11] combined YOLOv3 with Bayesian inference (71.23% accuracy), while Wang [12] discovered YOLOv5x to be most accurate (86.55%) and YOLOv5s to be fastest (0.019 s per frame). Lee et al. [13] proposed a YOLACT-based real-time method, achieving 66.4% accuracy for detecting helmets and vests, and Nguyen et al. [14] enhanced YOLOv5/YOLOv8 with a seahorse optimization algorithm, yielding 66% accuracy for various non-PPE classes (helmets, masks, gloves, vests, and shoes).
Although these studies reported impressive findings, most relied on unaugmented data, leaving the role of image augmentation largely unexplored. Meanwhile, several construction-oriented investigations have leveraged augmentation to enhance accuracy. For example, Bang et al. [15] boosted resource-detection rates from 35.96% to 60.22% by combining removing-and-inpainting, cut-and-paste, and image-variation methods with Mask R-CNN—though, notably, using only cut-and-paste lowered accuracy compared to the raw dataset, whereas other single techniques improved it. Wang et al. [6] introduced brightness, scale, blur, perspective, and rotation for rebar counting, showing up to a 5.43% improvement in accuracy using Faster R-CNN under different hyperparameter settings. Mansoor et al. [16] explored gamma transformation, Gaussian blur, and salt-and-pepper noise for heavy-equipment detection with YOLO, observing that individual transformations sometimes reduced training accuracy while marginally improving test accuracy, yet combining all techniques raised both training and test accuracy.
Beyond construction-focused tasks, other research illustrates the nuanced effects of augmentation. Wang [17] examined nine techniques—brightness, hue, saturation, contrast, scale, translation, cutout, weather, and various combinations—for two tasks (window detection and window-state detection) in building-facade images. These were demonstrated with three object detection methods (Faster R-CNN, YOLO, and R-FCN) using five architectures: ResNet-50, ResNet-101, MobileNetV3, EfficientNetV2, and InceptionV3, revealing that mixing multiple approaches did not always outperform a single well-chosen technique. Claridades et al. [18] applied rotation, horizontal flipping, Gaussian blur, and brightness adjustments to detect building entrances in street view images; model accuracy rose from 61.2% (original data) to 85.92% (rotation alone), 86.27% (three techniques), and 87.42% (all techniques). Collectively, these findings confirm that individual or combined augmentation strategies can outperform unaugmented data, though merging multiple methods is not invariably superior [19,20]. This underscores the importance of exploring augmentation approaches in different and underexplored contexts, including non-PPE detection on construction sites—a topic that remains largely unexamined.
3. Proposed Method
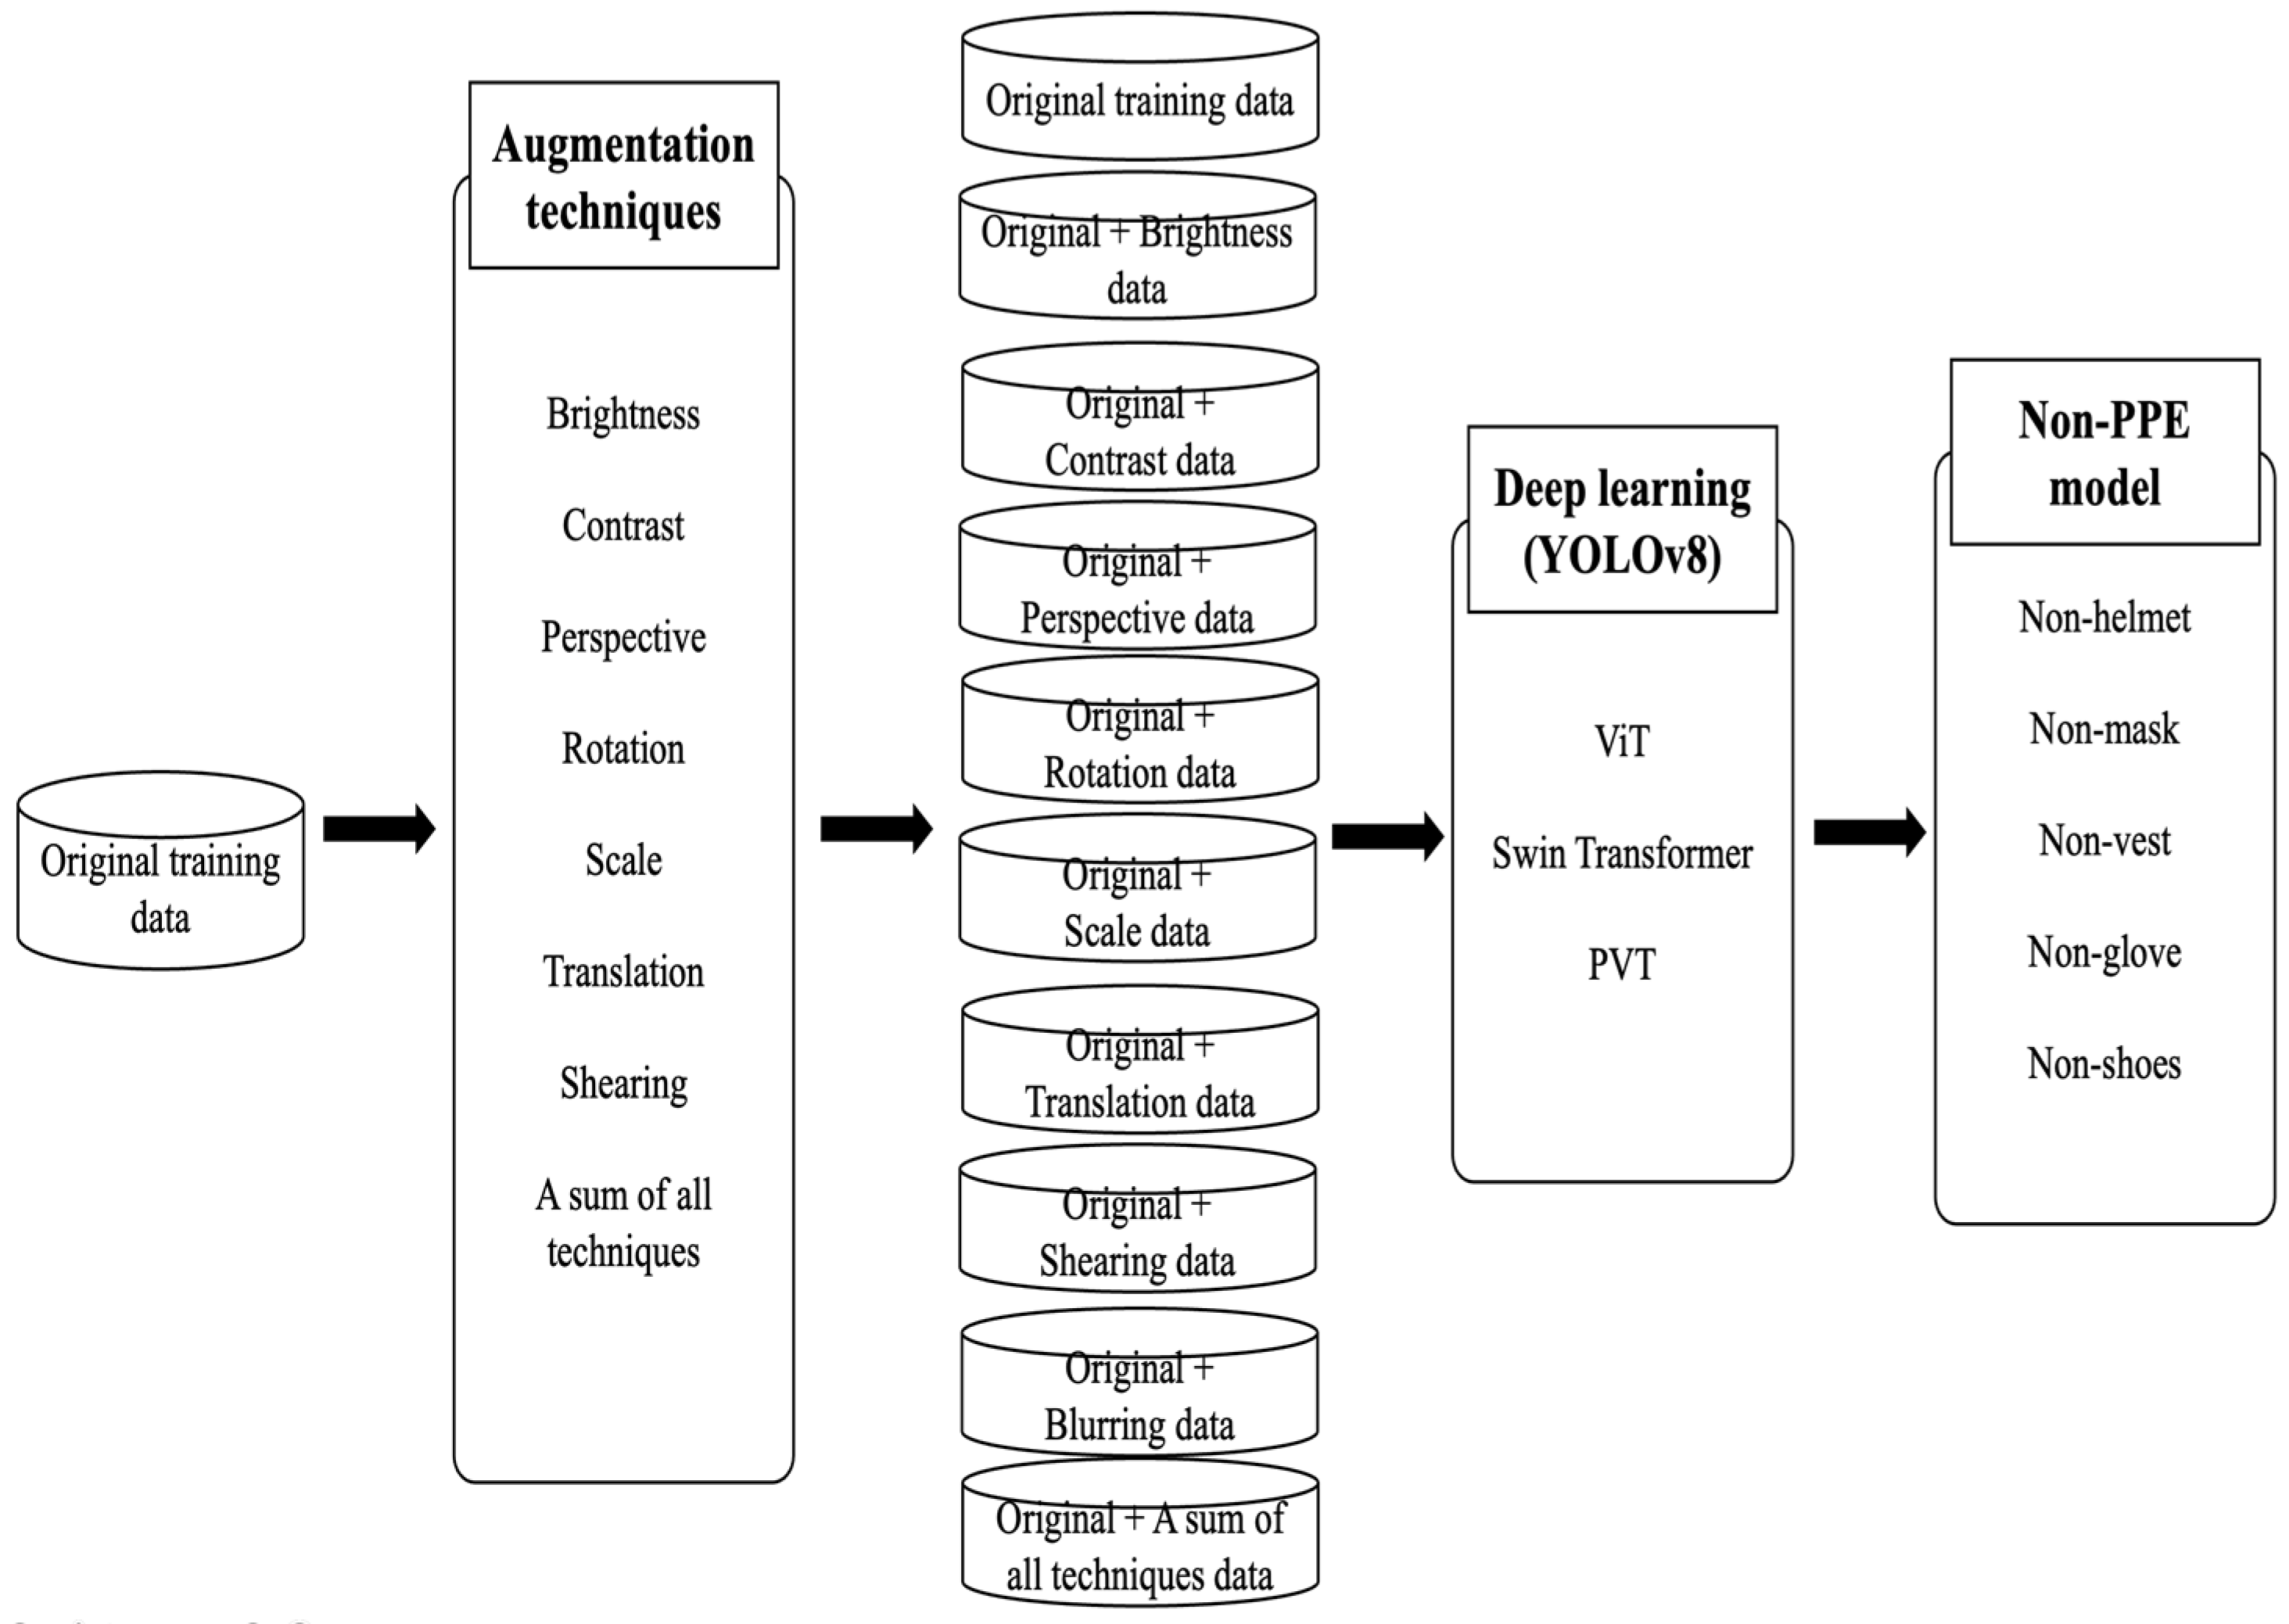
The objective of this research is to investigate how different image augmentation methods influence non-PPE detection in deep learning models. Eight distinct techniques—brightness, contrast, perspective, rotation, scale, shearing, translation, and a combined approach—are used to enhance the original training data. Figure 1 illustrates the methodological workflow, demonstrating how each augmentation (applied both individually and in combination) is integrated into the dataset. The resulting augmented datasets, along with the original dataset, are then employed to train models for detecting non-PPE on construction sites. Model performance is evaluated across various classes and architectures, comparing outcomes with and without the proposed augmentations. The following chapter details the rationale behind selecting these augmentation methods, their expected effectiveness, and the underlying mathematical principles.

Figure 1.
Workflow of experiment with proposed augmentation techniques.
3.1. Brightness Adjustment
In real-world construction environments, images of non-PPE scenarios are captured under varying lighting conditions caused by factors such as weather, the time of day, or indoor/outdoor transitions. These variations can significantly affect the visibility of key features in the scene, potentially hindering the model’s ability to accurately detect and classify instances of non-PPE. Brightness augmentation compensates for these fluctuations by adjusting the overall intensity of the image, thus producing outputs ranging from dark to bright [21]. Formally, brightness adjustment is modeled in Equation (1):
where is the brightness-adjusted image, is the original image, and is a matrix (of the same dimensions as , representing the brightness shift. Adding or subtracting modifies the pixel intensities in , creating new images under varied lighting conditions. Figure 2 provides an example in which the left image is brightened by +40, and the right image is darkened by −20.
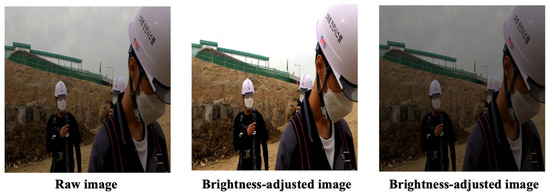
Figure 2.
Examples of images with brightness augmentation.
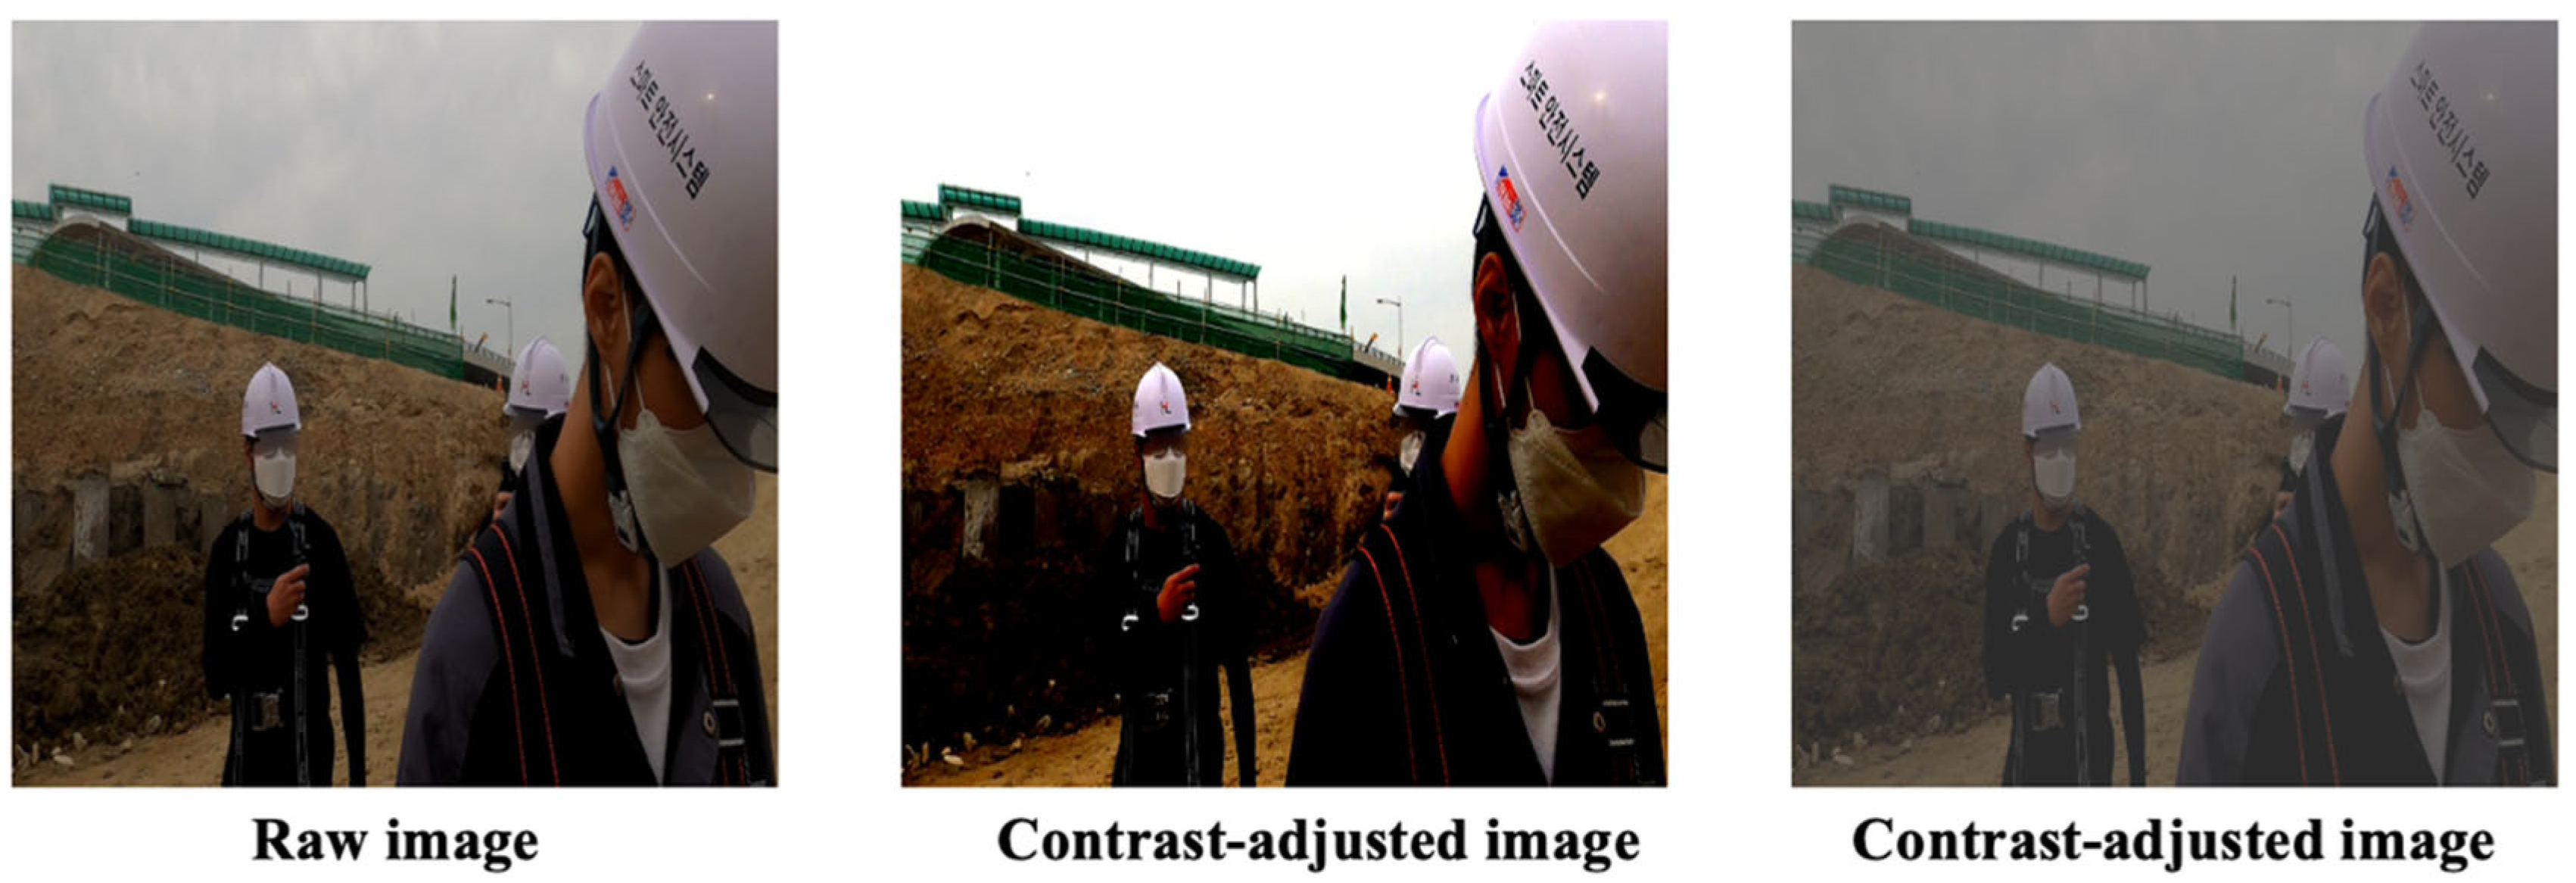
3.2. Contrast Adjustment
Non-PPE detection often relies on discerning subtle features within potentially cluttered or low-visibility construction environments. Varying the contrast during training helps the model learn to detect edges and boundaries under different contrast levels, ensuring that it can accurately distinguish non-PPE elements even when lighting or background conditions reduce the natural contrast in real-world images.
Mathematically, contrast adjustment scales pixel intensities relative to the image’s mean, as shown in Equation (2):
where is the intensity at pixel in the original image, is the contrast scaling factor, is the average intensity over all pixels in , and is the new intensity. Values of > 1 increase contrast, and < 1 decrease contrast, while adding the mean back maintains the overall brightness. Figure 3 shows the following examples: the left image has = 1.5, and the right image has = 0.5.

Figure 3.
Examples of images with contrast augmentation.
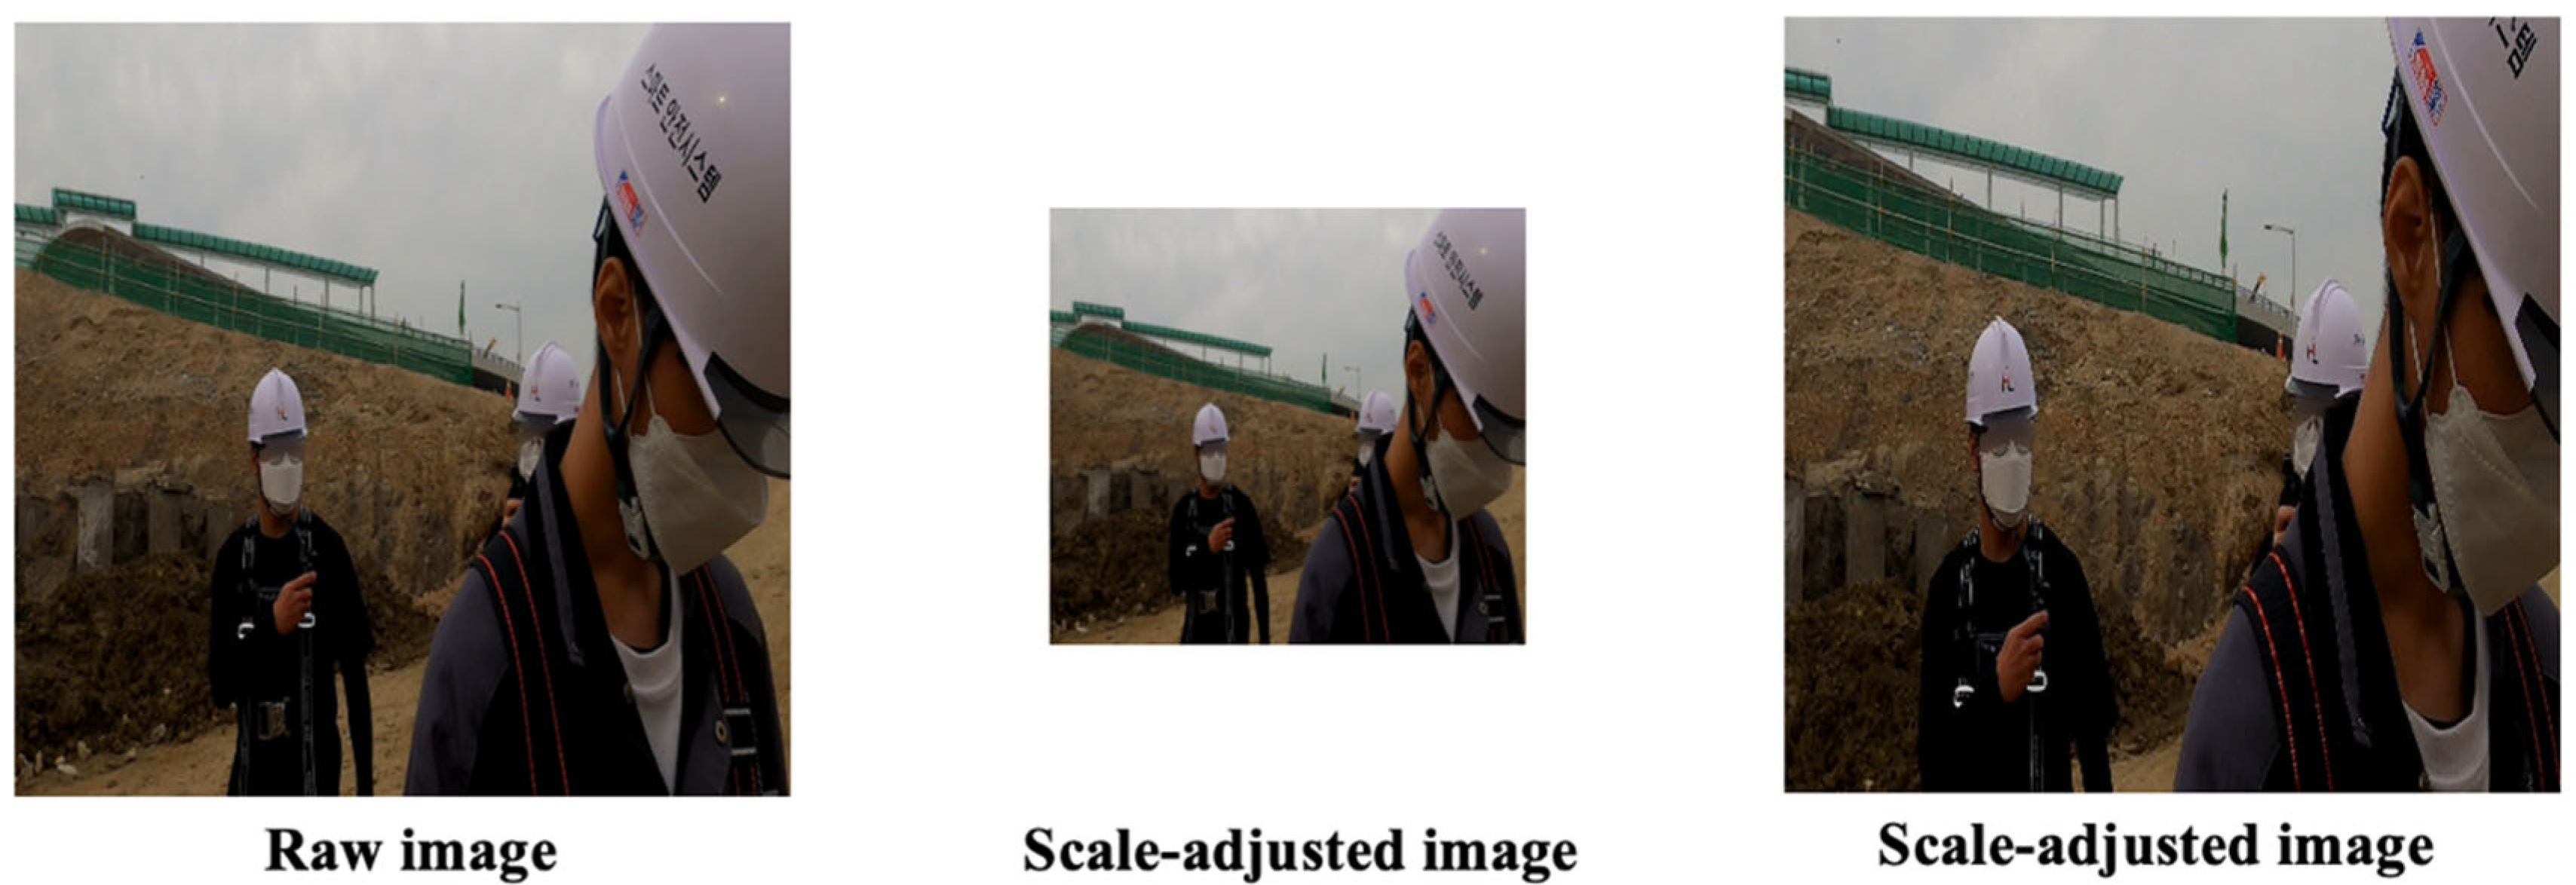
3.3. Scale Adjustment
Scale augmentation helps the model learn to detect non-PPE items across varying distances so that even if a worker is very close to or far from the camera, the detector can still correctly identify missing equipment. Moreover, by training the model on images where objects are artificially resized, it becomes better at handling diverse perspectives encountered on real construction sites, maintaining performance despite changes in object size. By resizing the image dimensions along the and axes, scale augmentation simulates how non-PPE might appear when photographed from different distances. The transformation is described by Equation (3):
where and are the transformed coordinates, and and are scaling factors for the horizontal and vertical axes, respectively [22]. Values greater than 1 enlarge the image, whereas values less than 1 shrink it. Figure 4 demonstrates the following examples: the left image is reduced with = 0.7 and = 0.8, and the right image is enlarged with = 1.3 and = 1.8.
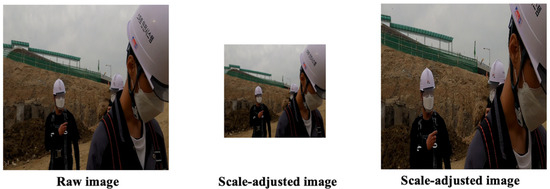
Figure 4.
Examples of images with scale augmentation.
3.4. Perspective Transformation
Construction-site images often exhibit perspective distortions due to limited camera vantage points. Perspective transformation is an augmentation technique that modifies the image view by applying a homography matrix, simulating the appearance of the scene from different angles or positions. By training on these altered viewpoints, the model becomes more adept at recognizing objects and identifying non-PPE from a range of perspectives—a critical capability for accurate detection. The transformation is expressed by Equation (4):
where are the original coordinates, the transformed coordinates, and the normalization factor. Parameters and introduce the perspective warp. In practical implementations, a “scale” parameter is often used to control corner shifts, sampled from a normal distribution [23,24]. Figure 5 shows raw and perspective-modified images: the left image uses a scale parameter of 0.13, while the right image uses 0.17.
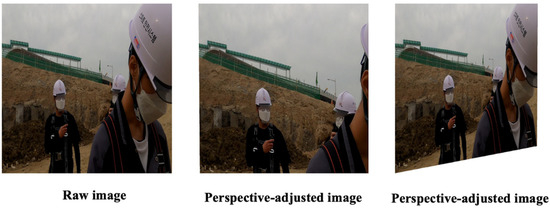
Figure 5.
Examples of images with perspective augmentation.
3.5. Rotation Augmentation
Rotation augmentation is vital in non-PPE detection tasks because workers and site elements might be viewed from various angles, causing objects to appear tilted or rotated in the image. By randomly rotating images during training, the model adapts to these orientation changes, improving its ability to detect non-PPE items regardless of how they are angled. Furthermore, exposing the model to a variety of rotated perspectives helps it avoid overfitting to a single orientation. The operation is described by Equation (5):
where are the original coordinates, is the rotation angle, is the pixel intensity at , and is the pixel intensity at the rotated coordinates [25]. Figure 6 illustrates two examples of rotation: the left image is rotated by –10, while the right image is rotated by +15.
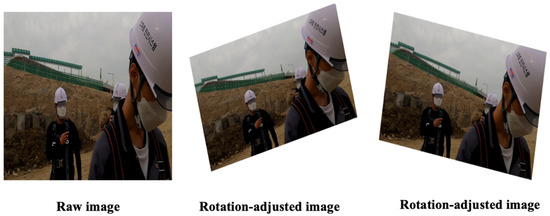
Figure 6.
Examples of images with rotation augmentation.
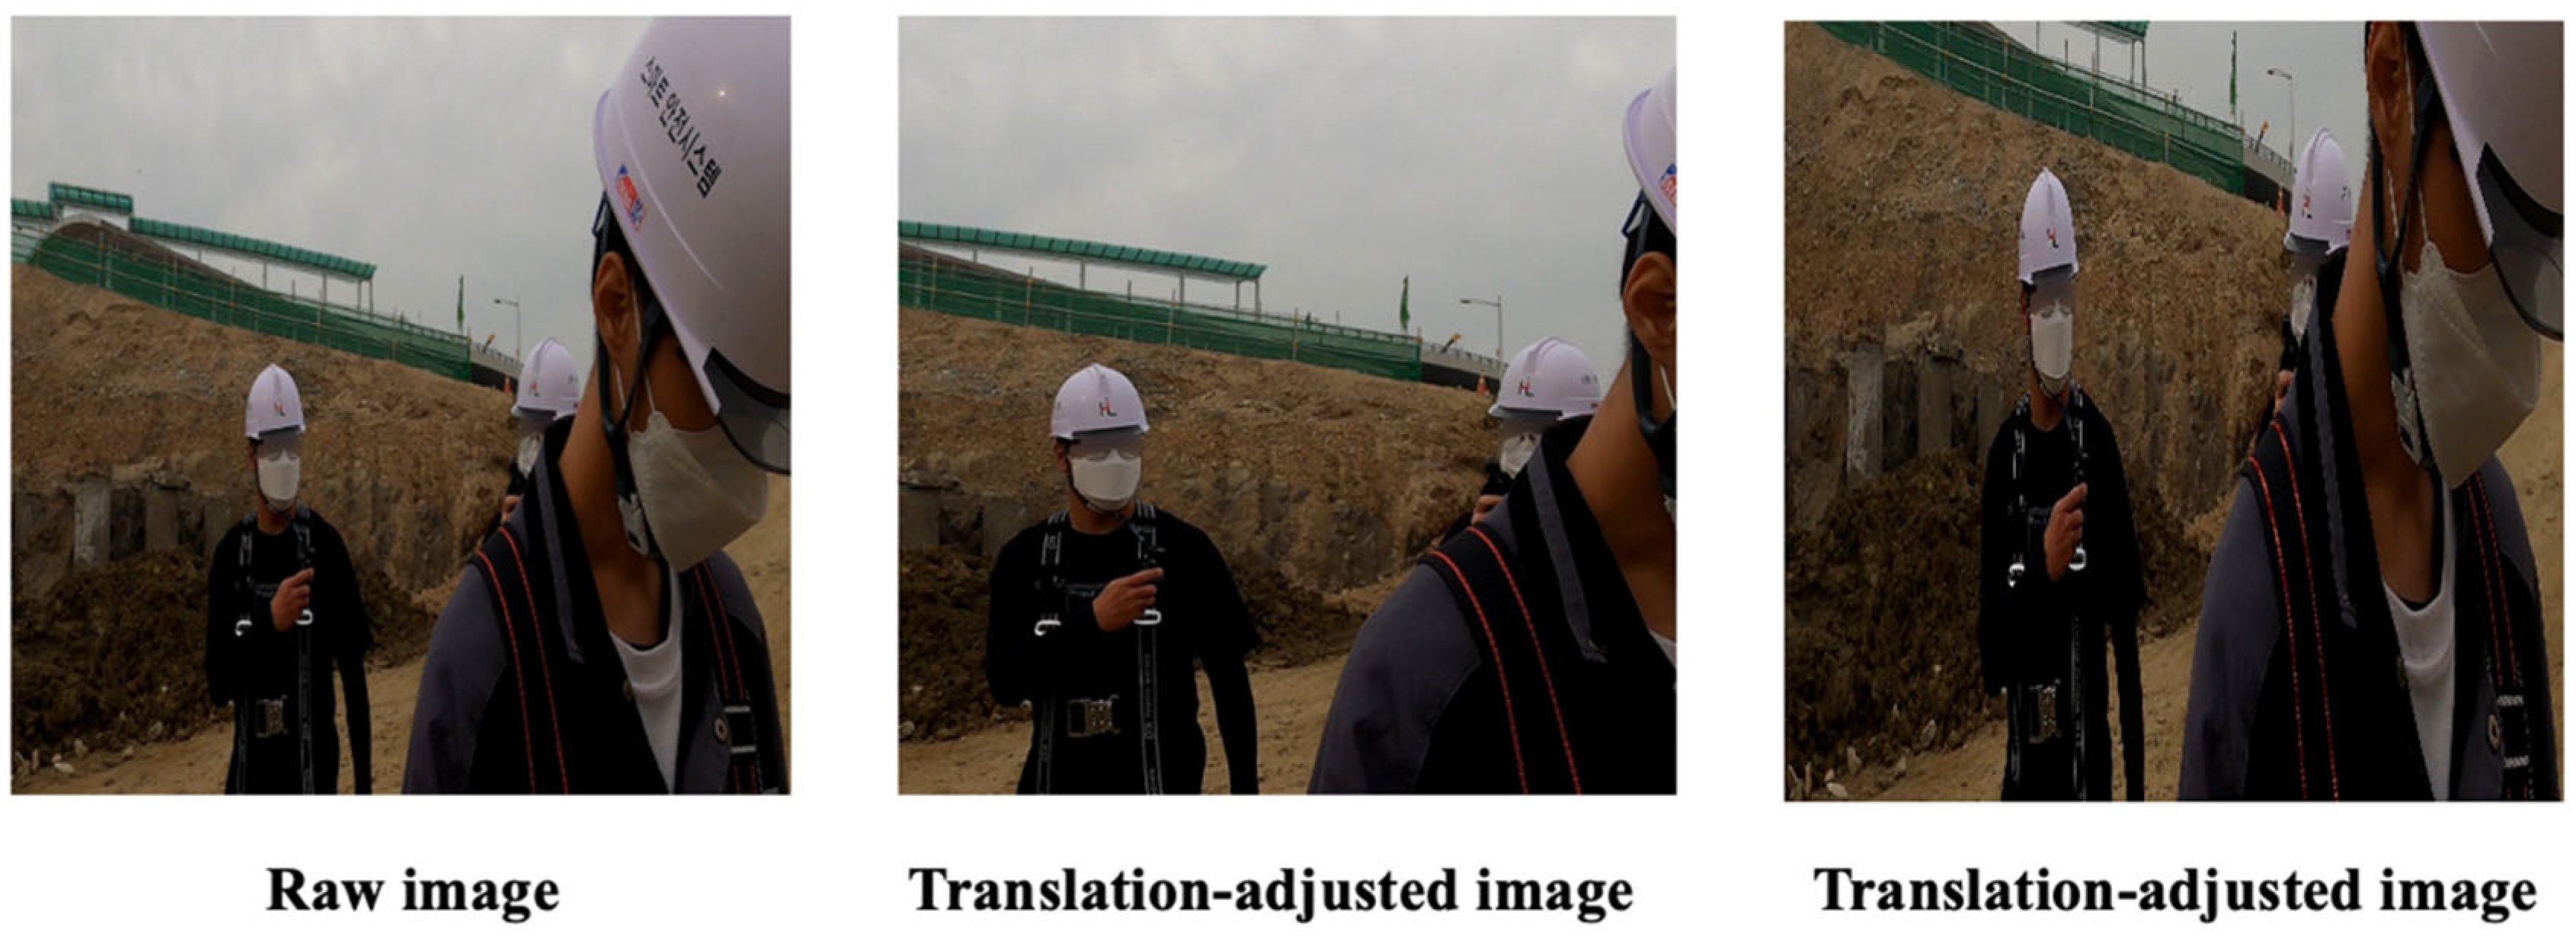
3.6. Translation Augmentation
On construction sites, movement by either the camera or the subject can cause objects to appear at different locations within the frame, resulting in translational variation. For example, a camera might capture a worker from various horizontal or vertical viewpoints depending on its position, or the subject could shift between panoramic shots. Translation augmentation, which alters the whole object’s position in an image by shifting it along the or -axis, enriches a dataset by mimicking these positional changes [26]. This approach bolsters a model’s capacity to detect non-PPE items regardless of where they appear in the image. The translation transformation can be mathematically expressed by Equation (6):
where denote the original coordinates, and are the translation distances, and is the pixel intensity at the shifted coordinates. Figure 7 presents an example: the left image is shifted right by = 0.7 and = 0, while the right image is shifted both right and downward with = 1.1 and = 1.5.

Figure 7.
Examples of images with translation augmentation.
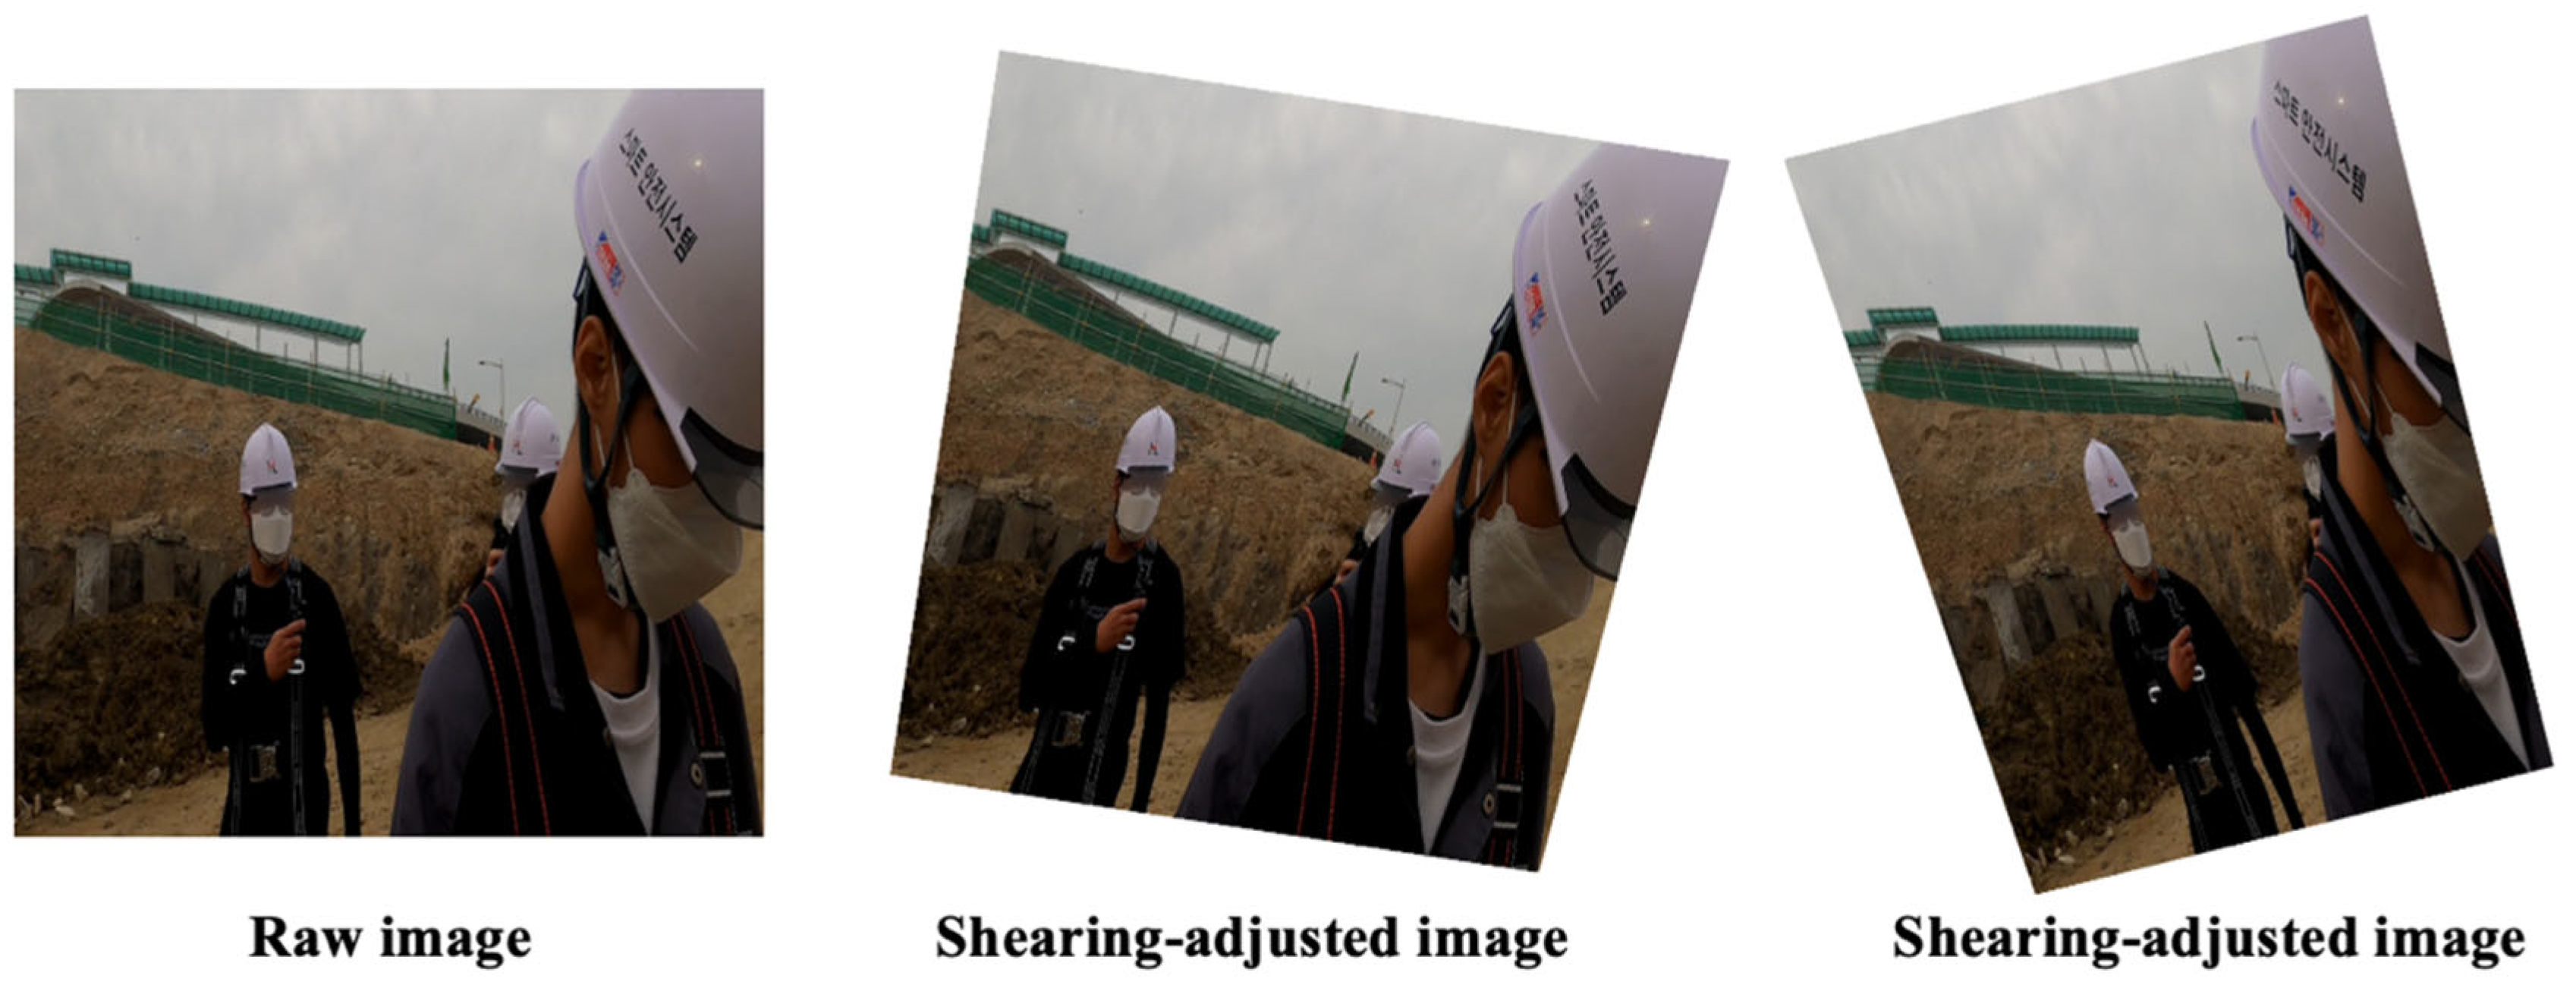
3.7. Shearing Augmentation
Shear augmentation is crucial in non-PPE tasks because construction-site images often feature oblique camera angles that skew parallel lines, making objects appear distorted. By simulating this skew during training, the model learns to recognize non-PPE items even when they are viewed from tilted or offset perspectives [27]. Additionally, this augmentation broadens the training data to capture the varied geometries present in real-world construction environments, thereby improving the model’s resilience to the myriad distortions that can arise on site. Horizontal shearing is defined by Equation (7):
Additionally, vertical shearing is defined by Equation (8):
where and are the shear factors for horizontal and vertical distortions, respectively. Figure 8 shows examples: the left image uses = 15 and = 20, and the right image uses = 20 and = 30.
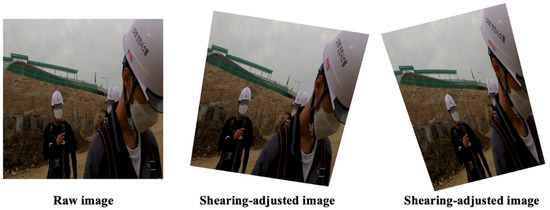
Figure 8.
Examples of images with shearing augmentation.
3.8. Evaluation Method: AP
In the realm of object detection, average precision (AP) is a commonly accepted metric for assessing accuracy. AP quantifies the average precision over all recall values ranging from 0 to 1 at different Intersection Over Union (IOU) thresholds. IOU is the ratio of the overlapping area between the predicted bounding box and the ground truth bounding box to the total area occupied by both boxes. AP is determined using the formula in Equation (9), where n is the total number of detected bounding boxes, i is the rank of a particular detected bounding box, p(i) is the precision value from the first to the i-th detection, and Δr(i) is the change in recall values between the (i − 1)-th and i-th detection [28].
AP50 measures the model’s ability to detect non-PPE items when the predicted bounding box overlaps with the ground truth by at least 50% (IOU ≥ 0.5). This threshold ensures that objects are recognized correctly, even if the bounding box alignment is not precise. By contrast, AP50:95 averages the model’s performance across IoU thresholds ranging from 0.50 to 0.95 in increments of 0.05, capturing increasingly strict localization requirements. In densely packed scenarios where non-PPE items are close together, tighter bounding boxes help differentiate individual objects and avoid misclassifications. Both metrics are used in this study to provide a comprehensive evaluation of model performance.
4. Experiment
4.1. Dataset Preparation
4.1.1. Original Dataset
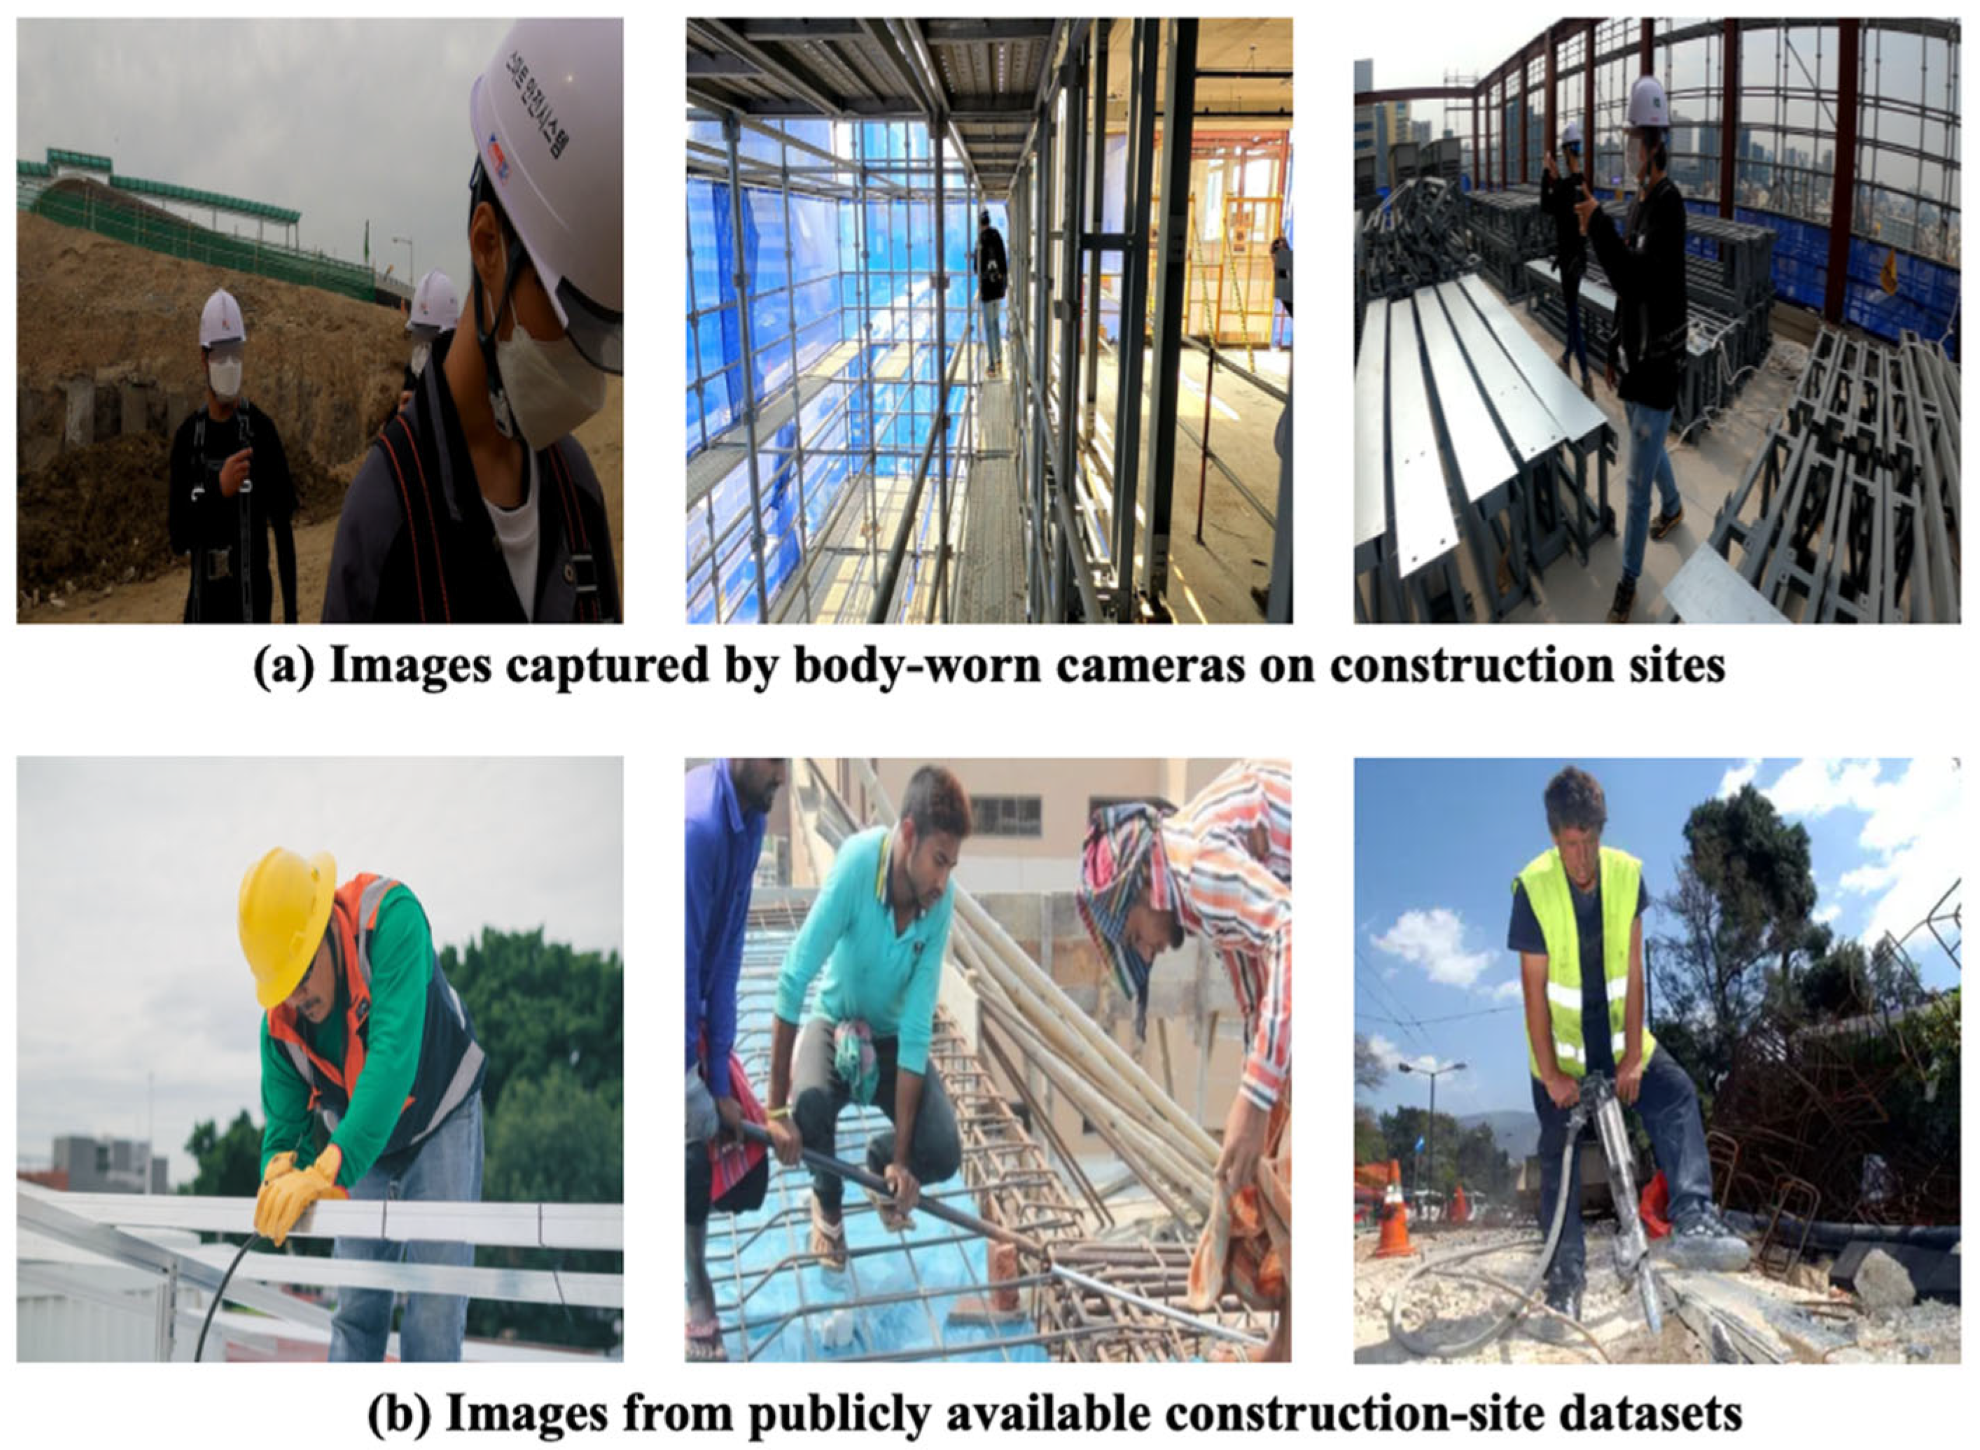
In this study, data were acquired from two principal sources: on-site collection and publicly available datasets. Detecting non-PPE poses a unique challenge because real-world imagery often depicts workers fully equipped with PPE, yet identifying instances where PPE is missing is vital. For the on-site component, data were gathered from five construction sites in South Korea by mounting a GoPro HERO9 Black camera on the helmets of 35 workers during peak hours. Video footage was recorded continuously, and frames were extracted at regular intervals to capture authentic site conditions (Figure 9a).
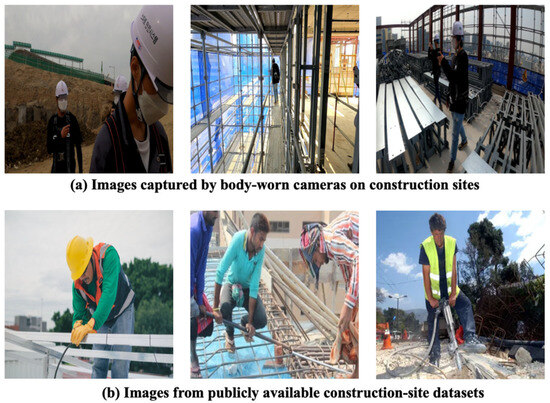
Figure 9.
Example images of constructed datasets.
Although the initial data-collection effort yielded 54,329 images, a balanced sampling strategy was applied to ensure adequate representation of both fully compliant (all PPE worn) and non-compliant (missing PPE) scenarios, reducing the on-site dataset to 1207 images. In addition, two publicly available construction datasets were incorporated: 530 images from the Safety Helmet Wearing Dataset (SHWD) [29] and 565 images from the Safety Helmet Computer Vision Project (SHCVP) [30]. These resources broadened the range of visual contexts for non-PPE detection. Overall, 2302 images were compiled from both the on-site collection and public sources, with illustrative examples shown in Figure 9b.
4.1.2. Data Split
Only the camera dataset (2302 images) was randomly split into training, validation, and testing subsets at a 60:20:20 ratio, resulting in 1382 images for training, 460 for validation, and 460 for testing. This random approach helped ensure that each subset remained representative of an unbiased dataset.
4.1.3. Augmenting the Training Datasets
The parameter of image augmentation techniques affects the quality of images for improving the accuracy. The parameters utilized were chosen through a trial-and-error process to generate images that are as realistic as possible. The dataset, with a detailed range of parameters, is presented in Table 1. For brightness adjustment, pixel intensity was randomly altered by adding a value between −50 and +50 to the intensity of the original images. The contrast level for the augmented images was modified by randomly varying the alpha value (α) within a range from 0.3 to 2.3.

Table 1.
The used techniques with parameter and generated images.
In scale augmentation, images were independently scaled along the x and y axes to random values ranging from 80% to 120% of their original size. The perspective changes were simulated through transformation by adjusting the “scale” parameter, with assigned ranges for these elements from 0.03 to 2.3, applied randomly and independently to each image. Rotation augmentation involved rotating the original images by a degree between −25 to +25, with the rotation parameter denoted by . For translation, the extent and direction of image shifting were controlled by adjusting and , allowing for horizontal and vertical movement within a range of −0.2 to +0.2 times the image’s dimensions. Shearing augmentation was executed within a −15 to +15 degree range, introducing a skew to the image features. This was achieved by modifying the shearing parameters and .
Geometric transformations like scaling, rotation, perspective shifts, translation, and shearing can push portions of the image beyond its original boundaries, creating “voids” without any data. Conversely, some regions may compress and overlap, forming gaps. Because deep learning models generally require inputs in standardized dimensions, the augmented images must maintain the same size. In this work, any voids in reduced images were filled with pixels of value 255, effectively padding these areas with white pixels.
As indicated in Table 1, the original training set contained 1382 images, which were expanded using a range of augmentation techniques (brightness, contrast, scaling, perspective, rotation, translation, and shearing). This process generated 9674 augmented images, bringing the total to 11,056 images when combined with the originals.
4.1.4. Annotation
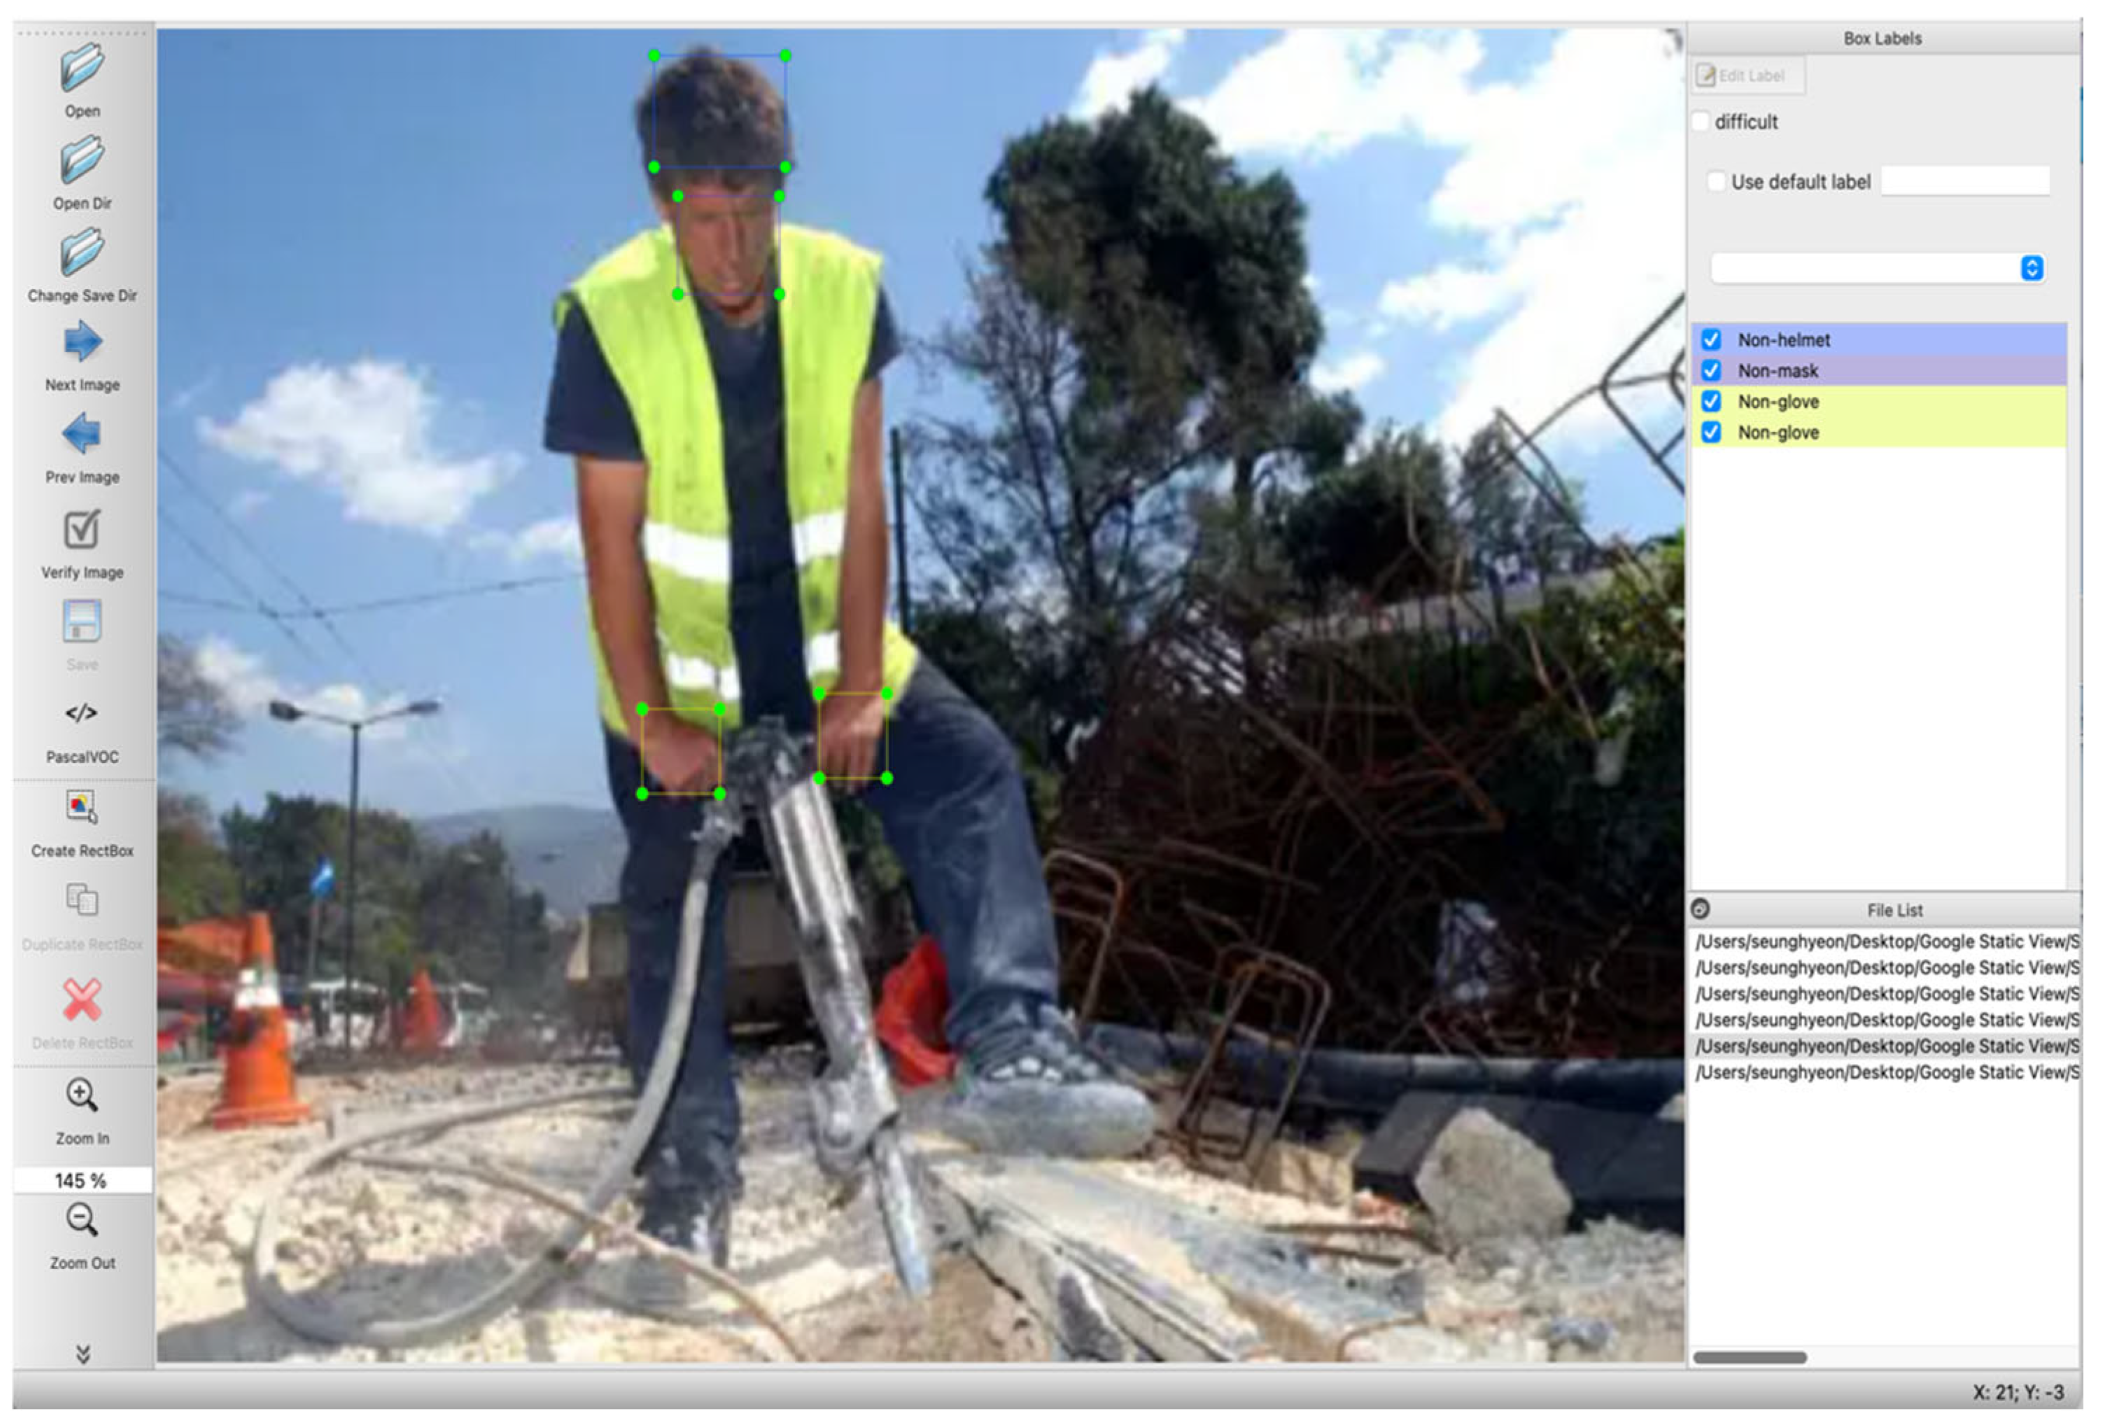
Each instance of non-PPE was annotated by drawing rectangular bounding boxes around “Non-helmet”, “Non-mask”, “Non-glove”, “Non-vest”, and “Non-shoes”, while all remaining regions were designated as “background”. Labeling was used for this process, generating labels in VOC XML format. An example of the annotation procedure is presented in Figure 10.

Figure 10.
Examples of annotation process for detecting non-PPE.
4.1.5. Synthesis of Final Dataset
To evaluate the proposed methods, construction-context and general-context datasets were assembled and then split into training, validation, and test sets. Each image was labeled according to its non-PPE category (“Non-helmet”, “Non-mask”, “Non-glove”, “Non-vest”, or “Non-shoes”). Table 2 offers a detailed overview of these annotated data, including the per-class distribution within each dataset.
Table 2.
Comprehensive dataset distribution.
4.2. YOLOv8 for Non-PPE Detection
In many fields, including construction, YOLO-based methods rank among the most widely adopted for object detection [11,31,32]. Over successive releases, YOLO has undergone significant enhancements, culminating in YOLOv8, which was chosen here for its high accuracy and flexibility. Compared to earlier versions, YOLOv8 offers substantial improvements in feature extraction and resilience to varied object sizes and occlusions, with its modular design allowing extensive customization—particularly in selecting a backbone architecture for balancing detection accuracy and computational efficiency [6].
Building on this foundation, three prominent transformer-based backbones—Vision Transformer (ViT), Swin Transformer, and Pyramid Vision Transformer (PVT)—are integrated, each recognized for robust performance across diverse object detection tasks [33,34,35]. Although YOLOv8 has thus far seen less application in construction environments than other YOLO variants, these backbones offer complementary approaches to feature extraction: ViT employs a patch-based global attention mechanism but can be computationally demanding at high resolutions, Swin Transformer adopts a hierarchical, windowed attention structure for improved scalability, and PVT utilizes a progressive shrinking pyramid to balance accuracy and efficiency.
Finally, to detect the presence of non-PPE, the final classification layer in each backbone was adapted to distinguish six classes—“Non-helmet”, “Non-mask”, “Non-glove”, “Non-vest”, “Non-shoes”, or “background”—reflecting the range of non-PPE categories relevant to construction-site safety.
4.3. Transfer Learning
Training a deep learning architecture from the ground up often requires a substantial amount of time and a vast dataset. An effective alternative is to employ a pre-trained model, which is a model that has been previously trained on a dataset and developed for use [36,37]. Such a model can apply the features it has already learned to new, diverse tasks. In this particular study, the researchers used ImageNet, a dataset created for scholarly pursuits in the field of computer vision [38]. With its extensive collection of more than 14 million images encompassing a wide array of categories including buildings and people, ImageNet was an ideal choice for pre-training the feature extraction component of the selected architectures in this research.
4.4. Hyperparameter Tuning
Deep learning models often require tuning numerous hyperparameters to achieve high accuracy, with performance varying considerably across different configurations [39]. However, this study is not focused on maximizing accuracy through exhaustive hyperparameter optimization; rather, it aims to assess how image augmentation influences the detection of non-PPE on construction sites. Consequently, only a few core hyperparameters were adjusted. Specifically, the batch size was fixed at 2 to accommodate the GPU’s memory constraints, and the training was conducted for 20,000 epochs to strike a balance between avoiding undertraining and excessive computational time. This setup sufficiently demonstrates the effectiveness of the proposed approach without overemphasizing hyperparameter fine-tuning.
4.5. Experimental Settings
All experiments were performed on a Windows 10 system, powered by an Intel Core i7-7700HQ (Intel, Santa Clara, CA, USA) processor with a clock speed of 2.80 GHz and eight cores. The hardware included an NVIDIA GeForce GTX 3080 Ti GPU and 32 GB of RAM (NVIDIA, Santa Clara, CA, USA). For the deep learning tasks, TensorFlow 1.8 was used in conjunction with Python 3.7. Image augmentation was executed using the imgaug 0.4.0 library. In this research, the augmentation techniques were implemented using the imgaug library [24], ensuring that the same methods and parameters can be r reproduced.
5. Results and Discussion
In these evaluation results, the effects of augmentation techniques on overall accuracy are assessed, alongside an analysis of class-level AP50 and AP50:95 performance. Additionally, the test results of the best-performing model are examined and discussed in relation to these findings.
5.1. Impact of Augmentation on Average Accuracy
Table 3 indicates that PVT consistently exhibits the highest performance, with initial (unaugmented) values of AP50 = 70.05 and AP50:95 = 38.47, surpassing ViT (68.42 and 37.25) and Swin Transformer (69.35 and 38.16). Augmentation techniques generally improve results for all three architectures, although their impact varies. Brightness and scale emerge as notably effective single augmentations, delivering clear gains over the baseline—for instance, brightness increases PVT’s AP50 from 70.05 to 73.12 and AP50:95 from 38.47 to 40.82—while translation offers more modest benefits, yielding values close to the original baseline. When combining all listed techniques, each model attains its highest accuracy, with PVT again leading (AP50 = 72.55 and AP50:95 = 40.92), followed by Swin Transformer and ViT. These observations suggest that image augmentation substantially enhances object detection performance, with both brightness and scale demonstrating particularly pronounced effects, while PVT retains an overall performance advantage.
Table 3.
Comparison results of average performance across different architectures under augmentation.
From an architectural perspective, each backbone’s design influences how it interacts with these augmentations. ViT employs a patch-based global attention mechanism that can be more sensitive to local distortions (e.g., translation), whereas Swin Transformer’s hierarchical windowed attention structure handles local shifts more gracefully. Meanwhile, PVT’s progressive shrinking pyramid design effectively captures both global context and local detail, enabling stronger robustness to a range of augmentations.
5.2. Impact of Augmentation on Class-Specific Level: AP50
As shown in Table 4, examining the class-specific AP50 results reveals that each augmentation technique produces variable improvements across the “Non-helmet”, “Non-mask”, “Non-glove”, “Non-vest”, and “Non-shoes” categories. Notably, “Non-helmet” detection lags behind other classes for all three architectures, underscoring the difficulty of accurately identifying helmets relative to other PPE types. Among the various augmentations, brightness emerges as the most effective, yielding higher average AP50 scores than even the sum of all techniques. Scale also contributes substantial gains, whereas translation and perspective offer comparatively modest benefits—suggesting that changes in object position or camera viewpoint are less critical for distinguishing PPE from the background in these datasets.
Table 4.
Class-wise performance of each augmentation technique with different architectures (AP50).
From an architectural perspective, each backbone’s design influences how it interacts with these augmentations. ViT’s patch-based global attention can be more sensitive to local distortions (e.g., translation), while Swin Transformer’s hierarchical windowed attention proves more resilient to shifts in object location and orientation. PVT’s progressive shrinking pyramid stands out by balancing efficiency and accuracy, leading to stronger gains when brightness and scale are applied. Indeed, PVT achieves the most pronounced per-class boosts, especially under brightness (e.g., from 66.35 to 68.66 in “Non-helmet” detection and 71.33 to 77.14 in “Non-shoes”). ViT and Swin Transformer likewise benefit from brightness and scale, though to a slightly lesser extent. While combining multiple augmentations still elevates performance above the unaugmented baseline, brightness alone remains the single most impactful method for enhancing AP50 in non-PPE detection.
5.3. Impact of Augmentation on Class-Specific Level: AP50:95
Table 5 presents the class-specific AP50:95 outcomes associated with various augmentation strategies in non-PPE detection tasks. Several notable patterns emerge. First, non-helmet detection remains consistently lower than that of other classes (e.g., non-mask or non-shoes) across ViT, Swin Transformer, and PVT, indicating that helmet recognition poses a greater challenge than identifying other PPE forms. Second, brightness augmentation yields the most pronounced gains in both the average AP50:95 and per-class performance. For instance, PVT improves from 38.47 to 40.82 with brightness, while ViT rises from 37.25 to 39.13. Third, scale augmentation also proves effective, often ranking second to brightness in boosting detection—especially for non-shoes, where variations in size and perspective are significant. In contrast, translation and perspective augmentations offer more modest improvements, possibly because minor positional or viewpoint shifts do not fully address key differences in color or scale. Finally, combining all techniques consistently produces the highest mean scores, suggesting that aggregating multiple transformations offers a more comprehensive simulation of real-world diversity and thus strengthens model generalization. Overall, these findings underscore the nuanced role of augmentation in refining class-specific detection accuracy, while also highlighting the particular difficulty of reliably detecting helmets.
Table 5.
Class-wise performance of each augmentation technique with different architectures (AP50:95).
5.4. Model Evaluation in Test Images
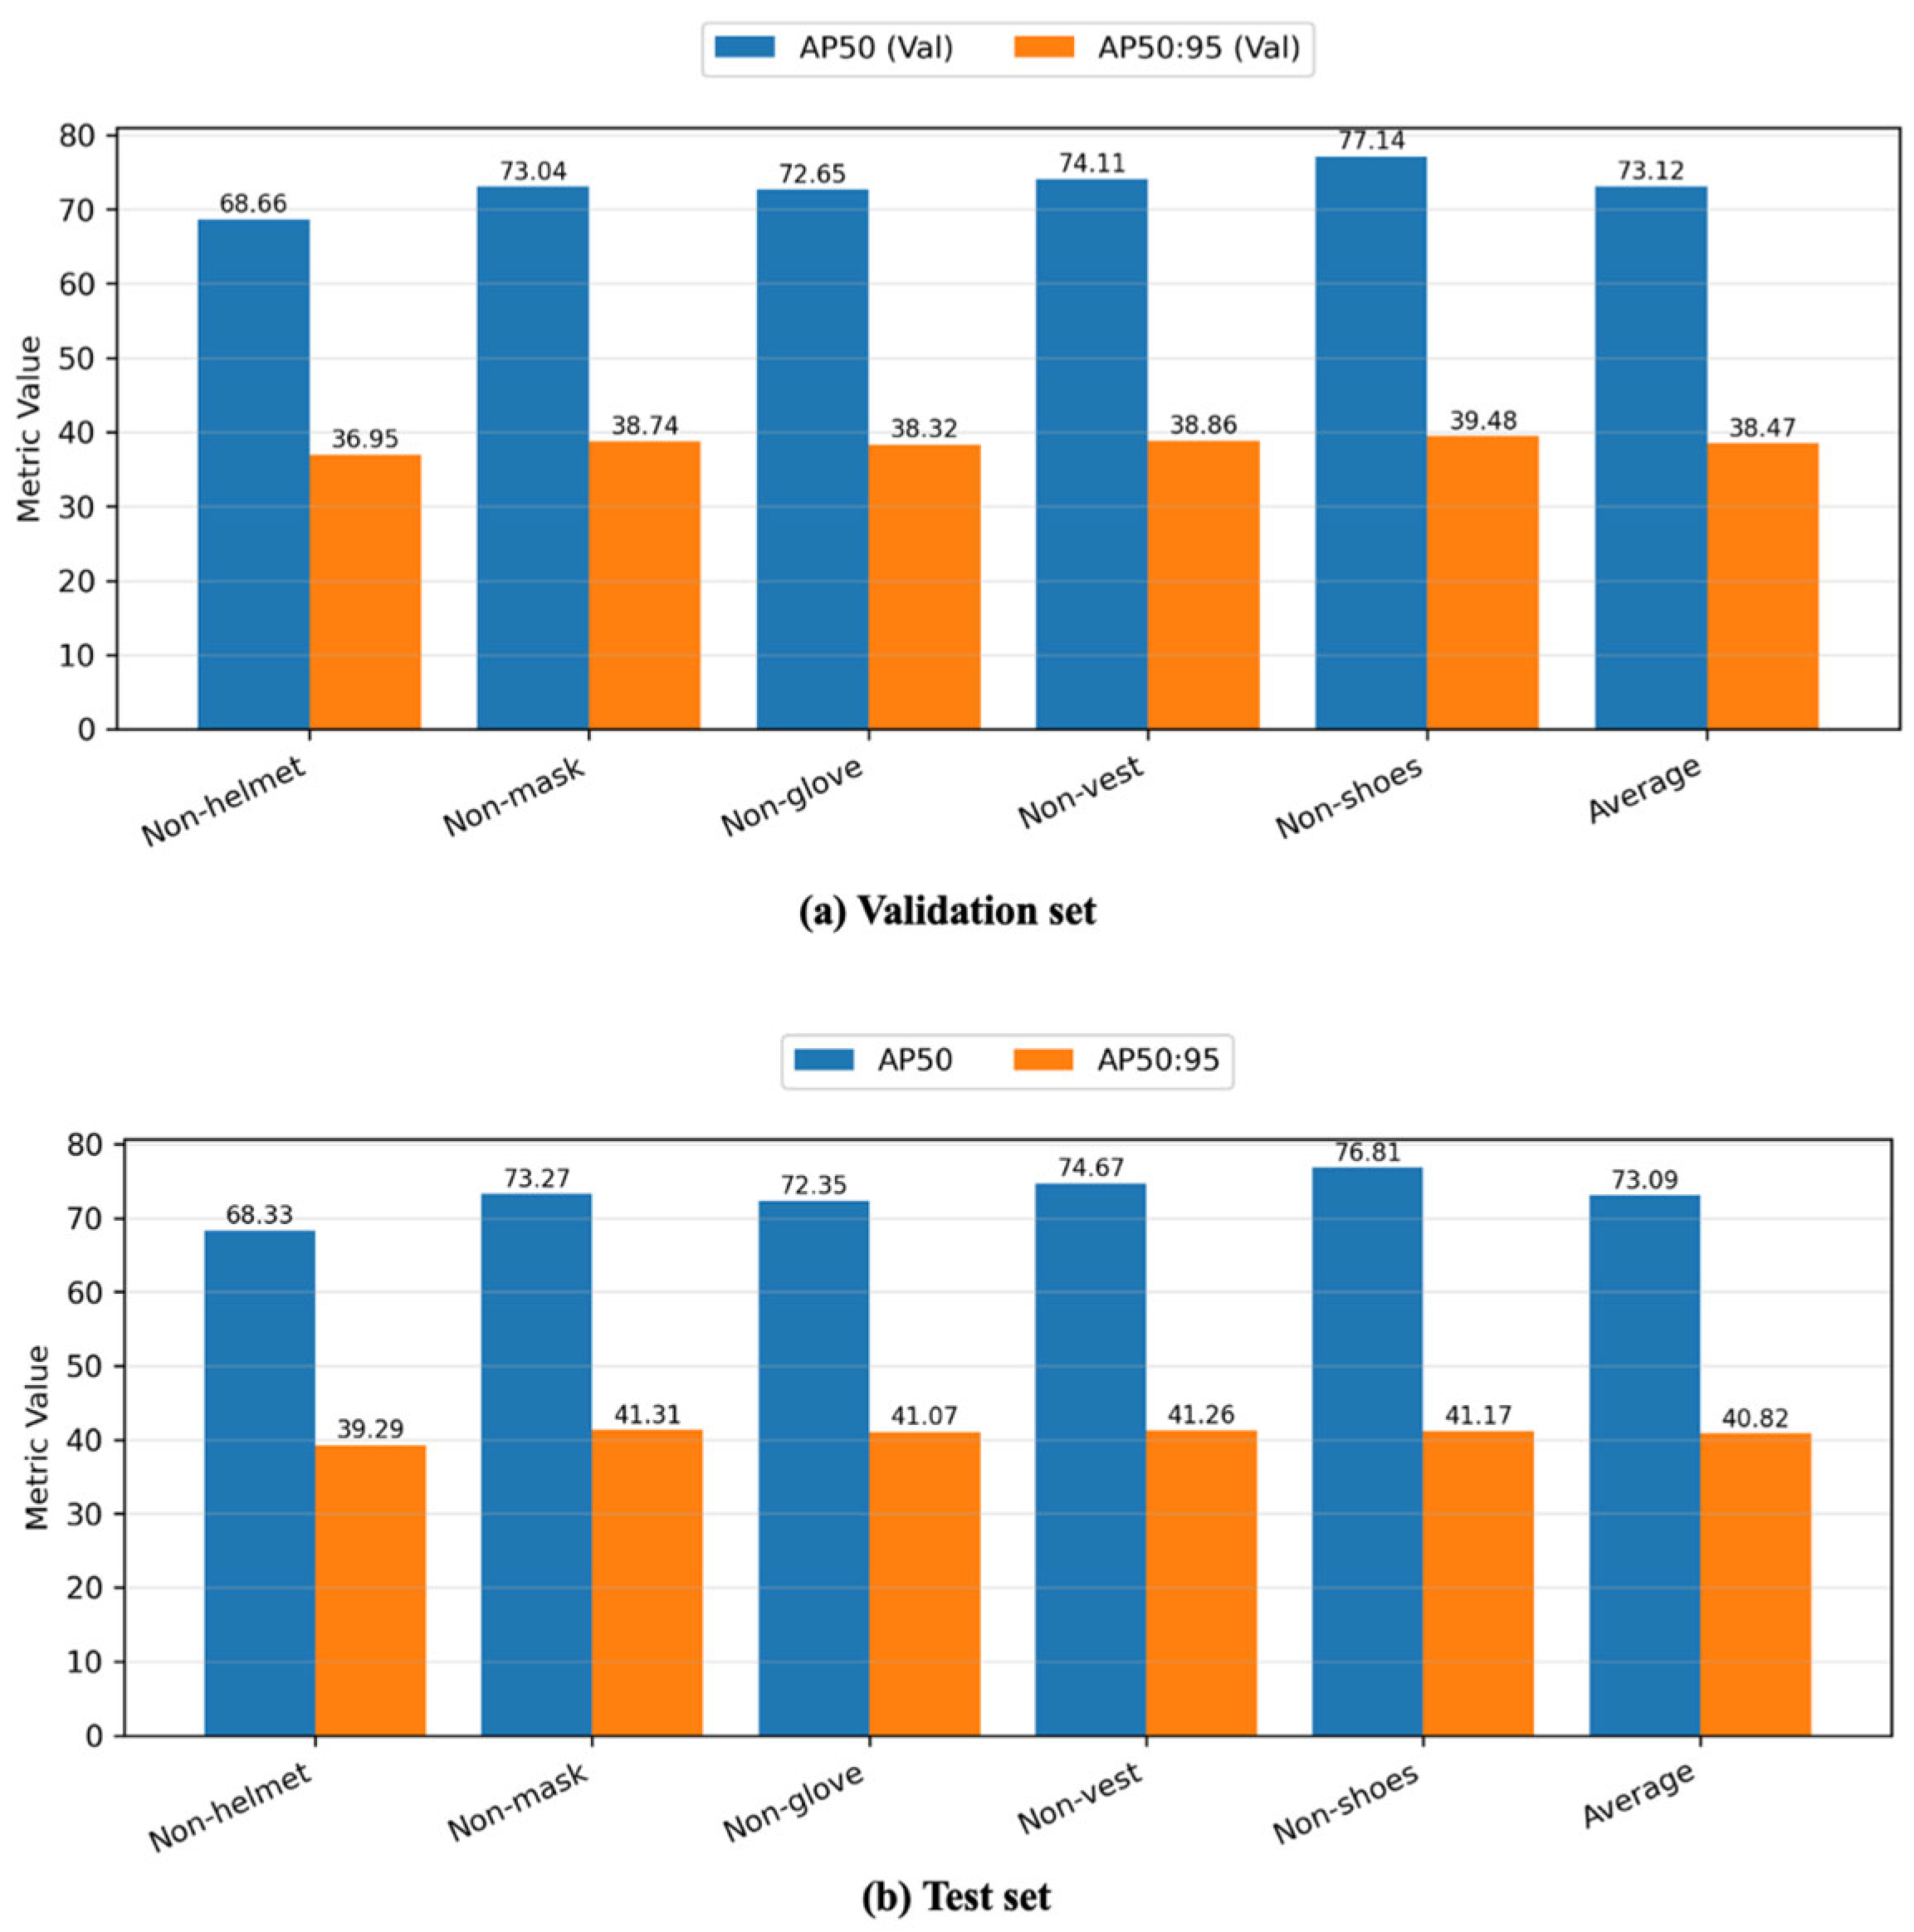
The best-performing model at the AP50 level was PVT with brightness augmentation, achieving an average AP50 of 73.12 on the validation set. This approach was chosen because, in non-PPE contexts, AP50 is typically more crucial than AP50:95 for practical detection purposes. Nevertheless, this same configuration did not produce the highest AP50:95; indeed, PVT combined with all augmentations reached an AP50:95 of 40.92, exceeding the brightness-only variant. Figure 11 illustrates the class-specific performance of the best model, with Figure 11a (Validation) and Figure 11b (Test) showing closely aligned results and indicating no signs of overfitting.

Figure 11.
Class-wise performance on validation and test set.
From the test set findings, non-helmet detection tends to yield lower accuracy in this study for several reasons. First, helmets are relatively small and often obscured by a worker’s body position or other site elements, making them harder to detect or classify. Second, helmets vary in shape, size, and color more than some other PPE items (e.g., vests), reducing the model’s ability to rely on consistent visual cues. Third, the head region can be partially covered by shadows or other obstructions, especially in busy or poorly lit construction environments. Finally, the dataset contains fewer examples of non-helmet instances compared to other non-PPE categories, which can limit the model’s exposure to distinctive “no-helmet” features during training.
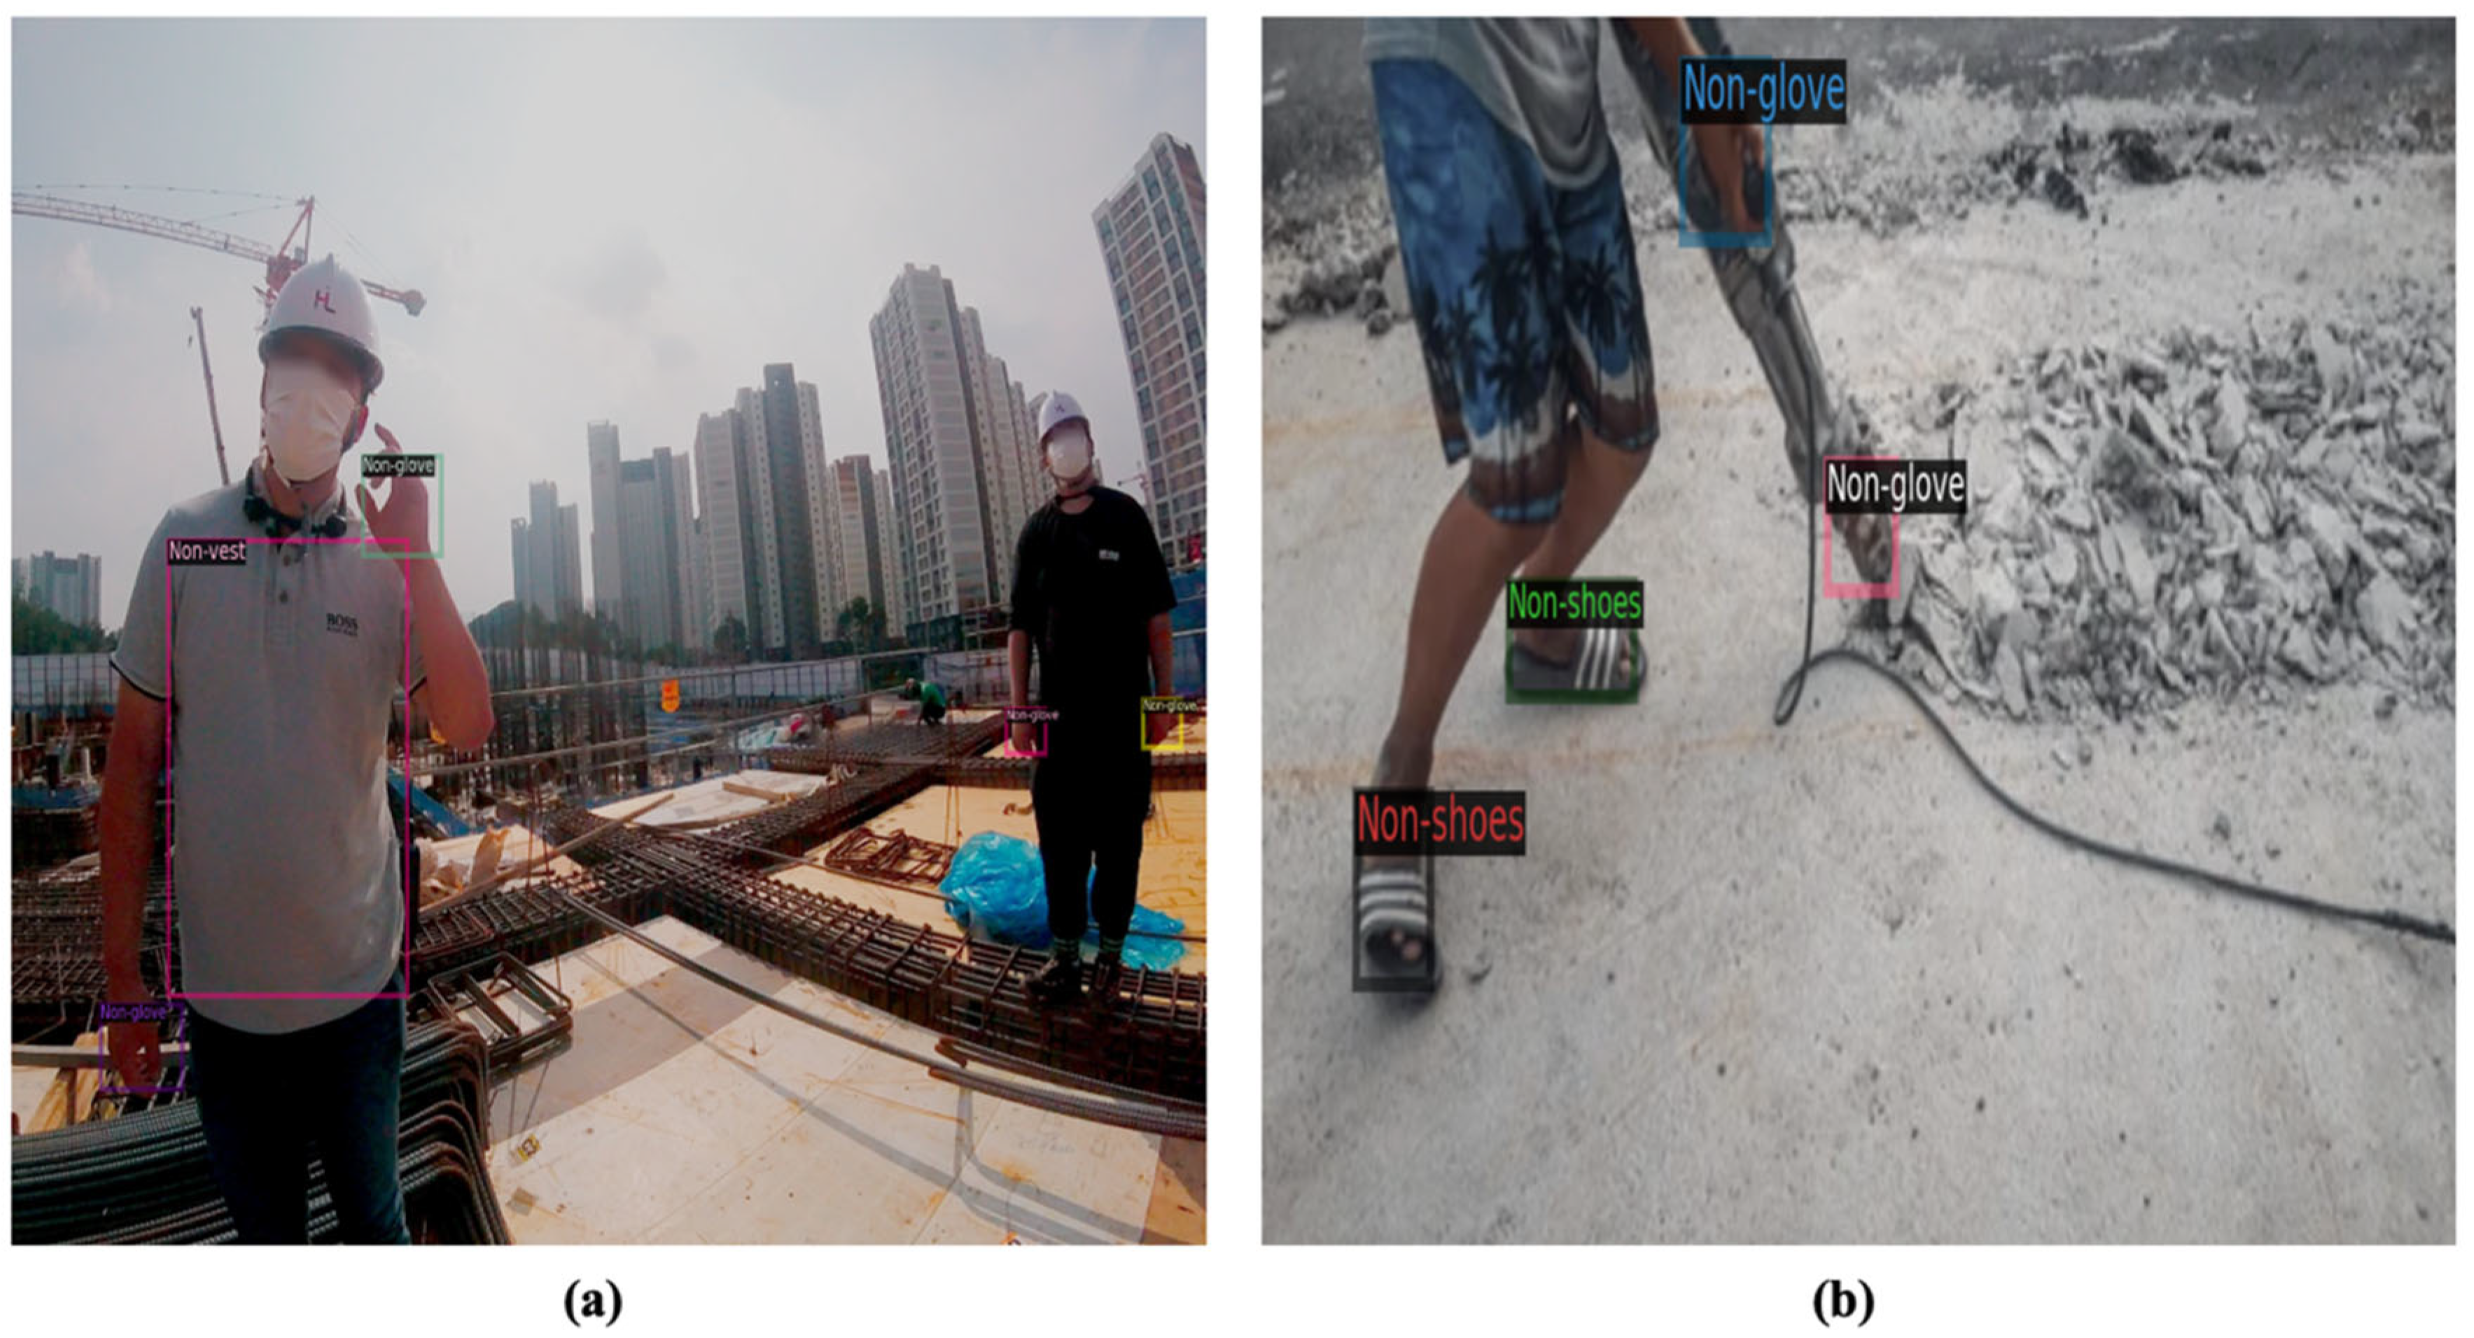
Figure 12 and Figure 13 present sample images illustrating high and low detection accuracies, respectively. In Figure 12a, two workers are shown in a partially completed interior space with unfinished walls, exposed ceilings, and scattered construction materials. The scene also includes construction tools and safety markers, such as a traffic cone, emphasizing that it is an active job site. The model correctly detects a missing mask and glove on the left worker and a missing vest and glove on the right worker. Figure 12b depicts four workers on an outdoor construction site where concrete is being poured. This environment appears more open-air, with scaffolding and wet concrete underfoot. All the missing PPE items in this scenario are accurately identified by the bounding boxes, highlighting the model’s effectiveness in diverse conditions.
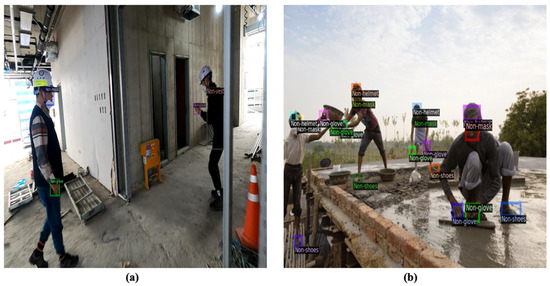
Figure 12.
Sample images of correct detection.

Figure 13.
Sample images of incorrect detection.
Figure 13a shows two workers on a high-rise construction site with rebar, plywood, and other building materials in the foreground. Tall buildings dominate the background, suggesting an urban environment. The individual in the foreground wears a helmet and mask but lacks a safety vest and gloves, while the worker behind him is incorrectly flagged for missing PPE—he is not detected as lacking a vest, even though he actually does not have one. Figure 13b provides a closer view of a worker using a demolition tool on a concrete surface. Here, the tool is erroneously identified as “non-glove”. Nonetheless, the bounding boxes correctly indicate “non-glove” and “non-shoes”, highlighting that the worker is not wearing protective gloves or appropriate footwear during a high-risk task that generates substantial debris.
6. Conclusions
This study investigates how various image augmentation techniques influence the detection of non-PPE using YOLOv8. Eight distinct augmentations—brightness, contrast, perspective, rotation, scale, shearing, translation, and their combined application—were examined. Three deep learning architectures (ViT, Swin Transformer, and PVT) were employed for validation.
The main resulting findings indicate that brightness augmentation is the single most effective method for enhancing AP50 in non-PPE detection across all three architectures. While combining all techniques does improve accuracy relative to no augmentation, brightness alone outperforms the sum of augmentations in every architecture. Scale augmentation yields notable gains, whereas translation and perspective exert comparatively modest effects. Non-helmet detection consistently shows the lowest accuracy, underscoring the challenge of identifying helmets in these datasets. Notably, PVT achieves the highest scores, particularly under brightness, demonstrating marked per-class improvements—for instance, raising non-shoes detection from 71.33 to 77.14 and non-helmet from 66.35 to 68.66. Although PVT with brightness achieves the best AP50, applying all techniques results in superior AP50:95 for PVT. Moreover, test outcomes closely align with validation results, suggesting minimal overfitting. These findings highlight the nuanced role of targeted augmentations in improving non-PPE detection.
The study concludes that no single augmentation method universally boosts both average and class-specific accuracy; each backbone architecture and PPE class benefits from its own tailored strategy. Although these approaches effectively detect non-PPE in the current context, their applicability to other datasets—even those with similar tasks—may be limited by variations in data attributes and distributions. Nevertheless, the proposed techniques could be adapted to related domains such as heavy-equipment detection or identifying hazardous worker behaviors, and the augmented models may serve as valuable pretrained baselines to streamline annotation processes. Further investigation into domain shifts, data distribution differences, and varying object morphologies will be essential for clarifying how well these methods transfer to broader contexts and tasks.
Author Contributions
Conceptualization, S.W. and J.K. (Jaejun Kim); methodology, S.W.; software, S.P.; validation, S.P. and J.K. (Jaejun Kim); formal analysis, J.K. (Juhyung Kim); investigation, J.K. (Jaejun Kim); resources, S.P.; data curation, S.W. and S.P.; writing—original draft preparation, S.W. and J.K. (Juhyung Kim); writing—review and editing, J.K. (Jaejun Kim) and J.K. (Juhyung Kim); visualization, J.K. (Jaejun Kim); supervision, S.W.; project administration, S.W.; funding acquisition, J.K. (Juhyung Kim). All authors have read and agreed to the published version of the manuscript.
Funding
This research was funded by the National Research Foundation of Korea (NRF) grant funded by the Korean government (Ministry of Science and ICT) (grant number RS202400356697).
Institutional Review Board Statement
Not applicable.
Informed Consent Statement
Not applicable.
Data Availability Statement
All code and datasets used in this study are available upon request.
Conflicts of Interest
The authors declare no conflicts of interest.
References
- Chen, S.; Demachi, K. Towards On-Site Hazards Identification of Improper Use of Personal Protective Equipment Using Deep Learning-Based Geometric Relationships and Hierarchical Scene Graph. Autom. Constr. 2021, 125, 103619. [Google Scholar] [CrossRef]
- Fang, W.; Ding, L.; Luo, H.; Love, P.E.D. Falls from Heights: A Computer Vision-Based Approach for Safety Harness Detection. Autom. Constr. 2018, 91, 53–61. [Google Scholar] [CrossRef]
- Wang, S.; Eum, I.; Park, S.; Kim, J. A Labelled Dataset for Rebar Counting Inspection on Construction Sites Using Unmanned Aerial Vehicles. Data Br. 2024, 55, 110720. [Google Scholar] [CrossRef]
- Cha, Y.J.; Choi, W.; Suh, G.; Mahmoudkhani, S.; Büyüköztürk, O. Autonomous Structural Visual Inspection Using Region-Based Deep Learning for Detecting Multiple Damage Types. Comput. Civ. Infrastruct. Eng. 2018, 33, 731–747. [Google Scholar] [CrossRef]
- Frid-Adar, M.; Klang, E.; Amitai, M.; Goldberger, J.; Greenspan, H. Synthetic Data Augmentation Using GAN for Improved Liver Lesion Classification. In Proceedings of the International Symposium on Biomedical Imaging, Washington, DC, USA, 4–7 April 2018. [Google Scholar]
- Wang, S.; Kim, M.; Hae, H.; Cao, M.; Kim, J. The Development of a Rebar-Counting Model for Reinforced Concrete Columns: Using an Unmanned Aerial Vehicle and Deep-Learning Approach. J. Constr. Eng. Manag. 2023, 149, 04023111. [Google Scholar] [CrossRef]
- Fang, Q.; Li, H.; Luo, X.; Ding, L.; Luo, H.; Rose, T.M.; An, W. Detecting Non-Hardhat-Use by a Deep Learning Method from Far-Field Surveillance Videos. Autom. Constr. 2018, 85, 1–9. [Google Scholar] [CrossRef]
- Gu, Y.; Xu, S.; Wang, Y.; Shi, L. An Advanced Deep Learning Approach for Safety Helmet Wearing Detection. In Proceedings of the 2019 International Conference on Internet of Things (iThings) and IEEE Green Computing and Communications (GreenCom) and IEEE Cyber, Physical and Social Computing (CPSCom) and IEEE Smart Data (SmartData), Atlanta, GA, USA, 14–17 July 2019. [Google Scholar]
- Yan, D.; Wang, L. Improved YOLOv3 Helmet Detection Algorithm. In Proceedings of the 2021 4th International Conference on Robotics, Control and Automation Engineering, RCAE 2021, Wuhan, China, 4–6 November 2021. [Google Scholar]
- Shen, J.; Xiong, X.; Li, Y.; He, W.; Li, P.; Zheng, X. Detecting Safety Helmet Wearing on Construction Sites with Bounding-Box Regression and Deep Transfer Learning. Comput. Civ. Infrastruct. Eng. 2021, 36, 180–196. [Google Scholar] [CrossRef]
- Nath, N.D.; Behzadan, A.H.; Paal, S.G. Deep Learning for Site Safety: Real-Time Detection of Personal Protective Equipment. Autom. Constr. 2020, 112, 103085. [Google Scholar] [CrossRef]
- Wang, Z.; Wu, Y.; Yang, L.; Thirunavukarasu, A.; Evison, C.; Zhao, Y. Fast Personal Protective Equipment Detection for Real Construction Sites Using Deep Learning Approaches. Sensors 2021, 21, 3478. [Google Scholar] [CrossRef]
- Lee, Y.R.; Jung, S.H.; Kang, K.S.; Ryu, H.C.; Ryu, H.G. Deep Learning-Based Framework for Monitoring Wearing Personal Protective Equipment on Construction Sites. J. Comput. Des. Eng. 2023, 10, 905–917. [Google Scholar] [CrossRef]
- Nguyen, N.T.; Tran, Q.; Dao, C.H.; Nguyen, D.A.; Tran, D.H. Automatic Detection of Personal Protective Equipment in Construction Sites Using Metaheuristic Optimized YOLOv5. Arab. J. Sci. Eng. 2024, 49, 13519–13537. [Google Scholar] [CrossRef]
- Bang, S.; Baek, F.; Park, S.; Kim, W.; Kim, H. Image Augmentation to Improve Construction Resource Detection Using Generative Adversarial Networks, Cut-and-Paste, and Image Transformation Techniques. Autom. Constr. 2020, 115, 103198. [Google Scholar] [CrossRef]
- Asif, M.; Liu, S.; Ali, G.M.; Bouferguene, A.; Al-Hussein, M. The Effectiveness of Data Augmentation in Construction Site-Related Image Classification. In Lecture Notes in Civil Engineering; Springer: Berlin/Heidelberg, Germany, 2023. [Google Scholar]
- Wang, S. Evaluation of Impact of Image Augmentation Techniques on Two Tasks: Window Detection and Window States Detection. Results Eng. 2024, 24, 103571. [Google Scholar] [CrossRef]
- Claridades, A.R.C.; Choi, H.S.; Lee, J. Detecting Building Entrances on Street View Images Using Deep Learning for Supporting Indoor-Outdoor Seamless Services. J. Korean Soc. Surv. Geod. Photogramm. Cartogr. 2023, 41, 351–365. [Google Scholar] [CrossRef]
- Shorten, C.; Khoshgoftaar, T.M. A Survey on Image Data Augmentation for Deep Learning. J. Big Data 2019, 6, 60. [Google Scholar] [CrossRef]
- O’Gara, S.; McGuinness, K. Comparing Data Augmentation Strategies for Deep Image ClassificationIn Proceedings of the Irish Machine Vision and Image Processing Conference (IMVIP), Dublin, Ireland, 28–30 August 2019. [CrossRef]
- Kandel, I.; Castelli, M.; Manzoni, L. Brightness as an Augmentation Technique for Image Classification. Emerg. Sci. J. 2022, 6, 881–892. [Google Scholar] [CrossRef]
- Mumuni, A.; Mumuni, F. Data Augmentation: A Comprehensive Survey of Modern Approaches. Array 2022, 16, 100258. [Google Scholar] [CrossRef]
- Wang, K.; Fang, B.; Qian, J.; Yang, S.; Zhou, X.; Zhou, J. Perspective Transformation Data Augmentation for Object Detection. IEEE Access 2020, 8, 4935–4943. [Google Scholar] [CrossRef]
- Jung, A.B.; Wada, K.; Crall, J.; Tanaka, S.; Graving, J.; Reinders, C.; Yadav, S.; Banerjee, J.; Vecsei, G.; Kraft, A. Imgaug; GitHub: San Francisco, CA, USA, 2020. [Google Scholar]
- Alomar, K.; Aysel, H.I.; Cai, X. Data Augmentation in Classification and Segmentation: A Survey and New Strategies. J. Imaging 2023, 9, 46. [Google Scholar] [CrossRef]
- Zhou, Q.; Situ, Z.; Teng, S.; Chen, G. Comparative Effectiveness of Data Augmentation Using Traditional Approaches versus StyleGANs in Automated Sewer Defect Detection. J. Water Resour. Plan. Manag. 2023, 149, 04023045. [Google Scholar] [CrossRef]
- Ottoni, A.L.C.; de Amorim, R.M.; Novo, M.S.; Costa, D.B. Tuning of Data Augmentation Hyperparameters in Deep Learning to Building Construction Image Classification with Small Datasets. Int. J. Mach. Learn. Cybern. 2023, 14, 171–186. [Google Scholar] [CrossRef] [PubMed]
- Ye, Y.; Ma, X.; Zhou, X.; Bao, G.; Wan, W.; Cai, S. Dynamic and Real-Time Object Detection Based on Deep Learning for Home Service Robots. Sensors 2023, 23, 9482. [Google Scholar] [CrossRef] [PubMed]
- SafetyHelmetWearing-Dataset. Available online: https://github.com/njvisionpower/Safety-Helmet-Wearing-Dataset?tab=readme-ov-file (accessed on 4 December 2024).
- Safety Helmet Computer Vision Project. Available online: https://universe.roboflow.com/digitalimage-114q6/safety-helmet-q3b8o (accessed on 4 December 2024).
- Wang, S.; Han, J. Automated Detection of Exterior Cladding Material in Urban Area from Street View Images Using Deep Learning. J. Build. Eng. 2024, 96, 110466. [Google Scholar] [CrossRef]
- Wang, N.; Zhao, X.; Zhao, P.; Zhang, Y.; Zou, Z.; Ou, J. Automatic Damage Detection of Historic Masonry Buildings Based on Mobile Deep Learning. Autom. Constr. 2019, 103, 53–66. [Google Scholar] [CrossRef]
- Mokayed, H.; Alsayed, G.; Lodin, F.; Hagner, O.; Backe, B. Enhancing Object Detection in Snowy Conditions: Evaluating YOLO v9 Models with Augmentation Techniques. In Proceedings of the 2024 11th International Conference on Internet of Things: Systems, Management and Security (IOTSMS), Malmö, Sweden, 2–5 September 2024; pp. 198–203. [Google Scholar]
- Eum, I.; Kim, J.; Wang, S.; Kim, J. Heavy Equipment Detection on Construction Sites Using You Only Look Once (YOLO-Version 10) with Transformer Architectures. Appl. Sci. 2025, 15. [Google Scholar] [CrossRef]
- Hwang, D.; Kim, J.-J.; Moon, S.; Wang, S. Image Augmentation Approaches for Building Dimension Estimation in Street View Images Using Object Detection and Instance Segmentation Based on Deep Learning. Appl. Sci. 2025, 15, 2525. [Google Scholar] [CrossRef]
- Wang, S.; Hae, H.; Kim, J. Development of Easily Accessible Electricity Consumption Model Using Open Data and GA-SVR. Energies 2018, 11, 373. [Google Scholar] [CrossRef]
- Krizhevsky, A.; Sutskever, I.; Hinton, G.E. ImageNet Classification with Deep Convolutional Neural Networks. In Advances in Neural Information Processing Systems, Proceedings of the 26th International Conference on Neural Information Processing Systems, Lake Tahoe, NV, USA, 3–6 December 2012; Curran Associates Inc.: Red Hook, NY, US, 2012; pp. 1–9. [Google Scholar] [CrossRef]
- Han, J.; Kim, J.; Kim, S.; Wang, S. Effectiveness of Image Augmentation Techniques on Detection of Building Characteristics from Street View Images Using Deep Learning. J. Constr. Eng. Manag. 2024, 150, 110956. [Google Scholar] [CrossRef]
- Meng, C.; Song, Y.; Ji, J.; Jia, Z.; Zhou, Z.; Gao, P.; Liu, S. Automatic Classification of Rural Building Characteristics Using Deep Learning Methods on Oblique Photography. Build. Simul. 2022, 15, 1161–1174. [Google Scholar] [CrossRef]


Disclaimer/Publisher’s Note: The statements, opinions and data contained in all publications are solely those of the individual author(s) and contributor(s) and not of MDPI and/or the editor(s). MDPI and/or the editor(s) disclaim responsibility for any injury to people or property resulting from any ideas, methods, instructions or products referred to in the content. |
© 2025 by the authors. Licensee MDPI, Basel, Switzerland. This article is an open access article distributed under the terms and conditions of the Creative Commons Attribution (CC BY) license (https://creativecommons.org/licenses/by/4.0/).