Abstract
Due to system failures and the limited overcurrent capability of semiconductor devices, overcurrent in modular multilevel converters (MMC) is a key factor affecting the safe and stable operation of offshore wind power MMC-HVDC (modular multilevel converter high-voltage direct current) transmission systems. This paper proposes a field–circuit coupling analysis method for overcurrent research in MMC valve. The method integrates the electric field characteristics of valves with the analysis of MMC-HVDC systems. Firstly, the development process and influencing factors of overcurrent in valves in offshore wind power MMC-HVDC systems are analyzed. A field–circuit coupling model and an electric field calculation model for MMC valves are established. The electric field characteristics and stray parameters of MMC valves are analyzed synchronously and the result are incorporated into the field–circuit coupling model. The nonlinear transient parameters of surge arresters are calculated, and the results are incorporated into the field–circuit coupling model. Finally, a reasonable overcurrent suppression strategy for offshore MMC-HVDC valves is proposed based on the proposed method. The effectiveness and practicality of the field–circuit coupling overcurrent analysis method are verified through comprehensive case studies conducted on the ±500kV offshore MMC-HVDC valve overcurrent calculation and suppression.
1. Introduction
The modular multilevel converter-based high-voltage direct current (MMC-HVDC) transmission system is a primary solution for large-scale renewable energy integration. With the continuous maturation of MMC-HVDC technology, an increasing number of offshore wind farms, both domestically and internationally, are expected to be connected to the grid via this system, particularly those located in deep-sea areas [1]. However, the high maintenance costs, long maintenance cycles, and significant challenges associated with offshore converter stations pose numerous unresolved issues [2]. Among these, the safety and stability of the MMC valves are particularly prominent. The core equipment of MMC consists of sub-modules based on semiconductor devices, such as half-bridge sub-modules with two power devices (e.g., IGBTs) and full-bridge sub-modules with four power devices (e.g., IGBTs). These power devices in the converter valves serve dual functions: circuit switching and power transmission. Unlike conductors, semiconductors have both free electrons and holes as charge carriers, and factors such as carrier concentration, diffusion current, and mobility can all affect the current-carrying characteristics of the semiconductor. Therefore, the overcurrent capability of MMC converter valves is very limited, and improper handling can lead to severe consequences [3].
Overcurrent in valves is generally caused by system faults or equipment failures. The control and protection strategies, protection settings, the timing of fault occurrence, and the circuit characteristics after a fault can all influence the fault current. After a fault occurs, the operating states of nonlinear components in the circuit change, altering the characteristics of the fault current. Furthermore, under high-frequency excitation, the impact of distributed parameters in the MMC valves becomes more pronounced, making the analysis of overcurrent more complex and challenging [4]. Therefore, research on the overcurrent characteristics of valves is of great importance, and the study of the development process and influencing factors of overcurrent is both complex and challenging.
The low safety margin due to overcurrent in MMC is a major concern for the safe operation of offshore wind power MMC-HVDC transmission systems. Currently, research on the fault characteristics of offshore MMC valve continues to be a hot topic in the industry [5,6,7]. To address the issue of overcurrent, reference [8] proposes a DC fault protection scheme consisting of main protection, directional pilot protection, and faulty pole identification. In 2021, a current-limiting requirement of the MMC-HVDC system and the performance of three types of superconducting fault current limiter (SFCL) were proposed by Xiangyu Tan [9]. In 2022, Geon-Woong Kim analyzed the discharge current of the capacitor and the current limiting characteristics of the superconducting fault current limiter (SFCL) when a fault occurred in the MMC system [10]. While these studies have analyzed the phenomenon and development process of overcurrent, they have not investigated the influencing factors of overcurrent, especially the insulation faults of equipment and the potential overcurrent anomalies caused by arresters in the system. To investigate the development of overcurrent under fault conditions, Hongyu Zhou analyzed a dynamic reactive current optimization strategy that combines MMC energy control capability with transient overload capability to achieve onshore AC fault ride-through in 2024 [11]. The influence of new energy of an AC system on DC fault current characteristics in the MMC-HVDC system was studied by Siyuan Liu in 2023 [12]. However, in the analysis of the overcurrent fault loop in these articles, the impact of stray capacitances and the nonlinear characteristics of surge arresters in the MMC-HVDC system during transient processes were not considered.
In previous studies, the stray parameters of the MMC valve, the nonlinear characteristics of surge arresters, and the electric field characteristics of the MMC valve have not been considered in the fault current loop. As a result, the overcurrent of the MMC valves calculated using these methods might be incomplete in terms of operational conditions and might lack sufficient accuracy. When overcurrent anomalies occur in the MMC-HVDC system, those methods are incapable of rapidly identifying and locating the fault factors. This deficiency poses risks for subsequent engineering commissioning and testing. Therefore, it is essential to incorporate these factors into the overcurrent studies to improve the accuracy and reliability of MMC protection strategies.
In this paper, a field–circuit coupling analysis method is proposed for overcurrent research on the MMC valve. The method integrated the electric field characteristics of valves, stray parameters, and transient characteristics of nonlinear devices during the fault process with the overcurrent analysis. By invoking the electric field calculation model, the results of the MMC valve electric field strength and the stray capacitances are synchronously coupled into the system analysis model. Firstly, the development process and influencing factors of overcurrent in the MMC valve within offshore wind power MMC-HVDC systems are analyzed. Subsequently, the stray parameters induced by the valve structure and valve hall layout were calculated. A comprehensive overcurrent analysis model for the MMC valves, incorporating field–circuit coupling analysis, is established. This model includes the electric field characteristics of the MMC valves, stray parameters, and the nonlinear model of the surge arresters in the MMC-HVDC system. Finally, the proposed field–circuit coupling method was used to accurately calculate the overcurrent in converter valves. The field–circuit coupling analysis method presented in this study enables precise calculation of overcurrent. When overcurrent anomalies occur in the MMC-HVDC system, the field–circuit coupling analysis method in this paper can rapidly identify and locate the fault factors causing the anomalies. Based on these calculations, a rational overcurrent suppression strategy for an offshore MMC valve is proposed. The effectiveness and practicality of the proposed method were verified through comprehensive case studies conducted on the ±500kV offshore MMC-HVDC valve overcurrent calculation and suppression. The numerical results demonstrate the efficacy and accuracy of the method presented in this paper.
2. Influencing Factors of MMC Valve Overcurrent
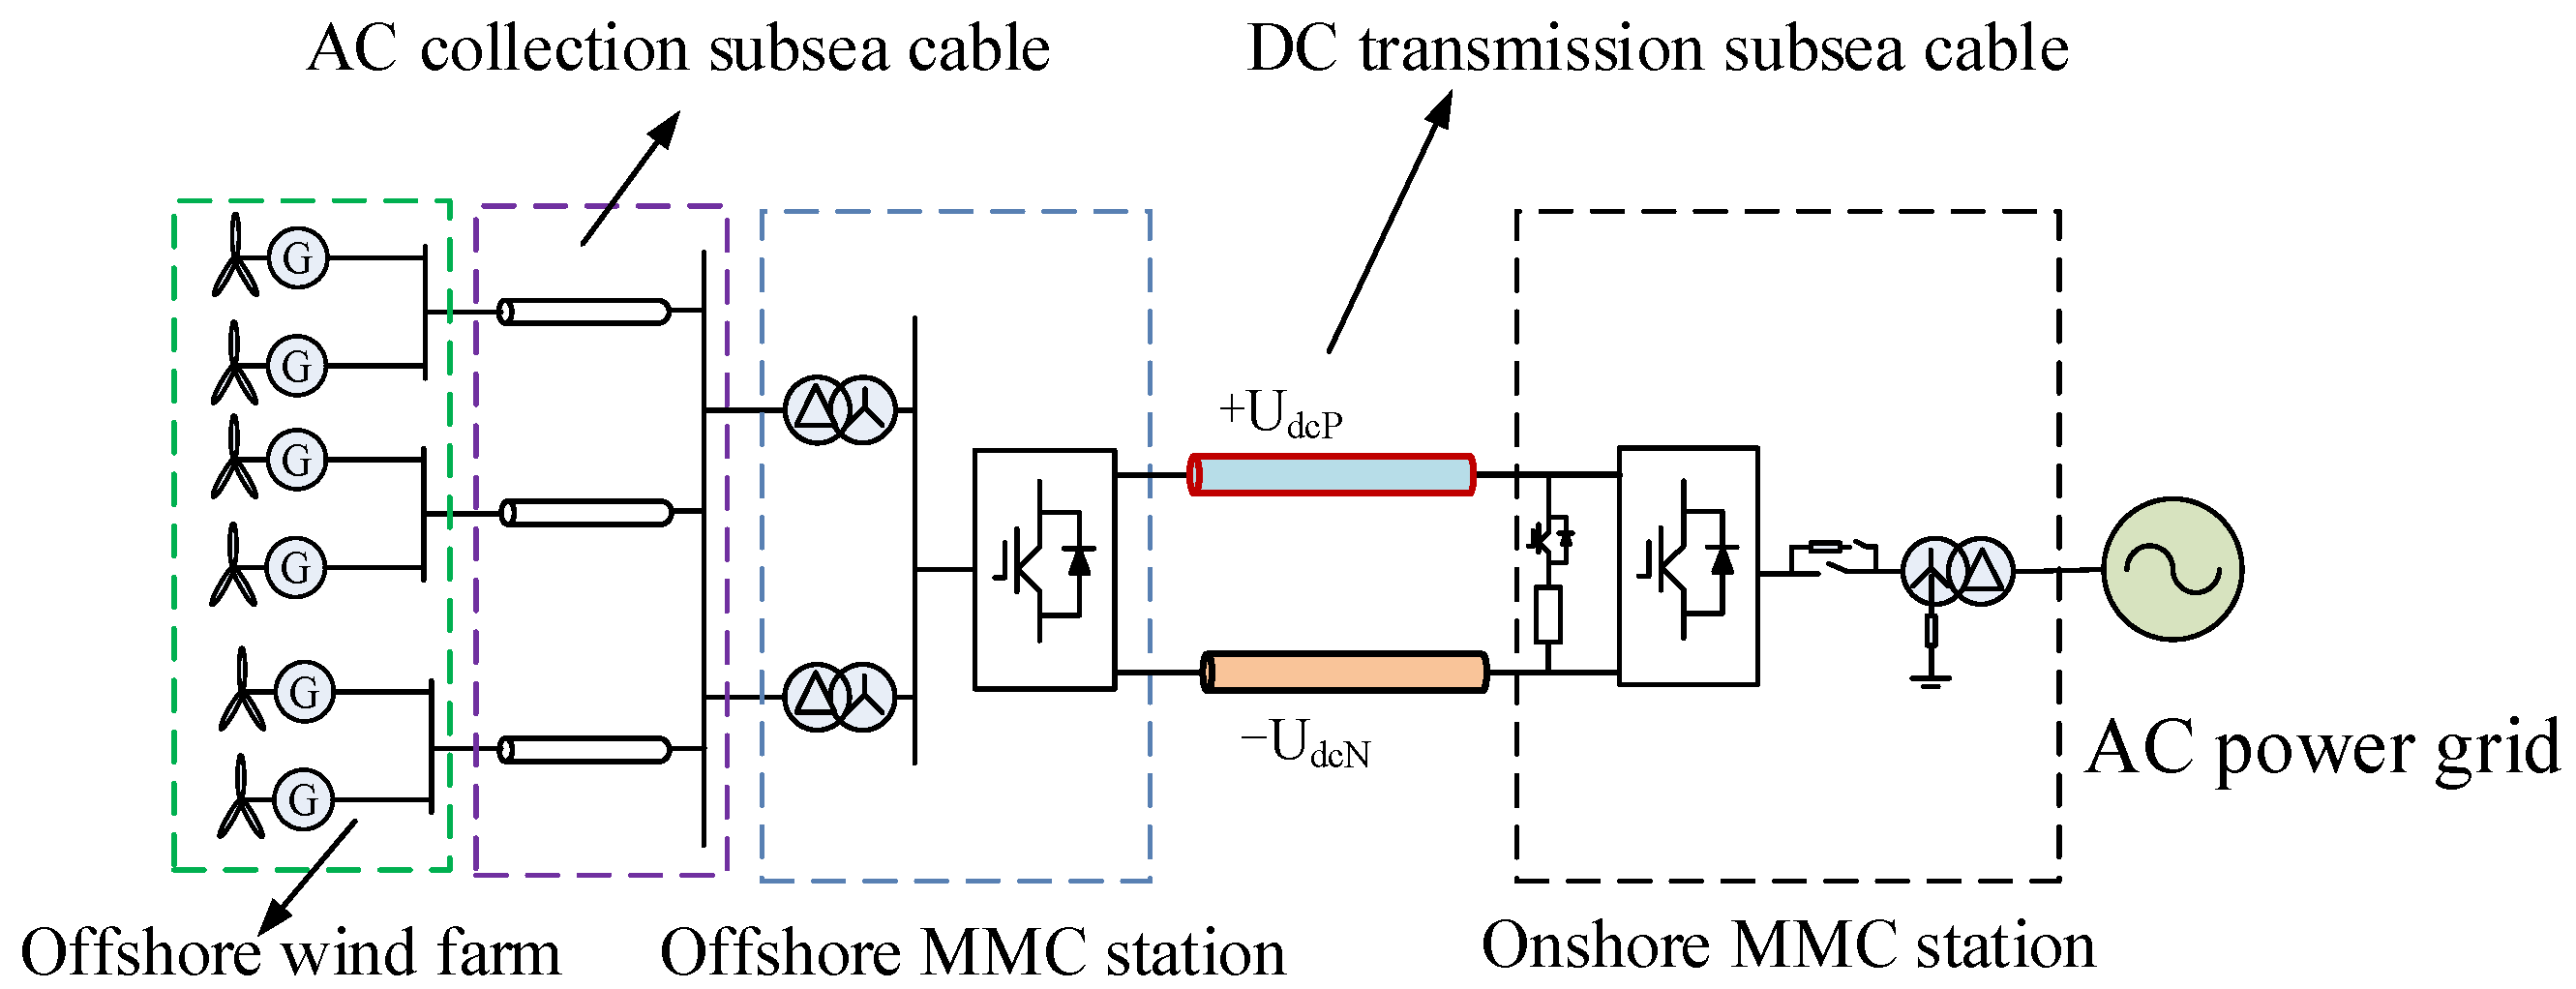
The offshore wind power MMC-HVDC transmission system is the primary method for delivering electrical energy from large-scale, deep-sea wind farms. Currently, several offshore wind power MMC-HVDC transmission projects have already been implemented [13]. The schematic diagram of the offshore wind power MM-HVDC transmission system is shown in Figure 1.
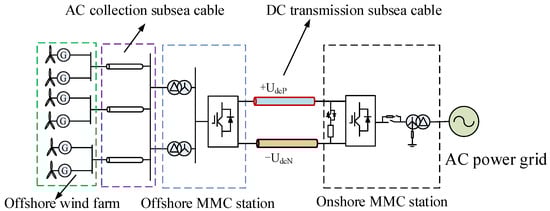
Figure 1.
System of MMC-HVDC transmission connected for offshore wind power.
As shown in Figure 1, the offshore wind power MMC-HVDC transmission system consists of the offshore wind farm, the AC collection system, the offshore converter station, the DC submarine cable, the onshore converter station, and the DC energy dissipation device.
In the offshore wind power MMC-HVDC system, half-bridge sub-modules are utilized to construct the MMC. The offshore converter station is arranged in the form of an offshore platform located in deep-sea areas, designed to withstand harsh marine environments while ensuring reliable power conversion and transmission.
Overcurrent phenomena in the MMC valves of the offshore MMC-HVDC system are typically caused by severe faults occurring in the converter station area or within the DC transmission lines. These faults can lead to significant transient currents that may exceed the rated capacity of the valves, posing risks to the safe and stable operation of the system.
The principle of overcurrent caused by faults in the valve hall area of the offshore converter station is illustrated in Figure 2.
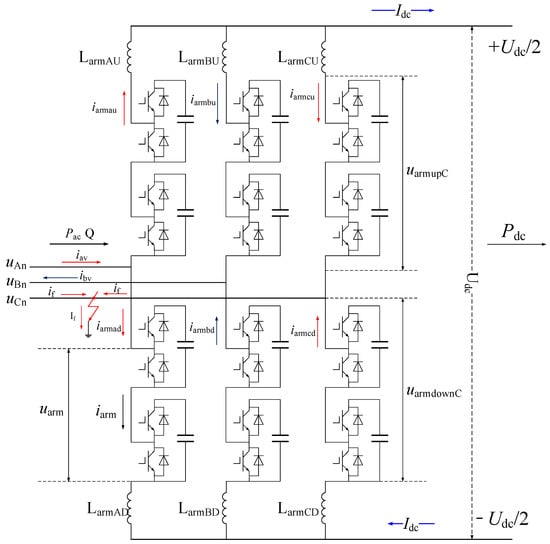
Figure 2.
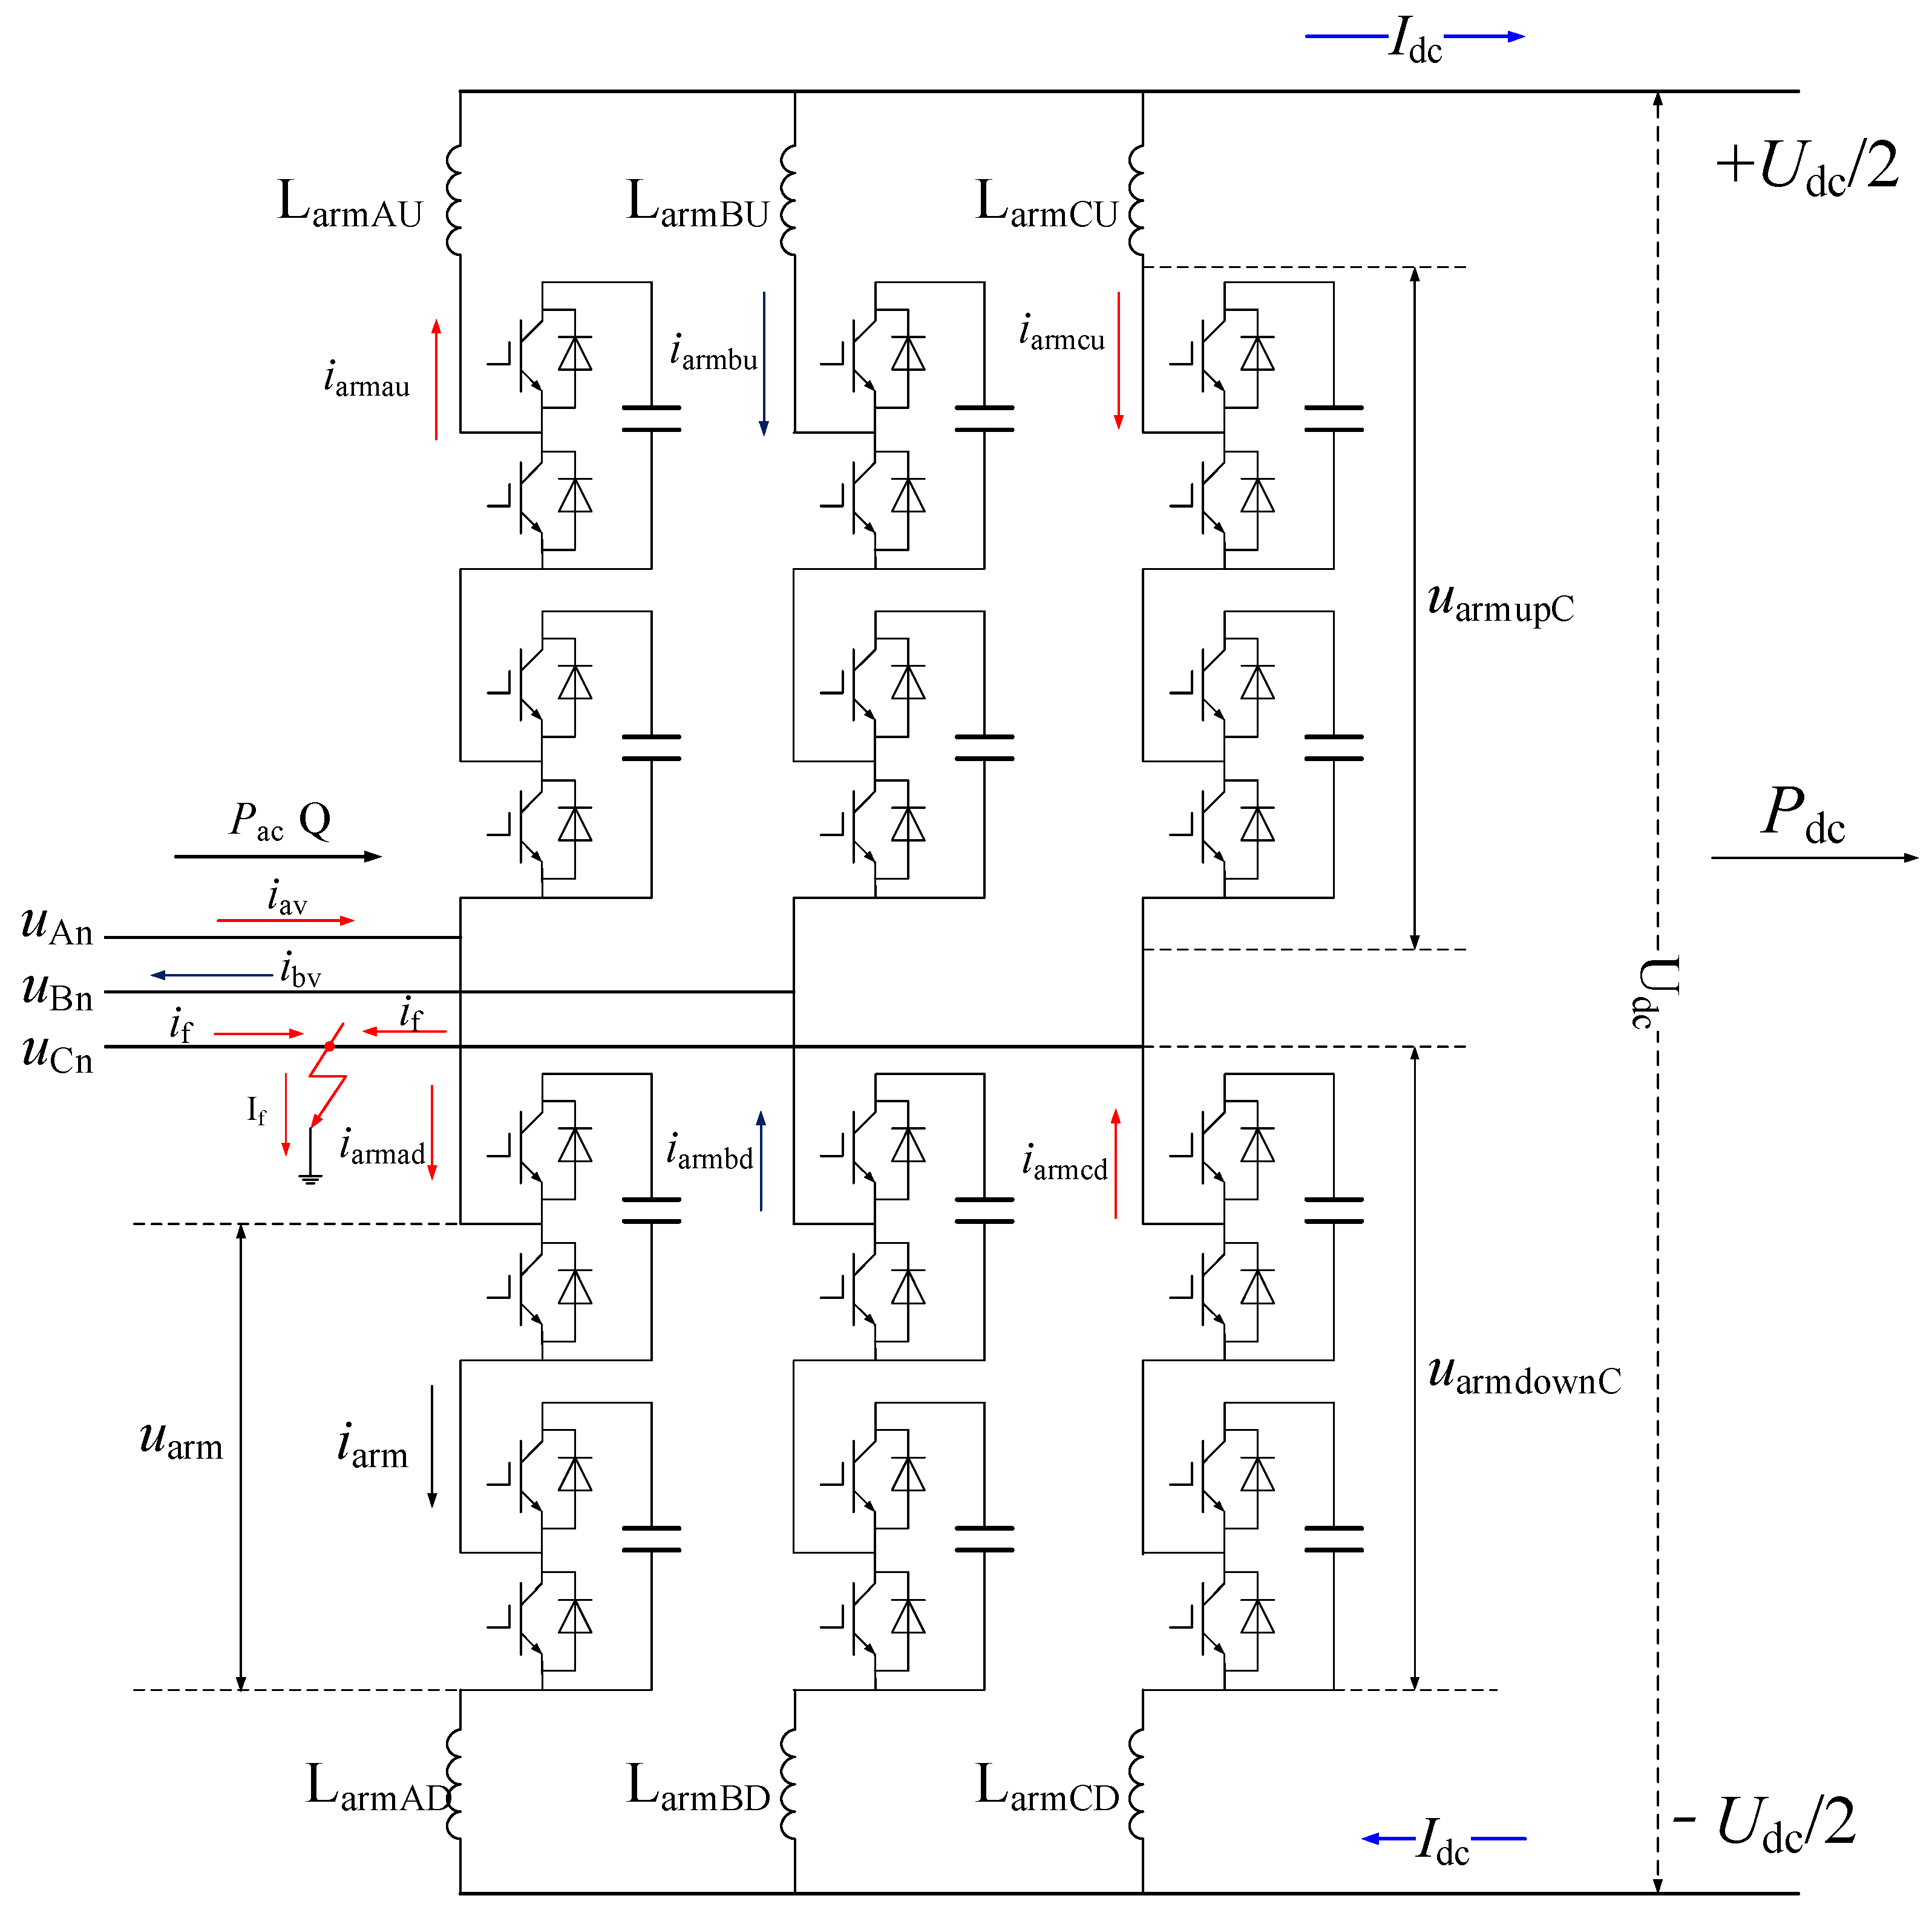
Equivalent circuit of MMC overcurrent fault.
As shown in Figure 2, the offshore wind power MMC-HVDC system employs a monopolar connection configuration. Each converter station consists of six bridge arms. Each bridge arm is composed of a series connection of N half-bridge sub-modules. During operation, power transmission is achieved by controlling the switching of sub-modules.
When a fault occurs within the offshore converter platform, whether it is a short-circuit fault, a ground fault, or an open-circuit fault, the physical characteristics of the power transmission system are altered. Due to the change in the circuit, the impedance characteristics of the MMC system are also affected.
The relationship between the bridge arm current and voltage during operation is defined as follows:
In Equation (1), iarm is the bridge arm current of MMC, uCn is the voltage to ground on the valve side, Udc is the DC voltage of the MMC, uarmupC and uarmdownC are the voltages of the upper and lower bridge arms, and Pdc and Q are the active power and reactive power of MMC.
As shown in Figure 2, during the transient process following a fault, the expression for the bridge arm current is defined as follows:
In Equation (2), Zarm is the equivalent impedance of the bridge arm, Zon and Zoff are the impedances of the sub-modules in the on-state and off-state, N and N1 are the total number of modules in the bridge arm and the number of sub-modules in the on-state, iarm is the bridge arm current of MMC, ZF is the impedance in the fault loop, and Zg is the impedance resulting from MMC valve stray parameters.
According to Equation (2), it can be seen that during steady-state operation, ZF is zero, and the effect of Zg can be neglected. In this case, the current through the valve can be indirectly controlled based on power.
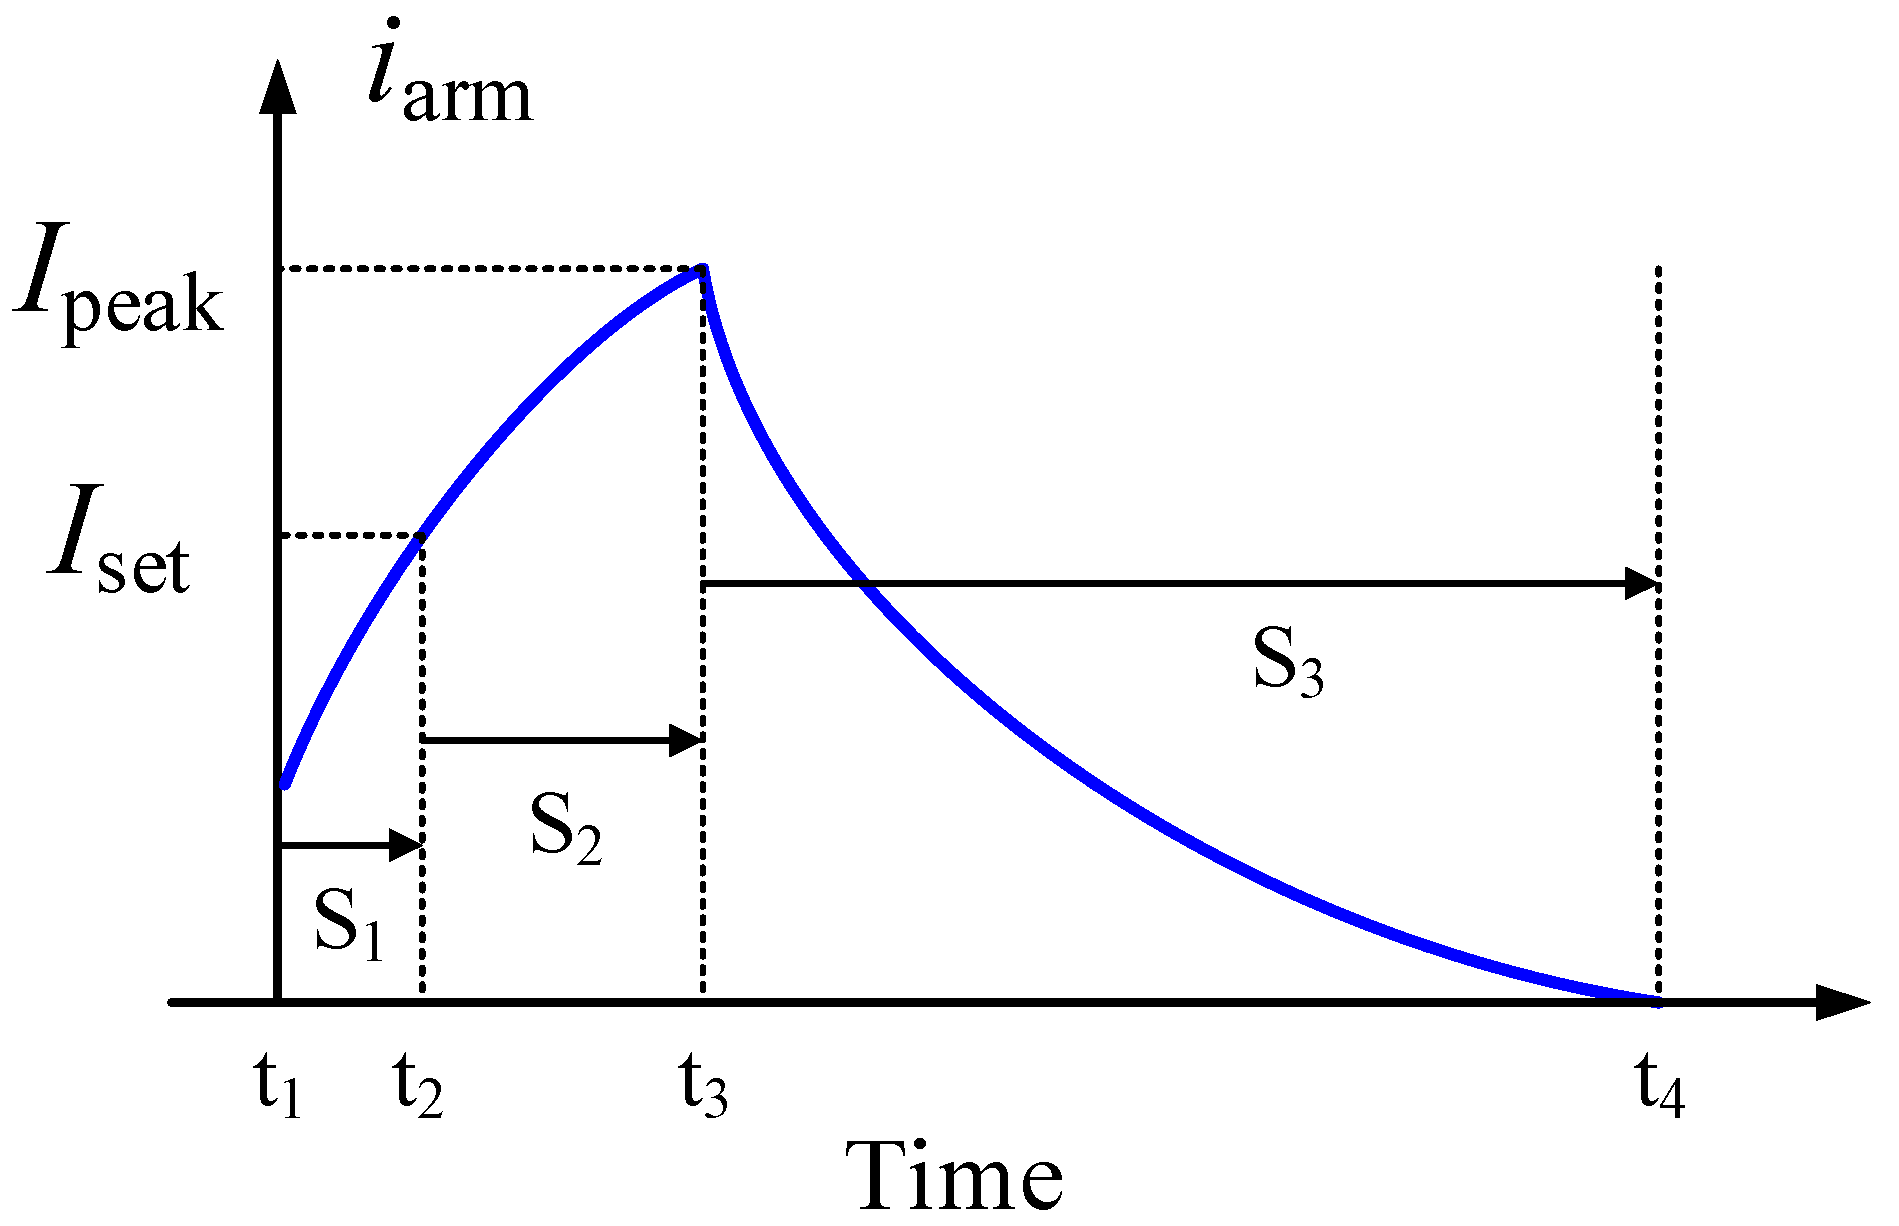
In the overcurrent protection of the MMC valve, the instantaneous current value is detected by the bridge arm current transformer. When the peak current of the bridge arm reaches the protection setting Iset or other conditions, the MMC current protection signal is triggered. Following the protection action, the bridge arm current is reduced. The development process of the bridge arm fault current in MMC is shown in Figure 3.

Figure 3.
Development process of MMC overcurrent during faults.
Figure 3 presents a schematic diagram constructed based on the development process of arm current during the overcurrent blocking protection in an actual MMC-HVDC system. This diagram is used to analyze the influencing factors of overcurrent in the MMC valve.
As shown in Figure 3, when a severe fault occurs in the station at time t1, the bridge arm current to increases rapidly. When the current iarm reaches the protection setting Iset, the protection is triggered, and the system is blocked. After the protection chain delay (S2), the blocking is completed, and the MMC valve current reaches its peak value Ipeak. When a severe fault occurs in the system, as shown in Figure 2, the operating circuit of the bridge arm will change, and the electrical energy cannot be transferred to the DC side. The electrical energy from the AC side power source is directly released to the ground through the bridge arm, forming a short-circuit current in the bridge arm.
The rate of rise in the fault current is closely related to the impedance characteristics of the fault loop. Within the control period following the fault, the increment of the current can be used to represent the rate of current rise. The increase in current within the control period is given as follows [14]:
In Equation (3), Uarmm is the maximum arm voltage at the moment of fault occurrence, m is the MMC voltage modulation ratio, ω is the AC side angular frequency, Tcontrol is the control period, Rd is the equivalent resistance in the fault current loop, and Larmd is the inductive reactance in the fault current loop.
As shown in Equation (3), the on-state resistance of the diodes and IGBTs in the sub-module, as well as the number of modules, affect the rise rate of the MMC overcurrent. However, the bridge arm reactor is the most significant factor influencing the current rise rate.
In practical design, the bridge arm reactor is primarily used to suppress the rise rate of the fault current. The sub-module balancing resistor is not involved in the fault loop before the module is blocked. Only after the MMC is blocked does this resistor come into the fault loop. Therefore, the sub-module balancing resistor does not influence the rate of rise in the fault current. The stray capacitances, typically at the pF level and not in the series path of the fault current, have a negligible effect on the current rise rate.
The insulation resistance represents the equivalent of the electric field characteristics at the valve terminal. When the transient electric field strength is less than the air breakdown field strength at the position, the insulation resistance does not affect the rate of rise in the fault current. Conversely, when the transient electric field reaches the air breakdown field strength, the resistance value becomes a relatively small value, approximately 1 to 5 ohm or even lower. The insulation resistance significantly influences the rate of rise in the fault current, which potentially causes damage to the equipment.
In practical engineering applications of HVDC transmission, the rated gate-emitter voltage for IGBT drivers is typically around 15 V. Additionally, the maximum safe turn-off current of IGBT is generally about twice the rated current. Therefore, the peak current Ipeak during a fault must be less than twice the rated current of IGBT to ensure device safety [15,16,17].
During time intervals S1 and S2, the development of the fault current is closely related to the characteristics of the fault loop. The time interval S2 is determined by the hardware of the control and protection system. Unreasonable design of the main circuit parameters and stray parameters of the equipment can cause current distortion and a rapid increase, leading to device damage under certain operating conditions.
As shown in (2), the fault-induced changes in impedance characteristics lead to overcurrent, especially under impulse excitation, where the effect of Zg becomes more pronounced.
Because of the different positions and geometric dimensions of the metal components, a large number of stray parameters exist in the MMC valve, especially stray capacitances.
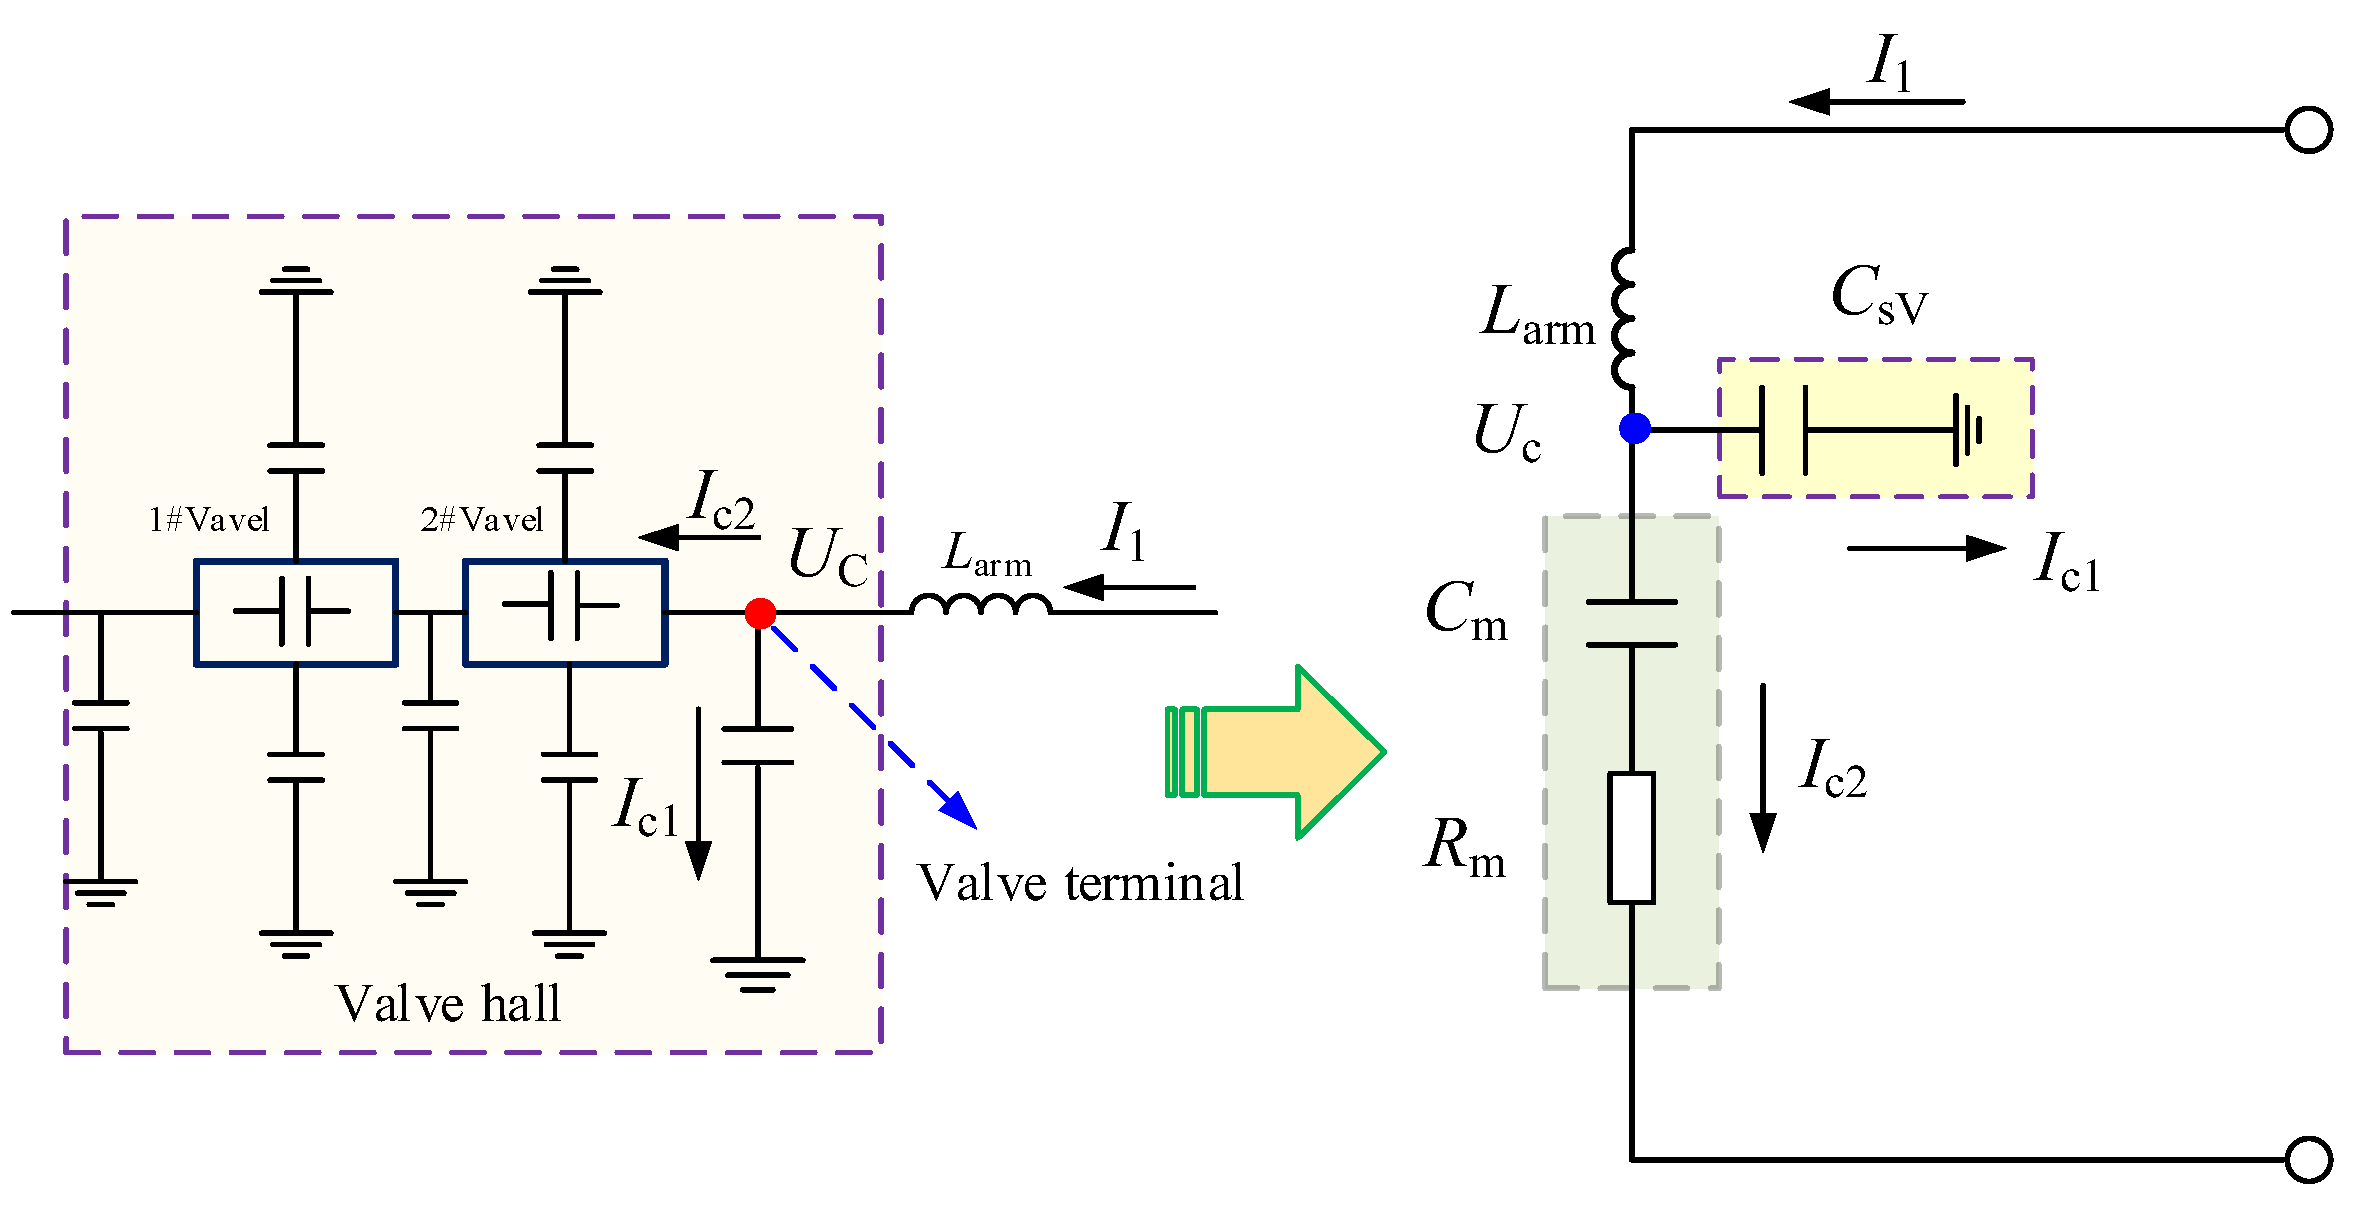
The impact of stray capacitance in the MMC valve on the current is shown in Figure 4.
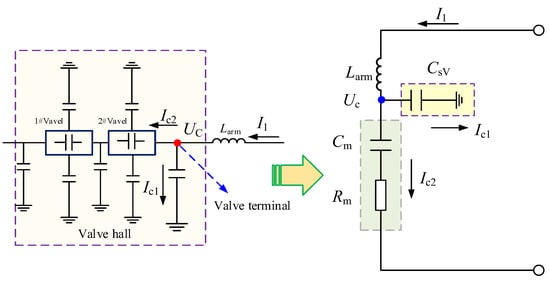
Figure 4.
Impact of stray capacitance in MMC valve on current.
As shown in Figure 4, Larm is the bridge arm inductance, CSV is the stray capacitance between the terminal of the MMC valve and ground, UC is the voltage to ground at the terminal of the MMC valve, Cm and Rm are the equivalent capacitance and equivalent resistance of the MMC, I1 is the bridge arm current, and Ic2 is the current in the MMC. The presence of stray capacitance may lead to changes in the bridge arm current.
The impact of stray capacitance on the bridge arm current is defined as follows:
In Equation (4), Ic1 is the current generated by stray capacitance, UC is the voltage to ground at the terminal of the MMC valve, Cm and Rm are the equivalent capacitance and equivalent resistance of the MMC, and ω is angular frequency of voltage or current.
Stray capacitance can cause changes in the bridge arm current. The impact factor of stray capacitance on the bridge arm current is defined as follows:
In Equation (5), fCI is the impact factor of stray capacitance on the bridge arm current. The magnitude of this impact factor is related to the frequency of the current.
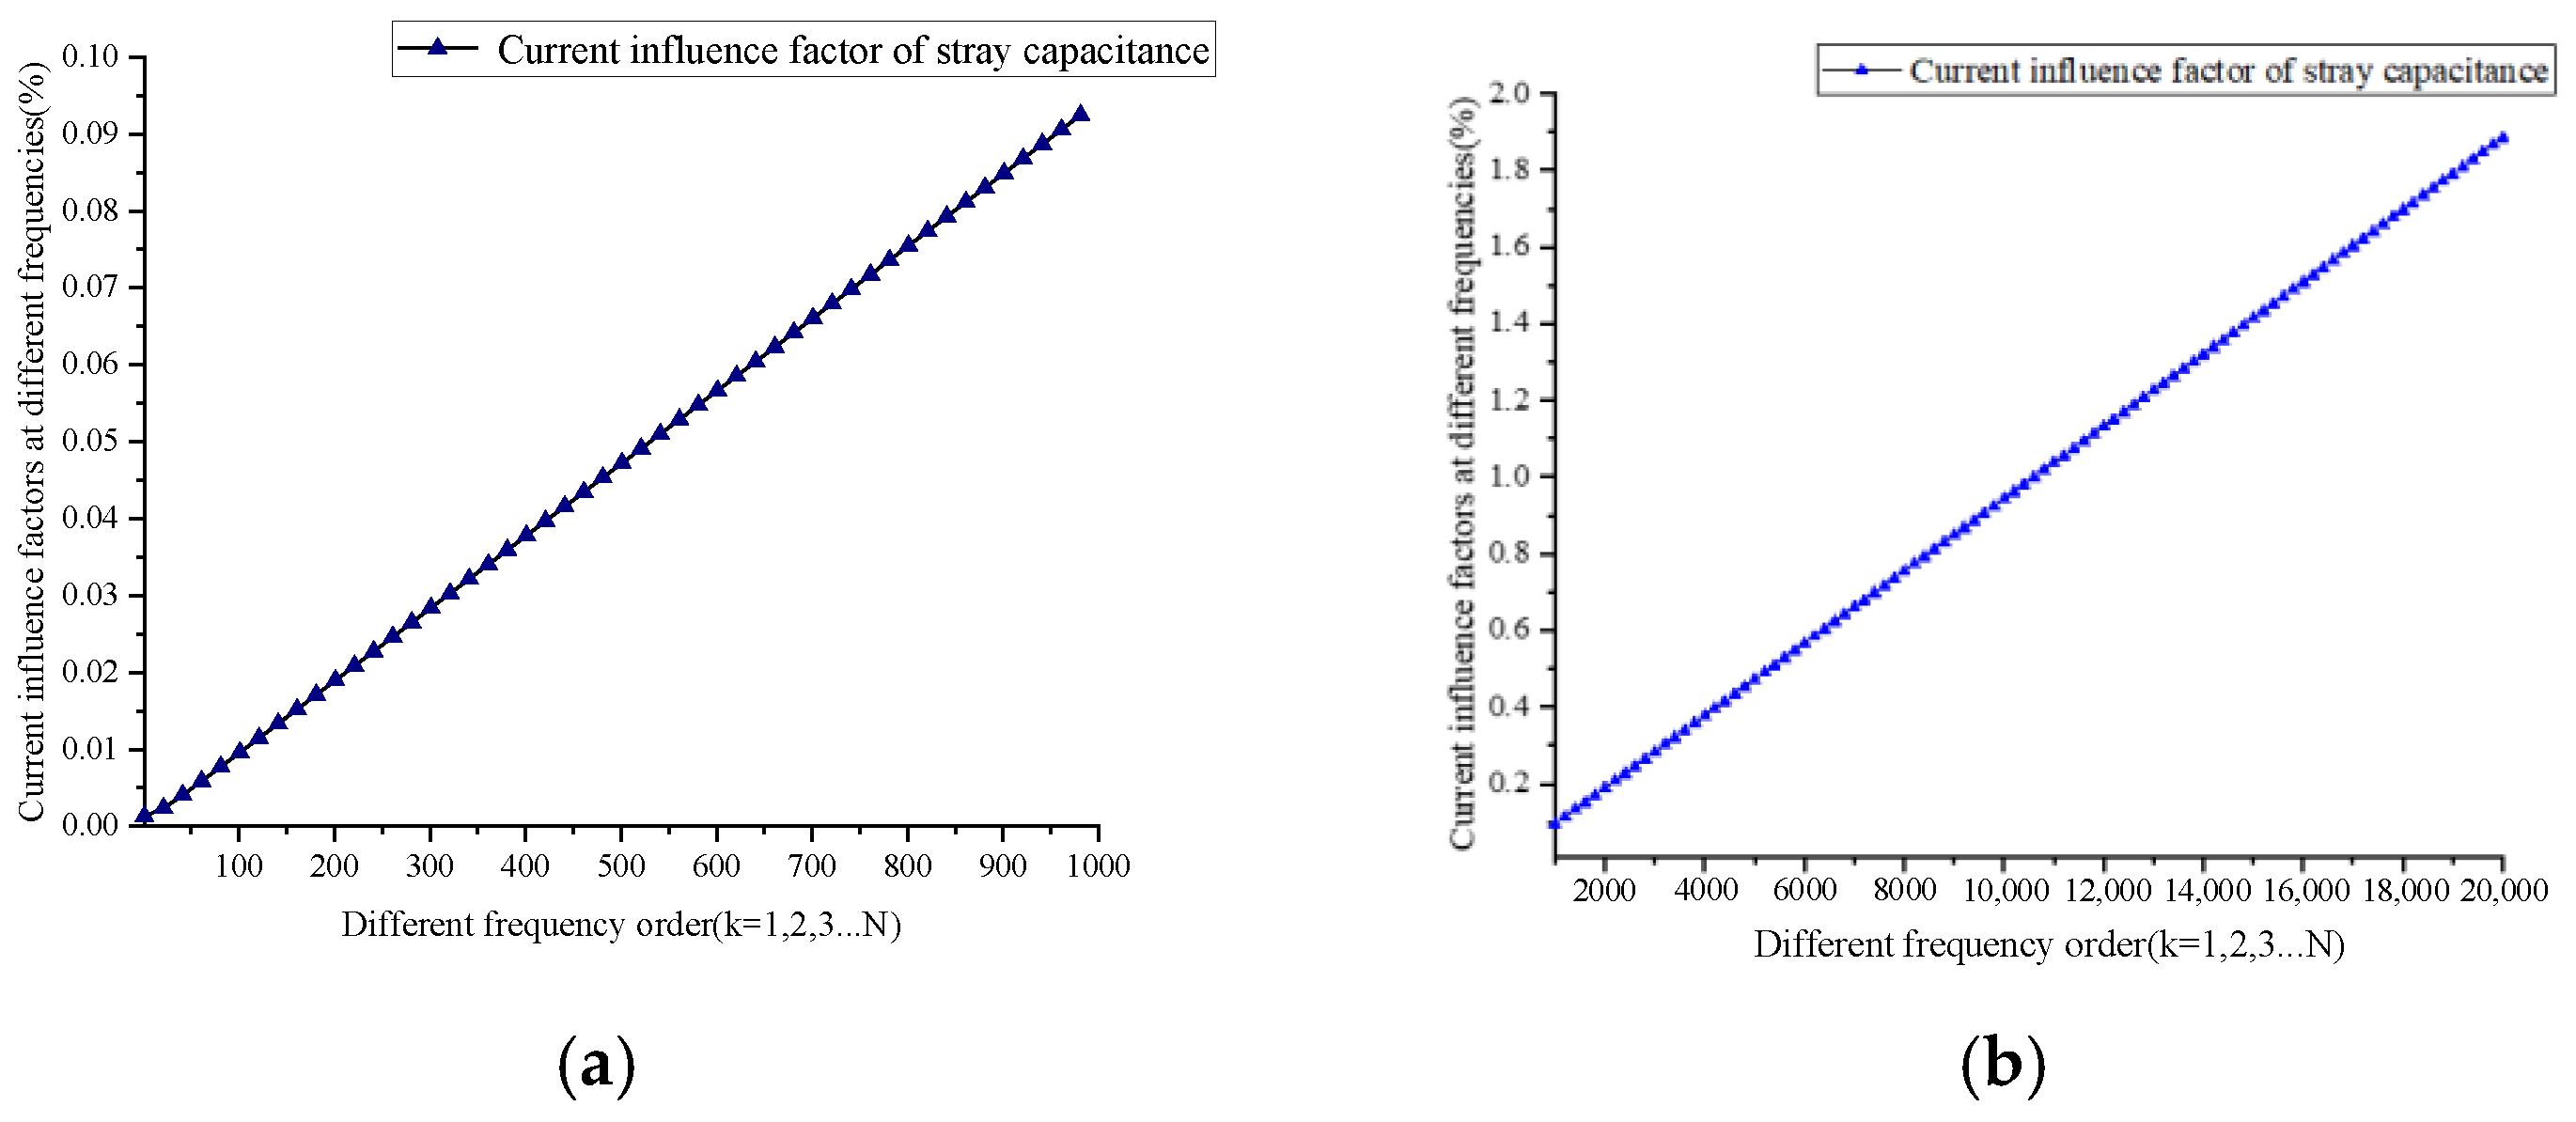
The impact factor fCI of stray capacitance on the bridge arm current at different frequencies is shown in Figure 5.
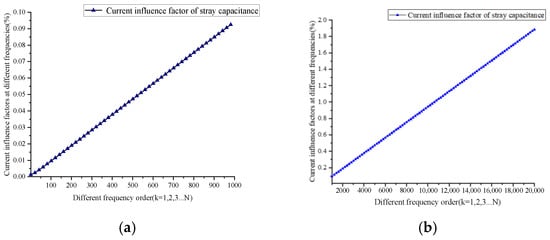
Figure 5.
Impact factor under frequencies ranging from 1 to 1000th order (a) and frequencies ranging from 1000th to 20,000th order (b).
As shown in Figure 5, the impact of stray capacitance on the bridge arm current is very small at low frequencies. Specifically, higher frequencies tend to result in a more pronounced effect due to the capacitive reactance characteristics.
At lower frequencies, the impact factor is relatively small, while at higher frequencies, it can significantly alter the current waveform.
When the frequency is below 50th order, the impact factor fCI is essentially zero. At a frequency of the 150th order, the impact factor is only 0.01%. When the frequency reaches the 1000th order, the impact factor increases to 0.1%, and the influence begins to become more pronounced. When the frequency reaches the 10,000th order (500 kHZ), the impact factor fCI increases to 1%, and the impact of stray capacitance becomes very significant.
In the offshore wind power MMC-HVDC transmission system, MMC valve overcurrent caused by severe station faults is typically in the form of impulses. The rise time of the MMC valve voltage and current waveforms is very short, resulting in the presence of high-frequency components in the waveforms. Therefore, the impact of stray capacitance in the MMC valve must be considered in the analysis of overcurrent.
3. Field–Circuit Coupling Analysis Method
3.1. Field–Circuit Coupling Analysis Model
In an offshore wind power MMC-HVDC transmission system, the overcurrent levels of the valves are typically high, and the current rises rapidly after a fault occurs [18]. As illustrated in Figure 2, the variation in fault current is primarily determined by the current loop formed after the fault.
According to Figure 4, the transient parameter variations in nonlinear components, stray parameters of the converter valve, and the electric field distribution can all influence the fault loop during transient conditions.
A field–circuit coupled analysis model for overcurrent calculation is established, as shown in Figure 6.
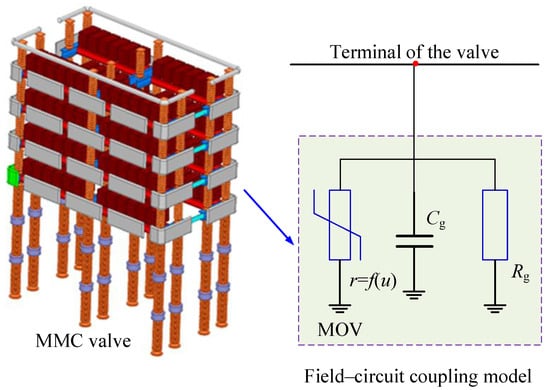
Figure 6.
Field–circuit coupling analysis model for overcurrent calculation.
As shown in Figure 6, the field–circuit coupled model (CF model) incorporates the electric field characteristics of the MMC valve, the stray parameters of the MMC valve, and the nonlinear model of the surge arrester within the MMC-HVDC system.
3.2. Electric Field and Stray Parameters Calculation
In the offshore wind power MMC-HVDC transmission system, severe station faults lead to the operation of control and protection systems, which in turn cause the MMC valve to be blocked.
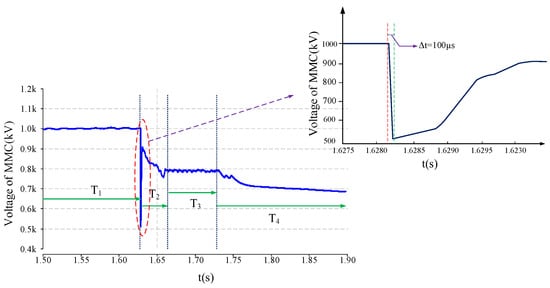
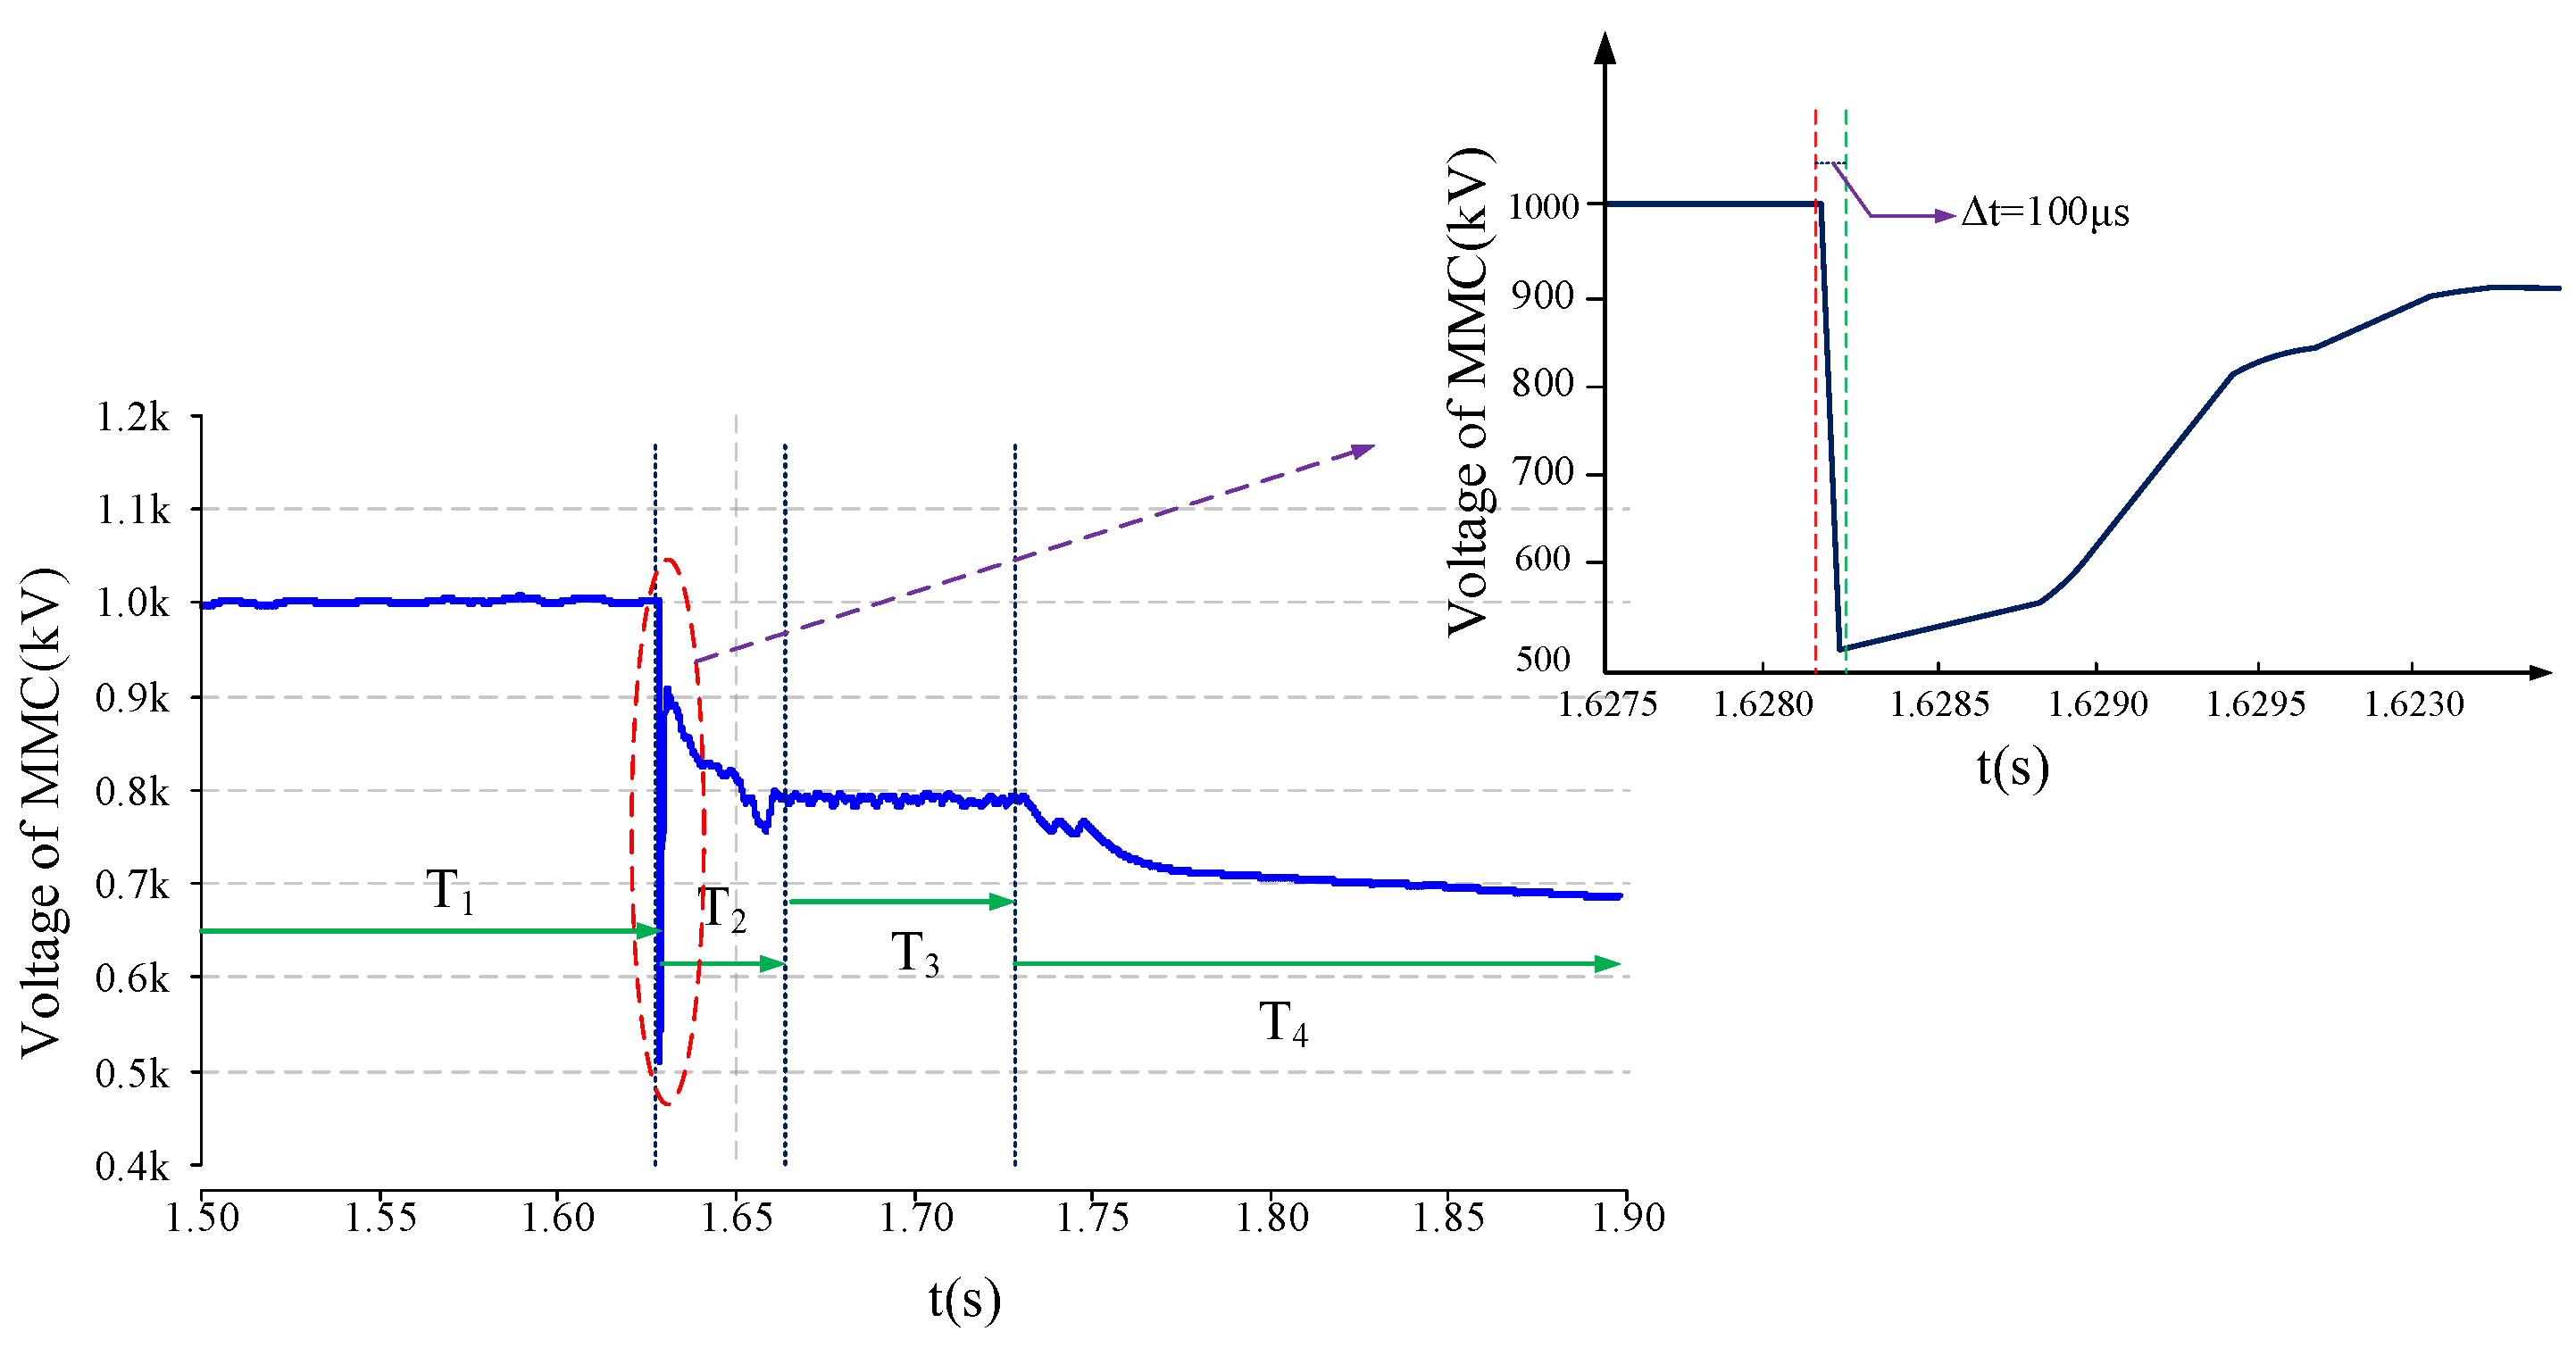
Figure 7.
Voltage of MMC valve end during fault.
As shown in Figure 7, following a severe system fault, the voltage variation can be divided into four stages. It can be observed that the terminal voltage of the MMC valve experiences the largest fluctuation and the most severe impulse during stage T2, with the voltage falling edge at the terminal occurring approximately 100 μs after the fault occurs.
After estimation, the high-frequency components are expected to exceed 1 MHz. As shown in Figure 5b, the fCI will exceed 1.5%, indicating that the stray parameters of the MMC valve will have a significant influence on the overcurrent.
From Figure 7, it is evident that during system faults, the terminal voltage of the MMC valve is subjected to impulse excitation, characterized by relatively steep voltage rise and fall edges.
In summary, under the influence of this impulse voltage, the following characteristics appear at the terminal location of the converter valve:
- (1)
- Under impulse excitation, the stray parameters of the valve cause more pronounced changes in the fault loop. Therefore, it is necessary to calculate the stray parameters of the MMC valve under impulse excitation, primarily the stray capacitance.
- (2)
- When the voltage peak is high, it may lead to a higher electric field strength at the terminal of the MMC valve. If partial discharge occurs, it will also cause changes in the fault loop.
- (3)
- Under impulse excitation, when the voltage peak is large, the surge arrester at the terminal location of the MMC valve may be activated, leading to changes in the fault loop.
The MMC valve is composed of multiple conductors, and all conductors need to be processed in the capacitance calculation. The capacitances of the valve shields are shown in Figure 8.
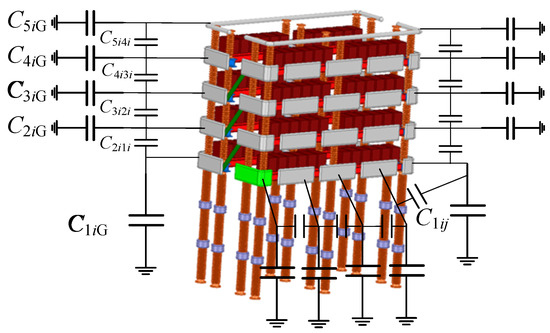
Figure 8.
Diagram of MMC valve stray capacitance.
As shown in Figure 8, C1iG is the capacitance between conductor i in the layer 1 and ground. C1ij is the capacitance between conductor i and conductor j in layer 1. C2i1i is the capacitance between conductor i in layer 1 and conductor i in layer 2. From Equation (2), a change in Zg will lead to alterations in the characteristics of the fault current.
According to the physical definition, capacitance is a measure that describes the ability to store electric field energy. The structure of the MMC valve is relatively complex, with a large number of conductors of various shapes.
The accurate calculation method of stray capacitance based on electric field energy calculation is defined as follows:
In Equation (6), Eij is the electric field between conductors i and j, φij are the potential distributions of the conductors, εr is the relative permittivity of the insulating structure between the conductors, ε0 is the vacuum permittivity, Wc is the electric field energy stored between the conductors, Cgij is the capacitance between the conductors, and ΔU is the voltage between the conductors.
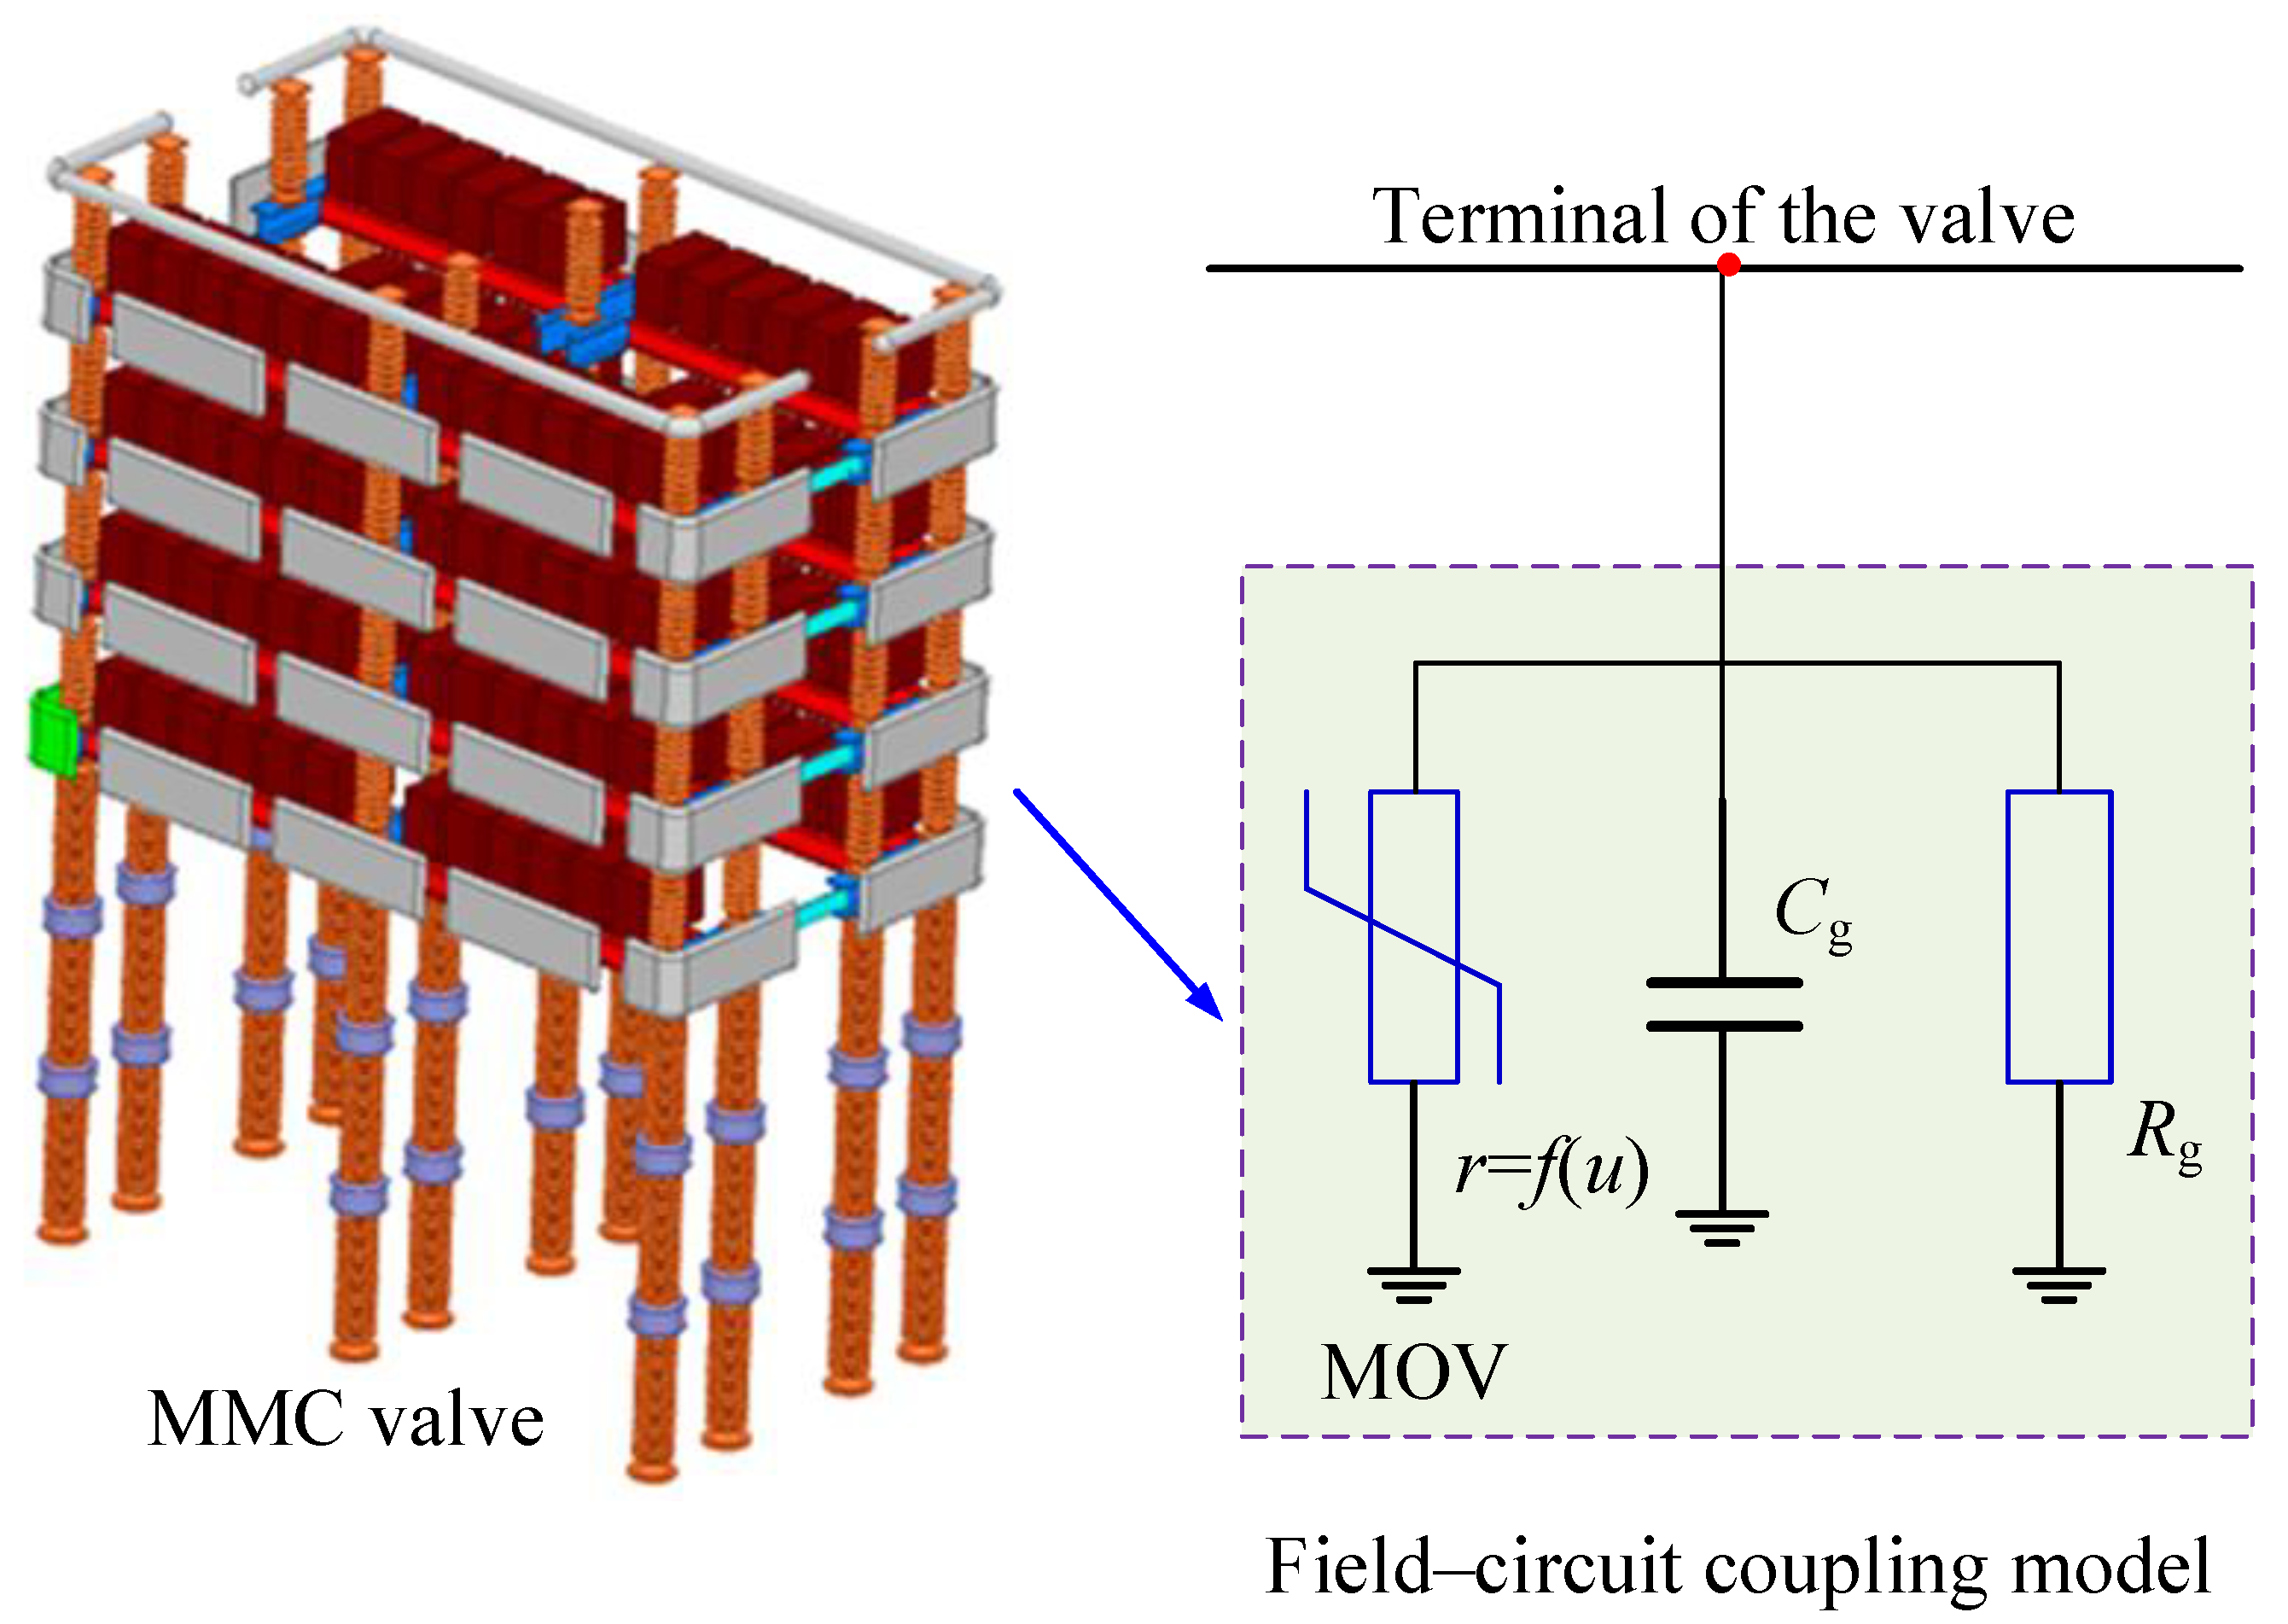
Due to the influence of factors such as terminal connectors and bus-bars, the electric field at the terminal of the MMC valve is often large and unevenly distributed.
Therefore, the electric field characteristics at the terminal of the converter valve are described through ground impedance. The electric field coupling impedance is defined as follows:
In Equation (7), Ei is the instantaneous electric field strength between the MMC terminal conductor and the ground, and Rg is the electric field coupling impedance of the MMC terminal.
The value of electric field coupling impedance Rg is determined by the electric field strength. When the transient electric field Ei is less than the air breakdown field strength at the position, the value of resistance Rg is considered to be infinite. Conversely, when the transient electric field Ei reaches the air breakdown field strength, the resistance value Rg becomes a relatively small value, approximately several 1 to 5 ohm or even lower.
From Equation (5), it can be deduced that the MMC stray capacitances can be obtained through electric field analysis. A 3-dimensional electric field calculation method was used to perform detailed calculations of the MMC valve stray parameters and electric field distribution characteristics.
In the electric field calculation model, the computed capacitance and electric field values are coupled into the system field–circuit coupling analysis model. During the system calculation process, the electric field characteristics of the MMC valve influence the fault characteristics.
3.3. Nonlinear Modeling of Arresters
According to the insulation coordination design of the MMC-HVDC transmission system, it is necessary to install surge arresters in the converter stations to suppress overvoltage levels. In the offshore wind power MMC-HVDC transmission system shown in Figure 1, zinc oxide surge arresters were installed on the valve side of the bridge arm reactors and the valve side of the transformers.
The characteristics of the metal oxide varistor (MOV) model for the surge arresters are defined as follows:
In Equation (8), U and I are the voltage and current of the surge arrester, C is the material constant, and α is the nonlinearity coefficient. Typically, the value range of α is 0.02 < α < 0.1. Therefore, by transforming Equation (8), the resistive characteristic of the surge arrester can be expressed as a function of the current flowing through it.
The resistive characteristic of the surge arrester is defined as follows:
From Equation (9), when the current through the surge arrester is small, the nonlinear resistance of the surge arrester exhibits a high-resistance state. In this case, the resistance rMOV is large and can be considered negligible. When the voltage at the end of the surge arrester exceeds the reference voltage, the current i begins to increase, leading to a decrease in rMOV. This, in turn, causes a further increase in the current through the surge arrester. During the energy absorption process, the surge arrester exhibits an instantaneous low-resistance characteristic.
The nonlinear impedance models of surge arresters at all locations within the system are calculated and incorporated into the CF model, as shown in Figure 6.
Since faults within the valve hall are generally permanent faults, the converter station can only be shut down and locked. During the fault process, the voltage and current of the MMC valve exhibit transient impulse characteristics. Therefore, it is necessary to consider the field–circuit coupling characteristics of the MMC valve.
4. Simulation Verification of MMC Overcurrent Calculation
The system simulation model in this paper is built in the PSCAD/EMTDC. The model is constructed based on actual primary parameters and control protection systems. The electromagnetic field calculations for the field–circuit coupling module and the stray parameter calculations for the MMC valves are performed using a finite element computation program, which is interfaced with PSCAD/EMTDC.
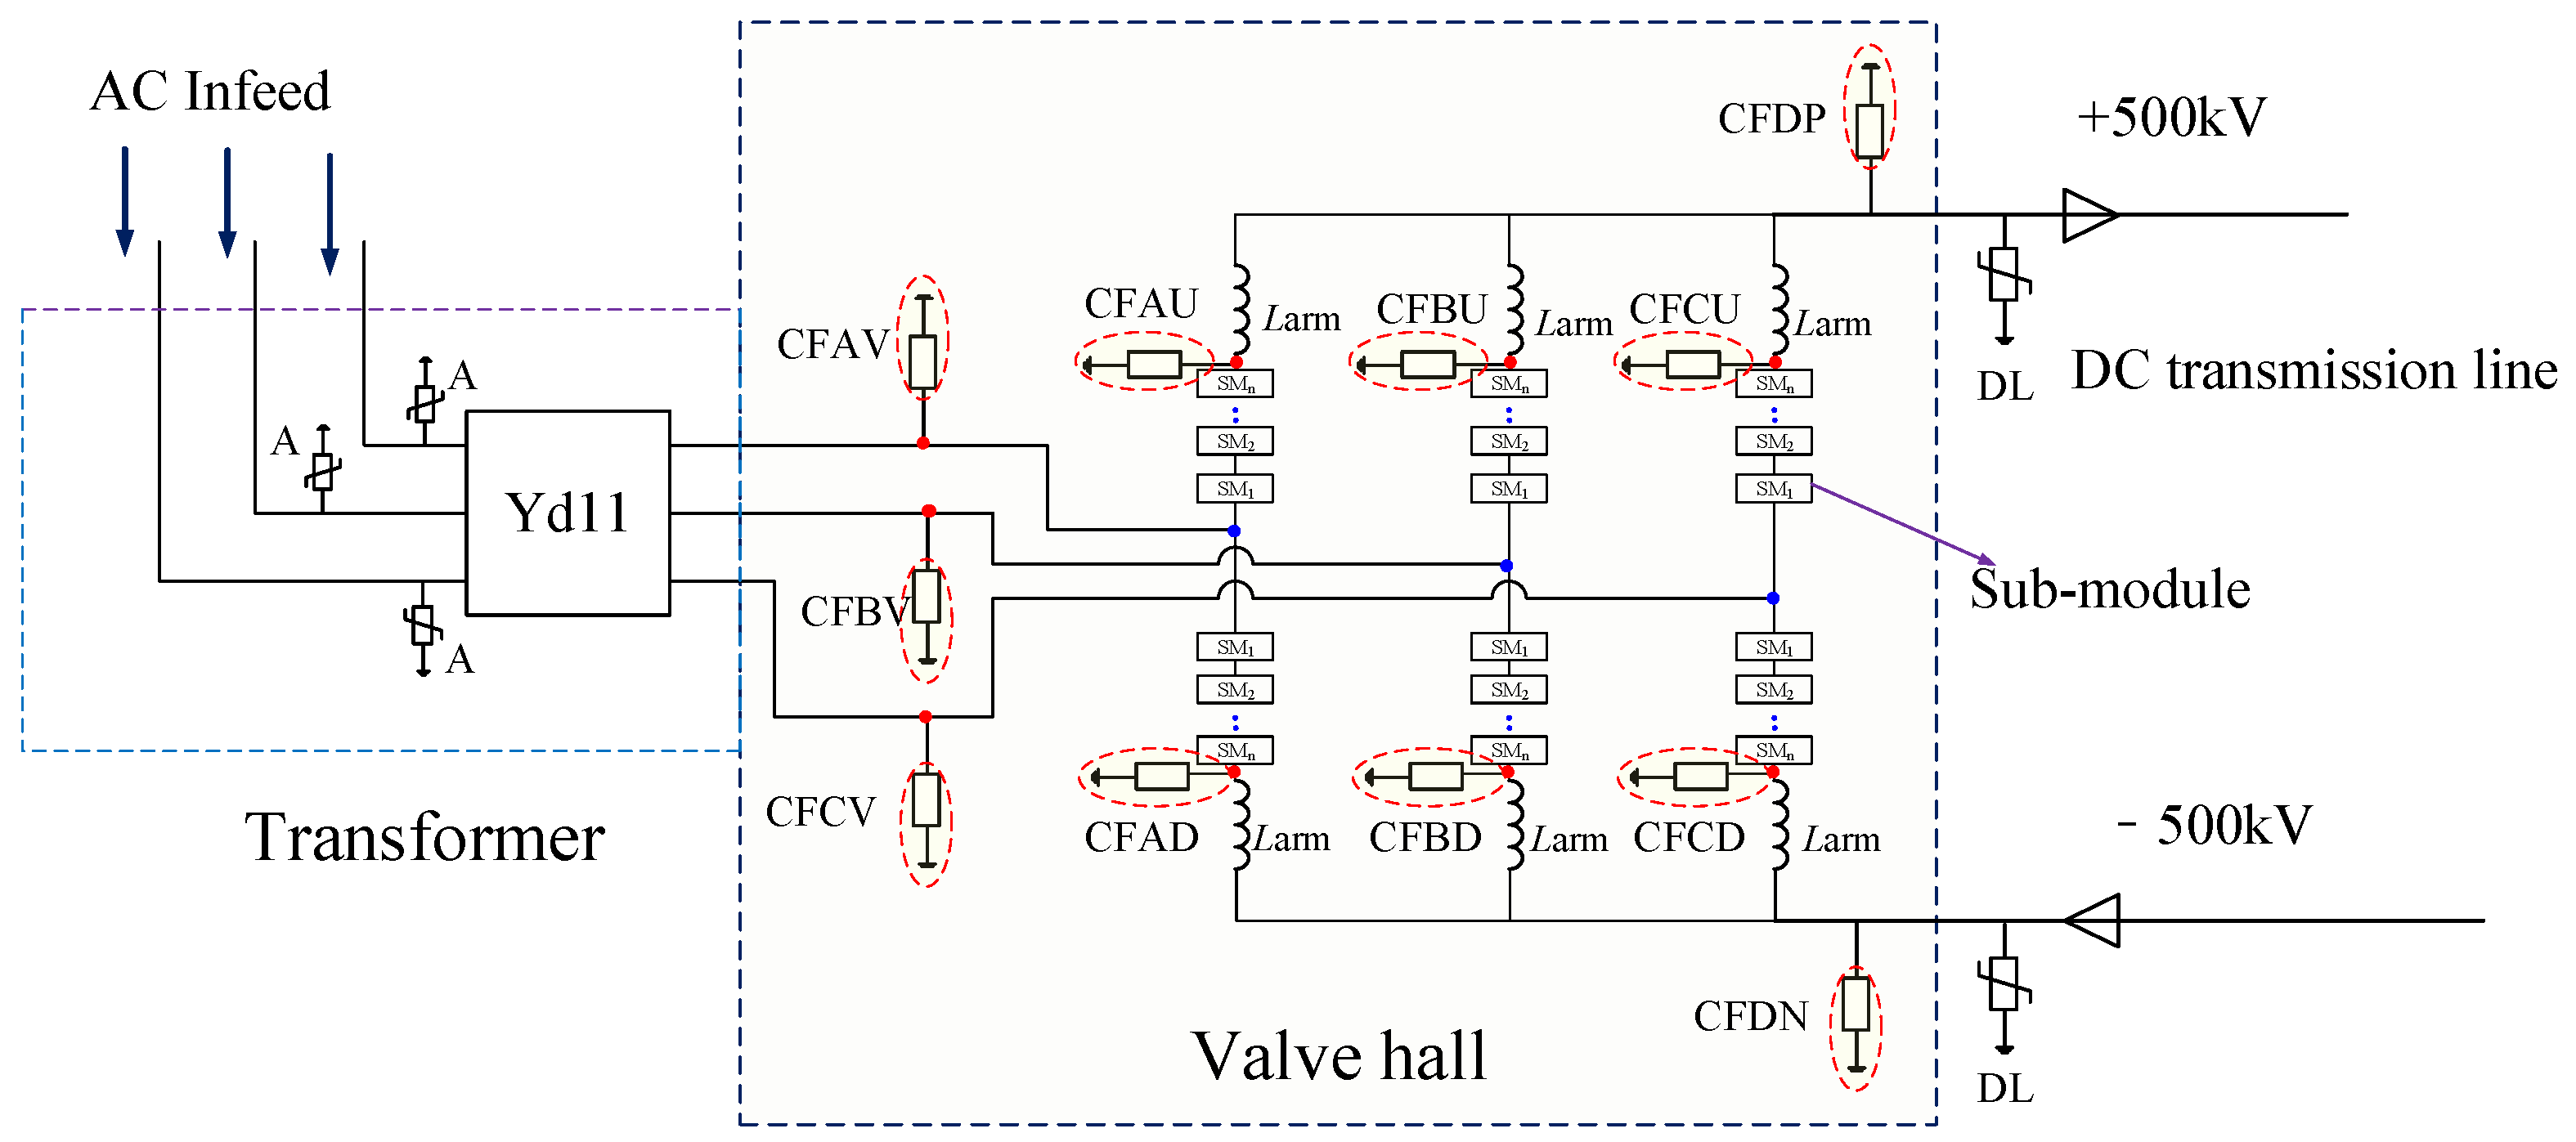
Based on the aforementioned discussion, a field–circuit coupling model was integrated into the offshore wind power MMC-HVDC transmission system model, as shown in Figure 9 [18,19,20].
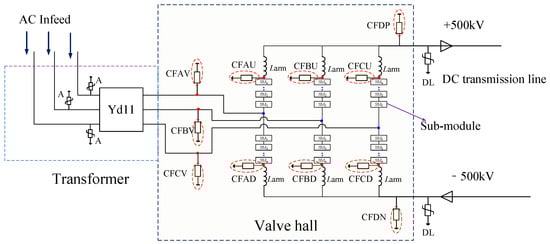
Figure 9.
Offshore wind MMC-HVDC system with field–circuit coupling model.
Figure 9 illustrates a ±500 kV, 2000 MW offshore wind power MMC-HVDC transmission system that represents an actual offshore engineering project. The project is currently in the process of technical justification and construction. The content studied in this paper is all related to the technical evaluation phase of the project.
As shown in Figure 9, a ±500 kV, 2000 MW offshore wind power MMC-HVDC transmission system model incorporating field–circuit coupled models (CFAV, CFBV, CFCV, CFAU, CFAD, CFBU, CFBD, CFCU, CFCD, CFDP, and CFDN) was established. This integration allows for a more comprehensive analysis of the system behavior under various operating conditions, particularly during transient events.
The main parameters of the ±500 kV, 2000 MW offshore wind power MMC-HVDC transmission system are shown in Table 1.

Table 1.
Main parameters of offshore MMC-HVDC system.
The parameter table presented herein represents the critical parameters of the system during the system validation process, which were derived through the following formulas and corroborated with the simulation checks.
The design of the sub-module capacitor is illustrated as follows [14]:
In Equation (10), Csm is the sub-module capacitance value, m is the MMC voltage modulation ratio, ε is the sub-module voltage ripple, εmax is the maximum sub-module voltage ripple, usmd is the sub-module rated voltage, S is the MMC rated capacity, N is the number of rated sub-modules per arm, and ω is the AC side angular frequency. The calculated value was then validated through system simulations to obtain the theoretical capacitance value presented in Table 1.
Concurrently, an electric field calculation model for the MMC valve was developed. The voltages at critical locations within the system serve as input conditions for the electric field model calculations.
The voltage–current (V-I) characteristics’ model of the MOV at these locations is also integrated into the field–circuit coupled models. The electric field strength, stray parameter values calculated by the electric field model, and the instantaneous system voltages are then input into the corresponding field–circuit coupled model at each location.
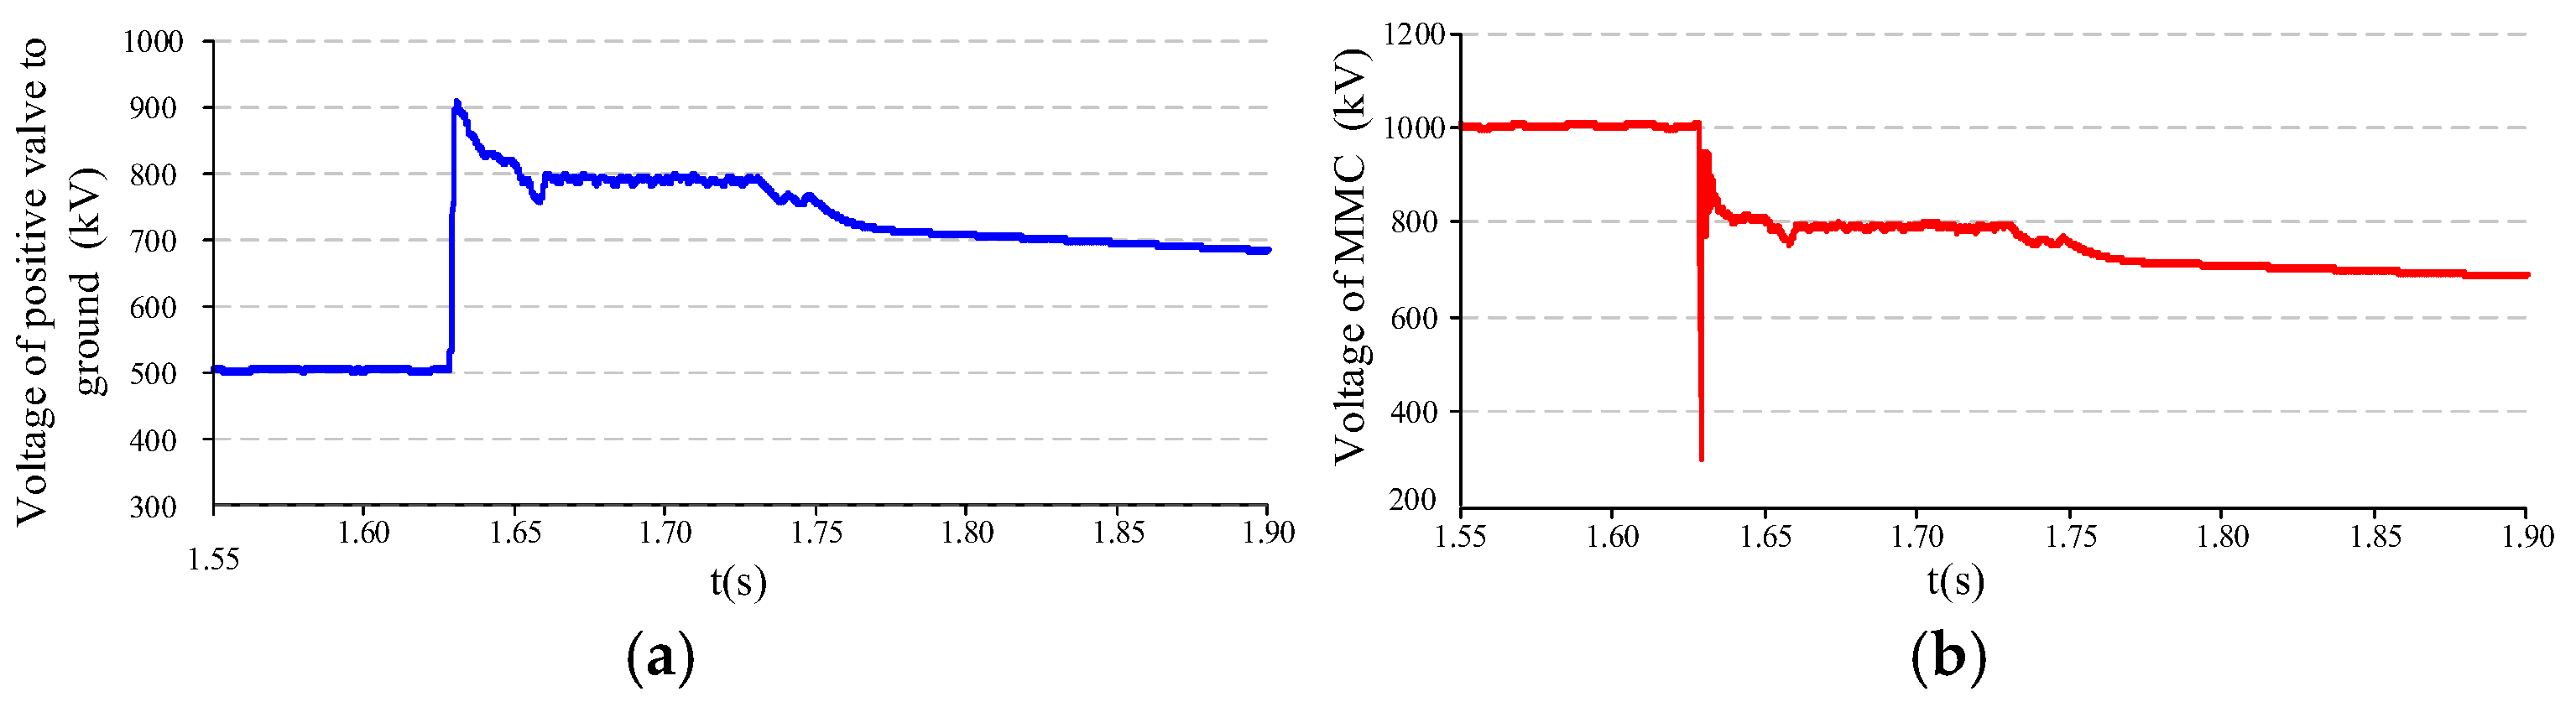
When a valve bottom ground fault occurs at the offshore station, the voltage waveform at the MMC and the voltage between the positive valve terminal and the ground are shown in Figure 10.

Figure 10.
Voltage of offshore MMC (a) and voltage of positive valve (b) to ground during fault.
As shown in Figure 10, after a ground fault occurs at the valve bottom of the system, the control and protection system detects the fault and performs a lockout and shutdown protection action. During the fault process, severe overvoltage is generated in the system. The voltage values are then input into the electric field calculation model of the MMC valve.
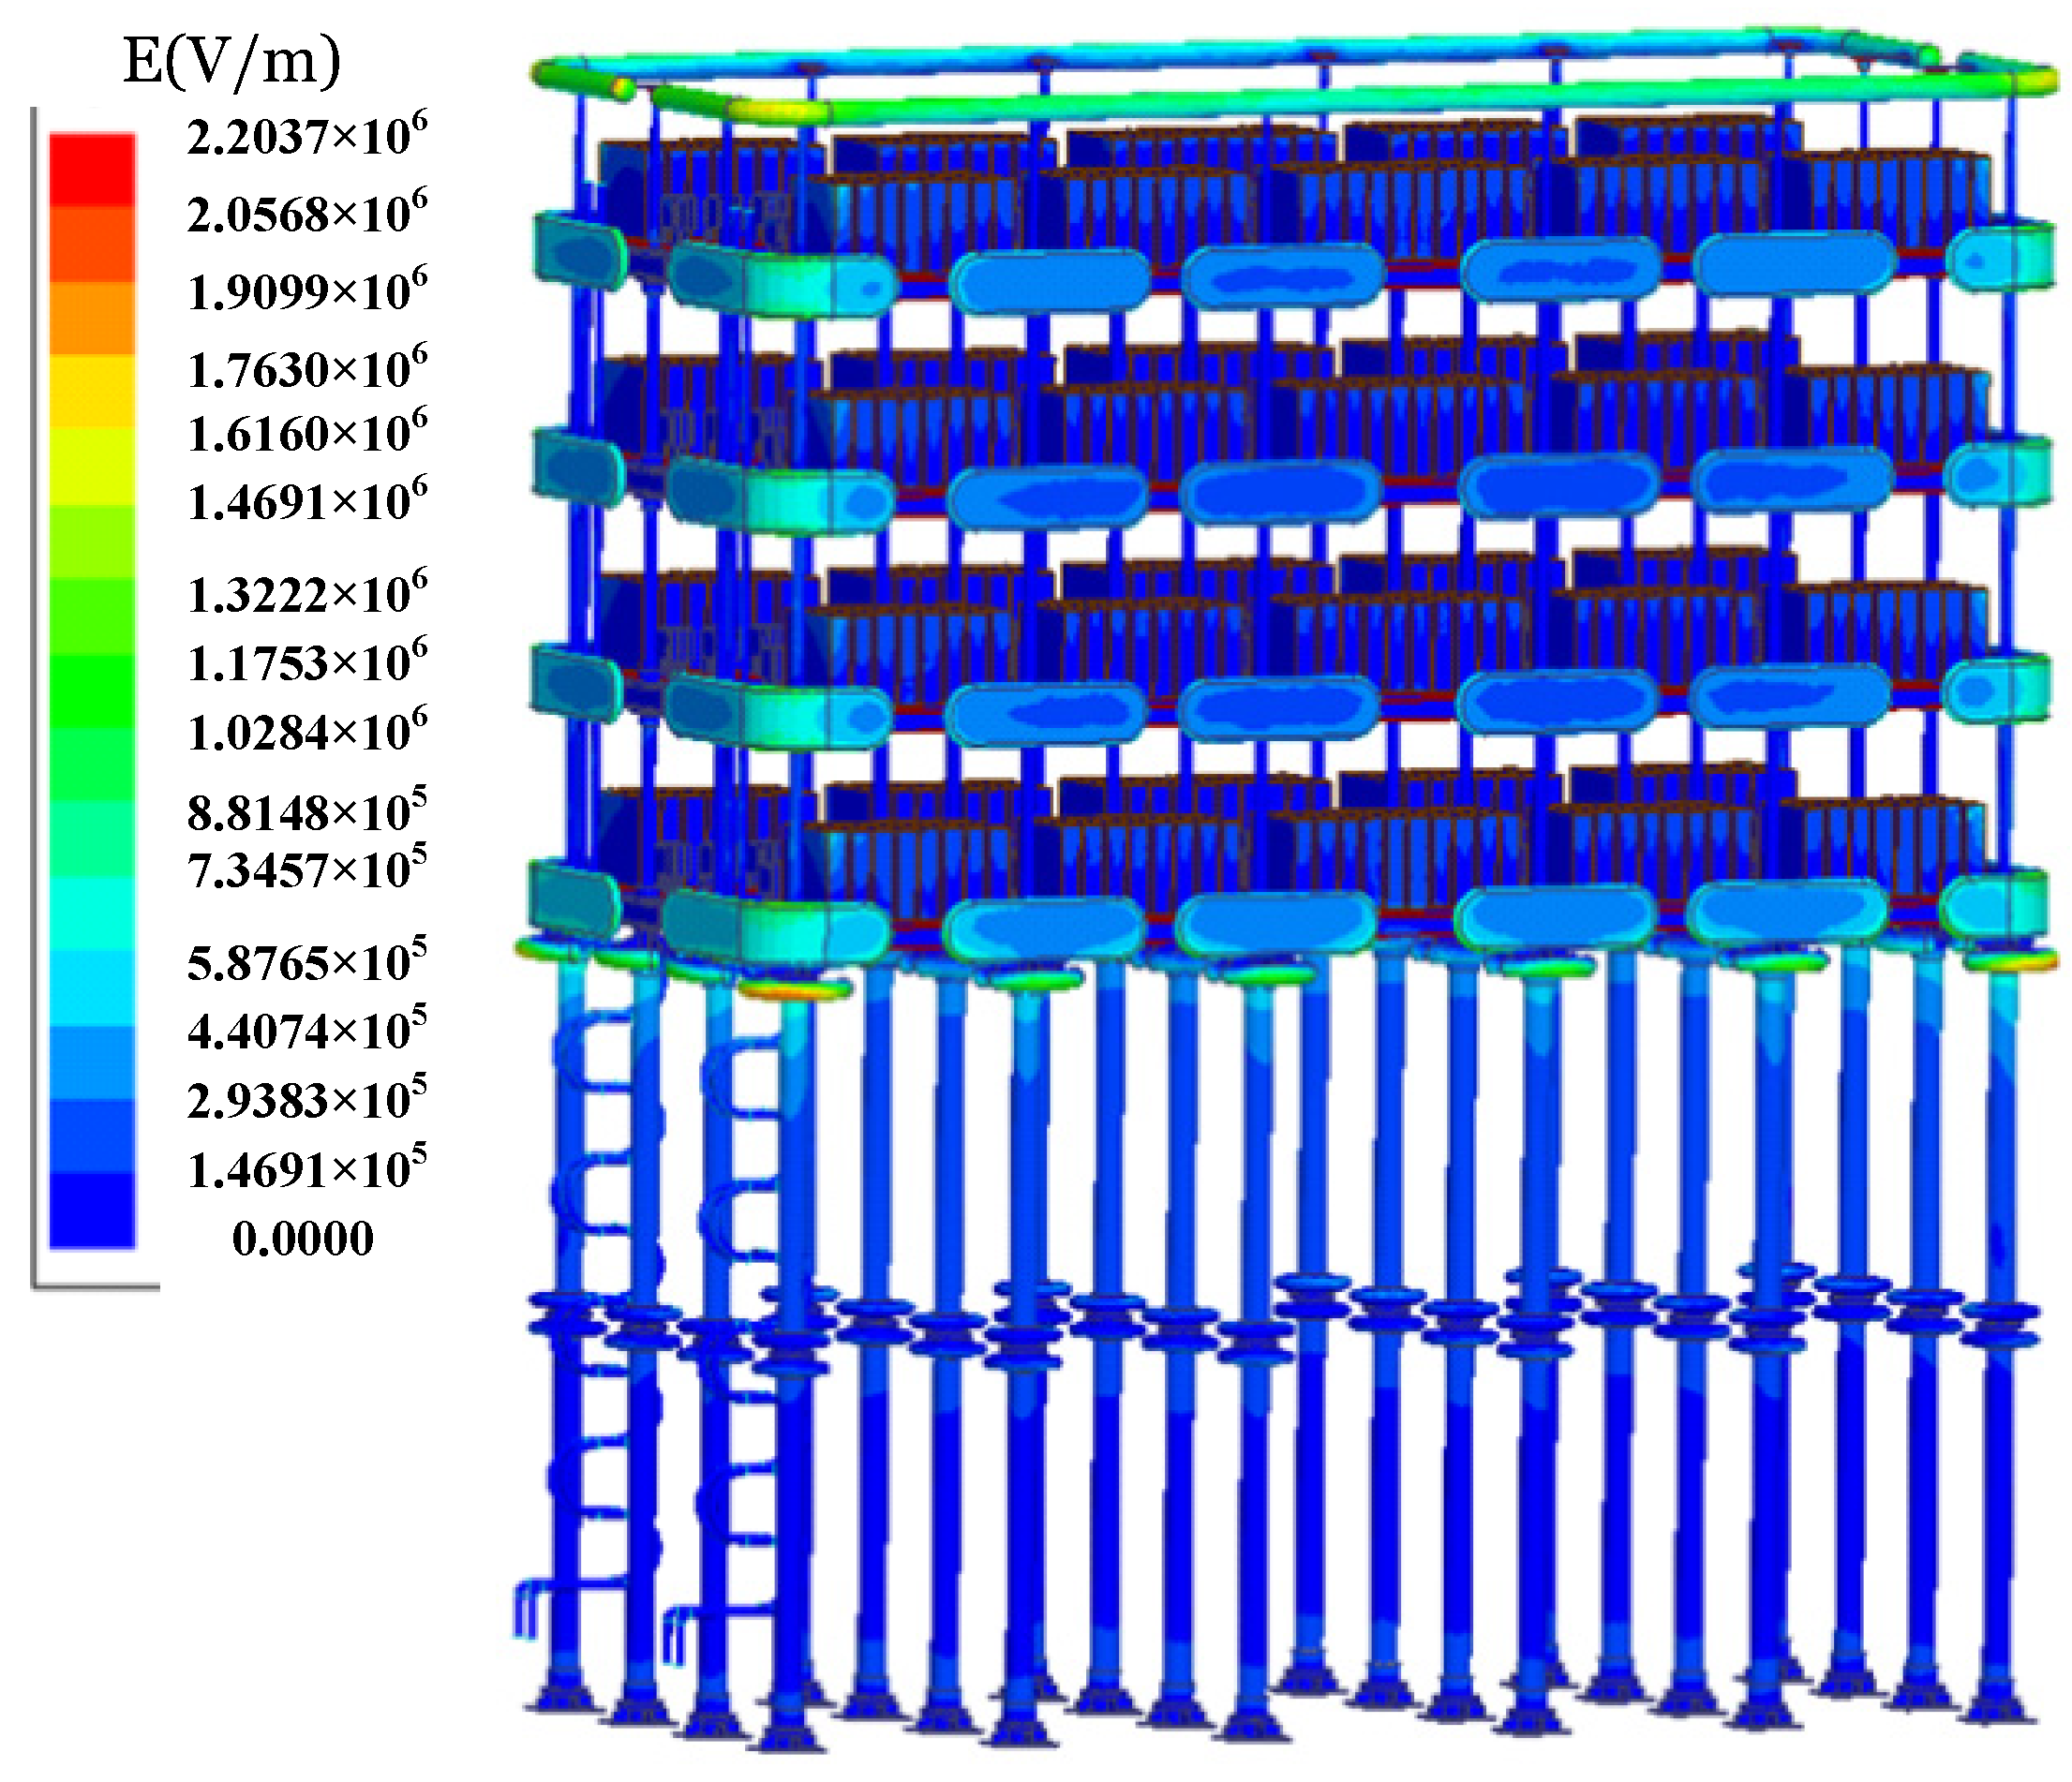
When a severe fault occurs within the offshore converter station, the electric field distribution when the converter valve voltage reaches its maximum increase is shown in Figure 11.
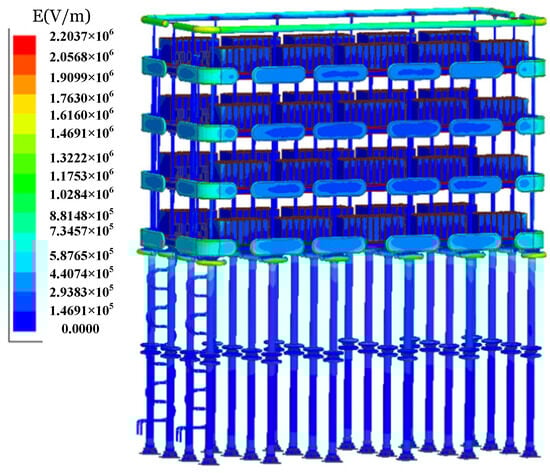
Figure 11.
Electrical field distribution of MMC valve during fault.
As shown in Figure 11, during a fault in the system, the electric field distribution characteristics and stray capacitance under the fault impulse excitation are calculated.
Through the electric field calculation, the maximum electric field strength at the end of the MMC valve reaches 2.2 kV/mm under the voltage peak condition. The maximum electric field strength is lower than the air breakdown field strength of 3.0 kV/mm.
Therefore, the resistance Rg is infinite. By the electric field calculation, the capacitance between the valve terminal and ground is approximately 108 pF.
The calculated stray capacitance and the results of the electric field analysis are input in real-time into the offshore MMC-HVDC system model, as shown in Figure 9. The MOV arrester current and absorbed energy in the CF model are shown in Figure 12.
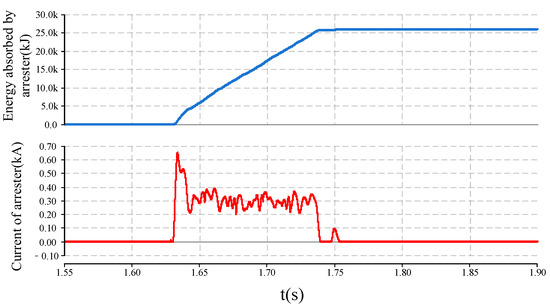
Figure 12.
Energy and current of arrester during fault.
As shown in Figure 12, the results of the field–circuit coupled model demonstrate that the occurrence of significant overvoltage during the fault event leads to the activation of the surge arrester.
As stated in Equation (3), the passage of large currents through the metal oxide varistor (MOV) results in the manifestation of a low-impedance characteristic of the MOV within the CF model, as shown in Figure 6. This low-impedance state allows the MOV to effectively divert fault currents, thereby protecting the system from overvoltage damage.
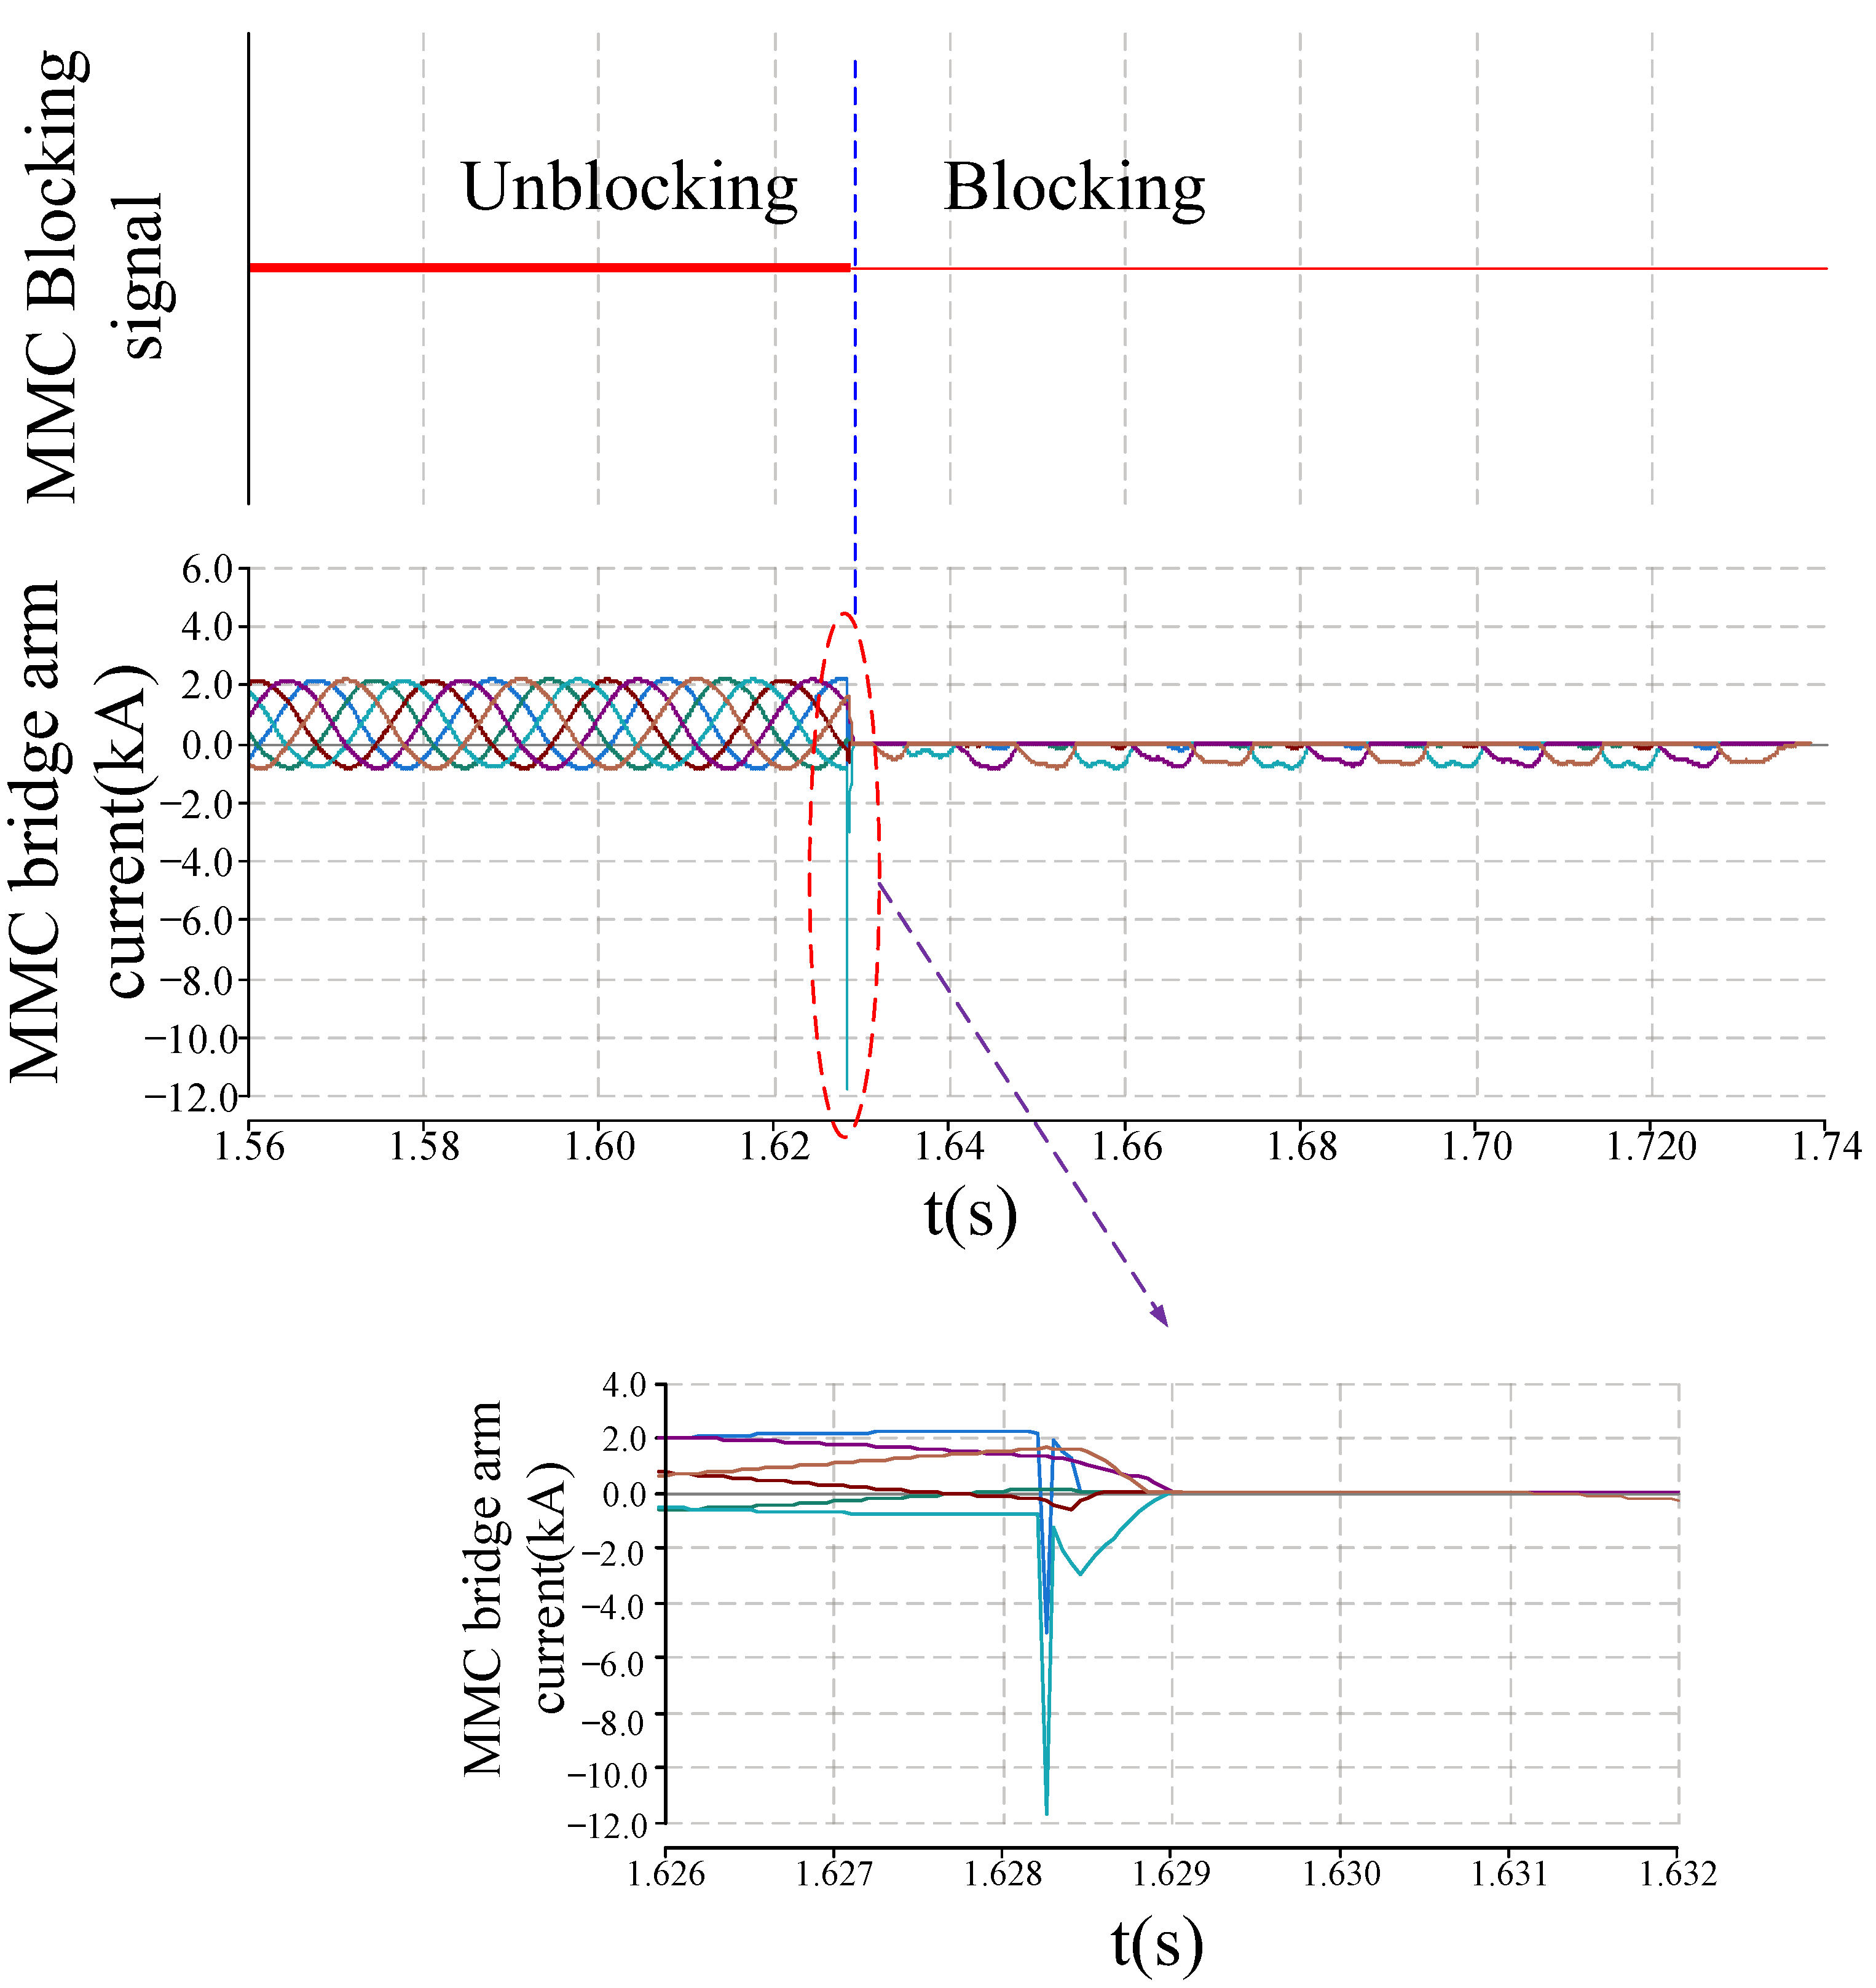
The current of the MMC valve during the fault, analyzed using the field–circuit coupled model of the ±500 kV MMC-HVDC transmission system, is shown in Figure 13.
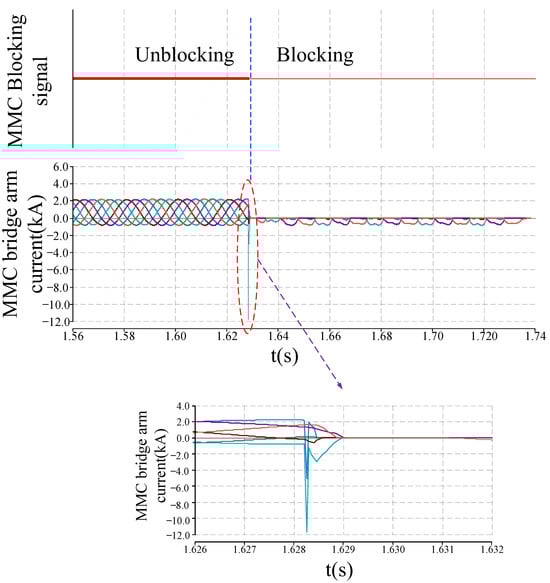
Figure 13.
Overcurrent waveform of offshore MMC during fault.
As shown in Figure 13, the establishment of the CF model in the system fault analysis takes into account the stray capacitance of the MMC valve.
The electric field and MOV nonlinear parameters are also applied to the establishment of the CF model. The current through the MMC valve becomes distorted before the system is locked out, with its peak significantly exceeding 4000 A. This may lead to the damage of IGBT.
To compare the advantages of the method proposed in this paper, the overcurrent in the MMC valve is investigated using conventional analysis methods without the field–circuit coupling model. Under identical simulation conditions, when a valve bottom ground fault occurs at the offshore station, the current of the MMC valve analyzed using conventional analysis methods is shown in Figure 14.
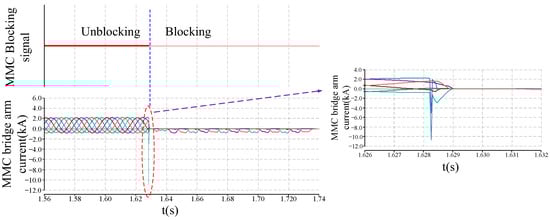
Figure 14.
Overcurrent waveform calculated by conventional calculation method.
The conventional analysis presented in Figure 14 does not account for the influence of stray parameters. As a result, the current peak in Figure 14 is reduced compared to that in Figure 13. Despite the consistency of the main circuit parameters and system parameters, the overcurrent anomaly still occurred in Figure 14.
As shown in Figure 14, after the current anomaly occurs, the cause cannot be determined due to the absence of the field–circuit coupling model described in this paper.
Under identical simulation conditions, simulations of the overcurrent in the MMC valve were performed using two different analysis methods. The comparative results of the two methods are summarized in Table 2.
Table 2.
Comparison results of two methods for overcurrent analysis.
As shown in Table 2, the analysis method proposed in this paper enables a comprehensive investigation into the causes of overcurrent anomalies. Factors affecting overcurrent, such as insulation faults, improper design of surge arresters, and stray parameters, have all been taken into account. The field–circuit coupling model developed herein allows for rapid and real-time parameter computation. Furthermore, it enables preemptive risk assessment based on the data from the CF models, as shown in Figure 6.
This approach facilitates swift and real-time localization of factors causing overcurrent anomalies and, on this basis, enables the formulation of more rational current suppression strategies. The field–circuit analysis method proposed in this paper offers distinct advantages in both the system design and argumentation phase, as well as in subsequent operational fault analysis.
Based on the calculation results from Figure 13, it is evident that the preliminary system parameters, including overcurrent protection strategy and settings, might not be reasonable. The initial design parameters of the MMC valve structure might also be unreasonable. Therefore, it is necessary to optimize the system design in response to the distortion of the MMC valve current.
5. Overcurrent Suppression Strategy and Verification
Based on the development process of overcurrent in the MMC valve shown in Figure 3, the magnitude of the overcurrent in the MMC valve is primarily determined by the fault current during the two stages S1 and S2. The rate of current rise and the delay in protection action determine the peak value Ipeak. Due to hardware limitations, optimization of the valve control link delay (t2~t3) is limited.
As shown in Figure 3, the overcurrent suppression can theoretically be approached from two directions.
- (1)
- Reducing the rate of current rise during the fault keeps Ipeak within a reasonable range during the time interval when the control and protection system is enabled. To achieve this, it is necessary to optimize the loop parameters or structure of the MMC-HVDC system to improve the fault loop characteristics.
- (2)
- Enhancing the sensitivity of overcurrent protection. Reducing the duration of time interval S1 and enabling the rapid activation of overcurrent protection. Effective suppression of Ipeak can be achieved.
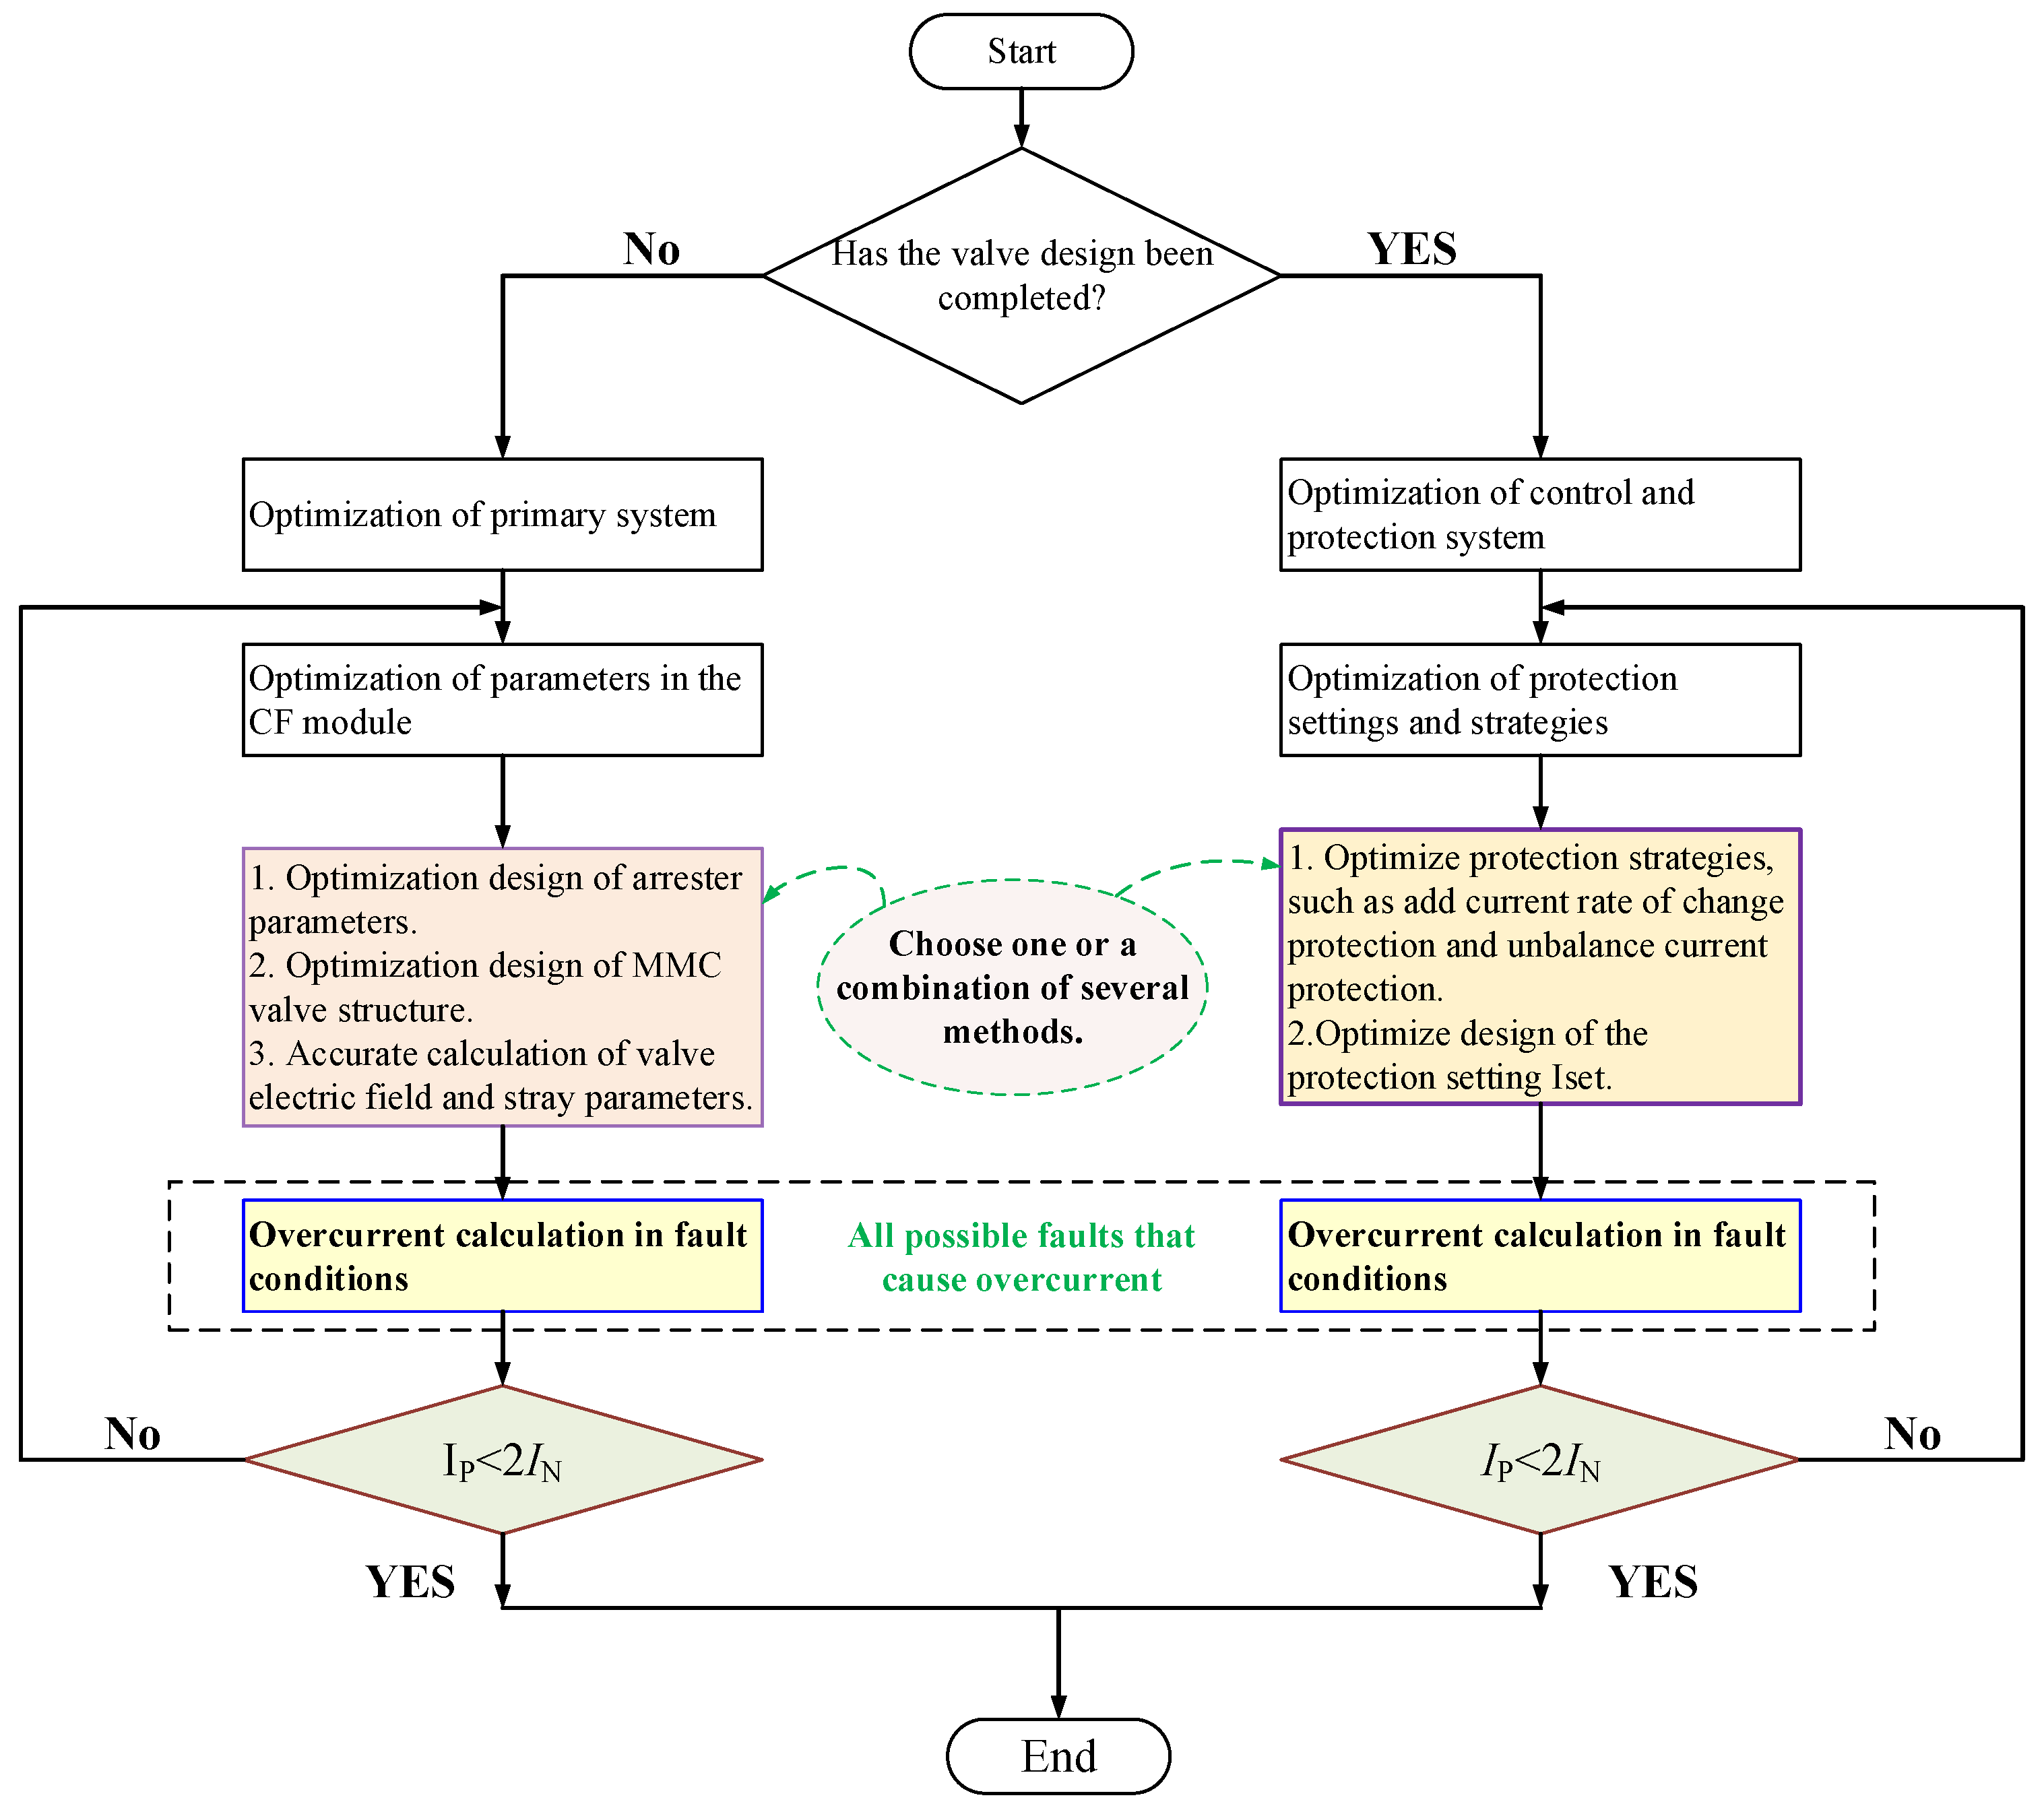
In summary, the suppression strategy for overcurrent of the MMC valve is shown in Figure 15.
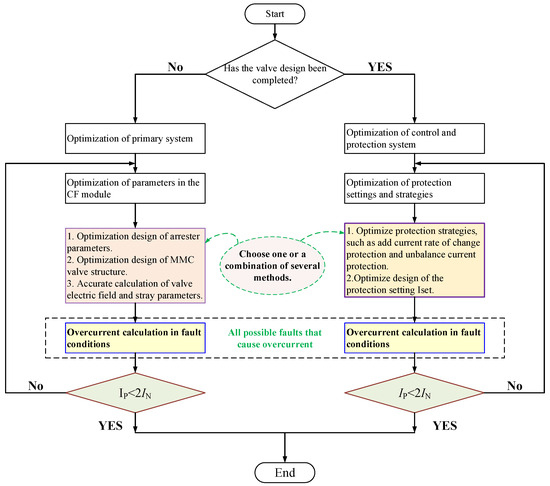
Figure 15.
Diagram of MMC overcurrent suppression strategy.
As shown in Figure 15, once the MMC valve design is finalized, the only options for overcurrent suppression are to modify the fault detection time, t1~t2, and the setting Iset.
More sensitive protection methods, such as rate-of-rise protection and unbalanced current protection, can be employed to reduce t2. Alternatively, without changing the original protection strategy, the setting Iset can be optimized within a reasonable range, such as by adopting a two-stage overcurrent protection strategy for the bridge arm.
If the offshore wind power MMC-HVDC transmission system is still in the design phase and the system parameters have not yet been finalized, then the optimal solution for suppressing overcurrent is to optimize the parameters of the primary system.
By employing the field–circuit coupled analysis method demonstrated in this paper, a comprehensive investigation of overcurrent in MMC valves can be conducted.
This approach enables the identification of factors that lead to high overcurrent levels in advance and, based on these findings, proposes effective strategies for overcurrent suppression.
The ±500 kV MMC-HVDC system shown in Figure 9 is still in the validation process. Drawing on the simulation waveforms from Figure 11, Figure 12 and Figure 13, the arrester scheme in the CF model is optimized by reasonably increasing the reference voltage of the arresters.
After re-evaluating and verifying the insulation coordination design, the MMC valve current under the same fault condition shown in Figure 9 is indicated in Figure 16.
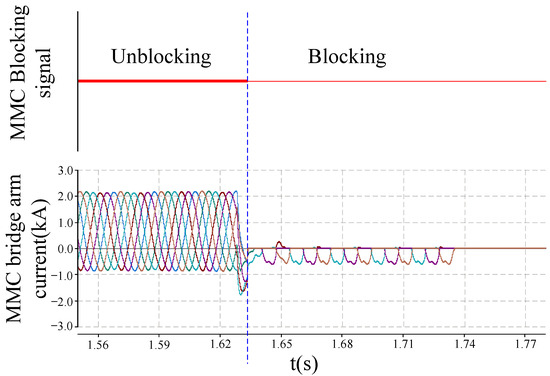
Figure 16.
MMC overcurrent after using current suppression strategy.
As shown in Figure 16, the CF model within the system was optimized through a refined design approach.
Consequently, the system simulation no longer exhibits any additional discharge paths. During the fault process, the current through the MMC valve does not display any spikes. The peak current of the converter valve is approximately 2800 A, which is less than 2IN (4000 A). Thus, the MMC valve current complies with the safety requirements for system operation during the fault process.
6. Conclusions
A field–circuit coupling analysis method for overcurrent research in MMC valves is proposed in this paper. The method integrated the electric field characteristics of the MMC valve with the analysis of the MMC-HVDC system. Given the limited overcurrent capability of semiconductor devices in MMC valves and the significant impact of overcurrent phenomena on the safe operation and system parameter design, accurate calculation of overcurrent in MMC valves is essential and complex.
Firstly, the method investigates the characteristics and influencing factors of fault currents in valves. Control and protection strategies, protection settings, and post-fault circuit characteristics all contribute to variations in fault currents.
Additionally, transient parameter changes in nonlinear components, stray parameters of the valve, and electric field distribution can influence the fault loop under transient conditions. Subsequently, a field–circuit coupling model and an electric field calculation model for valves were established, with the system’s instantaneous voltage serving as the input for electric field calculation and surge arrester transients. The electric field strength and capacitance values obtained from the electric field calculation were used as inputs for Cg and Rg in the field–circuit coupling model. Through this model, the operational circuit characteristics of the system were combined with the electric field characteristics of the valve, enabling precise calculation of overcurrent and the accurate design of suppression strategies. Finally, the method proposed in this paper was applied to the ±500 kV offshore MMC-HVDC system for overcurrent analysis and suppression strategy design.
Simulation experiments were conducted, and the numerical results demonstrate the effectiveness and correctness of the method presented in this paper. This research provides a solid basis for the accurate calculation of overcurrent protection strategies and settings and for improving the utilization rate of power devices in offshore MMC-HVDC valves.
In the future, a substantial amount of electrical data from system operations can be utilized for model verification. By incorporating measured values such as leakage current of bushings, insulation monitoring quantities of surge arresters, and leakage current of insulators in high-voltage equipment into the field–circuit coupling model proposed in this paper, preemptive risk assessment and rational suppression measures can be developed for system operation. Additionally, the method demonstrated in this paper can be utilized to guide the design of new MMC-HVDC transmission systems.
Author Contributions
Conceptualization, J.Z., S.W., Y.H. and R.T.; methodology, J.Z. and S.W.; software, J.Z.; validation, J.Z.; formal analysis, J.Z.; investigation, J.Z.; resources, J.Z.; data curation, J.Z.; writing—original draft preparation, J.Z.; writing—review and editing, J.Z.; visualization, J.Z. All authors have read and agreed to the published version of the manuscript.
Funding
This research was supported by the State Key Laboratory of Electrical Insulation and Power Equipment (No. EIPE22120).
Institutional Review Board Statement
Not applicable.
Informed Consent Statement
Not applicable.
Data Availability Statement
The original contributions presented in this study are included in the article. Further inquiries can be directed to the corresponding author.
Conflicts of Interest
The authors declare no conflict of interest.
References
- Wu, S.; Qi, L.; He, Z.; Jia, W.; Zhang, X. A voltage-boosting sub modules based modular multilevel converter with temporary energy storage ability for fault ride through of offshore wind VSC-HVDC system. IEEE Trans. Sustain. Energy 2022, 13, 2172–2183. [Google Scholar] [CrossRef]
- Pan, E.; Yue, B.; Li, X.; Zhao, Z.; Zhu, Q. Integration technology and practice for long-distance offshore wind power in China. Energy Convers. Econ. 2020, 1, 4–19. [Google Scholar] [CrossRef]
- Yang, B.; Liu, B.; Zhou, H.; Wang, J.; Yao, W.; Wu, S.; Shu, H.; Ren, Y. A critical survey of technologies of large offshore wind farm integration: Summarization, advances, and perspectives. Prot. Contr. Mod. Pow Syst. 2022, 7, 1–32. [Google Scholar] [CrossRef]
- Guest, E.; Jensen, K.H.; Rasmussen, T.W. Mitigation of harmonic voltage amplification in offshore wind power plants by wind turbines with embedded active filters. IEEE Trans. Sustain. Energy 2020, 11, 785–794. [Google Scholar] [CrossRef]
- Xu, C.; Zhang, X.; Yu, Z.; Zhao, B.; Chen, Z.; Zeng, R. A novel DC chopper with MOV-based modular solid-state switch and concentrated dissipation resistor for ±400 kv/1100 MW offshore wind VSC-HVDC system. IEEE Trans. Power Electron. 2020, 35, 4483–4488. [Google Scholar] [CrossRef]
- Shen, H.; Zhang, X.; Qi, L. A novel snubber circuit for mmc submodule using gap-rc to suppress fast transient overvoltage. IEEE Trans. Power Electron. 2023, 38, 12406–12410. [Google Scholar] [CrossRef]
- Shao, Y.; Zhang, B.; Xie, Y. A voltage full-waveform reconstruction method based on radiative near-field of electric field for the hybrid dc breaker of MMC-HVDC. IEEE Trans. Power Deliv. 2023, 38, 3496–3509. [Google Scholar]
- Xiao, L. A DC fault protection scheme for MMC-HVDC grids using new directional criterion. IEEE Trans. Power Deliv. 2021, 36, 1569–1577. [Google Scholar]
- Li, X.T.R.; Tang, Y. Comparative analysis of three types of SFCL considering current-limiting requirement of MMC-HVDC system. IEEE Trans. Appl. Supercond. 2021, 31, 5604505. [Google Scholar]
- Kim, G.W.; Choi, H.S. Limiting characteristics of capacitor discharge current of MMC-based system using the SFCL on short circuit. IEEE Trans. Appl. Supercond. 2022, 32. [Google Scholar] [CrossRef]
- Zhou, H.; Yao, W.; Sun, K. Dynamic reactive current optimization based onshore AC fault ride-through strategy for MMC-HVDC integrated offshore wind farms. IEEE Trans. Power Deliv. 2024, 15, 735–746. [Google Scholar] [CrossRef]
- Liu, S.; Li, B.; Li, A. Influence analysis of new energy proportion in the AC system on DC fault current of the MMC-HVDC system. In Proceedings of the 25th Asia Energy and Electrical Engineering Symposium (AEEES), Chengdu, China, 23–26 March 2023. [Google Scholar] [CrossRef]
- Zhu, R.; Lin, N.; Dinavahi, V. An accurate and fast method for conducted EMI modeling and simulation of MMC-based HVDC converter station. IEEE Trans. Power Electron. 2020, 35, 9876–9887. [Google Scholar] [CrossRef]
- Xu, Z. Flexible DC Transmission Systems, 2nd ed.; China Machine Press: Beijing, China, 2017; pp. 68–88. [Google Scholar]
- Qi, L.; Shuai, Q.; Cui, X. Parameter extraction and wideband modeling of ±1100 kV converter valve. IEEE Trans. Power Electron. 2017, 32, 1823–1832. [Google Scholar] [CrossRef]
- Sun, T.; Lu, X.; Cai, J. A calculation method of IGBT insulation voltages based on sub module stray capacitors in MMC. IEEE Trans. Power Electron. 2024, 39, 16187–16200. [Google Scholar] [CrossRef]
- Zhou, W.; Zhao, B.; Lou, Y. Current oscillation phenomenon of mmc based on IGCT and fast recovery diode with high surge current capability for HVDC application. IEEE Trans. Power Electron. 2021, 36, 4689–4702. [Google Scholar] [CrossRef]
- He, L.; Liu, C.-C. Protection Coordination between HVDC Off-Shore Wind System and AC Grid. In Proceedings of the CIGRE Symposium on the Future of Electrical Power Systems, Bologna, Italy, 13–15 September 2011; pp. 114–120. [Google Scholar]
- Li, Y.; Wang, X.; Guo, J.; Wu, H.; Zhao, B.; Wang, S.; Wu, G.; Wang, T. PLL synchronization stability analysis of MMC-connected wind farms under high-impedance AC faults. IEEE Trans. Power Syst. 2021, 36, 2251–2261. [Google Scholar] [CrossRef]
- Deng, F.; Jin, M.; Liu, C. Switch open-circuit fault localization strategy for MMC using sliding-time window based features extraction algorithm. IEEE Trans. Ind. Electron. 2020, 68, 10193–10206. [Google Scholar] [CrossRef]


Disclaimer/Publisher’s Note: The statements, opinions and data contained in all publications are solely those of the individual author(s) and contributor(s) and not of MDPI and/or the editor(s). MDPI and/or the editor(s) disclaim responsibility for any injury to people or property resulting from any ideas, methods, instructions or products referred to in the content. |
© 2025 by the authors. Licensee MDPI, Basel, Switzerland. This article is an open access article distributed under the terms and conditions of the Creative Commons Attribution (CC BY) license (https://creativecommons.org/licenses/by/4.0/).