
Case Study on Response Characteristic of Surroundings Induced by a Covered Semi-Top-Down Excavation with Synchronous Construction of the Superstructure and Substructure


Abstract
Featured Application
Abstract
1. Introduction
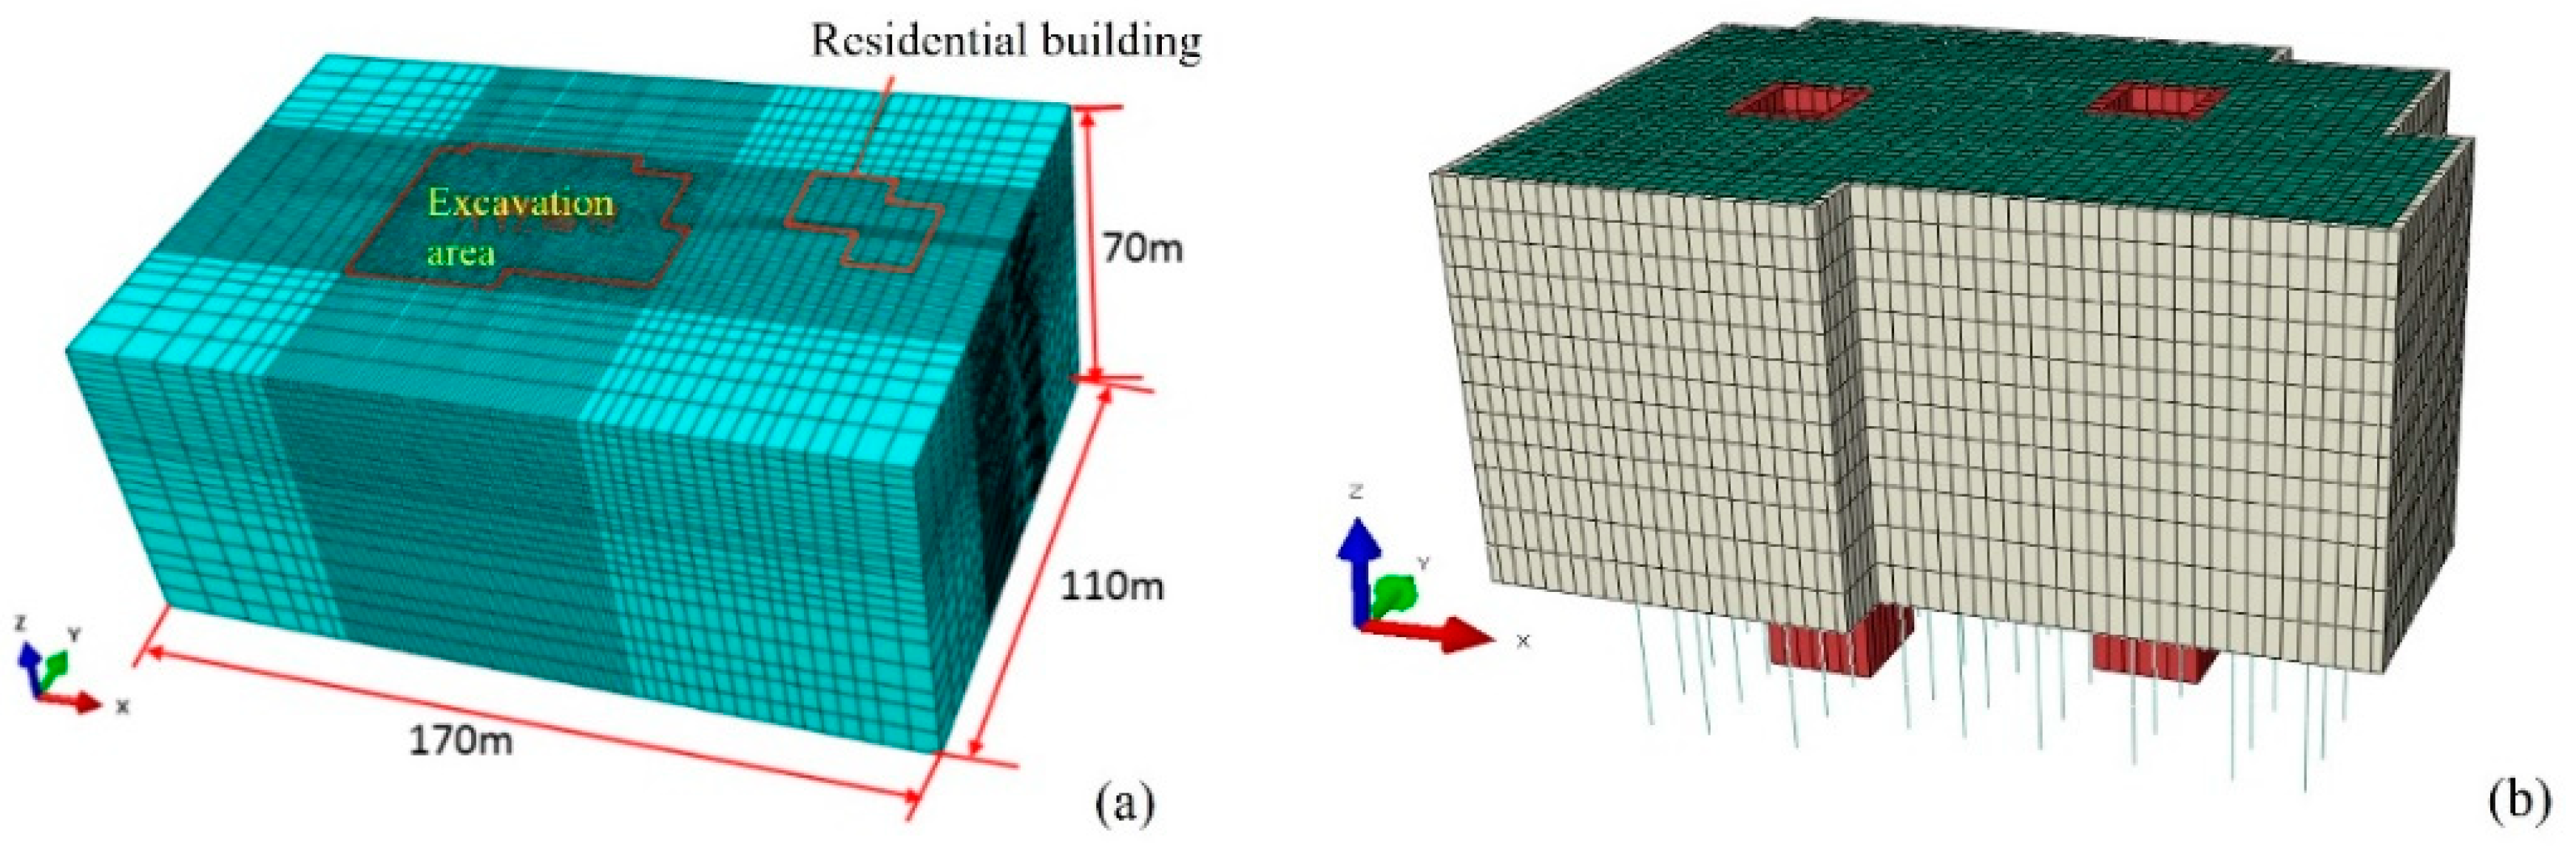
2. Project Overview
- (1)
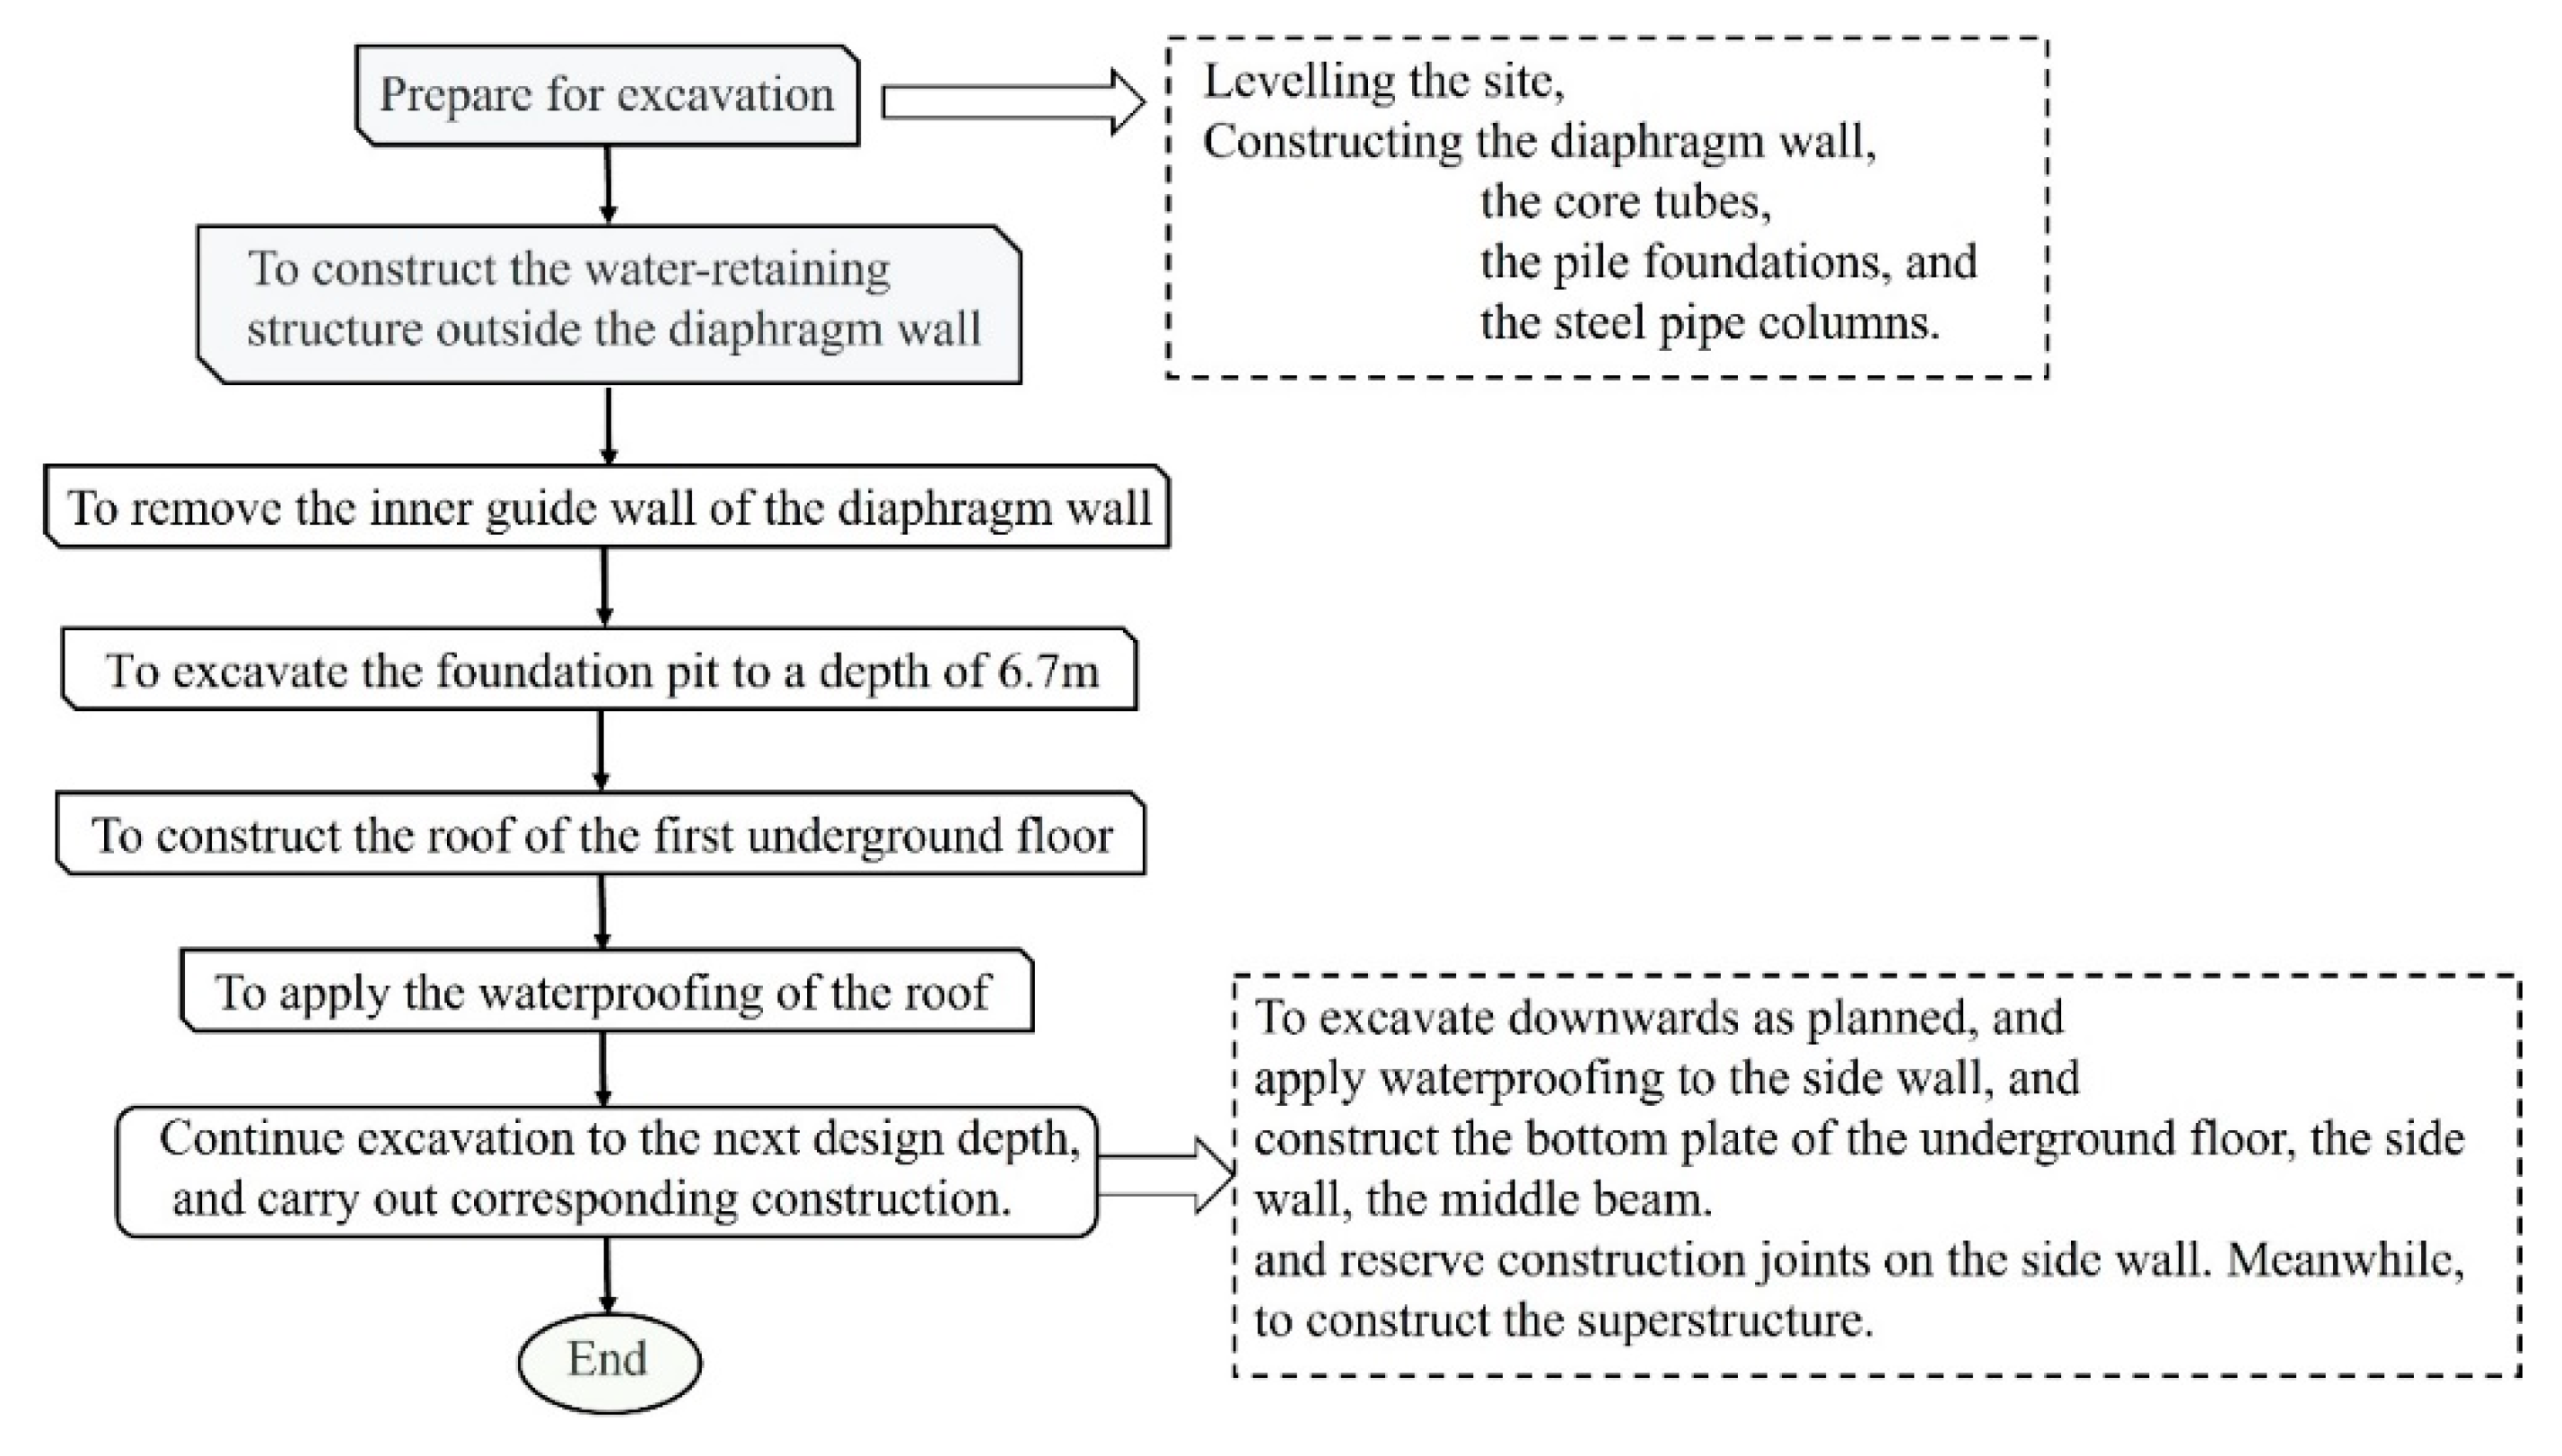
- Prepare for excavation, including leveling the site, constructing the diaphragm wall, the core tubes, the pile foundations, and the steel pipe columns inside the pit;
- (2)
- To construct the water-retaining structure outside the diaphragm wall, remove the inner guide wall of the diaphragm wall, then excavate 6.7 m downwards and construct the roof of the first underground floor;
- (3)
- After the strength of the roof of the first underground floor reaches 80% of the design strength, the waterproofing of the roof will be applied. Then, continue to excavate 2.3 m downwards, apply waterproofing to the side wall, and construct the roof of the second underground floor, the side wall of the first underground floor, and the middle beam, following reserve construction joints on the side wall. Meanwhile, the construction of the superstructure will reach the 5th floor;
- (4)
- After the strength of the roof of the second underground floor reaches 75% of the design strength, continue to excavate 4.1 m downwards, apply waterproofing for the side wall of the second underground floor, and construct the roof of the third underground floor, the side wall of the second underground floor, and the middle beam, following reserve construction joints on the side wall. At the same time, the construction of the superstructure reaches the 8th floor;
- (5)
- After the strength of the roof of the third underground floor reaches 75% of the design strength, continue to excavate 3.6 m downward, apply waterproofing for the side wall of the third underground floor, and construct the roof of the fourth underground floor, the side wall of the third underground floor, and the middle beam, following reserve construction joints on the side wall. Meanwhile, construct the superstructure to the 10th floor;
- (6)
- After the strength of the roof of the fourth underground floor reaches 75% of the design strength, continue to excavate 4.0 m downward, apply waterproofing for the side wall of the fourth underground floor, and construct the roof of the fifth underground floor, the side wall of the fourth underground floor, and the middle beam, following reserve construction joints on the side wall. Meanwhile, construct the superstructure to the 15th floor;
- (7)
- After the strength of the roof of the fifth underground floor reaches 70% of the design strength, continue to excavate down to the design elevation of the bottom slab; manual excavation will be adopted when 200–300 mm away from the bottom of the pit. Construct the bottom slab, apply waterproofing for the side wall of the fifth underground floor, and construct the side wall of the fifth underground floor and the sill, following reserve construction joints on the side wall. After the completion of the substructure construction, continue to complete the construction of the superstructure from the 16th to the 23rd floors.
3. Methodology
4. Results
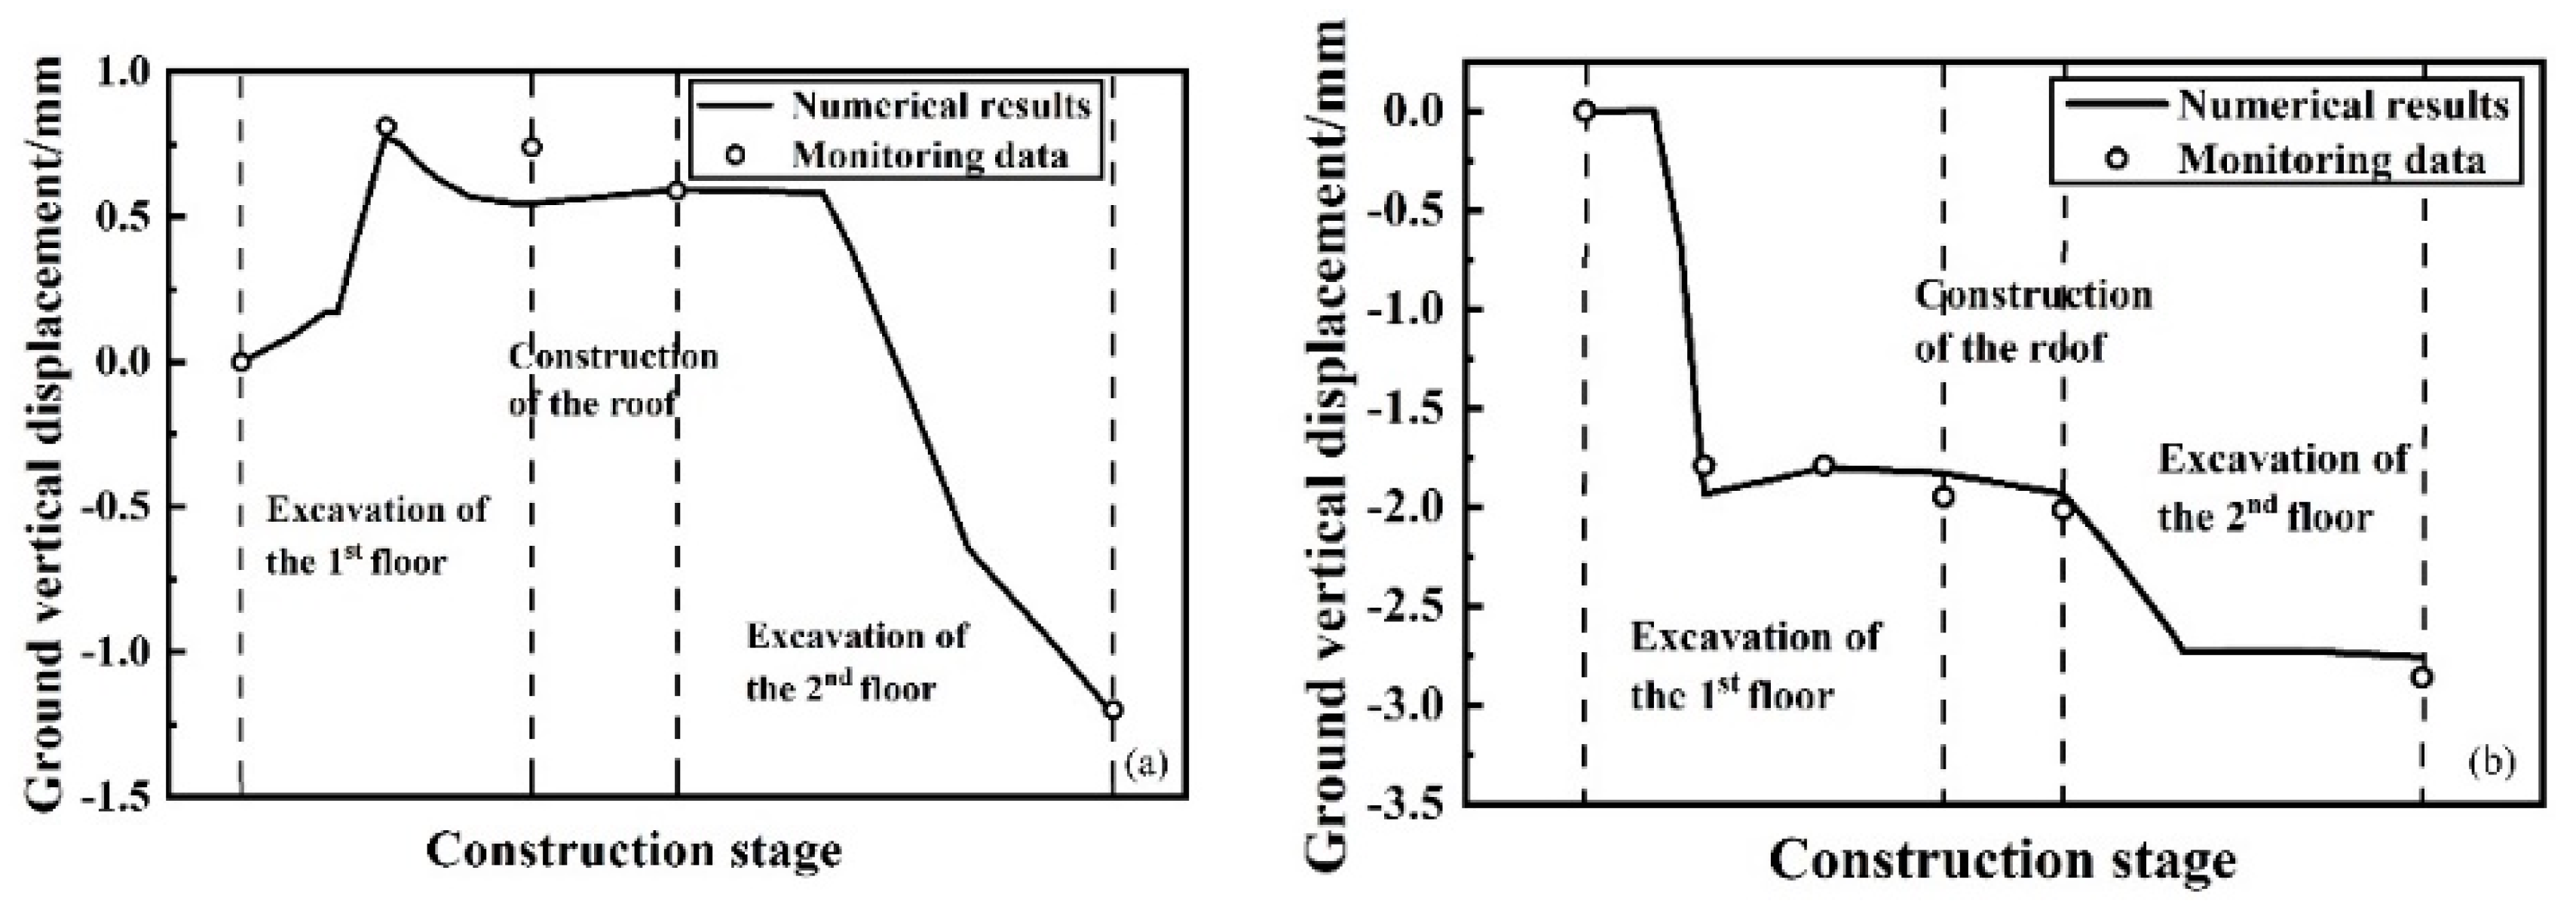
4.1. Validation of the Numerical Model
4.2. Structural Response Inside the Pit
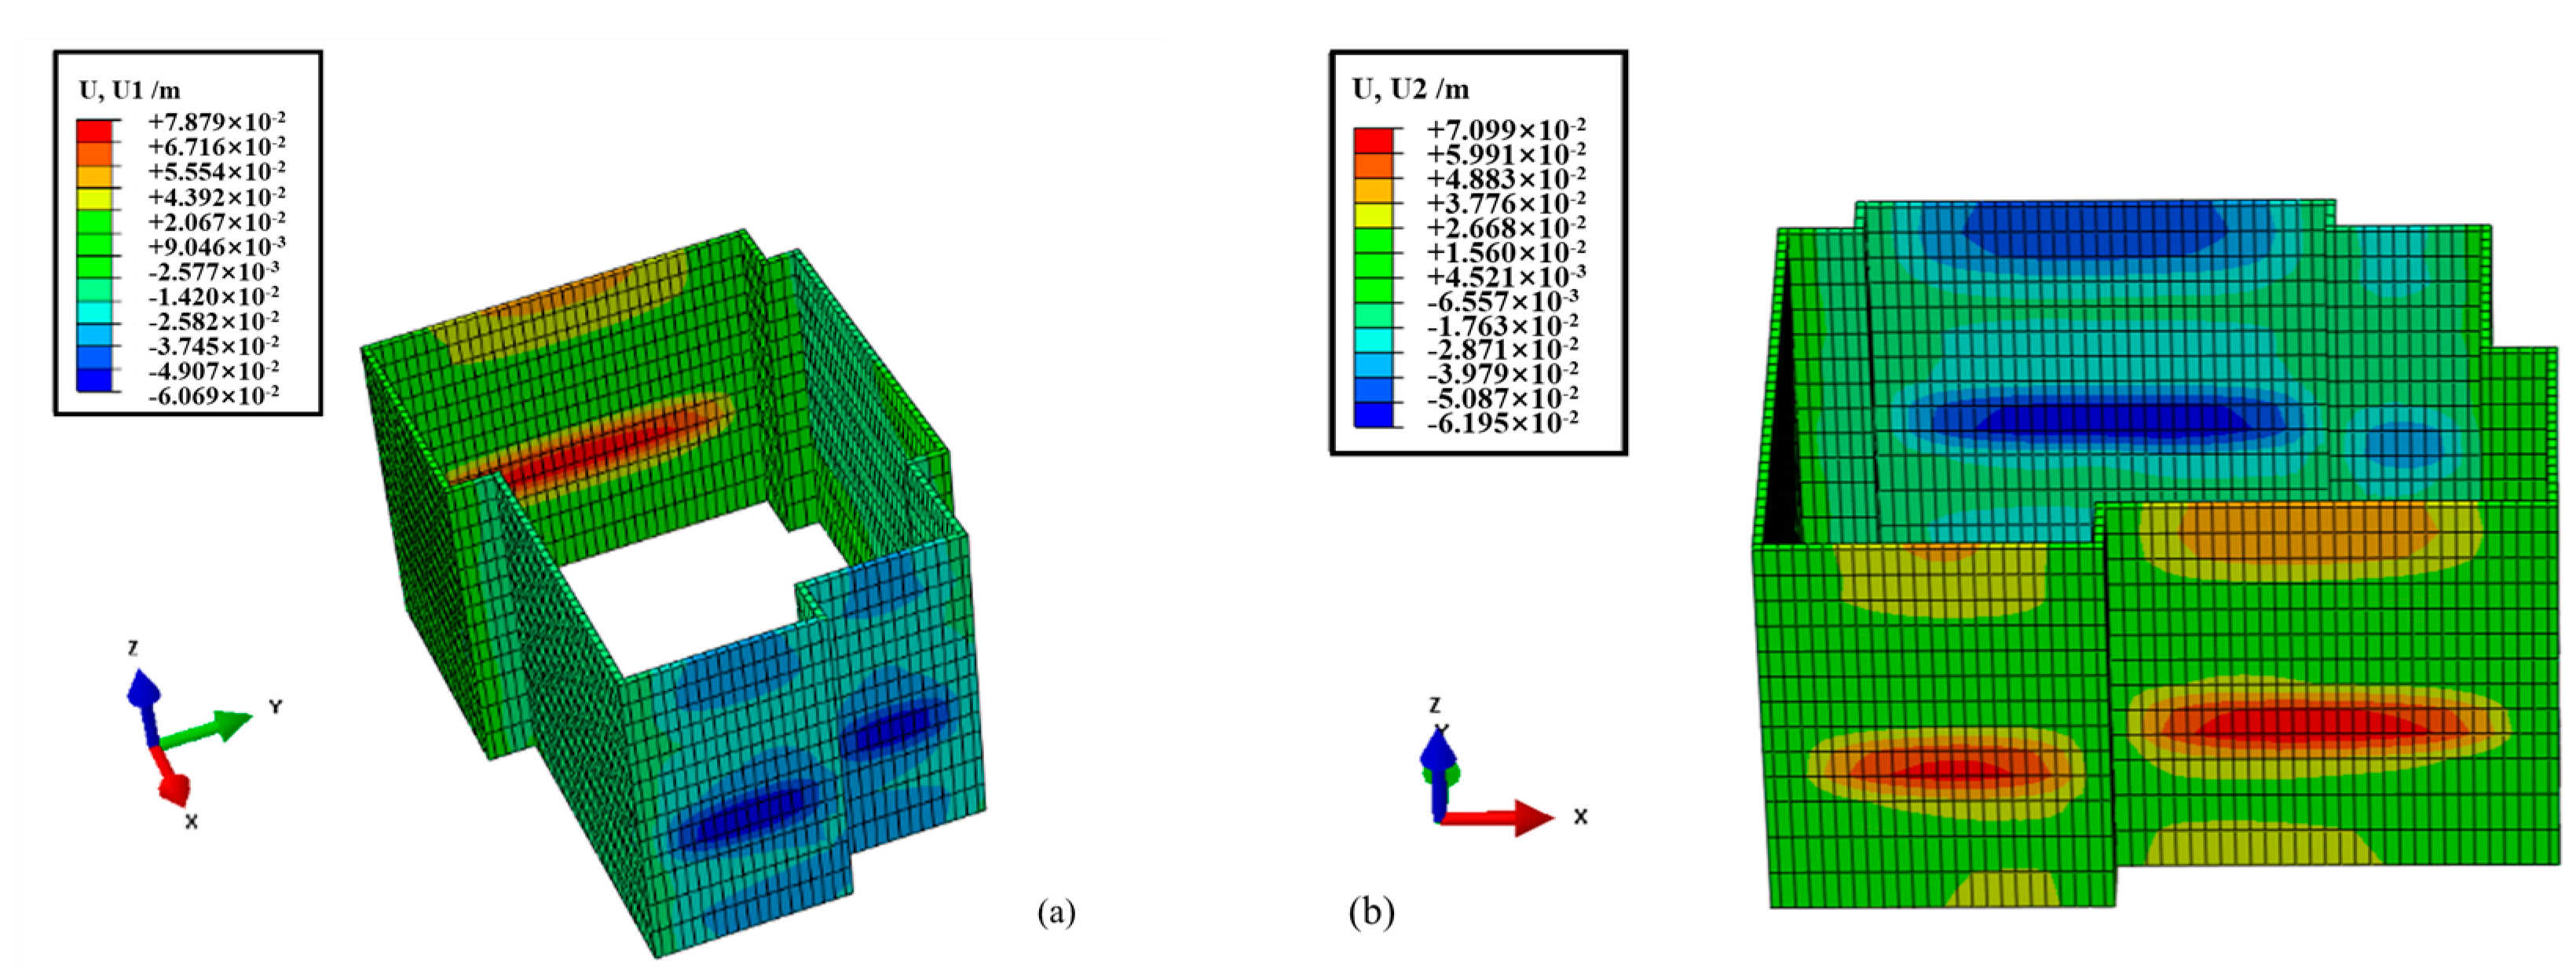
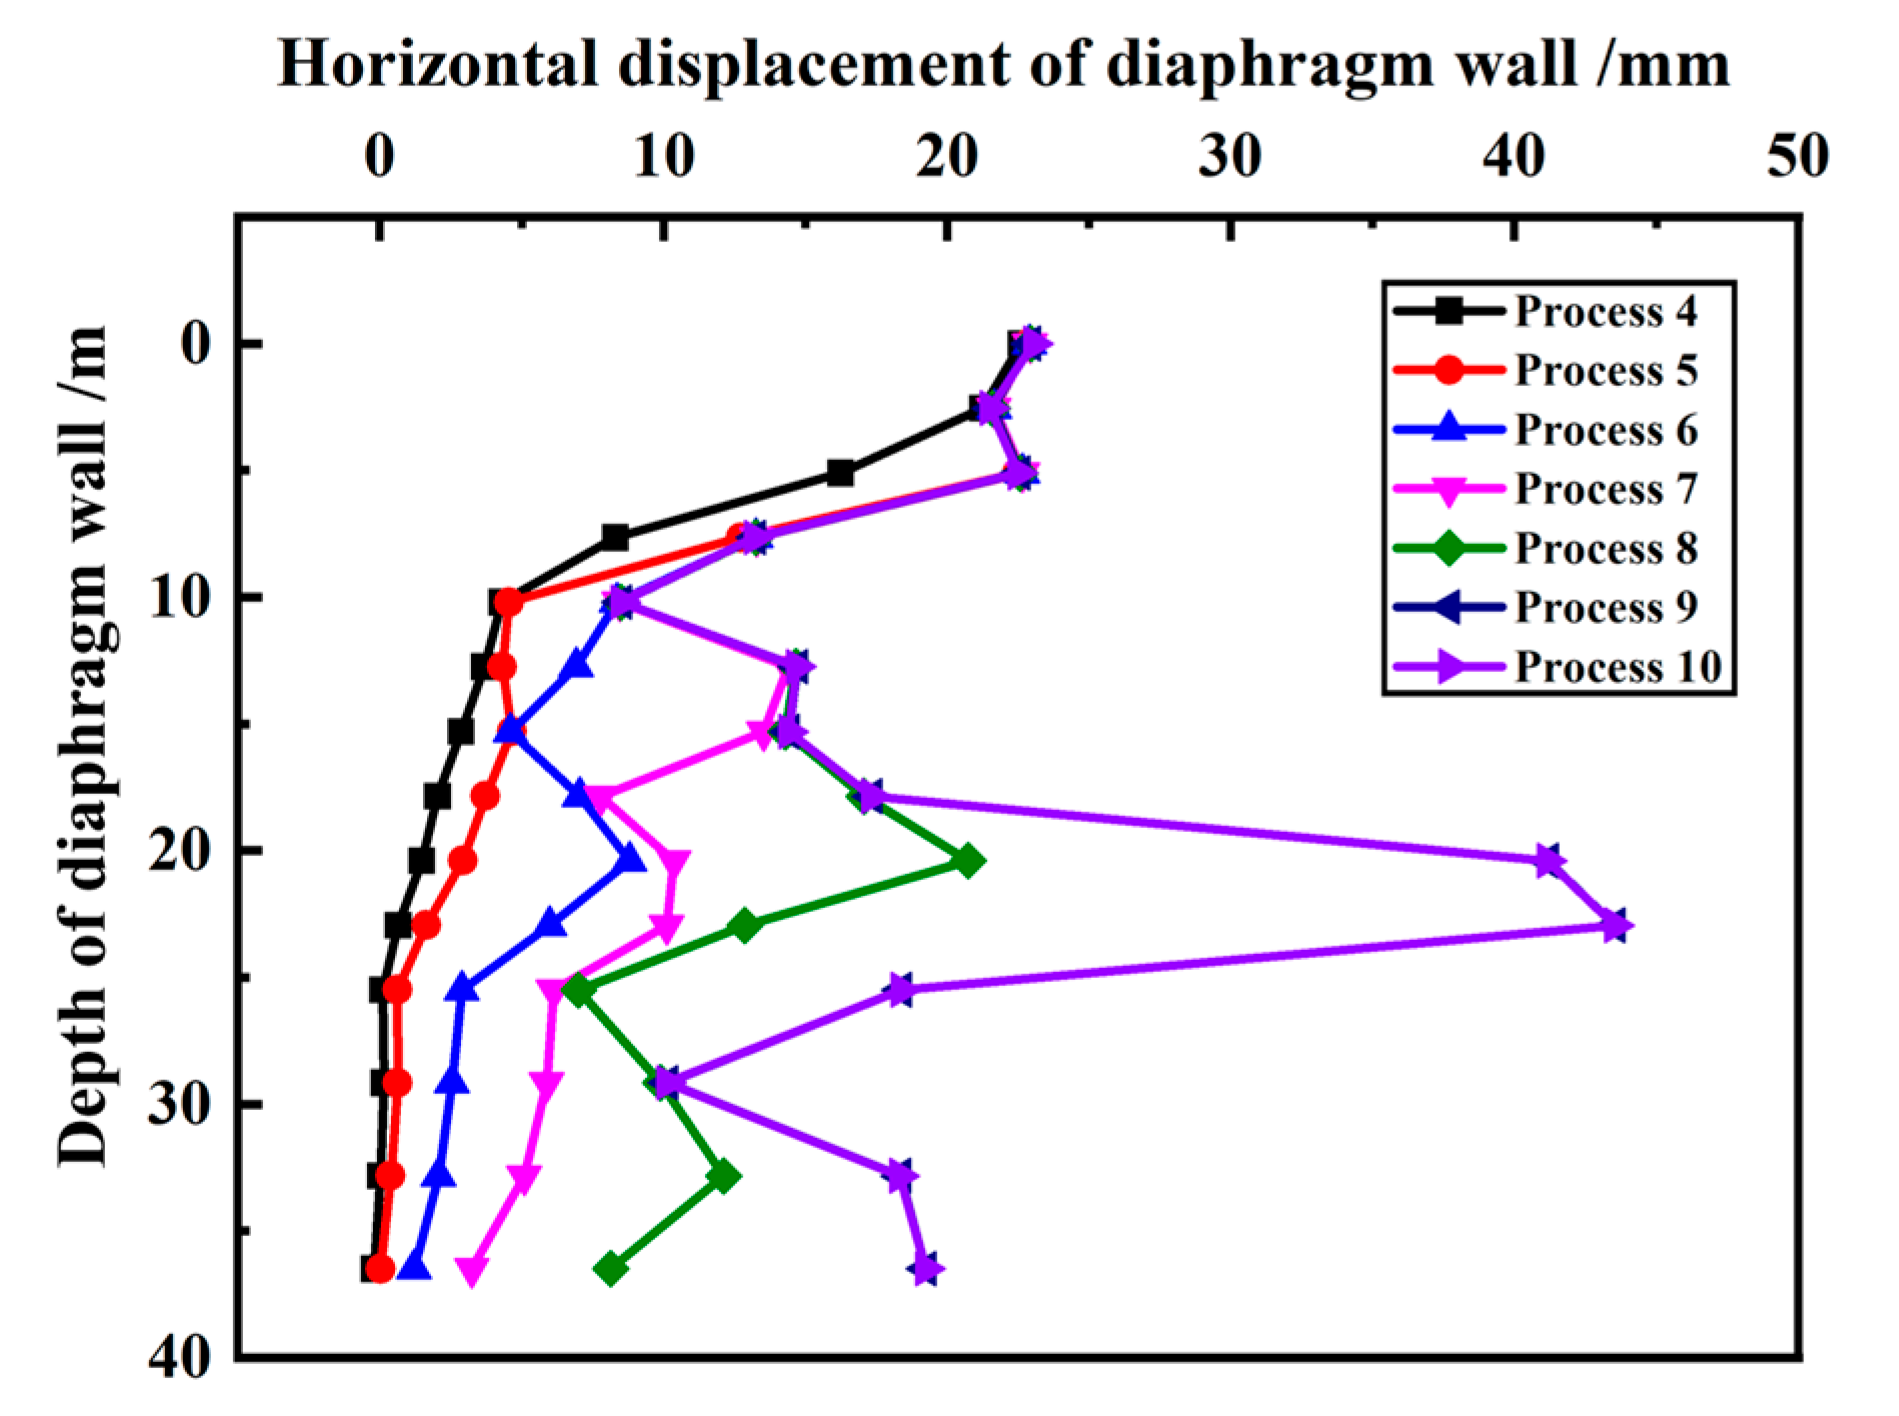
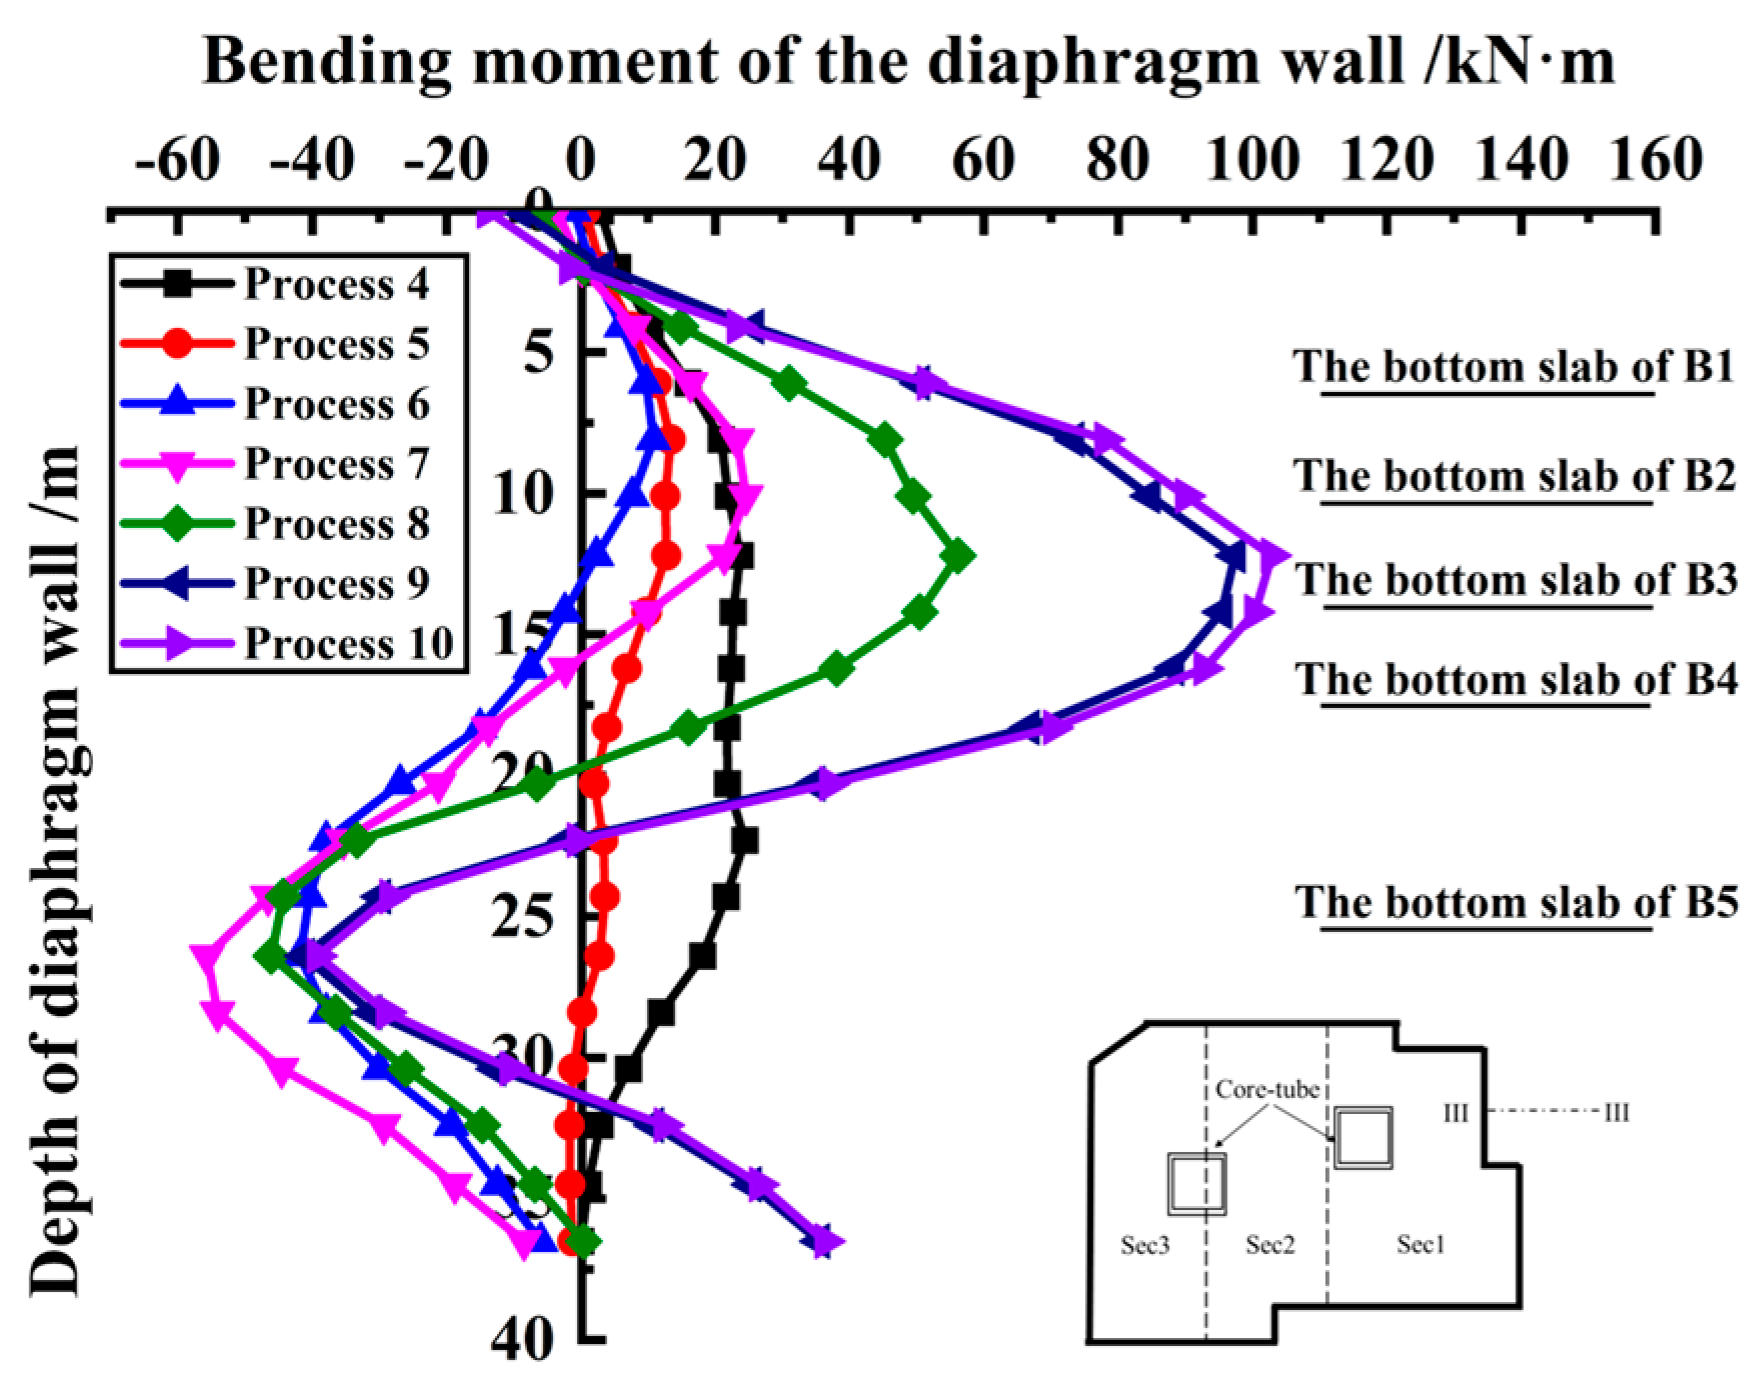
4.2.1. Diaphragm Wall
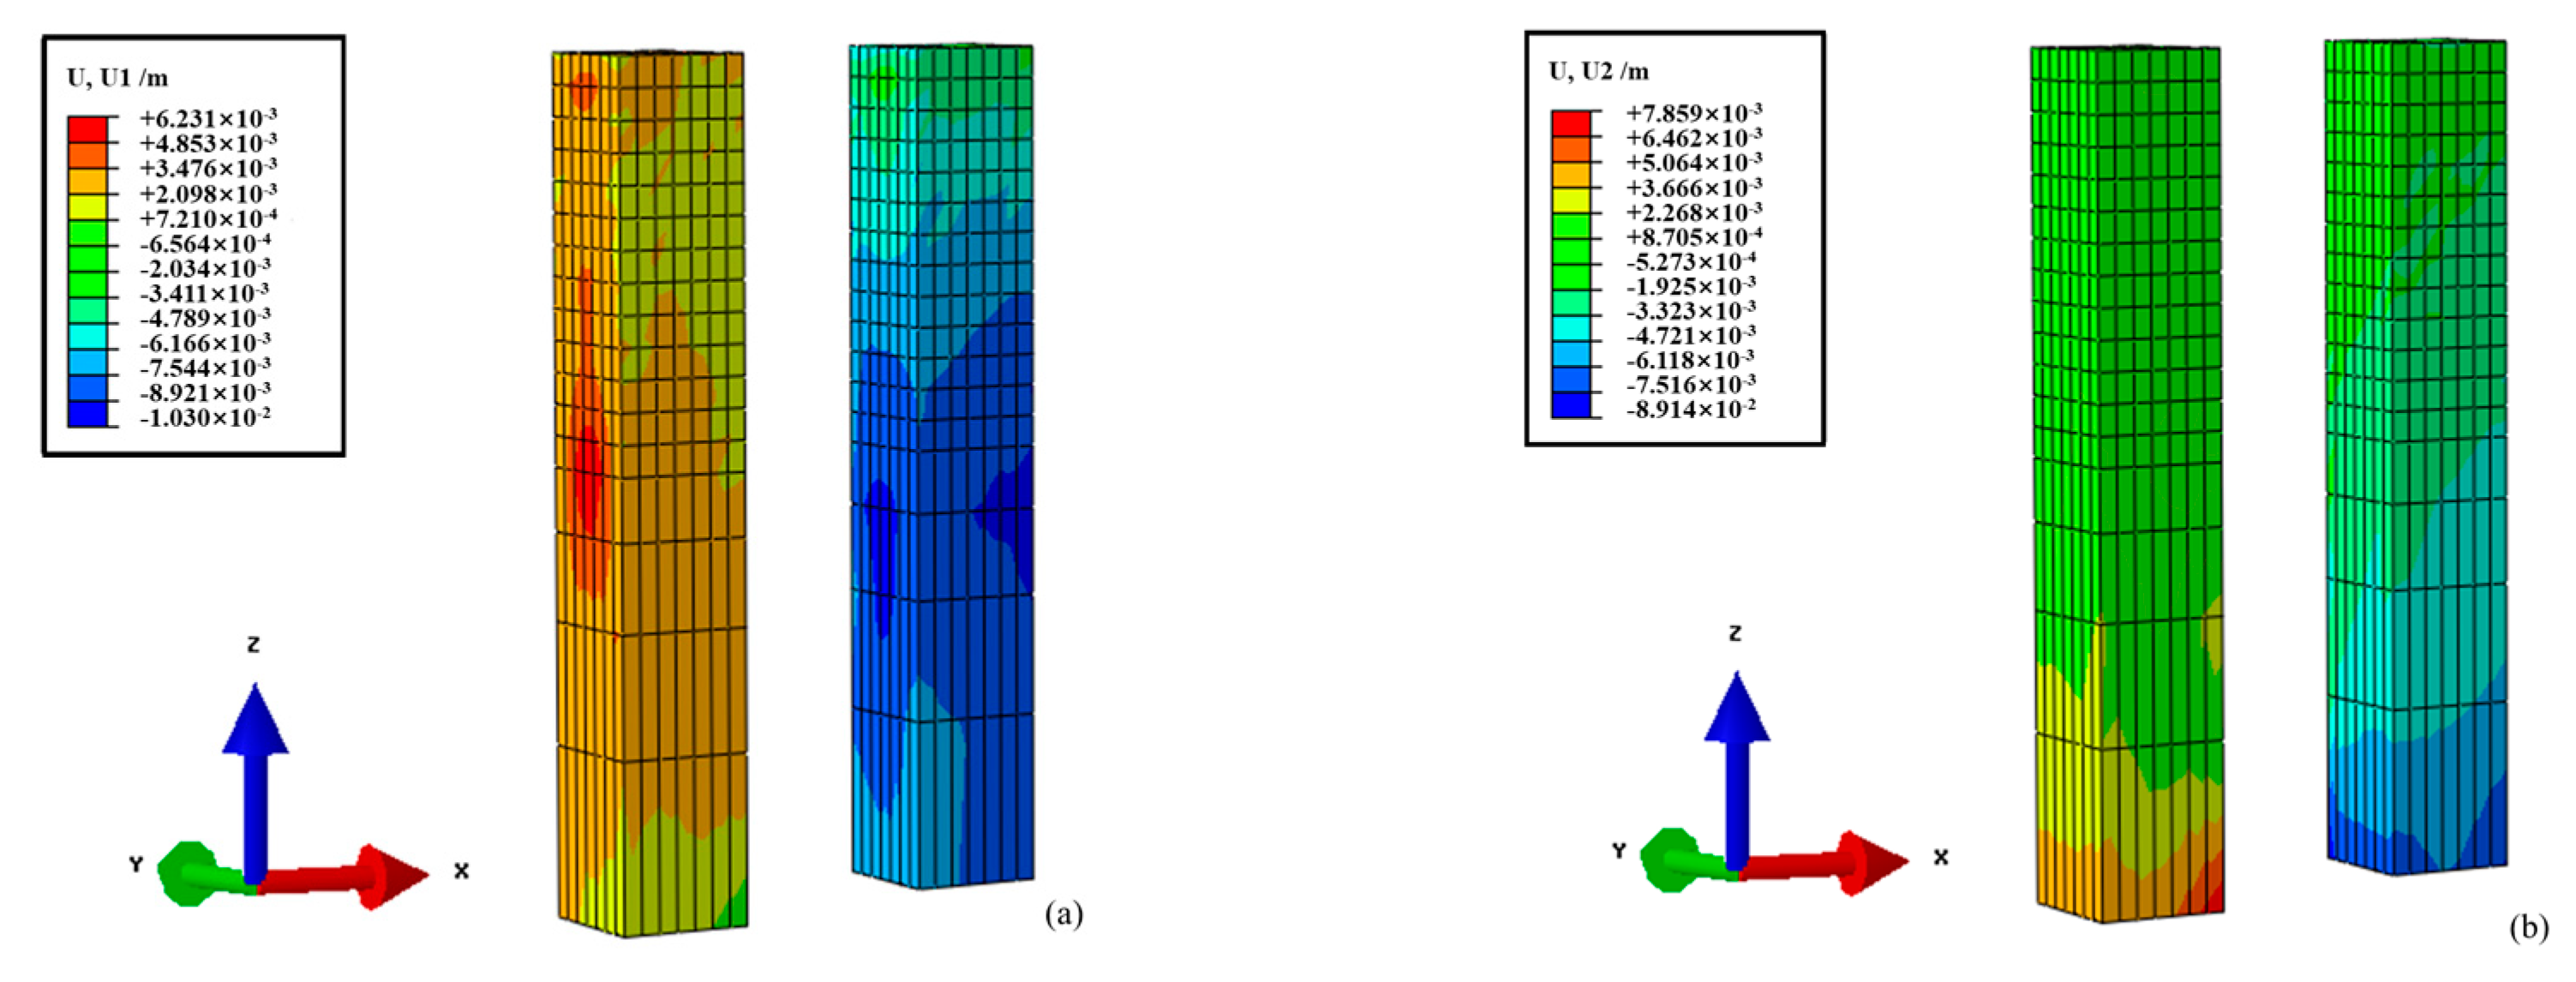
4.2.2. Core Tubes
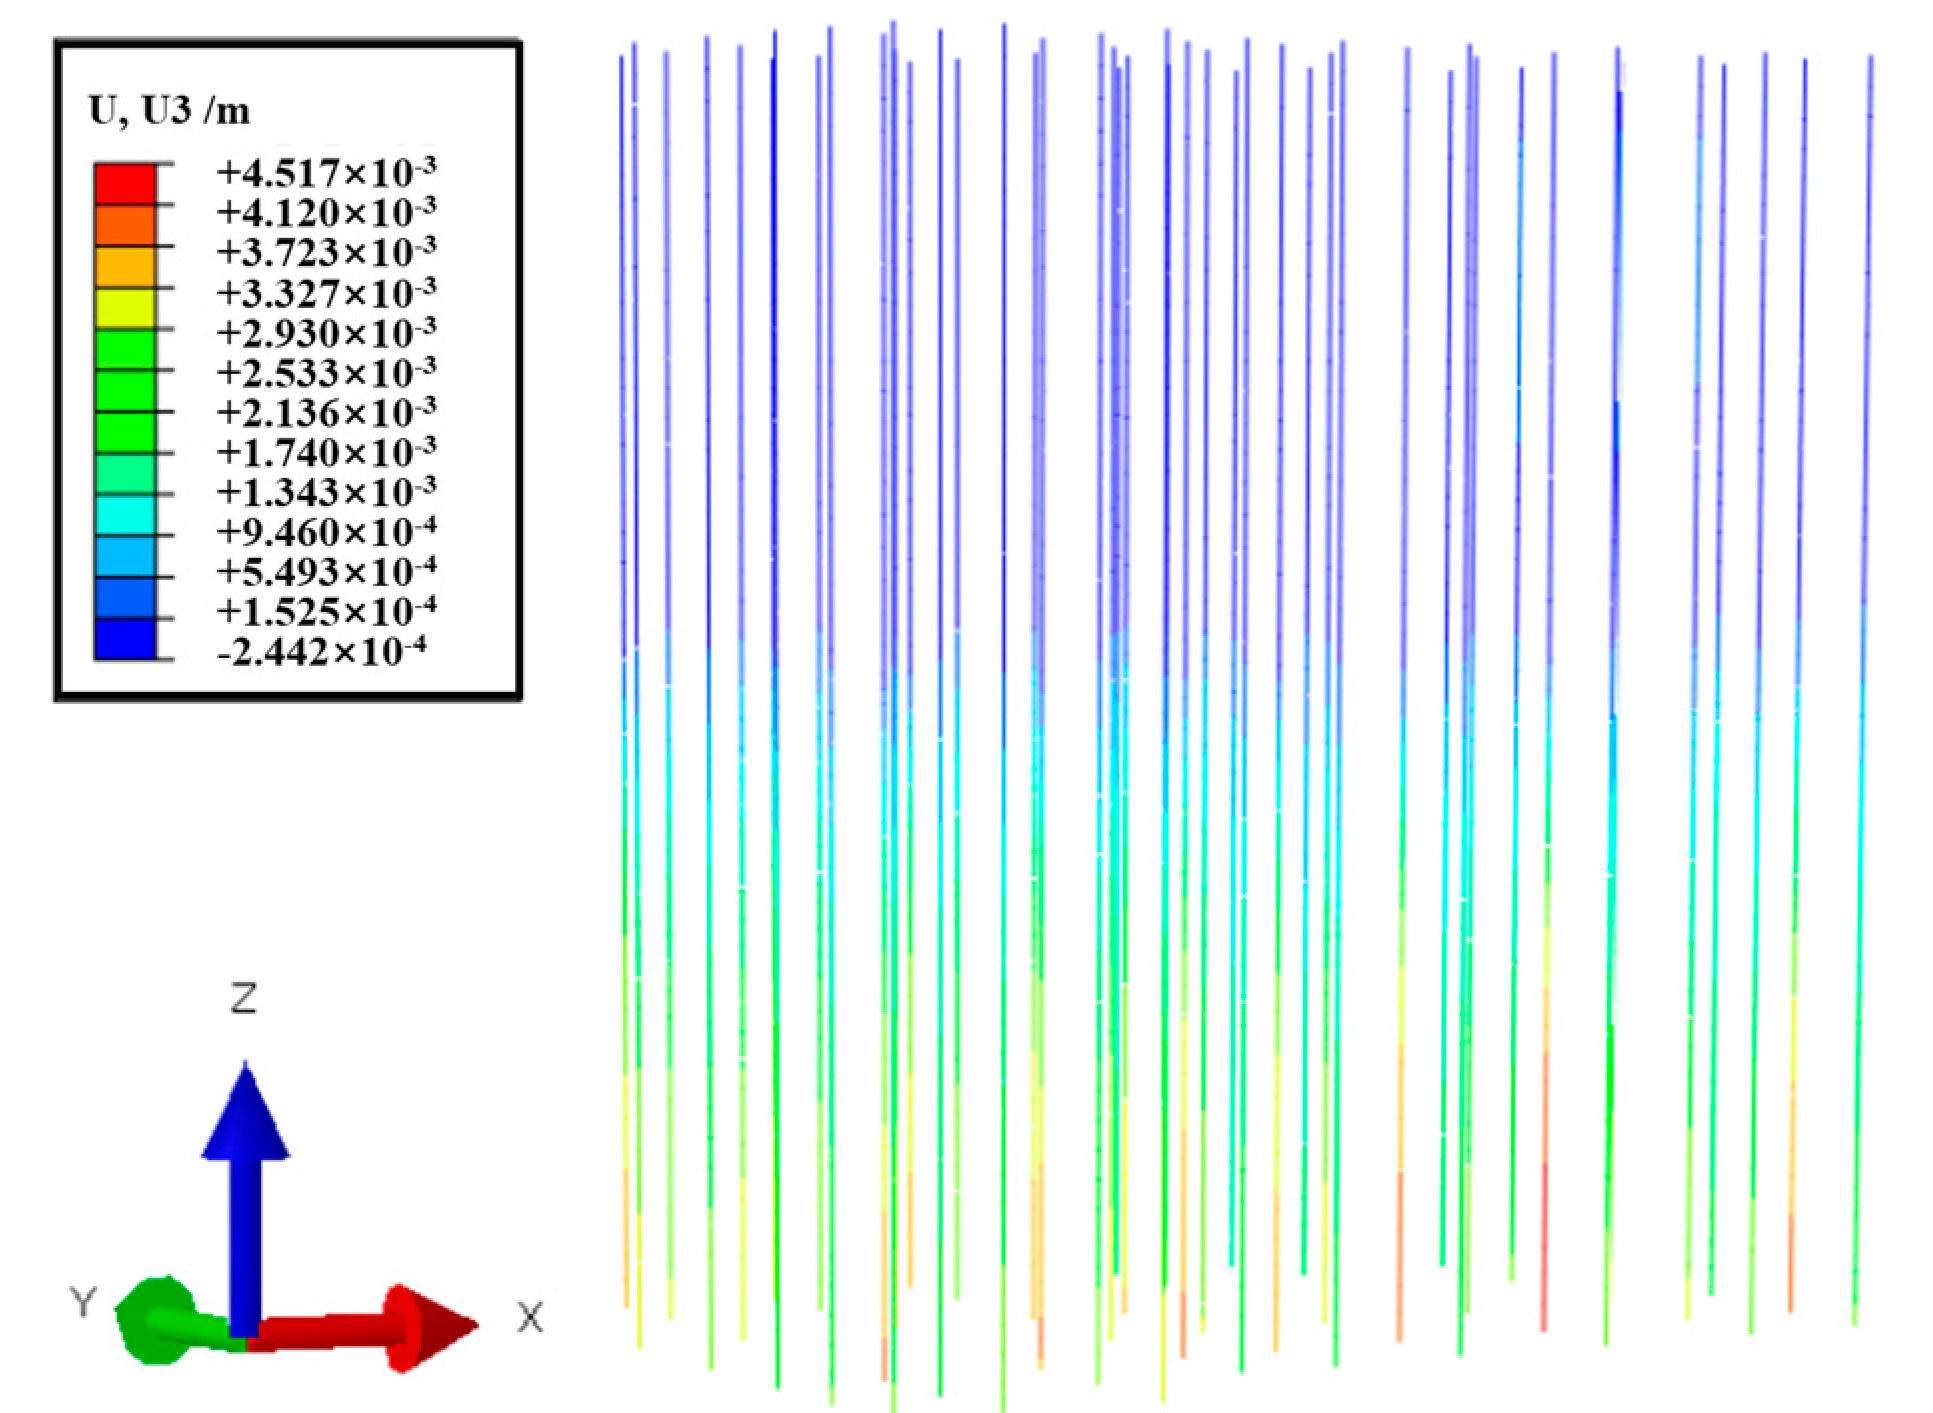
4.2.3. Integrated Piles and Columns
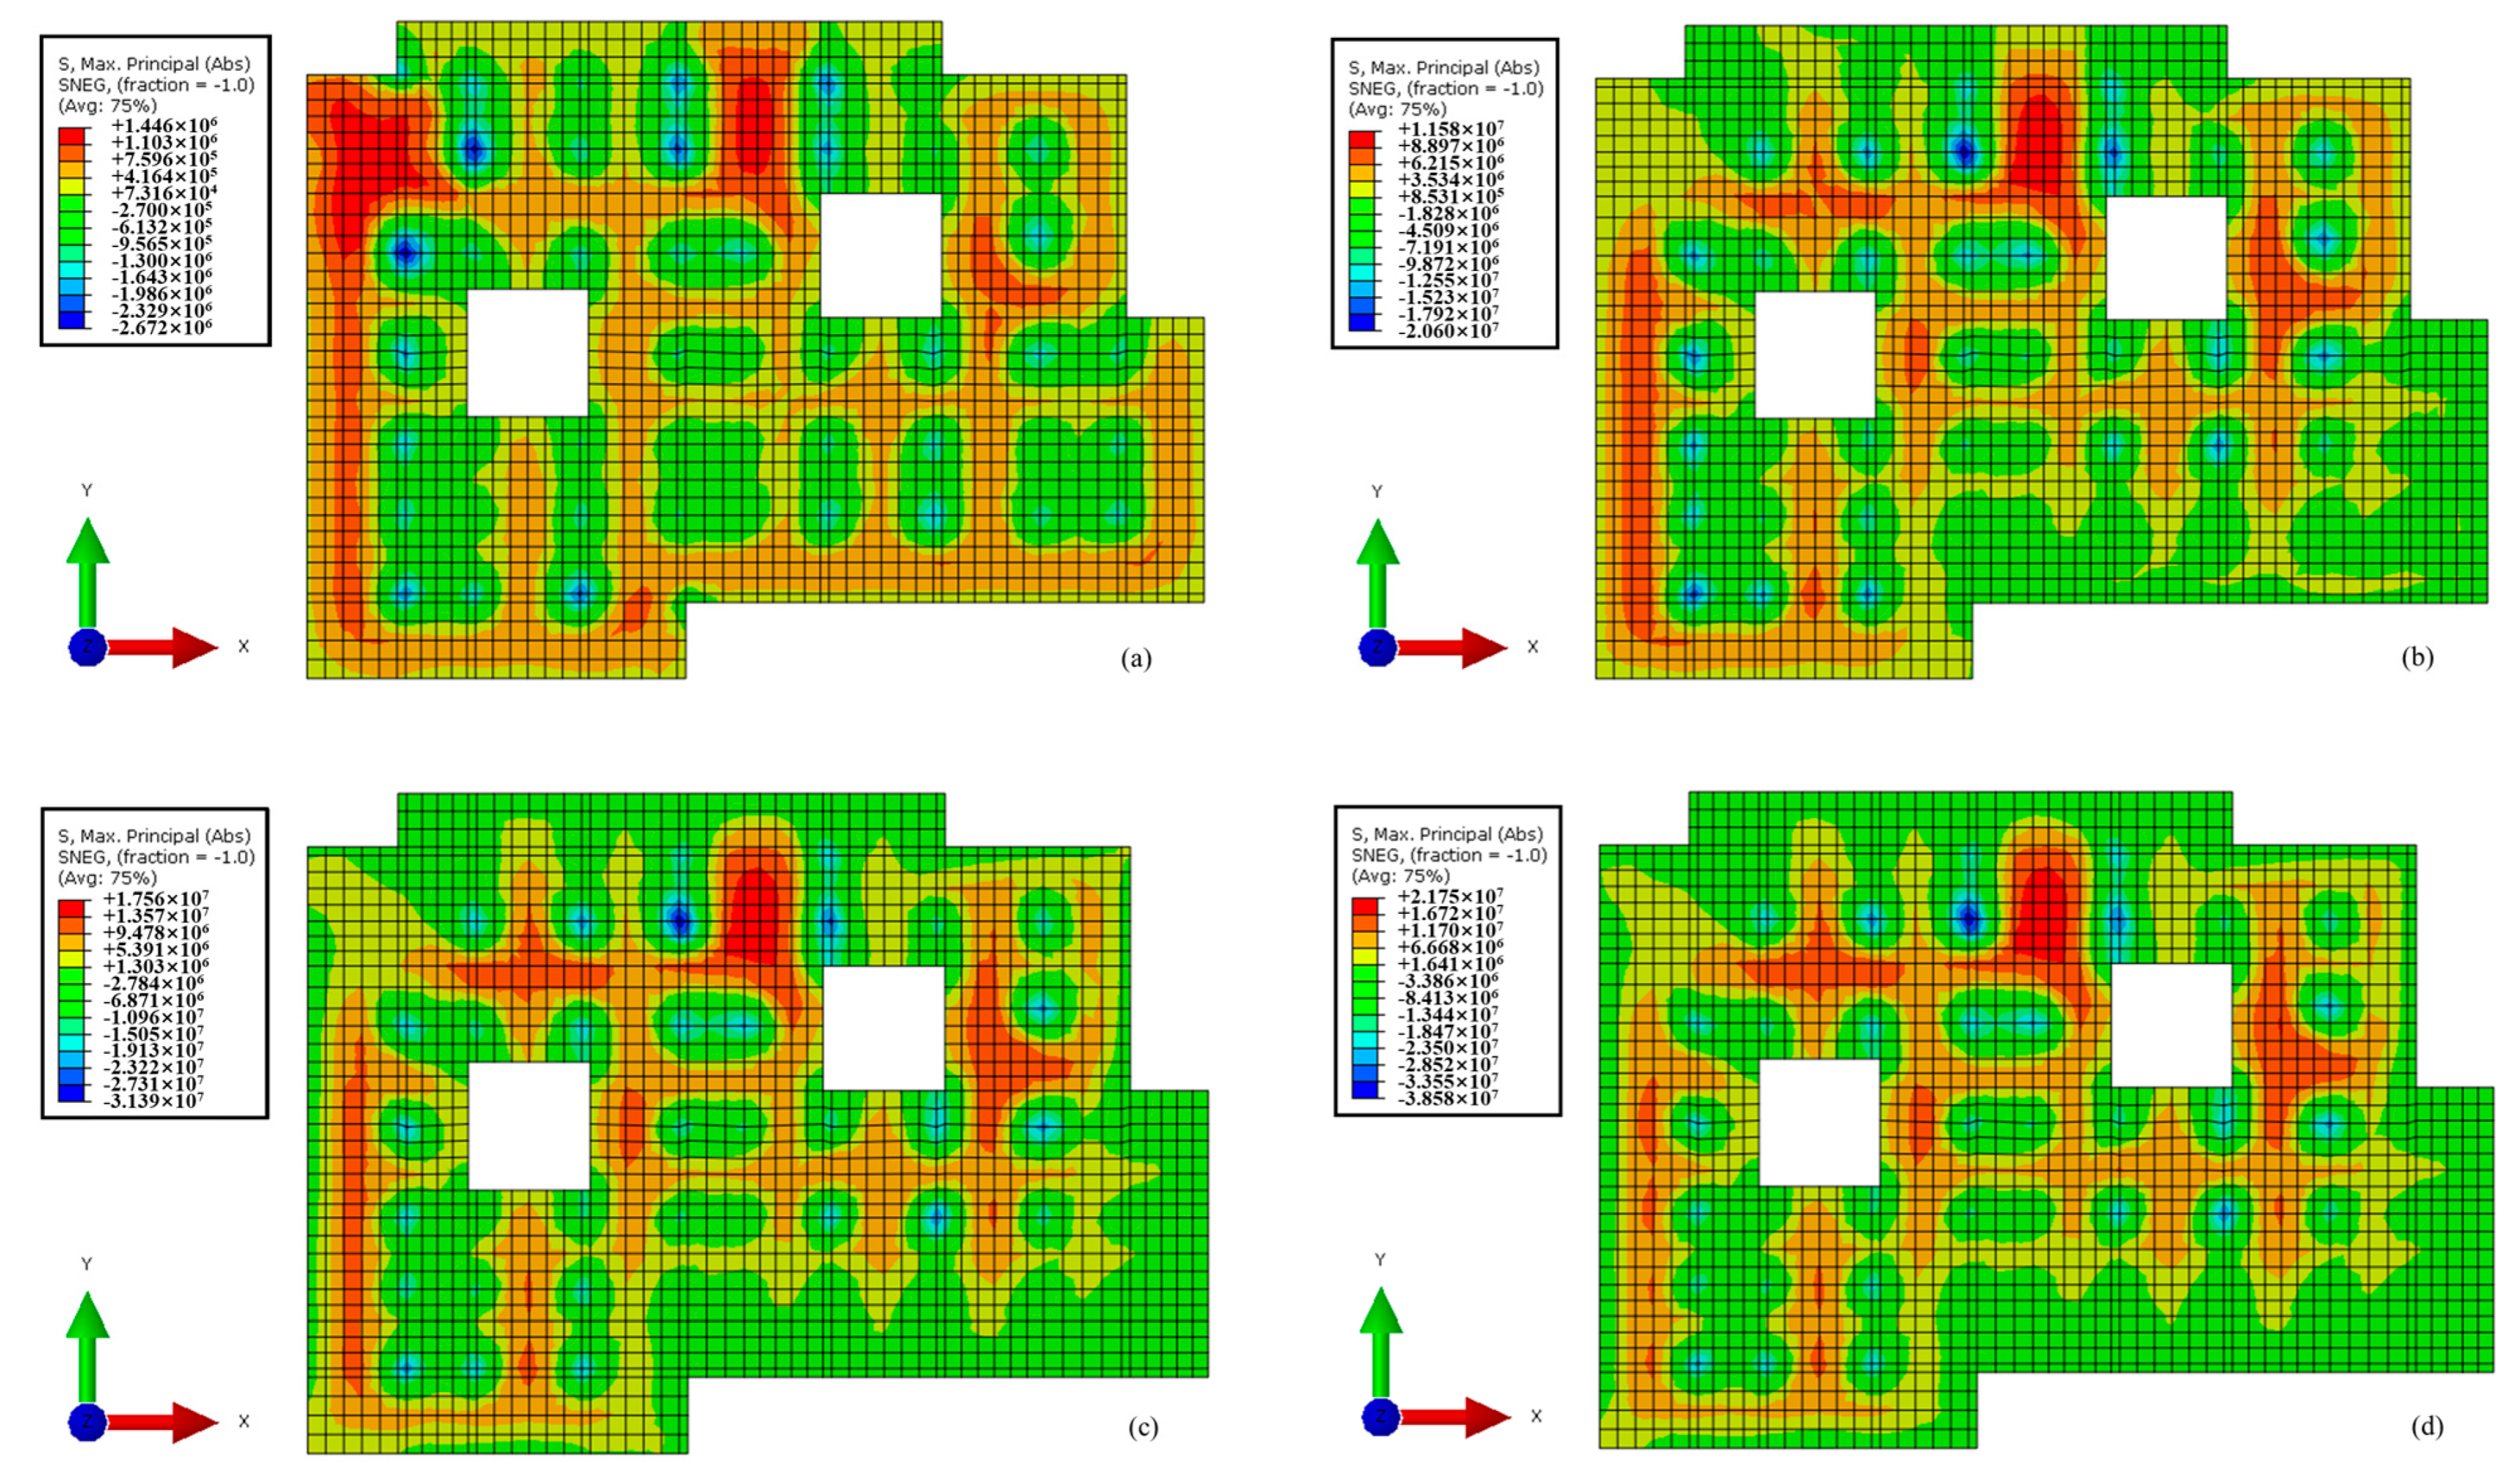
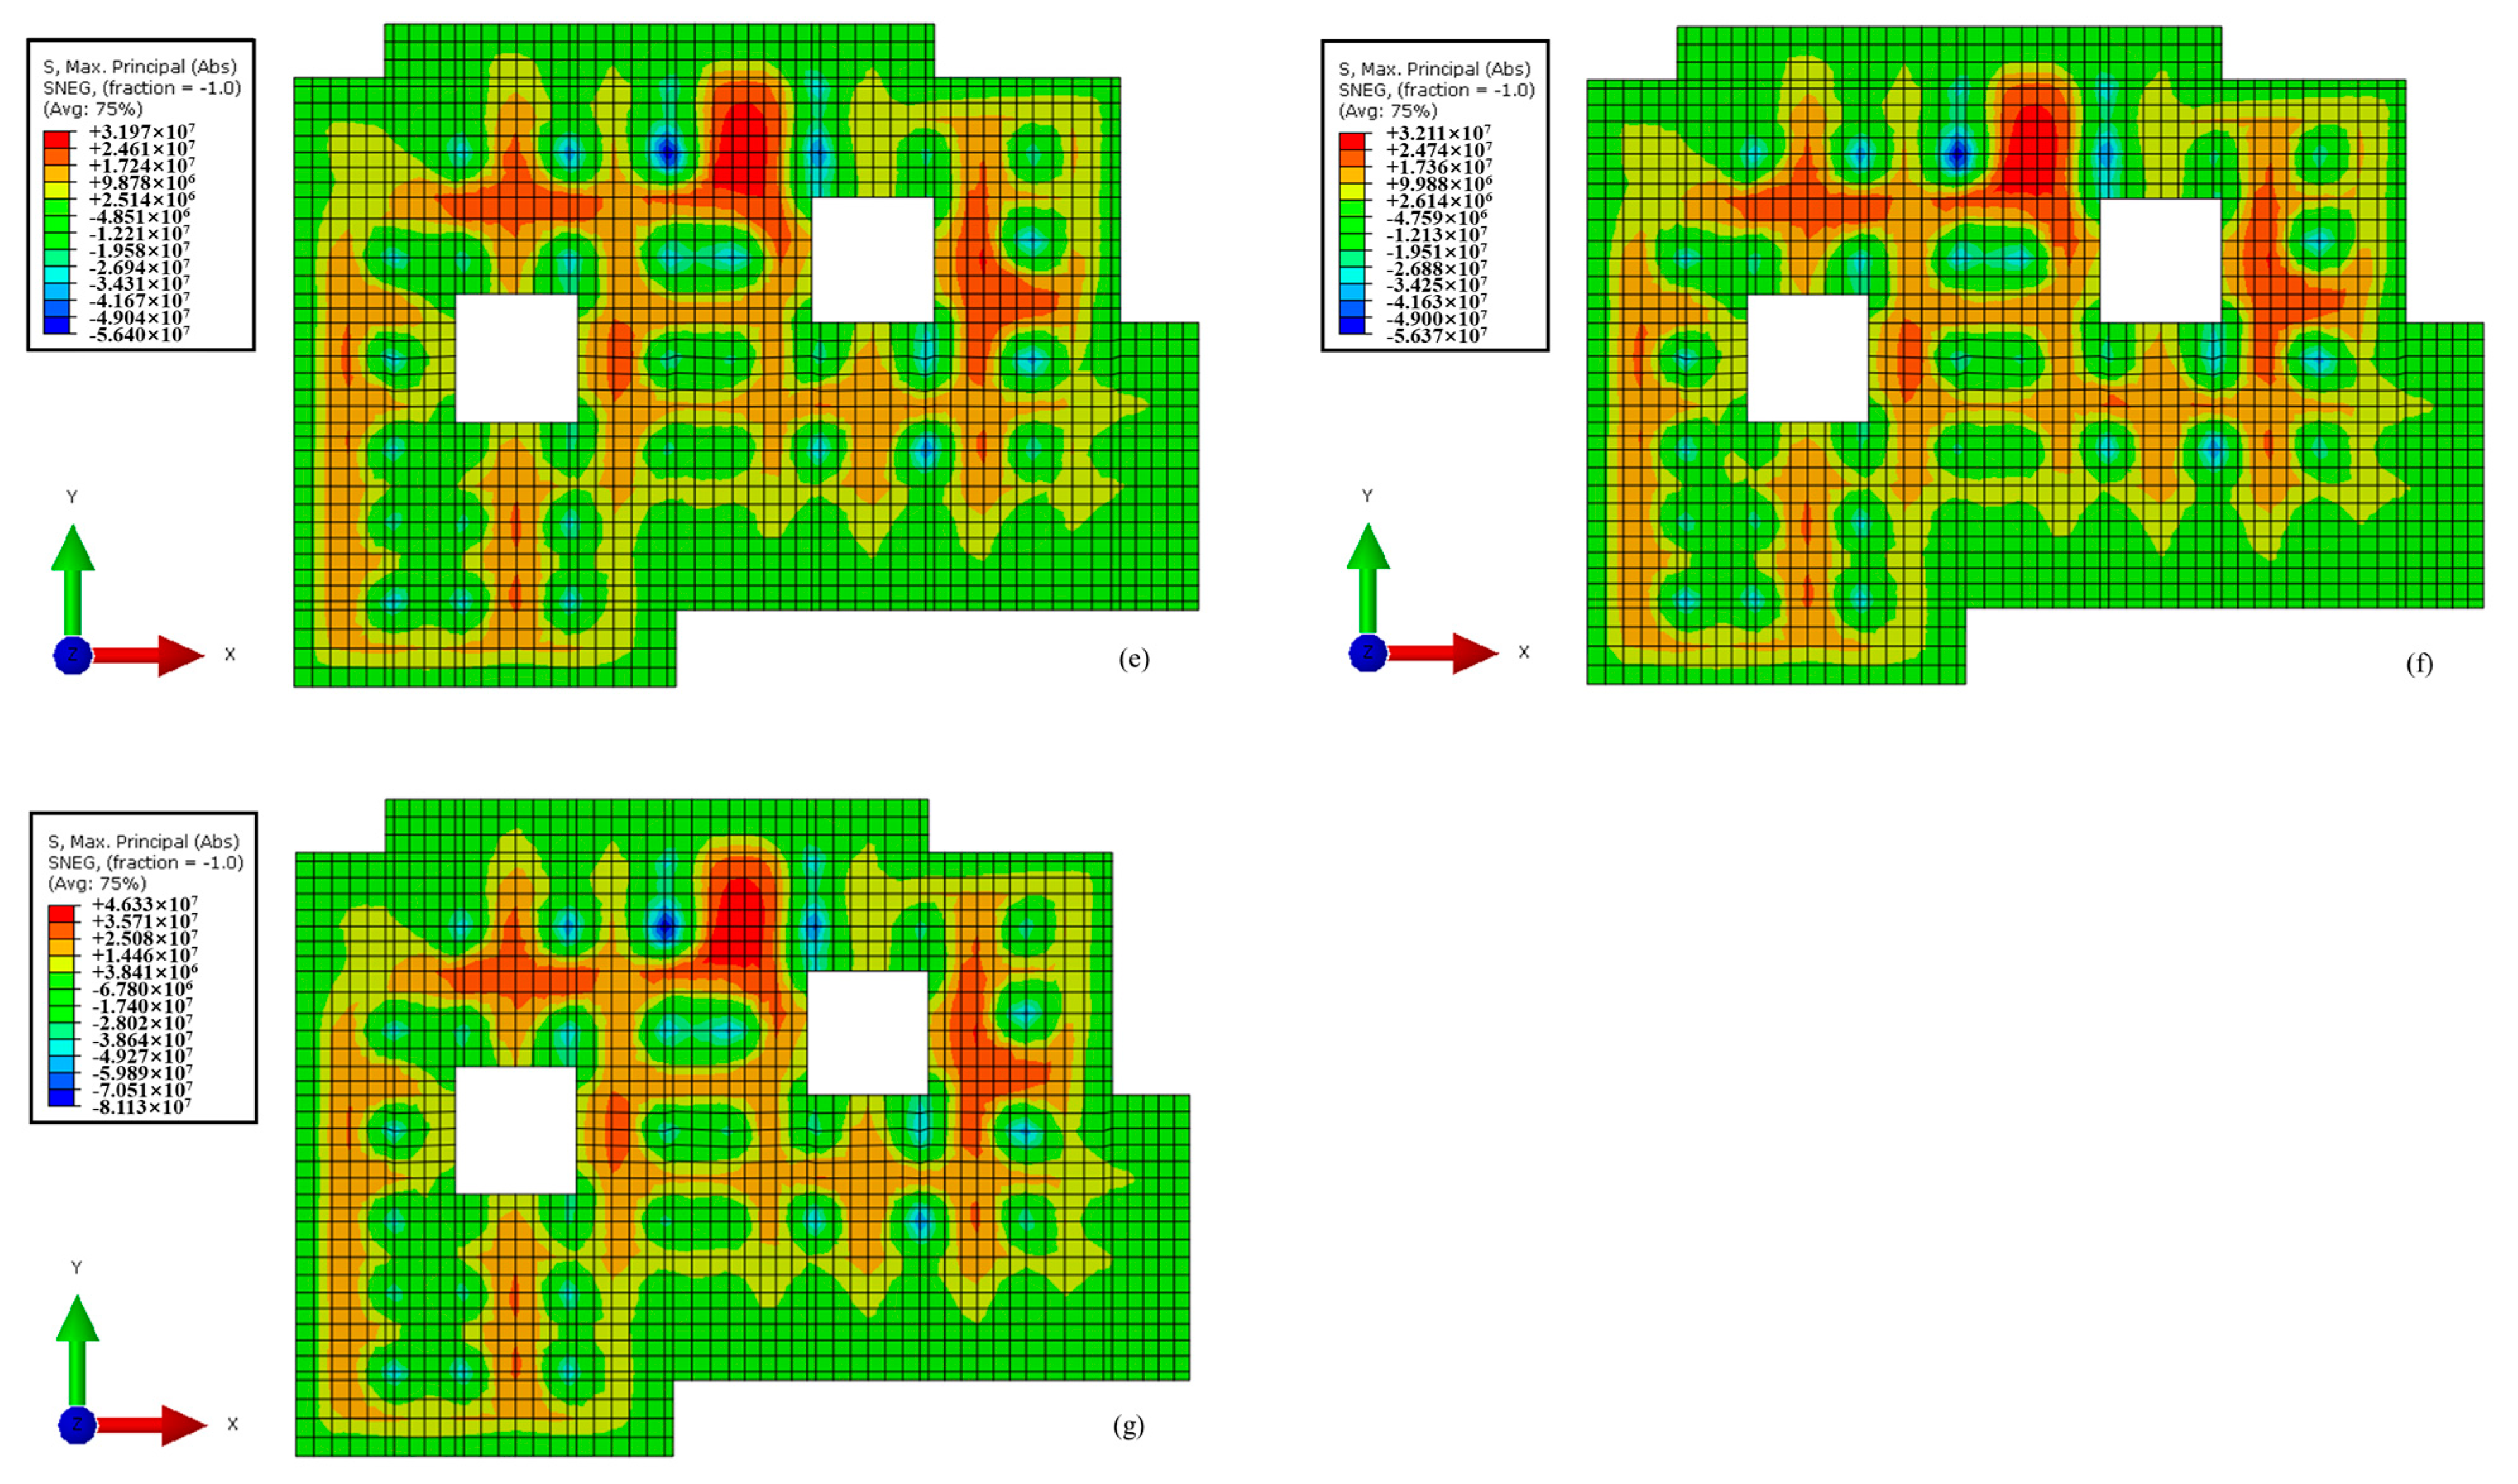
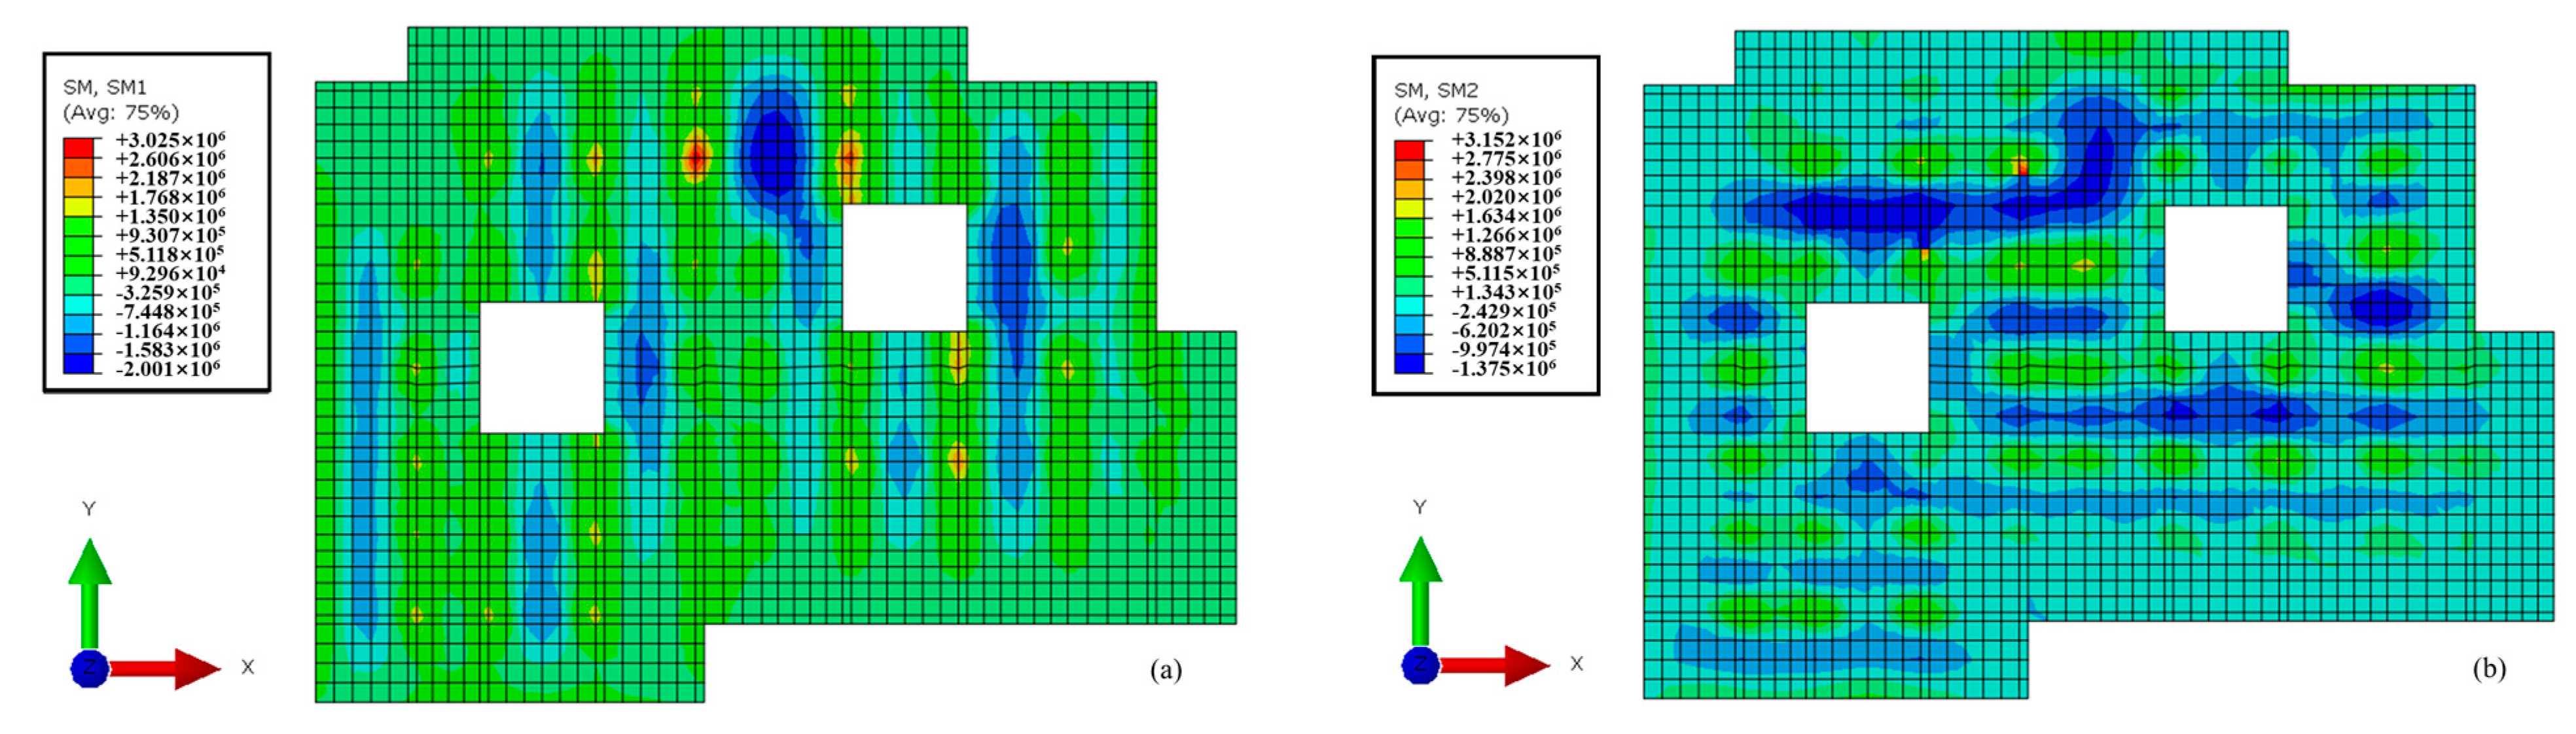
4.2.4. The Roof of the First Underground Floor
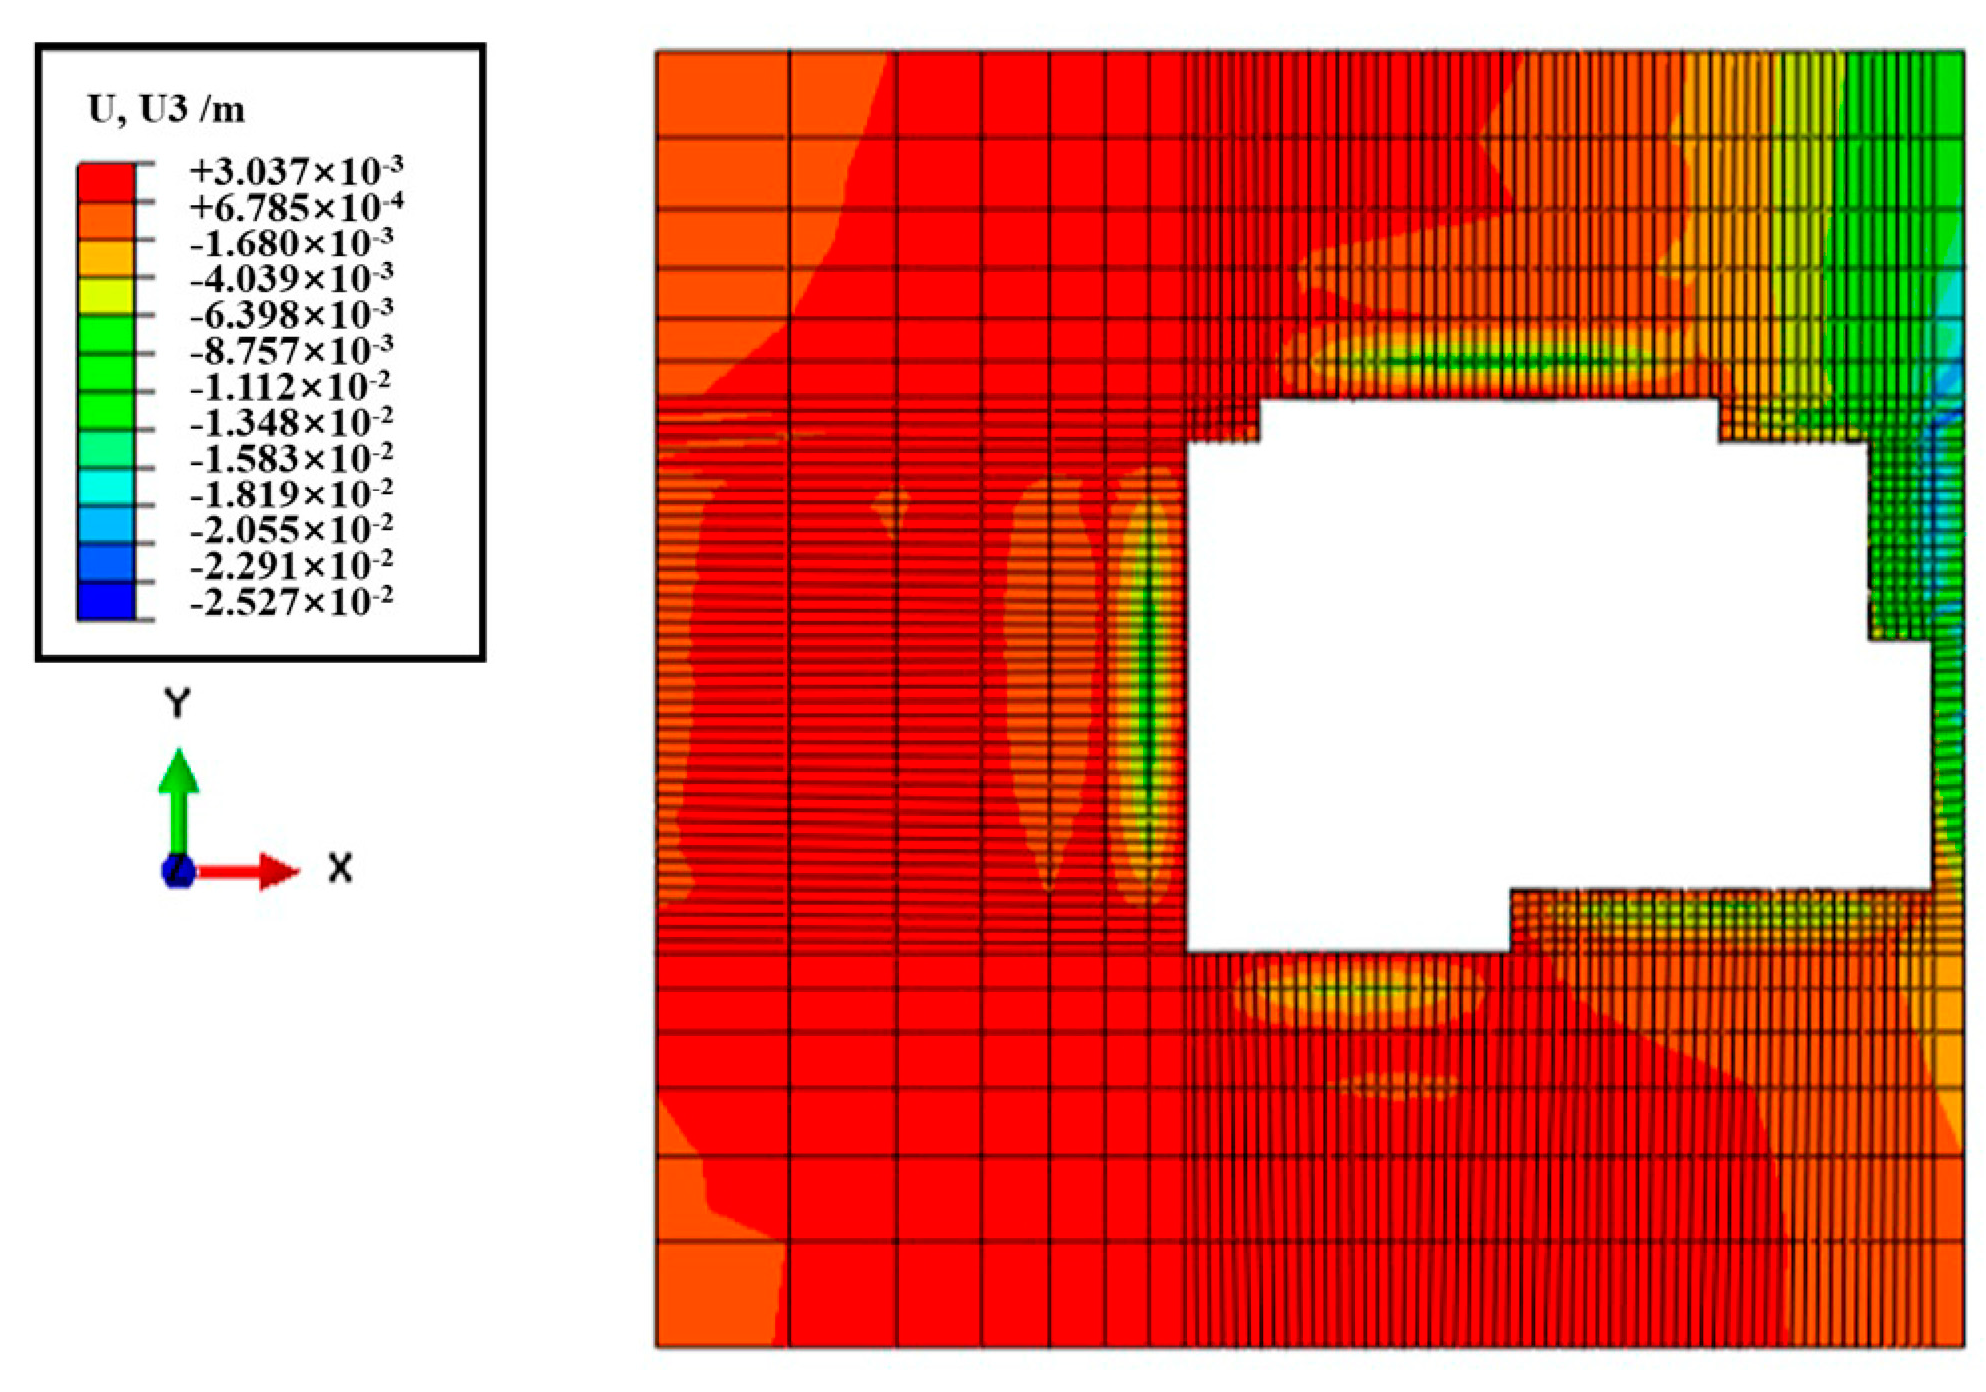
4.3. Site Response
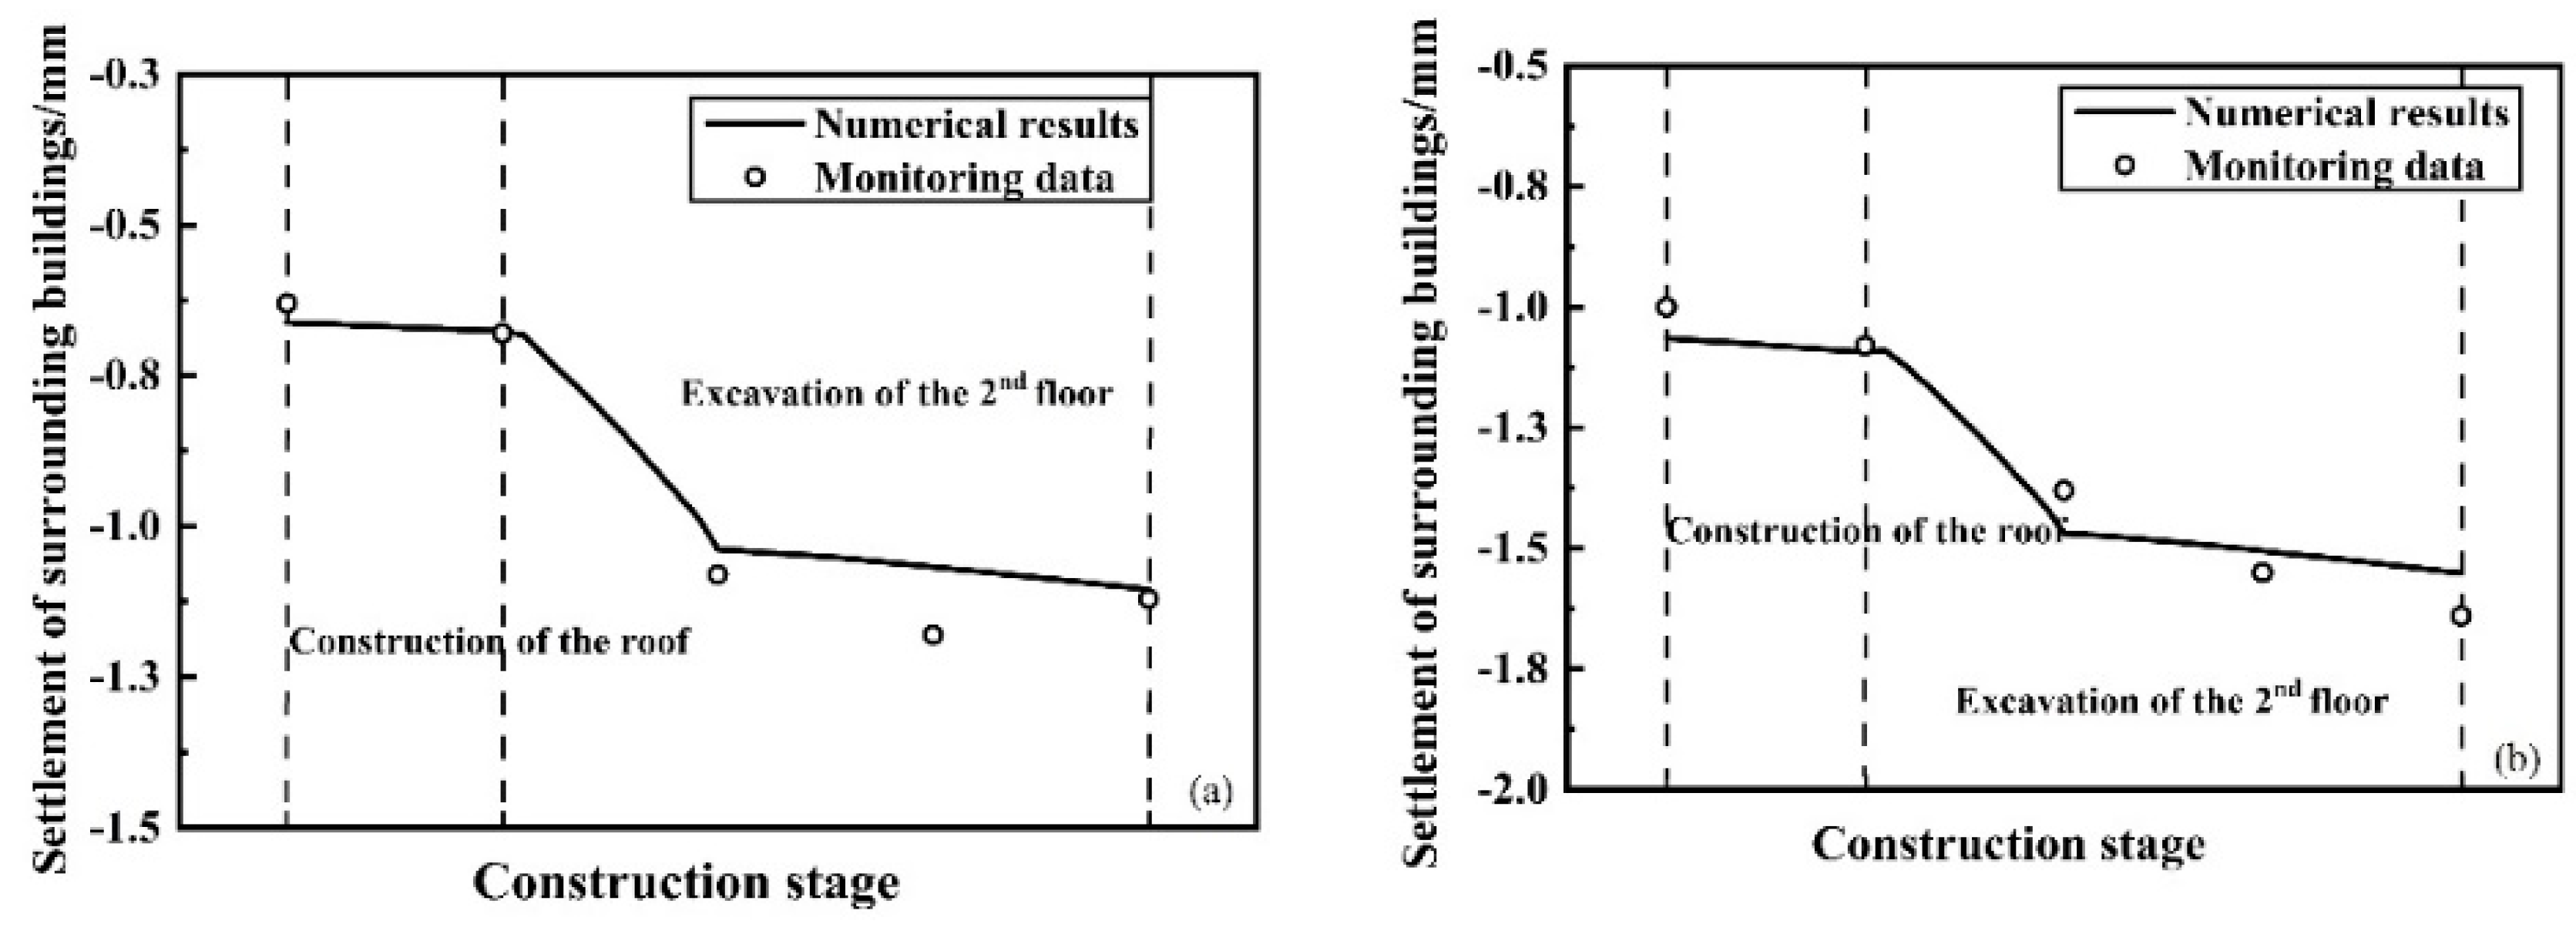
4.4. Settlement of Existing Buildings
5. Discussions
5.1. Construction Sequence
5.2. Existing Buildings
5.3. Strength of the Diaphragm Wall
6. Conclusions
- (1)
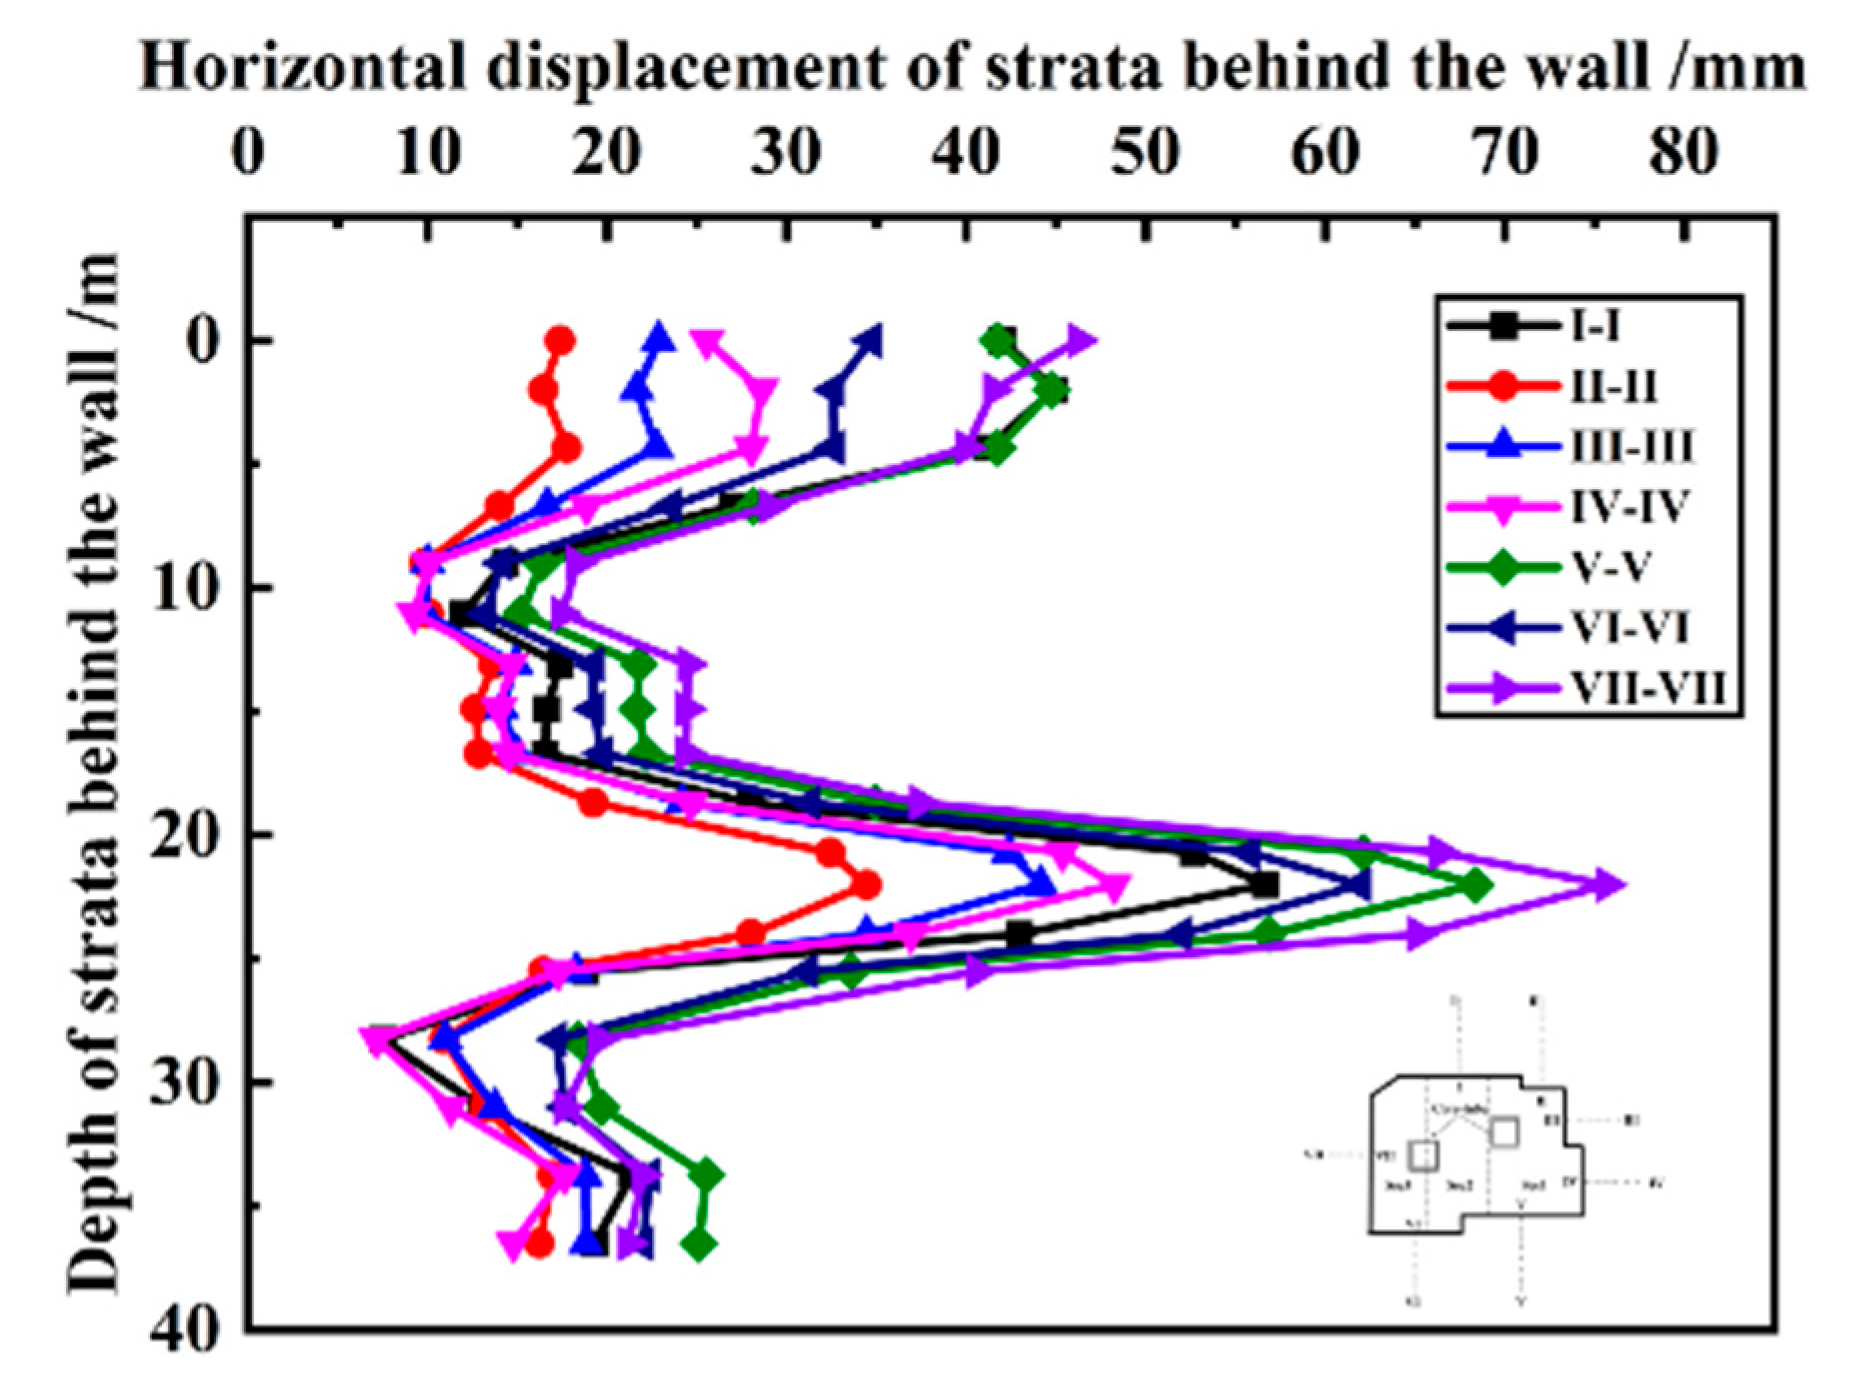
- During the whole process of cooperative construction of the superstructure and substructure under the covered semi-top-down method, the horizontal displacement of the diaphragm wall and of soil behind the wall along the depth direction gradually changes from a “single peak” to a “double peak” distribution, and the deformation value is related to the horizontal extension length and location of the wall;
- (2)
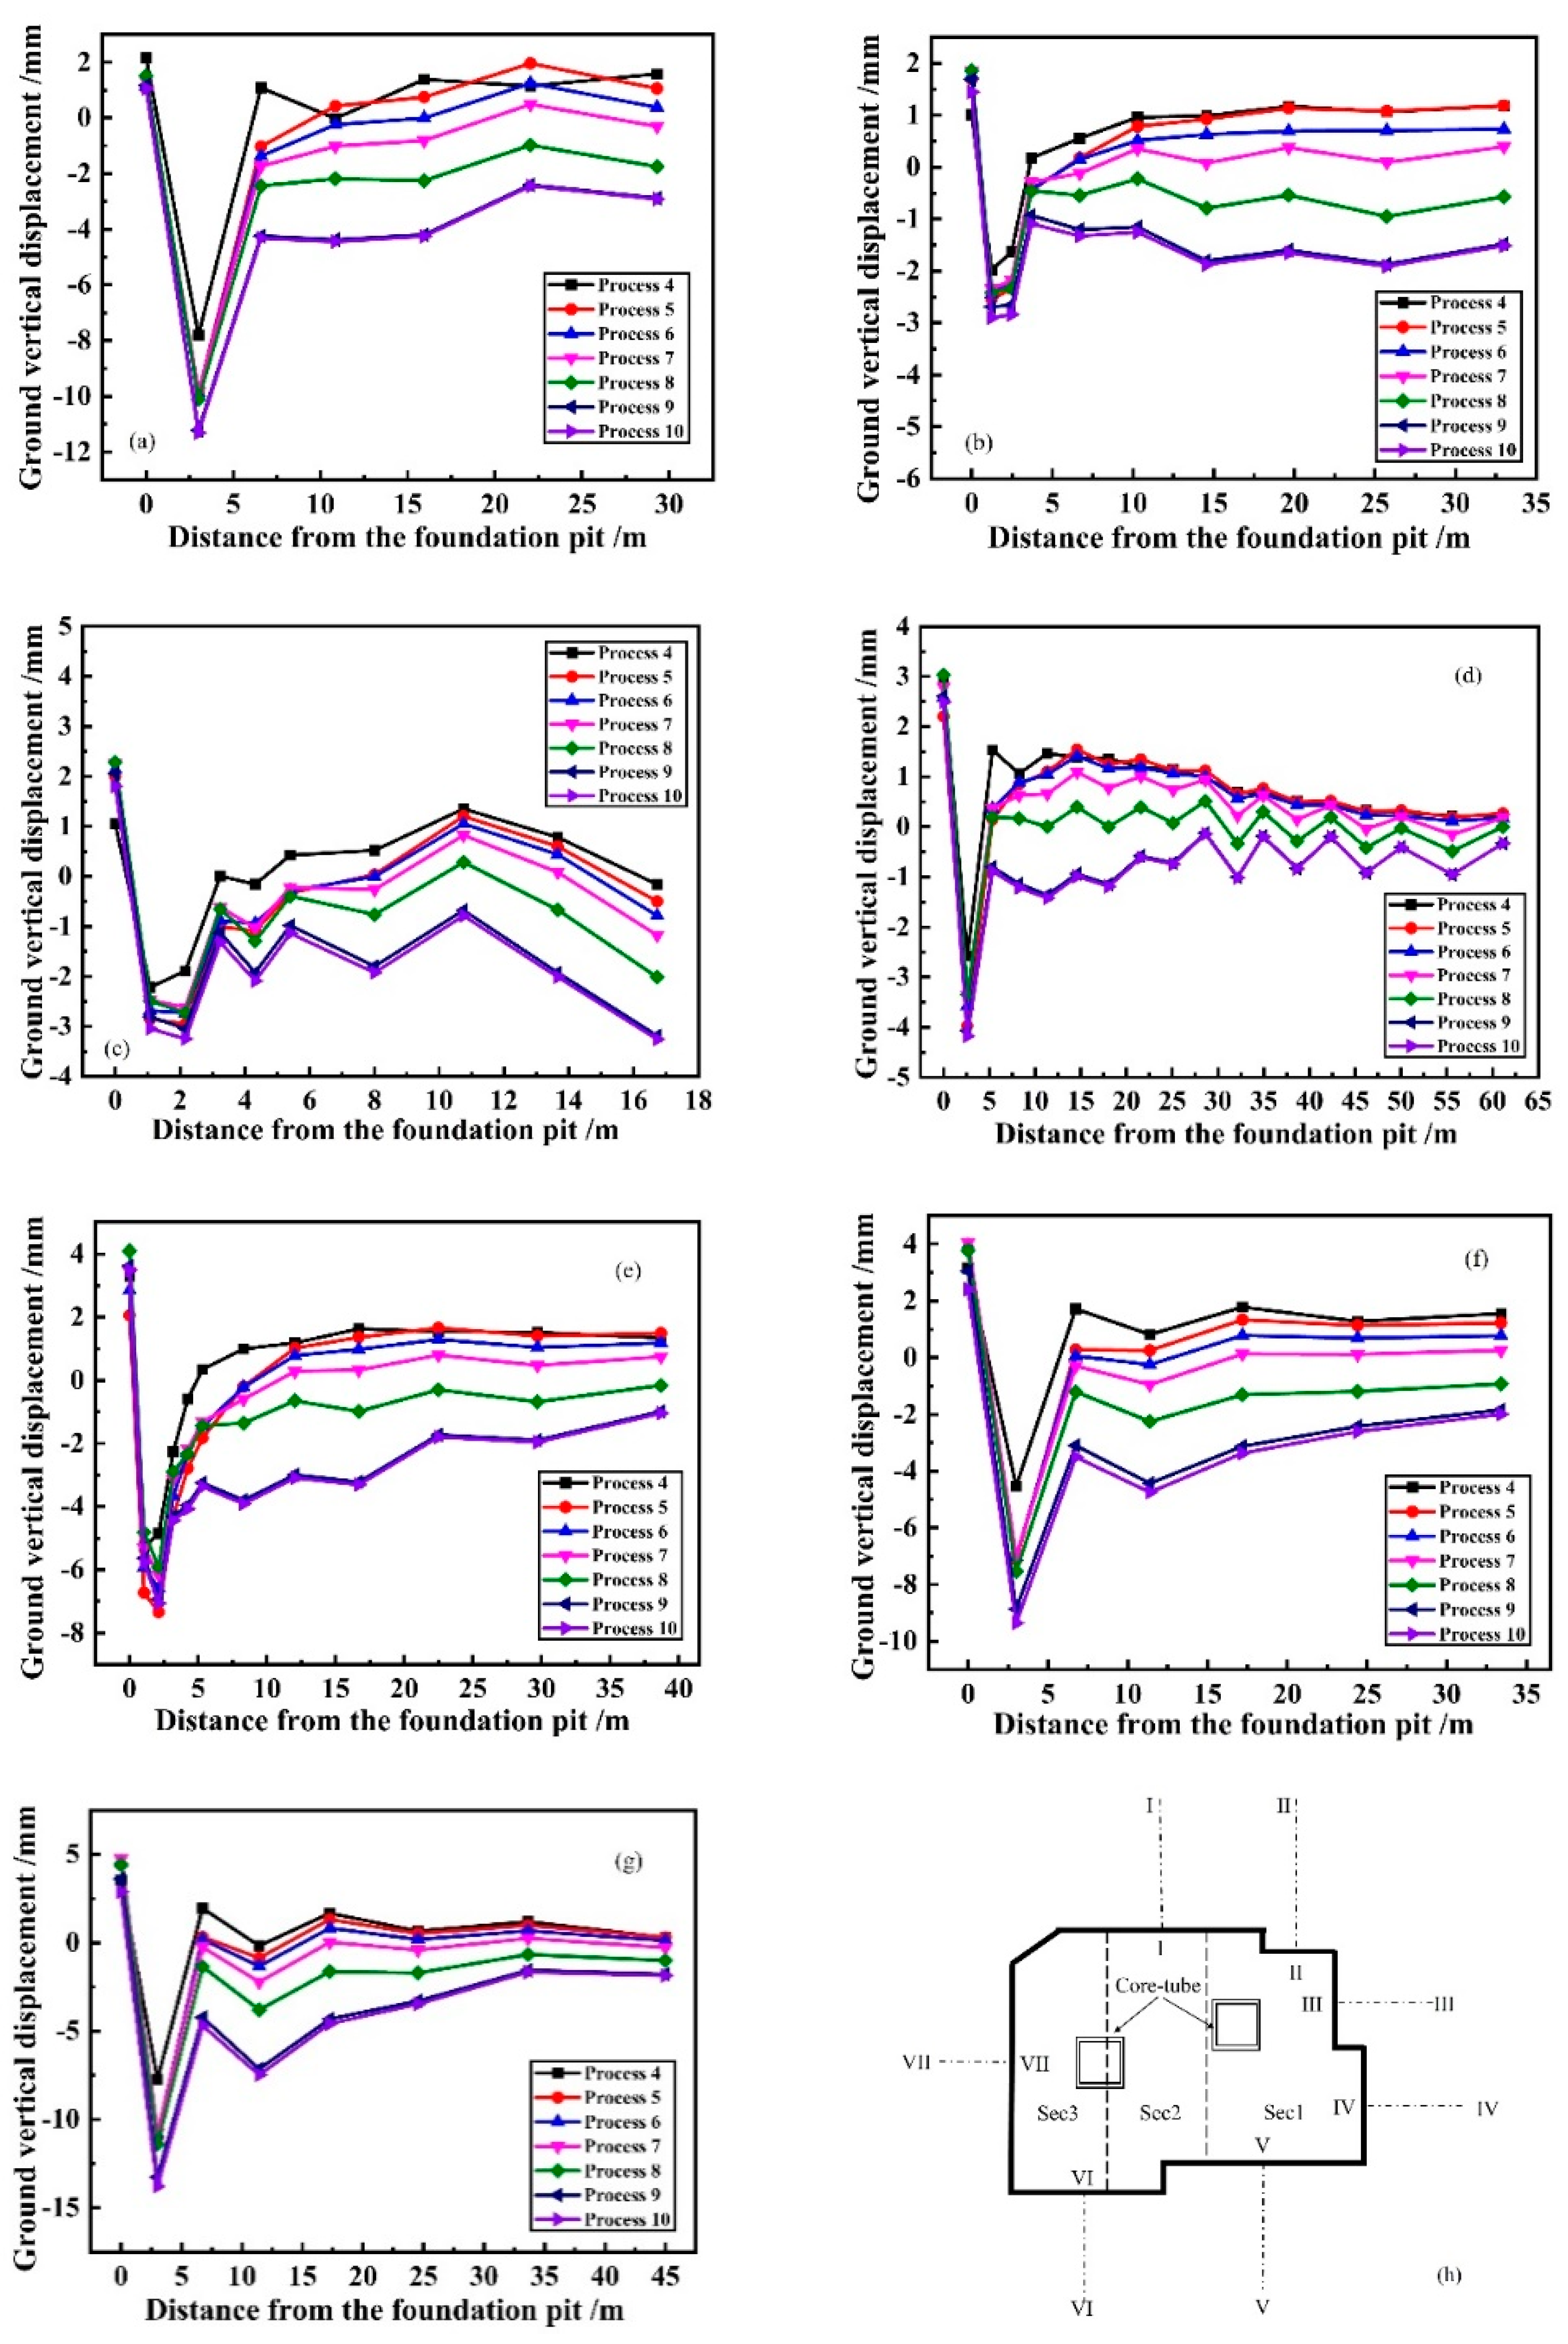
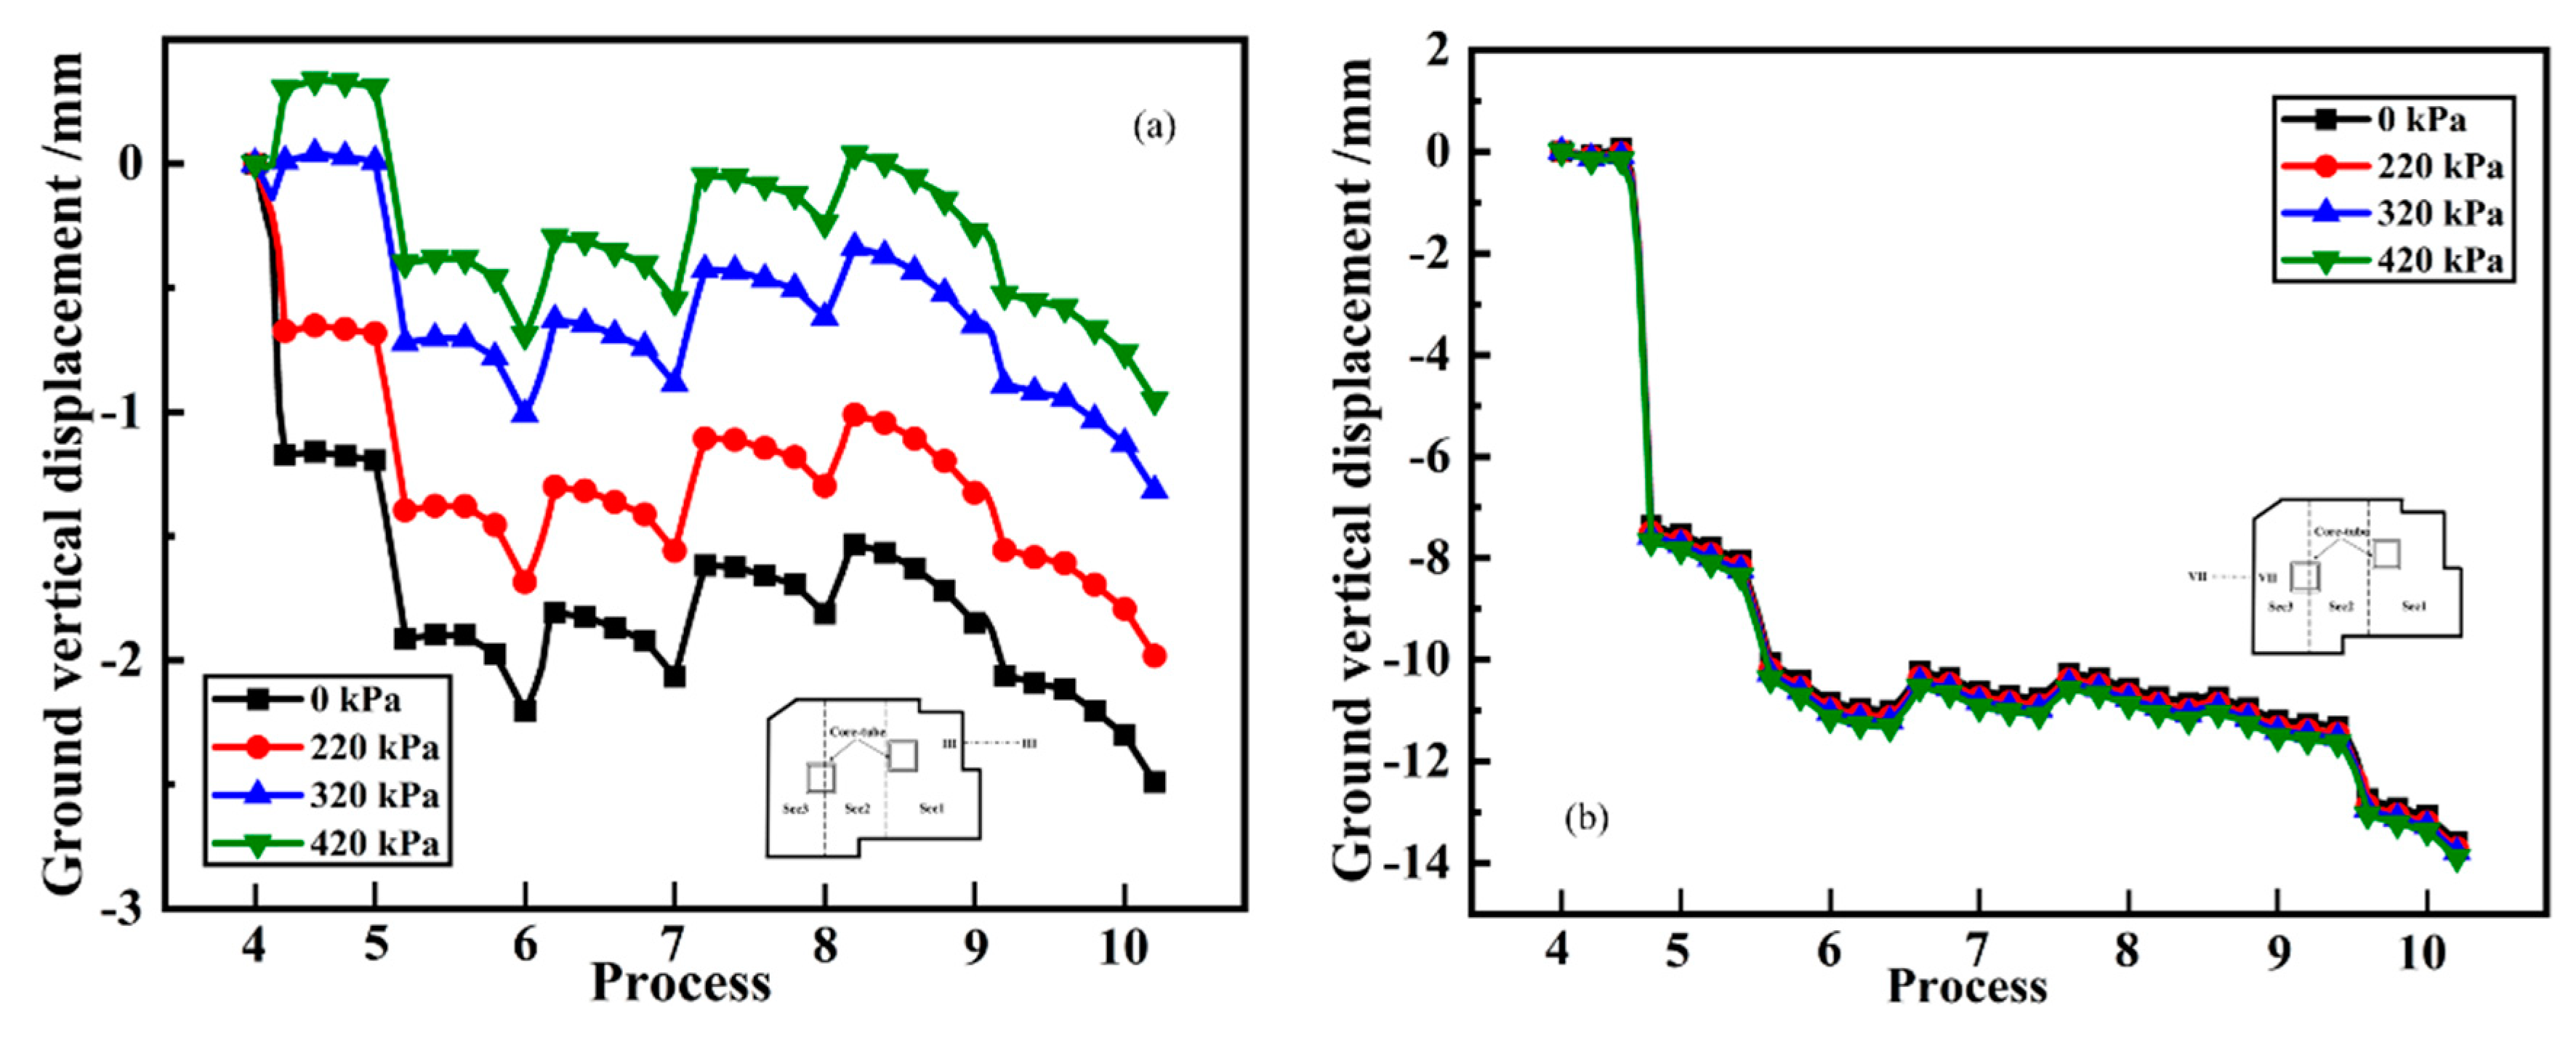
- The final deformations of the surrounding ground and of the existing buildings are settlements as the construction progress. The ground settlement shows an obvious groove shape, but it would be affected by the existing buildings and the corner effect of the pit. The significant impact range of excavation is approximately within 10.0 m around the pit. It is necessary to strengthen the monitoring of the structures and traffic routes within 10.0 m around the pit to avoid the adverse impact of construction during excavation;
- (3)
- The existing buildings have a greater impact on the deformation of the ground and the diaphragm wall between the building and the excavation, with a certain restraining effect;
- (4)
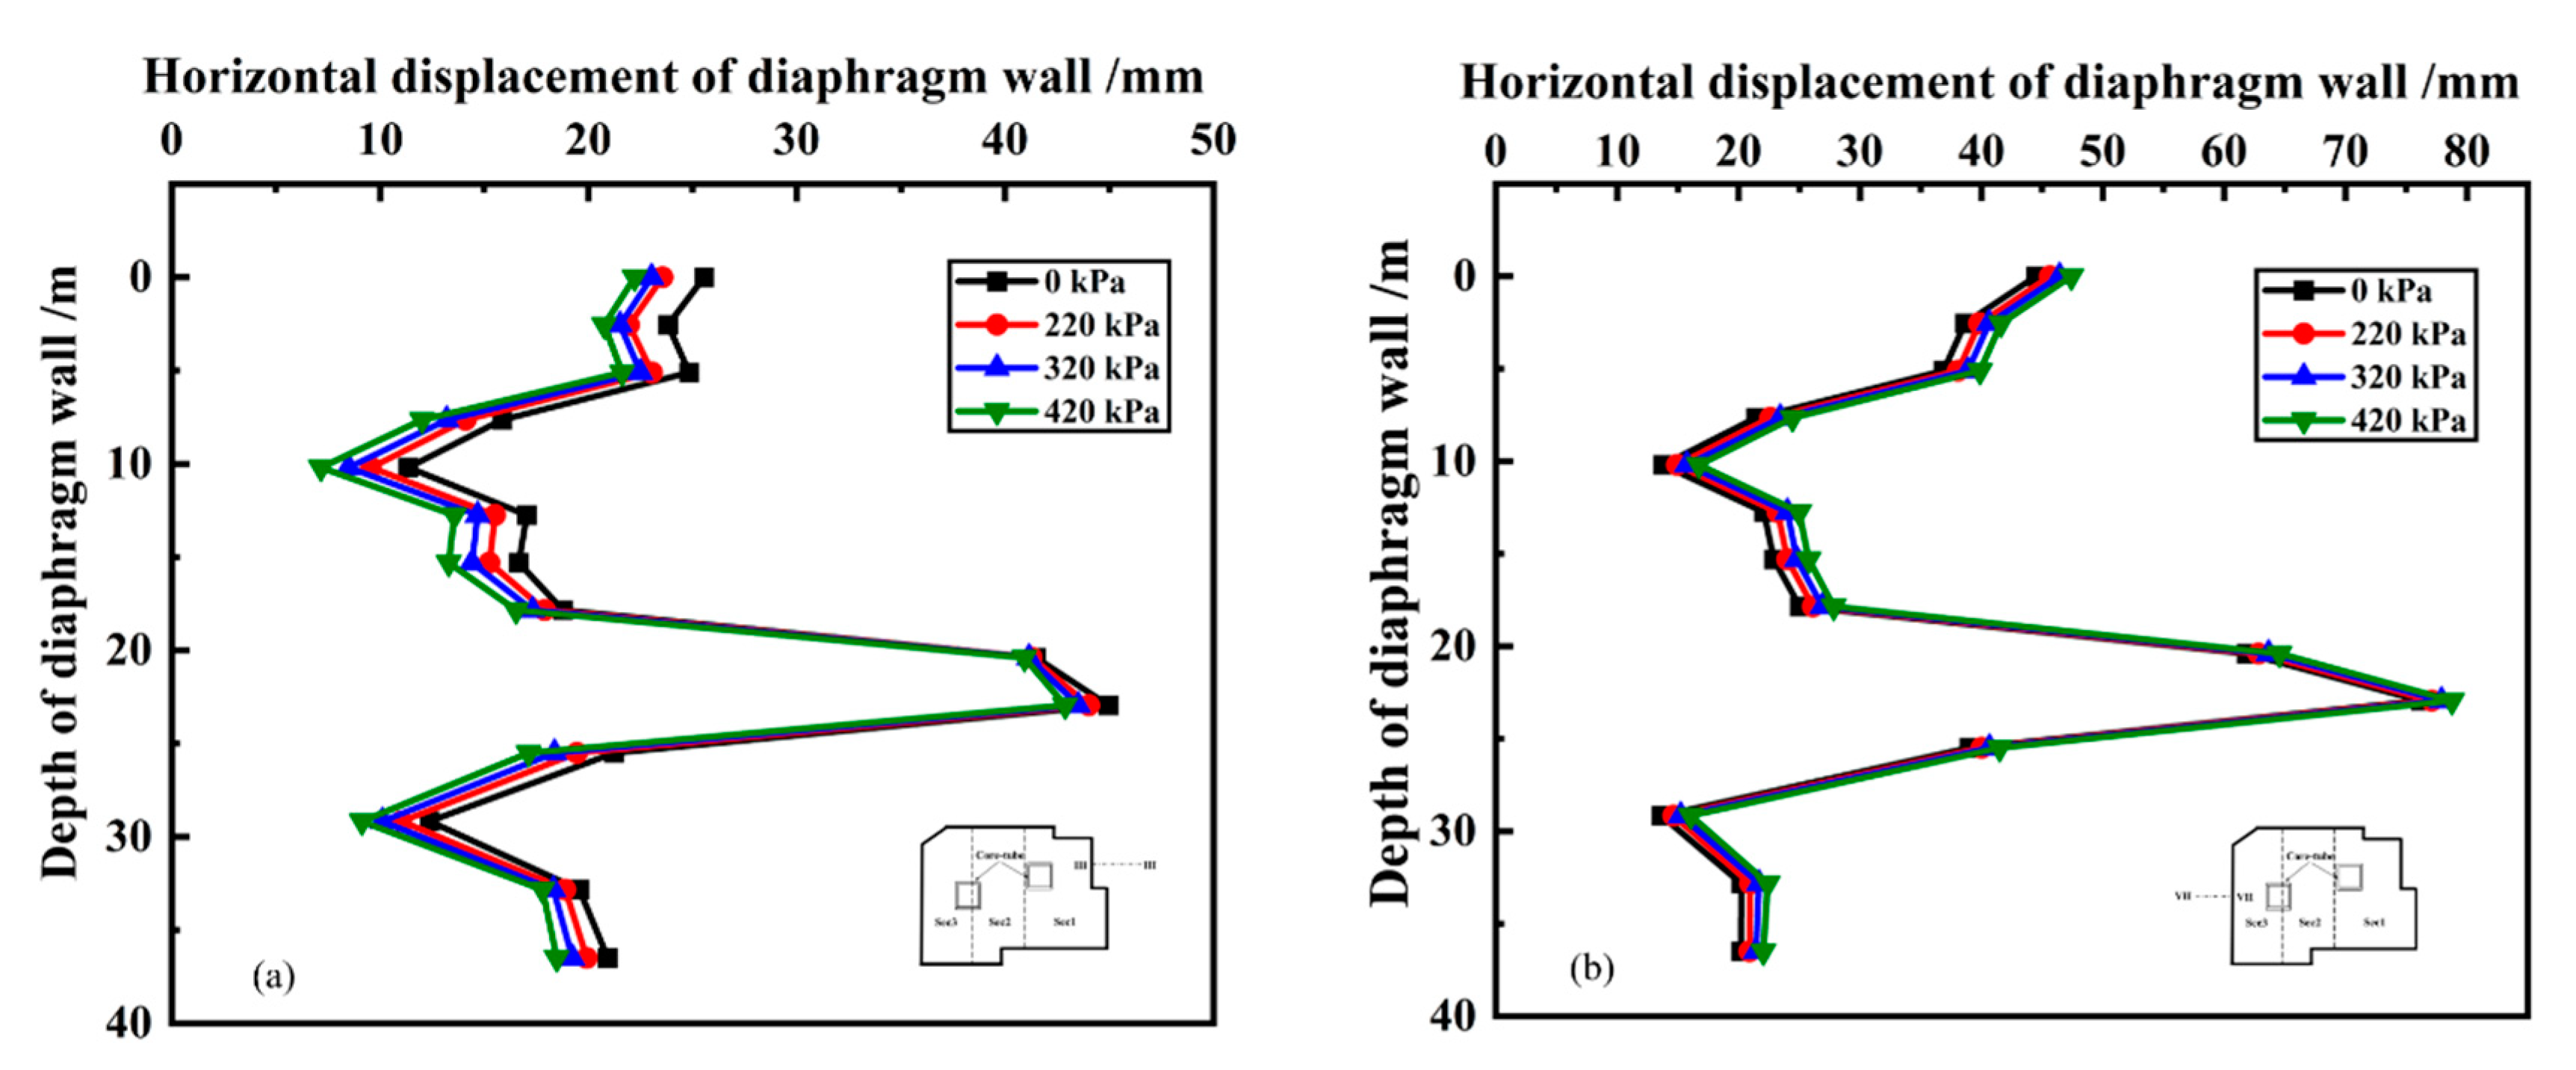
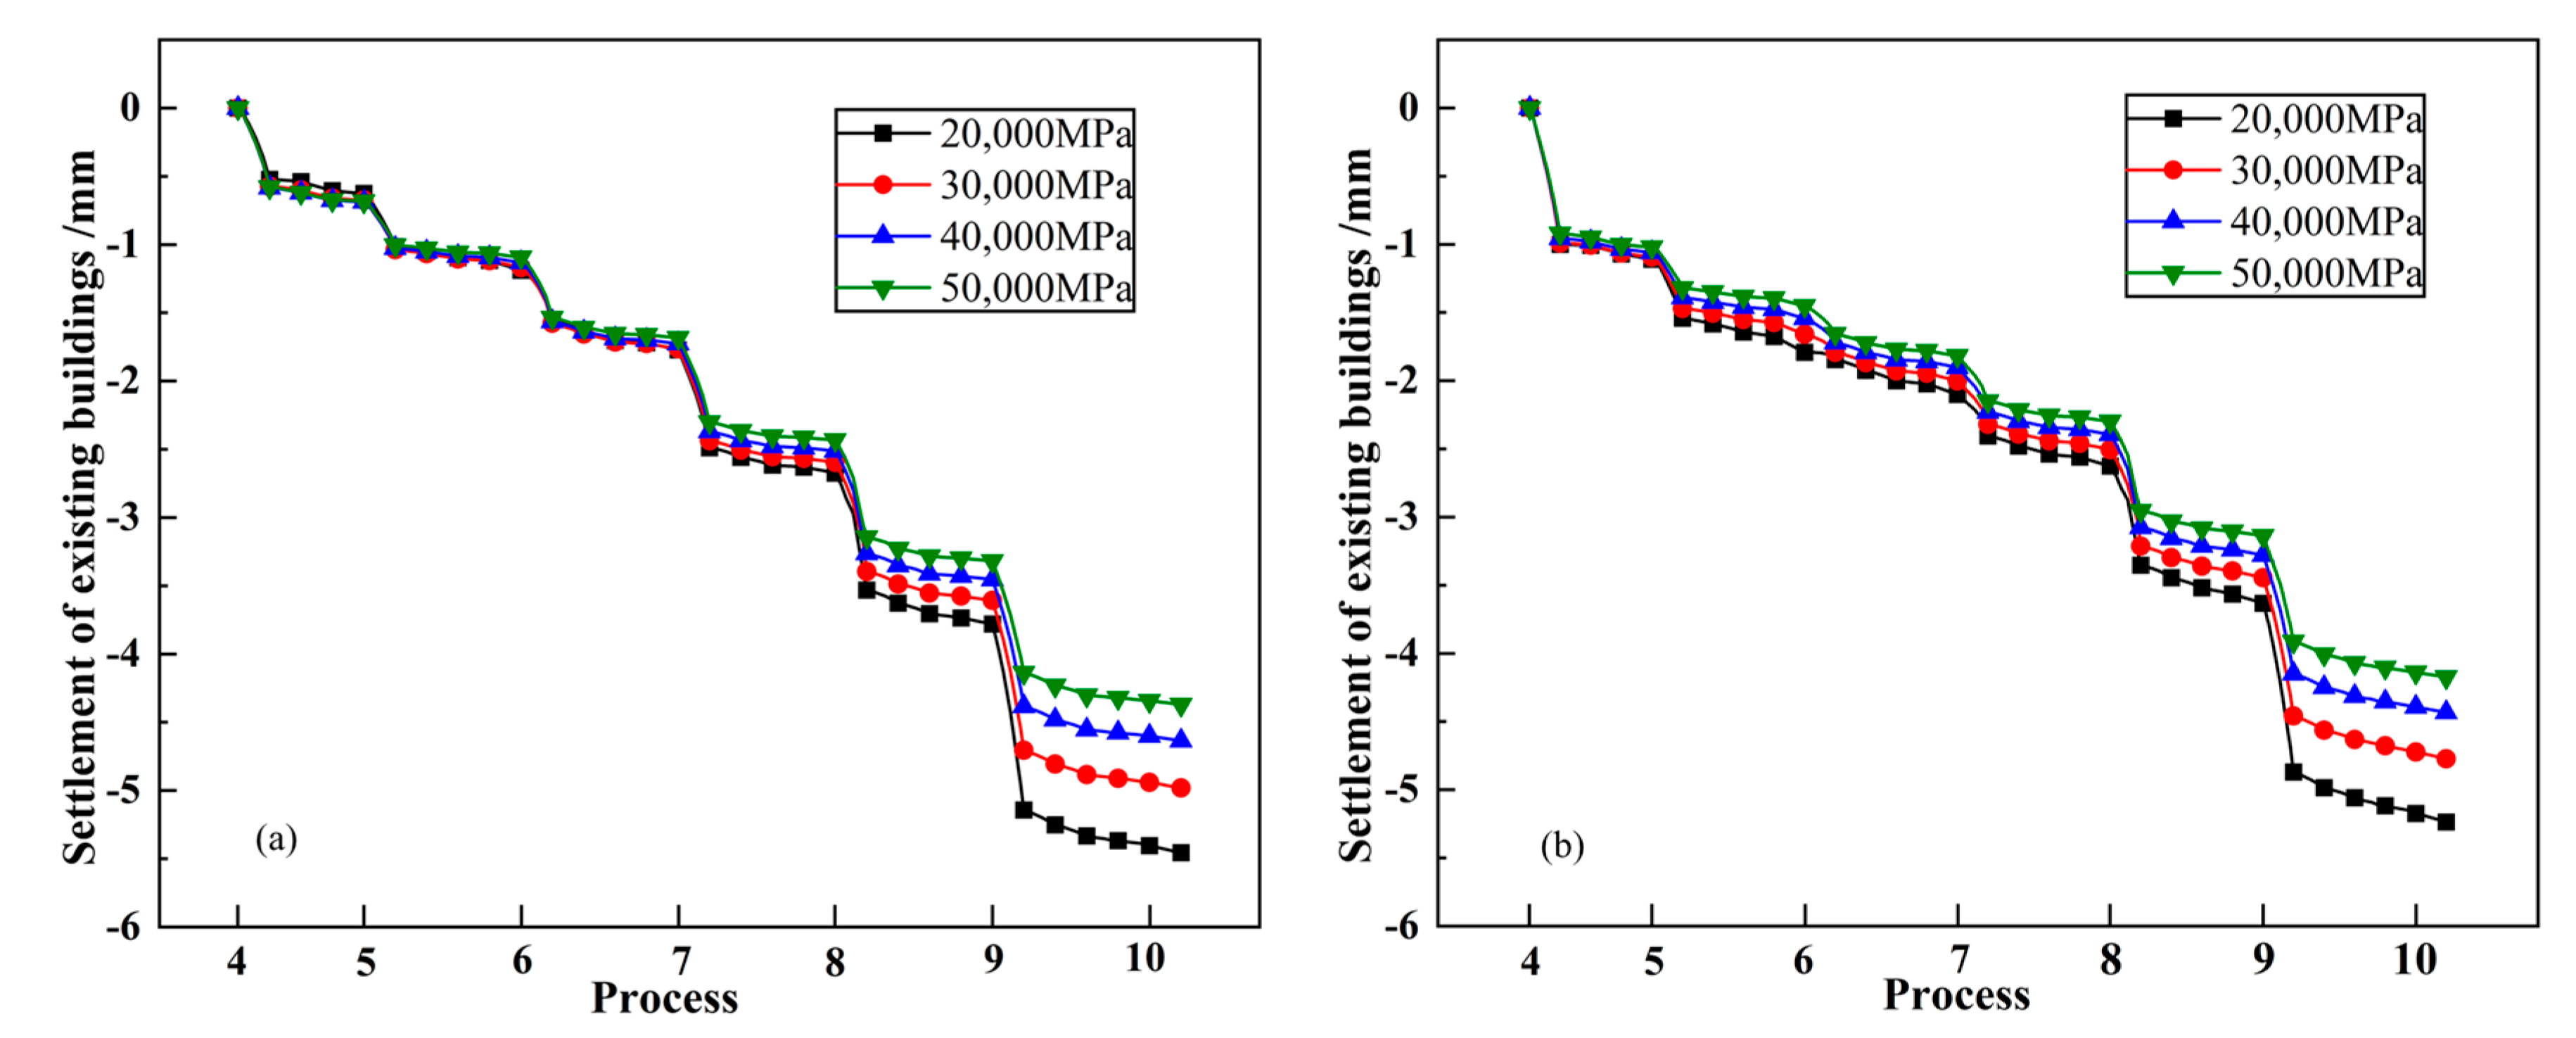
- The strength of the diaphragm wall has an obvious impact on its deformation and the settlement of existing buildings. As the strength increase, the horizontal displacement of the diaphragm wall and the vertical displacement of existing buildings both tend to decrease, but the degree of decrease is gradually diminished;
- (5)
- The impact of the construction sequence on the settlement of existing buildings can be negligible; the construction sequence can be adjusted appropriately to meet the requirements of the construction period under the condition of ensuring safety;
- (6)
- In this article, we only conducted research on specific engineering; comparative studies on different construction methods in complex site conditions need to be conducted in the future. Meanwhile, refined models also need to be gradually incorporated into engineering to obtain better results.
Author Contributions
Funding
Institutional Review Board Statement
Informed Consent Statement
Data Availability Statement
Conflicts of Interest
References
- Xiao, H.; Zhou, S.; Sun, Y. Wall Deflection and Ground Surface Settlement due to Excavation Width and Foundation Pit Classi-fication. KSCE J. Civ. Eng. 2019, 23, 1537–1547. [Google Scholar] [CrossRef]
- Finno, R.J.; Bryson, L.S. Response of Building Adjacent to Stiff Excavation Support System in Soft Clay. J. Perform. Constr. Facil. 2002, 16, 10–20. [Google Scholar] [CrossRef]
- Zheng, G.; He, X.; Zhou, H.; Yang, X.; Yu, X.; Zhao, J. Prediction of the tunnel displacement induced by laterally adjacent excavations using multivariate adaptive regression splines. Acta Geotech. 2020, 15, 2227–2237. [Google Scholar] [CrossRef]
- Korff, M.; Mair, R.J.; Van Tol, F.A.F. Pile-Soil Interaction and Settlement Effects Induced by Deep Excavations. J. Geotech. Geoenviron. Eng. 2016, 142, 04016034. [Google Scholar] [CrossRef]
- Huang, X.; Schweiger, H.F.; Huang, H. Influence of Deep Excavations on Nearby Existing Tunnels. Int. J. Géoméch. 2013, 13, 170–180. [Google Scholar] [CrossRef]
- Palmstrom, A.; Stille, H. Ground behaviour and rock engineering tools for underground excavations. Tunn. Undergr. Space Technol. 2006, 22, 363–376. [Google Scholar] [CrossRef]
- Long, M. Database for retaining wall and ground movements due to deep excavations. J. Geotech. Geoenviron. Eng. 2001, 127, 203–224. [Google Scholar] [CrossRef]
- Lu, C.B.; Zhang, M.J.; Cao, S.Q.; Wang, S.L.; Jiang, Y.F. Preferred Construction Solution for Xidan Station Engineering on Line 4# of Beijing Subway. J. Beijing Univ. Technol. 2007, 33, 160–165. (In Chinese) [Google Scholar] [CrossRef]
- Tao, L.J.; Dai, X.T.; Huang, M.Q.; Zhang, Y.; Wu, X.W. Contrast between cover and cut-top down method and cut-cover method for deformation control. J. Liaoning Tech. Univ. 2020, 39, 136–144. (In Chinese) [Google Scholar]
- Ghorbani, E.; Khodaparast, M. Geodetic Accuracy in Observational Construction of an Excavation Stabilized by Top-Down Method: A Case Study. Geotech. Geol. Eng. 2019, 37, 4759–4775. [Google Scholar] [CrossRef]
- Rojhani, M.; Bayesteh, H. Innovative Top-Down Construction Method with a Sequential Peripheral Wall. Geotech. Geol. Eng. 2023, 41, 1777–1799. [Google Scholar] [CrossRef]
- Ou, C.-Y.; Liao, J.-T.; Lin, H.-D. Performance of diaphragm wall constructed using top-down method. J. Geotech. Geoenviron. Eng. 1998, 124, 798–808. [Google Scholar] [CrossRef]
- Kung, G.T.-C. Comparison of excavation-induced wall deflection using top-down and bottom-up construction methods in Taipei silty clay. Comput. Geotech. 2009, 36, 373–385. [Google Scholar] [CrossRef]
- Fateh, A.; Hejazi, F.; Ming, Y.P.; Jafaar, M.S. Structural behavior in top-down excavation method. Arab. J. Geosci. 2014, 8, 7399–7408. [Google Scholar] [CrossRef]
- Wang, L.; Zheng, G.; Ou, R.-N. Differential uplift and settlement between inner column and diaphragm wall in top-down excavation. J. Central South Univ. 2015, 22, 3578–3590. [Google Scholar] [CrossRef]
- Gui, Y.; Zhao, Z.; Qin, X.; Wang, J. Study on Deformation Law of Deep Foundation Pit with the Top-Down Method and Its Influence on Adjacent Subway Tunnel. Adv. Civ. Eng. 2020, 2020, 1–15. [Google Scholar] [CrossRef]
- Tan, Y.; Wang, D. Characteristics of a Large-Scale Deep Foundation Pit Excavated by the Central-Island Technique in Shanghai Soft Clay. II: Top-Down Construction of the Peripheral Rectangular Pit. J. Geotech. Geoenviron. Eng. 2013, 139, 1894–1910. [Google Scholar] [CrossRef]
- Jamsawang, P.; Voottipruex, P.; Tanseng, P.; Jongpradist, P.; Bergado, D.T. Effectiveness of deep cement mixing walls with top-down construction for deep excavations in soft clay: Case study and 3D simulation. Acta Geotech. 2018, 14, 225–246. [Google Scholar] [CrossRef]
- Wang, G.; Liang, Z.; Wei, X. Study of time effect on top-down excavation of Shanghai Zhongshan Hospital. Rock Soil Mech. 2014, 35, 495–500. (In Chinese) [Google Scholar]
- Chen, Y.; Jia, P.; Ji, X. Investigation into the Performance of a Covered Top-Down Pit-in-Pit Deep Excavation in Shenzhen Soil-Rock Mixed Strata. Arab. J. Sci. Eng. 2021, 46, 10419–10437. [Google Scholar] [CrossRef]
- Tan, Y.; Huang, R.; Kang, Z.; Bin, W. Covered Semi-Top-Down Excavation of Subway Station Surrounded by Closely Spaced Buildings in Downtown Shanghai: Building Response. J. Perform. Constr. Facil. 2016, 30, 04016040. [Google Scholar] [CrossRef]
- Zong, L.D.; Xu, Z.H.; Weng, Q.P.; Wang, W.D. Application of Small Strain Constitutive Model in the Analysis of a Ultra Large and Deep Excavation. Chin. J. Undergr. Space Eng. 2019, 15, 231–242. (In Chinese) [Google Scholar]
- Huang, Z.-H.; Zhao, X.-S.; Chen, J.-J.; Wang, J.-H. Numerical Analysis and Field Monitoring on Deformation of the Semi-Top-Down Excavation in Shanghai. In Proceedings of the Geo-Shanghai 2014, Shanghai, China, 26–28 May 2014; pp. 198–207. [Google Scholar]
- Tan, Y.; Zhu, H.; Peng, F.; Karlsrud, K.; Wei, B. Characterization of semi-top-down excavation for subway station in Shanghai soft ground. Tunn. Undergr. Space Technol. 2017, 68, 244–261. [Google Scholar] [CrossRef]
- Zhang, D. Influence of Concrete Bracing on Ground Road by Cover and Dig for Concrete Support of Subway Station with Fine Silty Sand. Master’s Thesis, Anhui Jianzhu University, Hefei, China, 2018. (In Chinese). [Google Scholar]
- Gu, Z.X.; Lou, W.Z.; Cheng, Y.B.; Li, Y.W.; Song, D.W.; Sun, Y. Analysis on Deformation Behaviors of Diaphragm Walls of an Extra-long Special-shaped Deep Foundation Pit in Nanjing Soft Soil Area. Mod. Tunn. Technol. 2021, 58, 182–189. (In Chinese) [Google Scholar]


| Soil | Thickness H (m) | Unit Weight γ (kN/m3) | Compression Modulus Es (MPa) | Poisson Ratio ν | Cohesive Force c (kPa) | Internal Friction Angle ϕ (°) |
|---|---|---|---|---|---|---|
| Artificial fill | 2 | 17.9 | 3.7 | 0.30 | 5.0 | 10.0 |
| Silt | 7 | 19.1 | 8.5 | 0.30 | 31.6 | 14.3 |
| Medium sand | 13 | 20.7 | 40.0 | 0.24 | 0 | 40.0 |
| Silty clay | 2 | 19.9 | 15.7 | 0.30 | 31.2 | 14.7 |
| Pebble | 7 | 22.0 | 65.0 | 0.20 | 0 | 42.0 |
| Silty clay | 10 | 20.1 | 31.7 | 0.30 | 14.5 | 26.0 |
| Pebble | 17 | 22.0 | 75.0 | 0.20 | 0 | 42.0 |
| Silty clay | 12 | 19.8 | 35.4 | 0.30 | 15.4 | 26.7 |
| Type | Thickness or Diameter t or d (m) | Elastic Modulus E (MPa) | Poisson Ratio ν | Unit Weight γ (kN/m3) |
|---|---|---|---|---|
| Piles | 1.50 | 32,500 | 0.2 | 23.4 |
| Columns | 0.80 | 45,000 | 0.2 | 24.5 |
| The diaphragm wall | 0.80 | 30,000 | 0.3 | 23.4 |
| Core tubes | 0.80 | 37,000 | 0.2 | 24.0 |
| The roof of the 1st underground floor | 0.50 | 34,500 | 0.2 | 23.7 |
| The roof of the 2nd to the 4th underground floor | 0.25 | 32,500 | 0.2 | 23.5 |
| The roof of the 5th underground floor | 0.60 | 32,500 | 0.2 | 23.5 |
| The bottom slab of the 5th underground floor | 1.50 | 32,500 | 0.2 | 23.5 |
| The side wall | 0.70 | 37,000 | 0.2 | 24.0 |
| Process | Clarification of the Status |
|---|---|
| 1 | Initial ground stress equilibrium |
| 2 | Apply the existing buildings loads |
| 3 | Construct the diaphragm wall, the core tubes, the piles, and the steel pipe columns |
| 4 | Excavate 6.7 m downwards and construct the roof of the 1st underground floor |
| 5 | Excavate 2.3 m downwards, construct the bottom slab and the side wall of the 1st underground floor, and construct the superstructure to the 5th floor |
| 6 | Excavate 4.1 m downwards, construct the bottom slab and the side wall of the 2nd underground floor, and construct the superstructure to the 8th floor |
| 7 | Excavate 3.6 m downwards, construct the bottom slab and the side wall of the 3rd underground floor, and construct the superstructure to the 10th floor |
| 8 | Excavate 4.0 m downwards, construct the bottom slab and the side wall of the 4th underground floor, and construct the superstructure to the 15th floor |
| 9 | Excavate 4.8 m downwards and construct the bottom slab and the side wall of the 5th underground floor |
| 10 | Construct the superstructure from the 16th to the 23rd floor |
| The Cooperative Construction Sequence | Settlement of Existing Buildings (mm) | |
|---|---|---|
| JC-1 | JC-2 | |
| Actual construction sequence | 4.981 | 4.772 |
| Excavate after the construction of the roof of the first underground floor and the superstructure | 4.523 | 4.573 |
| Construct the superstructure after all the substructures are completed | 5.029 | 4.780 |
| Construct the superstructure of the 16th to the 23rd floors during the excavation of the last layer of pit | 4.992 | 4.783 |
| Construct the superstructure during excavation of the 2nd layer of pit | 5.005 | 4.777 |
| Construct the superstructure during excavation of the 3rd layer of pit | 5.089 | 4.795 |
Disclaimer/Publisher’s Note: The statements, opinions and data contained in all publications are solely those of the individual author(s) and contributor(s) and not of MDPI and/or the editor(s). MDPI and/or the editor(s) disclaim responsibility for any injury to people or property resulting from any ideas, methods, instructions or products referred to in the content. |
© 2025 by the authors. Licensee MDPI, Basel, Switzerland. This article is an open access article distributed under the terms and conditions of the Creative Commons Attribution (CC BY) license (https://creativecommons.org/licenses/by/4.0/).
Share and Cite
Li, L.; Li, Z.; Lei, L.; Li, Z.; Jiang, H.; Gao, Y. Case Study on Response Characteristic of Surroundings Induced by a Covered Semi-Top-Down Excavation with Synchronous Construction of the Superstructure and Substructure. Appl. Sci. 2025, 15, 2739. https://doi.org/10.3390/app15052739
Li L, Li Z, Lei L, Li Z, Jiang H, Gao Y. Case Study on Response Characteristic of Surroundings Induced by a Covered Semi-Top-Down Excavation with Synchronous Construction of the Superstructure and Substructure. Applied Sciences. 2025; 15(5):2739. https://doi.org/10.3390/app15052739
Chicago/Turabian StyleLi, Liyun, Zixuan Li, Ling Lei, Zhuyan Li, Haonan Jiang, and Yunhao Gao. 2025. "Case Study on Response Characteristic of Surroundings Induced by a Covered Semi-Top-Down Excavation with Synchronous Construction of the Superstructure and Substructure" Applied Sciences 15, no. 5: 2739. https://doi.org/10.3390/app15052739
APA StyleLi, L., Li, Z., Lei, L., Li, Z., Jiang, H., & Gao, Y. (2025). Case Study on Response Characteristic of Surroundings Induced by a Covered Semi-Top-Down Excavation with Synchronous Construction of the Superstructure and Substructure. Applied Sciences, 15(5), 2739. https://doi.org/10.3390/app15052739