Abstract
Football is a sport in which athletes perform many movements using one of their legs, which is characterized as dominant. This differentiation in usage often creates asymmetries between the limbs, which has been noted to be related to the occurrence of injuries as well as negative effects on performance. To assess these asymmetries, vertical jump tests, as well as tests using an isokinetic dynamometer, were employed. The aim of this study was to examine the relationship between the asymmetries observed in the application of the single-leg countermovement jump (SLCMJ) and those observed through isokinetic strength assessment at 60°/s, 180°/s, and 300°/s in high-level youth football players. The study involved 63 elite youth football players. For statistical analysis, correlation analysis and linear regression analysis were used. The results showed a significant positive correlation between the CMJ Bilateral Asymmetry Index and the BAI Anterior Quadriceps (60°/s) (r = 0.262, p = 0.038, 95% CI [0.016, 0.479]), indicating a small-to-moderate effect size (Fisher’s z = 0.269, SE = 0.129). Additionally, a significant negative correlation was identified between the CMJ Bilateral Asymmetry Index and the BAI Posterior Hamstrings (60°/s) (r = −0.319, p = 0.011, 95% CI [−0.525, −0.077]), demonstrating a moderate inverse relationship (Fisher’s z = −0.331, SE = 0.129). The overall regression model was significant, F(6,56) = 2.42, p = 0.038, R2 = 0.206, indicating that the predictors collectively explained approximately 20.6% of the variance in the CMJ Bilateral Asymmetry Index. From the findings of this study, we conclude that the SLCMJ asymmetry index cannot replace the asymmetry index from isokinetic strength tests.
1. Introduction
In football, as in most sports involving ball handling, athletes develop a preference for using one of their legs to control the ball. Typically, a football player uses their dominant leg to shoot and pass the ball, while the other leg is considered the non-dominant leg [1]. The choice of the dominant leg often influences the player’s position on the field. However, in addition to movements involving the ball, most movements made by football players during matches or training sessions are performed without the ball and are characterized by the preference for the dominant leg [2,3]. Such movements include changes of direction, take-offs for jumping, feints, and tackles, among others.
Over time, this preference has been shown to lead to asymmetries between the limbs in performance on specific physical tests (e.g., single-leg jumps, isokinetic strength measurements) [4]. When these asymmetries exceed 15%, they have been associated with an increased risk of injury [5,6] as well as a negative impact on athletic performance [7,8,9,10,11]. These asymmetries have been observed at all levels of football players, including professionals, amateurs, and youth players [11,12,13].
Over the years, various tests have been used to detect asymmetries, such as isokinetic strength measurements [14,15], vertical jump tests [8,16], horizontal jump tests [7,17,18], and strength exercises (e.g., back squat) [19]. However, it should be noted that these tests differ significantly from each other. For example, the assessment using an isokinetic dynamometer focuses on one joint and measures different types of strength depending on the speed of movement, whereas a jump test is a multi-joint test that evaluates the power/jumping ability of the athlete’s lower limbs. Therefore, the appropriate test should be chosen depending on the specific goal.
Among these tests, the isokinetic dynamometer is the most reliable for assessing strength asymmetries. However, this test requires specialized personnel for administration, is time-consuming, and has high costs, which means it is not frequently conducted by teams for all their players. In contrast, tests that involve single-leg jumps can be conducted with much more affordable equipment, require less specialized expertise from the evaluator, and are much quicker. Additionally, many jumping tests are part of the weekly routine for football teams. Thus, if there was a relationship between the detection tests (isokinetic evaluation and jump tests), it would be possible to detect not only strength asymmetries but also asymmetries in various forms of strength using a jumping test.
This approach could help identify asymmetries in the lower limbs (across a broader spectrum of physical abilities, maximum strength, power-speed, and strength endurance) as part of the weekly routine for football players, enabling the implementation of individualized programs before these asymmetries affect performance or become a risk factor for injury.
Therefore, the aim of this study was to examine the relationship between the asymmetries observed in the application of the single-leg countermovement jump (SLCMJ) and those observed through isokinetic strength assessment at 60°/s, 180°/s, and 300°/s in high-level youth football players. We hypothesize that the asymmetries observed in the SLCMJ will be positively correlated with the asymmetries observed in the isokinetic strength evaluation (60°/s, 180°/s, and 300°/s), and particularly at 300°/s, which is an indicator of the lower limb’s power-speed.
2. Methods
2.1. Participants
A priori power analysis was conducted to estimate the appropriate sample size for detecting a significant correlation between the CMJ Bilateral Asymmetry Index and isokinetic variables. The analysis was performed using G*Power version 3.1.9.7 [20,21], and the following parameters were applied: a two-tailed test, an α error probability of 0.05, a power (1-β) of 0.80, and an expected effect size (Cohen’s q) of 0.4 [22]. Based on these criteria, the analysis determined that a sample size of 62 participants would be required to achieve sufficient statistical power. To ensure robustness and accommodate any potential exclusions, we decided to include a total of 63 participants in the study.
The study included 63 high-level youth football players. The characteristics of the participants are presented in Table 1.

Table 1.
Characteristics of participants.
Regarding playing positions, central midfielders (CM) constituted the largest group, comprising 30.2% of the sample, followed by side midfielders (SM) at 27.0%, central defenders (CD) at 19.0%, side defenders (SD) at 11.1%, goalkeepers (GK) at 7.9%, and forwards (F) at 4.8%. Dominance in leg use was also assessed, revealing that 76.2% of the players favored their right leg, while 23.8% were left-leg dominant (Table 2).
Table 2.
Frequencies of position and dominant leg.
To participate, the players had to meet the following criteria: (a) no musculoskeletal injuries in the past two months, (b) no current medication use. All players were fully informed about the study’s requirements and provided appropriate consent to participate, with consent from a parent or guardian for players under the age of 18. The investigation was also approved by the institutional review board.
The study took place at the beginning of the preseason during the players’ ergometric testing. Specifically, the players were in their first week of training with the team after the transitional period. The participants were members of a high-level academy of a professional football team and had been training systematically for approximately 10 years. The previous year, they had finished in the top positions of their country’s domestic championship.
2.2. Procedures
The participants were familiar with the tests, as these were assessments they had performed annually during their ergometric evaluations. All tests were conducted in the morning, between 9:00 and 12:00 AM, in a laboratory setting with stable temperature and humidity conditions (~22 °C, ~40% humidity). Initially, the participants arrived at the lab, and their anthropometric characteristics were measured. This was followed by a 10 min warm-up, consisting of 7 min of cycling on a cycle ergometer (Monark 839, Varberg, Sweden) at 100 Watts and 3 min of stretching exercises for the lower limbs (hamstrings, quadriceps, gastrocnemius, adductors) and arm rotations. The jump test was then conducted, followed by the isokinetic strength evaluation. Additionally, the participants were allowed to drink water ad libitum to ensure proper hydration during testing.
2.3. Anthropometric Measurements and Assessment of Maturation
To measure body mass, the players removed their clothing and shoes and stood in their underwear. The measurement was taken using an electronic scale with an accuracy of 0.1 kg (Seca 220e, Hamburg, Germany). The same device also included a stadiometer, which was used to measure the players’ height with an accuracy of 0.1 cm. To assess body fat percentage, a skinfold caliper (Lange, Beta Technology, Santa Cruz, CA, USA) was used to measure four skinfold sites (biceps, triceps, suprailiac, and subscapular), and Siri’s equation [23] was applied to calculate the body fat percentage.
The chronological age at peak height velocity (PHV) of the players was estimated using the equation proposed by Moore and colleagues [24]. Early, average, and late maturation of the children were defined as those players with an estimated chronological age at PHV of less than 13 years of age, 13–15 years of age, and more than 15 years of age [25].
2.4. Single-Leg Countermovement Jump (SLCMJ)
The single-leg countermovement jump was measured using the electronic leap mat Chronojump from Boscosystem (Chronojump, Boscosystem, Barcelona, Spain). The participants stood in an upright position and lifted one leg off the ground with their hands placed on their hips. From this position, they bent the knee of the supporting leg to a self-selected depth, followed by a quick upward vertical movement. Two jumps were performed for each leg, and the best performance was used for analysis. If the jump technique was incorrect, the player was asked to repeat the jump after a one-minute recovery.
2.5. Isokinetic Strength Testing
The isokinetic strength of the hamstring and quadriceps muscles was measured using a Cybex II isokinetic dynamometer (Lumex Inc., Ronkonkoma, New York, NY, USA). For each angular velocity, peak isokinetic torque was recorded simultaneously, and the torque produced by the limb weight and the dynamometer arm was extracted from the collected data. Each participant then sat on the dynamometer in an adjustable chair, with their upper body secured by straps placed diagonally across the chest and around the hips and thighs to minimize any unwanted joint movement. The knee being tested was positioned at 90° of flexion (with 0° representing full knee extension) to align with the axis of the dynamometer lever arm at the distal point of the lateral femoral condyle. The length of the lever arm was adjusted individually for each participant, and the resistance pad was positioned just above the medial malleolus. The other leg remained relaxed, hanging freely without any applied force. Knee movements followed a specific sequence: extension was performed from the 90° flexed position, and flexion was performed from full extension (0°). Participants were instructed to kick their tested leg as hard and fast as possible through the full range of motion (ROM) while keeping their arms crossed over their chest. Three repetitions were performed at each angular velocity, with the peak torque (PT) value being recorded. A 30 s rest period was allowed between repetitions, and a 60 s rest interval was given between assessments at different angular velocities. During the session, participants were encouraged to perform maximal voluntary contractions with verbal positive reinforcement. Data were collected at angular velocities of 60, 180, and 300°/s, and maximal isokinetic strength was identified as the torque produced by the hamstring and quadriceps muscles during movements through their full ROM [26,27]. The ratio of peak torques at each angular velocity reflects the concentric strength ratio between the knee flexors and extensors. The traditional H:Q ratio was calculated by dividing each participant’s highest concentric peak torque for leg flexion by their highest concentric peak torque for leg extension.
2.6. Asymmetry Index
To calculate asymmetry, both in the CMJ (Countermovement Jump) and in isokinetic exercises at angular velocities of 60°/s, 180°/s, and 300°/s, the Bilateral Asymmetry Index was utilized, based on the following equation: [dominant leg − non-dominant leg]/[dominant leg + non-dominant leg] × 100.
This method assesses inter-limb asymmetry during bilateral CMJs and was previously used [28,29]. To determine the direction of asymmetry during unilateral CMJs, an “IF function” (IF × [non-dominant leg < dominant leg, 1, −1]) was added to the end of the equation, as suggested in previous research [30].
Leg preference during bilateral CMJs was identified through a questionnaire for the identification of dominant and non-dominant limbs, aligned with prior studies, such as those by Pérez-Castilla et al. (2021) [31].
2.7. Statistical Analysis
Initially, G*Power version 3.1.9.7 [20,21] was employed to estimate the required sample size and ensure adequate statistical power for the analysis. Descriptive statistics and correlation analyses were performed using JASP (version 0.19.3.0 for Windows), IBM SPSS Statistics (version 29 for Windows), and Jamovi (version 2.6.23.0 for Windows) [32,33,34,35]. In the current analysis, the correlation levels were interpreted as follows: coefficients around r = 0.10 were considered small, r = 0.30 indicated moderate relationships, and r = 0.50 or higher reflected strong correlations, in line with Cohen’s effect size guidelines. Effect sizes for the observed correlations were calculated using Fisher’s z transformation to provide a standardized measure of relationship strength, accompanied by standard error measurements. Furthermore, linear regression analysis was performed to examine the predictive relationship between the CMJ Bilateral Asymmetry Index and the isokinetic variables. Statistical significance was set at p < 0.05.
3. Results
The results regarding the biological maturation of the participants showed that, out of the total of 63 participants, 24 were in the stage of normal maturation, while the rest were all in the stage of early maturation. The characteristics of the youth football players are presented in the next table.
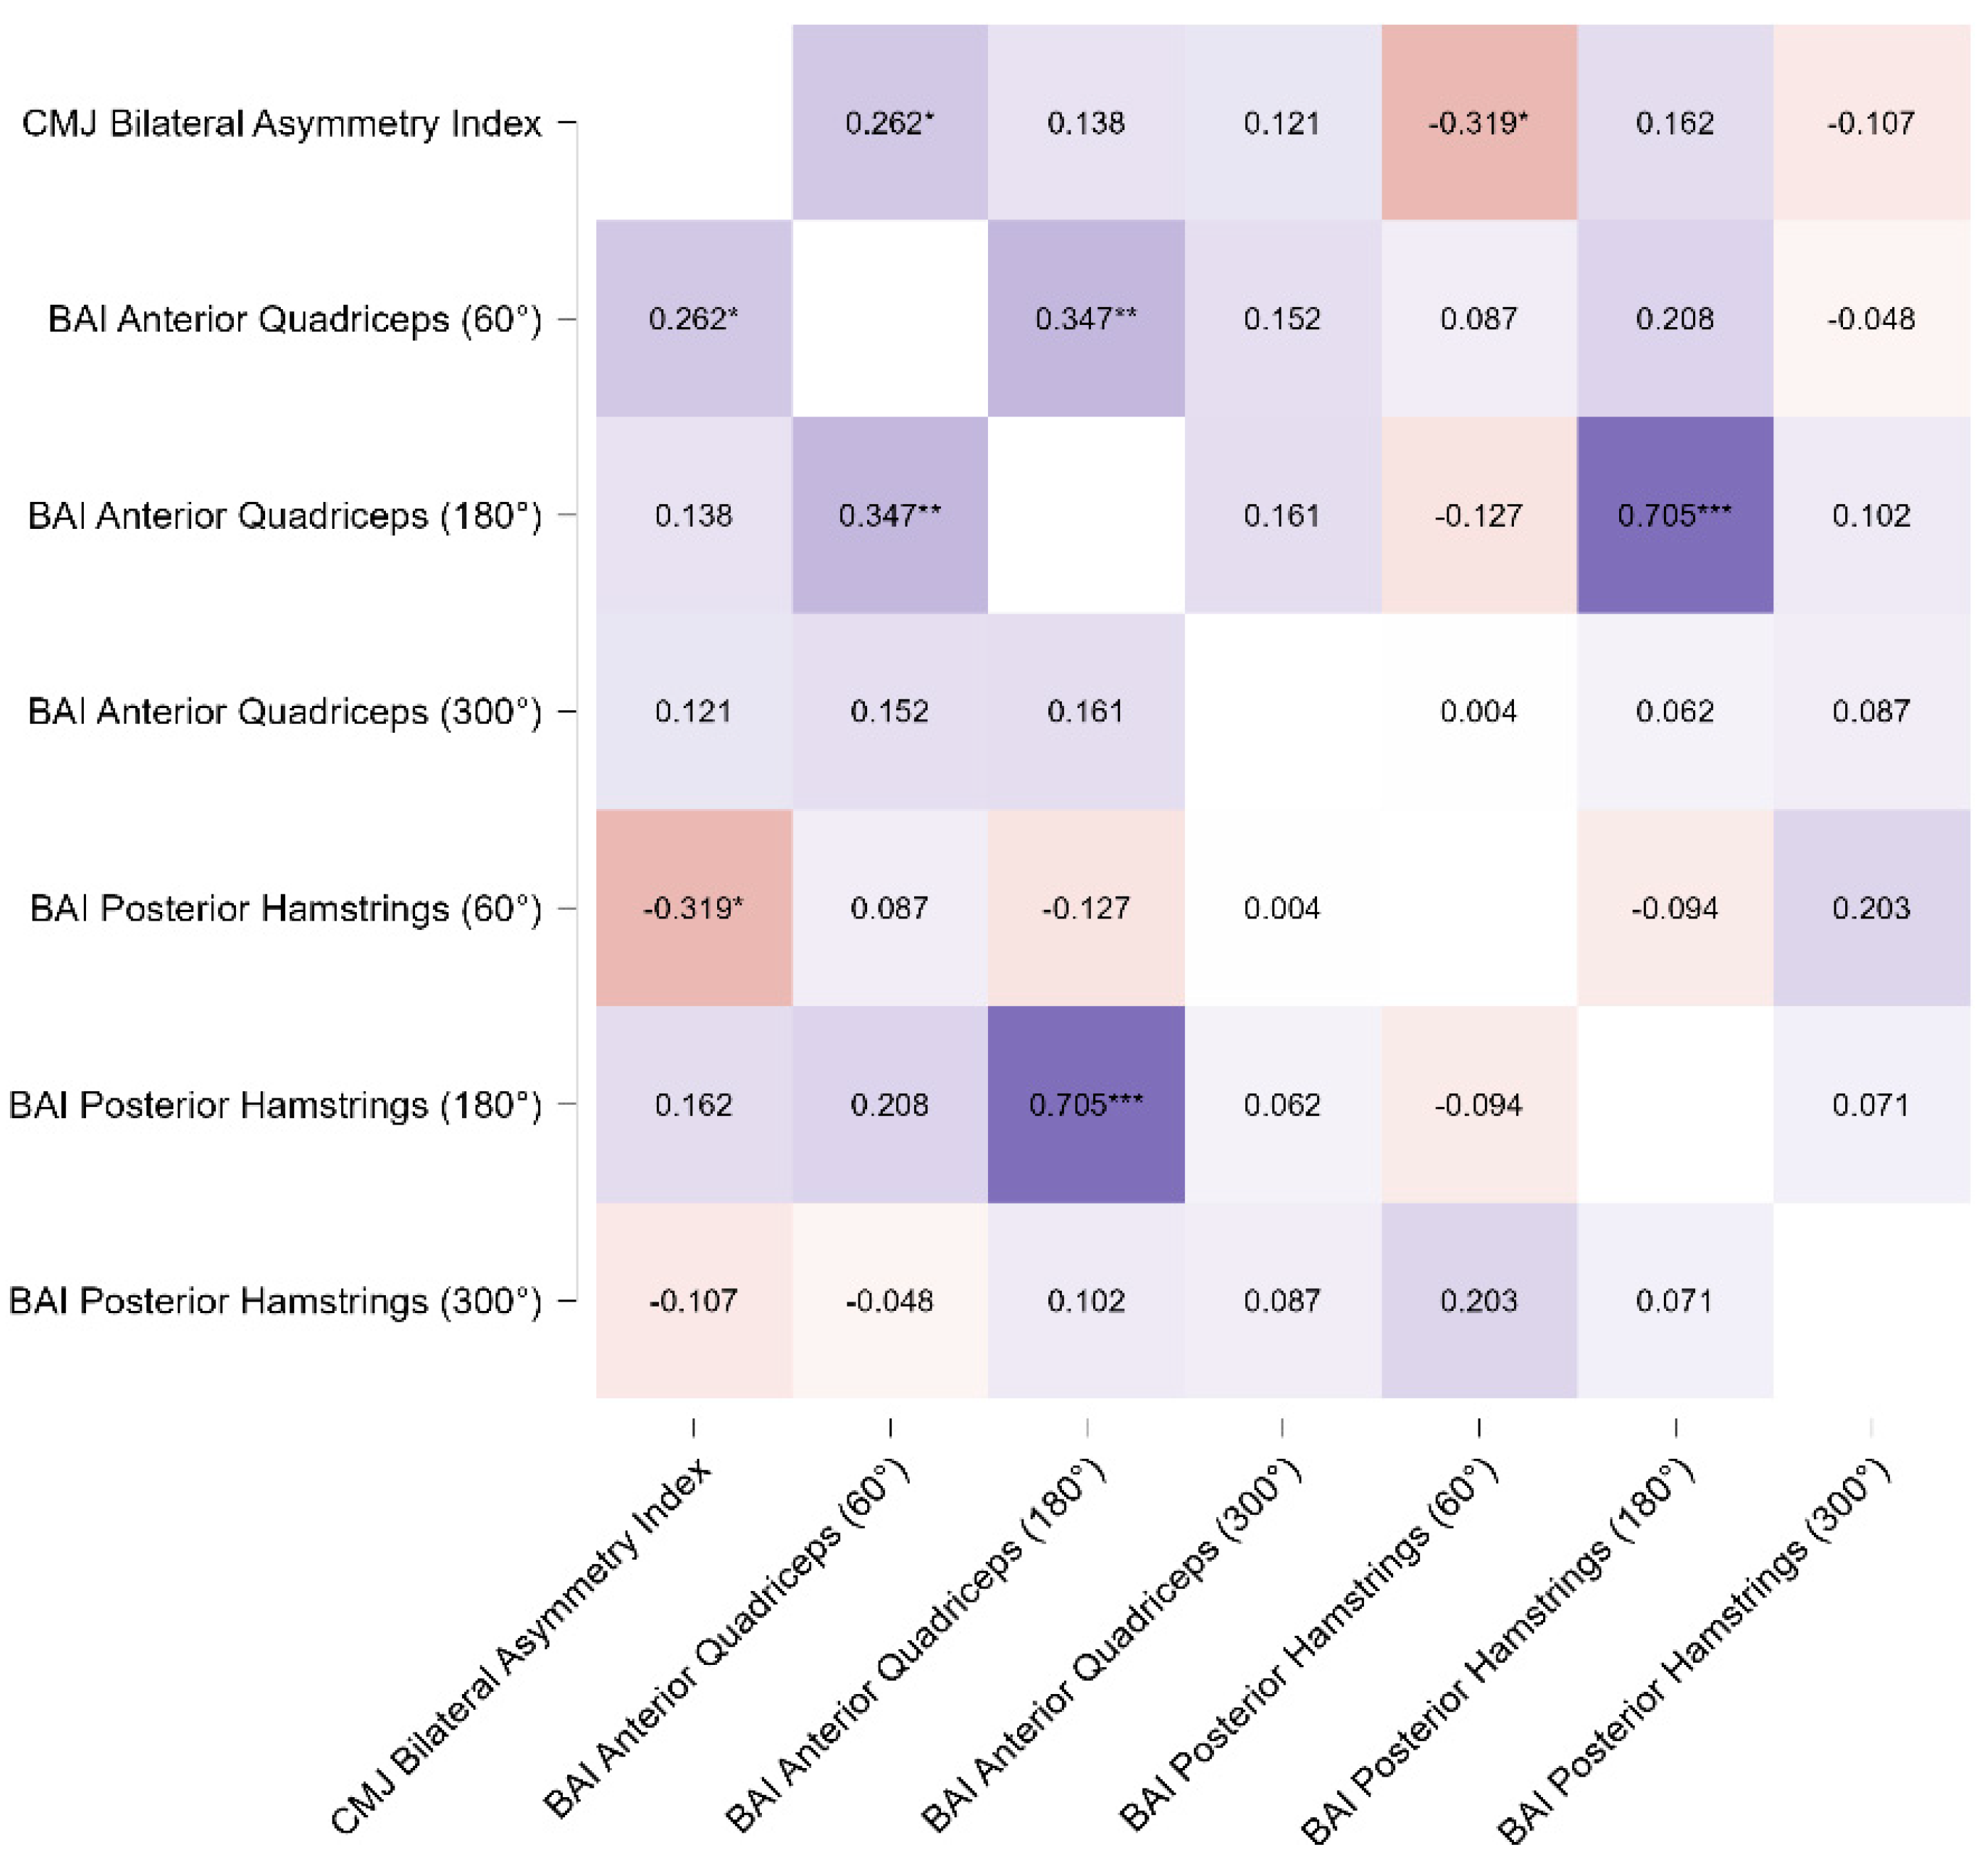
The correlation analysis revealed significant relationships between the CMJ Bilateral Asymmetry Index and specific isokinetic strength variables. A significant positive correlation was observed between the CMJ Bilateral Asymmetry Index and the BAI Anterior Quadriceps (60°/s) (r = 0.262, p = 0.038, 95% CI [0.016, 0.479]), indicating a small-to-moderate effect size (Fisher’s z = 0.269, SE = 0.129). This finding indicates a modest but meaningful association between bilateral asymmetry and the anterior quadriceps performance at lower angular velocities.
In contrast, a significant negative correlation was identified between the CMJ Bilateral Asymmetry Index and the BAI Posterior Hamstrings (60°/s) (r = −0.319, p = 0.011, 95% CI [−0.525, −0.077]), demonstrating a moderate inverse relationship (Fisher’s z = −0.331, SE = 0.129). This suggests that greater bilateral asymmetry in the CMJ is associated with reduced performance in the posterior hamstrings at this angular velocity.
No significant correlations were found between the CMJ Bilateral Asymmetry Index and the other variables, including BAI Anterior Quadriceps at 180°/s (r = 0.138, p = 0.280, 95% CI [−0.114, 0.373]) and 300°/s (r = 0.121, p = 0.347, 95% CI [−0.131, 0.358]), or the BAI Posterior Hamstrings at 180°/s (r = 0.162, p = 0.205, 95% CI [−0.090, 0.394]) and 300°/s (r = −0.107, p = 0.404, 95% CI [−0.346, 0.145]).
These findings indicate specific relationships between bilateral asymmetry and muscle performance at angular velocities of 60°/s, indicating distinct roles for the anterior quadriceps and posterior hamstrings (Table 3 and Figure 1).
Table 3.
Pearson correlation results between CMJ Bilateral Asymmetry Index (BAI) and muscle strength asymmetries at various angles.
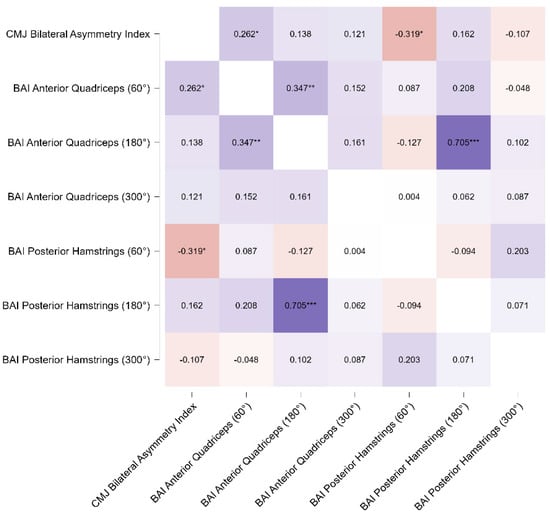
Figure 1.
Pearson’s correlation matrix of CMJ Bilateral Asymmetry Index (BAI) and isokinetic variables across different angular velocities. The heatmap displays Pearson’s correlation coefficients (r) between the CMJ Bilateral Asymmetry Index and biomechanical variables, including BAI Anterior Quadriceps (60°/s, 180°/s, 300°/s) and BAI Posterior Hamstrings (60°/s, 180°/s, 300°/s). Significant correlations are indicated with * p < 0.05, ** p < 0.01, *** p < 0.001. Warmer colors indicate positive correlations, while cooler colors represent negative correlations.
Moreover, a multiple linear regression analysis was conducted to explore the relationship between the CMJ Bilateral Asymmetry Index and the biomechanical predictors, including BAI Anterior Quadriceps (60°/s, 180°/s, 300°/s) and BAI Posterior Hamstrings (60°/s, 180°/s, 300°/s). The overall regression model (Table 3) was significant, F(6,56) = 2.42, p = 0.038, R2 = 0.206, indicating that the predictors collectively explained approximately 20.6% of the variance in the CMJ Bilateral Asymmetry Index. The regression coefficients revealed that BAI Anterior Quadriceps (60°/s) was a significant positive predictor of the CMJ Bilateral Asymmetry Index, B = 0.208, SE = 0.094, t(56) = 2.211, p = 0.031, with a standardized estimate of β = 0.288 and a 95% confidence interval of [0.027, 0.549]. Conversely, BAI Posterior Hamstrings (60°/s) demonstrated a significant negative relationship with the CMJ Bilateral Asymmetry Index, B = −0.203, SE = 0.074, t(56) = −2.723, p = 0.009, with a standardized estimate of β = −0.340 and a 95% confidence interval of [−0.589, −0.090]. The other predictors, including BAI Anterior Quadriceps (180°/s), BAI Anterior Quadriceps (300°/s), BAI Posterior Hamstrings (180°/s), and BAI Posterior Hamstrings (300°/s), did not show statistically significant contributions to the model (p > 0.05) (Table 4). These results highlight the specific influence of BAI Anterior Quadriceps and BAI Posterior Hamstrings at 60°/s angular velocity on bilateral asymmetry during CMJ performance.
Table 4.
Linear regression results for CMJ Bilateral Asymmetry Index.
4. Discussion
The results of the study partially confirmed the initial hypothesis. Specifically, a positive correlation was observed between the asymmetry in the SLCMJ and the BAI Anterior Quadriceps (60°/s), as well as a negative correlation between the asymmetry in the SLCMJ and the BAI Posterior Hamstrings (60°/s). No correlations were observed with strength measurements at other angular velocities. Additionally, the regression analysis showed that the BAI Anterior Quadriceps (60°/s) was a significant positive predictor of the CMJ Bilateral Asymmetry Index, while the BAI Posterior Hamstrings (60°/s) demonstrated a significant negative relationship with the CMJ Bilateral Asymmetry Index.
As mentioned earlier, asymmetry in isokinetic strength above 10% has been reported as a potential risk factor for injury [36,37], although there are studies that set the risk threshold at 15% [5,6]. Research interest has also focused on the effect of asymmetry on football players’ performance in physical performance indicators [38,39]. However, it seems that the results of these studies are not clear-cut, and the impact of asymmetry appears to depend on how it is assessed and the individual involved [40]. Therefore, it is evident that there is considerable room for further study on this topic.
In the present study, the participants were adolescents, and it is well known that biological maturation can significantly affect performance in physical ability tests [41,42]. The results of this study showed that approximately one-third of the participants were at a stage of normal maturation, while the remaining two-thirds were at a stage of early maturation. This observation is likely due to the fact that the participants are members of a professional football team academy. Often, biologically mature football players outperform their peers (normal maturation, delayed maturation) in physical abilities, which leads to them being selected by team scouts and coaches. This is likely why the majority of participants in this study were at an early maturation stage, and there were no participants in the late maturation stage. However, although the maturation stage of the participants was assessed, the effect of maturation level on the asymmetry indices and performance of the participants was not examined. This fact is mentioned as a limitation of the study.
Maximum strength is an important factor for jumping ability [43]. Specifically, a positive correlation between strength and jumping ability has been reported [44,45]. Strength improvement positively affects the rate of force development, which is particularly crucial for fast movements such as jumping [46,47]. It has been observed that vertical jump height can be explained by knee extensor and flexor strength by approximately 30% [36]. Thus, deficiencies in strength could affect jumping performance.
In one of the earliest studies on this subject [29], researchers investigated the relationship between bilateral asymmetry in isokinetic knee strength and the single-leg jump. The results indicated that the asymmetry index at 180°/s of isokinetic strength was positively correlated with the bilateral asymmetry index for the maximum flexion angle and the mean knee joint torque during single-leg jumps. In the present study, as previously mentioned, a positive correlation was observed between the asymmetry in the SLCMJ and the asymmetry in the isokinetic strength of the quadriceps at 60°/s, and a moderate negative correlation was found between the asymmetry in the SLCMJ and the asymmetry in the isokinetic strength of the hamstrings at 60°/s. More recent studies also report correlations between asymmetry indices in different tests [30], though these correlations were characterized as “poor” in some cases. This may be due to the use of an isometric strength test, as opposed to the current study, which utilized isokinetic strength assessment across the full range of motion of the joint at three different angular velocities.
The literature includes studies that found no correlations between the asymmetry indices used. For example, Loturco et al. (2018) [48] studied whether asymmetries in isokinetic strength (60°/s and 300°/s) were related to asymmetries in jump tests (squat jump, CMJ). Their results showed no correlations except for one between squat jump asymmetry and knee flexion at 60°/s. In a later study [39], asymmetry indices derived from the Abalakov test, a change of direction test, and an iso-inertial power test were found to be unrelated. A lack of correlations between asymmetry indices was also reported in another study [38]. The limited correlations observed suggest that multiple and varied tests are needed to detect asymmetries in football players. Furthermore, since the above studies involved both genders and participants of different ages and skill levels, it appears that the lack of relationship between asymmetry indices across different tests is more related to the nature of the parameter being assessed and less to the characteristics of the sample [39].
As mentioned earlier, the results of the regression analysis in this study showed that the quadriceps and hamstring asymmetry indices could explain 20.6% of the variance in the CMJ Bilateral Asymmetry Index. In this case, an R-squared value of 20.6% suggests that approximately 20.6% of the variation in the dependent variable (SLCMJ asymmetry) can be explained by the independent variables included in the model, while the remaining 79.4% may be attributed to factors not captured by the model or random variation. Although this is not a very high proportion, it can still provide useful insights depending on the context and domain of the analysis.
This study has certain limitations. The participants were only male athletes in the developmental age group, meaning the results cannot be generalized to both genders or to different skill levels. The effect of biological maturation on the asymmetry indices has not been examined. Additionally, to detect asymmetry in the SLCMJ, equipment that calculates jump height based on flight time was used. The use of a force plate would provide more detailed and accurate data. Furthermore, only isokinetic strength assessments of the knee flexors and extensors were conducted. Therefore, future research involving both genders and utilizing a force plate, as well as isokinetic strength evaluations of hip muscles, which significantly affect jump performance [49,50], may uncover stronger correlations and relationships between variables.
5. Conclusions
The results showed that no significant correlations were observed between the two asymmetry indices across all their parameters, meaning that the isokinetic dynamometer asymmetry index cannot be replaced by the SLCMJ asymmetry index. The asymmetries observed in football players depend on the physical ability being assessed, and a combination of tests is required to form a complete picture of the player. Coaches and rehabilitation professionals should use both methods (SLCMJ asymmetry index and isokinetic strength asymmetry index) for a comprehensive assessment of lower-limb asymmetry in young football players. More specifically, the SLCMJ asymmetry index should be used for jumping ability, while the corresponding asymmetry indices should be used for isokinetic strength.
Author Contributions
Y.M., T.I.M., A.M. and A.S. designed the study and provided critical feedback on the manuscript; A.M., A.E.K., G.A., R.K. and V.K. collected and processed. C.B., L.V. and E.S. analyzed the data. Y.M., A.S. and T.I.M. revised the first draft; A.S. and Y.M. conducted the statistical analysis. All authors have read and agreed to the published version of the manuscript.
Funding
This research received no external funding.
Institutional Review Board Statement
The Ethics Committee of the School of Physical Education and Sport Science at Thessaloniki hereby approved the study (App. No. 188/2024).
Informed Consent Statement
Informed consent was obtained from all parents of subjects involved in the study.
Data Availability Statement
The raw data supporting the conclusions of this article will be made available by the authors on request.
Acknowledgments
The authors thank the players of the team who participated in the study.
Conflicts of Interest
The authors declare no conflicts of interest.
References
- Ben Kahla, A.; Elghoul, Y.; Ammar, A.; Masmoudi, L.; Trabelsi, K.; Glenn, J.M.; Dahmen, R. Bilateral Training Improves Agility and Accuracy for Both Preferred and Non-Preferred Legs in Young Soccer Players. Percept. Mot. Skills 2022, 129, 1804–1825. [Google Scholar] [CrossRef] [PubMed]
- DeLang, M.D.; Rouissi, M.; Braggazi, N.L.; Chamari, K.; Salamh, P.A. Soccer Footedness and Between-Limb Muscle Strength: A Systematic Review and Meta-Analysis. Int. J. Sports Physiol. Perform. 2019, 14, 4. [Google Scholar] [CrossRef] [PubMed]
- Frontani, F.; Prenassi, M.; Paolini, V.; Formicola, G.; Marceglia, S.; Policastro, F. Dominant and Nondominant Leg Kinematics During Kicking in Young Soccer Players: A Cross-Sectional Study. Motor Control 2022, 27, 327–337. [Google Scholar] [CrossRef]
- Keeley, D.W.; Plummer, H.A.; Oliver, G.D. Predicting Asymmetrical Lower Extremity Strength Deficits in College-Aged Men and Women Using Common Horizontal and Vertical Power Field Tests: A Possible Screening Mechanism. J. Strength Cond. Res. 2011, 25, 1632–1637. [Google Scholar] [CrossRef] [PubMed]
- Hägglund, M.; Waldén, M.; Ekstrand, J. Risk Factors for Lower Extremity Muscle Injury in Professional Soccer. Am. J. Sports Med. 2013, 41, 327–335. [Google Scholar] [CrossRef]
- Nadler, S.F.; Malanga, G.A.; Feinberg, J.H.; Prybicien, M.; Stitik, T.P.; DePrince, M. Relationship Between Hip Muscle Imbalance and Occurrence of Low Back Pain in Collegiate Athletes: A Prospective Study. Am. J. Phys. Med. Rehabil. 2001, 80, 572–577. [Google Scholar] [CrossRef]
- Michailidis, Y.; Savvakis, C.; Pirounakis, V.; Mikikis, D.; Margonis, K.; Metaxas, T. Association Between Jump Asymmetry and Reduced Performance in the Change of Direction Tests of Youth Soccer Players. J. Phys. Educ. Sport 2020, 20, 1362–1368. [Google Scholar] [CrossRef]
- Michailidis, Y.; Pirounakis, V.; Savvakis, C.; Margonis, K.; Metaxas, T. The Influence of Unilateral Jumping Asymmetry on Acceleration and Speed Performance in U10 and U15 Groups of Youth Soccer Players. Trends Sport Sci. 2019, 26, 141–151. [Google Scholar] [CrossRef]
- Bishop, C.; Coratella, G.; Beato, M. Intra- and Inter-Limb Strength Asymmetry in Soccer: A Comparison of Professional and Under-18 Players. Sports 2021, 9, 129. [Google Scholar] [CrossRef]
- Lin, J.; Shen, J.; Zhou, A.; Badicu, G.; Grosz, W.R. The Effects of Inter-Limb Asymmetry on Change of Direction Performance: A Systematic Review. Symmetry 2022, 14, 2177. [Google Scholar] [CrossRef]
- Michailidis, Y. Relation of Jump and Change of Direction Inter-Limb Asymmetries with Fitness in Youth Male Soccer Players. Medicina 2023, 59, 1749. [Google Scholar] [CrossRef] [PubMed]
- Beato, M.; Young, D.; Stiff, A.; Coratella, G. Lower-Limb Muscle Strength, Anterior-Posterior and Inter-Limb Asymmetry in Professional, Elite Academy and Amateur Soccer Players. J. Hum. Kinet. 2021, 77, 135–146. [Google Scholar] [CrossRef] [PubMed]
- Bishop, C.; Brashill, C.; Abbott, W.; Read, P.; Lake, J.; Turner, A. Jumping Symmetries Are Associated with Speed, Change of Direction Speed, and Jump Performance in Elite Academy Soccer Players. J. Strength Cond. Res. 2021, 35, 1841–1847. [Google Scholar] [CrossRef] [PubMed]
- Coratella, G.; Beato, M.; Schena, F. Correlation Between Quadriceps and Hamstrings Inter-Limb Strength Asymmetry with Change of Direction and Sprint in U21 Elite Soccer Players. Hum. Mov. Sci. 2018, 59, 81–87. [Google Scholar] [CrossRef]
- Dos’Santos, T.; Thomas, C.; Jones, P.; Comfort, P. Assessing Muscle Strength Symmetry via a Unilateral Stance Isometric Mid-Thigh Pull. Int. J. Sports Physiol. Perform. 2017, 12, 505–511. [Google Scholar] [CrossRef]
- Maloney, S.; Fletcher, I.; Richards, J. A Comparison of Methods to Determine Bilateral Asymmetries in Vertical Leg Stiffness. J. Sports Sci. 2016, 34, 829–835. [Google Scholar] [CrossRef]
- Hamilton, R.T.; Shultz, S.J.; Schmitz, R.J.; Perrin, D.H. Triple-Hop Distance as a Valid Predictor of Lower Limb Strength and Power. J. Athl. Train. 2008, 43, 144–151. [Google Scholar] [CrossRef]
- Hewit, J.K.; Cronin, J.B.; Hume, P.A. Asymmetry in Multi-Directional Jumping Tasks. Phys. Ther. Sport 2012, 13, 238–242. [Google Scholar] [CrossRef]
- Hart, N.; Nimphius, S.; Spiteri, T.; Newton, R. Leg Strength and Lean Mass Symmetry Influence Kicking Performance in Australian Football. J. Sports Sci. Med. 2014, 13, 157–165. [Google Scholar]
- Faul, F.; Erdfelder, E.; Buchner, A.; Lang, A.G. Statistical Power Analyses Using G*Power 3.1: Tests for Correlation and Regression Analyses. Behav. Res. Methods 2009, 41, 1149–1160. [Google Scholar] [CrossRef]
- Faul, F.; Erdfelder, E.; Lang, A.G.; Buchner, A. G*Power 3: A Flexible Statistical Power Analysis Program for the Social, Behavioral, and Biomedical Sciences. Behav. Res. Methods 2007, 39, 175–191. [Google Scholar] [CrossRef] [PubMed]
- Cohen, J. Statistical Power Analysis. Curr. Dir. Psychol. Sci. 1992, 1, 98–101. [Google Scholar] [CrossRef]
- Siri, W.E. The Gross Composition of the Body. Adv. Biol. Med. Phys. 1956, 4, 239–280. [Google Scholar]
- Moore, S.A.; McKay, H.A.; Macdonald, H.; Nettlefold, L.; Baxter-Jones, A.D.; Cameron, N.; Brasher, P.M. Enhancing a Somatic Maturity Prediction Model. Med. Sci. Sports Exerc. 2015, 47, 1755–1764. [Google Scholar] [CrossRef] [PubMed]
- Sherar, L.B.; Mirwald, R.L.; Baxter-Jones, A.D.; Thomis, M. Prediction of adult height using maturity-based cumulative height velocity curves. J. Pediatr. 2005, 147, 508–514. [Google Scholar] [CrossRef]
- Mandroukas, A.; Metaxas, T.I.; Michailidis, Y.; Christoulas, K.; Heller, J. Effects of Soccer Training on Muscular Strength: A Comparative Study in Trained Youth Soccer Players and Untrained Boys of the Same Biological Age. J. Sports Med. Phys. Fit. 2020, 61, 1469–1477. [Google Scholar] [CrossRef]
- Mandroukas, A.; Michailidis, Y.; Metaxas, T. Muscle Strength and Hamstrings to Quadriceps Ratio in Young Soccer Players: A Cross-Sectional Study. J. Funct. Morphol. Kinesiol. 2023, 8, 70. [Google Scholar] [CrossRef]
- Bishop, C.; Read, P.; Lake, J.; Chavda, S.; Turner, A. Interlimb Asymmetries: Understanding How to Calculate Differences from Bilateral and Unilateral Tests. Strength Cond. J. 2018, 40, 1–6. [Google Scholar] [CrossRef]
- Kobayashi, Y.; Kubo, J.; Matsubayashi, T.; Matsuo, A.; Kobayashi, K.; Ishii, N. Relationship Between Bilateral Differences in Single-Leg Jumps and Asymmetry in Isokinetic Knee Strength. J. Appl. Biomech. 2013, 29, 61–67. [Google Scholar] [CrossRef]
- Bishop, C.; Lake, J.; Loturco, I.; Papadopoulos, K.; Turner, A.; Read, P. Interlimb Asymmetries: The Need for an Individual Approach to Data Analysis. J. Strength Cond. Res. 2021, 35, 695–701. [Google Scholar] [CrossRef]
- Pérez-Castilla, A.; García-Ramos, A.; Janicijevic, D.; Delgado-García, G.; De la Cruz, J.C.; Rojas, F.J.; Cepero, M. Between-Session Reliability of Performance and Asymmetry Variables Obtained During Unilateral and Bilateral Countermovement Jumps in Basketball Players. PLoS ONE 2021, 16, e0255458. [Google Scholar] [CrossRef] [PubMed]
- The Jamovi Project. Jamovi, Version 2.6 [Computer Software]; The Jamovi Project: Sydney, Australia, 2025; Available online: https://www.jamovi.org (accessed on 30 January 2025).
- R Core Team. R: A Language and Environment for Statistical Computing, Version 4.4 [Computer Software]; R Foundation for Statistical Computing: Vienna, Austria, 2025; Available online: https://cran.r-project.org (accessed on 30 January 2025).
- IBM Corporation. IBM SPSS Statistics for Windows, Version 29.0.2.0 [Computer Software]; IBM Corporation: Armonk, NY, USA, 2025; Available online: https://www.ibm.com/analytics/spss-statistics-software (accessed on 30 January 2025).
- JASP Team. JASP, Version 0.19.3.0 [Computer Software]; JASP Team: Amsterdam, The Netherlands, 2025; Available online: https://jasp-stats.org (accessed on 30 January 2025).
- Križaj, J.; Rauter, S.; Vodičar, J.; Hadžić, V.; Šimenko, J. Predictors of Vertical Jumping Capacity in Soccer Players. Isokinet. Exerc. Sci. 2019, 27, 9–14. [Google Scholar] [CrossRef]
- Croisier, J.L.; Ganteaume, S.; Binet, J.; Genty, M.; Ferret, J.M. Strength Imbalances and Prevention of Hamstring Injury in Professional Soccer Players: A Prospective Study. Am. J. Sports Med. 2008, 36, 1469–1475. [Google Scholar] [CrossRef] [PubMed]
- Bishop, C.; Turner, A.; Read, P. Effects of Inter-Limb Asymmetries on Physical and Sports Performance: A Systematic Review. J. Sports Sci. 2018, 36, 1135–1144. [Google Scholar] [CrossRef]
- Raya-González, J.; Bishop, C.; Gómez-Piqueras, P.; Veiga, S.; Viejo-Romero, D.; Navandar, A. Strength, Jumping, and Change of Direction Speed Asymmetries Are Not Associated with Athletic Performance in Elite Academy Soccer Players. Front. Psychol. 2020, 11, 175. [Google Scholar] [CrossRef]
- Pardos-Mainer, E.; Bishop, C.; Gonzalo-Skok, O.; Nobari, H.; Pérez-Gómez, J.; Lozano, D. Associations Between Inter-Limb Asymmetries in Jump and Change of Direction Speed Tests and Physical Performance in Adolescent Female Soccer Players. Int. J. Environ. Res. Public Health 2021, 18, 3474. [Google Scholar] [CrossRef]
- Malina, R.M.; Bouchard, C.; Bar-Or, O. Growth, Maturation, and Physical Activity; Human Kinetics: Champaign, IL, USA, 2004. [Google Scholar] [CrossRef]
- Philippaerts, R.M.; Vaeyens, R.; Janssens, M.; Van Renterghem, B.; Matthys, D.; Craen, R.; Bourgois, J.; Vrijens, J.; Beunen, G.; Malina, R.M. The relationship between peak height velocity and physical performance in youth soccer players. J. Sports Sci. 2006, 24, 221–230. [Google Scholar] [CrossRef]
- Suchomel, T.J.; Nimphius, S.; Stone, M.H. The Importance of Muscular Strength in Athletic Performance. Sports Med. 2016, 46, 1419–1449. [Google Scholar] [CrossRef]
- Kraska, J.M.; Ramsey, M.W.; Haff, G.G.; Fethke, N.; Sands, W.A.; Stone, M.E.; Stone, M.H. Relationship Between Strength Characteristics and Unweighted and Weighted Vertical Jump Height. Int. J. Sports Physiol. Perform. 2009, 4, 461–473. [Google Scholar] [CrossRef]
- Sheppard, J.M.; Cronin, J.B.; Gabbett, T.J.; McGuigan, M.R.; Etxebarria, N.; Newton, R.U. Relative Importance of Strength, Power, and Anthropometric Measures to Jump Performance of Elite Volleyball Players. J. Strength Cond. Res. 2008, 22, 758–765. [Google Scholar] [CrossRef]
- Aagaard, P.; Simonsen, E.B.; Andersen, J.L.; Magnusson, P.; Dyhre-Poulsen, P. Increased Rate of Force Development and Neural Drive of Human Skeletal Muscle Following Resistance Training. J. Appl. Physiol. 2002, 93, 1318–1326. [Google Scholar] [CrossRef] [PubMed]
- Andersen, L.L.; Andersen, J.L.; Zebis, M.K.; Aagaard, P. Early and Late Rate of Force Development: Differential Adaptive Responses to Resistance Training? Scand. J. Med. Sci. Sports 2010, 20, e162–e169. [Google Scholar] [CrossRef] [PubMed]
- Loturco, I.; Pereira, L.A.; Kobal, R.; Abad, C.C.C.; Komatsu, W.; Cunha, R.; Arliani, G.; Ejnisman, B.; Pochini, A.C.; Nakamura, F.Y.; et al. Functional Screening Tests: Interrelationships and Ability to Predict Vertical Jump Performance. Int. J. Sports Med. 2018, 39, 189–197. [Google Scholar] [CrossRef] [PubMed]
- Lees, A.; Vanrenterghem, J.; De Clercq, D. The Maximal and Submaximal Vertical Jump: Implications for Strength and Conditioning. J. Strength Cond. Res. 2004, 18, 787–791. [Google Scholar] [CrossRef]
- Vanezis, A.; Lees, A. A Biomechanical Analysis of Good and Poor Performers of the Vertical Jump. Ergonomics 2005, 48, 1594–1603. [Google Scholar] [CrossRef]
Disclaimer/Publisher’s Note: The statements, opinions and data contained in all publications are solely those of the individual author(s) and contributor(s) and not of MDPI and/or the editor(s). MDPI and/or the editor(s) disclaim responsibility for any injury to people or property resulting from any ideas, methods, instructions or products referred to in the content. |
© 2025 by the authors. Licensee MDPI, Basel, Switzerland. This article is an open access article distributed under the terms and conditions of the Creative Commons Attribution (CC BY) license (https://creativecommons.org/licenses/by/4.0/).