Article

Longitudinal Bending Stiffness Analysis of Composite Carbon Plates and Shoe Sole, Based on Three-Point Bending Test

Sport Science School, Beijing Sport University, Beijing 100084, China
*
Author to whom correspondence should be addressed.
Appl. Sci. 2025, 15(5), 2785; https://doi.org/10.3390/app15052785
Submission received: 14 January 2025 / Revised: 26 February 2025 / Accepted: 2 March 2025 / Published: 5 March 2025

Abstract

:
The forefoot longitudinal bending stiffness of shoe soles, measured through the widely used three-point bending test, is a key factor influencing running economy and lower-limb biomechanics. This study utilizes the finite element method to simulate three-point bending, examining the influence of different loading rates on stiffness and analyzing the impact of various plate thicknesses and forefoot curvature radii on the stiffness of plates and the ‘plate-sole’ system. The results indicate that within the same displacement range, varying the loading rates did not affect stiffness. However, increased thickness significantly enhanced both the stiffness of the plate and the ‘plate-sole’, while a larger curvature radius of the plate resulted in a modest 5–10% stiffness increase for both. To conclude, the present study provides a theoretical foundation for further exploring the mechanical properties of carbon plate configurations in footwear. Plate stiffness is affected by both thickness and curvature radius, with thickness having a greater impact. The same applies to the ‘plate-sole’. The stiffness of the ‘plate-sole’ is not a simple sum of the individual contributions from the shoe and the plate. This non-additive response emphasizes the significant role of the shoe material in altering the plate’s mechanical properties, which is an important consideration for optimizing shoe design.

1. Introduction

The forefoot longitudinal bending stiffness (FLBS) of a shoe’s sole is an important variable affecting running economy and lower-limb biomechanics [1]. Increased FLBS has been shown to improve running economy by 2.8% to 4.2% [2,3,4]. Biomechanically, increased FLBS reduces the dorsiflexion angle [5], slows the dorsiflexion rate [6], and decreases negative work [7] of the metatarsophalangeal joint. Additionally, it shifts the point of application of ground reaction forces further forward, increasing the runner’s mechanical advantage [8]. The three-point bending test is the most commonly used method for quantifying the FLBS of shoe soles in research [9].
As a key technique, the three-point bending test is frequently used to determine the bending stiffness, ultimate strength [10], and fatigue strength [11] of materials such as plastics [12], metals [13], and fiber-reinforced composites [14]. In the field of research on carbon-plated running shoes, the three-point bending test is utilized to quantify the FLBS around the metatarsophalangeal joint [9]. Despite simplifying the complex loading conditions of running by applying a unidirectional static load—whereas running involves dynamic, multidirectional forces and complex sole deformation—the test still provides valuable data on sole performance, such as the impact of the FLBS on running. Different stiffness levels of shoe soles impact the foot, causing changes in the kinematics and dynamics of the metatarsophalangeal and ankle joints [5,6,7]. These changes then affect running economy. Currently, there is no explicit standard for testing the FLBS of shoes using the three-point bending test [1], and the test procedures vary across various studies. A common pre-testing step is to position the loading head at the location corresponding to the metatarsophalangeal joint on the shoe sole, while also aligning it directly above the center of two supporting beams spaced 80 mm apart [15,16,17]. Differences in testing procedures mainly involve the loading rate and displacement range [18,19] of the loading head [20]. Considering that the dimensions of the three-point bending fixture can also affect the comparability of test results across different studies, and in order to facilitate simulation, it is necessary to clarify whether varying loading rates will influence stiffness data under the same three-point bending fixture and displacement range.
The finite element method (FEM) is an effective approach for simulating and analyzing the mechanical properties of materials. Previous studies have integrated three-point bending mechanical tests with finite element simulations to analyze the mechanical responses of structures such as composite fiber tubes [14], femurs [21], and trabecular bone [22]. In the research field of carbon-plated running shoes, some studies have established a ‘foot-shoe-plate’ model to simulate running characteristics and analyze the effects of different carbon plate structures on the stress and strain of foot bones and plantar soft tissues [23,24]. However, these studies do not consider the anisotropic material properties of carbon plate layup designs, nor do they test the stiffness of different carbon plates coupled with the shoe sole. In a typical carbon-plated running shoe design process, the bending stiffness of the shoe or carbon plate is first obtained through mechanical testing, and then the shoe and carbon plate are integrated to produce the final running shoe product. Subsequent motion testing is conducted to evaluate the impact of carbon plates with varying bending stiffness on shoe performance. This process is costly, time-consuming, and slow to provide feedback. Therefore, it is essential to use FEM simulations of composite materials to analyze the three-point bending behavior of the shoe sole, the carbon plate, and the ‘plate-sole’ system, which can reduce trial-and-error costs in the early design stages and shorten the product development cycle.
This study aims to simulate the FLBS of a shoe sole through a three-point bending test using non-linear FEM and to validate the effect of different loading rates on stiffness test results through experimental testing. A further aim is to construct both carbon plate and ‘plate-sole’ models to analyze the impact of varying carbon plate thicknesses and forefoot curvature radii on the bending stiffness of the carbon plate and the ‘plate-sole’ structure under identical loading conditions. Additionally, it seeks to explore the interaction between the carbon plate stiffness and the stiffness of the ‘plate-sole’ structure.

2. Materials and Methods

2.1. Mechanical Test
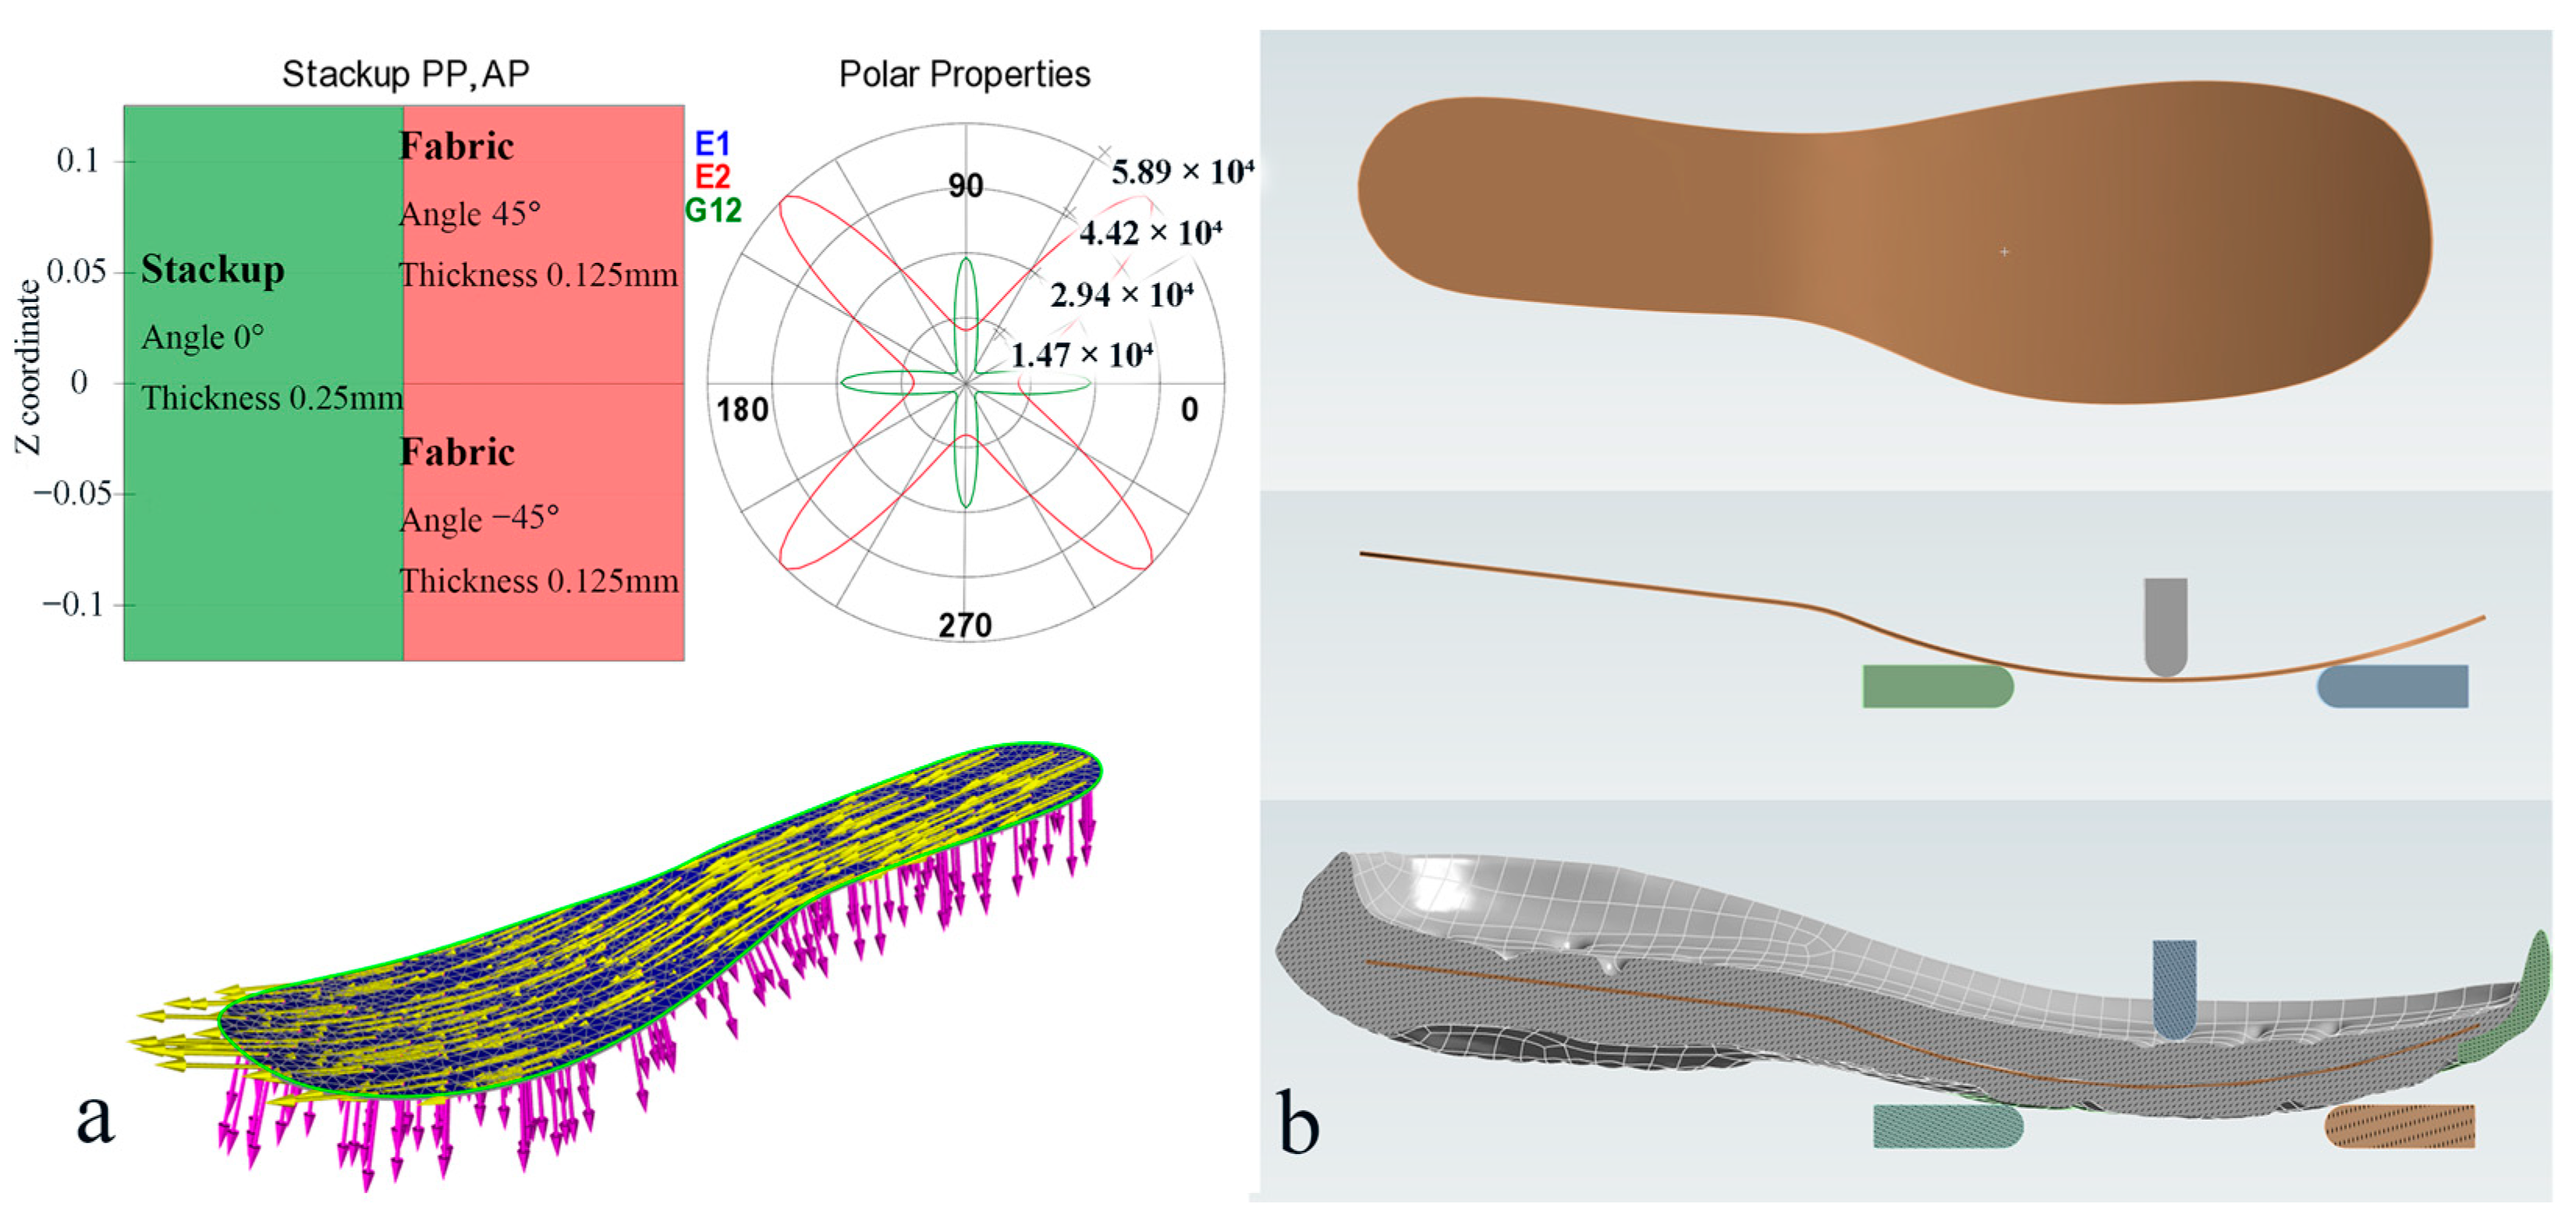
The experimental shoe used in this study was a men’s size 42 ANTA sports shoe (Figure 1a). The shoe was treated with an adhesive remover to strip away the upper part, leaving only the sole (Figure 1b). A three-point bending test was conducted on the forefoot section of the sole using a universal testing machine (TSE104B, Wance Group, Shenzhen, China) and a three-point bending fixture. The loading head and the two support beams on the fixture (Figure 1b) were approximately 45 mm wide and 10 mm thick, with a loading head diameter of 10 mm. Based on previous studies [7,9], the support beams were placed 80 mm apart, with the loading head positioned directly above the midpoint between the beams, aligning with the metatarsophalangeal flexion area of the sole (approximately 73% of the total sole length [25]). The sole was fixed in the fixture, and tests were conducted at loading rates of 7.5 mm/s, 10 mm/s [26], 12.5 mm/s [27], and 15 mm/s [7]. The vertical displacement of the loading head was set to 15 mm for all tests [6]. Each rate was tested ten times [6], with a 3 min interval between tests. Force–displacement curves were recorded for each trial at each rate. Based on a previous study on the FLBS of carbon-plated running shoes which used the three-point bending test, the 80% to 90% segment of the curve range was used to fit a linear equation, with the slope representing the longitudinal bending stiffness of the sole [6]. The full-range fitted curve can be found in the Supplementary Materials (Figure S1). The average stiffness value of the ten trials at each rate was calculated to represent the result at that rate. The fitting equation is shown in Equation (1), where F is the force (N), d is the displacement (mm), K is the slope representing stiffness (N/mm), and b is the y-intercept of the linear regression:
F = K · d + b

2.2. Sole Model

A portable 3D scanner (model Leo, Artec 3D, Luxembourg) was used to capture the sole model, with a maximum scanning frame rate of 50 Hz and a scanning accuracy of 1 mm. Based on the dimensions of the three-point bending fixture, a coupled sole–fixture model was created (Figure 1c). The bending simulation for the sole model was conducted using the Transient Structural module in ANSYS Workbench (version 2019, ANSYS Inc., Canonsburg, PA, USA). To facilitate computational modeling, the material properties of the midsole, outsole, and fixture were assumed to be homogeneous and isotropic under the assumption of linear elasticity [28]. To determine the material properties of the midsole, ASTM D638 Type IV [29] standards were followed, and tensile dog-bone samples were cut using a standard cutting knife. Three samples were taken for tensile testing using a miniature in situ mechanical testing system equipped with a non-contact video extensometer (model IBTC-300SL, CARE, Tianjin, China) with a tensile rate of 5 mm/min. The material properties of the midsole are listed in Table 1, and the corresponding details can be found in the Supplementary Materials (Figure S2). The material of the fixture is structural steel, and the material of the outsole was obtained from previous studies [30], as shown in Table 1. Bonded contact was applied between the outsole and midsole, while frictional contact (with a coefficient of 0.6 [31]) was applied between the loading head and the shoe sole, as well as between the two support beams and the shoe sole. A tetrahedral patch-conforming method was used for mesh generation, followed by a mesh sensitivity analysis (Table 2), which determined that a mesh size of 4 mm was appropriate for further simulations. The support beams were fixed at the bottom, and vertical downward rates of 7.5 mm/s, 10 mm/s [26], 12.5 mm/s [27], and 15 mm/s [7] were applied to the loading head, with a displacement of 15 mm. The analysis time was set based on the displacement and rate. The simulation generated force–displacement data for the loading head, from which the linear region was selected to calculate the longitudinal bending stiffness of the sole using Equation (1). The effectiveness of the model was evaluated by comparing the percentage error between the experimentally measured stiffness and the simulated stiffness, with an error of less than 10% considered as an indication of model validity [31].

2.3. Plate and ‘Plate-Sole’ Models

Carbon plate surface models with three curvature radii (200 mm, 250 mm, and 300 mm) were created in ANSYS DesignModeler (Figure 2b). Epoxy carbon woven (230 GPa, wet) was selected from the ANSYS materials database [32], and its properties are listed in Table 3. As shown in Figure 2a, the thickness of each carbon fiber fabric layer was set to 0.125 mm in Ansys Composite Prep (ACP) [33]. A stacking configuration of two fabric layers with fiber orientations of ±45° relative to the reference axis formed a single layer with a total thickness of 0.25 mm. To achieve the required carbon plate thicknesses of 1 mm, 1.5 mm, and 2 mm, a total of four, six, and eight stacked layers of carbon fiber fabric were used, respectively, resulting in fully laminated composite carbon fiber plates with the desired thicknesses [34,35]. The coupling position of the carbon plates within the sole is shown in the lower part of Figure 2b, with the embedded position at the heel remaining fixed. The bending areas of the carbon plates are located in the forefoot, while the heel section remains flat. Bonded contact was defined as being between the carbon plates and the sole, and the contact conditions between the loading head, support beams, shoe sole were set as described in the model validation section. The support beams were fixed at the bottom, and the loading head was set to move vertically downward at a rate of 15 mm/s, with a displacement of 15 mm. The analysis time was determined based on the displacement and rate. Force–displacement data for the loading head were obtained, and the linear region was selected to calculate the FLBS of the plates and the combined ‘plates-sole’ structures using Equation (1).

2.4. Statistical Analysis

MATLAB (R2024a, MathWorks, Natick, MA, USA) was used to fit simple linear regression equations, and SPSS 27.0 (IBM Corp., Armonk, NY, USA) was employed for statistical analysis. For the experimentally measured longitudinal bending stiffness values of the sole at four different rates, the homogeneity of variances was first tested. If the data met the assumption of homogeneity of variances, one-way ANOVA was conducted, followed by Tukey’s post hoc test to assess the significance of differences between groups. If the homogeneity of variances was not confirmed, Welch’s test was used for significance analysis. The significance level was set at 0.05.

3. Results

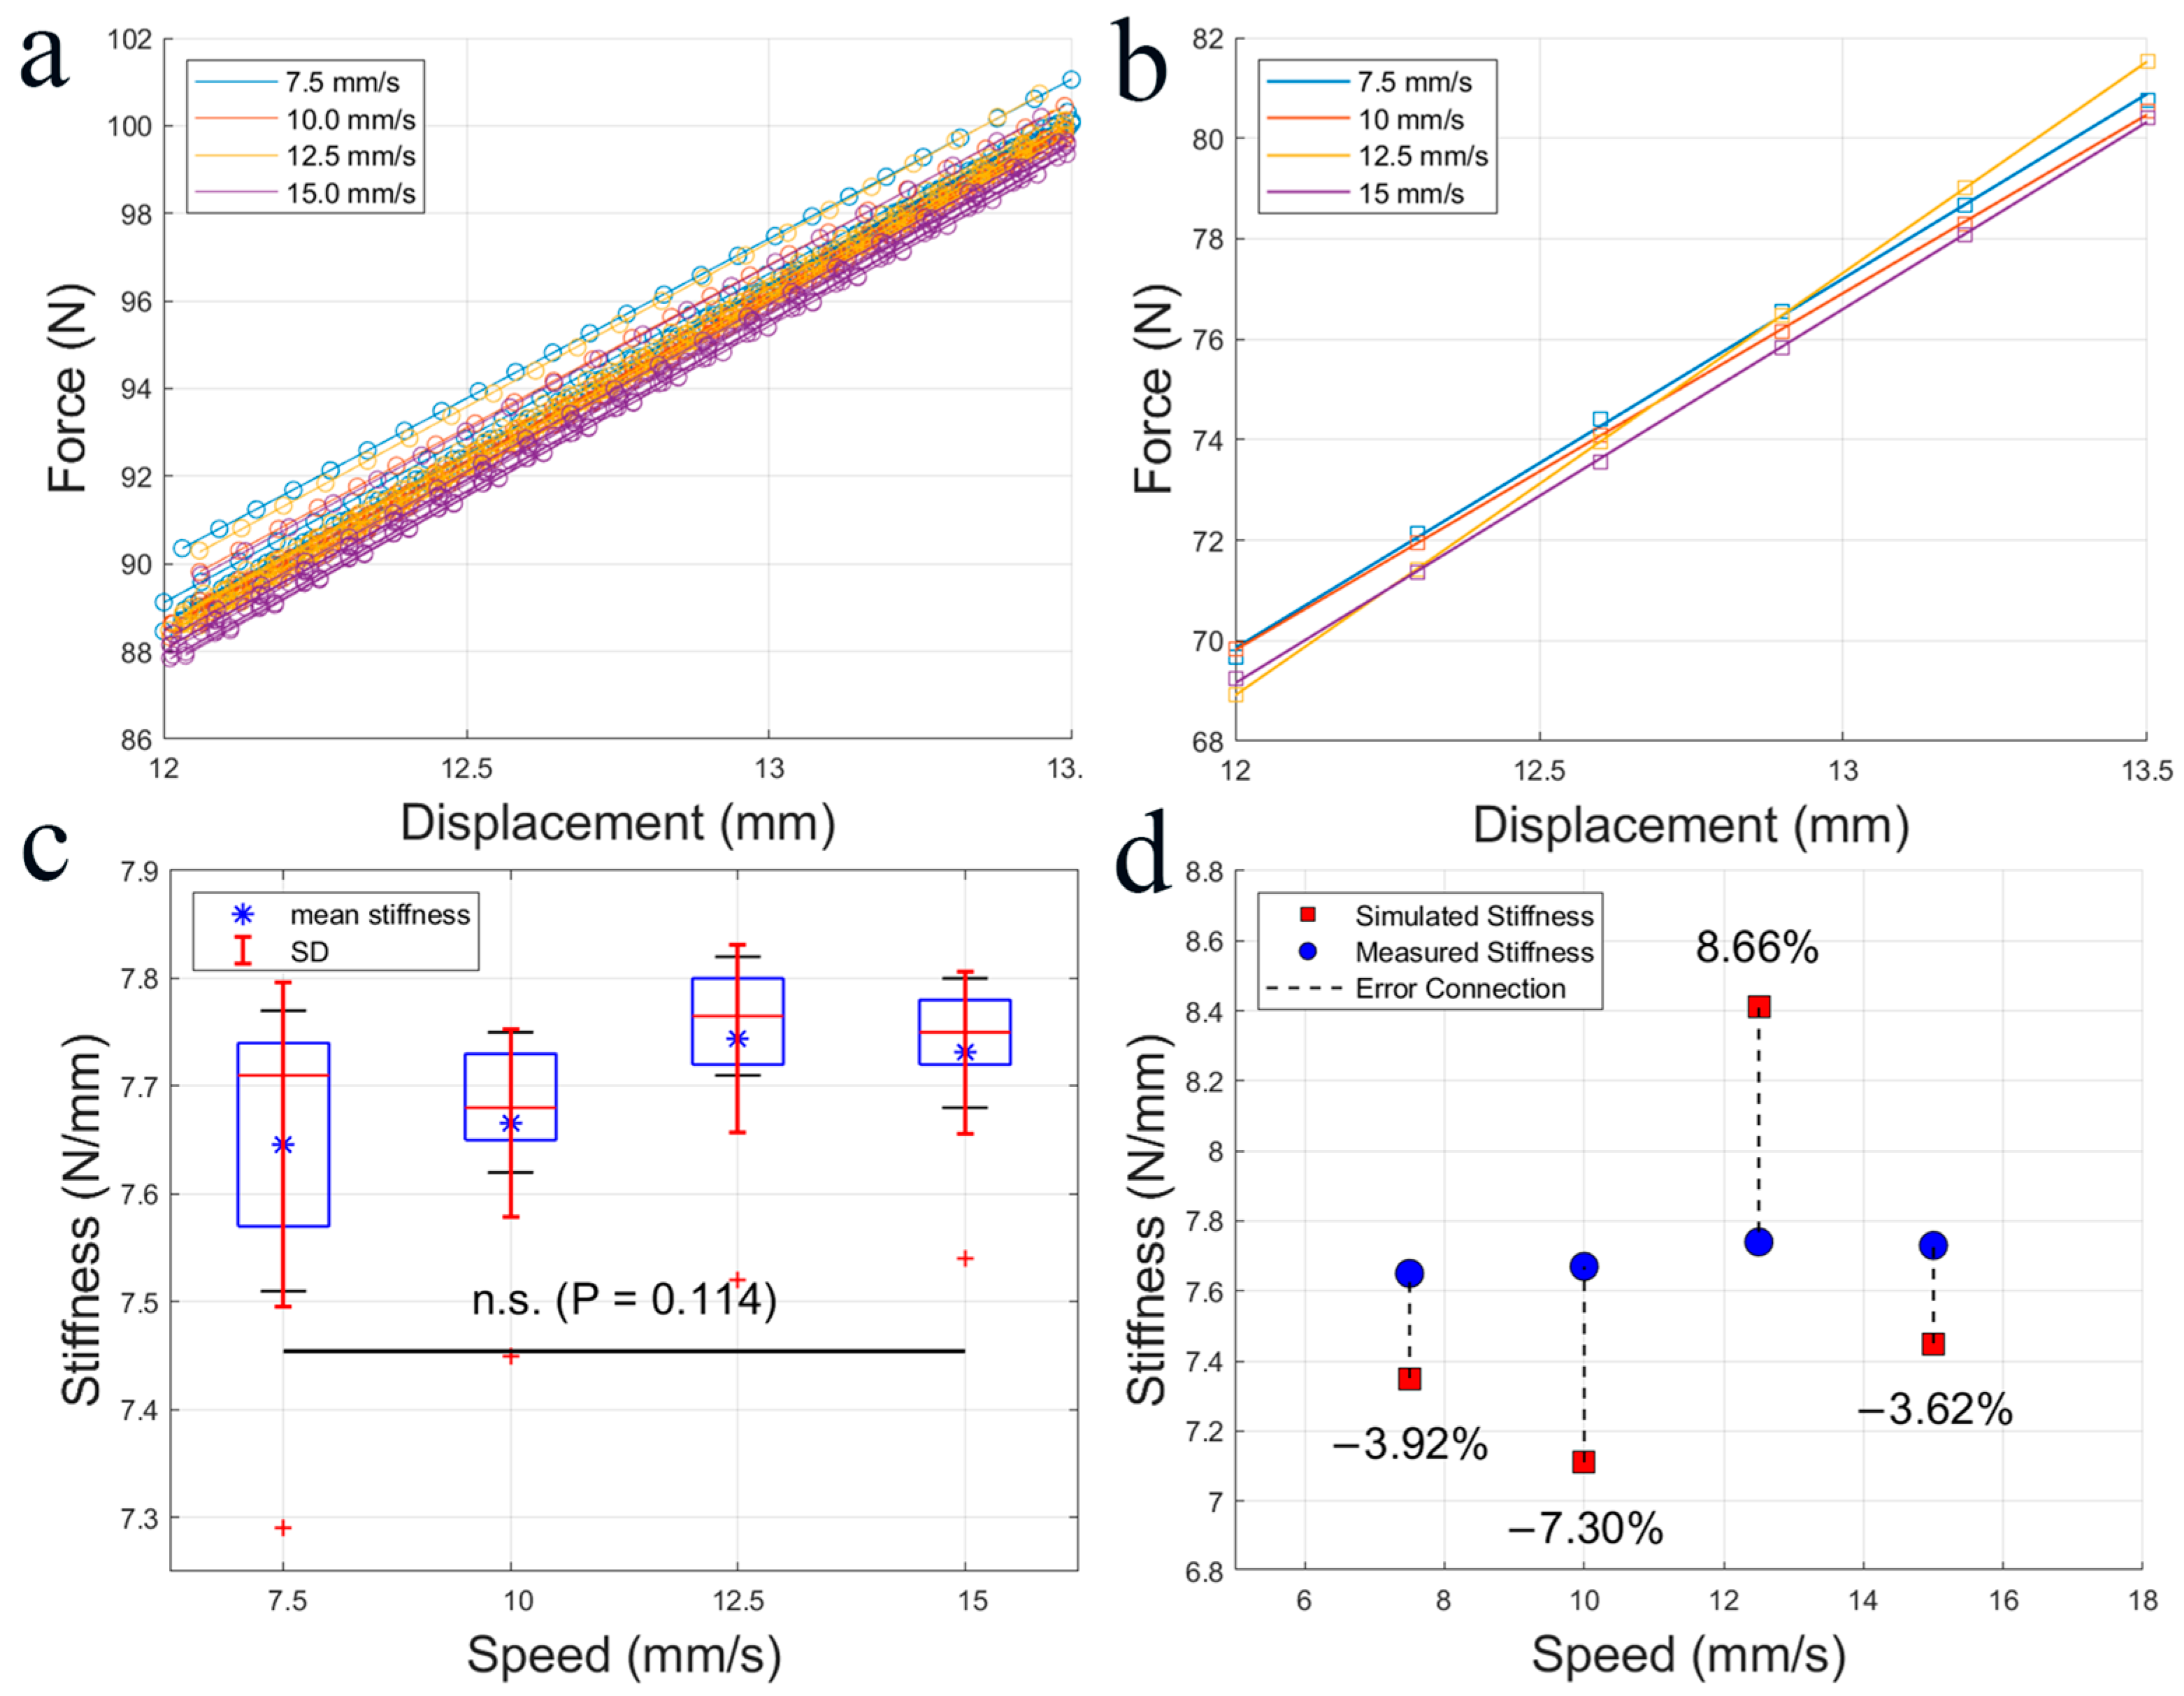
3.1. Model Validation

As shown in Figure 3a,c, the mean (standard deviation) of the longitudinal bending stiffness of the sole’s forefoot at 7.5 mm/s was 7.65 (0.15) N/mm. At 10.0 mm/s, it was 7.67 (0.09) N/mm; at 12.5 mm/s, it was 7.74 (0.09) N/mm; and at 15.0 mm/s, it was 7.73 (0.08) N/mm. The 10 sets of data obtained at each rate met the assumption of homogeneity of variances, allowing one-way ANOVA to be performed. The results indicated no significant differences in stiffness among the rates tested (p > 0.05).
Figure 3b,d present the error rates between the simulated stiffness values at different rates and the experimentally measured stiffness values. The simulated stiffness at 7.5 mm/s was 7.35 N/mm, with an error rate of 3.92%. At 10 mm/s, the simulated stiffness was 7.11 N/mm, with an error rate of 7.30%. At 12.5 mm/s, the simulated stiffness was 8.41 N/mm, with an error rate of 8.66%. At 15 mm/s, the simulated stiffness was 7.45 N/mm, with an error rate of 3.62%. Due to simplifications in the model, as well as minor fluctuations in error during the fitting of the linear regression equation, the simulated value at 12.5 mm/s is slightly higher than the measured value. However, the overall error rates between the simulated and measured values were less than 10%, confirming the validity of the “three-point bending fixture-sole” model used in this study.

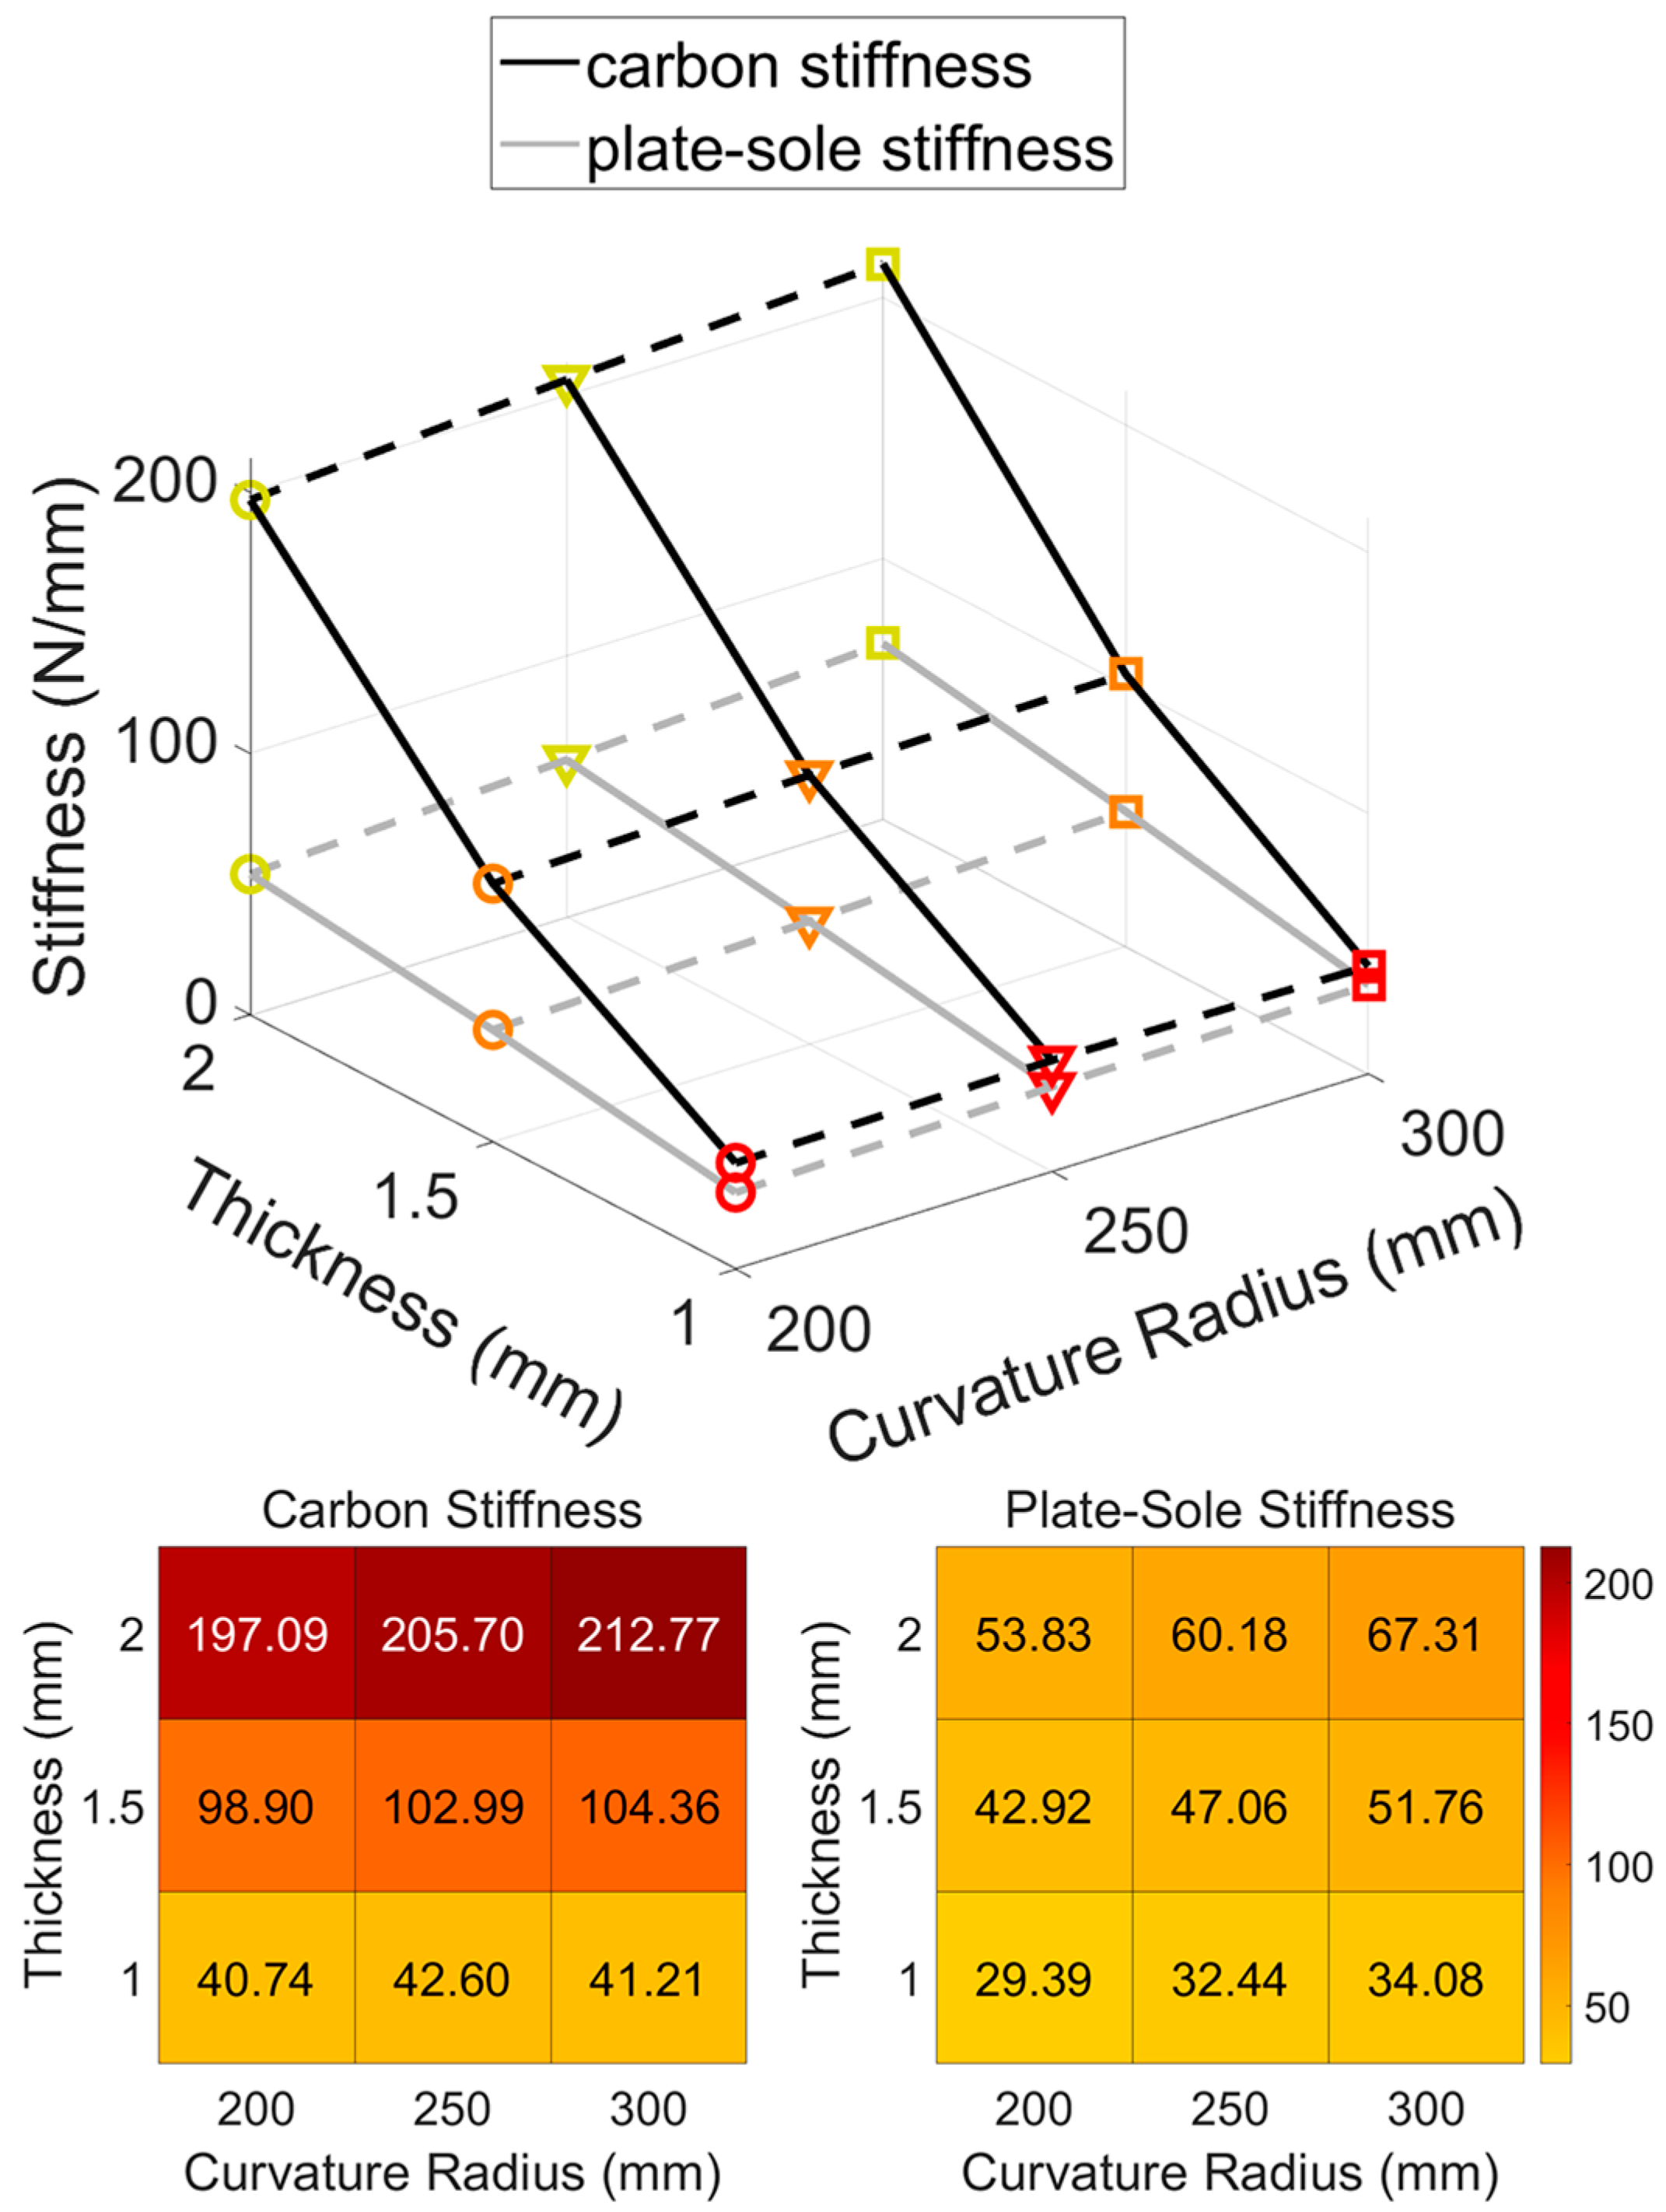
3.2. Plate Stiffness

As shown in Figure 4, the stiffness of the plates varied with thickness and curvature radius. For the 1 mm thick plate, when the curvature radius increased from 200 mm to 250 mm, the stiffness increased by 4.57%. However, further increasing the radius to 300 mm resulted in a 3.27% decrease in stiffness. For the 1.5 mm thick plate, the stiffness increased by 4.13% when the curvature radius was changed from 200 mm to 250 mm, and further increased by 1.33% when the radius was increased from 250 mm to 300 mm. The 2 mm thick plate showed an increase in stiffness of 4.37% from 200 mm to 250 mm and 3.44% from 250 mm to 300 mm.
Regarding changes in plate thickness, for a curvature radius of 200 mm, increasing the plate thickness from 1 mm to 1.5 mm resulted in a significant stiffness increase of 147.78%, and further increasing the thickness from 1.5 mm to 2 mm raised the stiffness by 99.27%. For a curvature radius of 250 mm, the increase in thickness from 1 mm to 1.5 mm led to a 141.76% increase in stiffness, and from 1.5 mm to 2 mm, the stiffness increased by 99.73%. For a curvature radius of 300 mm, the thickness increase from 1 mm to 1.5 mm resulted in a 153.25% increase in stiffness, and the increase from 1.5 mm to 2 mm resulted in a 103.88% increase.

3.3. ‘Plate-Sole’ Stiffness

Figure 4 illustrates the composite stiffness of the midsole with embedded plates of varying thicknesses and curvature radii. For the 1 mm thick plate, increasing the curvature radius from 200 mm to 250 mm resulted in a 10.38% increase in composite stiffness, while a further increase to 300 mm raised the stiffness by 5.06%. For the 1.5 mm thick plate, the stiffness increased by 9.64% when the curvature radius was changed from 200 mm to 250 mm, and by 9.99% when the radius increased from 250 mm to 300 mm. For the 2 mm thick plate, the stiffness increased by 11.79% from 200 mm to 250 mm, and by 11.85% from 250 mm to 300 mm.
Similarly, when varying the thickness of the plates, at a curvature radius of 200 mm, increasing the thickness from 1 mm to 1.5 mm resulted in a 46.03% increase in composite stiffness, while further increasing the thickness from 1.5 mm to 2 mm raised the stiffness by 25.42%. At a curvature radius of 250 mm, the stiffness increased by 45.05% when the thickness was changed from 1 mm to 1.5 mm, and by 27.88% when the thickness was increased from 1.5 mm to 2 mm. For a curvature radius of 300 mm, the increase in thickness from 1 mm to 1.5 mm raised the stiffness by 51.86%, while the increase from 1.5 mm to 2 mm led to a 30.05% rise in stiffness.

3.4. Plate and ‘Plate-Sole’ Stiffness

As summarized in Table 4, whether altering the thickness or the curvature radius, the stiffness of the ‘plate-sole’ system is significantly lower than that of the carbon plate once the plate is embedded in the sole. However, changes in thickness or curvature radius affect the degree of stiffness reduction. Specifically, with a constant thickness, increasing the curvature radius slightly reduces the rate of stiffness decrease in the ‘plate-sole’. Conversely, with a constant curvature radius, increasing the carbon plate’s thickness leads to a gradual increase in the rate of stiffness reduction in the ‘plate-sole’.

4. Discussion

The aims of this study are to validate the effectiveness of FE simulation of the FLBS of a shoe sole and to analyze the effect of different loading rates on the stiffness by combining both experimental and simulation methods. Additionally, this study investigates how varying carbon plate thicknesses and forefoot curvature radii affect the FLBS of both the carbon plates and the ‘plate-sole’ under identical loading conditions, ultimately clarifying the relationship between the carbon plate and the ‘plate-sole’ in terms of stiffness.
In this study, we established different rate variables in combination with experimental and simulation analysis and found that varying the rate within the same displacement range has no significant effect on the stiffness results. This implies that in the simulation model, the rate can be freely set within the same displacement range for stiffness testing. In previous studies, the three-point bending test has often been used to evaluate the FLBS of shoe soles, especially for carbon plate running shoes, and to qualitatively investigate both the impact of carbon plates with different stiffness levels on running economy and the effect of stiffness values on lower extremity biomechanics [9]. However, there is no unified testing standard for the current shoe sole three-point bending test. The initial loading method involved setting the stamping head to move 7.5 mm vertically downward at a rate of 75 mm/s over 0.1 s, with the center of the forefoot as the reference point [9]. Subsequently, the loading rate was adjusted in various studies to 15 mm/s [7], 500 mm/min (8.33 mm/s) [20], 16 mm/s [36], 4 mm/s [19], 12.5 mm/s [27], and 10 mm/s [26], with displacement ranges including 10 mm [18], 20 mm [19], and 15 mm [6]. Although the measurement ranges differ, all studies performed linear regression on the linear portion of the force–displacement curve [6,26,37]. By employing FE analysis to simulate three-point bending tests, the present study provides a theoretical foundation for further exploring the mechanical properties of carbon plate configurations in footwear.
The results of this study indicate that increased carbon plate thickness leads to a significant rise in the stiffness of both the carbon plate and the ‘plate-sole’. However, when comparing the two, it can be observed that the increase in ‘plate-sole’ stiffness is less pronounced than that of the carbon plate. In previous studies, increasing the number of stacked carbon plate layers is a common method to enhance the longitudinal bending stiffness of experimental shoe soles [17]. Stefanyshyn [38] embedded varying numbers of 1 mm thick flat carbon fiber plates into midsoles, while Chen [39] embedded 1 mm and 1.5 mm thick carbon fiber plates in a shoe’s midsole. In experimental testing, changing stiffness by stacking layers presents challenges such as imperfect bonding between the carbon plates and the complex manufacturing process of embedding them into the shoe sole. However, using models for analysis allows for easy adjustment of the carbon plate thickness and the positioning of the embedded plates in the sole, addressing these limitations. For example, some researchers have used finite element methods to analyze the effects of different thicknesses, embedding positions, and curvatures of carbon plates on foot biomechanics [40,41]. However, the material properties of the carbon plates used were isotropic, and the impact of these factors on the FLBS of the shoe sole was not further analyzed. This study validates the method of increasing stiffness by stacking additional carbon plates, as proposed in previous research, through finite element simulations. Unlike earlier FE simulations of carbon plate running shoes, this study employs a more realistic approach by using carbon fiber composite materials and laminate structures during micro-scale modeling, further simulating the mechanical properties of the carbon plates.
This study also finds that when the thickness is consistent, the stiffness increases slightly with the increase in the curvature radius, and this phenomenon is observed in both carbon plate and ‘plate-sole’ systems. Previous research has shown that changes in carbon plate curvature affect the biomechanics of the ankle and metatarsophalangeal joints, and an appropriate curvature radius can reduce the net energy loss at the metatarsophalangeal joint [42]. Song [41] used finite element methods to investigate the effects of different thicknesses of flat and curved carbon plates on the stress and strain of foot and metatarsal soft tissues. It was found that carbon plates with a larger forefoot curvature (i.e., smaller curvature radius) can reduce peak pressure in the forefoot. Compared to flat carbon plates, when wearing running shoes with forefoot-curved carbon plates, the thicker midsole beneath the metatarsophalangeal joint may play a significant role in cushioning impact and absorbing energy during running [43]. The present research shows that carbon plates with a smaller curvature radius exhibit lower FLBS, and for the human foot, this lower FLBS helps reduce the peak pressure in the forefoot. This may be due to changes in the carbon plate’s bending structure and the distribution of midsole material as the curvature radius increases.
Regarding the relationship between the stiffness of the carbon plate and the ‘plate-sole’ system, this study finds that regardless of changes in thickness or curvature radius, the stiffness of the ‘plate-sole’ is significantly lower than that of the carbon plate when the plate is embedded into the sole. However, changes in thickness or curvature radius affect the extent of stiffness reduction. Specifically, when the thickness remains unchanged, increasing the curvature radius slightly reduces the rate of stiffness decrease in the ‘plate-sole’. In contrast, when the curvature radius remains constant, increasing the carbon plate thickness leads to a progressively larger decrease in the stiffness of the ‘plate-sole’. In other words, for the same thickness, the larger the curvature radius, the smaller the stiffness reduction in the ‘plate-sole’; conversely, for the same curvature radius, the thicker the carbon plate, the greater the reduction in the stiffness of the ‘plate-sole’. This suggests that the overall response of the ‘plate-sole’ is not a simple sum of the individual contributions from the shoe and the carbon plate. Instead, the shoe material modifies the overall stiffness of the system, leading to a noticeable reduction that increases significantly with the carbon plate thickness. This non-additive response highlights the significant role of the shoe material in altering the mechanical properties of the carbon plate, which is a crucial consideration for optimizing shoe design.
This study has several limitations. Firstly, the model assumes linear elastic material behavior, but under large deformations, materials may exhibit nonlinear behaviors such as plasticity or viscoelasticity. Additionally, time-dependent effects, such as viscoelasticity, were not considered in this study, but they could become significant under different loading rates or longer durations. Future research could incorporate both nonlinear material models and time-dependent effects to more accurately describe the response under large deformations. Secondly, this study focused on three-point bending mechanical testing and simulation, without full feedback from motion and human body data. Future studies could include kinematic and biomechanical data to further improve the accuracy of the simulations. Lastly, the experimental shoes used in this study were selected for finite element (FE) validation purposes, rather than being dedicated carbon-plated running shoes. Using pre-made carbon-plated shoes might limit the benefits of FE modeling, whereas incorporating carbon plates into the shoe model allows for more cost-effective evaluations. Future research should refine the FE framework, simulate combinations of different sole materials and carbon plates (including variations in layer thickness and angles), and incorporate ankle–foot models and running biomechanics to better support the design of carbon-plated shoes.

5. Conclusions

To conclude, the present study provides a theoretical foundation for further exploration of the mechanical properties of carbon plate configurations in footwear. The carbon plate’s stiffness is influenced by both its thickness and its curvature radius, with thickness having a more pronounced effect. This trend also applies to the ‘plate-sole’ system. The overall response of the ‘plate-sole’ system is not a simple sum of the individual contributions from the shoe and the plate. Instead, the shoe material modifies the system’s stiffness, leading to a noticeable reduction that increases significantly with the carbon plate thickness. This non-additive response emphasizes the significant role of the shoe material in altering the plate’s mechanical properties, which is an important consideration for optimizing shoe design.

Supplementary Materials

The following supporting information can be downloaded at: https://www.mdpi.com/article/10.3390/app15052785/s1, Figure S1: Force-displacement curves obtained from experimental tests at four different speeds; Figure S2: Experimental image of the sample during tensile testing (left). Typical stress-strain curve (right).

Author Contributions

Conceptualization, Y.G. and X.Z.; data curation, Y.J.; formal analysis, Y.G.; investigation, X.Z.; methodology, Y.G.; software, Y.G.; supervision, X.Z.; validation, Y.G., Y.J. and Y.W.; visualization, Y.G.; writing—original draft, Y.G.; writing—review and editing, Y.G., Y.J., Y.W. and X.Z. All authors have read and agreed to the published version of the manuscript.

Funding

This research received no external funding.

Institutional Review Board Statement

Not applicable.

Informed Consent Statement

Not applicable.

Data Availability Statement

The datasets used and/or analyzed during the current study are available from the corresponding author upon reasonable request.

Conflicts of Interest

The authors declare no conflicts of interest.

References

  1. Ortega, J.A.; Healey, L.A.; Swinnen, W.; Hoogkamer, W. Energetics and Biomechanics of Running Footwear with Increased Longitudinal Bending Stiffness: A Narrative Review. Sports Med. 2021, 51, 873–894. [Google Scholar] [CrossRef] [PubMed]
  2. Barnes, K.R.; Kilding, A.E. A Randomized Crossover Study Investigating the Running Economy of Highly-Trained Male and Female Distance Runners in Marathon Racing Shoes Versus Track Spikes. Sports Med. 2019, 49, 331–342. [Google Scholar] [CrossRef] [PubMed]
  3. Hoogkamer, W.; Kipp, S.; Frank, J.H.; Farina, E.M.; Luo, G.; Kram, R. A Comparison of the Energetic Cost of Running in Marathon Racing Shoes. Sports Med. 2018, 48, 1009–1019. [Google Scholar] [CrossRef] [PubMed]
  4. Hunter, I.; McLeod, A.; Valentine, D.; Low, T.; Ward, J.; Hager, R. Running economy, mechanics, and marathon racing shoes. J. Sports Sci. 2019, 37, 2367–2373. [Google Scholar] [CrossRef]
  5. Hoogkamer, W.; Kipp, S.; Kram, R. The Biomechanics of Competitive Male Runners in Three Marathon Racing Shoes: A Randomized Crossover Study. Sports Med. 2019, 49, 133–143. [Google Scholar] [CrossRef]
  6. Cigoja, S.; Firminger, C.R.; Asmussen, M.J.; Fletcher, J.R.; Edwards, W.B.; Nigg, B.M. Does increased midsole bending stiffness of sport shoes redistribute lower limb joint work during running? J. Sci. Med. Sport 2019, 22, 1272–1277. [Google Scholar] [CrossRef]
  7. Willwacher, S.; König, M.; Potthast, W.; Brüggemann, G.P. Does specific footwear facilitate energy storage and return at the metatarsophalangeal joint in running? J. Appl. Biomech. 2013, 29, 583–592. [Google Scholar] [CrossRef]
  8. Willwacher, S.; König, M.; Braunstein, B.; Goldmann, J.P.; Brüggemann, G.P. The gearing function of running shoe longitudinal bending stiffness. Gait Posture 2014, 40, 386–390. [Google Scholar] [CrossRef]
  9. Roy, J.P.R.; Stefanyshyn, D.J. Shoe midsole longitudinal bending stiffness and running economy, joint energy, and EMG. Med. Sci. Sports Exerc. 2006, 38, 562–569. [Google Scholar] [CrossRef]
  10. Qin, Z.; He, Y.; Wang, S.; Meng, C. Ultimate Strength Study of Structural Bionic CFRP-Sinker Bolt Assemblies Subjected to Preload under Three-Point Bending. Biomimetics 2023, 8, 215. [Google Scholar] [CrossRef]
  11. Sadeghi, H.; Espino, D.M.; Shepherd, D.E.T. Fatigue strength of bovine articular cartilage-on-bone under three-point bending: The effect of loading frequency. BMC Musculoskelet. Disord. 2017, 18, 142. [Google Scholar] [CrossRef] [PubMed]
  12. Ishida, Y.; Miura, D.; Shinya, A. Application of fused deposition modeling technology for fabrication jigs of three-point bending test for dental composite resins. J. Mech. Behav. Biomed. Mater. 2022, 130, 105172. [Google Scholar] [CrossRef] [PubMed]
  13. Wang, B.; Cheng, L.; Li, D. Experimental Study on Forged TC4 Titanium Alloy Fatigue Properties under Three-Point Bending and Life Prediction. Materials 2021, 14, 5329. [Google Scholar] [CrossRef]
  14. Biały, M.; Szust, A.; Napadłek, P.; Dobrzyński, M.; Więckiewicz, W. The three-point bending test of fiber-reinforced composite root canal posts. Adv. Clin. Exp. Med. 2020, 29, 1111–1116. [Google Scholar] [CrossRef]
  15. Flores, N.; Rao, G.; Berton, E.; Delattre, N. The stiff plate location into the shoe influences the running biomechanics. Sports Biomech. 2021, 20, 815–830. [Google Scholar] [CrossRef] [PubMed]
  16. Rodrigo-Carranza, V.; Hoogkamer, W.; Salinero, J.J.; Rodríguez-Barbero, S.; González-Ravé, J.M.; González-Mohíno, F. Influence of Running Shoe Longitudinal Bending Stiffness on Running Economy and Performance in Trained and National Level Runners. Med. Sci. Sports Exerc. 2023, 55, 2290–2298. [Google Scholar] [CrossRef]
  17. Rodrigo-Carranza, V.; Hoogkamer, W.; González-Ravé, J.M.; González-Mohíno, F. Relationship Between Advanced Footwear Technology Longitudinal Bending Stiffness and Energy Cost of Running. Scand. J. Med. Sci. Sports 2024, 34, e14687. [Google Scholar] [CrossRef]
  18. Engel, F.A.; Zehnter, F.; Yona, T.; Mai, P.; Willwacher, S.; Düking, P.; Sperlich, B. Acute physiological, biomechanical, and perceptual responses of runners wearing downward-curved carbon fiber insoles. Front. Sports Act. Living 2024, 6, 1340154. [Google Scholar] [CrossRef]
  19. Castellanos-Salamanca, M.; Rodrigo-Carranza, V.; Rodríguez-Barbero, S.; Salinero, J.J.; González-Mohíno, F. Effects of the increase of longitudinal bending stiffness of advanced footwear technology on 3000 m performance, pacing strategy, and biomechanics. Footwear Sci. 2024, 16, 163–169. [Google Scholar] [CrossRef]
  20. Oh, K.; Park, S. The bending stiffness of shoes is beneficial to running energetics if it does not disturb the natural MTP joint flexion. J. Biomech. 2017, 53, 127–135. [Google Scholar] [CrossRef]
  21. Park, G.; Forman, J.; Kim, T.; Panzer, M.B.; Crandall, J.R. Injury risk functions based on population-based finite element model responses: Application to femurs under dynamic three-point bending. Traffic Inj. Prev. 2018, 19 (Suppl. S1), S59–S64. [Google Scholar] [CrossRef] [PubMed]
  22. Ridha, H.; Thurner, P.J. Finite element prediction with experimental validation of damage distribution in single trabeculae during three-point bending tests. J. Mech. Behav. Biomed. Mater. 2013, 27, 94–106. [Google Scholar] [CrossRef]
  23. Fu, F.; Levadnyi, I.; Wang, J.; Xie, Z.; Fekete, G.; Cai, Y.; Gu, Y. Effect of the Construction of Carbon Fiber Plate Insert to Midsole on Running Performance. Materials 2021, 14, 5156. [Google Scholar] [CrossRef]
  24. Lu, R.; Chen, H.; Huang, J.; Ye, J.; Gao, L.; Liu, Q.; Quan, W.; Gu, Y. Biomechanical Investigation of Lower Limbs During Slope Transformation Running with Different Longitudinal Bending Stiffness Shoes. Sensors 2024, 24, 3902. [Google Scholar] [CrossRef] [PubMed]
  25. Fraser, S.; Harland, A.; Smith, P.; Lucas, T. A Study of Football Footwear Bending Stiffness. Procedia Eng. 2014, 72, 315–320. [Google Scholar] [CrossRef]
  26. Takahashi, K.Z.; Gross, M.T.; Van Werkhoven, H.; Piazza, S.J.; Sawicki, G.S. Adding Stiffness to the Foot Modulates Soleus Force-Velocity Behaviour during Human Walking. Sci. Rep. 2016, 6, 29870. [Google Scholar] [CrossRef]
  27. Bagehorn, T.; Mai, P.; Bill, K.; Herbaut, A.; de Zee, M.; Kersting, U.G. Effect of increased shoe longitudinal bending stiffness on ankle and foot biomechanics in jump-cut movements of low and high degrees. Footwear Sci. 2024, 16, 135–146. [Google Scholar] [CrossRef]
  28. Peng, Y.; Wang, Y.; Wong, D.W.C.; Chen, T.L.W.; Chen, S.F.; Zhang, G.; Tan, Q.; Zhang, M. Different Design Feature Combinations of Flatfoot Orthosis on Plantar Fascia Strain and Plantar Pressure: A Muscle-Driven Finite Element Analysis With Taguchi Method. Front. Bioeng. Biotechnol. 2022, 10, 853085. [Google Scholar] [CrossRef] [PubMed]
  29. Kumar, A.; Verma, S.; Jeng, J.Y. Supportless Lattice Structures for Energy Absorption Fabricated by Fused Deposition Modeling. 3d Print. Addit. Manuf. 2020, 7, 85–96. [Google Scholar] [CrossRef]
  30. Zhu, X.; Liu, J.; Liu, H.; Liu, J.; Yang, Y.; Wang, H. Effects of midsole hardness on the mechanical response characteristics of the plantar fascia during running. Bioengineering 2023, 10, 533. [Google Scholar] [CrossRef]
  31. Wu, Y.; Wang, H.; Deng, C.; Guo, Y.; Zhu, X. Cushioning mechanism of the metatarsals during landing for the skateboarding ollie maneuver. Front. Bioeng. Biotechnol. 2024, 12, 1382161. [Google Scholar] [CrossRef] [PubMed]
  32. Amsalu, C.; Negasa, D.; Merga, A. Numerical analysis of fiber reinforced composite material for structural component application. Heliyon 2024, 10, e37698. [Google Scholar] [CrossRef]
  33. Asiri, S. Comparative modal analysis on fishing rod made of functionally graded composite material using finite element analysis. J. Appl. Biomater. Funct. Mater. 2022, 20, 22808000221089774. [Google Scholar] [CrossRef] [PubMed]
  34. Reda, R.; Khamis, M.; Ragab, A.E.; Elsayed, A.; Negm, A.M. Numerical analysis of the impact of winding angles on the mechanical performance of filament wound type 4 composite pressure vessels for compressed hydrogen gas storage. Heliyon 2024, 10, e33796. [Google Scholar] [CrossRef]
  35. Zhuang, W. Simulation and Analysis of the Damage of Carbon Fiber Composite Laminates Under Three Point Bending Load. J. Mech. Eng. 2019, 55, 109. [Google Scholar] [CrossRef]
  36. McLeod, A.R.; Bruening, D.; Johnson, A.W.; Ward, J.; Hunter, I. Improving running economy through altered shoe bending stiffness across speeds. Footwear Sci. 2020, 12, 79–89. [Google Scholar] [CrossRef]
  37. Healey, L.A.; Hoogkamer, W. Longitudinal bending stiffness does not affect running economy in Nike Vaporfly Shoes. J. Sport Health Sci. 2022, 11, 285–292. [Google Scholar] [CrossRef]
  38. Stefanyshyn, D.J.; Nigg, B.M. Influence of midsole bending stiffness on joint energy and jump height performance. Med. Sci. Sports Exerc. 2000, 32, 471–476. [Google Scholar] [CrossRef]
  39. Chen, H.; Shao, E.; Sun, D.; Xuan, R.; Baker, J.S.; Gu, Y. Effects of footwear with different longitudinal bending stiffness on biomechanical characteristics and muscular mechanics of lower limbs in adolescent runners. Front. Physiol. 2022, 13, 907016. [Google Scholar] [CrossRef]
  40. Song, Y.; Cen, X.; Chen, H.; Sun, D.; Munivrana, G.; Bálint, K.; Bíró, I.; Gu, Y. The influence of running shoe with different carbon-fiber plate designs on internal foot mechanics: A pilot computational analysis. J. Biomech. 2023, 153, 111597. [Google Scholar] [CrossRef]
  41. Song, Y.; Cen, X.; Sun, D.; Bálint, K.; Wang, Y.; Chen, H.; Gao, S.; Bíró, I.; Zhang, M.; Gu, Y. Curved carbon-plated shoe may further reduce forefoot loads compared to flat plate during running. Sci. Rep. 2024, 14, 13215. [Google Scholar] [CrossRef] [PubMed]
  42. Farina, E.M.; Haight, D.; Luo, G. Creating footwear for performance running. Footwear Sci. 2019, 11 (Suppl. S1), S134–S135. [Google Scholar] [CrossRef]
  43. Isherwood, J.; Woo, S.; Cho, M.; Cha, M.; Park, S.; Kim, S.; Han, S.; Jun, J.; Sung, N.; Sterzing, T. Advanced footwear technology and its impacts on running mechanics, running economy and perception of male and female recreational runners. Footwear Sci. 2024, 16, 179–189. [Google Scholar] [CrossRef]
Figure 1. (a) Experimental shoe; (b) shoe sole in three-point bending test after removing upper part; (c) fixture model, shoe sole model, and coupled model.
Applsci 15 02785 g001
Figure 2. (a) Carbon fiber composite laminate: stacked structure (left) and polar properties (right). Below: stacking direction (purple vector) and layup direction (yellow vector). (b) Carbon plate model: top view (top), side view of carbon plate three-point bending FEA simulation (middle, 200 mm radius, 1 mm thickness), and coupled plate-sole structure three-point bending FEA simulation (bottom).
Applsci 15 02785 g002
Figure 3. (a) Scatter plot and fitted line graph (R2 > 0.99) of results from ten tests at loading rates of 7.5 mm/s, 10 mm/s, 12.5 mm/s, and 15 mm/s, within displacement range of 80–90%. (b) Scatter plot and fitted line graph (R2 > 0.99) of simulation results at loading rates of 7.5 mm/s, 10 mm/s, 12.5 mm/s, and 15 mm/s, within displacement range of 80–90%. (c) Box plot of stiffness values within displacement range of 80–90% for ten tests at each rate, showing maximum, minimum, median, outliers, upper quartile, and lower quartile, along with mean value and standard deviation. “n.s. (p = 0.114)” indicates no significant difference between groups of stiffness data. (d) Error percentage between simulated and experimental results compared to measured stiffness at each rate.
Applsci 15 02785 g003
Figure 4. Three-dimensional line graph and heatmaps of stiffness of plates and ‘plate-sole’ system. In three-dimensional line graph, hollow circles represent curvature radius of 200 mm, hollow triangles represent curvature radius of 250 mm, and hollow squares represent curvature radius of 300 mm. Red represents thickness of 1 mm, orange represents 1.5 mm, and yellow represents 2 mm. In heatmaps, deeper colors indicate greater stiffness.
Applsci 15 02785 g004
Table 1. Material properties of each model part.
PartDensity (kg/m3)Young’s Modulus (MPa)Poisson’s Ratio
Fixture7850200,0000.3
Midsole23001.20.365
Outsole [30]230080.47
Table 3. Material properties of epoxy carbon woven (230 GPa) wet.
Epoxy Carbon Woven (230 GPa) Wet
Density (kg/m3)1451
Young’s Modulus X direction (MPa)59,160
Young’s Modulus Y direction (MPa)59,160
Young’s Modulus Z direction (MPa)7500
Poisson’s Ratio XY0.04
Poisson’s Ratio YZ0.3
Poisson’s Ratio XZ0.3
Shear Modulus XY (MPa)3300
Shear Modulus YZ (MPa)2700
Shear Modulus XZ (MPa)2700
Table 2. Data obtained from mesh sensitivity analysis.
Size (mm)Average QualityNodesElements
160.6117,5389256
80.7129,24916,570
40.82131,96184,760
20.84878,940611,511
Table 4. Comparison of stiffness reduction percentages of carbon plate vs. ‘plate-sole’ for same thickness and curvature radius.
Plate Thickness (mm)Curvature Radius (mm)Reduction Percentage (%)Curvature Radius (mm)Plate Thickness (mm)Reduction Percentage (%)
120027.86200127.86
25023.851.556.61
30017.29272.69
1.520056.61250123.85
25054.311.554.31
30050.41270.75
220072.69300117.29
25070.751.550.41
30068.37268.37
Disclaimer/Publisher’s Note: The statements, opinions and data contained in all publications are solely those of the individual author(s) and contributor(s) and not of MDPI and/or the editor(s). MDPI and/or the editor(s) disclaim responsibility for any injury to people or property resulting from any ideas, methods, instructions or products referred to in the content.

