Article

Analysis of Three-Dimensional Micro-Contact Morphology of Contact Groups Based on Superpixel AMR Morphological Features and Fractal Theory

1
State Key Laboratory of Reliability and Intelligence of Electrical Equipment, Hebei University of Technology, Tianjin 300401, China
2
Guilin Electrical Equipment Scientific Research Institute Co., Ltd., Guilin 541000, China
3
China Railway Shenyang Group Co., Ltd., Shenyang 110025, China
*
Author to whom correspondence should be addressed.
Appl. Sci. 2025, 15(5), 2842; https://doi.org/10.3390/app15052842
Submission received: 12 January 2025 / Revised: 23 February 2025 / Accepted: 26 February 2025 / Published: 6 March 2025

Abstract

:
At the microscale, the three-dimensional morphological features of contact surfaces have a significant impact on the performance of electrical contacts. This paper aims to reconstruct the microscopic contact state of contact groups and to deeply study the effect of contact morphological features on electrical contact performance. To fully obtain multimodal data such as the three-dimensional micro-morphological features and chemical composition distribution of contact surfaces, this paper proposes a contact surface feature-matching method based on entropy rate superpixel seed point adaptive morphological reconstruction. This method can adaptively retain meaningful seed points while filtering out invalid seed points, effectively solving the problem of over-segmentation in traditional superpixel segmentation method. Experimental results show that the proposed method achieves a segmentation accuracy of 92% and reduces over-segmentation by 30% compared to traditional methods. Subsequently, on the basis of the moving and static contact group difference plane model and the W-M model, this paper constructs a three-dimensional surface fractal contact model with an irregular base. This model has the ability to layer simulate multi-parameter elastic and plastic and to extract fractal parameter point cloud height, which can more accurately reflect the actual contact state of the contact group. The model demonstrates a 15% improvement in contact area prediction accuracy and a 20% reduction in contact resistance estimation error compared to existing models. Finally, this paper compares and verifies the theoretical feasibility of the model, providing a new theoretical contact model for the study of the impact of three-dimensional micro-morphology on the electrical contact reliability.

1. Introduction

Contact resistance is a key factor affecting the electrical contact performance of contact groups, and failures caused by high contact resistance account for the majority of statistical cases of switch failures [1,2]. According to Holm’s theory of electrical contact, the contact resistance is not only composed of the resistance of the metal base but also includes the resistance of the film layer and the constriction resistance [3,4].
At the microscale, the three-dimensional morphological characteristics of contact surfaces have a significant impact on electrical contact performance. According to ISO 25178-2:2021 [5], surface topography is a general term that encompasses various characteristics of a surface, including its geometric shape, texture, roughness, waviness, and more. Among these, surface roughness is an important subset of surface morphological characteristics, typically used to describe the irregularities on a surface at the microscale. Calculating the surface contact area through using roughness joint surfaces and constructing a micro-asperity model is an effective method for analyzing the electrical contact performance of contact groups. Hamid et al. [6] constructed a micro-asperity distribution model based on the principles of G-W statistics. This model is based on assumptions about the distribution pattern of micro-asperities and explores the correlation between the number of micro-asperities and the actual contact area. The heights of micro-asperities on a rough surface do not necessarily follow a Gaussian distribution but exhibit chaotic and disordered characteristics. In statistical models, the standard deviation of roughness parameters of the microsurface is affected by the accuracy of the measuring instrument, and traditional statistical methods cannot uniquely characterize the micro-morphology of rough surfaces. Li et al. [7,8] discussed geometric modeling techniques for anisotropic rough surfaces and analyzed the relationship between the number of asperities, deformation height, and contact area in the contact interface of rough surfaces with the W-M function possessing fractal characteristics. A three-dimensional rough surface contact resistance model was constructed using the W-M function [3,9], considered the random distribution characteristics of contact spots and the interaction between spots [10]. Peta et al. [11] used fractal dimension and multi-scale parameters, specifically relative area (Srel), relative length (RL), area-scale fractal complexity (Asfc), and length-scale fractal complexity (Lsfc), to describe the micro wear on the surface after contact with worn surface and worn tool surface. Chen et al. [12] proposed a fractal contact model of rough surfaces (isotropic and non-Gaussian), which revealed the influences of topography and material properties on the contact characteristics.
Contact resistance is one of the important parameters characterizing the electrical contact performance of contacts [9,10,11,12,13]. Li et al. [13] analyzed the peak time series of moving contact resistance of contacts based on chaos theory and verified the effectiveness of chaos prediction. Zhao et al. [14] analyzed the factors influencing the contact resistance changes in railway relay contacts and the relationships between these factors. Contact failure has a crucial impact on the reliability of switching electrical appliances. Existing studies on the intrinsic failure mechanisms of switching electrical appliances have not clearly identified the relationship between the surface morphology characteristics of contacts and the types of failure, nor have they deeply investigated the correlation between morphological parameters and failure mechanisms. Therefore, the analysis of the micro-morphology of the contact surfaces of the contact group is crucial [15,16,17].
The contact surface models constructed in existing studies mainly focus on single contact surface [18,19,20]. However, the micro-morphological characteristics of the contact interface of contact groups can more directly and accurately reflect the level of electrical contact performance. Therefore, this paper proposes a method that fuses the matching of contact surface erosion, scratches, and deformations based on superpixel entropy rate and adaptive morphological reconstruction (AMR) [21,22,23], inversely restoring the contact interface of the contact group. A contact model is established based on point cloud data and fractal contact theory. On the basis of the differential plane established [15], combined with the kinematic parameters high-speed captured by computer vision, conducting moving contact analysis on the contact group, providing a new model and method for further exploring the correlation between the electrical contact performance and morphological characteristics of contact groups.

2. Construction of the Contact Group Contact Model

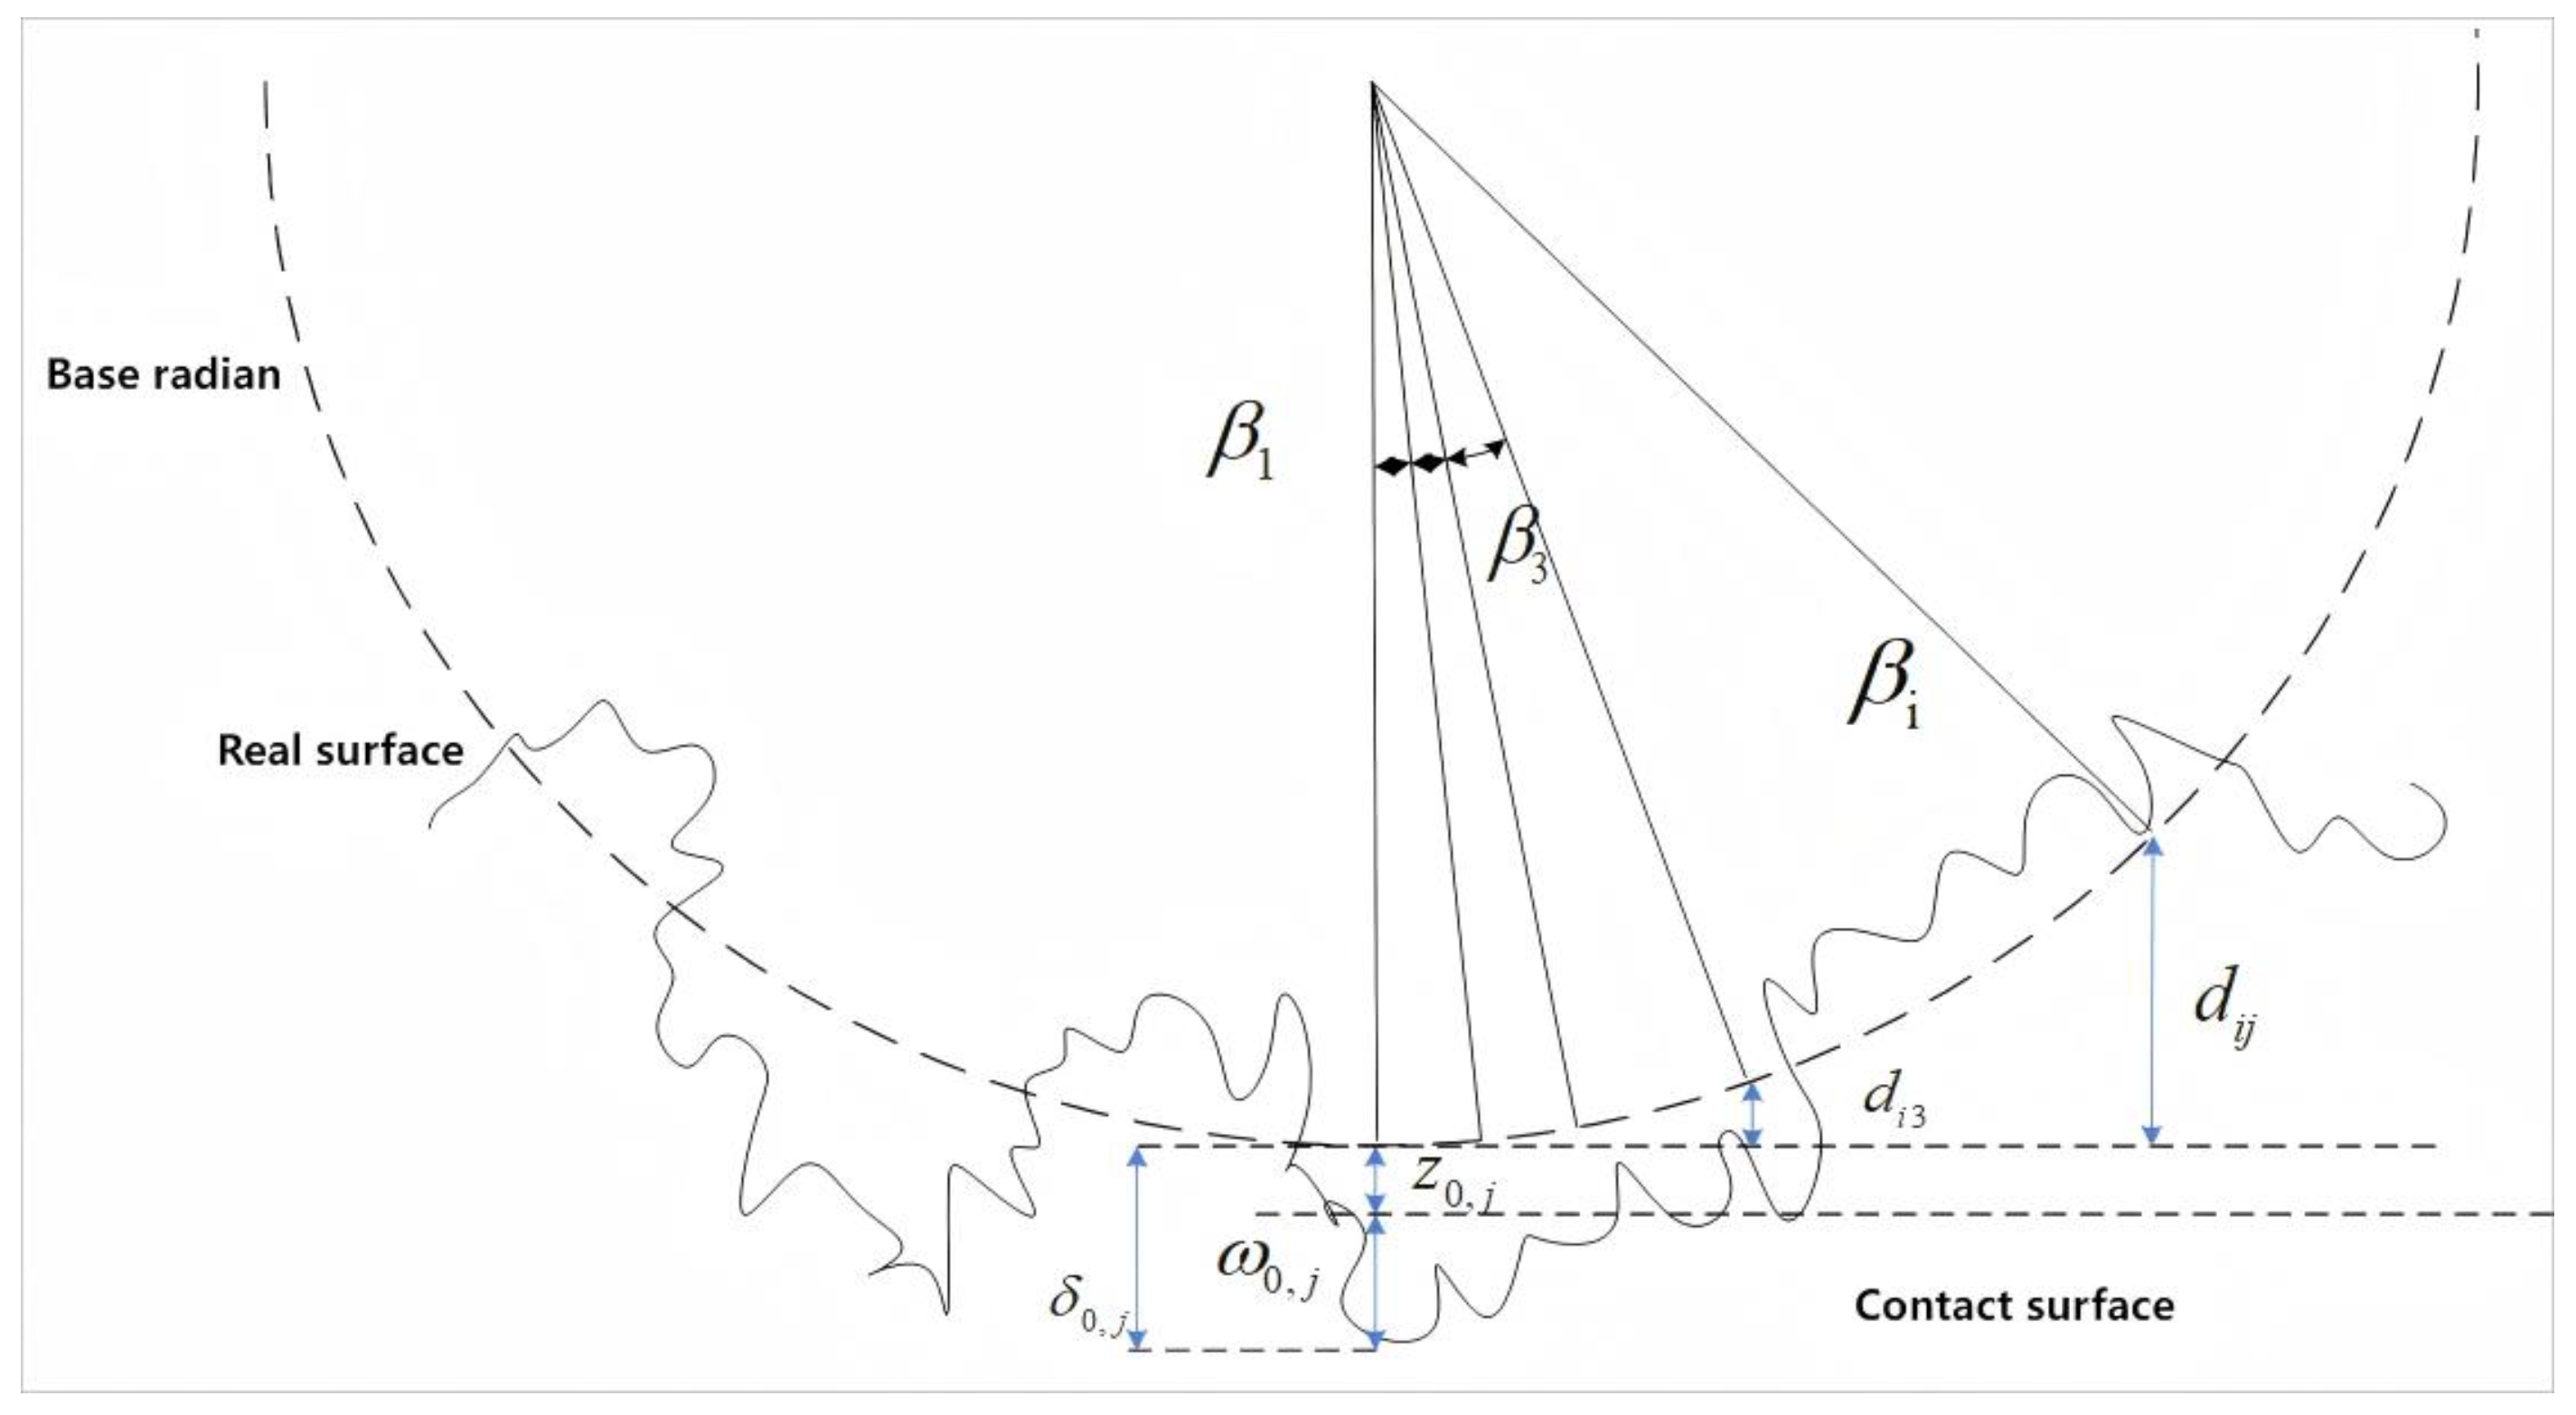
2.1. Application of Differential Planes in Fractal Contact Models

Most of the contact models constructed in existing studies are limited to single contact point. For those contact groups that are in contact status, the extremely small contact gap makes it difficult to collect topographical data. Moreover, the existing methods for analyzing contact surfaces are relatively single, usually considering only one aspect of the micro-morphology, mechanical motion parameters, or surface composition distribution of the contact, lacking research on comprehensive analysis of multimodal data obtained from different instruments. Based on the differential plane model, this paper extends the contact model of contact groups by incorporating the micro-morphology features of the contact group. The morphology diagram of the contact state of the sample contact group in this article is shown in Figure 1.
According to the GW model and CEB model theories, when conductive materials come into contact, due to the discontinuity of the micro-morphology of the rough surface at the contact, there will be multiple contact spots within the contact gaps of the contact group, but the deformation process of the micro-asperities is continuous; the contact process of the rough surface of the contact group can be equated to the contact between a non-rigid rough surface and a rigid smooth surface. Based on the continuity and smoothness principle of the deformation of rough surface micro-asperities, this paper explores the relationship between stress and strain.
Firstly, calibrating the position of the contact area of the contact group, extending from Hertz theory, simplifying the contact area after calibration into a contact interface, namely the differential plane [15], for the analysis of the mechanical properties of the contact group.

2.2. Morphological Feature Extraction of Contact Groups

There are irregular morphological features such as scratches and ablation on the contact surface, and Table 1 is a surface morphology image of the contact. Based on the theory of image saliency analysis, features such as edges and contours of the image are extracted for regional classification, and the morphological features are further extracted using the superpixel method. The superpixel method has the problem of over-segmentation, and this paper adopts an entropy rate segmentation method based on adaptive morphological reconstruction (AMR) for extracting image contour features with LOG, which can effectively solve this problem.

2.2.1. Image Denoising Preprocessing

Contact images are easily being affected by environmental lighting and reflections from metallic surfaces during the capture process, which necessitates noise reduction preprocessing of the images.
First, the Gaussian function is used to extract the illumination component of the contact surface morphology image [24], with the expression of the Gaussian function as follows:
B ( x , y ) = λ x 2 + y 2 c 2
In which, λ is the normalization constant, and c is the scale factor.
Use P(x,y) to represent the HSV value of the contact surface morphology image, and by convolving with a multi-scale Gauss function and P(x,y), the expression of the illumination component C(x,y) in A(x,y) is as follows:
C ( x , y ) = P ( x , y ) B ( x , y )
Secondly, adjust the parameters of the 2D-Gamma function based on the distribution characteristics of the illumination components to achieve uniform illumination processing of the 3D morphology image of the contact point, the expression of a brightness value is as follows:
D ( x , y ) = 255 P ( x , y ) 255 γ
In which, the magnitude of γ is determined by both the characteristics of the lighting component and the average brightness of the lighting component, and its expression is as follows:
γ = 1 2 k C ( x , y ) k
In which, k is the mean brightness of the illumination component.
Equations (1)–(4) are from references [24,25].
The contact group morphology image captured by the non-contact 3D profiler is a mirror image of the actual contact image, so a mirror transformation is required. Normalized intensity contact group morphology mirror image as shown in Figure 2. Contact group gradient direction degree image as shown in Figure 3.

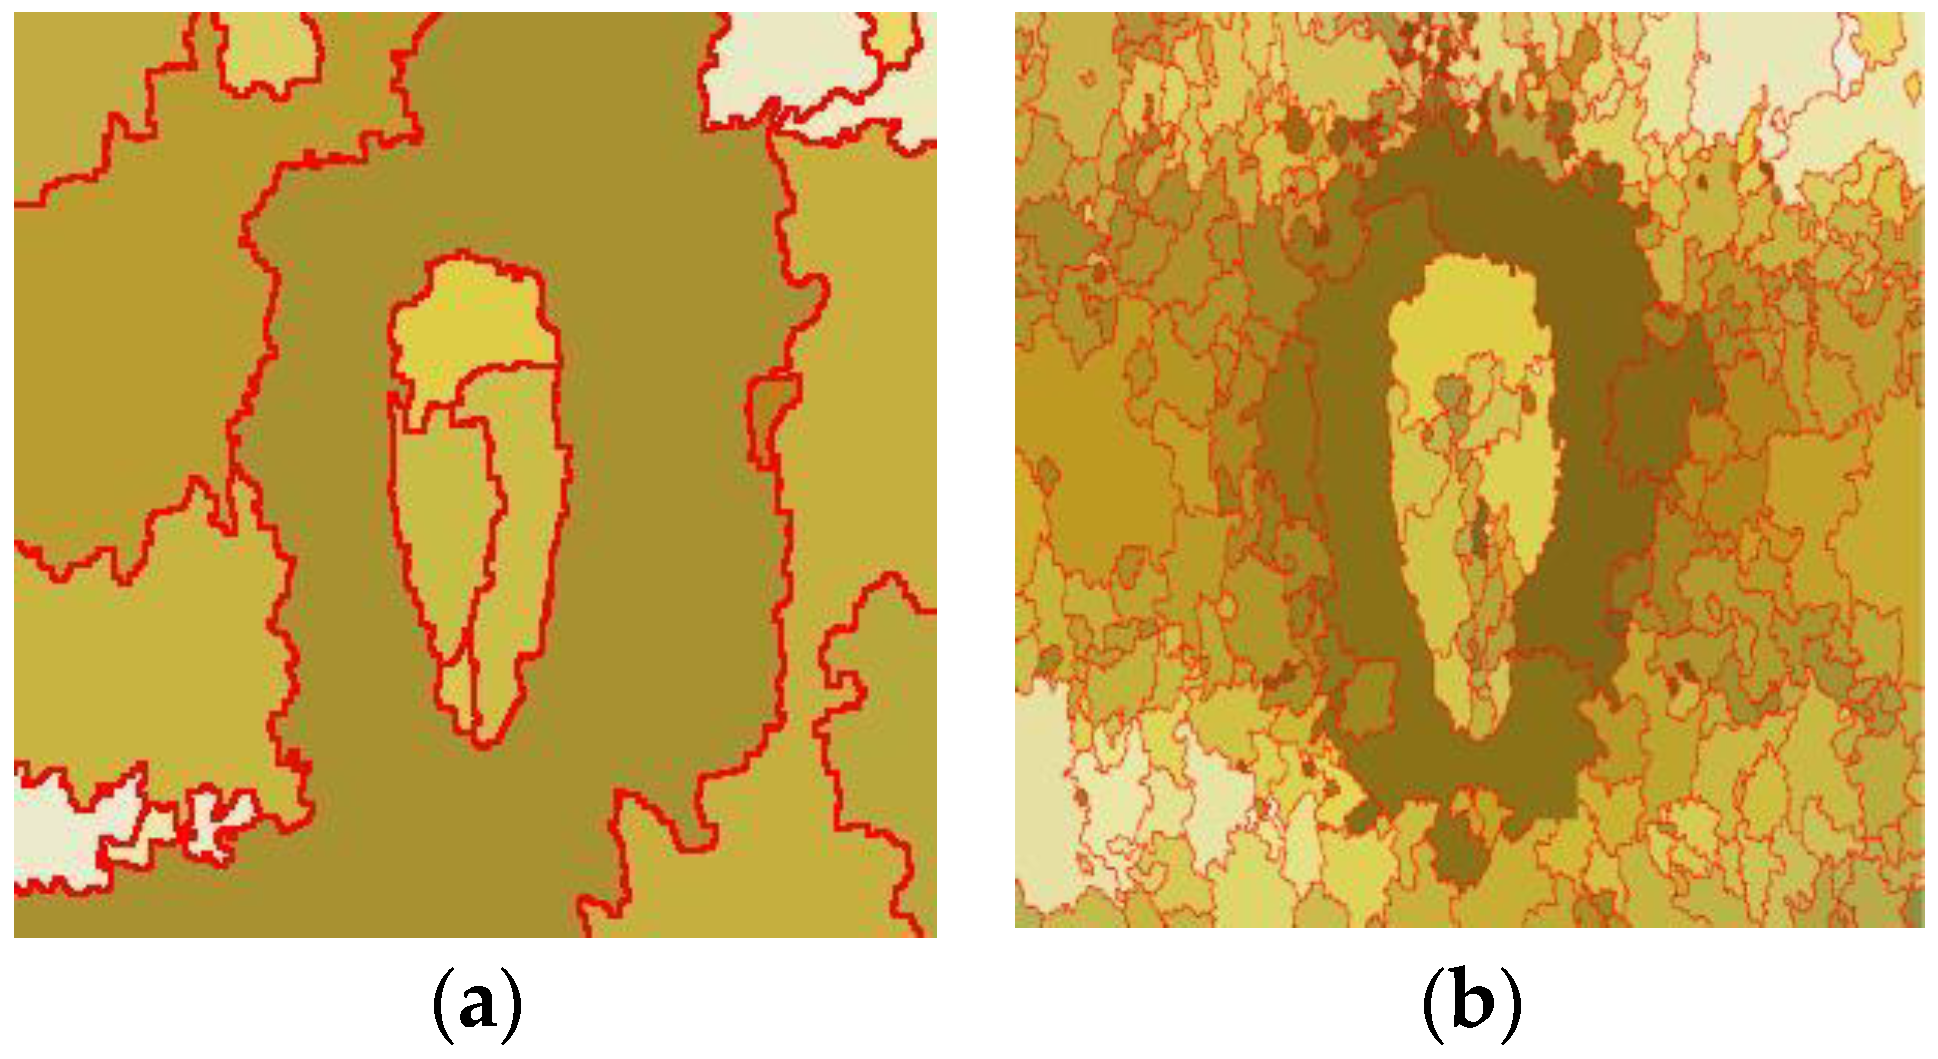
2.2.2. Entropy Rate Superpixel Segmentation

Use G = ( V , E ) to represent an undirected graph, where V represents the set of vertices, and E represents the set of edges. Vertices and edges are denoted by v i and e i respectively. The similarity between vertices is represented by a weight function ω :   E   R + U { 0 } , where the weights of edges are symmetric, i.e., ω i , j = ω j , i ,   X = { X t | t T , X t V } represents a random walk process on the graph G = ( V , E ) with non-negative similarity weights ω [23]. A random walk model proposed in the literature is adopted, the transition probability is defined as Equation (5).
P i , j = P r X t + 1 = v j X t = v i = ω i , j / ω i
In which, ω i = k : e i , k ϵ E ω i , k represents the sum of weights associated with the node.
The normalized result is as shown in Equation (6).
μ = μ 1 , μ 2 , , μ V T = ω 1 ω T , ω 2 ω T , , ω V ω T T  
In which, ω T = i = 1 V ω i is the normalization constant.
The goal is to select a subset of edges A E , such that the resulting graph G = ( V , E ) contains exactly k adjacent nodes.
Entropy rate: To obtain compact clusters consistent with the region, the entropy rate of random walks on the connection graph is used as a criterion. The mapping function for the transition probabilities p i , j   :   2 E > R is defined by Equation (7).
p i , j A = ω i , j ω i i f   i j               e i , j ϵ A 0       i f   i j               e i , j ϵ A 1 j : e i , j ϵ A ω i , j ω i     i = j
Therefore, the entropy rate of a random walk on a graph G = ( V , E ) is defined as a set mapping, as shown in Equation (8).
h ( A ) = i μ i j p i , j ( A ) l o g ( p i , j ( A ) )
Balance function: to ensure that the formed clusters have similar sizes, a balancing function is used as the criterion for judgment. Let N a be the number of connecting sub-graphs in the graph, and Z a be the distribution of cluster members. The partition boundary of the graph is S A = { S 1 , S 2 , , S N A } .
P Z A = S i V ,   i = { 1 , , N a }
The balance function is defined by Equation (10).
B A h Z a N a = i P Z a i log P Z a ( i ) N a
Equations (5)–(10) are from references [21,22,23].

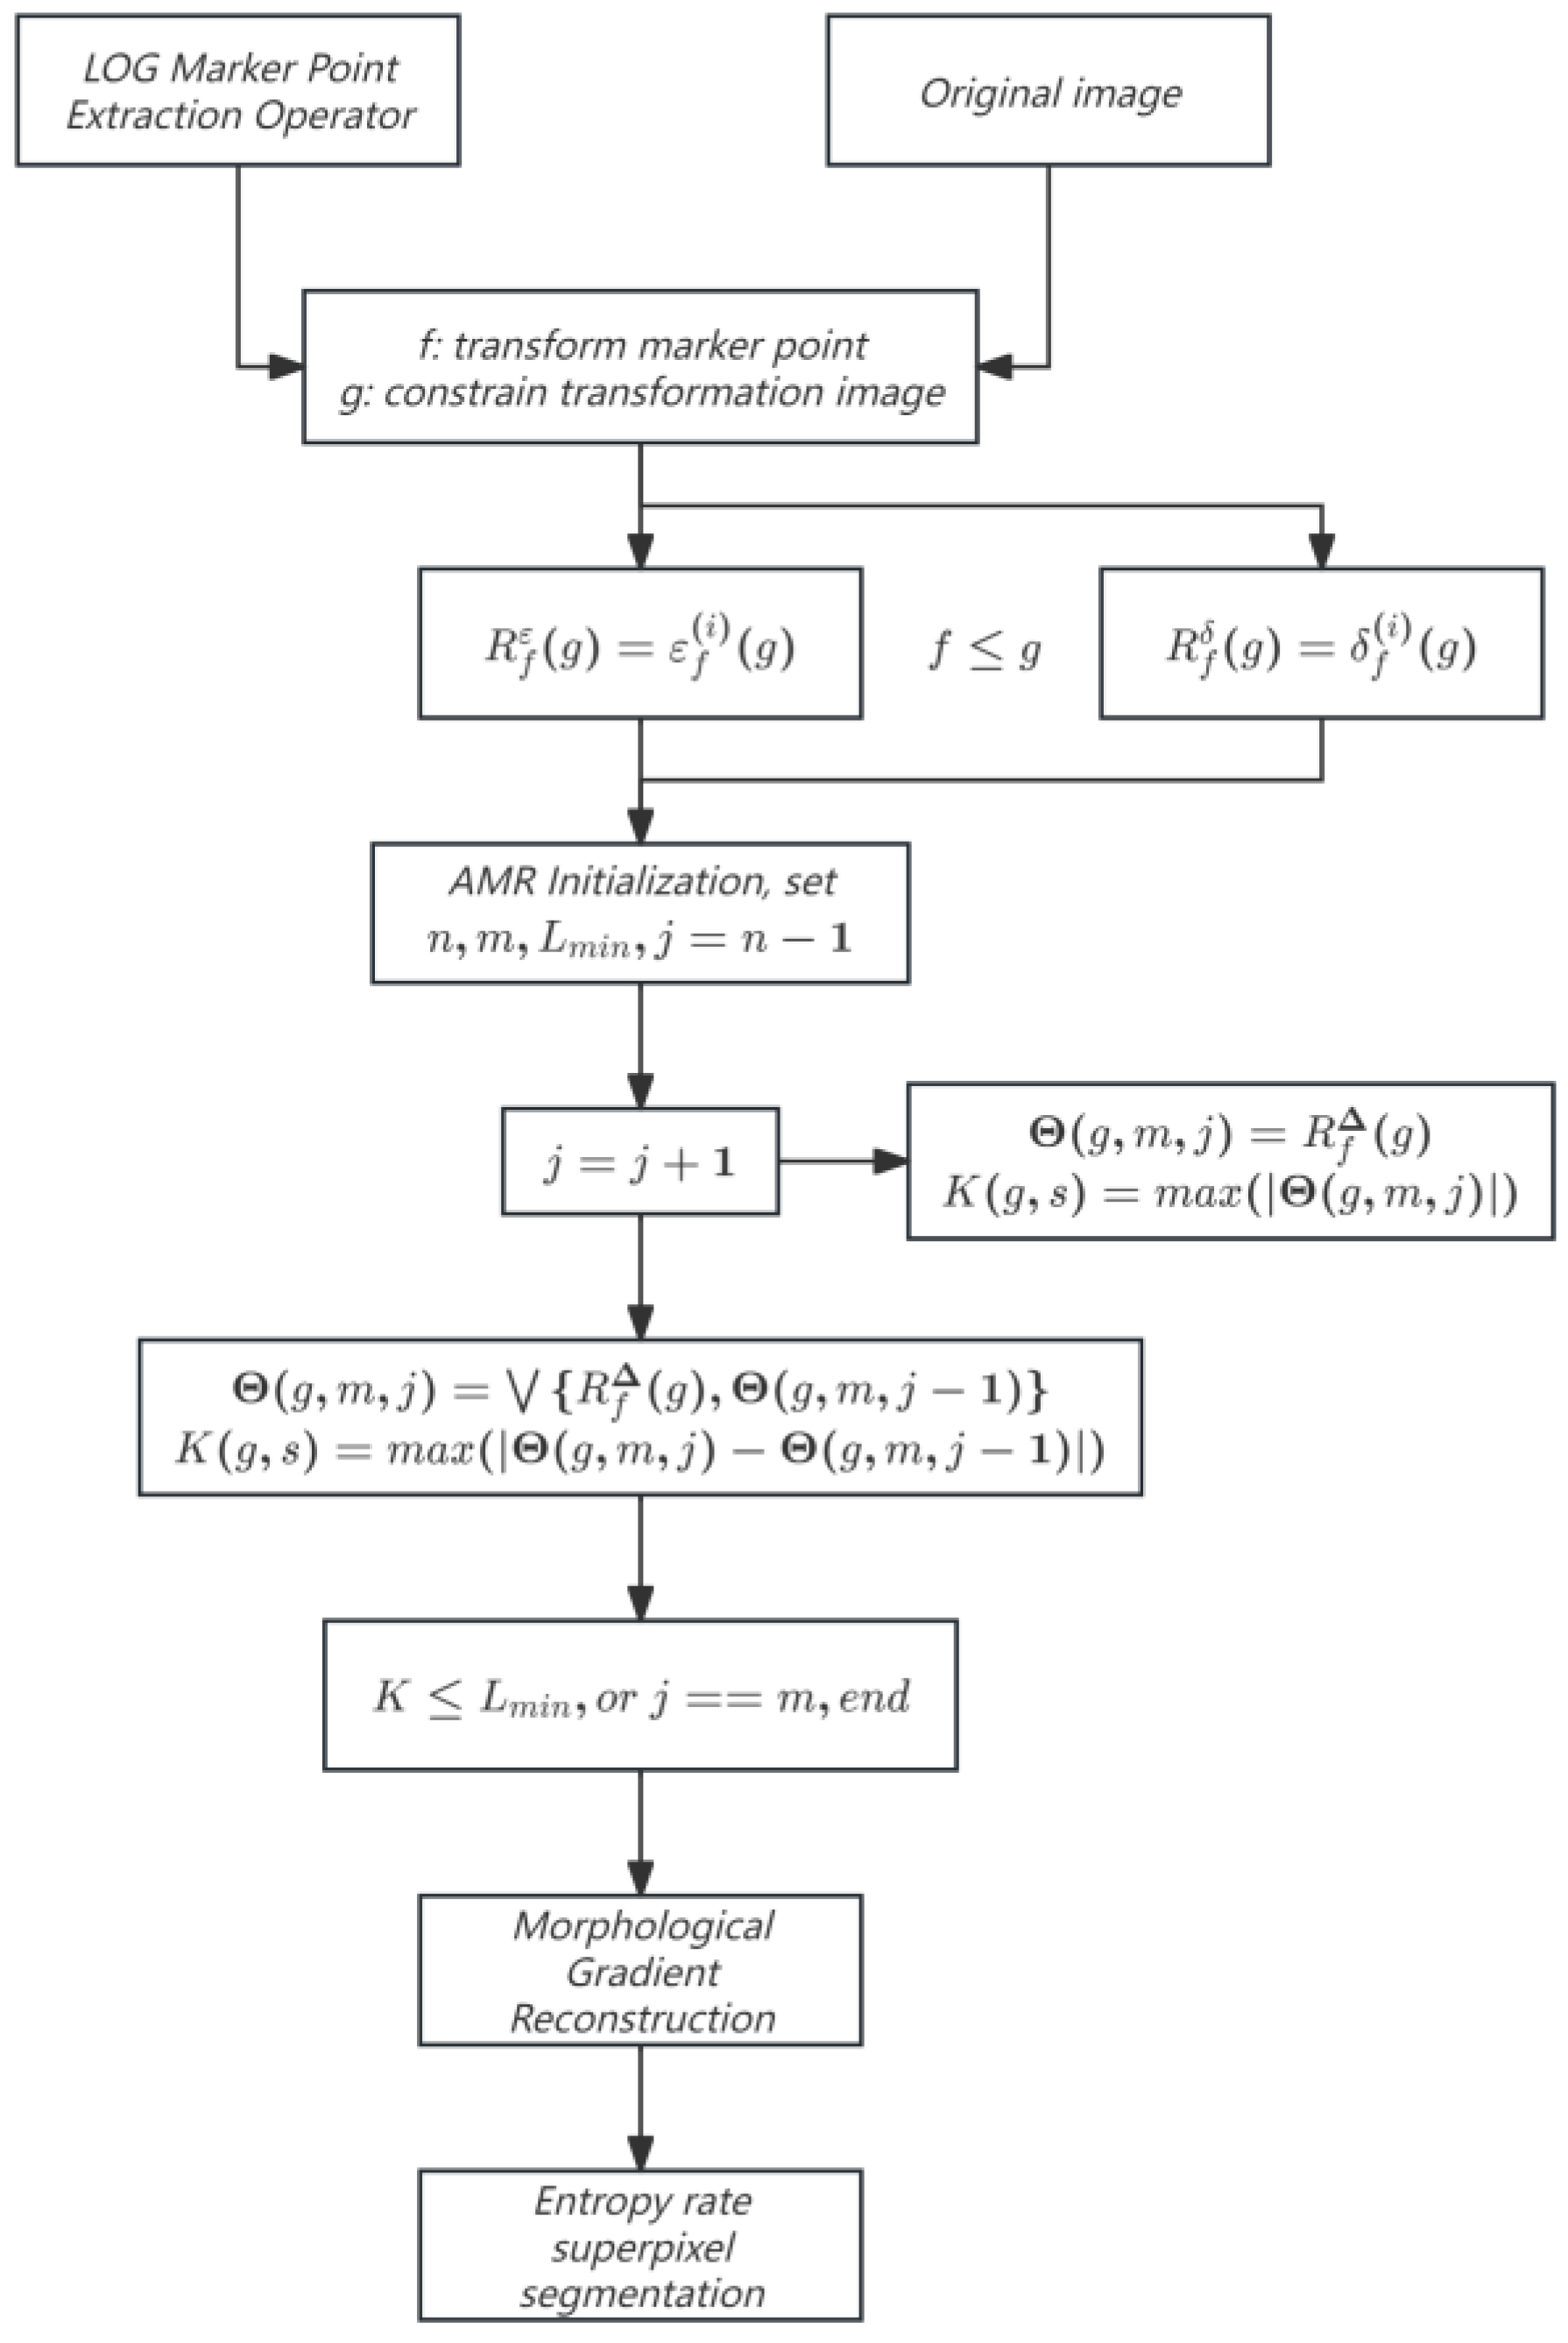
2.2.3. Morphological Adaptive Feature Extraction

Morphological reconstruction can effectively remove noise and preserve object contours when the type of noise is unknown. Using the LOG operator, which has high boundary localization accuracy, strong anti-interference capability, and good continuity, for preprocessing [19], followed by grayscale transformation to obtain seed points [21,22], morphological corrosion reconstruction R f ε and morphological dilation reconstruction R f δ are then performed, as shown in Equation (11).
R f ε ( g ) = ε f ( i ) ( g ) , g f R f δ ( g ) = δ f ( i ) ( g ) , g f
The Multi-scale Combinatorial Grouping (MCG) proposed by Pont-Tuset et al. is an excellent hierarchical segmentation method that employs a fast normalized cut algorithm and an effective hierarchical region merging algorithm. Based on the hierarchical segmentation results provided by MCG, some improved methods have also been proposed [21,22].
Let be an adaptive morphological reconstruction operator, which is convergent when the scale parameter m is increased, that is, for any gradient images f and g, it satisfies Equation (12).
ϑ ( g , m , j ) = R f Δ ( g ) , ϑ ( g , m , j )
As m increases, the gradient amplitude of the reconstructed gradient image by AMR eventually converges to the minimum value of the original gradient image, meaning AMR only filters out the useless regional minima and preserves the significant minima when m approaches infinity; whereas MR filters out all regional minima. Therefore, AMR can effectively avoid over-segmentation and also adaptively filter out useless seed points while preserving meaningful seed points. This paper proposes an objective function to prove the convergence of AMR.
K ( g , s ) = m a x ϑ ( g , m , j ) ϑ ( g , m , j 1 )
To achieve unsupervised learning, this paper proposes a method of morphological reconstruction and clustering validity index to determine the optimal number of clusters. As shown in Figure 4, the grayscale values of the image gradually decrease from the center to the edges. Therefore, LOG can extract the extremum points in the central area of the image from this distribution feature, and then achieve AMR adaptive seed point segmentation, finally completing the superpixel segmentation. The results of AMR segmentation are shown in Figure 5. ARM feature recognition flowchart based on LOG features is shown in Figure 6.
Algorithm steps:
(1)
Process the image P based on LOG, mark the contour feature points, and use the connected domain extremum point module to process;
(2)
Apply AMR to image P to generate the morphological gradient reconstruction ϑ ;
(3)
The entropy rate superpixel segmentation method divides the image P into N regions, each representing the growth range of pixel points;
(4)
Extract gradient features from each region, integrate all feature vectors into a feature vector matrix, initialize the membership matrix, update the clustering centers, and use Equation (10) to update the weight matrix;
(5)
If t > m a x _ i t e r   ( m a x i m u m   n u m b e r   o f   i t e r a t i o n s ) , proceed to step 6, otherwise return to step 4;
(6)
Obtain the final segmentation result based on the membership matrix.

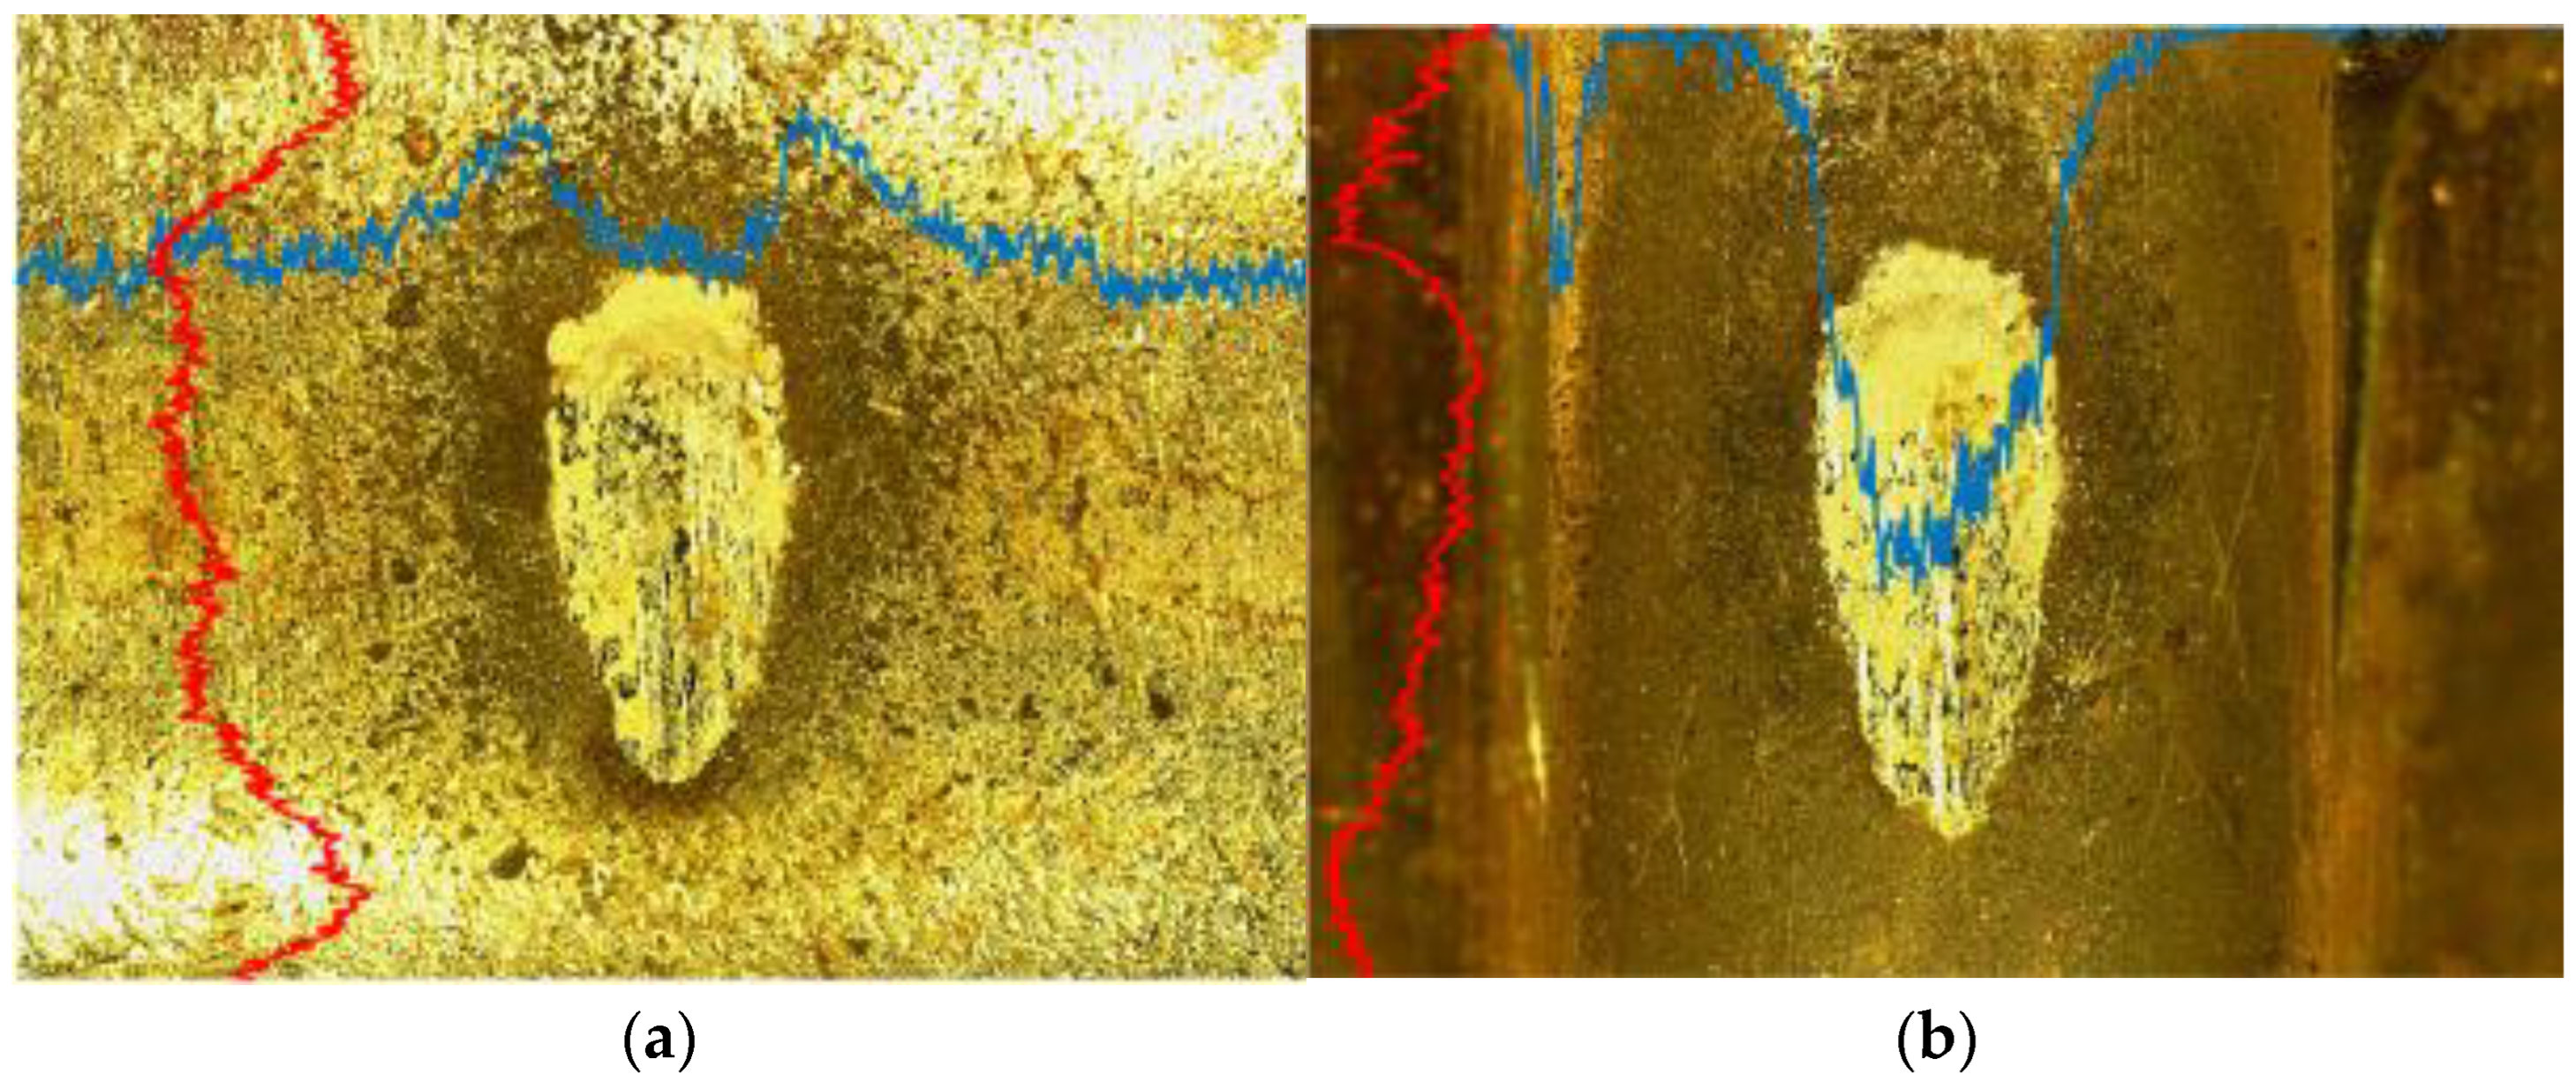
2.2.4. Contact Group Feature Matching and Difference Plane Construction

For the selected feature area contour, perform iterative error calculations using the central ablation area as the reference, and ultimately take the image corresponding to the minimum error value as the feature-matching image, conducting iterative calculations according to Equation (14). Contact group feature-matching diagrams are shown in Figure 7.
x y = s c o s Δ θ   s i n Δ θ s i n Δ θ                 c o s Δ θ x x 0 + Δ x y y 0 + Δ y + x 0 y 0
In which, Δ x is the deviation of the image’s horizontal axis length, less than 10% of the horizontal axis length, Δ y is the deviation of the image’s vertical axis length, less than 10% of the vertical axis length, x 0 is the horizontal coordinate of the ablation center of the static contact point, y 0 is the vertical coordinate of the ablation center of the static contact point.
The contact feature extraction indicators use the probability rand index (PRI), global consistency error index (GCE), and boundary displacement error (BDE). Use the extracted moving and static contact profiles as the benchmark for evaluating the fused image. P R I [ 0 , ) , The higher the PRI value, the greater the consistency between the two clustering results, and the better the segmentation result. G C E [ 0 , ) , A smaller GCE value indicates a smaller refinement error and a better segmentation effect. B D E [ 0 , ) , The smaller the value, the smaller the boundary difference between the two, indicating a better segmentation effect [21]. The performance evaluation parameters from Table 2 suggest that the feature extraction effect is good.
Using a non-contact 3D profilometer to scan the moving and static contact points of a relay, extract the point cloud height data from the contact surfaces, perform mirror symmetry on the moving contact point surface height data, and finally achieve in-situ calibration and restoration of the actual contact state of the contact group. The plane formed by the maximum sum of the heights of the moving and static contact points’ surfaces is used as the reference plane for establishing the difference plane [15]. The three-dimensional morphology restoration diagram of the contact point group difference plane thus established is shown in Figure 8.
Due to the presence of numerous micro-structures on the surface of the contact point, which are different from the distinct layers of ordinary macroscopic images, Gauss filtering is used to remove the incoherence of illumination and structure. An entropy segmentation method based on LOG extraction of image contour features and adaptive morphological rate (AMR) is used to extract the ablation features. Due to the strong correlation between the moving and static contact points, the ablation features extracted are used to calibrate the in-situ contact positions of the moving and static contact points, providing a theoretical basis for the correlation analysis of the moving and static contact points.

3. The Fractal Model and the W-M Contact Model

Modeling studies for the normal contact stiffness of joint surfaces are generally divided into two types: those based on statistical parameters and those based on fractal parameters.
Greenwood and Williamson [26] first established the GW model based on statistical methods, assuming that the height of the rough surface profile follows a Gaussian distribution. Statistical parameters are usually constrained by the measurement accuracy of the instrument and do not have scale independence or uniqueness [7,8], whereas fractal parameters have scale independence. Therefore, the contact stiffness calculation model of the interface based on fractal parameters has certain advantages. The implementation of the W-M model is defined by Equation (15). 3D fractal contact model is shown in Figure 9.
z ( x , y ) = L l n γ M 1 / 2 m = 1 M n = 0 n m a x γ ( D 3 ) n × c o s φ m , n c o s 2 π γ n ( x 2 + y 2 ) 1 / 2 L × c o s t a n 1 y x π m M + φ m , n
Parameter explanation:
  • z: the height of the combined surface profile;
  • x,y: profile coordinates;
  • φ m , n : random phase;
  • L: sampling length;
  • D: fractal dimension;
  • G: scale parameter;
  • γ: spatial frequency of the profile;
  • M: number of overlapping surface protrusions;
  • n: frequency exponent, rank of micro-asperities.
Based on the theory of three-dimensional anisotropic fractal geometry, this paper establishes a fractal model for the normal contact stiffness of the interface, compares it with other models in the literature, and verifies the correctness of the model. The model uses a distribution function to express the distribution of contact points on the interface, superimposes frequency micro-asperities, and includes three contact deformation mechanisms of micro-asperities: elasticity, elastoplasticity, and fully plasticity. It considers the anisotropy of rough surfaces, making the model more closely aligned with the actual contact process of contact groups. The base shape of the relay contacts selected in this paper is close to an arc surface, so the base shape is added to the differential plane W-M model, resulting in Equation (16).
z ( x , y , θ ) = r × c o s θ + L G L D 2 l n γ M 1 / 2 m = 1 M n = 0 n m a x γ ( D 3 ) n × c o s φ m , n c o s 2 π γ n ( x 2 + y 2 ) 1 / 2 L × c o s t a n 1 y x π m M + φ m , n
In which, r is the base radius, and θ is the horizontal angle of the base, and the model is shown in Figure 10.
Equations (15) and (16) are from references [12,26].

3.1. Optimization of a Single Micro-Asperity Model

Superimposing micro-asperities of different frequencies to simulate a state of micro-asperities, a single micro-asperity with a frequency exponent of n undergoes three types of deformation during the contact process: elastic, elastoplastic, and plastic deformation. Different deformation processes are fitted and analyzed using micro-asperities in various states, thereby simulating the true micro-deformation process of a single micro-asperity. Schematic diagrams of multi-frequency micro-asperity synthesis are shown in Figure 11.
The structural parameters of a single micro-asperity are as follows.
Single asperity contact area:
a n = 2 π R n ω n
Single asperity deformation:
ω n e c = π K H 2 E 2 R n
Radius:
R n = ( 1 + z 2 ) 3 / 2 z x = 0 = L / 2 γ n D 1 2 3 D π 2 G D 2 l n γ 1 / 2
Height:
δ n = G D 2 l n γ 1 / 2 L γ n 3 D
Variable quantity:
ω n = δ n z n ( r n ) = G D 2 l n γ 1 / 2 L γ n 3 D × 1 c o s π r n r n
Parameter explanation:
  • H: hardness of materials;
  • K: hardness coefficient, K = 0.454 + 0.4 v ;
  • E: elastic modulus, E = 1 1 v 1 2 E 1 + 1 v 2 2 E 1 ;
  • E 1 ,   E 2 : elastic modulus of two contacting surfaces;
  • v 1 ,   v 2 : Poisson’s ratio of two contacting surfaces.
Using the arc-shaped profile of a cross-section of the base model Figure 10 as the base for the fractal model, as shown in the schematic Figure 12.
Equations (17)–(21) are from references [9,17].
Divide the point cloud height data of the contact surface into M × N small blocks to approximate the fitting of the contact surface, with the equivalent distance from each point on the contact surface to the contact plane being d i j .
d i , j = r r × c o s i 1 N 1 × β i
Let the deformation of the central area be ω 0 , j , then the deformation of the area deviating from the central contact area is calculated by Equation (23).
ω 0 , j δ 0 , j = ε 1 × δ i , j d i , j δ i , j
The scale factor D s can determine the relationship between the average distribution quantity and the size of micro-asperities, thereby obtaining the true contact area of the micro-asperities.
Δ i , j = z i , j × d i , j / ( M N δ m a x )
Equations (22)–(24) are from references [4,16].

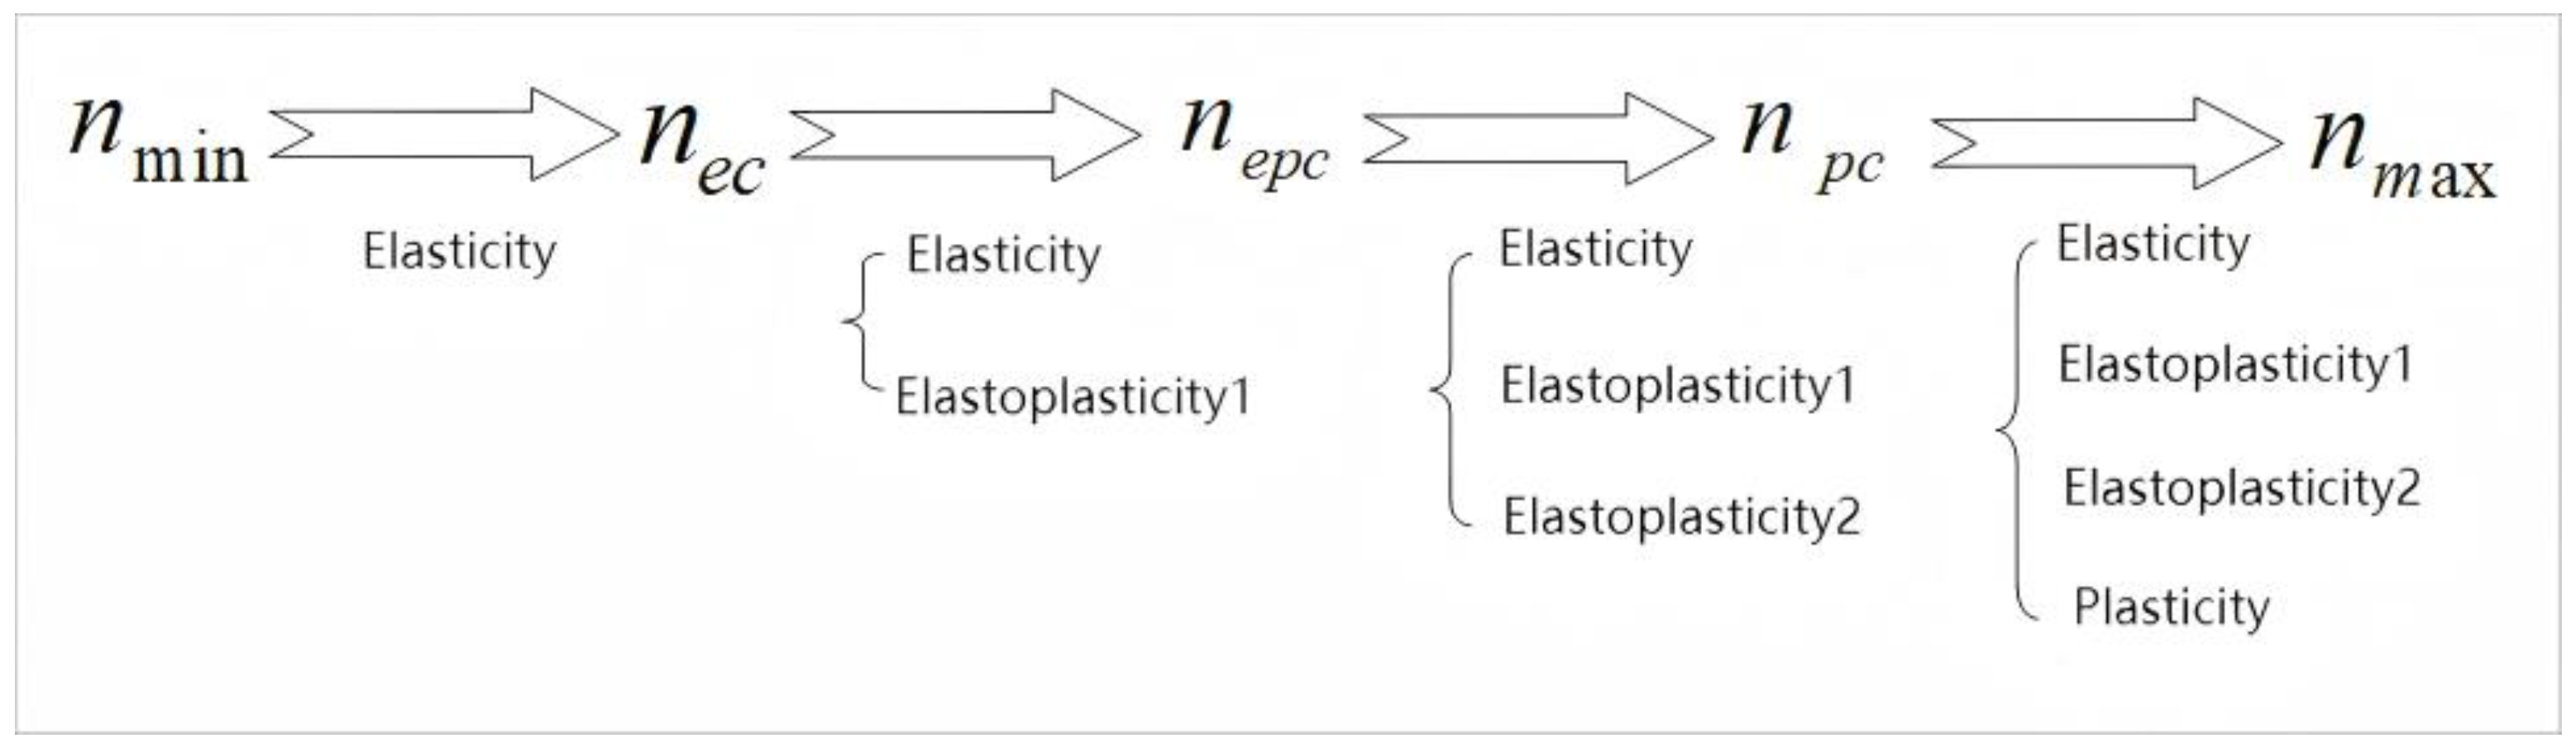
3.2. Deformation Stages of a Single Micro-Asperities

The following studies the conditions for the existence of three types of deformation processes: elastic, elastoplastic, and plastic. Schematic diagram of the micro-asperity deformation process is shown in Figure 13.
(1)
Elastic contact
In the Holm contact theory, when ω < ω c , the micro-asperities are in an elastic contact state.
(2)
Plastic contact
When ω > 6 ω p , the micro-asperities are in the stage of fully plastic contact deformation.
(3)
Elastoplastic contact
When 6 ω c ω 110 ω p , the micro-asperities is in the elastic-plastic deformation stage. The contact load and contact stiffness at the beginning and end of this stage should satisfy the conditions of continuous and smooth transition.
According to Hertz’s contact theory, the relationship between the contact load f of micro-asperities and the deformation ω can be known.
Contact load:
F n e = 16 E π 1 / 2 G D 2 l n γ 1 / 2 3 L D 1 a n e 3 / 2 γ n ( D 1 ) a n e a n e c F n e p 1 = 2 3 K H × 1.1282 a n e c 0.2544 a n e p 1 1.2544 a n e c < a n e p 1 < a n e p c F n e p 2 = 2 3 K H × 1.4988 a n e c 0.1021 a n e p 2 1.1021 a n e p c < a n e p 2 a n p c F n p = H a n         a n e a n e c a n p a n p c

3.3. The Micro-Asperity Fractal Processing and Distribution Model

The MB model was the first to link the distribution of oceanic islands with fractal rough surfaces, suggesting that during the contact process between a rigid surface and a rough surface, the distribution of contact areas of micro-asperities on the rough surface is similar to that of oceanic islands. By differentiating the contact area equation, the area density distribution function of the micro-asperities is obtained:
n ( a ) = Q D 1 2 φ ( 3 D ) / 2 a l ( D 1 ) / 2 a ( D + 1 ) / 2
In which, a l is the maximum contact area of micro-asperities, φ is the area expansion coefficient.
Integrating the contact area formula yields the distribution coefficient:
ζ ( n ) = a l   n = n m i n n m a x  
According to the critical conditions of contact load and contact area, as well as δ n ω n e c , it can be deduced that:
G D 2 ( l n γ ) 1 / 2 L γ n 3 D K φ 2 2 L / ( 2 γ n ) D 1 2 3 D G D 2 ( l n γ ) 1 / 2
Derive the critical contact level further:
n e c = i n t 1 2 ( D 2 ) l n γ l n ( K ϕ / 2 ) 2 L 2 D 4 4 G 2 D 4 l n γ
Similarly, the critical levels of the combined surfaces for the other two states of the model can be deduced.
Equations (25)–(29) are from references [6,12].

3.4. Establishment of the Distribution Model for Micro-Asperity Base Areas

Extended over the entire surface, considering the three states of contact deformation in conjunction with the distribution model, the calculation formula for the total base area can be derived:
A r = i = 1 N j = 1 M ( n = n m i n n e c 0 a n l Δ i j ζ ( a ) d a + n = n e c + 1 n m a x 0 a n e c Δ i j ζ ( a ) d a + n = n e c + 1 n e p c a n e c a n l Δ i j ζ ( a ) d a + n = n e p c + 1 n m a x a n e c a n e p c Δ i j ζ ( a ) d a + n = n e p c + 1 n p c a n e p c a n l Δ i j ζ ( a ) d a + n = n p c + 1 n m a x a n e p c a n p c Δ i j ζ ( a ) d a + n = n p c + 1 n m a x a n p c a n l Δ i j ζ ( a ) d a )
Total base load:
F r = i = 1 N j = 1 M ( n = n m i n n e c 0 a n l Δ i j F n e ζ ( a ) d a + n = n e c + 1 n m a x 0 a n e c Δ i j F n e ζ ( a ) d a + n = n e c + 1 n e p c a n e c a n l Δ i j F n e p 1 ζ ( a ) d a + n = n e p c + 1 n m a x a n e c a n e p c Δ i j F n e p 1 ζ ( a ) d a + n = n e p c + 1 n p c a n e p c a n l Δ i j F n e p 2 ζ ( a ) d a + n = n p c + 1 n m a x a n e p c a n p c Δ i j F n e p 2 ζ ( a ) d a + n = n p c + 1 n m a x a n p c a n l Δ i j F n p ζ ( a ) d a )
Total hardness of the substrate:
K r = i = 1 N j = 1 M ( n = n m i n n e c 0 a n l Δ i j k n e ζ ( a ) d a + n = n e c + 1 n m a x 0 a n e c Δ i j k n e ζ ( a ) d a + n = n e c + 1 n e p c a n e c a n l Δ i j k n e p 1 ζ ( a ) d a + n = n e p c + 1 n m a x a n e c a n e p c Δ i j k n e p 1 ζ ( a ) d a + n = n e p c + 1 n p c a n e p c a n l Δ i j k n e p 2 ζ ( a ) d a + n = n p c + 1 n m a x a n e p c a n p c Δ i j k n e p 2 ζ ( a ) d a + n = n p c + 1 n m a x a n p c a n l Δ i j k n p ζ ( a ) d a )
Dimensionless processing of data can eliminate the influence of units.
Dimensionless contact area:
A * = A / ( E A a )
Dimensionless contact load:
F * = F / ( E F a )
Equations (30)–(34) are from references [3,27].

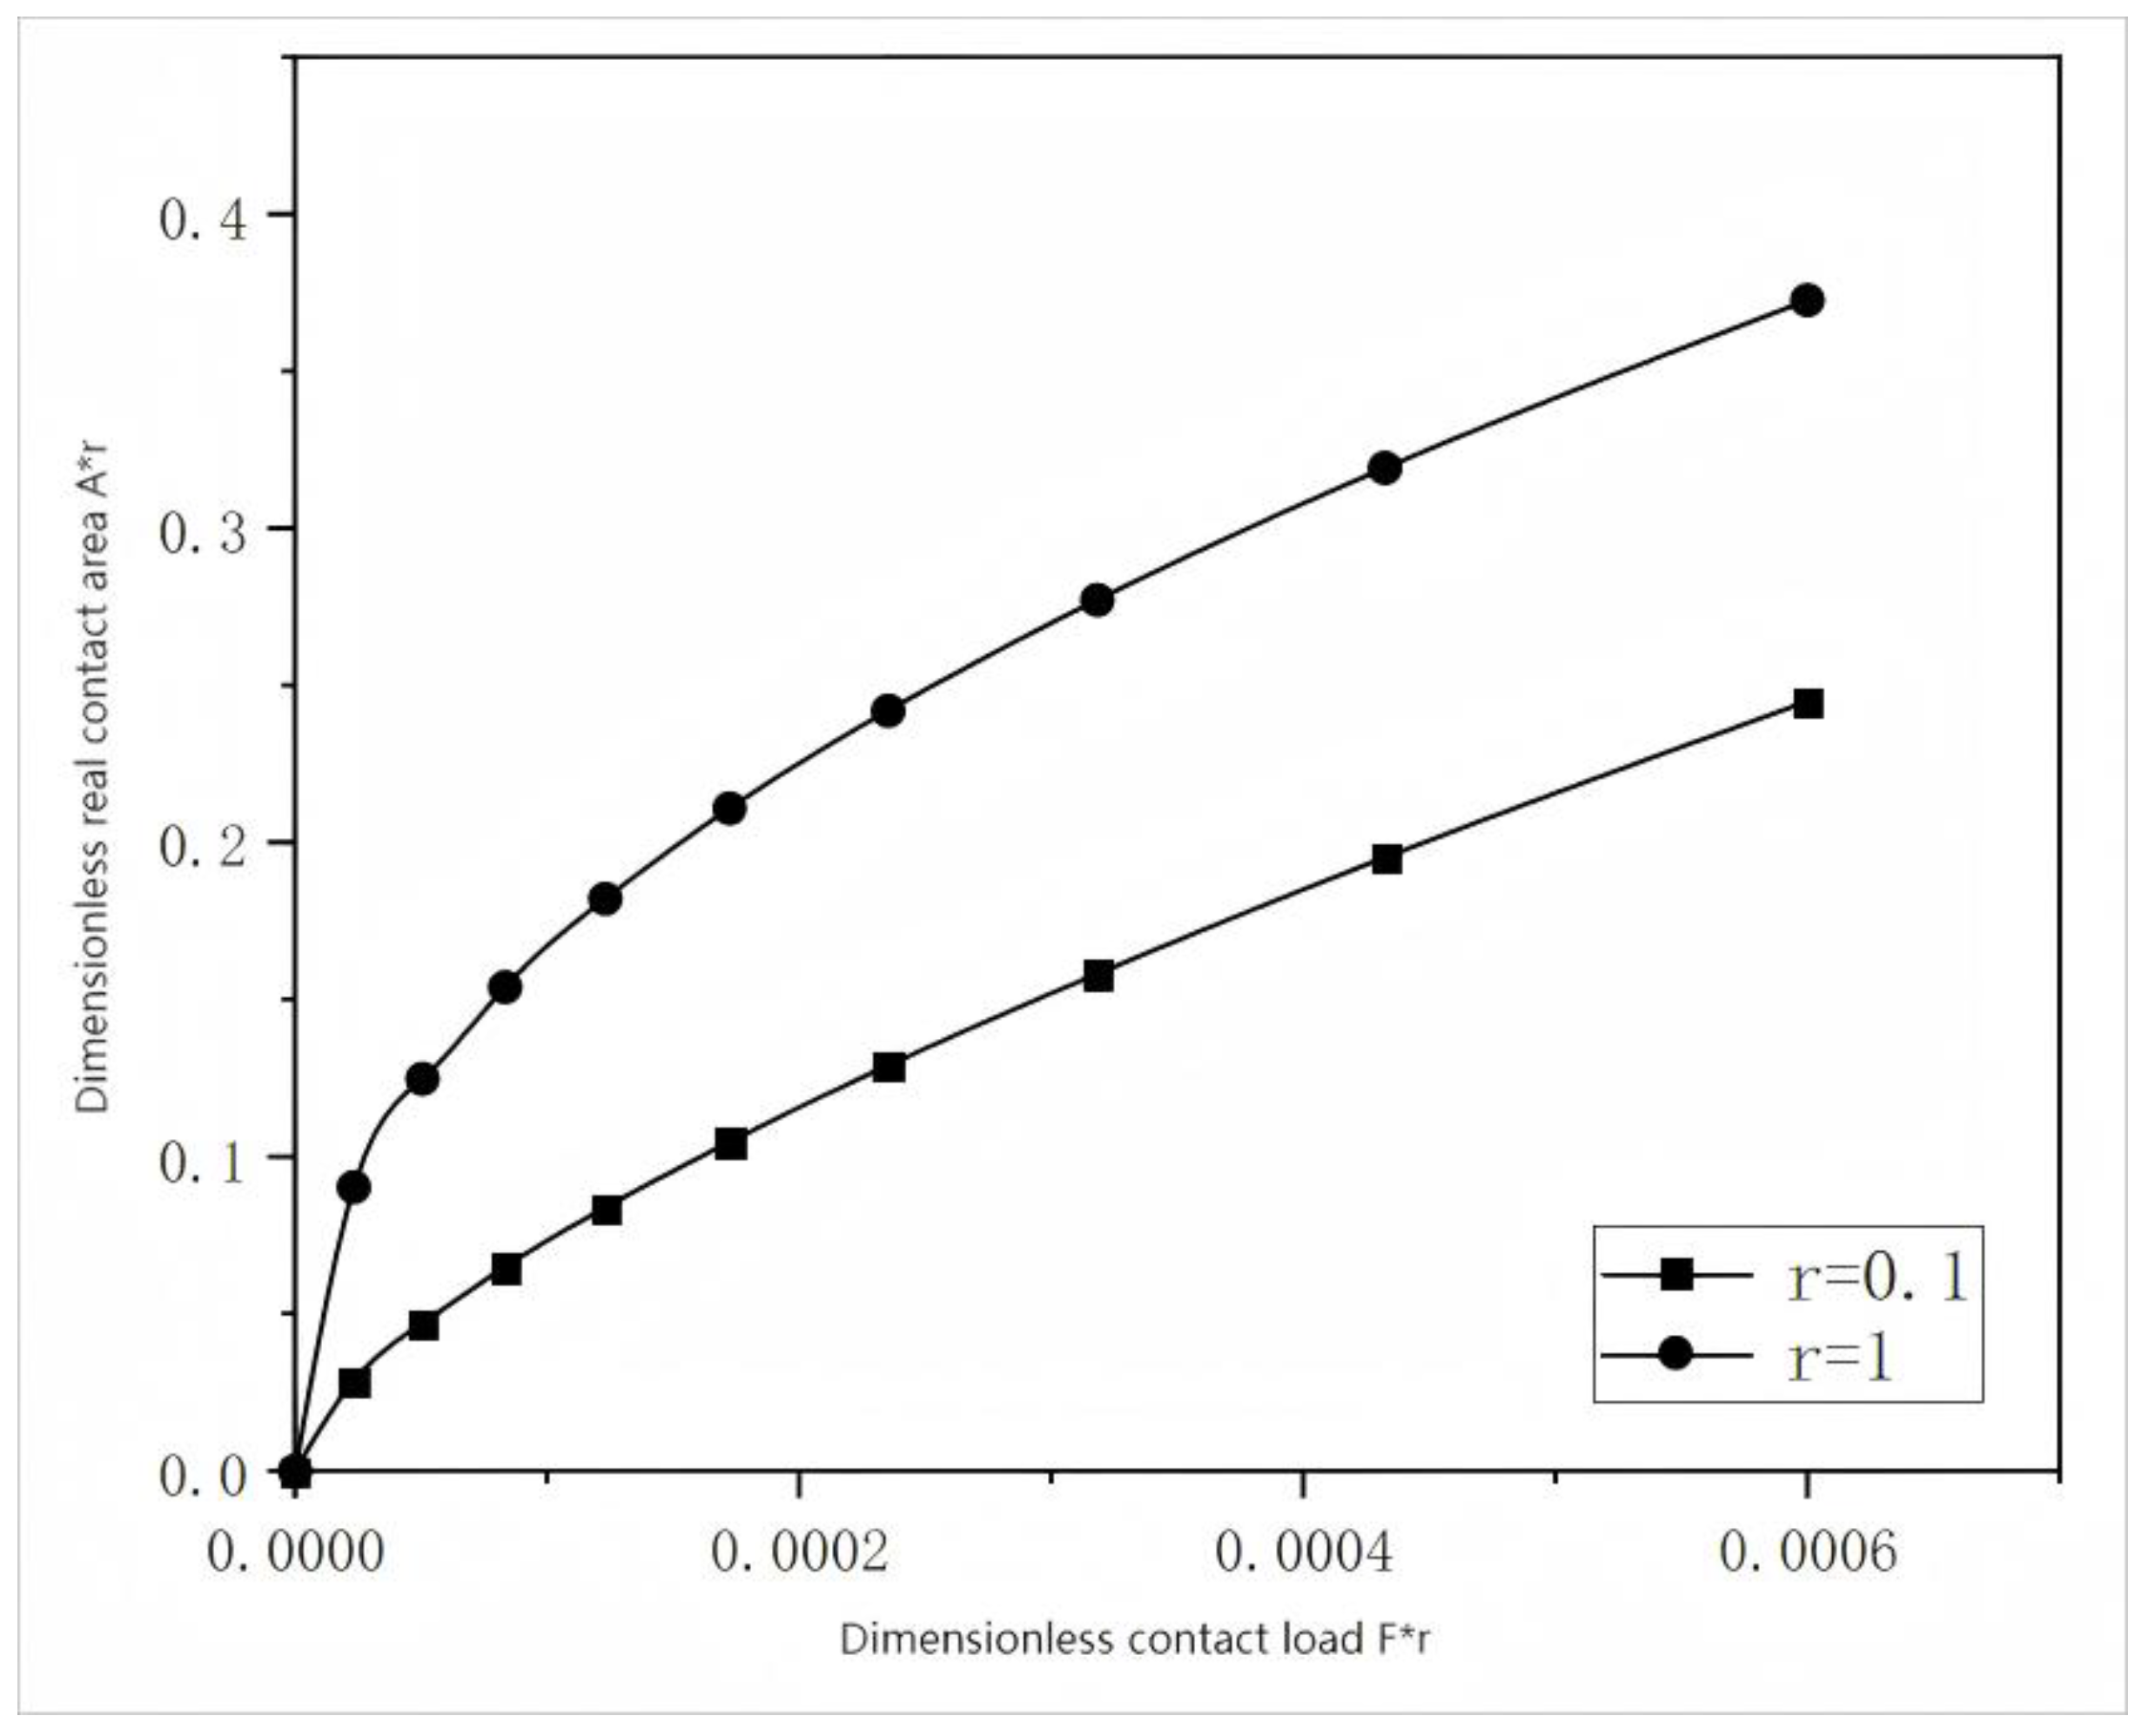
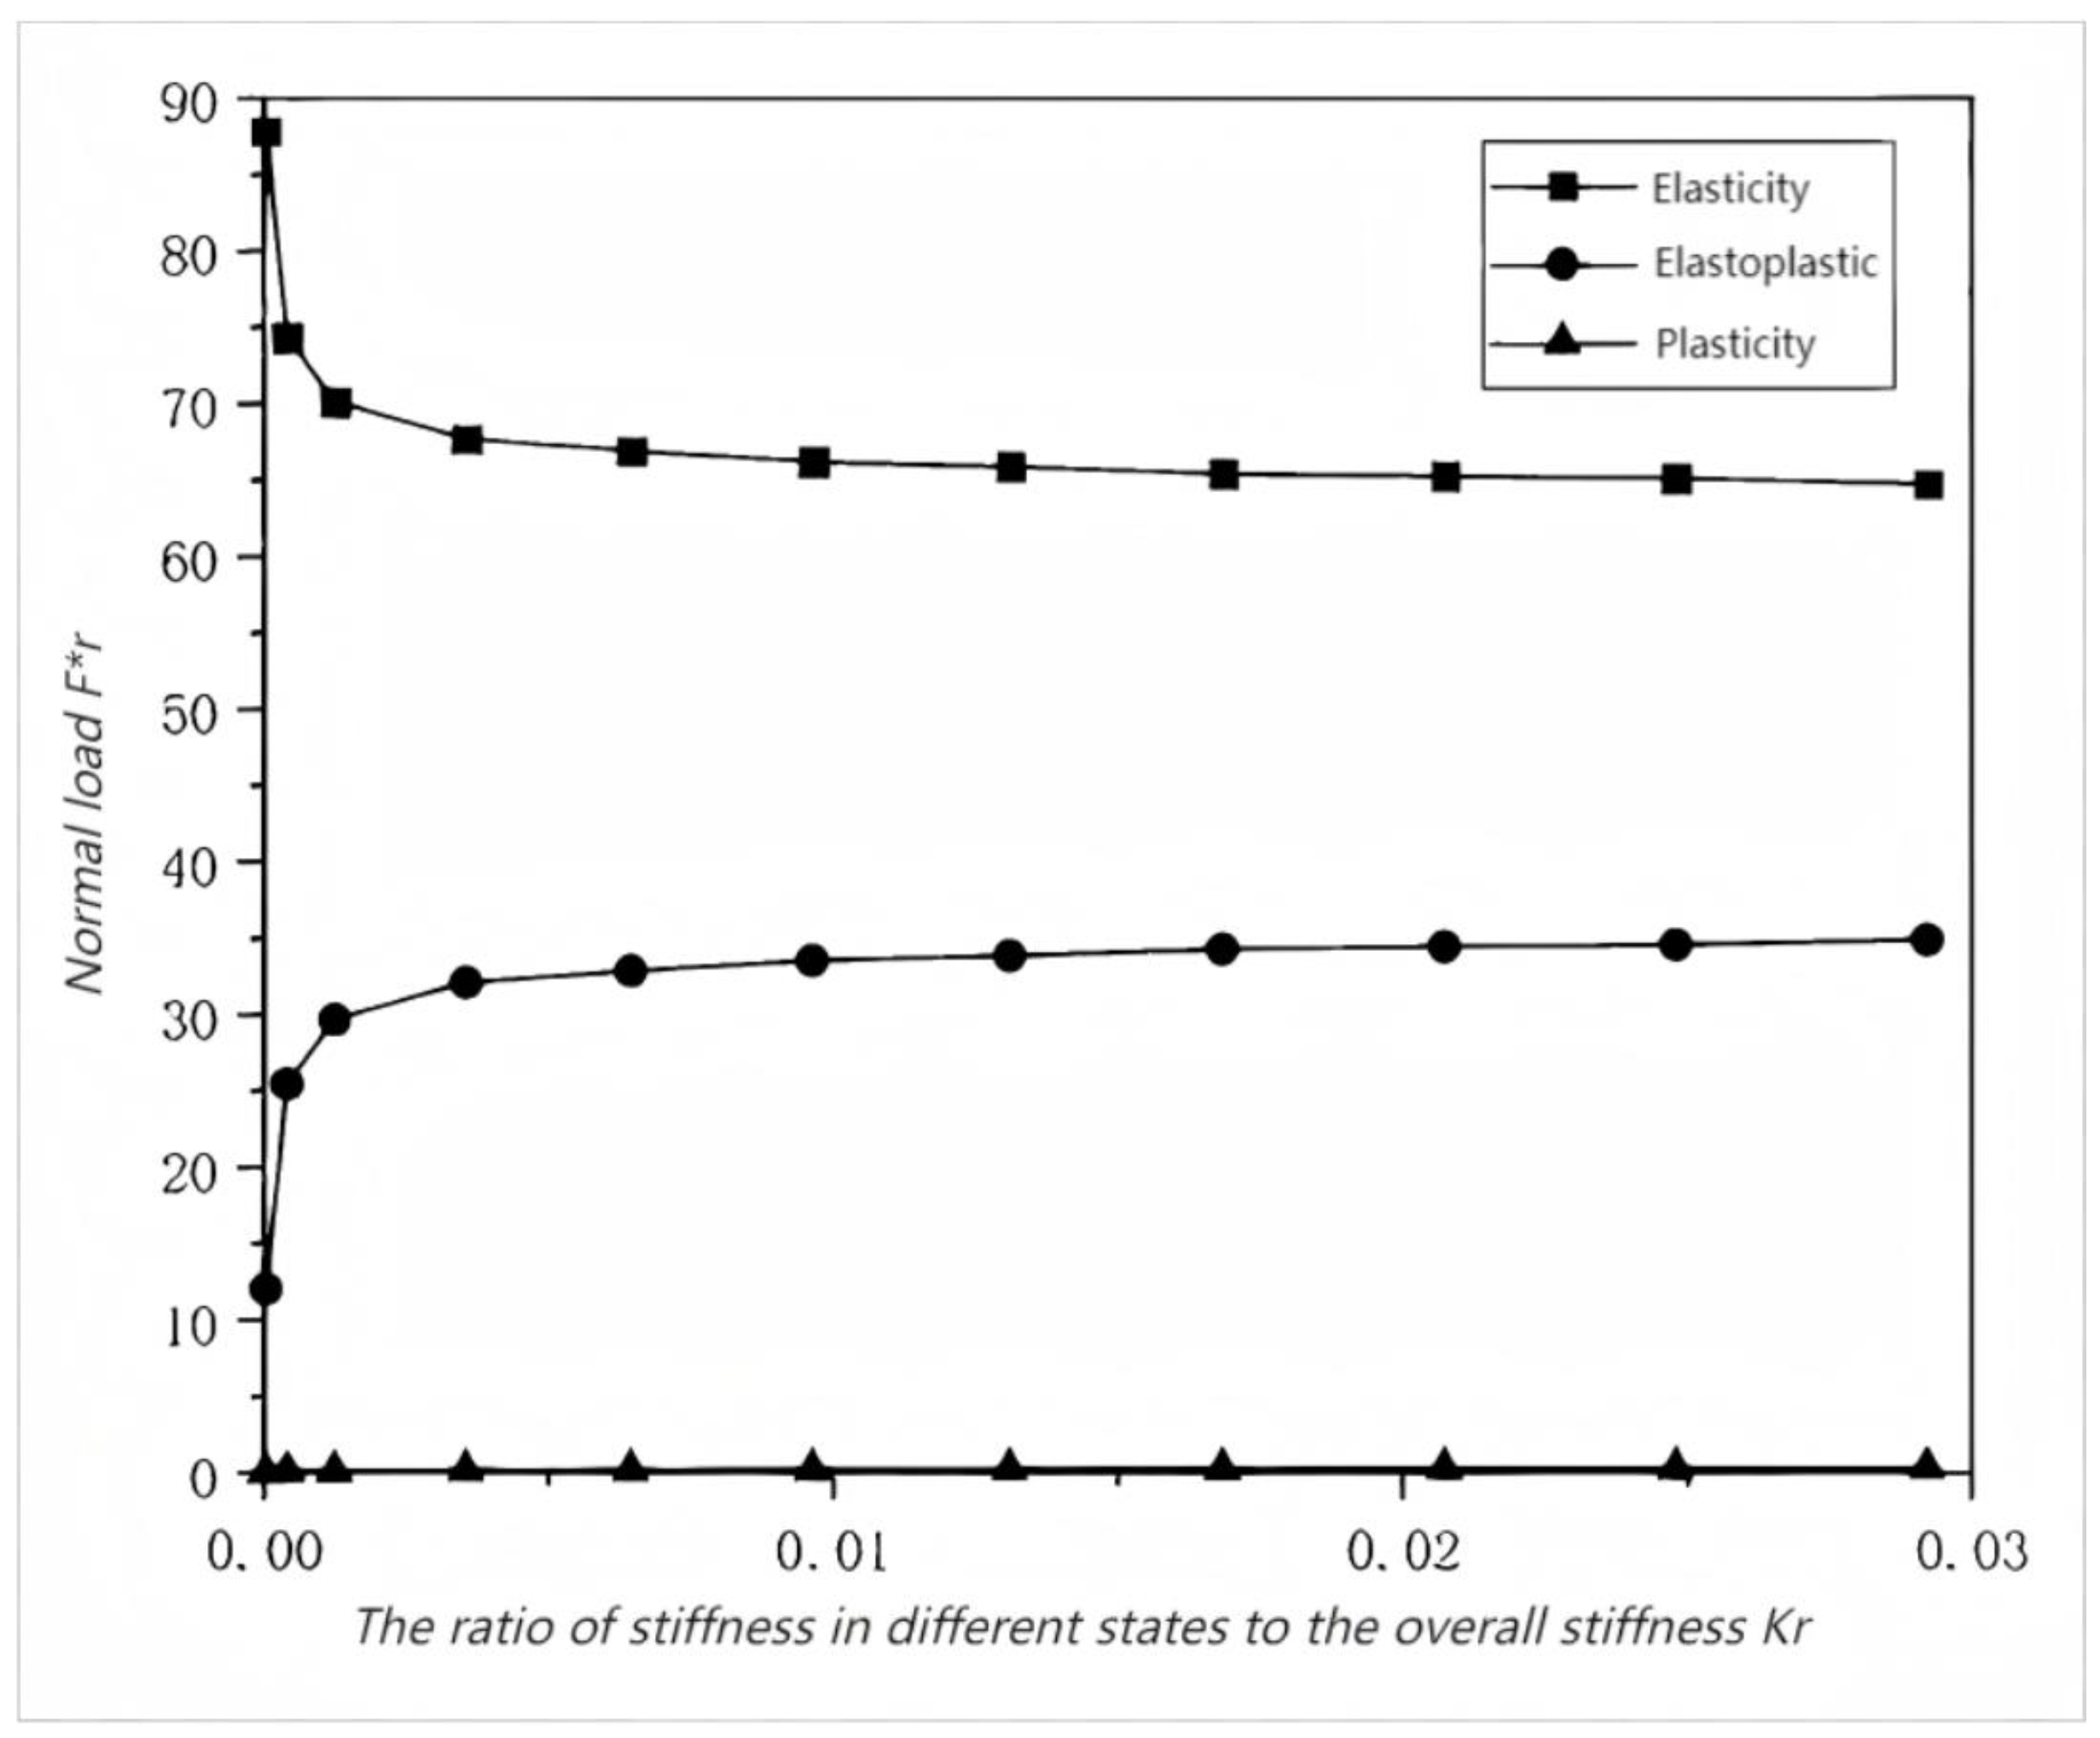
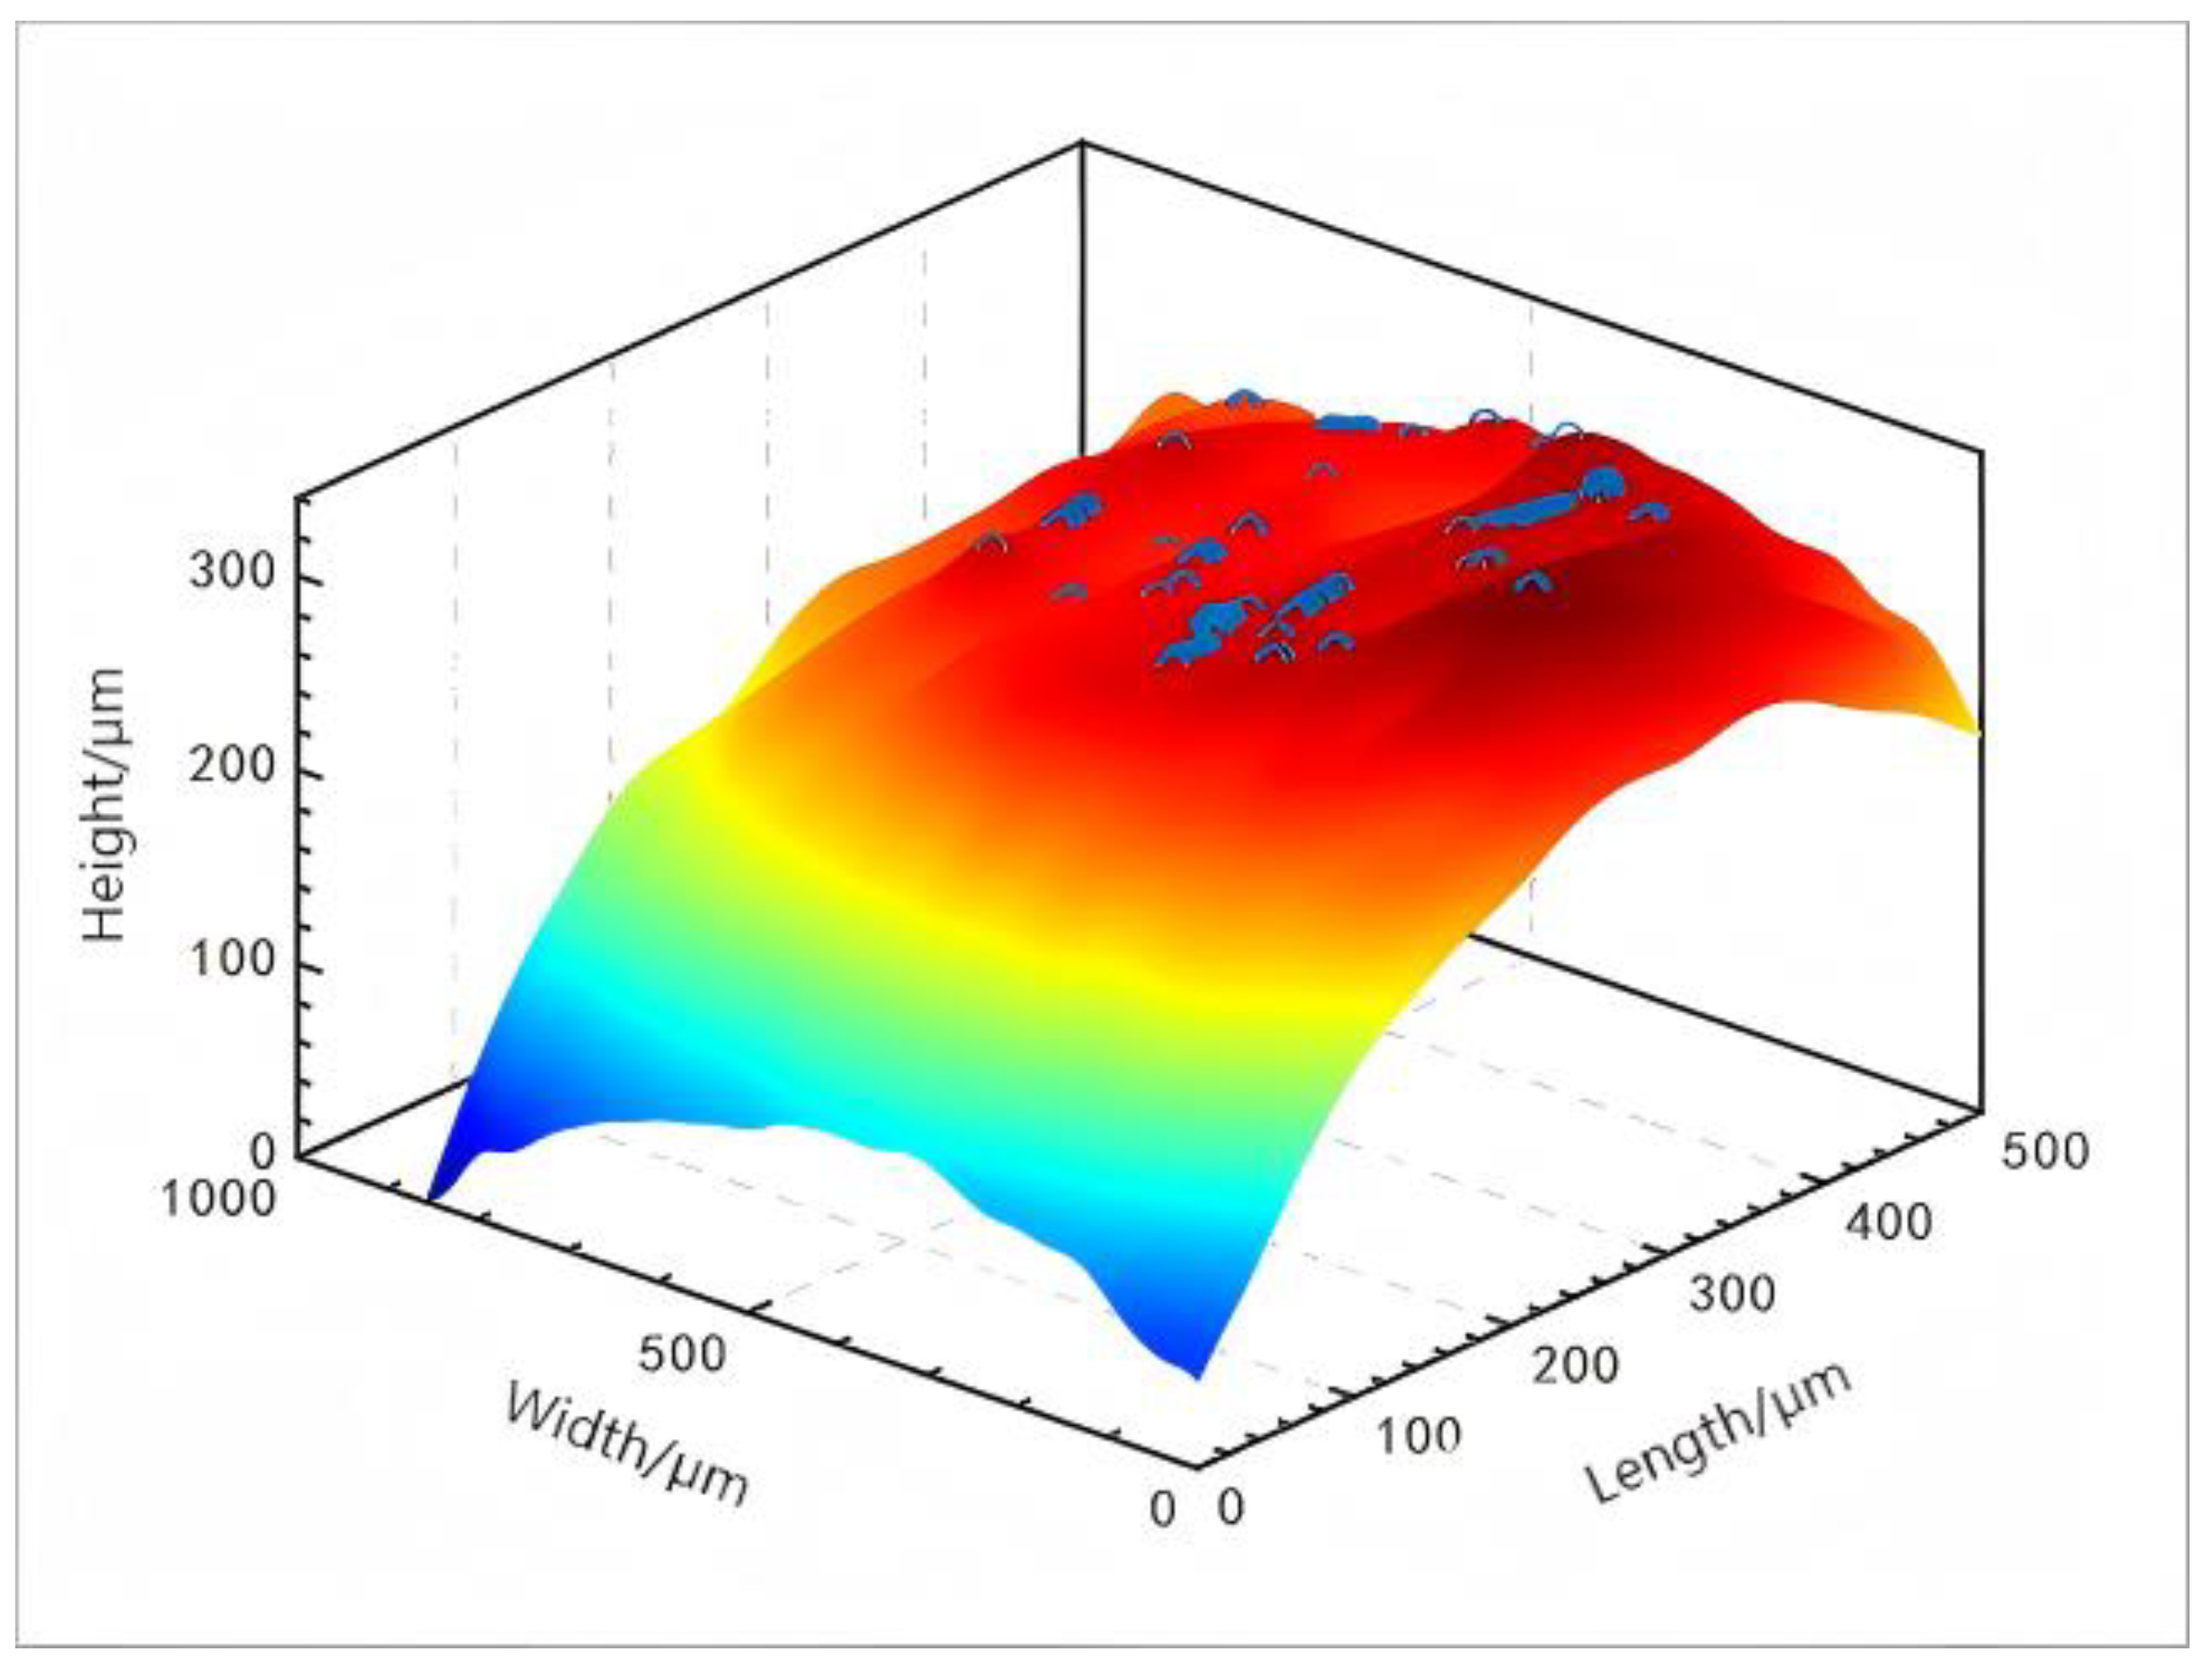
4. Analysis of the Three-Dimensional Micro-Contact Model

Using a non-contact 3D surface analysis system to scan the surface of the contact group, morphological images and point cloud height data are obtained. Extracting the surface micro-morphological characteristics of the contact group at various test stages, a contact model of the contact group is then established. The impact of morphological characteristics on the arc erosion and ablation of the contact group is analyzed, exploring the mechanism of electrical contact failure, providing a theoretical basis for future research on the reliability of switching electrical appliances. The values for the contact model are shown in Table 3.
As shown in Figure 14 and Figure 15, during the contact process of the interface with asperity levels ranging from 10 to 34, the relationship between the normal contact area and the normal load increases in proportion to the deformation as a percentage of the maximum height of the asperities. The dimensionless real contact area is approximately proportional to the 3/2 power of the contact load when the contact load is small, and during a complete contact process, the rough surface is approximately an elastic deformation. The difference in the base radius also affects the size of the contact area. When the base radius increases, the contact area will decrease for the same downward contact pressure relative to the whole, but the normal load in the contact area will increase, making the contact state more stable and improving the reliability of electrical contact.
In Figure 16, at the initial contact of the joint surface, the normal stiffness of the elastic deformation part accounts for 90% of the total normal stiffness, as the contact load increases, the proportion of normal stiffness due to elastic deformation to the total normal stiffness gradually decreases, and when the maximum deformation is reached, this proportion is 65%. Since asperities with a level of 14 to 7 only undergo elastic deformation, the normal contact stiffness of this interface is non-linearly related to the normal load. This theory explains why, under conditions of low contact pressure, most deformations are elastic, and there may even be gaps, which makes it easier for arc breakdown and erosion to occur; accordingly, appropriately increasing the contact pressure can enhance contact stability. At the same time, permanent deformation may occur in areas with a smaller contact surface, leading to easier erosion when environmental temperatures rise. Therefore, the contact surface should be processed to remove any small particles adhering to it as much as possible, to prevent them from becoming areas where ablation growth may occur.
Through the analysis and comparison of the model [28], as the fractal dimension D increases, the surface becomes smoother, and the real contact area of the rough surface is larger under the same contact pressure. When the degree of surface refinement is high or the surface is relatively smooth, as the fractal dimension increases, the critical level also gradually rises, leading to an increase in the number of elastic contact points, which causes the overall normal contact stiffness of the interface to increase, thereby reducing the contact area; to improve contact stability, it is generally necessary to increase the contact area to reduce the contact resistance [29].
Fit the height of the micro-asperities to a normal distribution, compare the morphological characteristics of the micro-asperities, and through a confidence level of 90% confidence interval. Micro-asperity distribution map is shown in Figure 17.

5. Experiments

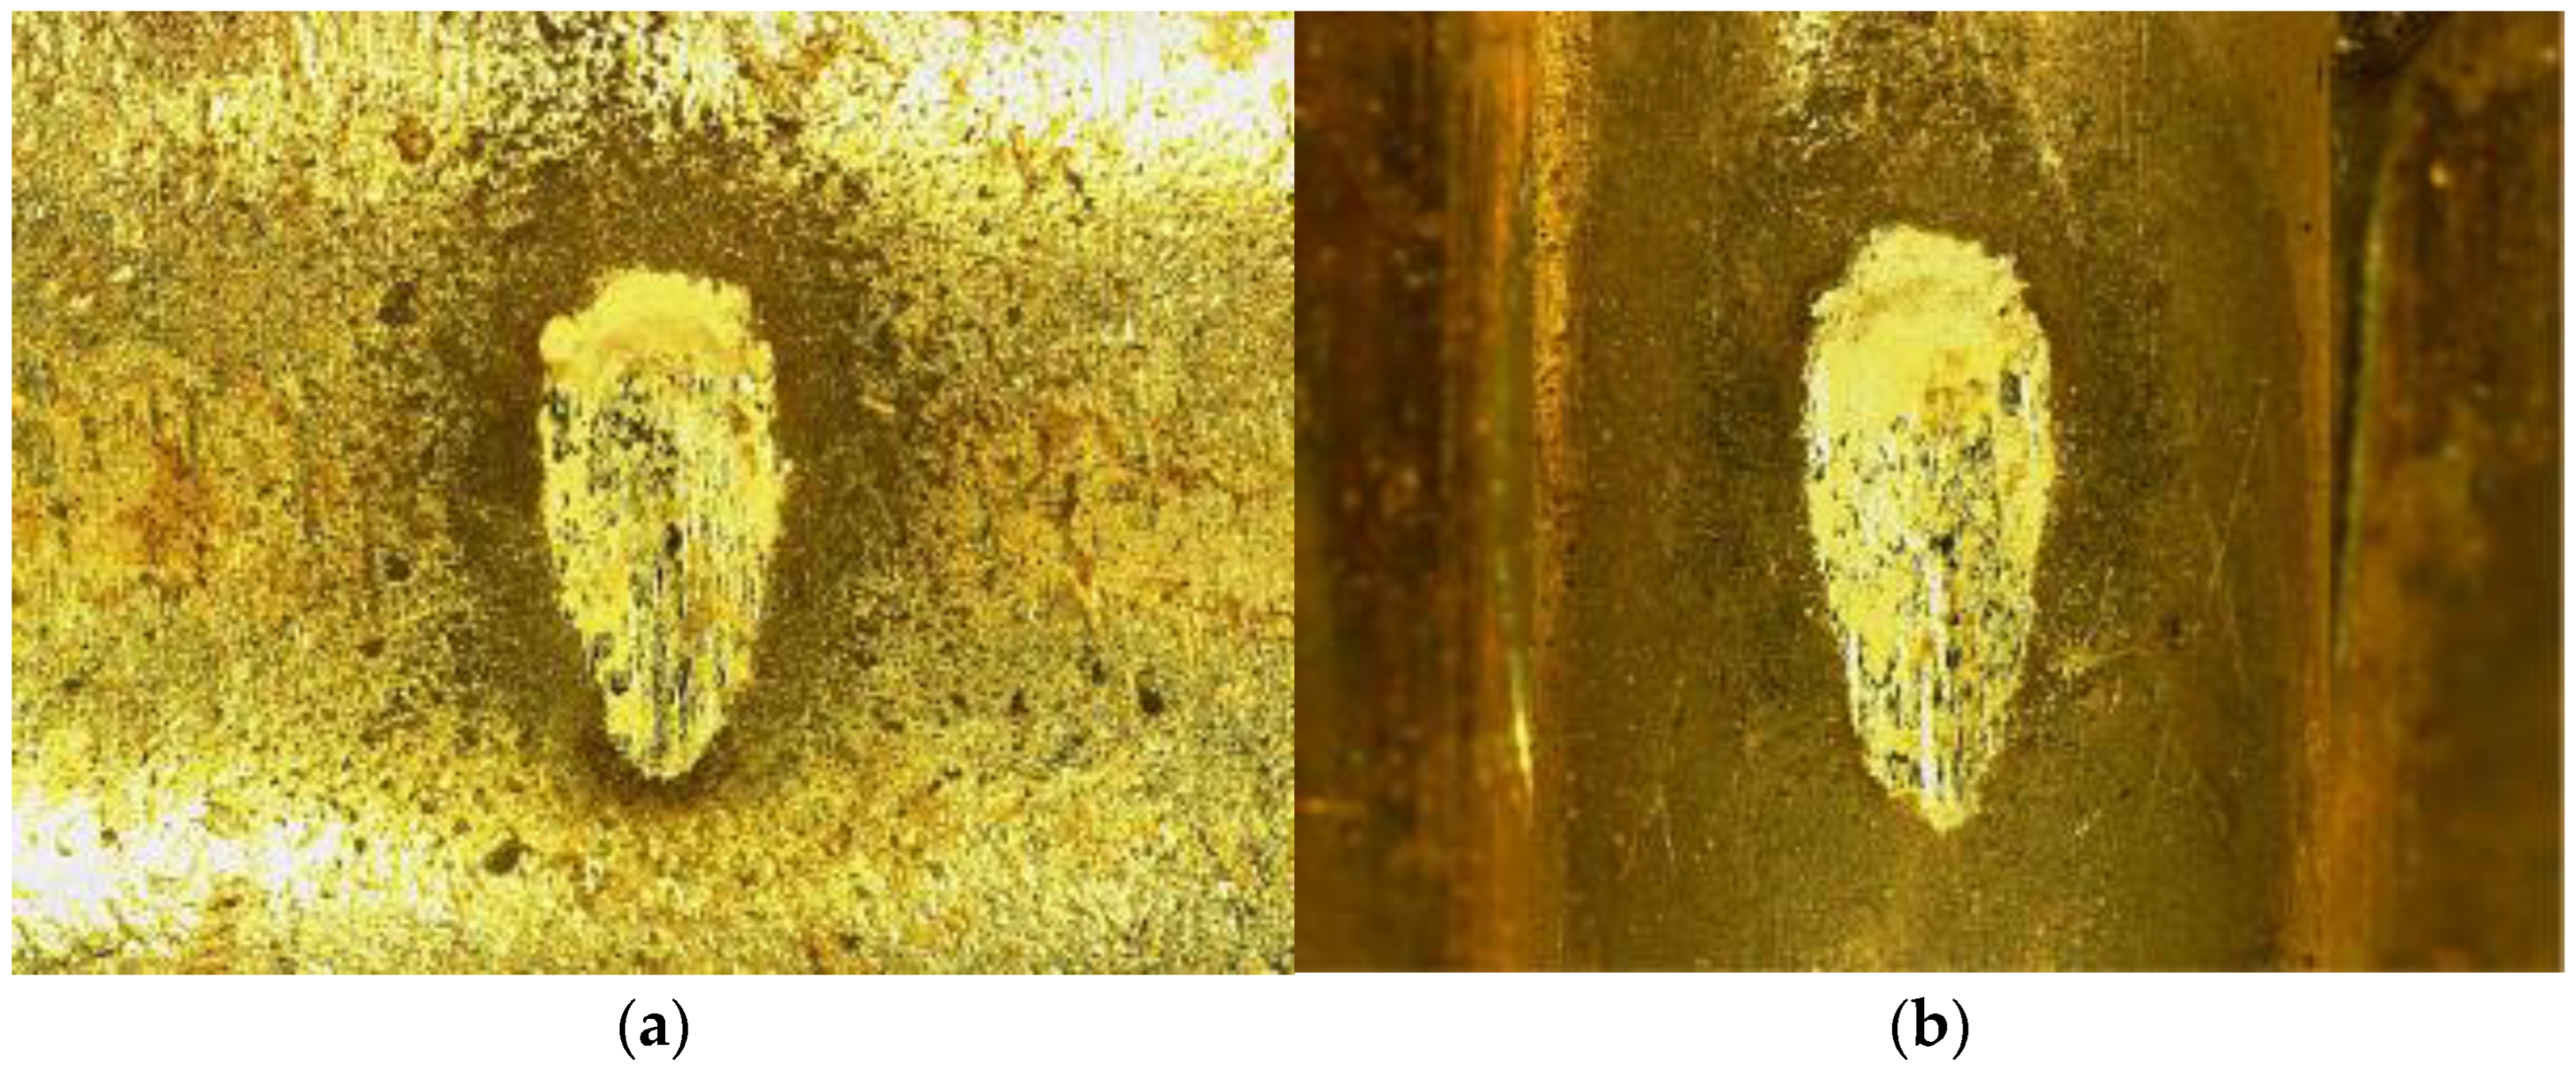
5.1. Sample Introduction

The test samples selected for this article were the railway AX series relays, whose internal structure is shown in Figure 18. The relay consists of a contact system, an electromagnetic module, and auxiliary systems, etc. This model of relay is a commonly used type in the market, and its contact group combination method has a certain degree of universality.
The relay of this model features a dual-winding structure, which is parallel to the core and can be switched between single-winding and dual-winding operation modes based on actual requirements. A stopper is placed between the core and the armature to increase the working magnetic resistance, and a weight piece is connected to the armature to accelerate the circuit breaking. Figure 19 shows the electromagnetic module of the relay. Each contact module of the product includes an middle contact and front and lower contacts, which are sequentially connected to the moving and stationary contacts. Since the load of the stationary contact is the positive electrode, the static contact is the anode, and the moving contact is the cathode. The contacts of the relay are arranged in parallel, and all contacts work simultaneously when the contacts are opened or closed.

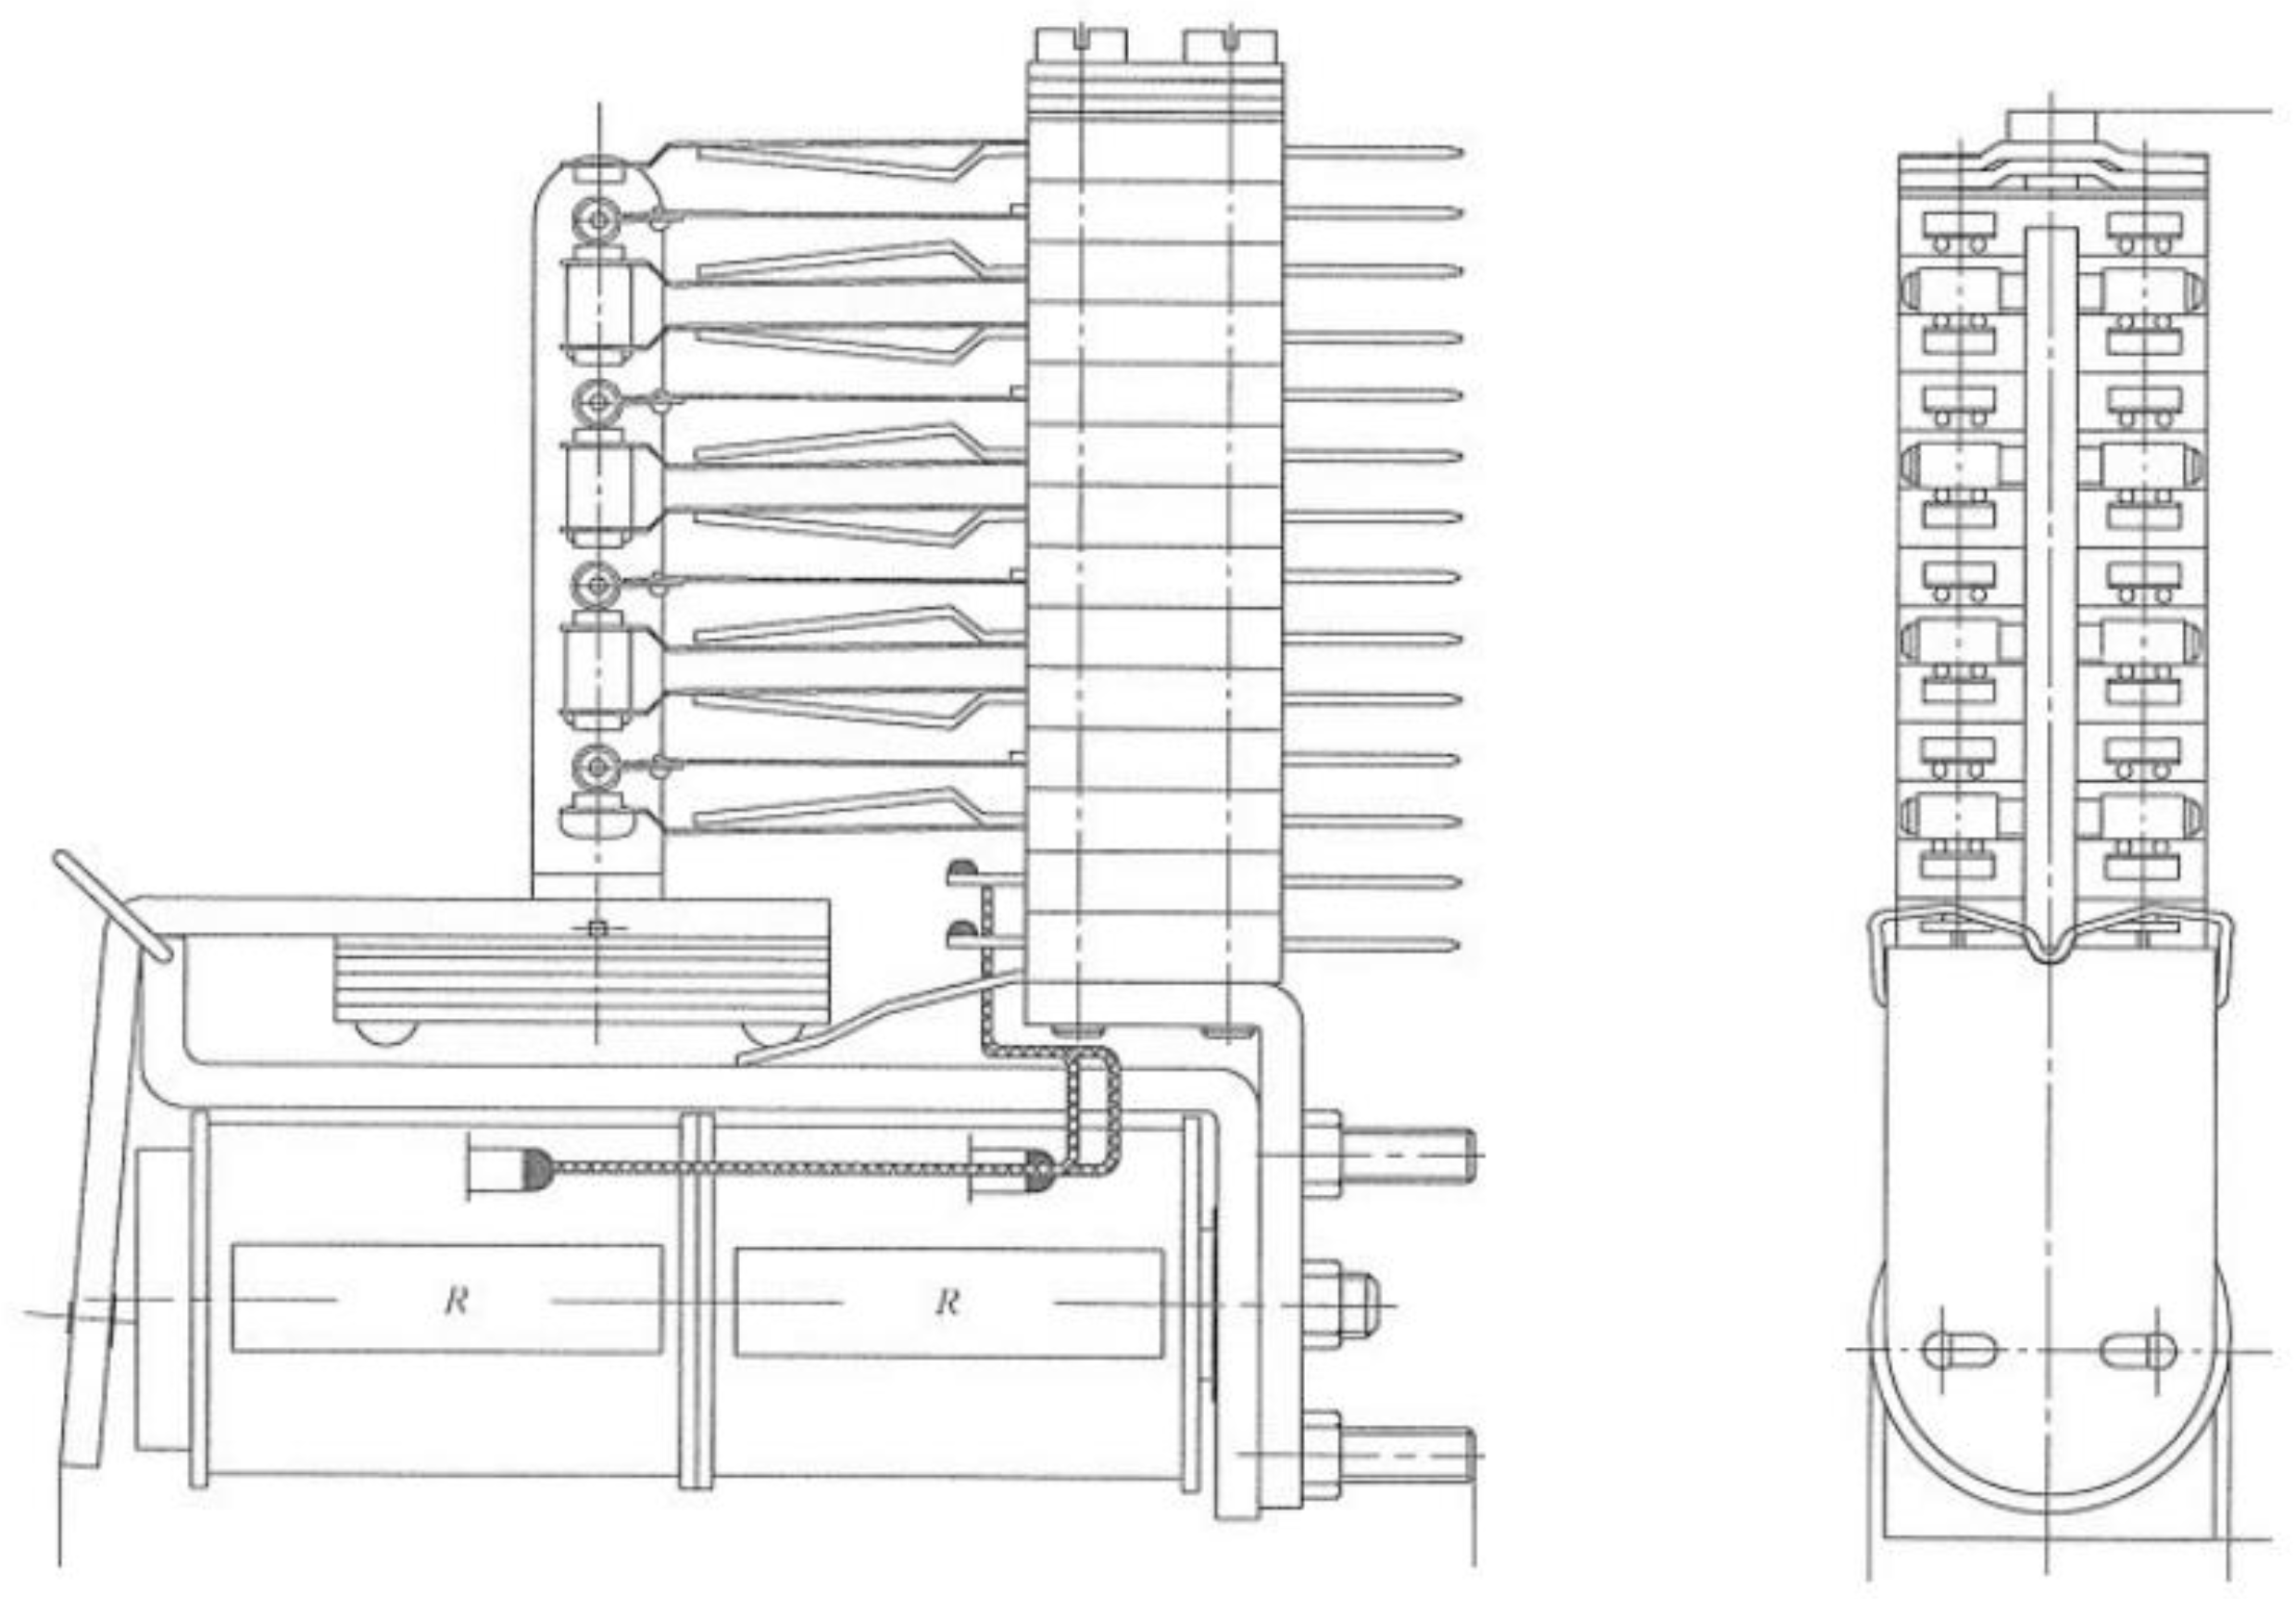
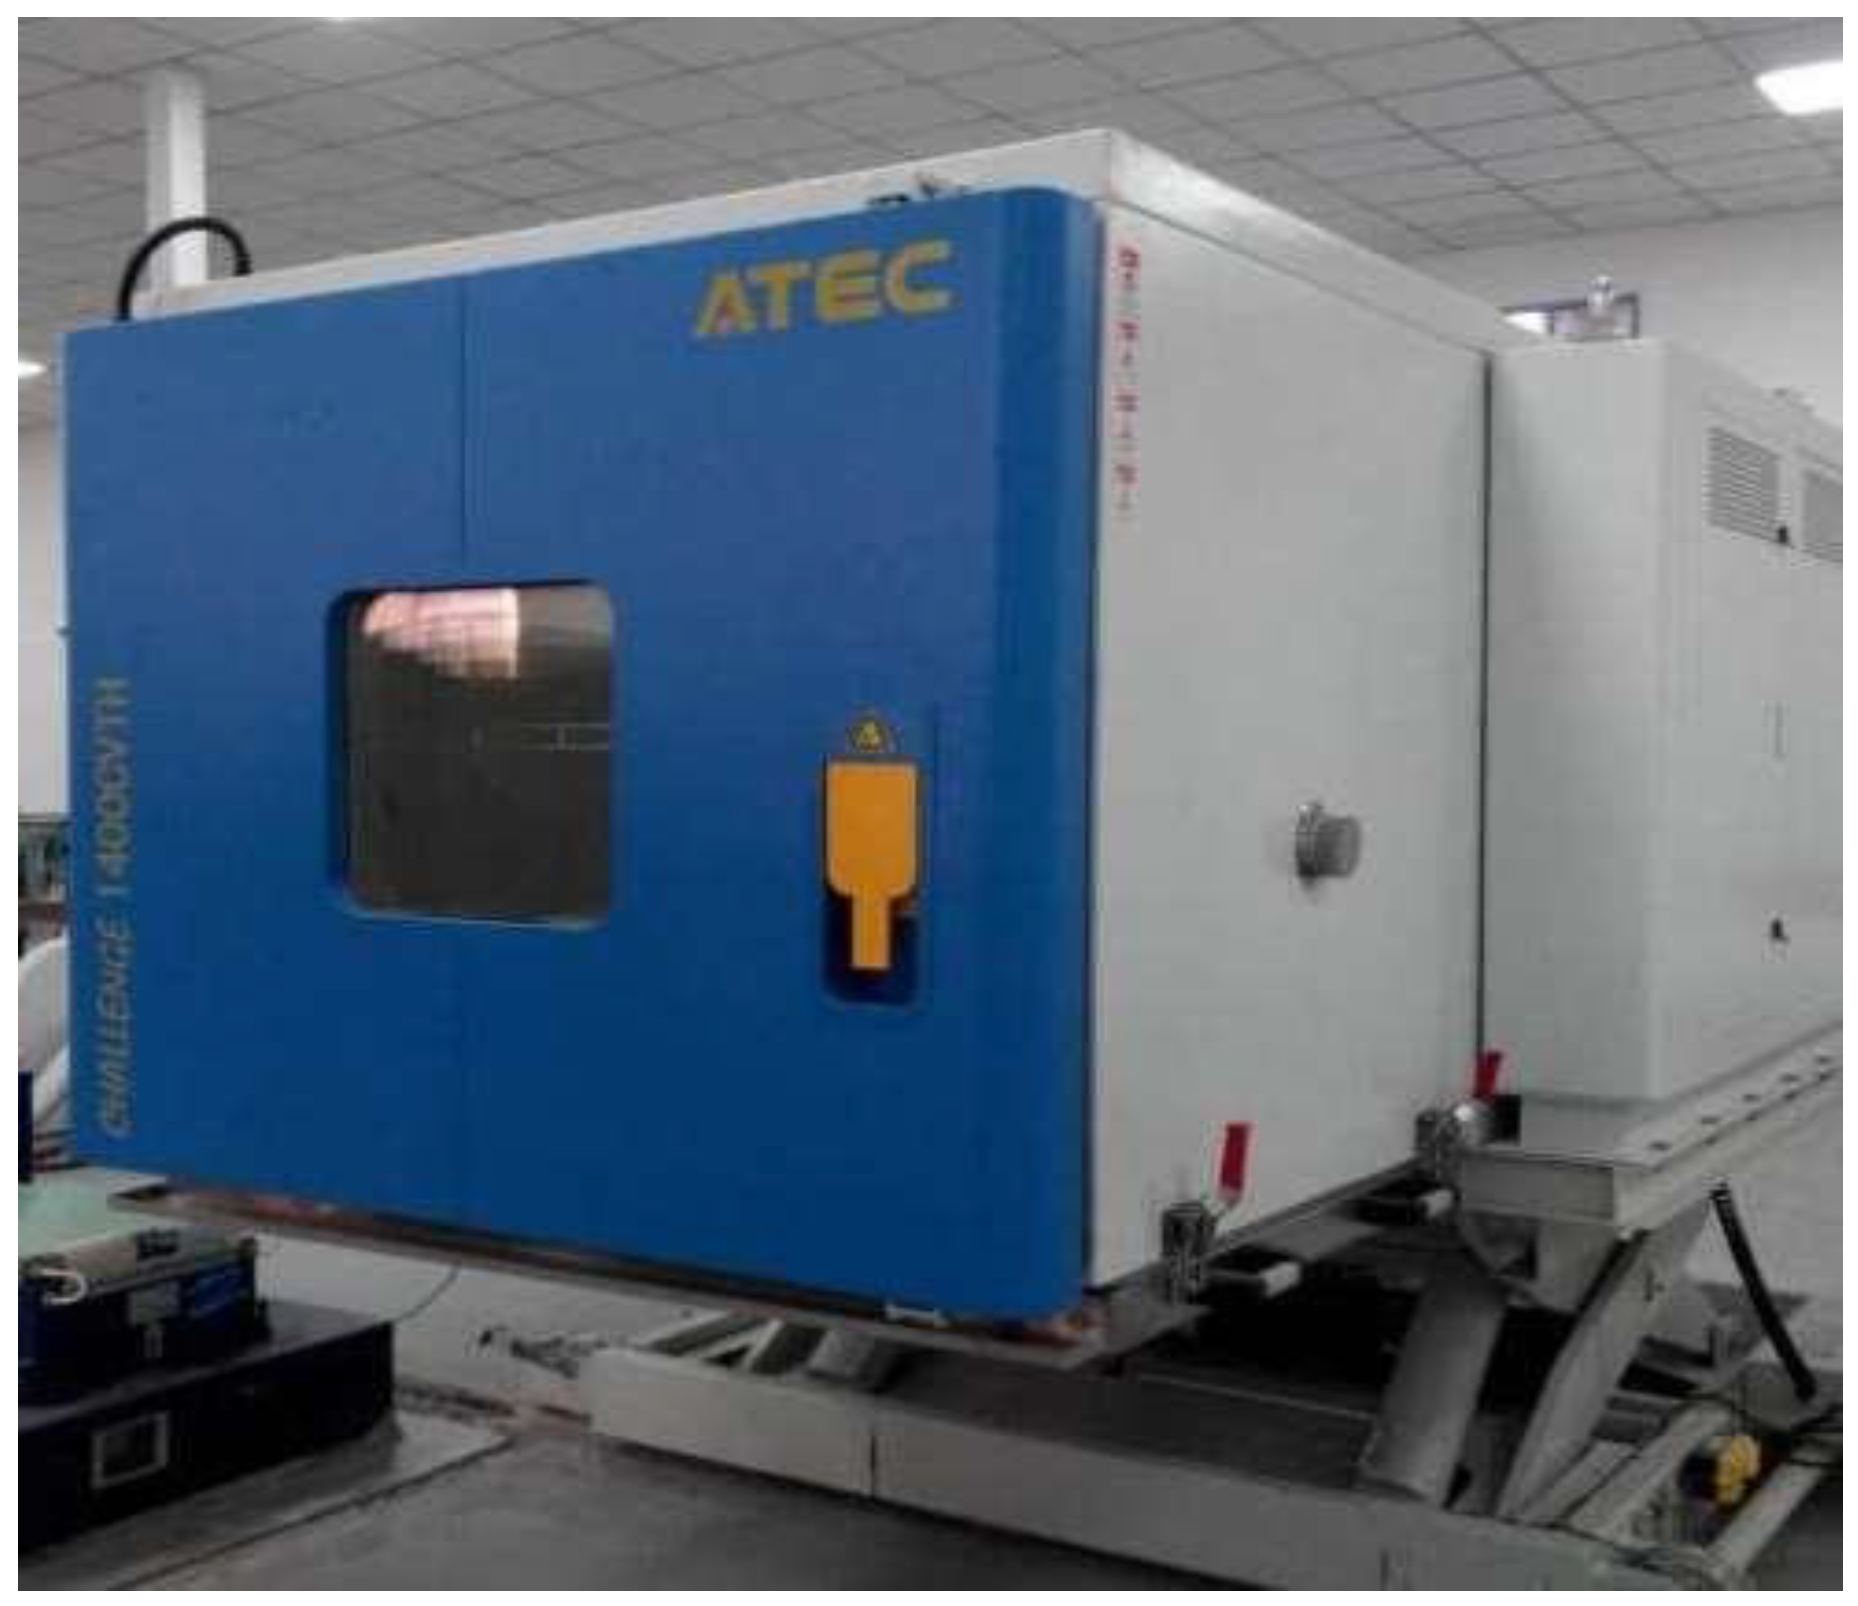
5.2. Experimental Introduction

Electronic products are highly reliable and long-lasting, making it difficult to analyze them with traditional testing methods. Therefore, it is necessary to design accelerated life test plans that can shorten testing time without affecting the failure mechanism. Through experiments, combined with existing research findings, it has been discovered that the contact performance of relays is significantly affected by environmental factors, especially temperature conditions. As the temperature increases, the rate of performance degradation accelerates [30,31]. This experiment is based on the IEC electrical standards, to improve the progress of life testing and consider the requirements for the lowest temperature, sets T1 to 40 °C. Since the relay structure contains a large number of plastic components, its maximum operating temperature is 90 °C, so testing should be conducted at 90 °C. Therefore, the temperature stress level is set to 4, with the values of two temperature stresses calculated using the Arrhenius Equations (35) and (36). Two intermediate temperatures can be calculated as 49 °C and 64 °C.
T j = 1 / T 1 + j 1 1   ,   j = 2,3 , . . . , n 1
= 1 / T n 1 / T 1 / n 1
This experiment features 8 workstations, with each relay having 4 sets of contacts connected to power and 4 sets not connected. The experiment is conducted at selected temperature stress levels, and inspection and replacement are carried out after each round of testing. At a temperature stress of T1 (40 °C), the test cycle is 200,000 times. After the test, a relay is sequentially removed from the test station to measure its electrical and mechanical performance, followed by the use of a non-contact 3D analysis system to detect and record the surface morphology data of the contacts. In the subsequent test, the vacant workstation is replaced with a standard new relay. The 8 relays at the start of the experiment undergo 8 rounds of testing, completing a total of 1.6 million cycles of operation. The disassemble and replacement of test samples are carried out in the above cycle sequence until truncated failure. At temperature stresses of T2 (49 °C), T3 (65 °C), and T4 (90 °C), the test cycles are set at 150,000 times, 100,000 times, and 50,000 times respectively, with the relay testing and replacement method after each test cycle being consistent with that at a temperature stress of T1 (40 °C).
In order to achieve controllability of the external and internal environments during the experimental process, a temperature and humidity controlled environmental test chamber is used, as shown in Figure 20. This device is commonly used for the study of performance degradation in electronic products, offering high reliability and stable simulation of atmospheric environments.
In this paper, the test sample is the relay contacts after accelerated life testing, with the contact action frequency set to 3 times per second, and the product life is 2 million times. The test conditions are shown in Table 4.

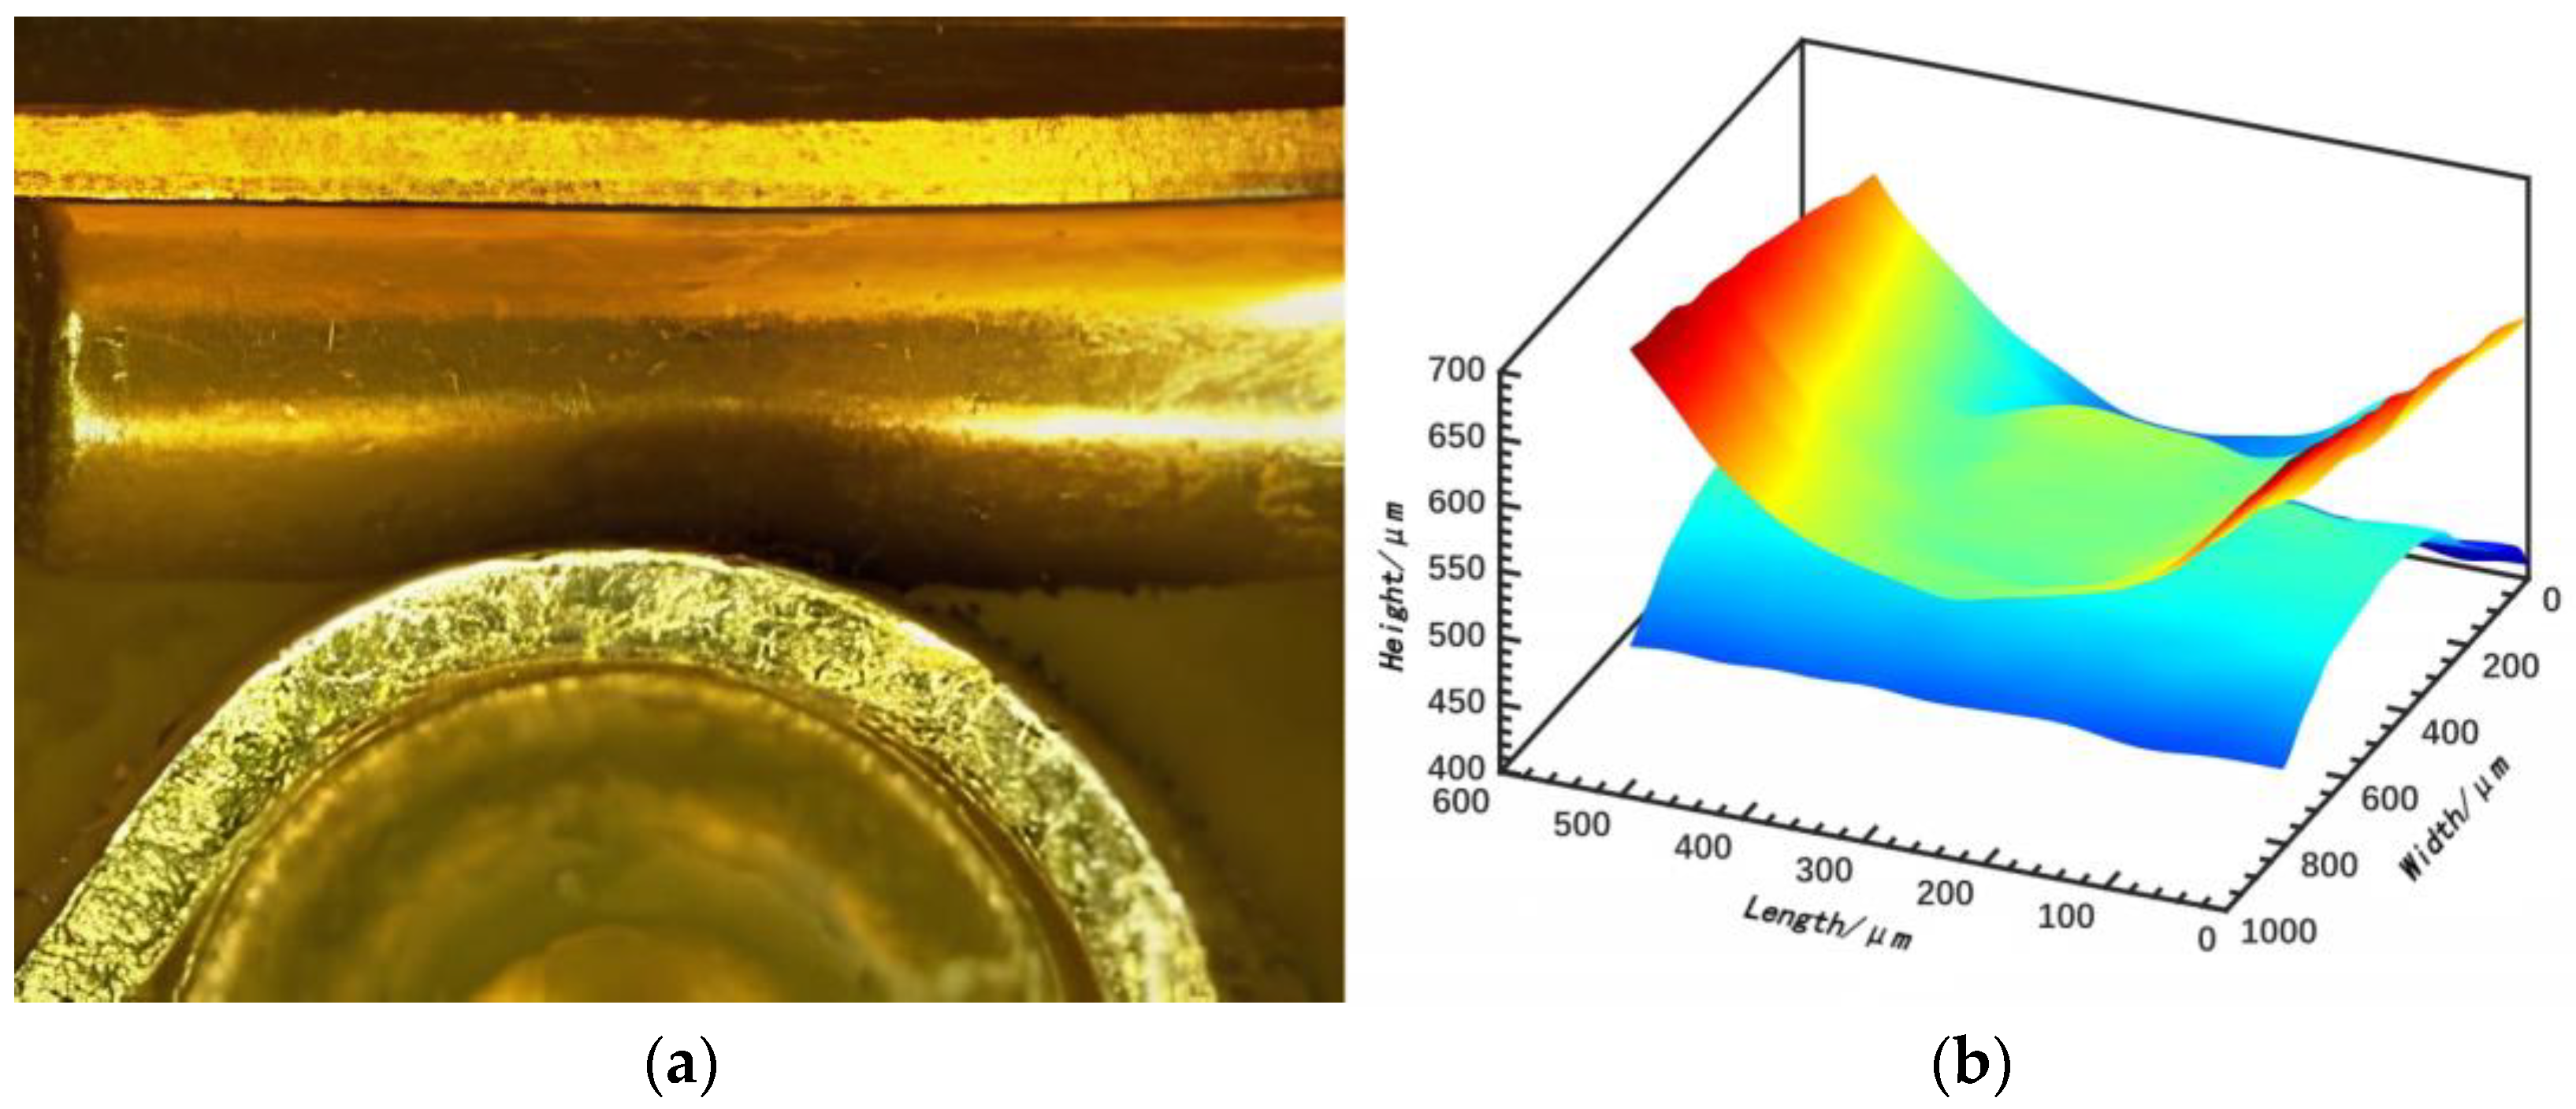
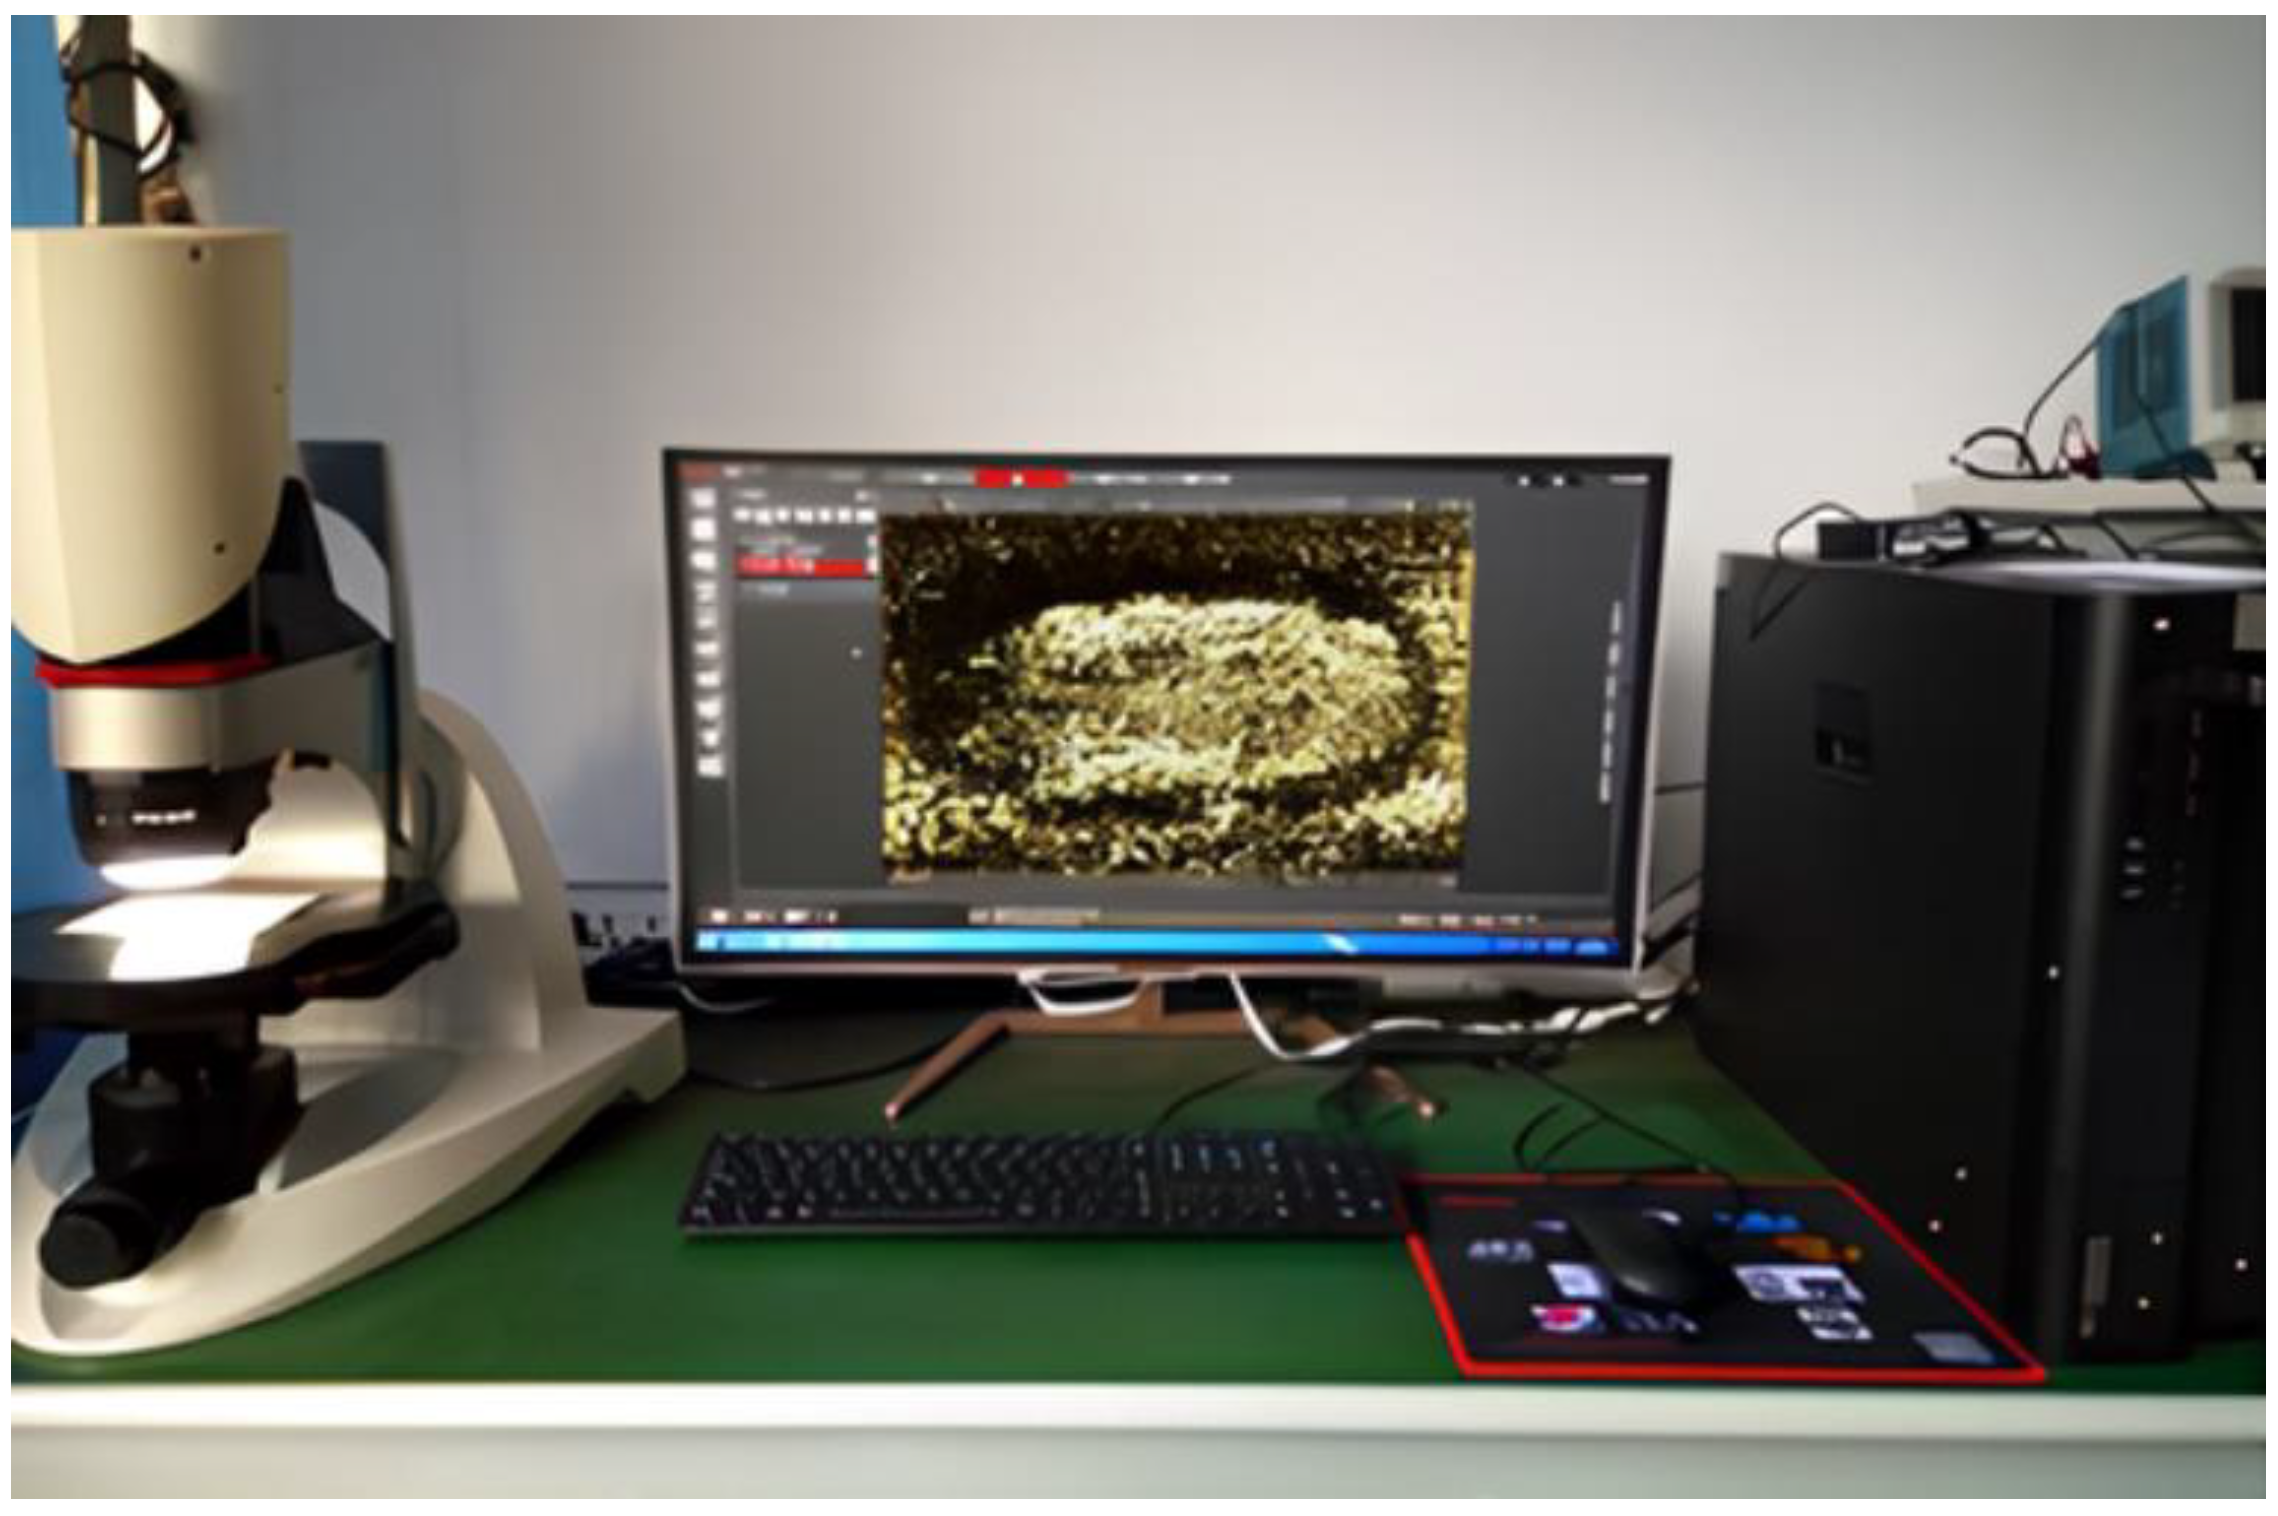
5.3. Non-Contact 3D Profilometry System Introduction

This article employed a non-contact 3D analysis system to obtain surface 3D height data and surface micro-morphology data. Table 5 shows the technical parameters of the digital microscope reference for the 3D analysis system, and Figure 21 is the physical image of the non-contact 3D analysis system used in this article.
The optical analysis system devices include various devices of digital microscopes and some image sensors. Linear array image sensors can be used to measure surface profiles, while area array image sensors can be used to measure regional surface structures, where the spacing and width of the sensor pixels are important characteristic parameters that determine the spatial resolution of the instrument. The PC end is connected to the processing part of the three-dimensional analysis system, which includes an image analysis system and an image processing system.

6. Discussion

The feature-matching method based on entropy rate superpixel seeds and adaptive morphological reconstruction (AMR) proposed in this paper has shown significant advantages in experiments. Compared with traditional superpixel segmentation methods, its segmentation accuracy has been improved, and the phenomenon of over-segmentation has been reduced. This improvement is mainly due to the adaptive filtering capability of the AMR method for invalid seed points. By combining the LOG (Laplacian of Gaussian) operator to extract contour features, AMR can effectively distinguish meaningful areas in the surface morphology (such as ablation marks, scratches) from noise. For example, when there is complex light reflection on the contact group surface, traditional methods are prone to over-segmentation due to noise interference, while AMR reduces the impact of uneven lighting on image segmentation through multi-scale Gaussian functions and morphological reconstruction operations. In addition, the entropy rate-based balance function ensures the consistency of the size of the segmented areas, thereby further enhancing the robustness of feature extraction. The AMR method exhibits stronger adaptability when dealing with non-uniform surfaces (such as local ablation areas). In the reconstruction of ablation areas, the AMR method successfully preserves the details of the ablation edges, while traditional methods result in detail loss due to over-reliance on fixed threshold segmentation. However, the computational complexity of AMR is relatively high, and efficiency issues may arise when processing large-scale point cloud data. Future research can further enhance its practical application value by optimizing iterative algorithms or introducing parallel computing.
The three-dimensional fractal contact model based on the W-M function proposed in this paper has shown improvements in predicting contact area and estimating contact resistance over existing models, thanks to an in-depth understanding of the multi-scale features and deformation mechanisms of micro-asperities. Compared to traditional statistical models, such as the GW model, the fractal model avoids the impact of measurement instrument accuracy on surface morphology characterization by introducing scale parameters, such as fractal dimension and characteristic scale. Furthermore, the model incorporates the elastic, elastoplastic, and fully plastic deformation mechanisms of micro-asperities, enabling a more realistic simulation of the non-linear mechanical processes during actual contact.
Experimental data indicate that at a fractal dimension of 2.5, the contact area exhibits an approximate 3/2 power law relationship with the load, which is consistent with the predictions of the classical Hertz theory under elastic contact conditions. However, at higher loads, the model predicts a slower increase in contact area, reflecting the impact of elastoplastic deformation on the contact process. Additionally, the introduction of the substrate curvature (as shown in Equation (16)) significantly enhances the model’s applicability to actual contact groups, such as arc-shaped contacts. For instance, as the substrate curvature radius increases, the contact area decreases under the same load, but the contact stability improves. This conclusion aligns with the engineering practice of “increasing contact pressure to reduce arc erosion” in the design of railway relay contacts.

7. Conclusions

(1)
This paper proposes a method for adaptive morphological feature extraction based on entropy rate superpixel seed points, combined with an adaptive morphological reconstruction (AMR) method using LOG features. It can adaptively filter out useless seed points while preserving meaningful seed points, achieving the extraction of surface micro-morphological features of contact groups.
(2)
This paper proposes a combined surface normal contact stiffness fractal model, which is compared with data from other literature models to verify its correctness. The model’s features include correcting the W-M model based on point cloud data, characterizing the distribution of micro-asperities using an island distribution function, and incorporating three contact deformation mechanisms of micro-asperities: elastic, elastoplastic, and fully plastic. It also considers the anisotropy of rough surfaces, making the model more closely aligned with the actual contact process of the contact point group.
(3)
This article analyzes the contact deformation process of the model, explores the properties of micro-asperity deformation, and its impact on the actual contact area, providing a theoretical basis for the correlation analysis between the surface micro-morphological characteristics of contact groups and the electrical contact performance of switching electrical appliances.
(4)
The content of this article requires further study. Subsequent work can integrate more morphological feature parameters and consider the effect of surface films to establish a more comprehensive and accurate contact model.

Author Contributions

Conceptualization, W.L. and J.S.; methodology, P.Z.; validation, P.Z. and Z.H.; formal analysis, J.S., P.Z., X.M. and Z.H.; investigation, J.S. and P.Z.; resources, D.C. and J.C.; data curation, J.S.; writing—original draft, J.S.; writing—review and editing, W.L.; supervision, W.L. and H.W.; project administration, J.S.; funding acquisition, W.L. All authors have read and agreed to the published version of the manuscript.

Funding

This research was funded by the Key Research and Development Program of Shijiazhuang Universities in Hebei (241130161A), the Innovative Research Group Project of the Natural Science Foundation of Hebei Province (E20202142), and the Hebei Province Graduate Innovation Funding Project (CXZZSS2024012).

Institutional Review Board Statement

Not applicable.

Informed Consent Statement

Not applicable.

Data Availability Statement

The data presented in this study are available upon request from the corresponding author due to confidentiality restrictions.

Conflicts of Interest

Author Defeng Cui was employed by the Guilin Electrical Equipment Scientific Research Institute Co., Ltd. Jiyuan Cai was employed by the China Railway Shenyang Group Co., Ltd. The remaining author declare that the research was conducted in the absence of any commercial or financial relationships that could be construed as a potential conflict of interest.

References

  1. Wang, H.T.; Liu, W.; Yang, M.L.; Zhu, Y.C. Effect of Particle Size of Second Phase on Wettability and Electrical Contact Properties of AgSnO2 Contact Materials. Rare Met. Mater. Eng. 2022, 51, 24–29. [Google Scholar]
  2. Li, Z.; Wang, Z.B.; Liu, B.X.; Qiao, Q.Y.; Chen, K.N. Research on failure degradation evaluation of electromagnetic relay contact material under resistive loads. Univ. Sci. Technol. 2023, 37, 66–72. [Google Scholar]
  3. Chen, Z.; Liu, Y.; Zhou, P. A comparative study of fractal dimension calculation methods for rough surface profiles. Chaos Solitons Fractals 2018, 112, 24–30. [Google Scholar] [CrossRef]
  4. Zhou, L.; Lu, T.C.; Zhang, B.; Yu, G.K.; Wan, J.W. Multi-Physics Coupling Analysis of Rough Surfaces Using 3D Fractal Model. Trans. China Electrotech. Soc. 2015, 30, 226–232. [Google Scholar]
  5. ISO 25178-2:2021; Geometrical Product Specifications (GPS)—Surface Texture: Areal—Part 2: Terms, Definitions and Surface Texture Parameters. International Standard Organization: London, UK, 2021.
  6. Ghaednia, H.; Wang, X.; Saha, S.; Xu, Y.; Sharma, A.; Jackson, R.L. A review of elastic-plastic contact mechanics. Appl. Mech. Rev. 2017, 69, 60804. [Google Scholar] [CrossRef]
  7. Li, Z.T.; Wang, S.J.; Han, Z.R.; Wei, J.J.; Zhao, J.J.; Li, P.Y. Modeling of Tangential Stiffness of Mechanical Joint Surface Using lmproved Fractal Theory and Continuous Deformation Theory. Xi’an Jiaotong Univ. 2020, 54, 107–114. [Google Scholar]
  8. Han, Z.R. Research on the Contact Characteristics of Anisotropic Joint Surface Using the Contact Coefficient of Ellipsoid. Master’s Thesis, Xi’an University of technology, Xi’an, China, 2021. [Google Scholar]
  9. Yuan, Y.; Cheng, Y.; Liu, K.; Gan, L. A revised Majumdar and Bushan model of elastoplastic contact between rough surfaces. Appl. Surf. Sci. 2017, 425, 1138–1157. [Google Scholar] [CrossRef]
  10. Stanislaw, K.; Grzegorz, S. Study of contact of rough surfaces: Modeling and experiment. Wear 2014, 311, 167–179. [Google Scholar]
  11. Peta, K.; Stemp, W.J.; Chen, R.; Love, G.; Brown, C.A. Multiscale characterizations of topographic measurements on lithic materials and microwear using a GelSight Max: Investigating potential archaeological applications. J. Archaeol. Sci. Rep. 2024, 57, 104637. [Google Scholar] [CrossRef]
  12. Chen, J.; Liu, D.; Wang, C.L.; Zhang, W.Y.; Zhu, L.B. A fractal contact model of rough surfaces considering detailed multi-scale effects. Tribol. Int. 2022, 176, 107920. [Google Scholar] [CrossRef]
  13. Li, L.L.; Ma, D.J.; Li, Z.G. Chaotic Predication of Dynamic Contact Resistance Times Series on Contacts. Trans. China Electrotech. Soc. 2014, 29, 187–193. [Google Scholar]
  14. Zhao, Z.Y. Factors Affecting Contact Resistance Change of Railway Signal Relay. Railw. Signal. Commun. Eng. 2020, 17, 13–18. [Google Scholar]
  15. Li, W.; Li, Q.; Zhao, Z.; Pan, R.; Lu, W. Contact Spots Analysis of Sealed Relay Contact Pair Based on Contact Difference-Plane. IEEJ Trans. Electr. Electron. Eng. 2021, 16, 355–363. [Google Scholar] [CrossRef]
  16. Wang, S.H.; Yuan, W.K.; Liang, X.M.; Wang, G.F. A new analytical model for the flattening of Gaussian rough surfaces. Eur. J. Mech./A Solids 2022, 94, 104578. [Google Scholar] [CrossRef]
  17. Chu, N.R.; Jackson, R.L.; Wang, X.Z.; Gangopadhyay, A.; Ghaednia, H. Evaluating Elastic-Plastic Wavy and Spherical Asperity-Based Statistical and Multi-Scale Rough Surface Contact Models with Deterministic Results. Materials 2021, 14, 3864. [Google Scholar] [CrossRef]
  18. Ta, W.; Zhao, H.; Zhang, X.Y.; Gao, Y.W.; Zhou, Y.H. Rough contact surface reconstruction based on A mechanicalthermal contact model. Tribol. Int. 2023, 177, 107977. [Google Scholar] [CrossRef]
  19. Ejaz, F.; Kang, M.; Son, J.; Kim, J.S.; Lee, D.S.; Kwon, B. A two-dimensional finite element model for Cu-CNT composite: The impact of interface resistances on electrical and thermal transports. Materialia 2022, 24, 101505. [Google Scholar] [CrossRef]
  20. Chen, W.K.; Jin, W.Y.; Cao, H. Finite element analysis of indentation contact of double piezoelectric spheres. Mater. Today Commun. 2021, 11, 102775. [Google Scholar] [CrossRef]
  21. Xu, S.J.; Zhou, Y.X.; Meng, Y.B.; Liu, G.H.; Shi, Y. Image segmentation based on higher-order MRF model with multi-node topological overlap measure. Acta Autom. Sin. 2020, 41, 1–16. [Google Scholar]
  22. Song, Y.T.; Ji, Z.X.; Sun, Q.S. Brain MR Image Segmentation Algorithm Based on Markov Random Field with Image Patch. Acta Autom. Sin. 2014, 40, 1754–1763. [Google Scholar]
  23. Zhang, Z.L.; Li, A.H.; Li, C.W. Superpixel Segmentation Based on Clustering by Finding Density Peaks. Chin. J. Comput. 2020, 43, 1–15. [Google Scholar]
  24. Li, W.H.; Zhao, P.D.; Wang, J.Q. A Three-Dimensional Roughness Characterization Method for the Morphology of the Ablation Area of Silver Wire Type Contacts. China Patent CN113344823B, 5 October 2022. [Google Scholar]
  25. Lideberg, T. Feature detection with automatic scale selection. Int. J. Comput. Vis. 1998, 30, 79–116. [Google Scholar] [CrossRef]
  26. Ciavarella, M.; Greenwood, J.A.; Paggi, M. Inclusion of “interaction” in the greenwood and williamson contact theory. Wear 2008, 265, 729–734. [Google Scholar] [CrossRef]
  27. Ta, W.R.; Qiu, S.M.; Wang, Y.L.; Yuan, J.Y.; Gao, Y.W.; Zhou, Y.H. Volumetric contact theory to electrical contact between random rough surfaces. Tribol. Int. 2021, 160, 107007. [Google Scholar] [CrossRef]
  28. Fu, S.; Cao, Y.D.; Li, J. Simulation of forming process of Vacuum Metal vapor arc in Contact Separation moment. Trans. China Electrotech. Soc. 2020, 35, 2922–2931. [Google Scholar]
  29. Chen, J.J. Study on the Contact Property of Rough Surface During Loading-Unloading Process. Master’s Thesis, Xi’an University of Technology, Xi’an, China, 2018. [Google Scholar]
  30. Wu, Q.; Xu, G.F.; Yuan, M.; Wu, C.P. Influence of operation numbers on arc erosion of Ag/CuO electrical contact material. J. Mater. Sci. Mater. Electron. 2020, 31, 2497–2513. [Google Scholar] [CrossRef]
  31. Zhang, Y.; Wang, J.Q.; Kang, H.L.; Hu, D.L. Simulation and Experiment of Metal-Doped AgSnO2 Contact Material. Trans. China Electrotech. Soc. 2021, 36, 1587–1595. [Google Scholar]
Figure 1. Contact group image: (a) visual image; (b) three-dimensional reconstruction image (the color range from blue to red in this image indicates a change in surface height from low to high).
Applsci 15 02842 g001
Figure 2. Normalized intensity contact group morphology mirror image: (a) moving contact; (b) static contact.
Applsci 15 02842 g002
Figure 3. Contact group gradient direction degree image: (a) moving contact; (b) static contact.
Applsci 15 02842 g003
Figure 4. Segmentation of contact group morphological images using superpixel entropy rate with different clustering numbers: (a) clustering number is 500; (b) pseudo color effect, where clustering number is 500; (c) clustering number is 100; (d) pseudo color effect, where clustering number is 100.
Applsci 15 02842 g004
Figure 5. The result of AMR: (a) AMR segmentation, where n = 3; (b) AMR segmentation, where n = 4.
Applsci 15 02842 g005
Figure 6. ARM feature recognition flowchart based on LOG features.
Applsci 15 02842 g006
Figure 7. Contact group feature-matching diagrams: (a) static contact image; (b) moving contact image; (c) mixed image.
Applsci 15 02842 g007
Figure 8. Differential plane diagram (the color range from blue to red in this image indicates a change in surface height from low to high).
Applsci 15 02842 g008
Figure 9. 3D fractal contact model diagram (blue represents moving contact points, while white represents stationary contact points).
Applsci 15 02842 g009
Figure 10. Base curved surface 3D model diagram (the color range from blue to yellow in this image indicates a change in surface height from low to high).
Applsci 15 02842 g010
Figure 11. Schematic diagram of multi-frequency micro−asperities synthesis: (a) f = 1; (b) f = 2; (c) f = 3; (d) f = 28.
Applsci 15 02842 g011aApplsci 15 02842 g011b
Figure 12. Schematic diagram of the fractal model base.
Applsci 15 02842 g012
Figure 13. Schematic diagram of the micro-asperity deformation process.
Applsci 15 02842 g013
Figure 14. Normal total stiffness and normal load (this figure cited references [16,17]).
Applsci 15 02842 g014
Figure 15. Contact area and normal load.
Applsci 15 02842 g015
Figure 16. The ratio of normal load to total normal stiffness.
Applsci 15 02842 g016
Figure 17. Micro-asperity distribution map (the color range from blue to yellow in this image indicates a change in surface height from low to high).
Applsci 15 02842 g017
Figure 18. Relay design module schematic diagram.
Applsci 15 02842 g018
Figure 19. Relay electromagnetic module structure diagram.
Applsci 15 02842 g019
Figure 20. Environmental test box.
Applsci 15 02842 g020
Figure 21. The 3D non-contact analysis system.
Applsci 15 02842 g021
Table 1. Surface morphology map of the contact.
Contact MorphologyReconstructed Morphology
Unablated area (local)Applsci 15 02842 i001Applsci 15 02842 i002
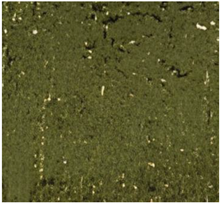
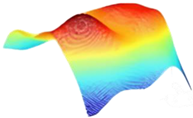
Ablated area (local)
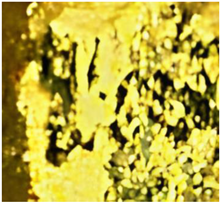
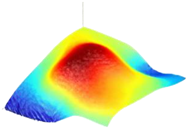
Applsci 15 02842 i003Applsci 15 02842 i004
Table 2. Feature Extraction Evaluation.
Evaluation IndicatorsMoving ContactStatic ContactMixed Data
PRI0.920.940.89
GCE0.140.120.15
BDE6.66.87.4
Table 3. Model parameter values.
ParametersValue
Micro-asperity level 10 34
Fractal dimension D 2.1 2.9
Characteristic scale parameter G 10 6 ~ 10 9   m
Elastic modulus E 6.32 × 10 10   P a
Hardness H 2.5 × 10 9
Poisson’s ratio ν 0.38
Resistivity of Ag 1.65 × 10 8   m Ω
Resistivity of AgCdO 2.8 × 10 8   m Ω
Table 4. Test Conditions.
ConditionsDescriptions
Test environmentTemperature: 40 °C, 49 °C, 65 °C, 90 °C
Humidity: 65%
Test sampleA certain type of railway relay
Contact materialMoving contact (cathode): Ag/15CdO
Stationary contact (anode): Ag
Electrical life2 million times
Test conditionsCoil voltage: DC24 V
Contact load: DC24 V/1 A (resistive)
Test method3D non-contact analysis system
Test period40 °C: 200,000 cycles; 49 °C: 150,000 cycles;
65 °C: 100,000 cycles; 90 °C: 50,000 cycles
Table 5. Reference technical parameters of digital microscopy of the 3D non-contact analysis system.
ConditionsDescriptions
Optical systemHigh-performance infinity axial, radial dual chromatic aberration correction optical technology
Illumination devicesAnnular light, coaxial light, transmitted light
Objective turretZoom ratio 16:1, magnification 1 to 2350 times
(including digital zoom)
StageTravel range 70 mm × 50 mm, resolution 1 μm, maximum rotation ±180°, sample weight (maximum load) up to 2 kg
Observation tubeIntegrated digital camera device
Focusing methodAuto focus
Resolution3664 × 2748 pixels
Pixel sizeMicrometer × micrometer
Disclaimer/Publisher’s Note: The statements, opinions and data contained in all publications are solely those of the individual author(s) and contributor(s) and not of MDPI and/or the editor(s). MDPI and/or the editor(s) disclaim responsibility for any injury to people or property resulting from any ideas, methods, instructions or products referred to in the content.

