Abstract
Smart grids have enormous potential in terms of reliability and sustainability, but with the large-scale integration of distributed energy like solar energy, the network security risks of smart grids have also increased. In response to the physical and information network threats faced in the network security risk assessment of solar powered smart grids, this study develops a smart grid theft detection model based on TimesNet and a smart grid intrusion detection model based on bidirectional long short-term memory networks. The results indicated that when the proportion of electricity theft data was 25%, the false detection rate of the proposed model was 3.52. The area under the curve of the proposed model was 0.98, and the detection rate, false negative rate, F1 value, and accuracy were 97.04%, 1.21%, 92.69%, and 97.15%, respectively. The loss value of the proposed intrusion detection model was stable at around 0.012 in the NSL-KDD dataset and around 0.02 in the CICIDS2017 dataset, with a detection accuracy of 97.54% and a false positive rate of 1.21%. The experiment demonstrated the electricity theft behavior and network intrusion detection performance of the proposed model, which can effectively detect security threats faced by solar smart grids and provide practical basis for network security risk assessment. The research results can help reduce the economic losses of power companies, maintain a good order of electricity consumption, and ensure the safe and stable operation of solar smart grids.
1. Introduction
Distributed energy such as wind power and solar are rapidly developing. As a vital component of the new power system, the network security issues of solar smart grid are increasingly receiving attention. Smart grid refers to the intelligent transformation of traditional power grids through advanced sensing and measurement technology, information and communication technology, computer technology, and control methods, to improve the efficiency, sustainability, and reliability of power distribution [1,2]. However, this integration also brings new Network Security Risks (NSRs), including network layer attacks, network physical layer attacks, and coordinated attacks [3]. Especially in the context of widespread deployment of distributed energy resources such as solar energy, NSR evaluation is particularly important. Since the communication dependency and architectural diversity of these resources have expanded the threat surface and exacerbated the network security situation of the power system [4]. The NSR analysis of smart grids is gradually shifting from a physical security analysis focused on engineering faults to a comprehensive security risk analysis that considers both information networks and physical systems [5]. The integration of distributed energy sources such as solar energy has brought flexibility and sustainability to smart grids, but it has also introduced new security issues such as increased data complexity and expanded attack surfaces. However, the current NSR analysis methods for smart grids are relatively disconnected between information security research and system operation research, lacking comprehensive consideration of the security issues of information physical fusion systems. In real-world scenarios, electricity theft in solar smart grids not only involves physical tampering of power equipment, but may also be achieved through network attacks to tamper with data or remotely control metering devices, posing a threat to the network security and stable operation of smart grids. In this context, this study proposes a Solar Smart Grid (SSG)-NSR evaluation method, which includes two parts: a TimesNet-based Smart Grid Theft Behavior Detection (SGTBD) model and a Bidirectional Long Short-Term Memory (Bi-LSTM)-based Smart Grid Intrusion Detection (SGID) model. The purpose of the research is to effectively detect electricity theft behavior in the physical network of the smart grid and intrusion attacks in the information network, provide real and reliable basis for the NSR evaluation work of relevant personnel, and thus improve the reliability of SSG power supply. The innovation lies in using Deep Belief Network (DBN) for data dimensionality reduction, and inputting the reduced data into Bi-LSTM for intrusion detection to improve the detection accuracy.
2. Related Works
Smart grid security not only involves equipment security at the physical level but also includes data security and system stability at the information level. Tuo M. et al. discussed the impact of inter-regional oscillations on system safety in response to the significant decrease in system inertia caused by the increase in wind and solar power generation devices. They proposed a location-based frequency change rate safety constrained unit model. This model could effectively enhance the market efficiency of the power grid model [6]. Syrmakesis A. D. et al. classified network resilience methods that can protect smart grid systems from intentional attacks, targeting the problem of smart grid network attacks caused by the use of heterogeneous communication technologies. This study emphasized the most critical challenge in achieving network resilience, which could help improve the network resilience of smart grids [7]. Vahidi et al. stated that protection and control systems greatly improve the reliability of smart grid systems, but also increase the risk of potential attack surfaces and critical vulnerabilities. Therefore, they provided a key classification of the scope of network security, guiding the investigation of research in smart grid security [8]. Park K. S. et al. proposed a privacy protected authentication scheme for demand response management to resist various attacks and conducted security analysis to address the security issues encountered in the deployment of smart meters and wireless communication in smart grids. The proposed method provided high-level security and had certain practical application value [9]. Chen Y. et al. developed an optimization strategy built on NDSGA-II for fault detection in smart grids, aiming to keep the security of the power grid at the lowest cost. This method had advantages in optimizing maintenance completion and the distribution of non-dominated solution sets, and could effectively maintain the security of smart grids [10]. Ullah M. H. et al. summarized the latest research results on quantum computing in response to the high computational complexity of smart grid systems, and further identified potential smart grid applications that can overcome computational limitations [11].
Electricity theft detection refers to the process of identifying and confirming whether users engage in illegal electricity use through a series of technical means and inspection procedures. The modern electricity theft detection models mainly include deep learning-based models and data mining-based models. Wu et al. designed a homomorphic encryption friendly model based on region search and clustering, as well as a theft detection model that uses neural networks to infer encrypted data, to address privacy issues in the process of electricity theft detection. The results indicate that the AUC value of the proposed model is 0.763 [12]. Pamir et al. proposed a hybrid gate convolutional autoencoder model based on skip group algorithm to address the complex hyperparameter adjustment process in machine learning based electricity theft detection methods. The results indicate that the proposed model has a theft detection accuracy of 99.45% [13]. Liao W. et al. proposed a theft detection model based on graph convolutional neural network and convolutional neural network to address the problem that most existing theft detection models cannot capture temporal dependencies. The results indicate that the proposed model outperforms popular benchmarks in electricity theft detection [14]. Wang X. et al. proposed a privacy protection protocol based on threshold homomorphic encryption and a decentralized federated learning framework to address privacy issues in the process of electricity theft detection. The results indicate that the proposed models have similar performance to centralized models [15].
The TimesNet model is a deep learning model used for time series analysis. It effectively simulates multi period changes in time series, including intra-period and inter-period changes, by converting 1D time series into 2D tensors. Zuo C. et al. proposed a hybrid load forecasting model based on TimesNet and time convolutional network, considering the multi periodicity of load data for short-term power load forecasting. The results indicate that the proposed model reduces the average absolute percentage error of the ISO-NE dataset by 20% to 43% [16]. Yan H. et al. proposed a broadband oscillation localization model based on TimesNet and Autoformer algorithms to address the stability issue of integrating new energy generators into the power grid. The simulation experiment verified the accuracy of the proposed model for broadband oscillation source localization [17]. Tu S. et al. proposed a basic model of power time series data and TimesNet to address the issue of external factors affecting power time series, which helps maintain the stability of the power grid [18].
In summary, although the security issues of smart grids have been extensively studied and the predictive performance of TimesNet models has been affirmed, the security assessment of smart grids is facing new challenges with the integration of distributed energy sources such as solar energy and the increase in network attack types and concealment. Therefore, further verifying and improving the performance of the TimesNet model, and strengthening the network security analysis of the power grid to adapt to the new network security environment, remains an important research direction. To this end, this study proposes an SGTBD model based on TimesNet and an SGID model based on Bi-LSTM to detect physical and information threats faced by smart grids, thereby promoting the efficient implementation of SSG security assessment work.
3. SSG-NSR Evaluation
To accurately evaluate SSG-NSR, this study will first focus on the electricity theft problem faced by the physical network of smart grids, and build an SGTBD model based on TimesNet. Then, in response to the network intrusion issues faced by the smart grid information network, a Bi-LSTM-based SGID model will be built.
3.1. SGTBD Model Based on TimesNet
The smart grid is a typical Cyber Physical System (CPS); therefore, the NSR evaluation of the smart grid not only involves security issues at the information network level, but also includes security issues of the physical grid. This study first analyzes the security issues of physical power grids. Electricity theft is a common safety issue in the CPS of distribution networks, involving the illegal use of electrical energy in the grid, directly affecting the physical operation of the grid and the legal distribution of electrical energy. Electricity theft detection is an essential component of the NSR assessment of the power grid, which helps identify and prevent illegal activities that may lead to economic losses and threats to the safety of power grid operation [19]. To improve the accuracy of electricity theft detection, feature extraction and selection are first required. The act of electricity theft in the smart grid is a kind of time-series data. Time Series Fresh (Tsfresh) is a Python library used for feature extraction, which can automatically extract features from time series data, covering various aspects of time series data [20]. Therefore, this study uses Tsfresh 0.21.0 to extract features of electricity theft behavior and utilizes the Maximum Information Coefficient (MIC) algorithm for feature selection. MIC is a statistical measure used to measure the relationship between two variables, aimed at capturing various nonlinear relationships [21]. Assuming the electricity consumption data are a matrix with rows and columns , the actual electricity theft result is . The expression of mutual information calculated using an approximate density function is shown in Equation (1).
In Equation (1), is the grid generated by dividing and into grids. is the boundary distribution probability of the electricity consumption data for the -th user. is the boundary distribution probability of the electricity theft result . means the joint possibility of the electricity consumption data of the user and the electricity theft result of the -th user. The calculation of MIC result for and is shown in Equation (2).
In Equation (2), is a function of the number of samples . After completing feature selection, this study utilizes the TimesNet model to fully utilize features for detecting electricity theft behavior. The TimesNet model is used for time series analysis, which extracts periodic features through Fast Fourier Transform (FFT) and converts 1D time series into multiple periods arranged side by side 2D sequences. It enables the use of 2D convolution and ResBlock like structures to extract features, which is of great significance for identifying and detecting electricity theft behavior. FFT is an efficient algorithm for computing discrete Fourier transform, aimed at reducing the number of multiplications required for computation, especially when dealing with large amounts of data. Firstly, it is needed to analyze the periodicity of the time series. FFT has been widely used in digital signal processing. Assuming there is a time series with a time length of and a channel dimension of , its periodicity can be obtained through FFT, as shown in Equation (3).
In Equation (3), is the intensity of each frequency component. is the frequency with the highest intensity. is the most significant cycle length. The formula for converting 1D time series to 2D is shown in Equation (4).
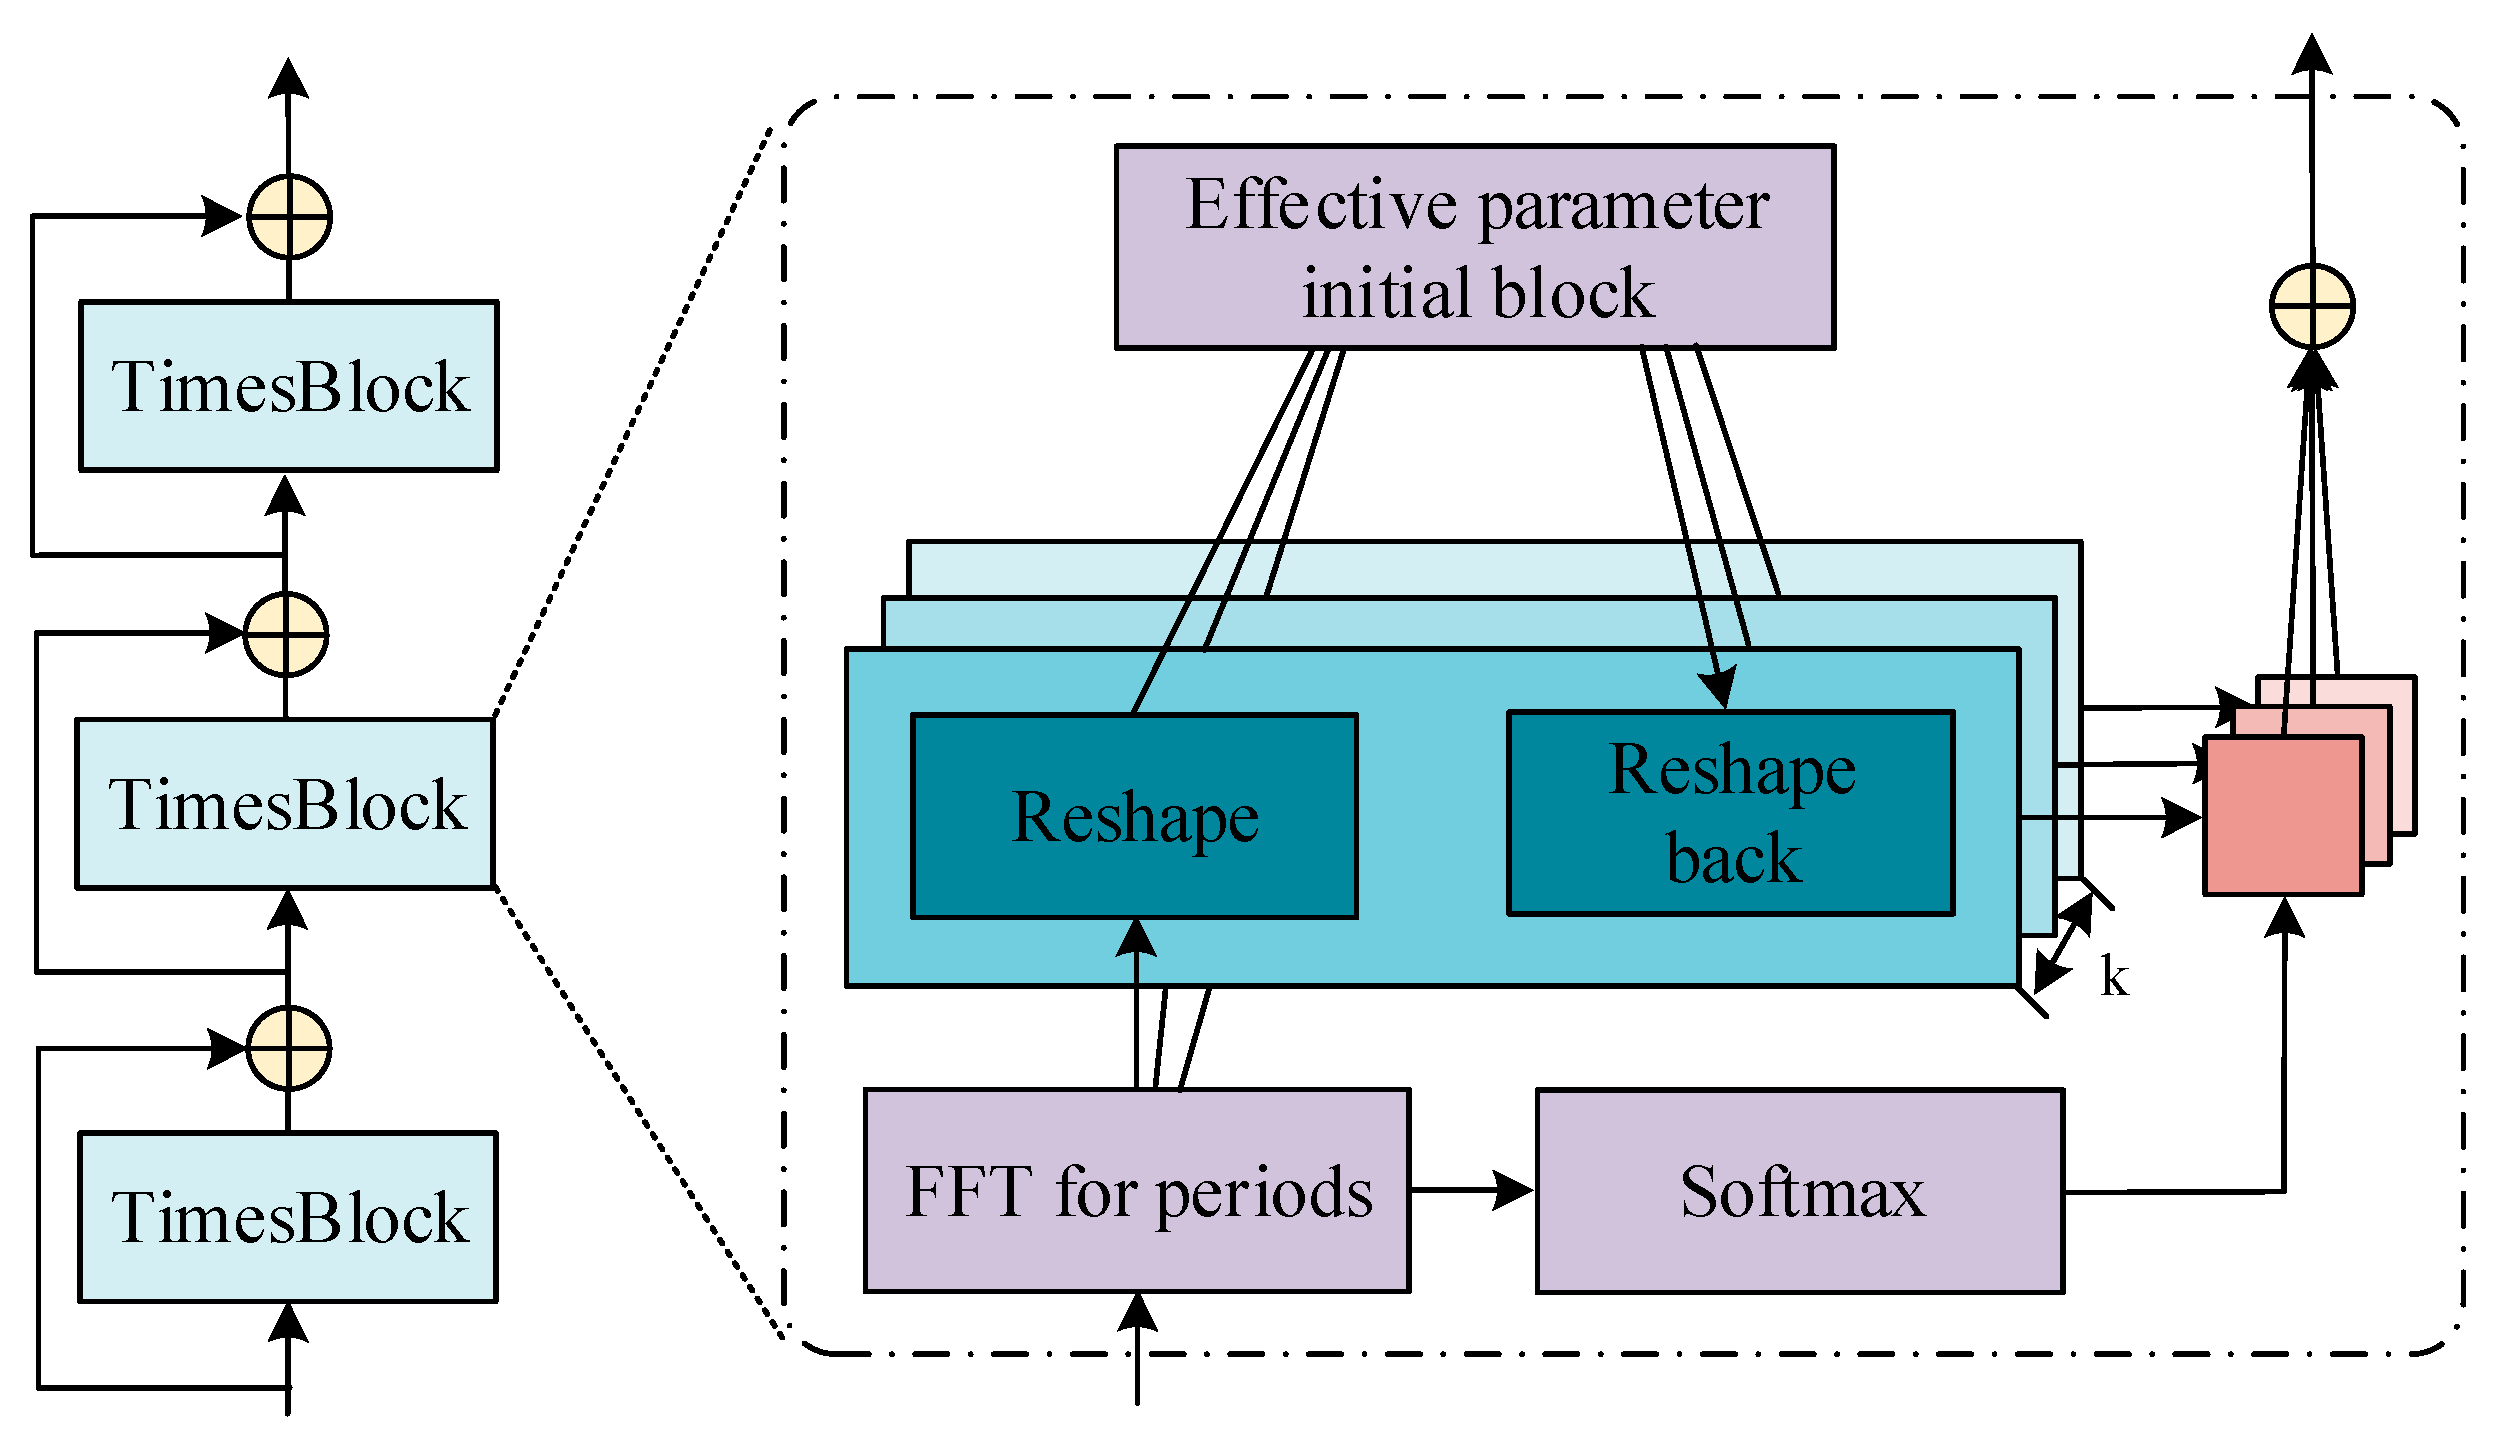
The 2D tensor can be obtained through Equation (4). The TimesNet model consists of stacked time blocks, as shown in Figure 1 [22].

Figure 1.
Structure diagram of TimesNet model.
In Figure 1, each time block in the TimesNet model has residual connections, which are responsible for capturing 2D changes in the time series and adaptively aggregating characterization features from different periods. The input for the time block in layer is . Firstly, the time series changes are extracted through 2D convolution, as shown in Equation (5).
Secondly, the 2D temporal variation representation is extracted. This study uses the Inception model to extract information from the 2D tensor , as shown in Equation (6).
Then, the 2D representation is transformed into 1D representation to achieve a more in-depth and effective modeling of temporal changes, as shown in Equation (7).
In Equation (7), represents the addition of 0 after removing . Finally, the 1D representation is weighted and summed according to the corresponding frequency to obtain the final feature output, as shown in Equation (8).
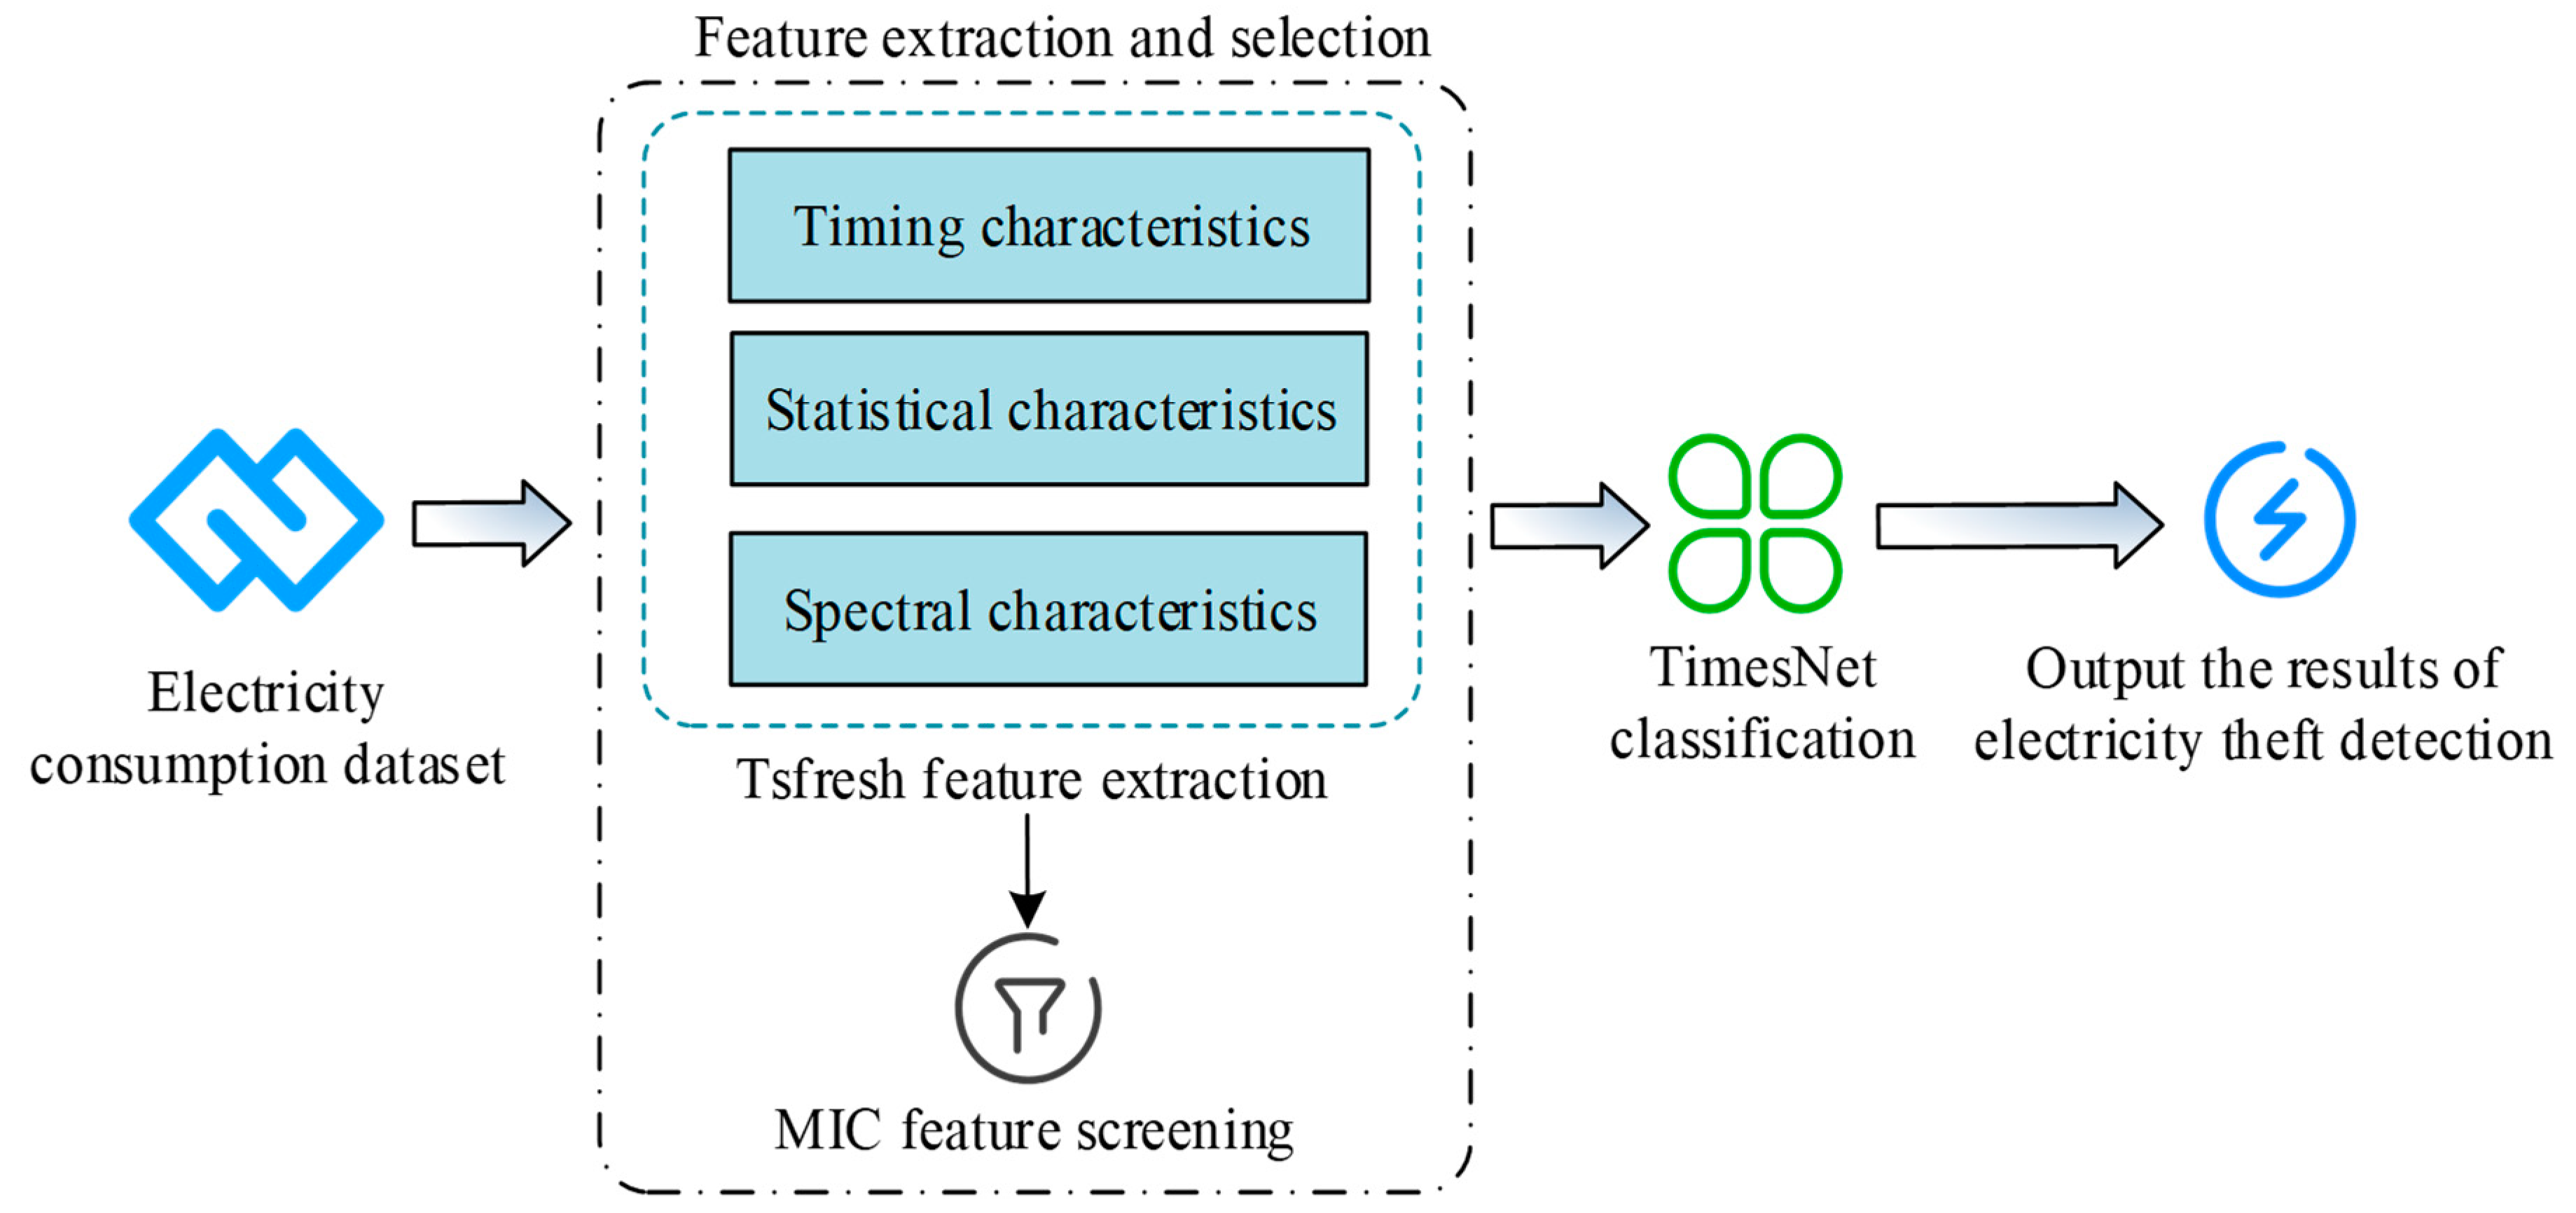
In summary, the framework of the SGTBD model based on TimesNet is displayed in Figure 2.
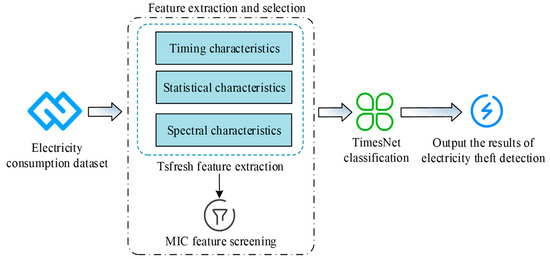
Figure 2.
Structure diagram of SGTBD model based on TimesNet.
Normal electricity consumption behavior usually has obvious periodicity: for example, household electricity consumption is low during the day and high at night, factory electricity consumption is high during working hours and low after work, and seasonal changes such as heating in winter and air conditioning in summer. And electricity theft behavior may disrupt this periodicity, such as through intermittent or sustained electricity theft, leading to abnormal fluctuations in the electricity consumption curve. In Figure 2, the SGTBD model based on TimesNet first uses Tsfresh to extract electricity theft behavior features from the input electricity consumption data, mainly used to extract time series features such as highest or lowest electricity consumption, average electricity consumption, and peak electricity consumption. Then, MIC is used for feature screening to identify features highly correlated with electricity theft behavior. Finally, the selected features are input into the TimesNet for classification. TimesNet learns patterns from time series data, identifies abnormal patterns that differ from normal electricity consumption behavior, and outputs the final detection results of electricity theft behavior, providing a basis for the network security assessment of smart grids. In summary, in order to improve the detection accuracy of the TimesNet model, the study proposes using Tsfresh for electricity theft behavior feature extraction and using MIC algorithm for feature selection to improve the TimesNet model.
3.2. SGID Model Based on Bi-LSTM
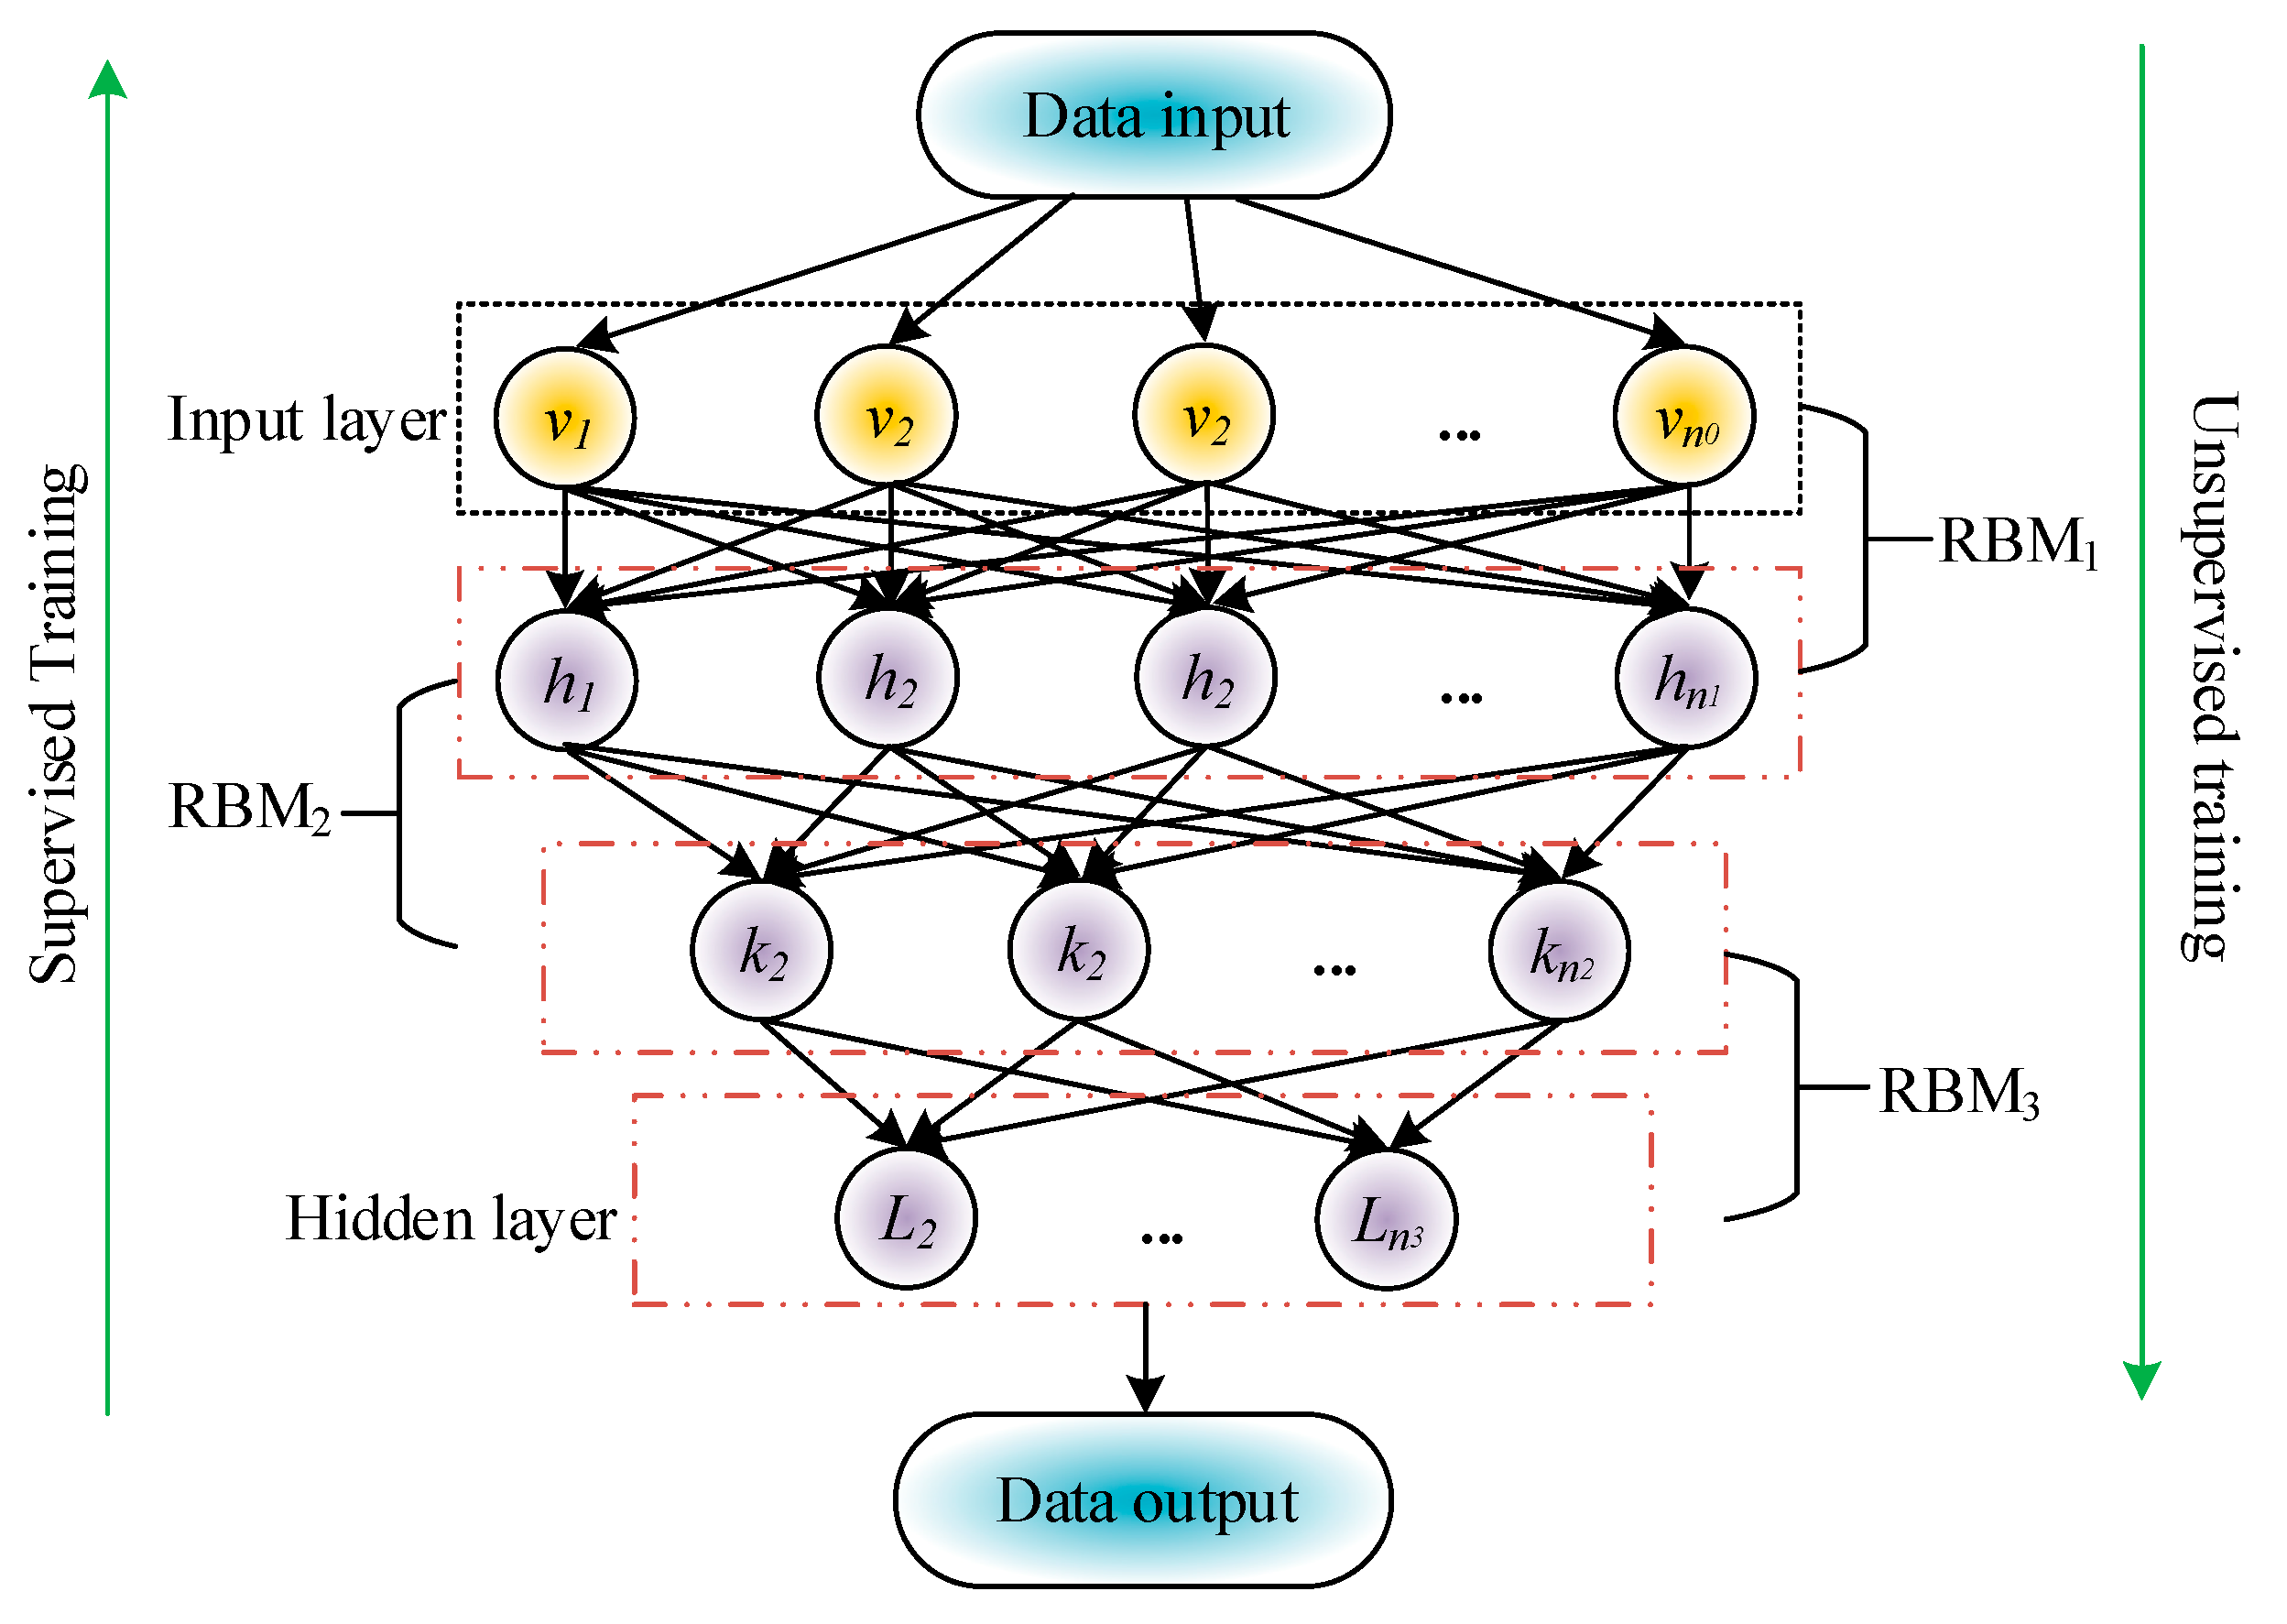
The proposed TimesNet-based SGTBD model can detect electricity theft behavior in smart grids, but mainly focuses on the physical network of the grid. The development of information technology construction in smart grids may also involve the risk of information side network attacks, especially those aimed at obtaining economic benefits. In addition, with the integration of distributed energy sources such as solar energy, the network boundaries of smart grids have become more complex and the attack surface has expanded. Intrusion detection of solar smart grids has become increasingly important and is a key component of smart grid security. Therefore, to conduct a security risk assessment of the information network of the smart grid, this study will build an SGID model. Considering that the data feature dimension of the smart grid information network is relatively high and contains a large amount of redundant information, this study first uses DBN to perform feature dimensionality reduction. DBN is essentially a generative graphical representation network consisting of multiple stacked Restricted Boltzmann Machines (RBM) and one or more classifiers [23]. The DBN structure is exhibited in Figure 3.

Figure 3.
Structure diagram of DBN.
In Figure 3, the unsupervised pre training stage is from the input layer to the output layer, and each RBM layer of DBN is trained through unsupervised learning using unlabeled data. After pre-training is completed, DBN can be fine-tuned using labeled data, so the process of returning from the output layer to the input layer is supervised learning. RBM is a randomly generated neural network that can learn probability distributions from input datasets. Its structure is simplified into visible and hidden layers, and the connections between these two layers are bidirectional, but there are no connections between nodes within each layer, allowing RBM to learn feature representations of data unsupervised. By learning high-dimensional features of data, RBM can help reduce the data dimensionality. The energy function of RBM can be used to calculate the probability distribution of RBM. Given a set of states , their energy function is shown in Equation (9).
In Equation (9), is a visible layer neuron. is a hidden layer neuron. and are the bias terms of and . and are the state of the -th and -th visible and hidden layer neurons. is the connection weight between and . In the pre training stage of DBN, it is necessary to use multi-layer RBM to map feature vectors to a new space. In RBM, given the activation state of the visible layer, the state of each hidden layer neuron depends only on the state of the visible layer neuron and is independent of the states of other hidden layer neurons. The calculation of the probability of being activated is shown in Equation (10).
In Equation (10), represents the Sigmoid activation function. According to Equation (10), the probability of being activated can be derived in reverse, as shown in Equation (11).
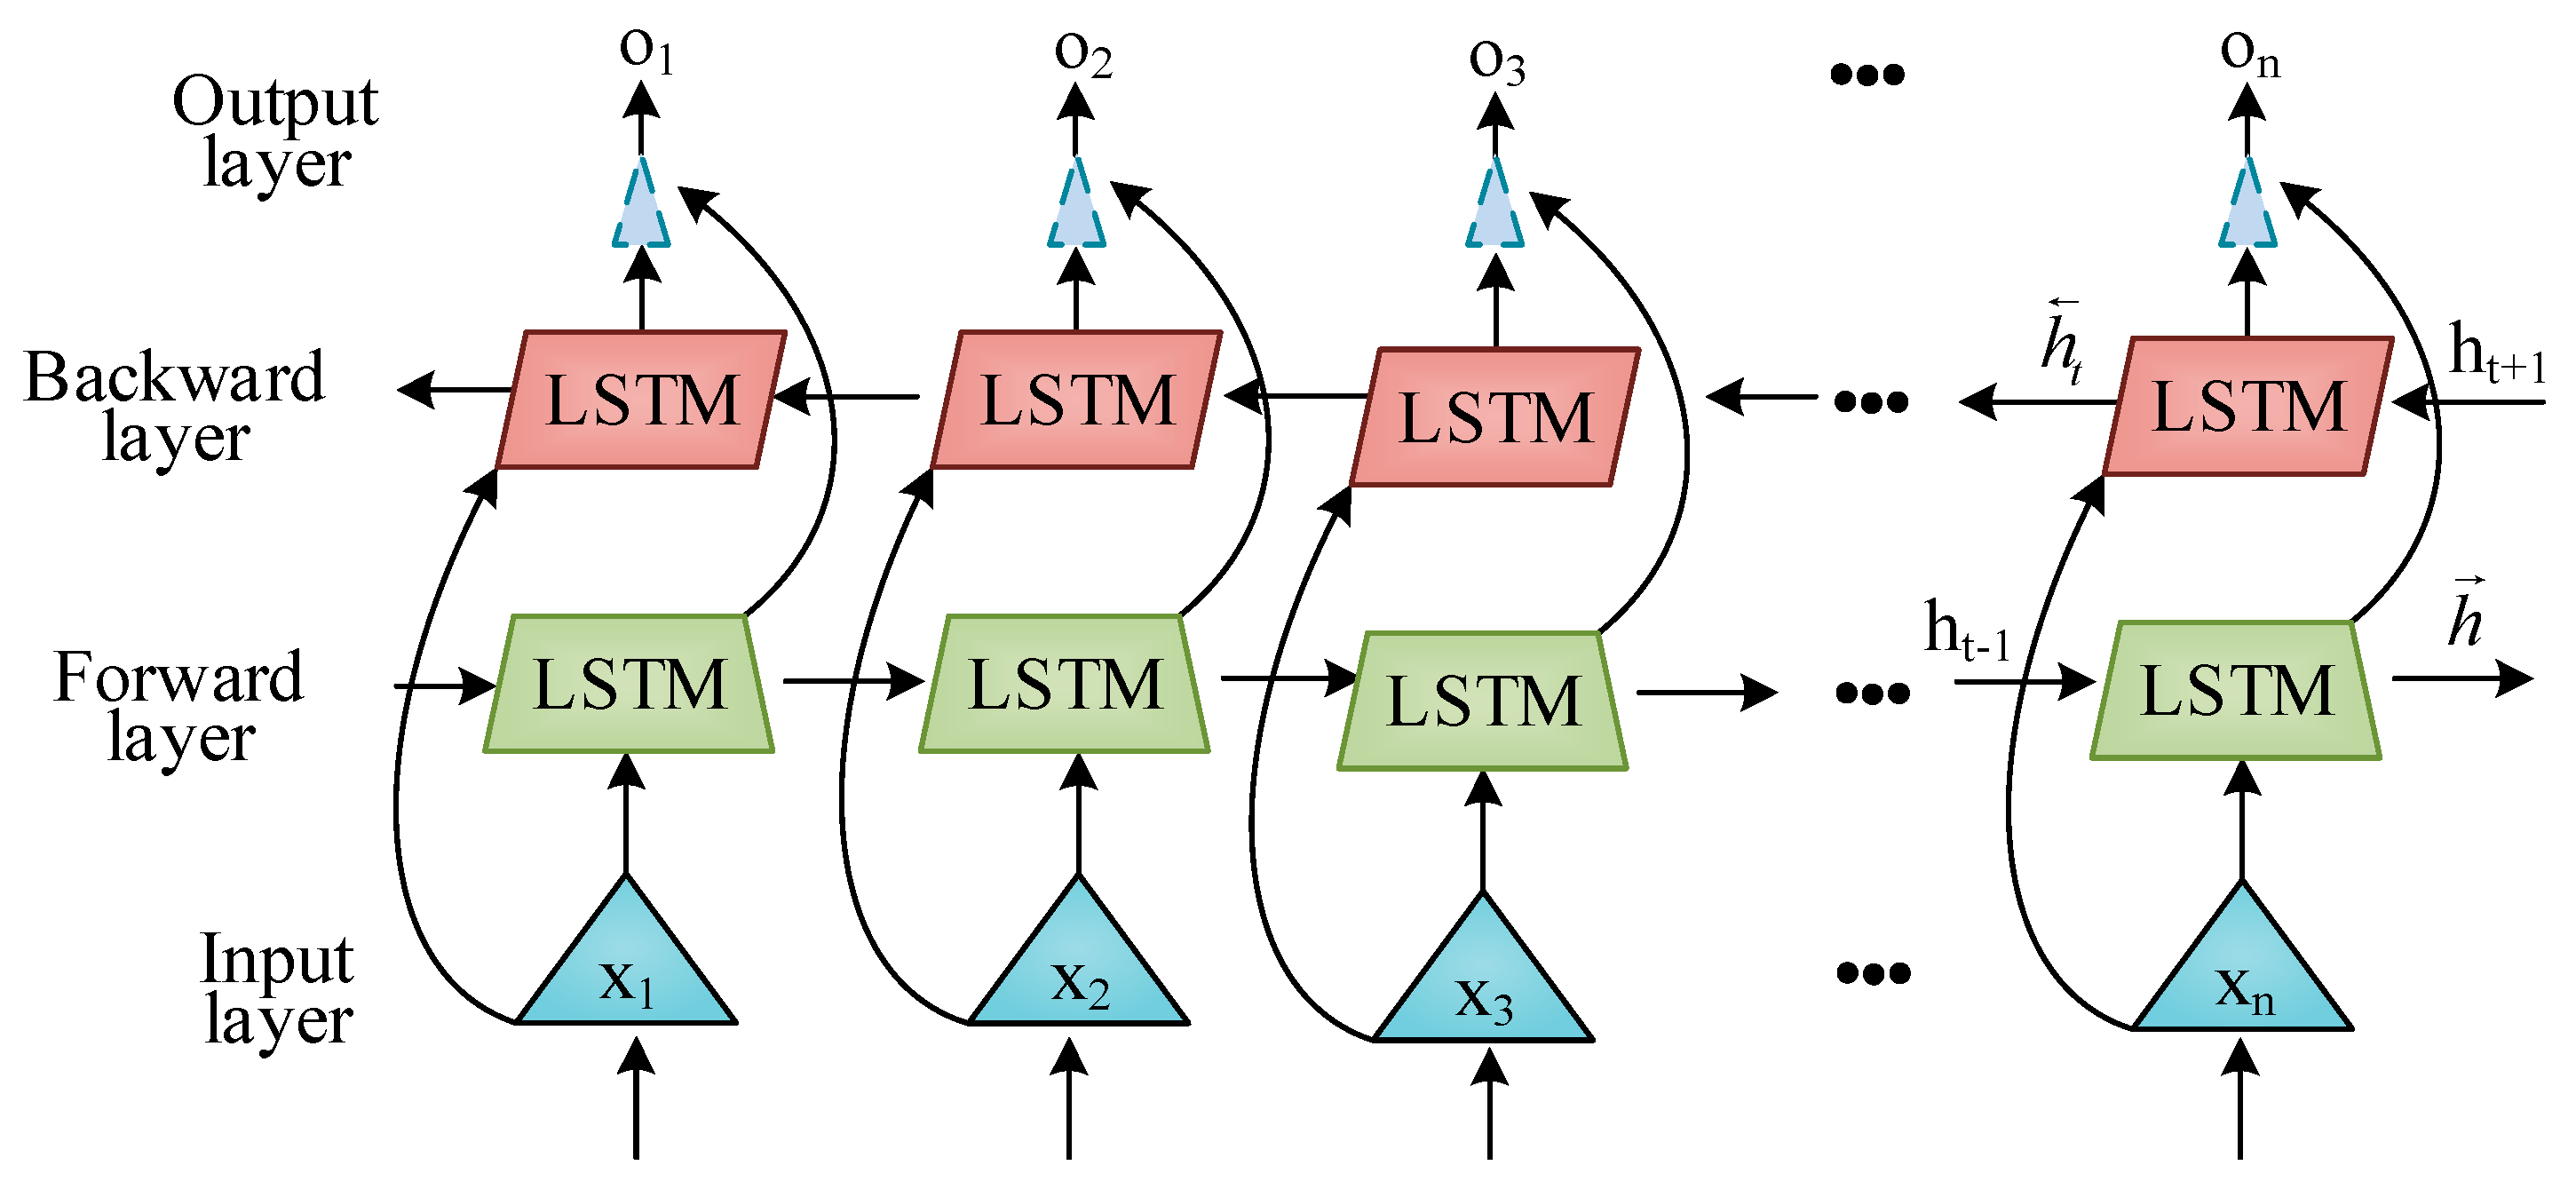
After completing feature dimensionality reduction, this study takes these preliminary features as inputs for network intrusion detection. Deep learning has been widely applied in network intrusion detection, which can automatically extract features and classify large amounts of data through learning, thereby identifying attacks and malicious behaviors. Bi-LSTM is capable of modeling and capturing long-range dependencies in data, which is crucial for intrusion detection in dynamic and constantly changing network environments [24]. By combining forward and backward LSTM, Bi-LSTM can better capture hidden features and patterns of data, improving the effectiveness and reliability of detection. Therefore, this study uses Bi-LSTM for intrusion detection. Figure 4 shows the specific Bi-LSTM framework.

Figure 4.
Bi-LSTM structure.
In Figure 4, Bi-LSTM consists of two independent LSTM layers, one processing the input sequence in chronological order and the other processing in reverse chronological order. The calculation of Bi-LSTM is shown in Equation (12).
In Equation (12), and are forward and backward hidden sequences. is forward LSTM. is a reverse LSTM. is the input vector for time step . is the gross of . The combination of two sequences results in the output sequence , as shown in Equation (13).
After Bi-LSTM processing, this study introduces a Dropout layer to randomly set the output of some neurons to zero to avoid overfitting in the network. Through the fully connected layer, the output of the Bi-LSTM network is flattened into higher meaning feature dimension vectors. Finally, the feature dimension vector is input into the Softmax layer to generate the final detection result. The study used detection rate, false detection rate, accuracy rate, recall rate, and F1 score as evaluation indicators. Among them, the detection rate represents the ratio of the number of correctly identified positive samples to the actual number of positive samples. The false positive rate refers to the ratio of the number of negative samples incorrectly identified as positive to the actual number of negative samples. Accuracy represents the ratio of correctly identified samples to total samples, while recall represents the ratio of correctly identified positive samples to actual positive samples. The calculation of accuracy and recall is shown in Formula (14).
In Equation (14), represents true positives, which is the number of correctly identified positive samples. represents true negative, which is the number of correctly identified negative samples. represents false positives, which refers to the number of samples incorrectly identified as positive. false negative refers to the number of samples incorrectly identified as negative. The F1 value represents the harmonic mean of precision and recall , calculated as shown in Formula (15).
In summary, the Bi-LSTM-based SGID framework is displayed in Figure 5.
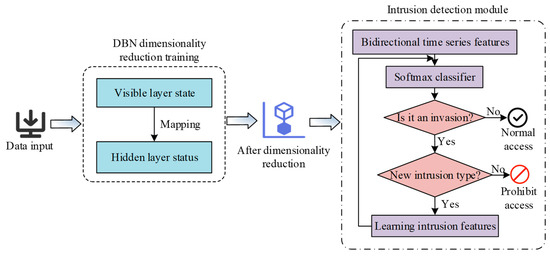
Figure 5.
Framework diagram of SGID model based on Bi-LSTM.
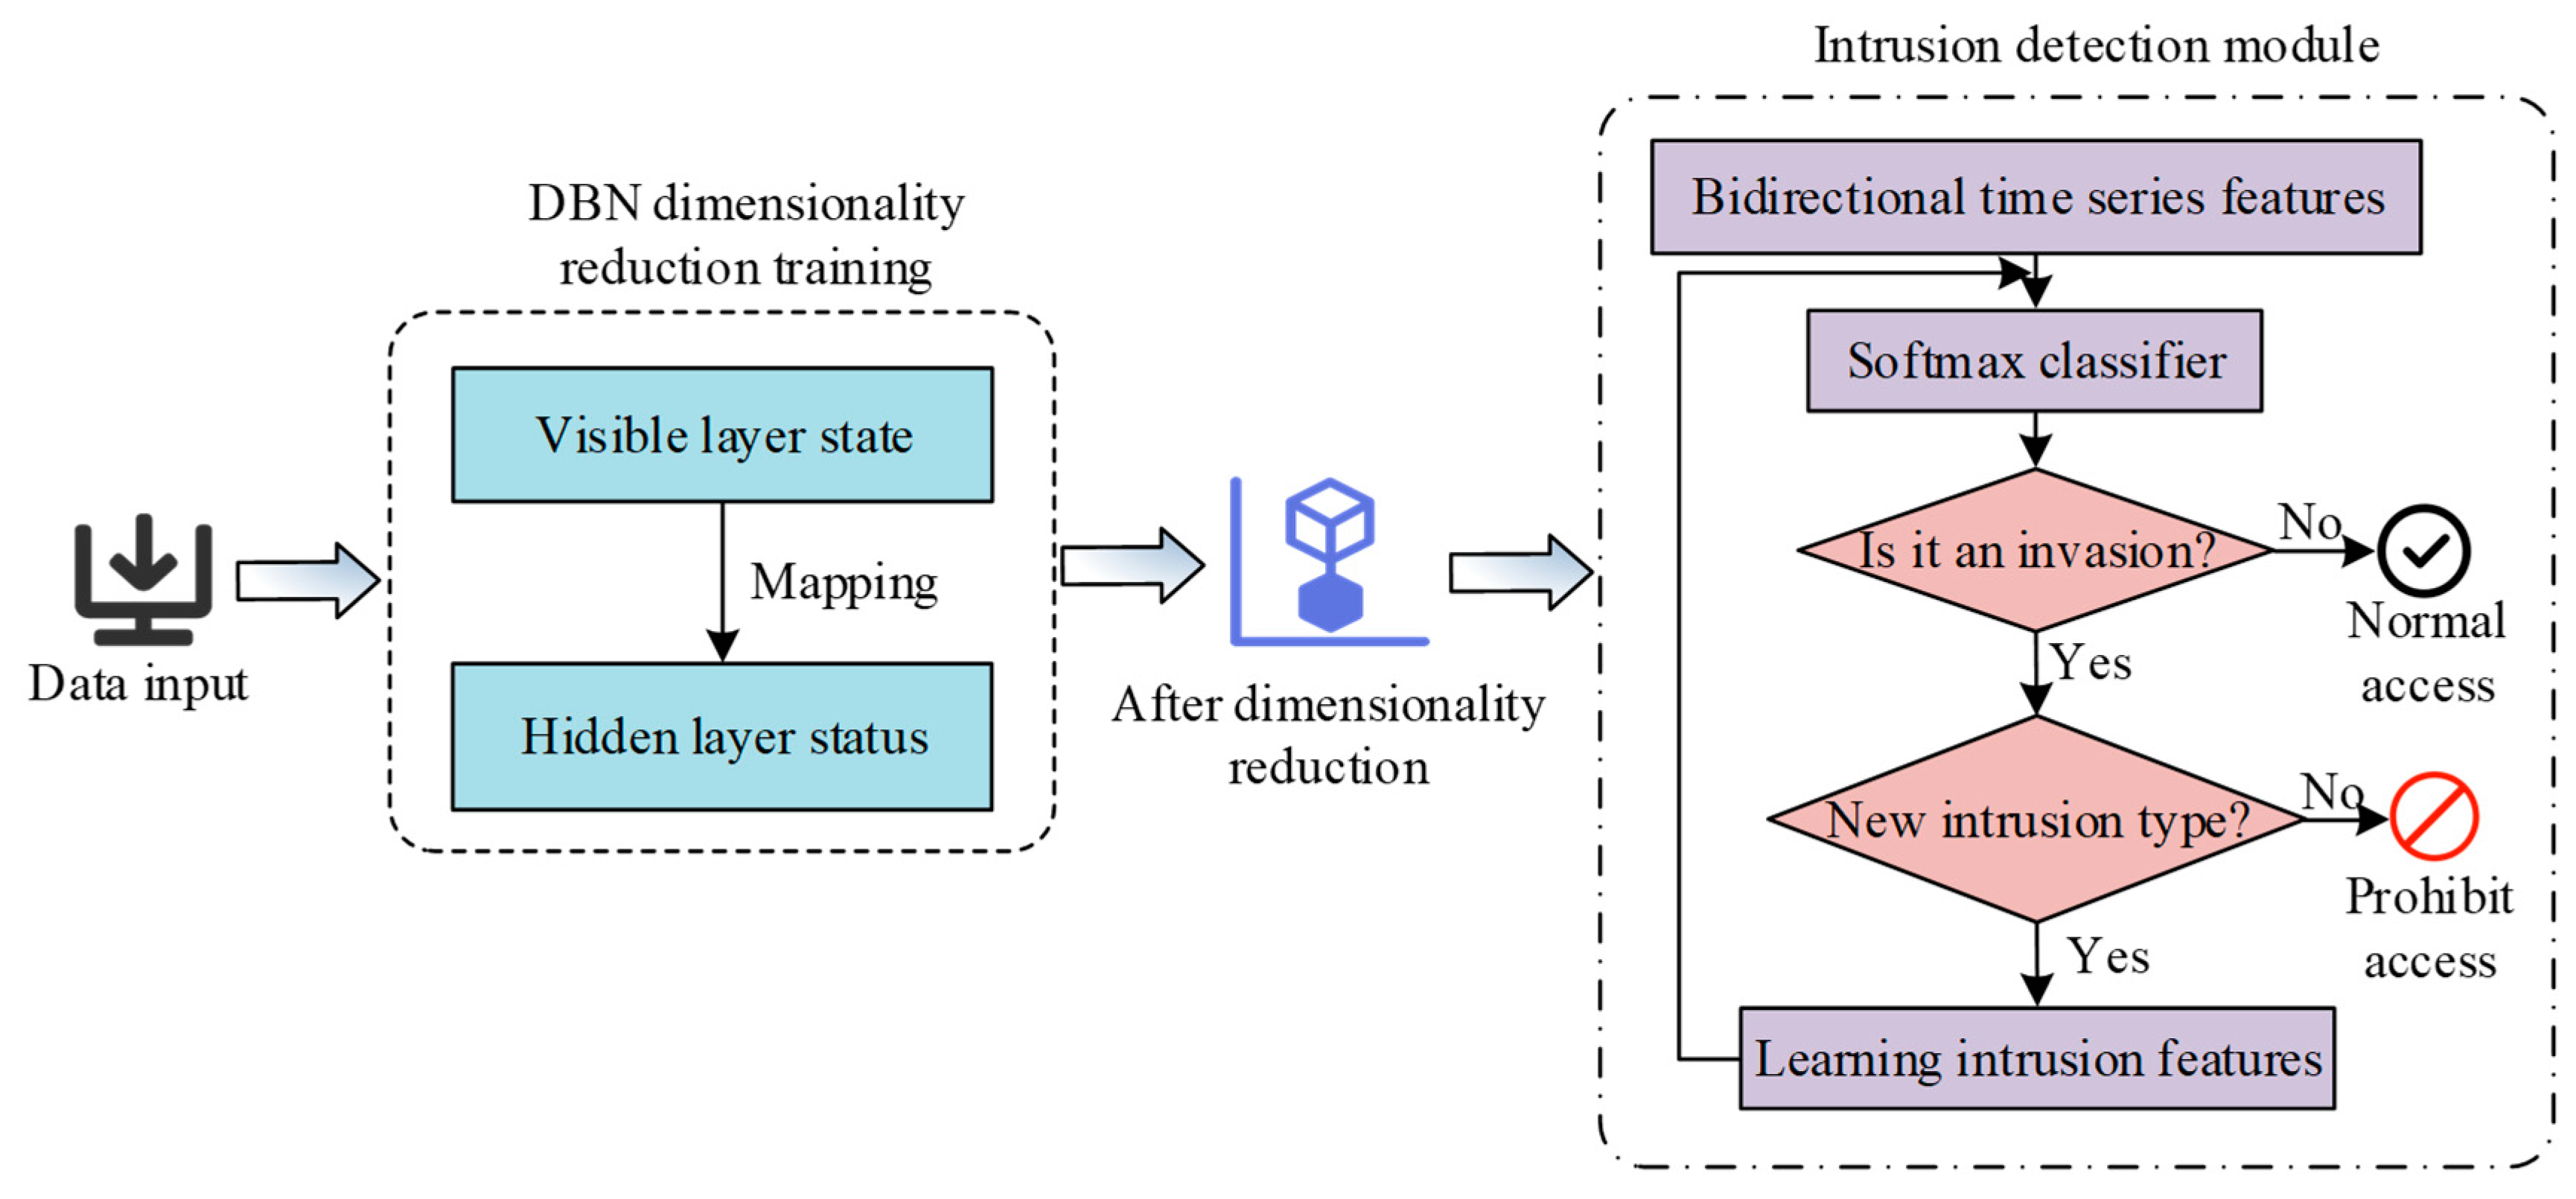
In Figure 5, the SGID model based on Bi-LSTM first uses DBN for feature dimensionality reduction, and then inputs the reduced features into Bi-LSTM for intrusion detection. When intrusion behavior is detected, access operations are prohibited from being executed. When new intrusion behaviors are discovered, they are learned and saved in the feature knowledge base. In summary, in order to improve Bi LSTM, the study first uses DBN for feature dimensionality reduction to avoid the influence of redundant information and improve the detection accuracy of BiLSTM.
4. Analysis of the Results of NSR Evaluation for Smart Grid
This study constructs an SGTBD model based on TimesNet and an SGID model based on Bi-LSTM. To further verify its feasibility, the performance of SGTBD and SGID will be explored separately.
4.1. Performance Analysis of SGTBD Model
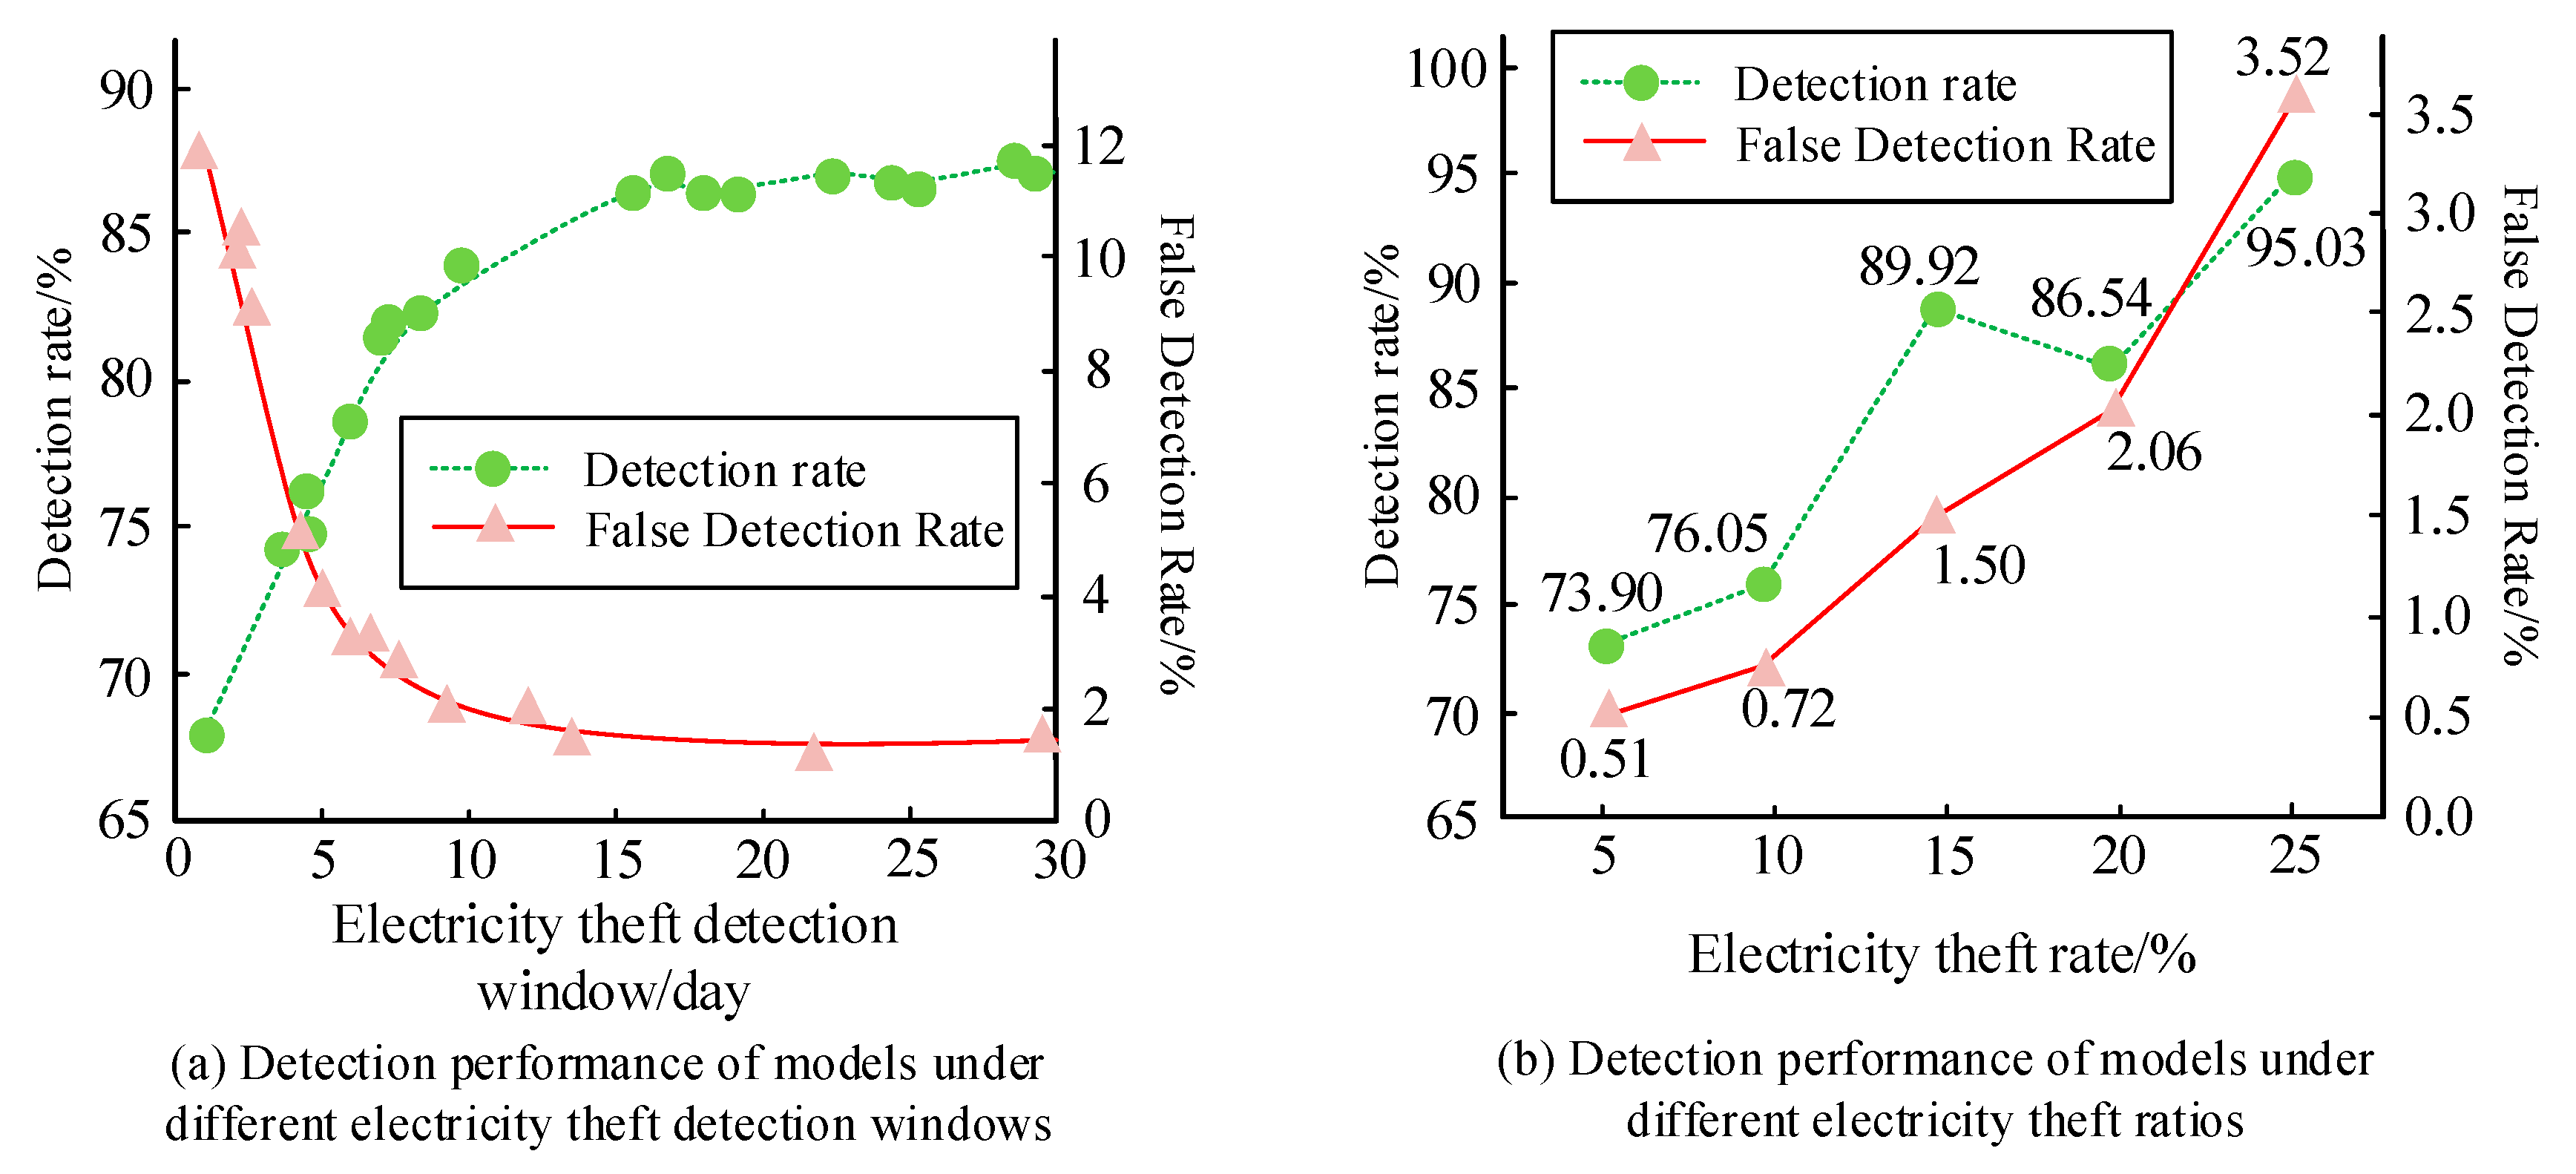
To validate the feasibility of the TimesNet-based SGTBD, this study used a publicly available dataset of actual electricity users from the Irish power grid for testing. The dataset was published by the Irish National Grid operator and ESB Networks and includes power generation data from renewable energy sources such as wind and solar energy [25]. Randomly selecting 90 days of electricity consumption data from 2000 users. Considering that the electricity consumption behavior of normal electricity users usually has periodicity, a sample of 12,000 normal samples is taken based on 15 days of electricity consumption data for each user. Randomly select 5%, 10%, 15%, 20%, and 25% of 12,000 normal samples, add random noise to the electricity consumption data of the normal samples to cause abnormal fluctuations in the data, simulate electricity theft behavior, and generate electricity theft users. Divide the model into training, validation, and testing sets in an 8:1:1 ratio. Due to the normal sample size of 12,000, electricity theft samples are generated by randomly selecting 5%, 10%, 15%, 20%, and 25% of the normal samples. This means that the number of electricity theft samples is much smaller than that of normal samples, and the dataset exhibits significant imbalance. Unbalanced datasets may cause the model to lean towards the majority class (i.e., normal samples) during training, resulting in insufficient detection ability for minority classes (electricity theft samples). The testing environment adopts the Windows 11 system, with AMD Ryzen 75800H CPU. The host memory is 32.0 GB, and the graphics card is NVIDIA GeForce RTX 3060. The iterations are set to 200. The Detection Rate (DR) and False Detection Rate (FDR) of the model are analyzed under different theft detection windows and theft data ratios, as shown in Figure 6. In Figure 6a, as the window for electricity theft detection increases, the DR of the model gradually increases and the FDR gradually decreases. When the electricity theft detection window reaches 15 days and continues to increase, the magnitude of changes in the DR and FDR models decreases, so the electricity theft detection window is set to 15 days. In Figure 6b, as the proportion of electricity theft data in the dataset increases, the DR and FDR of the model show a gradually increasing trend overall, but the FDR is still at a relatively low level. When the proportion of electricity theft data is 25%, the FDR is 3.52. The reason for false positives may be that although Tsfresh can extract time series features, in some cases, it may not be able to fully distinguish the subtle differences between normal electricity consumption and electricity theft behavior. For example, some users have unique electricity usage patterns, such as the use of temporary high energy consuming devices, which may result in peak electricity consumption and similar characteristics to electricity theft behavior, leading to misjudgment as electricity theft. This indicates that the SGTBD model based on TimesNet still has good detection performance in imbalanced samples and has a certain level of reliability.
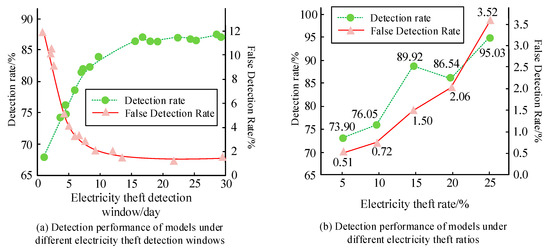
Figure 6.
Performance of models under various theft detection windows and theft ratios.
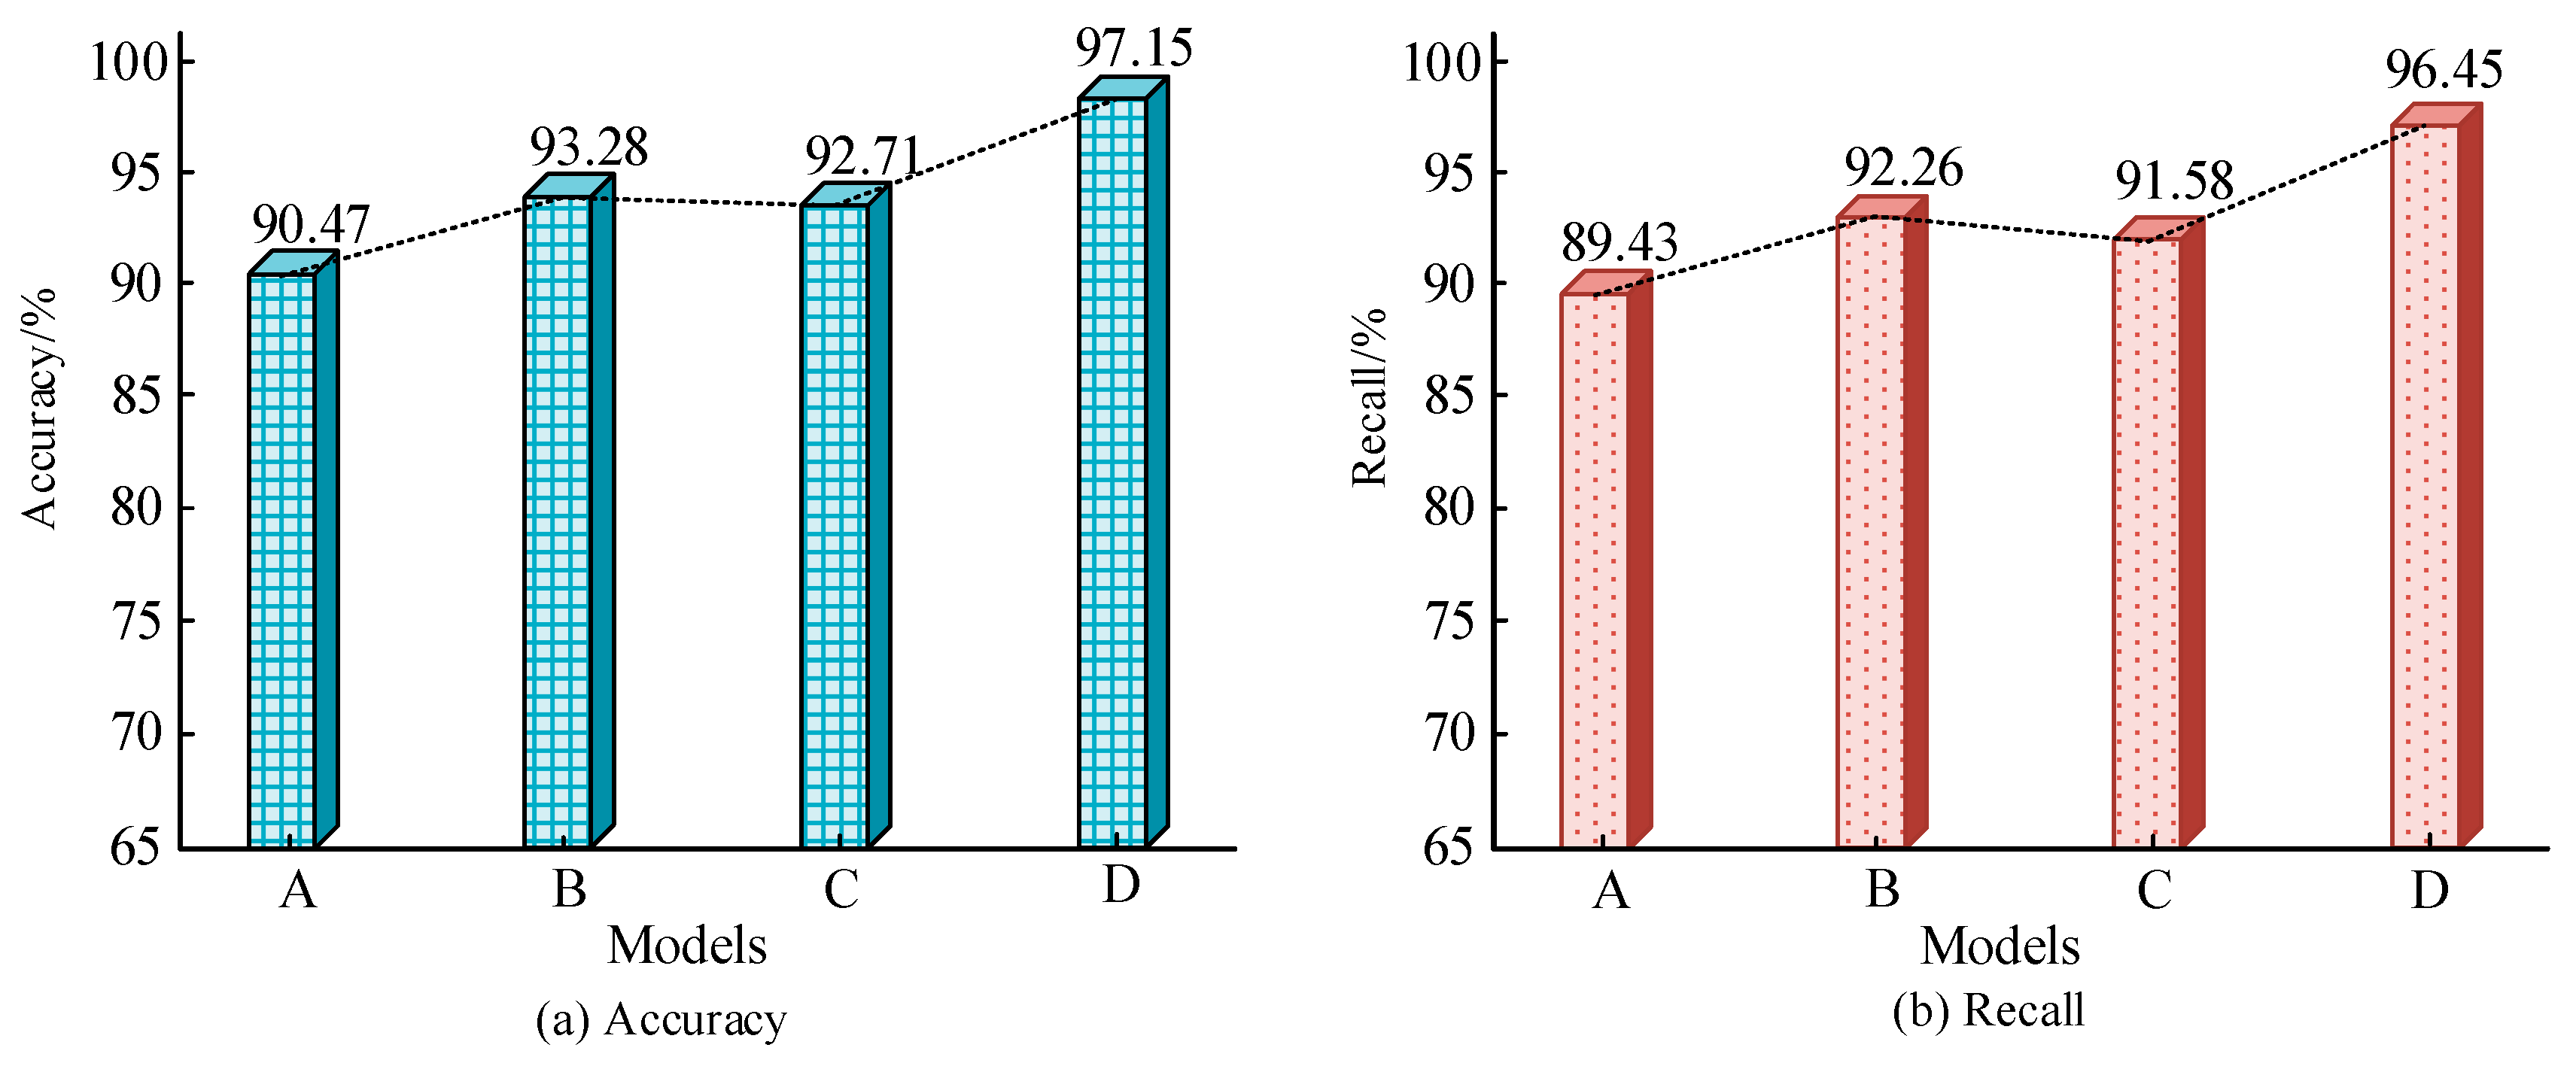
To verify the effectiveness, ablation experiments are performed. The detection accuracy and recall of traditional TimesNet (A), Tsfresh-TimesNet (B), MIC-TimesNet (C), and the complete model (D) are compared. The results of the ablation experiment are shown in Figure 7. The accuracy and recall of the complete model in Figure 7a,b are the highest, at 97.15% and 96.45%. The TimesNet model has the lowest accuracy (90.47%) and recall (89.43%). The proposed feature extraction and selection strategy can enhance the detection accuracy of the TimesNet and has certain feasibility.
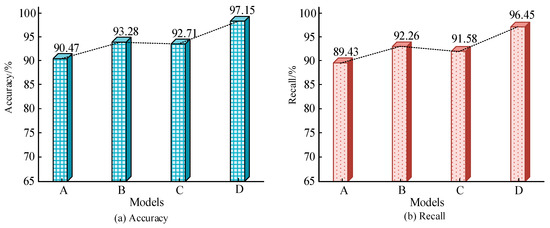
Figure 7.
Results of ablation experiment.
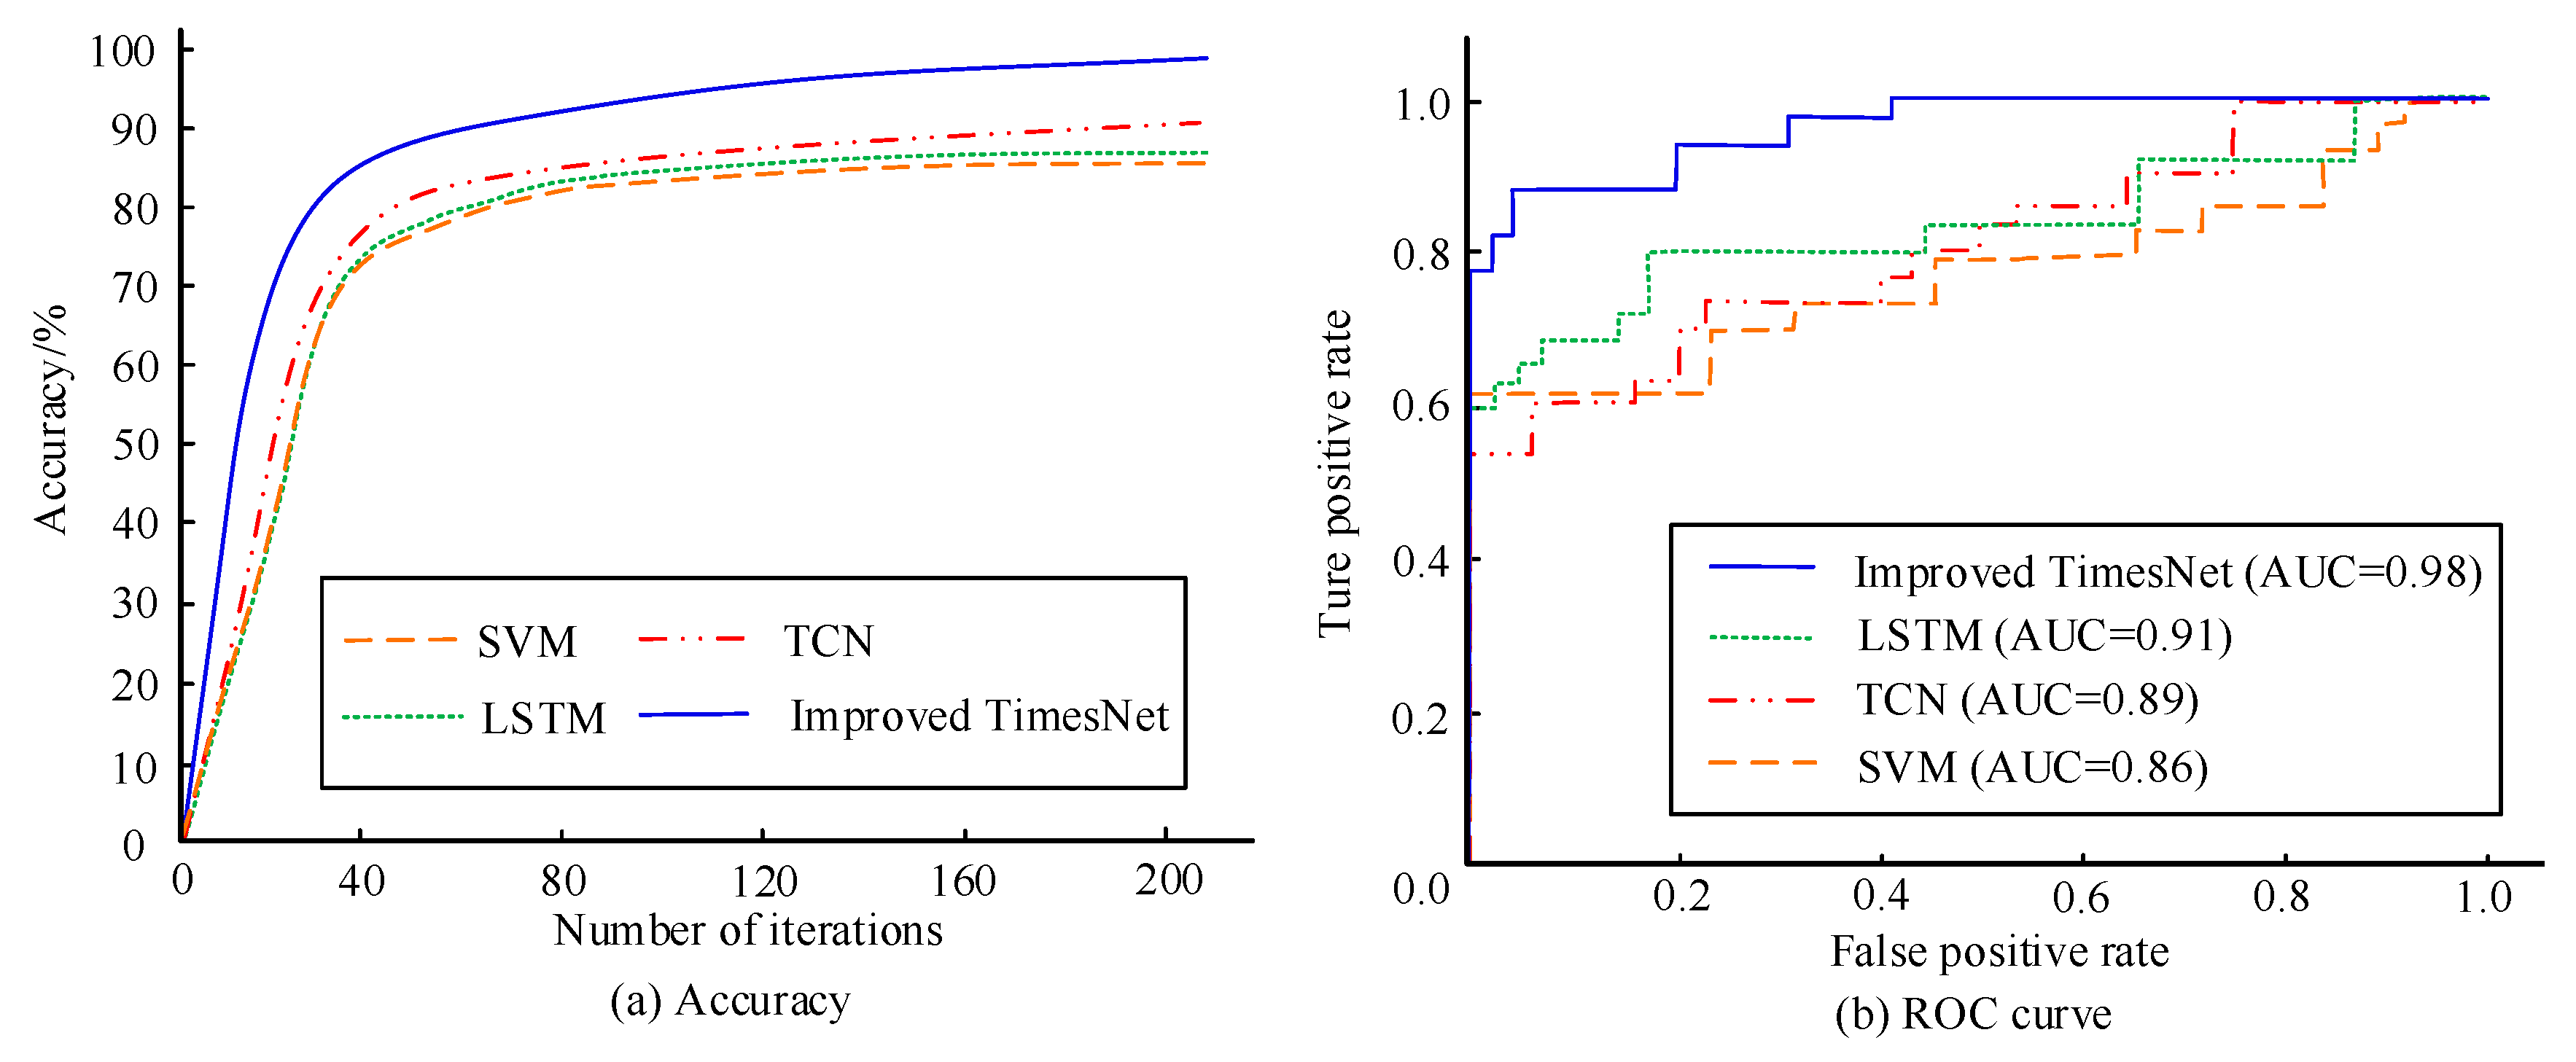
To test the performance of the designed model in detecting electricity theft behavior, its detection accuracy and Receiver Operating Characteristic (ROC) curves are compared with traditional Support Vector Machine (SVM), LSTM, and TCN models, as shown in Figure 8. In Figure 8a, the detection accuracy of the research model is the highest, at 97.15%, followed by TCN, and SVM has the lowest detection accuracy. In Figure 8b, the Area Under the Curve (AUC) of the designed model surpasses that of the control model, at 0.98, followed by LSTM at 0.91. Therefore, the improved TimesNet model has good performance in detecting electricity theft behavior.
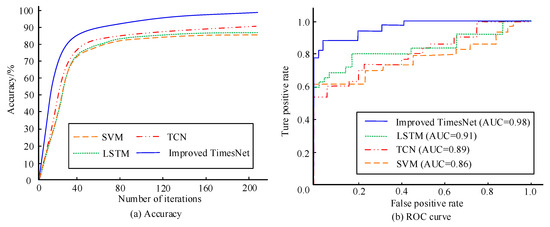
Figure 8.
Detection accuracy and ROC curve of four models.
To further validate the superiority, the improved model is compared with the currently advanced Genetic Algorithm-based Backpropagation Neural Network (GA-BPNN), Adaptive Recurrent Neural Network (ARNN), and CNN-LSTM, as shown in Table 1. The performance in the four indicators of DR, FDR, F1 value, and accuracy is superior to the comparison model, with scores of 97.04%, 1.21%, 92.69%, and 97.15%, respectively. Therefore, the improved TimesNet has good detection performance and demonstrates certain superiority.

Table 1.
Comparison of electricity theft detection performance among four models.
4.2. Performance Analysis of SGID Model
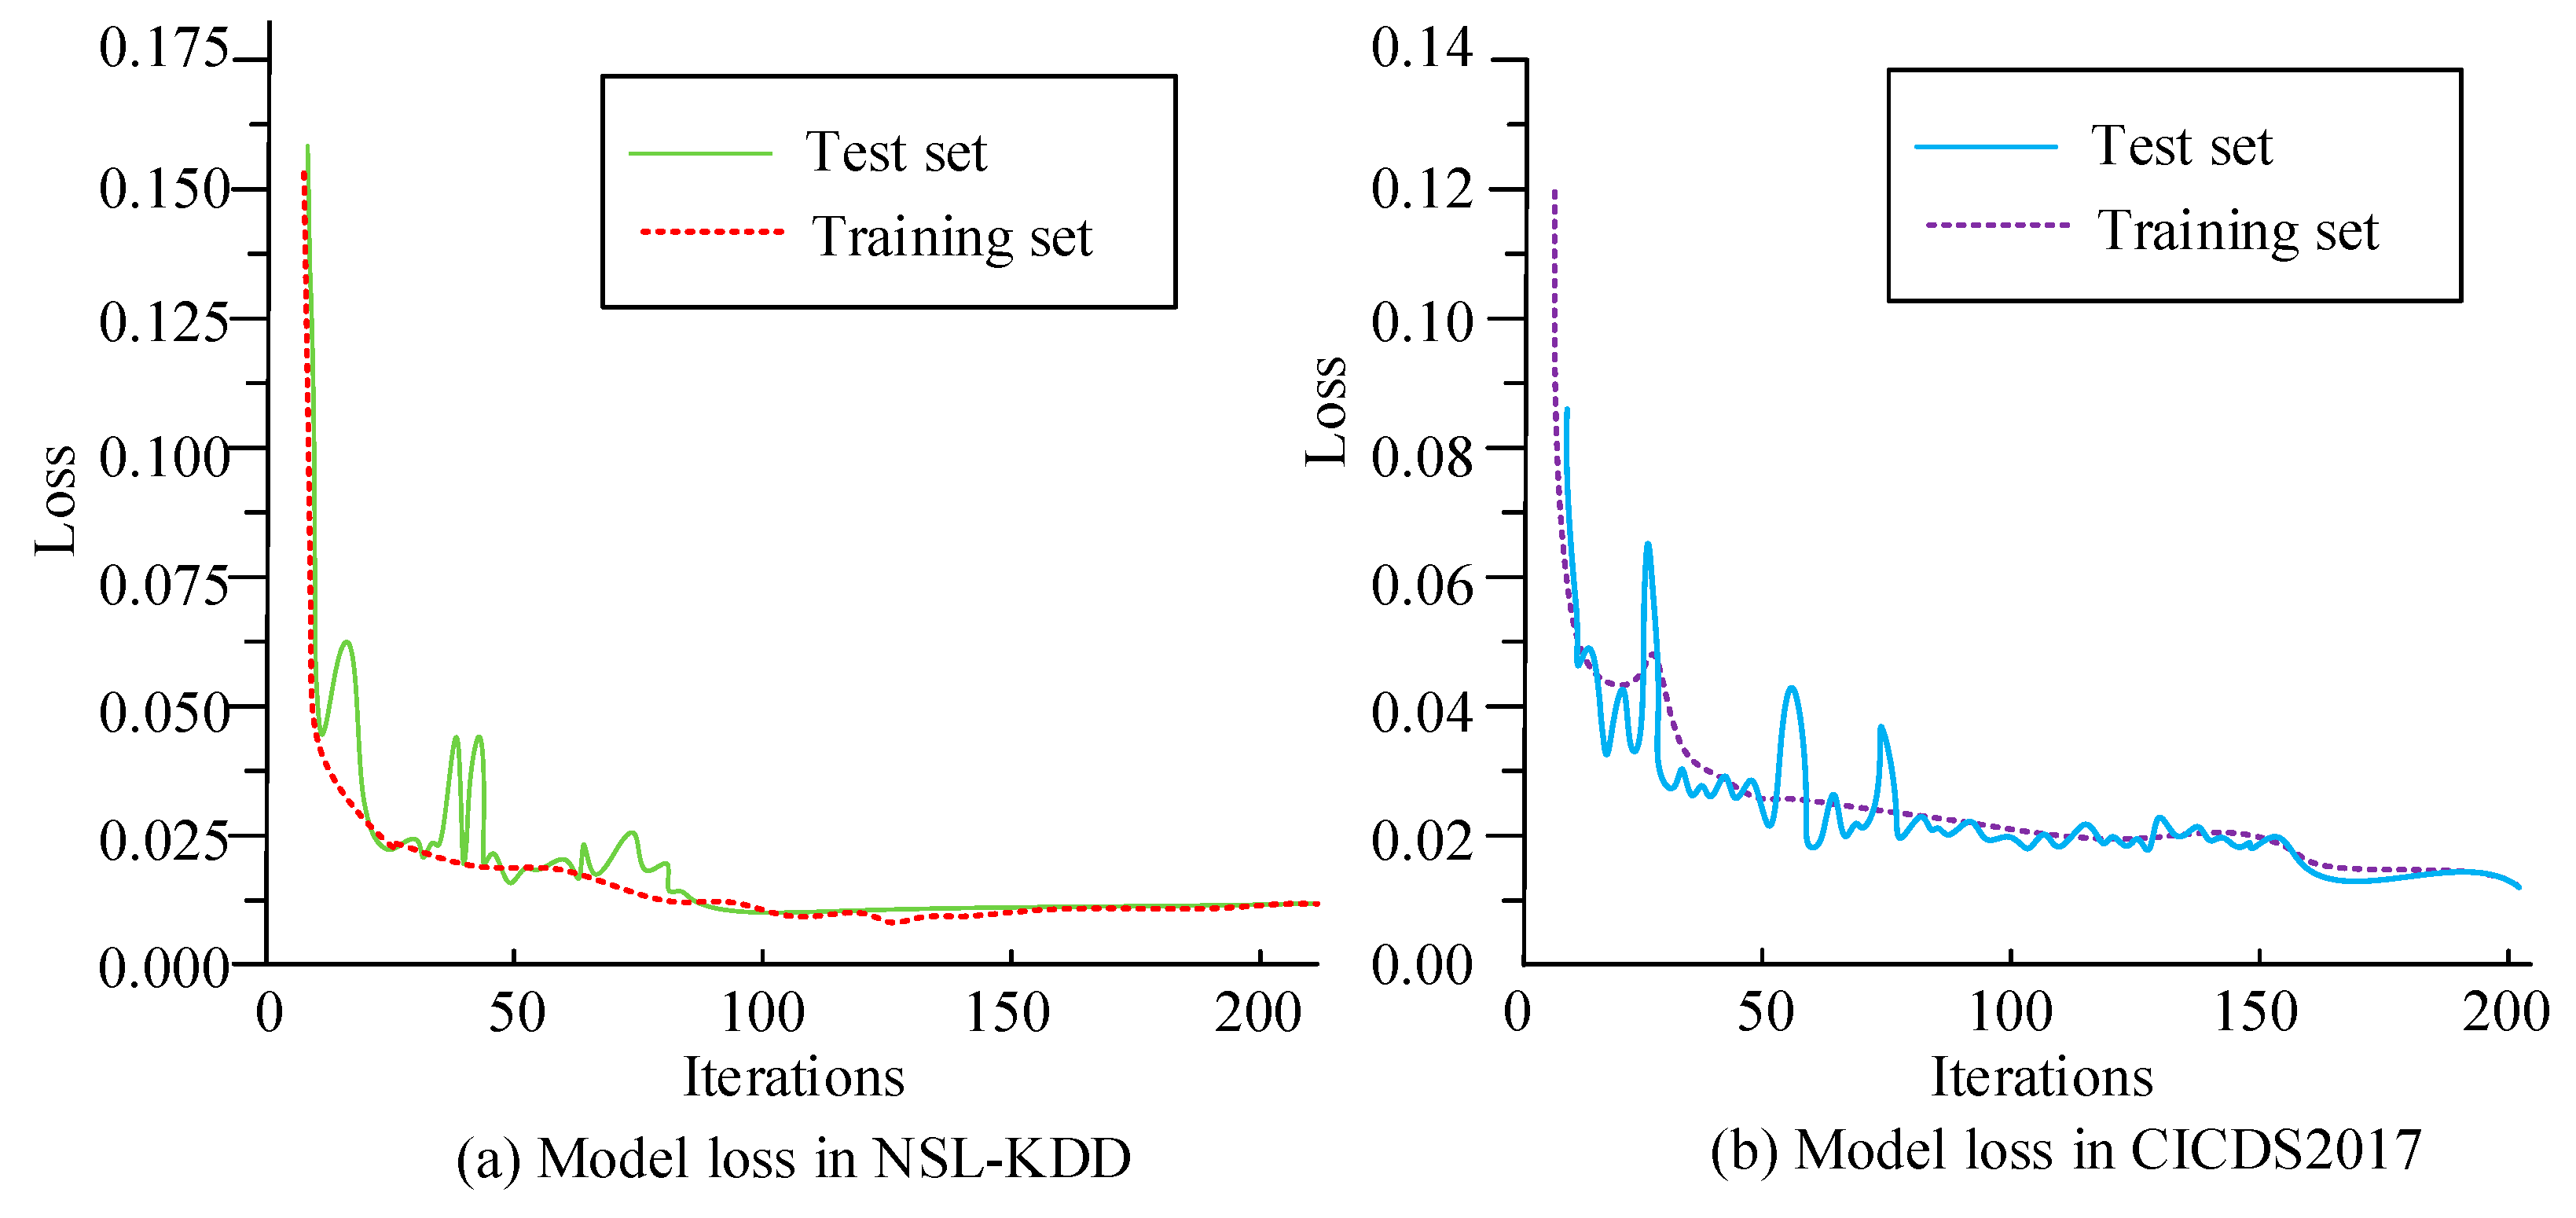
To verify the Bi-LSTM-based SGID model’s performance, two publicly available network security datasets, NSL-KDD and CICIDS2017, are utilized to assess the model, which are segmented into training and testing sets in a 7:3 ratio. The NSL-KDD and CICIDS2017 datasets contain a large amount of detailed information on network traffic characteristics and attack types, which is of great significance for training and evaluating intrusion detection models, and can provide valuable references and inspirations for intrusion detection research in smart grids. The NSL-KDD dataset is a binary anomaly detection dataset that uses 41 features to describe each flow. In addition, each traffic has a label, namely normal and abnormal, indicating whether the corresponding traffic is normal or abnormal. The CICIDS2017 dataset collected data for 5 days, each consisting of 79 feature attributes and 1 category label, with normal traffic accounting for 80% and attack traffic accounting for 20%. The open source code for the NSL-KDD dataset can be found on the website: https://github.com/AhmedMohammedAdel/NSL_KDD (accessed on 11 December 2024). The open source code for the CICIDS2017 dataset can be found on the website: https://github.com/beyzann/CICIDS2017_Dataset_Exploration_A1 (accessed on 11 December 2024). This study followed the research of Sivamohan S. et al. for parameter settings, which have been experimentally validated for their effectiveness and can therefore be used as a reference [26]. The iteration count was set to 200, epochs to 50, learning rate to 0.001, number of hidden layer neurons to 64, LSTM layers to 2, and Dropout to 0.2, and the Sigmoid activation function and Adam optimizer were used. The number of iterations is 200. Figure 9 shows the loss value variation curves of the proposed model in two datasets. In Figure 9a, in the NSL-KDD dataset, the model reaches convergence after about 50 iterations, and the final loss value remains stable at around 0.012. In Figure 9b, in the CICIDS2017 dataset, the curve rapidly decreases before 20 iterations of the model and then converges at approximately 50 iterations, with the final loss value stabilizing at around 0.02. This indicates that the SGID model based on Bi-LSTM has shown good convergence and fast convergence in different datasets.
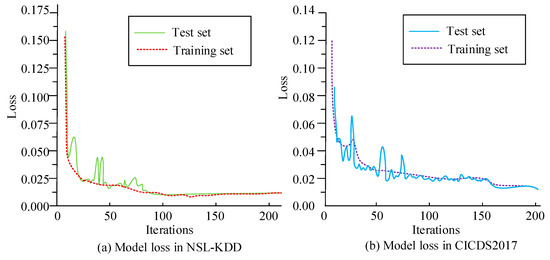
Figure 9.
The loss value variation curve of the proposed model.
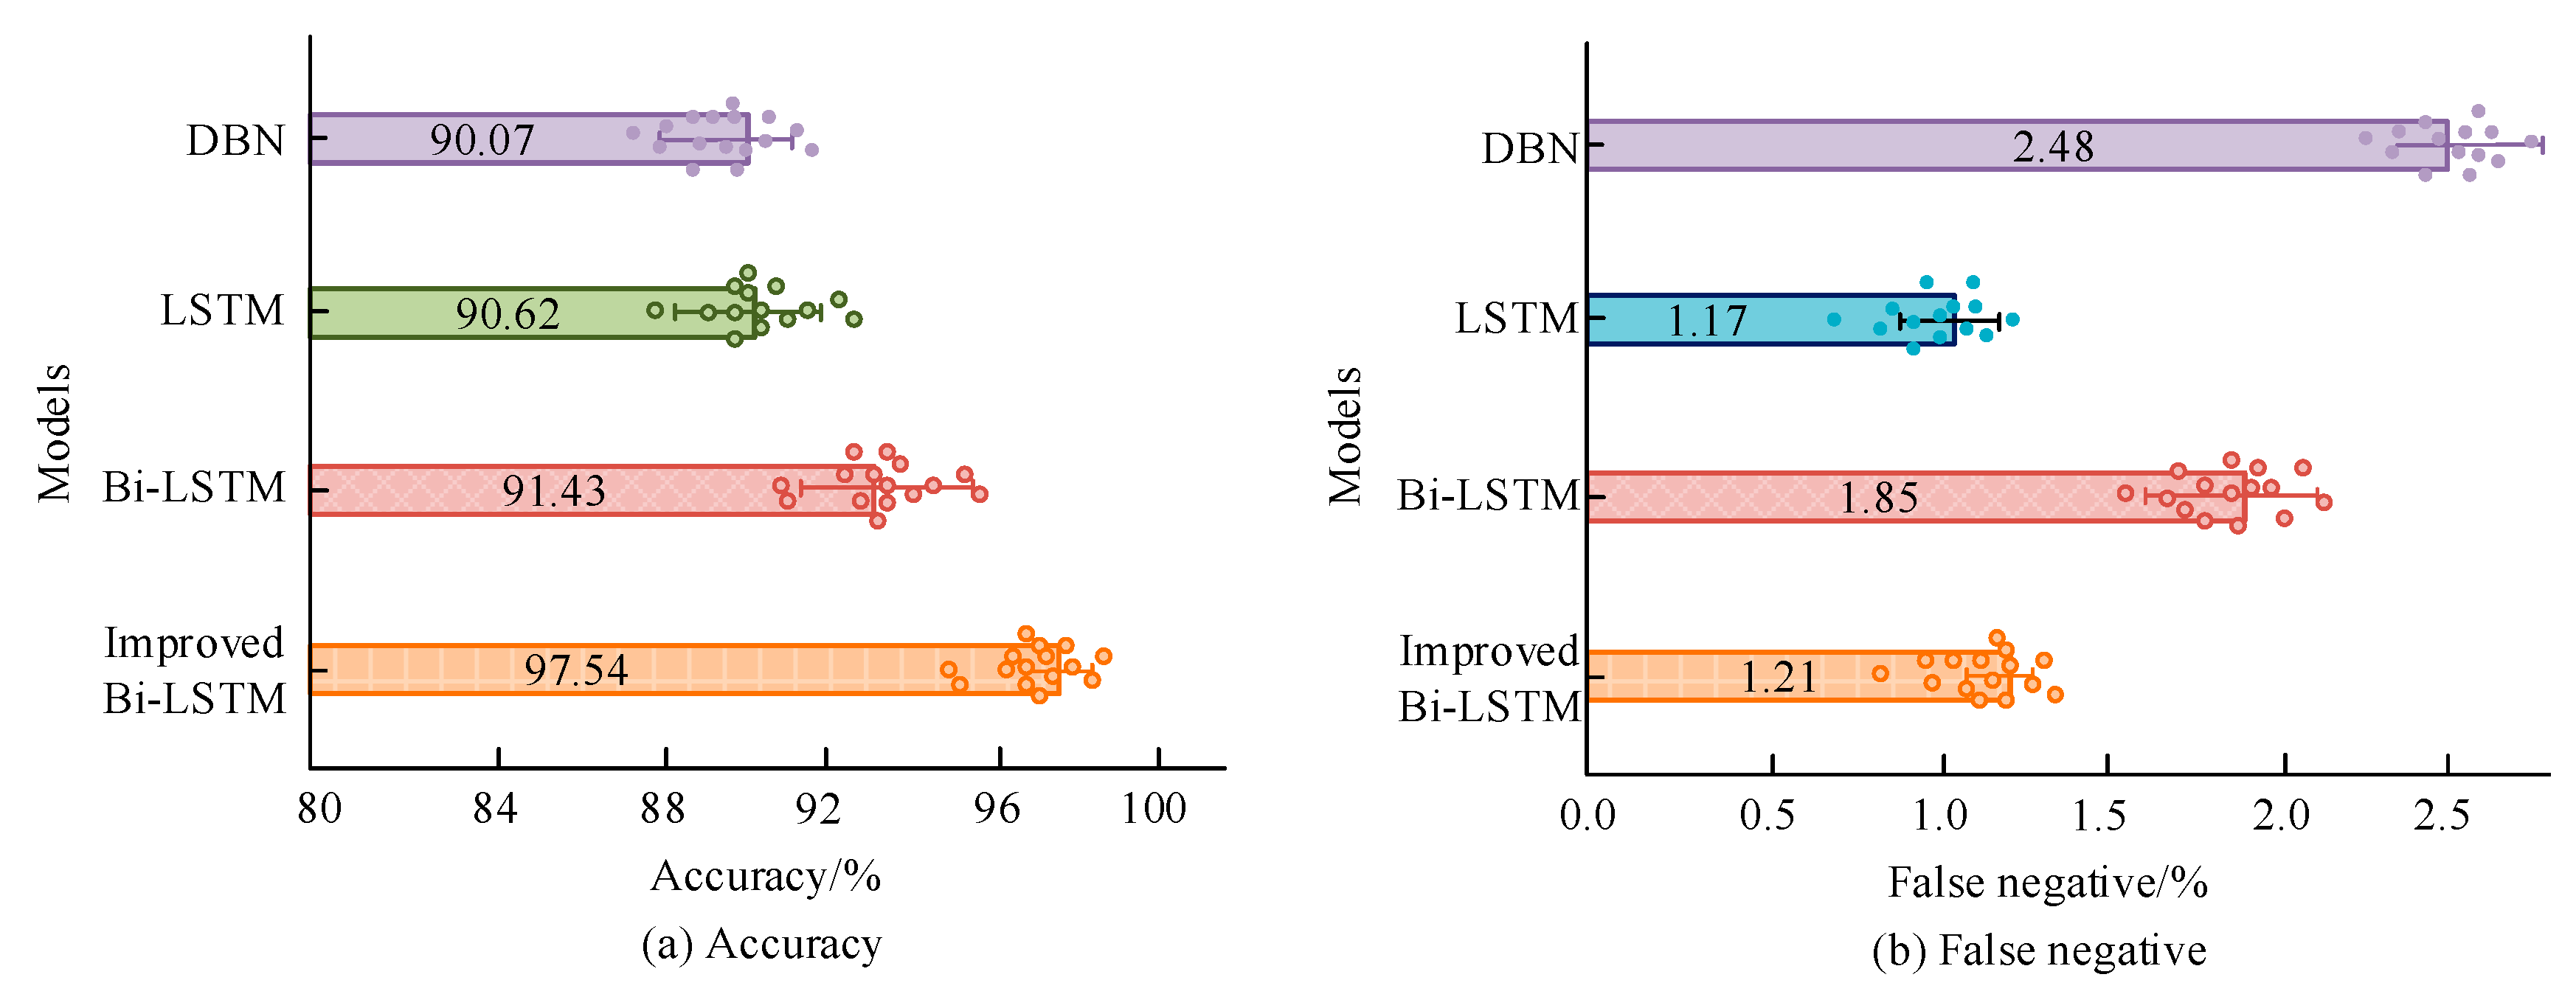
To verify the improvement effect of the proposed improvement strategy, the CICIDS2017 dataset is used, and the research model is compared with traditional DBN, LSTM, and Bi-LSTM using accuracy and False Negative Rate (FNR) as evaluation metrics, as listed in Figure 10. In Figure 10a, the detection accuracy of the research model is the highest (97.54%), followed by Bi-LSTM (91.43%), and DBN has the lowest detection accuracy (90.07%). In Figure 10b, the FNR of the research model is the lowest (1.21%), and the DBN is the highest (2.48%). The intrusion detection performance of the research model is superior to DBN and Bi-LSTM, indicating that this improvement strategy has certain effectiveness.

Figure 10.
Comparison of accuracy and FNR of four models.
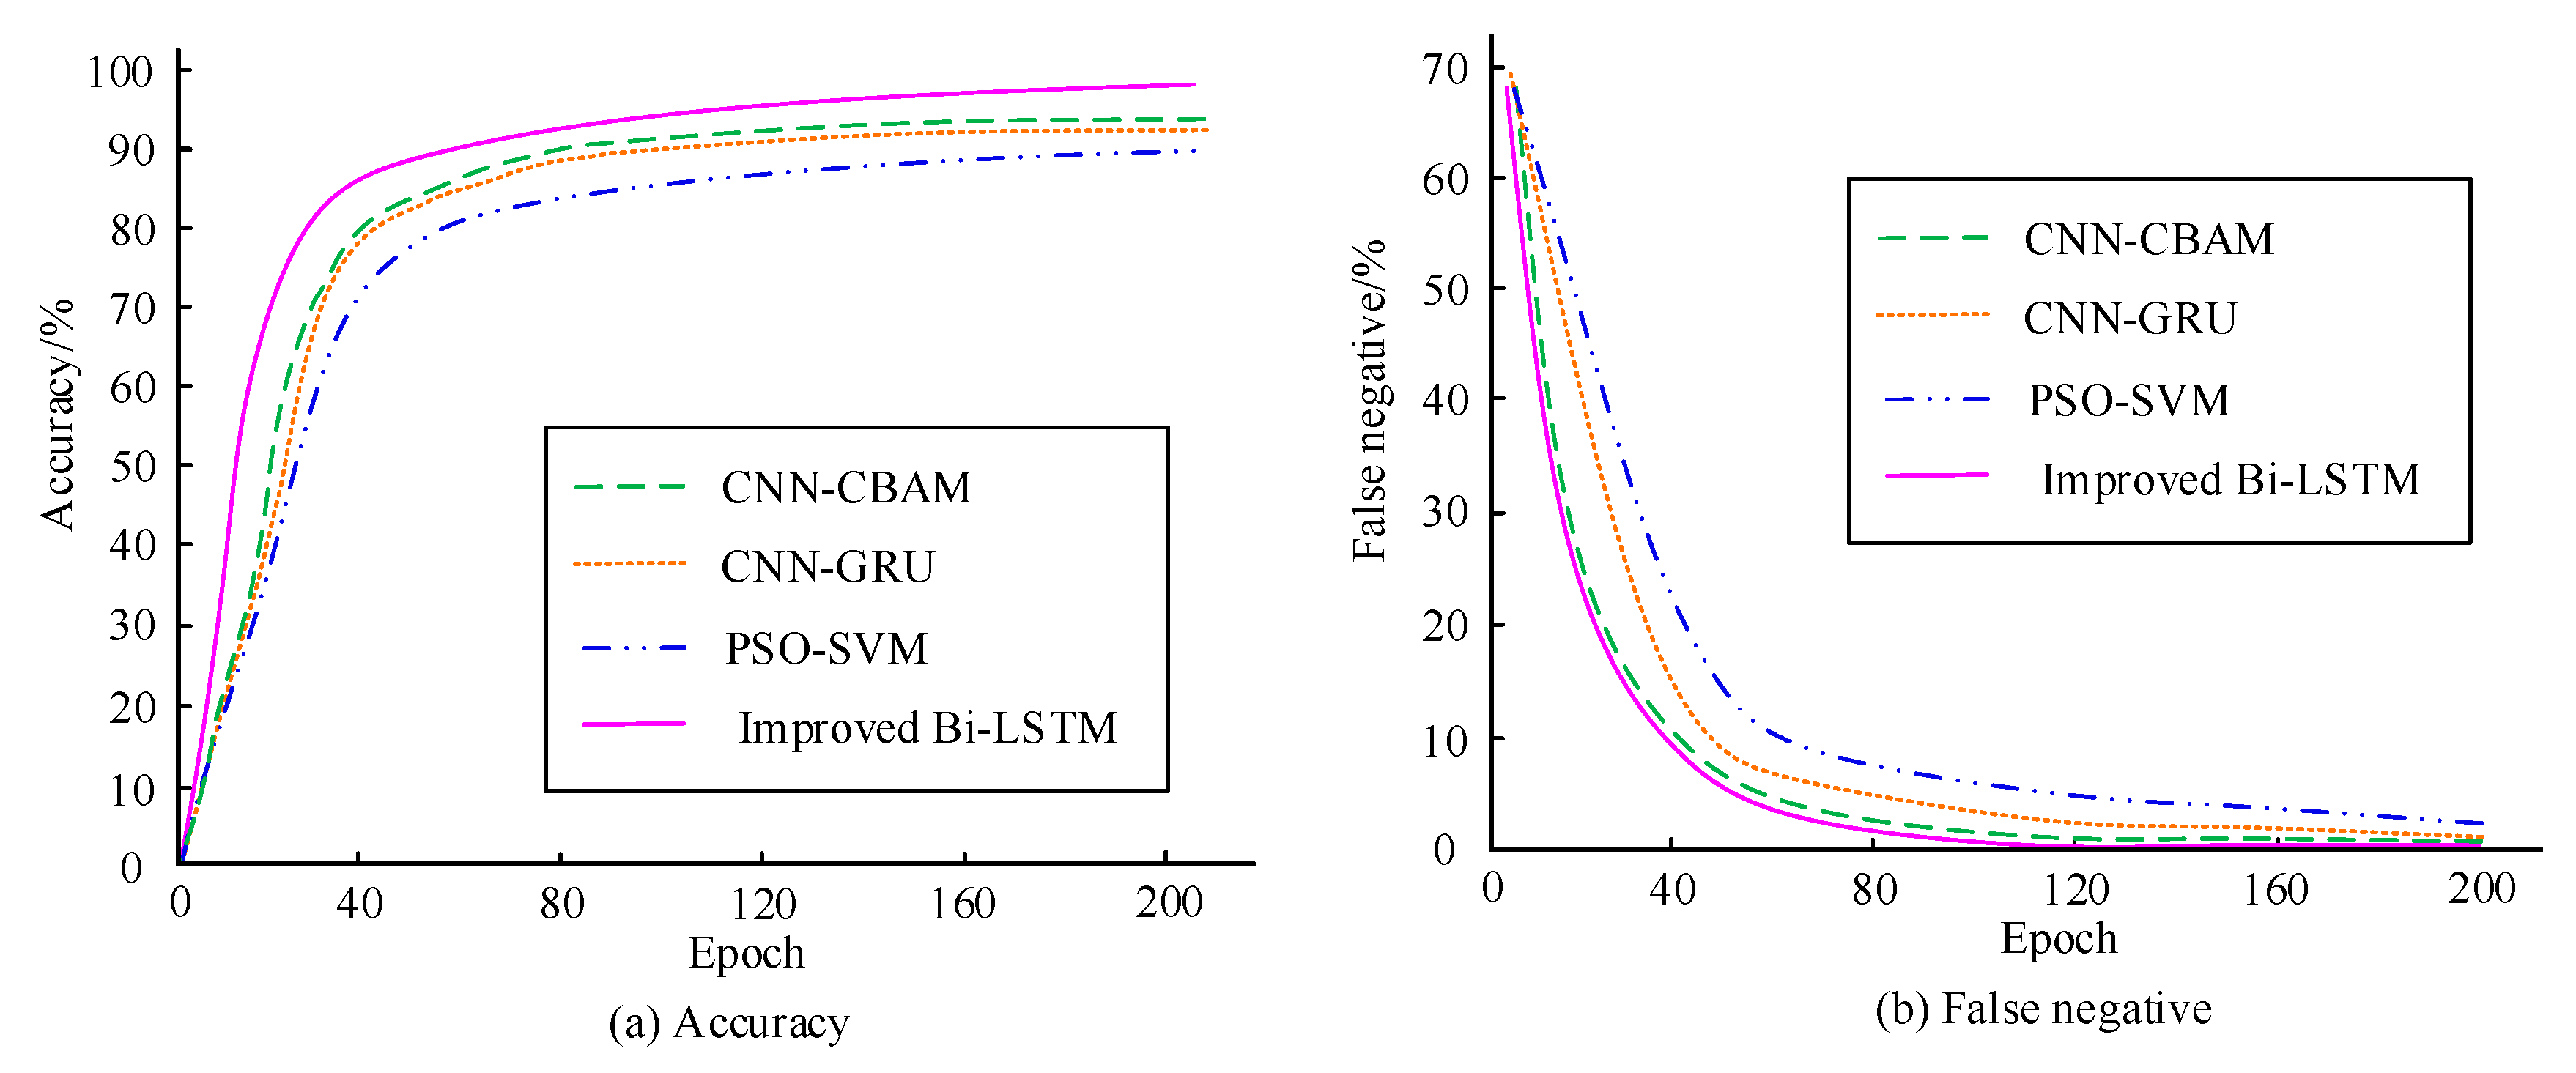
To further validate the superiority, it is compared with CNN-CBAM, CNN-GRU, and PSO-SVM. Figure 11 compares the intrusion detection performance of four models. In Figure 11a,b, the detection accuracy and FNR of the research model are higher than those of the comparison model. The detection performance of PSO-SVM is the worst. This indicates that the detection performance is good.
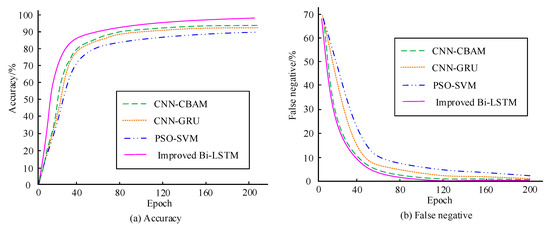
Figure 11.
Comparison of intrusion detection performance among four models.
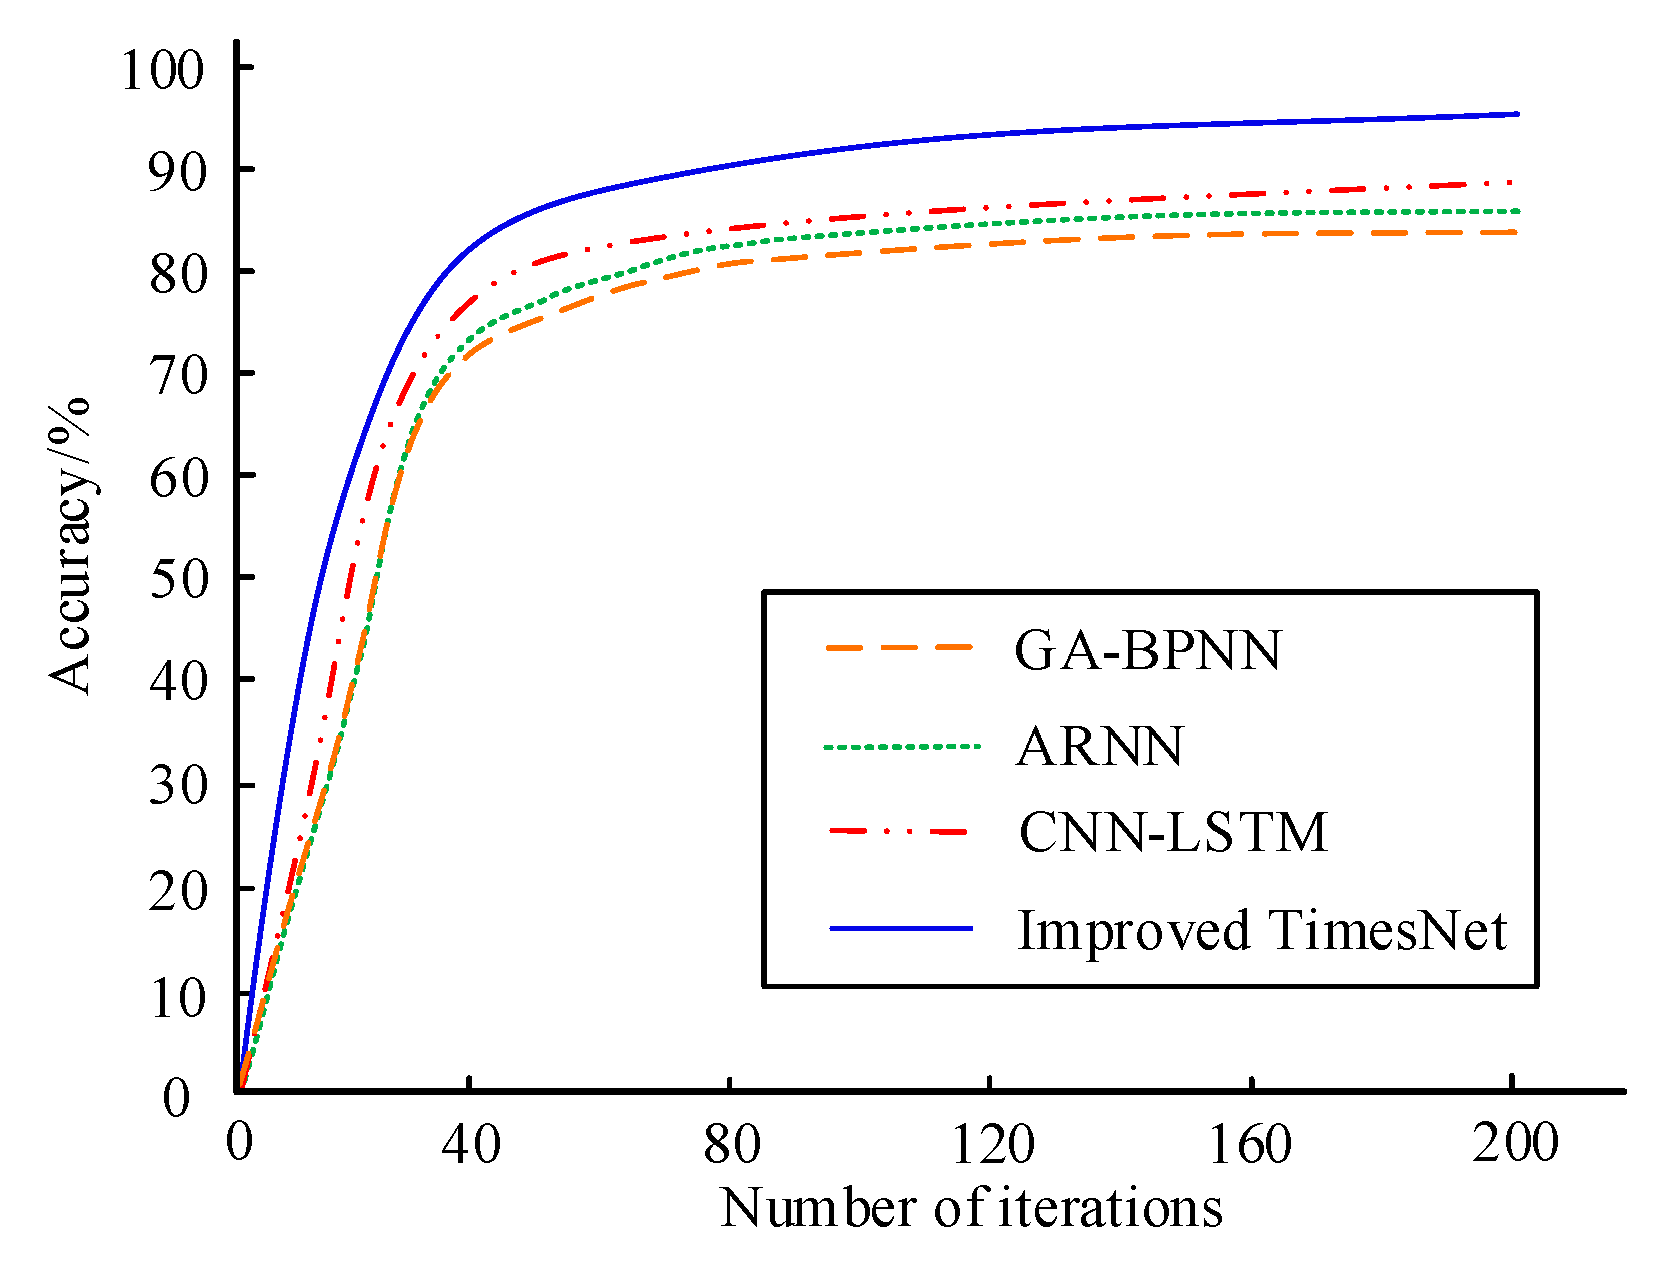
To further validate the performance of the proposed model in detecting advanced attacks, the Streamspot dataset was used for testing. The Streamspot dataset contains five normal behaviors and one attack behavior, with each scenario running 100 times. The accuracy comparison results of the above two models are shown in Figure 12. From Figure 12, it can be seen that the proposed model still has good detection performance when facing advanced attacks, with a detection accuracy of 95.36%.
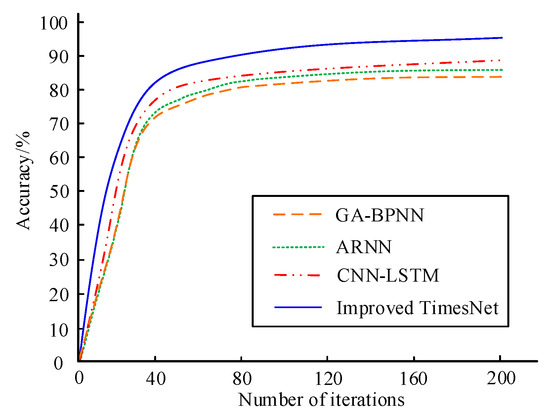
Figure 12.
Comparison of accuracy among four models.
5. Conclusions
To provide a reliable basis for SSG-NSR evaluation, this study constructed a TimesNet-based SGTBD model and a Bi-LSTM-based SGID model. In the experiment, as the window for electricity theft detection increased, the DR of the SGTBD model gradually increased and the FDR gradually decreased. When the proportion of electricity theft data was 25%, the FDR of the model was 3.52. The accuracy and recall of the complete model were the highest, at 97.15% and 96.45%. The accuracy and recall of the traditional TimesNet model were the lowest, at 90.47% and 89.43%. The AUC value of the proposed model was outperformed that of the comparative model, which was 0.98. The model performance in terms of DR, FDR, F1 value, and accuracy was superior to the comparative model, with scores of 97.04%, 1.21%, 92.69%, and 97.15%, respectively. The detection accuracy of the proposed SGID model was the highest, at 97.54%, followed by the Bi-LSTM (91.43%), and the DBN was the lowest (90.07%). The FNR of the proposed model was the lowest, at 1.21%. The FNR of DBN was the highest, at 2.48%. Traditional methods for detecting electricity theft include statistical analysis, machine learning models, and time series models. Among them, statistical analysis methods usually rely on manual experience and are difficult to capture complex time series patterns, resulting in a high false alarm rate. Machine learning models such as support vector machines and random forests are unable to effectively model long-term dependencies and nonlinear time relationships. LSTM and other time series models have poor adaptability to complex electricity consumption patterns. The smart grid electricity theft detection model based on TimesNet proposed by the research institute extracts time series features through Tsfresh and uses MIC algorithm for feature screening, which can better capture complex patterns and correlations in the data, thereby improving the performance of electricity theft detection. In summary, both the proposed SGTBD and SGID models have good detection performance, and their application in SSG-NSR evaluation can help improve the accuracy of the evaluation. In actual production environments, the data distribution of smart grids may differ from the training data of the model, which may affect the generalization ability of the model. And the model may face a lot of data cleaning and preprocessing work during implementation, and the diversity and complexity of data may have a certain impact on the performance of the model. To ensure the practical application effect of the proposed model, it is necessary to strengthen the cleaning and processing of data. However, while the proposed intrusion detection model improves detection performance, it also has high complexity and requires more training time. Therefore, future research should further explore lightweight power grid intrusion detection methods to improve the efficiency of SSG-NSR evaluation.
Author Contributions
Conceptualization, Y.C. and B.Z.; methodology, Y.C.; software, B.Z.; resources, B.Z.; data curation, B.Z.; writing—original draft preparation, Y.C.; writing—review and editing, B.Z.; project administration, Y.C.; funding acquisition, B.Z. All authors have read and agreed to the published version of the manuscript.
Funding
This work was supported by National Natural Science Foundation of China Youth Project (52307133).
Institutional Review Board Statement
Not applicable.
Informed Consent Statement
Not applicable.
Data Availability Statement
Publicly available datasets were analyzed in this study. This data can be found here: [https://github.com/AhmedMohammedAdel/NSL_KDD] [https://github.com/beyzann/CICIDS2017_Dataset_Exploration_A1] (accessed on 4 March 2025).
Conflicts of Interest
Author Yushu Cheng was employed by the company State Grid Shanxi Electric Power Company Marketing Service Center. The remaining authors declare that the research was conducted in the absence of any commercial or financial relationships that could be construed as a potential conflict of interest.
References
- Li, Y.; Yan, J. Cybersecurity of smart inverters in the smart grid: A survey. IEEE Trans. Power Electron. 2022, 38, 2364–2383. [Google Scholar]
- Bhattarai, T.N.; Ghimire, S.; Mainali, B.; Gorjian, S.; Treichel, H.; Paudel, S.R. Applications of smart grid technology in Nepal: Status, challenges, and opportunities. Environ. Sci. Pollut. Res. 2023, 30, 25452–25476. [Google Scholar] [CrossRef]
- Li, Y.; Wei, X.; Li, Y.; Dong, Z.; Shahidehpour, M. Detection of false data injection attacks in smart grid: A secure federated deep learning approach. IEEE Trans. Smart Grid 2022, 13, 4862–4872. [Google Scholar] [CrossRef]
- Li, J.; Gu, C.; Xiang, Y.; Li, F. Edge-cloud computing systems for smart grid: State-of-the-art, architecture, and applications. J. Mod. Power Syst. Clean Energy 2022, 10, 805–817. [Google Scholar] [CrossRef]
- Kim, Y.; Hakak, S.; Ghorbani, A. Smart grid security: Attacks and defence techniques. IET Smart Grid 2023, 6, 103–123. [Google Scholar] [CrossRef]
- Tuo, M.; Li, X. Security-constrained unit commitment considering locational frequency stability in low-inertia power grids. IEEE Trans. Power Syst. 2022, 38, 4134–4147. [Google Scholar] [CrossRef]
- Syrmakesis, A.D.; Alcaraz, C.; Hatziargyriou, N.D. Classifying resilience approaches for protecting smart grids against cyber threats. Int. J. Inf. Secur. 2022, 21, 1189–1210. [Google Scholar] [CrossRef]
- Vahidi, S.; Ghafouri, M.; Au, M.; Kassouf, M.; Mohammadi, A.; Debbabi, M. Security of wide-area monitoring, protection, and control (WAMPAC) systems of the smart grid: A survey on challenges and opportunities. IEEE Commun. Surv. Tutor. 2023, 25, 1294–1335. [Google Scholar] [CrossRef]
- Park, K.S.; Lee, J.Y.; Das, A.K.; Park, Y. BPPS: Blockchain-enabled privacy-preserving scheme for demand-response management in smart grid environments. IEEE Trans. Dependable Secur. Comput. 2022, 20, 1719–1729. [Google Scholar] [CrossRef]
- Chen, Y.; Zhang, N.; Yan, J.; Zhu, G.; Min, G. Optimization of maintenance personnel dispatching strategy in smart grid. World Wide Web 2023, 26, 139–162. [Google Scholar] [CrossRef]
- Ullah, M.H.; Eskandarpour, R.; Zheng, H.; Khodaei, A. Quantum computing for smart grid applications. IET Gener. Transm. Distrib. 2022, 16, 4239–4257. [Google Scholar] [CrossRef]
- Wu, L.; Shi, H.; Fu, S.; Luo, Y.; Xu, M. p2detect: Electricity theft detection with privacy preservation for both data and model in smart grid. IEEE Trans. Smart Grid 2022, 14, 2301–2312. [Google Scholar] [CrossRef]
- Shams, P.; Javaid, N.; Javed, M.U.; Houran, M.A.; Almasoud, A.M.; Imran, M. Electricity theft detection for energy optimization using deep learning models. Energy Sci. Eng. 2023, 11, 3575–3596. [Google Scholar]
- Liao, W.; Yang, Z.; Liu, K.; Zhang, B.; Chen, X.; Song, R. Electricity theft detection using Euclidean and graph convolutional neural networks. IEEE Trans. Power Syst. 2022, 38, 3514–3527. [Google Scholar] [CrossRef]
- Wang, X.; Xie, H.; Tang, L.; Chen, C.; Bie, Z. Decentralized privacy-preserving electricity theft detection for distribution system operators. IEEE Trans. Smart Grid 2023, 15, 2179–2190. [Google Scholar] [CrossRef]
- Zuo, C.; Wang, J.; Liu, M.; Deng, S.; Wang, Q. An ensemble framework for short-term load forecasting based on timesnet and tcn. Energies 2023, 16, 5330. [Google Scholar] [CrossRef]
- Yan, H.; Tai, K.; Liu, M.; Wang, Z.; Yang, Y.; Zhou, X.; Zheng, Z.; Gao, S.; Wang, Y. A Method for Locating Wideband Oscillation Disturbance Sources in Power Systems by Integrating TimesNet and Autoformer. Electronics 2024, 13, 3250. [Google Scholar] [CrossRef]
- Tu, S.; Zhang, Y.; Zhang, J.; Fu, Z.; Zhang, Y.; Yang, Y. Powerpm: Foundation model for power systems. Adv. Neural Inf. Process. Syst. 2025, 37, 115233–115260. [Google Scholar]
- Yao, R.; Wang, N.; Ke, W.; Chen, P.; Sheng, X. Electricity theft detection in unbalanced sample distribution: A novel approach including a mechanism of sample augmentation. Appl. Intell. 2023, 53, 11162–11181. [Google Scholar] [CrossRef]
- Mohamed, B.; Yassine, B.A. Enhanced video temporal segmentation using a Siamese network with multimodal features. Signal Image Video Process. 2023, 17, 4295–4303. [Google Scholar] [CrossRef]
- Zhai, Q.; Liu, Z.; Song, Z.; Zhu, P. An improved high-dimensional Kriging modeling method utilizing maximal information coefficient. Eng. Comput. 2023, 40, 2754–2775. [Google Scholar] [CrossRef]
- Ding, T.; Wu, D.; Li, Y.; Shen, L.; Zhang, X. A hybrid CEEMDAN-VMD-TimesNet model for significant wave height prediction in the South Sea of China. Front. Mar. Sci. 2024, 11, 1375631. [Google Scholar] [CrossRef]
- Luo, J.; Zhao, C.; Chen, Q.; Li, G. Using deep belief network to construct the agricultural information system based on Internet of Things. J. Supercomput. 2022, 78, 379–405. [Google Scholar] [CrossRef]
- Khullar, S.; Singh, N. Water quality assessment of a river using deep learning Bi-LSTM methodology: Forecasting and validation. Environ. Sci. Pollut. Res. 2022, 29, 12875–12889. [Google Scholar] [CrossRef]
- Badr, M.M.; Mahmoud MM, E.A.; Abdulaal, M.; Aljohani, A.J.; Alsolami, F.; Balamsh, A. A novel evasion attack against global electricity theft detectors and a countermeasure. IEEE Internet Things J. 2023, 10, 11038–11053. [Google Scholar] [CrossRef]
- Sivamohan, S.; Sridhar, S.S. An optimized model for network intrusion detection systems in industry 4.0 using XAI based Bi-LSTM framework. Neural Comput. Appl. 2023, 35, 11459–11475. [Google Scholar] [CrossRef]
Disclaimer/Publisher’s Note: The statements, opinions and data contained in all publications are solely those of the individual author(s) and contributor(s) and not of MDPI and/or the editor(s). MDPI and/or the editor(s) disclaim responsibility for any injury to people or property resulting from any ideas, methods, instructions or products referred to in the content. |
© 2025 by the authors. Licensee MDPI, Basel, Switzerland. This article is an open access article distributed under the terms and conditions of the Creative Commons Attribution (CC BY) license (https://creativecommons.org/licenses/by/4.0/).