Article

Development of a Short-Range Multispectral Camera Calibration Method for Geometric Image Correction and Health Assessment of Baby Crops in Greenhouses

DAFE, Department of Agricultural Forest Food and Environmental Sciences, University of Basilicata, 85100 Potenza, Italy
*
Author to whom correspondence should be addressed.
Appl. Sci. 2025, 15(6), 2893; https://doi.org/10.3390/app15062893
Submission received: 30 January 2025 / Revised: 4 March 2025 / Accepted: 5 March 2025 / Published: 7 March 2025
(This article belongs to the Special Issue Advances in Automation and Controls of Agri-Food Systems)

Abstract

:
Multispectral imaging plays a key role in crop monitoring. A major challenge, however, is spectral band misalignment, which can hinder accurate plant health assessment by distorting the calculation of vegetation indices. This study presents a novel approach for short-range calibration of a multispectral camera, utilizing stereo vision for precise geometric correction of acquired images. By using multispectral camera lenses as binocular pairs, the sensor acquisition distance was estimated, and an alignment model was developed for distances ranging from 500 mm to 1500 mm. The approach relied on selecting the red band image as a reference, while the remaining bands were treated as moving images. The stereo camera calibration algorithm estimated the target distance, enabling the correction of band misalignment through previously developed models. The alignment models were applied to assess the health status of baby leaf crops (Lactuca sativa cv. Maverik) by analyzing spectral indices correlated with chlorophyll content. The results showed that the stereo vision approach used for distance estimation achieved high accuracy, with average reprojection errors of approximately 0.013 pixels (4.485 × 10⁻⁵ mm). Additionally, the proposed linear model was able to explain reasonably the effect of distance on alignment offsets. The overall performance of the proposed experimental alignment models was satisfactory, with offset errors on the bands less than 3 pixels. Despite the results being not yet sufficiently robust for a fully predictive model of chlorophyll content in plants, the analysis of vegetation indices demonstrated a clear distinction between healthy and unhealthy plants.

1. Introduction

Plant health is crucial for agricultural success as it can be affected by biotic and abiotic stress. Real-time monitoring of plant physiological status helps identify signs of stress conditions and disease, enabling early intervention. Advanced techniques like multispectral and hyperspectral imaging provide spectral and spatial information, making them useful for food and agricultural applications. The ability of multispectral cameras to collect data on a limited number of spectral bands, as opposed to hyperspectral imaging, allows for a more rapid and cost-effective assessment of plant physiology, including size, shape, and color, but also presents the potential for disease detection [1]. The most well-known applications are the use of satellites and drones as they are designed to survey large areas due to their small size and cost accessibility [2].
The main disadvantages of the remote sensing (RS) approach are the lower sensitivity and spatial resolution of the images, which are only useful for providing the evolution of the average state of a field [3]; the acquisition of more detailed data on the state of individual plants requires close-up images, such as those mounted on rovers [4].
More and more proximal sensing platforms have been applied to identify differences in plant physiology due to growth and responses to stresses.
Over the last few years, several researchers have proposed phenotyping platforms to estimate several morphological indices for plants grown in greenhouses, such as weight, height, and leaf area [5,6], supporting cultivation and weed management decisions [7]. Commercially available systems (e.g., the PlantEyeF500 (PE) 3D scanner) have been commonly employed to support weed management [7] and to monitor physiological crop stress [8]. On the other hand, other research lines have developed prototype designs: hyperspectral imaging (HSI) was implemented to monitor the detrimental effects of salinity on the physiological and biochemical processes of okra [9]. Similarly, [10] developed a low-cost hyperspectral camera, Senop HSC-2, within an HTP platform to evaluate the drought stress resistance and physiological responses of four tomato genotypes. Recently, [11] developed a mobile platform equipped with a commercial multispectral camera (RedEdge-MX) at close range to characterize the water stress response in poplar seedlings (Populus L.). Meanwhile, hyperspectral proximal sensing was trained to detect short-term water drought effects in broccoli [12]. A miniaturized multicamera imaging sensor to simplify the analysis of physiological indices in lettuce was proposed by [13]. A rotating wheel of interchangeable band-pass filters in the optical visible and near-infrared (VIS-NIR) and thermal, long-wave infrared (LWIR) ranges was proposed as a low-cost solution for multispectral camera-based scouting systems [14].
In contrast to traditional point spectroscopy, imaging spectroscopy allows it to be easier to automatically obtain spectral data from specific crop regions. To identify and detect drought stress [8,12,15], weed competition [7], the impact of environmental changes [16], and nutrient deficits [17] and to distinguish between various types of stress [18], multispectral and hyperspectral imaging has proven to be effective.
Specifically, compared with conventional visual observations, changes in the concentration of pigments such as anthocyanins [19] and chlorophyll [20] can be identified with significantly higher sensitivity. Spectral indices are now frequently used to track the health of plants since they offer an indirect measure of photosynthetic capability [21]. By analyzing these indices, possible issues throughout different temporal and spatial domains can be promptly diagnosed, and resource management, such as water and fertilizers, is enhanced [22]. Several vegetation indices, including the Normalized Difference Vegetation Index (NDVI), the Normalized Difference Red Edge Index (NDRE), the Anthocyanin Reflectance Index (ARI), and others, have been developed using multispectral signatures, which can be used to evaluate plant health [16,17,18] or deficiencies in water or nutrients [8,10,11,12,23].
Hence, prevention of crop yield losses and early detection of plant stresses are the goals of a multispectral imaging system that can automate agricultural management [14]. Although the integration of sensors is considered one of the major advantages underlying short-range phenotyping platforms [14], the acquisition of images from one or more sensors or different points of view has emerged as an open challenge in the field of image analysis [1]. Misalignment is particularly problematic when using low-altitude imaging systems that capture images from non-orthogonal angles relative to the plant surface. This can lead to significant errors in spectral index calculations, compromising the quality of the analysis and, consequently, the accuracy of crop health diagnoses [24].

Related Work

Recent studies have highlighted the relevance of image registration methods in the case of non-georeferenced multispectral images acquired at close range, for example, to identify the presence of powdery mildew on cucumber plants [25], water stress on lettuce [23], identification of weeds in wheat [26], and the effects of potassium water deficit in cassava [27]. The Scale-Invariant Feature Transform (SIFT) algorithm [27] and Speeded-Up Robust Features (SURF) [28] are commonly used for feature detection, based on the alignment of fixed and moving image spaces.
One of the main advantages of these methods is that they are invariant to scale changes. SIFT is also invariant to orientation and illumination [29]; however, it struggles with processing time constraints. In contrast, SURF was developed to overcome this issue [30].
With the increasing use of computer vision, other feature detection techniques have been proposed, such as KAZE, AKAZE, ORB, and BRISK, with an overview and comparison provided by [31].
Although registration techniques differ in preserving image parameters like scale, angles, etc., they are based on affine transformations. An affine transformation combines translation, rotation, scaling, and image shearing (parallel distortion). According to the comparative analysis proposed by [32], the affine transformation was found to be the most accurate in terms of multispectral image registration accuracy (RMSE < 1 pixel). Applying automatic image registration techniques has been the focus of several researchers, who have found success using open-source programming. Different sensor perspectives have been used to test registration algorithms in complex ecosystems [28] and on individual plants [27].
As previously discussed in [24], there is a lack of a metric to adjust the registration offset of images related to changes in the sensor acquisition distances.
Therefore, the main objective of this work was to further explore the implications of sensor acquisition distance in the calibration of multispectral imaging systems by addressing the gaps in image alignment. Specifically, this study focused on developing a robust model to quantify and compensate for alignment discrepancies from different sensor acquisition distances and evaluate the applicability to physiological stress analysis in crops.
Furthermore, to extend the utility of multispectral imaging in agriculture, this work investigated the potential of stereo vision applied to multispectral images to propose a single automated system to calculate the distance between the target and the sensor in real time.

2. Materials and Methods

2.1. Stereo Camera Calibration

Camera calibration aims to establish the transformation from the three-dimensional (3D) real world to two-dimensional (2D) digital images. In general, the simplest case assumes that the camera operation can be described by an ideal pinhole model, known as the Pinhole model [33].
Briefly, by using a pattern with known dimensions, a reference point system is defined in the real world as P1, …, Pn. When these points are projected onto the image captured by the camera, they generate corresponding image points p1, …, pn.
The relationship between points in 3D space, Pi = [Xi, Yi, Zi, 1]T, and their corresponding points in the image, pi = [xi, yi, 1]T, excluding the effects of translation (T) and rotation (R), is described by the camera matrix M.
In its simplified form, the relationship between Pi and pi is expressed as
piMPi
where pi represents the homogeneous coordinates of the point in the 2D image, Pi represents the homogeneous coordinates of the point in 3D space, and M is a (3 × 4) matrix describing the camera projection.
This matrix combines both intrinsic parameters (which describe the optical and geometric properties of the camera) and extrinsic parameters (which define the camera’s position and orientation relative to the scene), as follows:
M = K⋅[RT]
where K is a (3 × 3) matrix containing the intrinsic parameters, R is a (3 × 3) rotation matrix that defines the camera’s orientation, and T is a (3 × 1) translation vector that represents the camera’s position.
Similarly, when working with a multicamera (stereo) system, it is possible to determine the geometric relationship (rotation and translation) between the two captured images [34]; this process is known as stereo calibration.
Stereo calibration is commonly used in autonomous vehicle navigation to estimate the geometric and optical parameters related to the position of the stereo system [35].
As is well known, the relationship between homologous points in the left and right images of a stereo pair (known as disparity (d)) allows for the determination of the depth (Z) of the captured scene. This is given by the equation
Z = f × B/d
where f is the focal length of the sensor, B is the baseline distance between the camera pair, and d is the disparity.
Experimental images of a checkerboard pattern (35 mm squares, printed on an A3 sheet and fixed to a rigid plywood surface) were acquired at distances ranging from 500 mm to 1500 mm, in 100 mm steps.
For each distance, five different image positions were captured using a MicaSense RedEdge P™ multispectral (MS) camera (AgEagle Aerial Systems Inc., Wichita, KS, USA). This camera featured a sensor resolution of 1456 × 1088 pixels (1.6 MP per band) and captured images in five spectral bands: blue (B) (475 nm ± 32 nm), green (G) (560 nm ± 27 nm), red (R) (668 nm ± 14 nm), red edge (RE) (717 nm ± 12 nm), and NIR (NR) (842 nm ± 57 nm). The proposed binocular system (Figure 1) utilized the red (R) band sensor as a fixed reference lens, while the sensors of the other spectral bands (G, B, NIR, and RE) functioned as relative lenses.
The acquired images were processed using the flowchart proposed by [36] within the Camera Calibration Toolbox in MATLAB software (2023b) [37]. The stereo calibration process was implemented using the “estimateCameraParameters” function, which enabled the calculation of the geometric parameters (R, T, relative pose of the cameras, and reprojection error) for each image pair.
The reprojection error, defined as the difference (in pixels) between the detected fiducial points in the acquired images and their estimated positions (projected onto the image plane using the calibration parameters), was used to evaluate the goodness of the calibration.
Subsequently, the calibration parameters were applied to a new set of images to validate the system’s accuracy in 3D reconstruction. In this phase, the distance to a known target, a potted plant, was estimated using images acquired at fixed distances (800 mm, 1000 mm, 1300 mm, and 1400 mm). The distance between the camera lens and the target was calculated by determining the Z-component (depth) in the 3D reconstruction space, corresponding to a region of interest (ROI).
To reduce computing time, the depth (Z) was calculated using up to 150,000 randomly selected points within the ROI. This approach optimized the computation time while maintaining accuracy. Finally, the relative error provided an indication directly related to the accuracy of the system in terms of depth measurement in real-world scenarios.

2.2. Image Registration

Image alignment aims to overlay two or more images using spatial transformations such as translations, rotations, and cropping [38]. Typically, images are aligned by selecting one image as the reference image and aligning it with the others (referred to as the moving images).
The evaluation of the geometric transformations (offsets) required for the alignment of the multispectral (MS) bands was carried out according to the experimental setup described in previous work [24].
In summary, a checkerboard pattern was captured at distances ranging from 500 mm to 1500 mm from the sensor. For each distance, five different image positions were captured to enable the calculation of geometric offsets between the bands from more viewpoints. Once again, the R band was chosen as the reference.
Three methods were selected for image alignment: the CB (checkerboard) and FT (Fourier transform) methods, as described in [24], combined with a conventional method. The conventional method consisted of the RG (rigid transformation), which involved a rigid affine transformation based on the similarity of homologous points between images. This method is available in the Image Processing Toolbox™ in MATLAB (2023b), MathWorks.
Briefly, while the CB and RG methods used affine transformations to align images while maintaining geometry and proportions, the FT method used a transformation in frequency domain, identifying a principal point to correct misalignment. The inclusion of the RG (rigid transformation) method as a conventional approach allowed us to verify the performance of the previously used CB (checkerboard) and FT (Fourier transform) methods under comparable conditions.
Due to the effect of the sensor acquisition distance on the geometric offsets required to align the bands, an interpolation model of the experimental data was established to fit the alignment.
The proposed interpolation model follows an inverse linear behavior, as described by the equation y = a + b/x. In this equation, y represents the offset, x is the distance, and a and b are model parameters estimated through the analysis of experimental data.
From a physical perspective, the value of the constant a can be interpreted as the minimum geometric offset for alignment, while b represents a weighting factor between the offset (y) and the distance (x).
As the distance increases (x), the term b/x approaches zero, and therefore, y approaches the value of a. Under these conditions, the geometric offset is minimally affected by the distance, and the model simplifies to ya.
On the contrary, as the distance decreases (x → 0), the term b/x increases, thereby significantly affecting the offset (y).
The relationship expressed by the model is particularly useful in contexts where the geometric offset is strongly dependent on the distance between the sensor and the measurement object, such as in close-range applications.

2.3. Crop Health Assessment

Baby leaf lettuce (Lactuca sativa cv. Maverik) plants grown in greenhouses were used to test the performance of the multispectral image alignment model. Images of individual baby lettuce leaves were acquired using the multispectral camera at a distance of 1 m from the ground.
Images were collected from two groups of plants: lettuce grown under a conventional irrigation system (healthy) and lettuce not irrigated for 7 days (unhealthy). For each group, 100 images were acquired. To assess the physiological condition of the leaves, chlorophyll concentration (μmol/m2) was measured using an Apogee MC-100 Portable Chlorophyll Meter (Apogee Instruments, Inc., 721 West 1800 North, Logan, UT, USA).
Several vegetation indices (VIs) (listed in Table 1) were calculated for each leaf following the application of the alignment models. The mean value of individual leaves was used to correlate spectral variations with chlorophyll content. Additionally, the NDVI with a threshold of 0.40 was applied as a binary mask to calculate the leaf area (cm2).
Image analysis and vegetation index calculations were performed using MATLAB software (2023b) from MathWorks.

3. Results

3.1. Stereo Camera Calibration

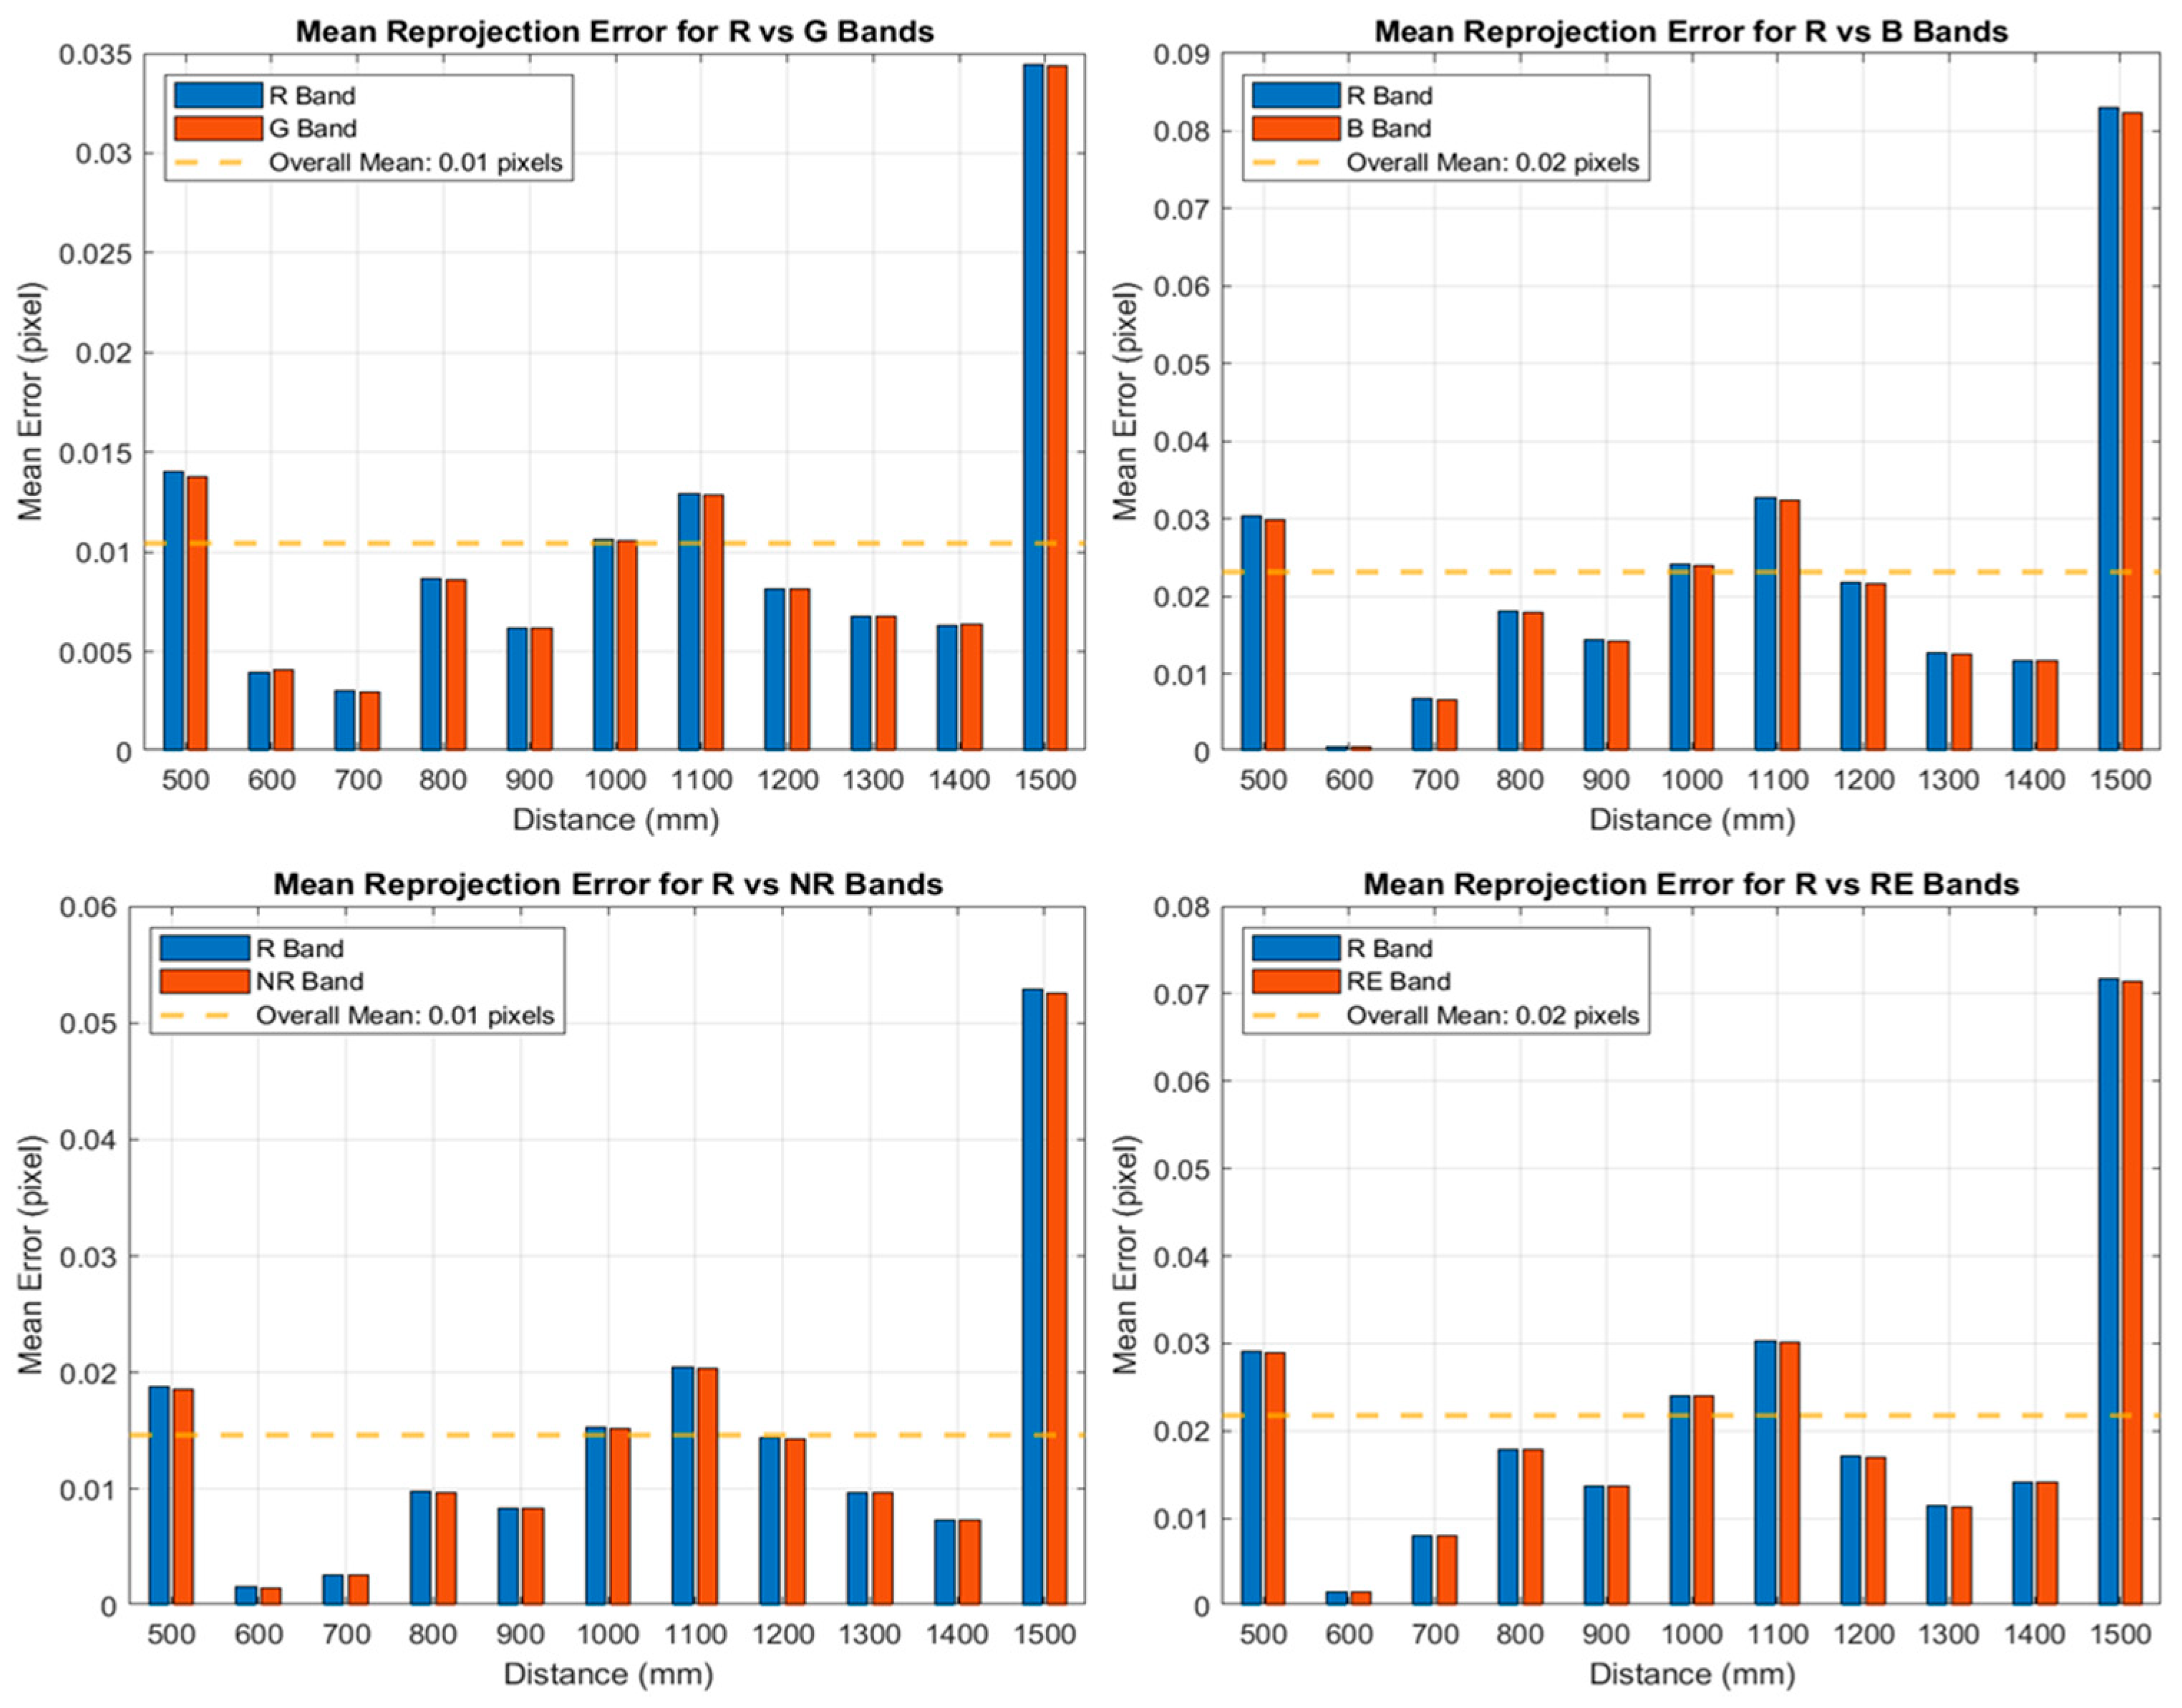
The reprojection error, expressed as the mean value on the X- and Y-axis of the fiducial points found in the chosen pair of bands, clearly showed the bias on calibration accuracy (Figure 2).
The overall trend of the reprojection error for several bands (G, B, NIR, and RE) showed a uniform behavior for all pairs of bands relative to the distance.
Notably, higher errors were observed at extreme distances (500 mm and 1500 mm), while the lowest error values occurred at intermediate distances, particularly between 600 mm and 700 mm, for both the X and Y coordinates. The reprojection error tended to increase with increasing distance, as shown in previous studies [45], while the error at lower distances could be due to the high resolution of the camera, which reduced the detected fiducial point size at these distances during the calibration process. However, the bands showed differing behavior for errors along the axes. While the B and RE bands exhibited lower accuracy along the X axis, the error along the Y axis was generally more significant for the G band. The NR band, conversely, showed a homogeneous trend across both axes, with no notable impact from a single axis.
Despite these variations, the average values of the reprojection error, calculated for both the x- and y-axis, at the analyzed distances indicated a well-calibrated model. Figure 3 shows that the overall reprojection error of calibration patterns was much less than 1 pixel. This result demonstrated that despite the observed variability, the system maintained good accuracy for practical applications within the calibration range.
Table 2 summarizes the performance of the depth estimation (Z) in mm at several distances for the spectral band combinations (G vs. R, B vs. R, NR vs. R, and RE vs. R). Overall, it was observed that the percentage error (Err%) associated with each stereo system increased proportionally to the distance. As expected, this behavior reflected the performance limitations previously identified in the calibration dataset. The best results were observed at the shortest distance (800 mm), with percentage errors of 18.36%, 8.85%, 6.20%, and 4.72% for the G, NR, B, and RE bands, respectively.
The worst results were estimated at 1000 mm, with percentage errors of 23.22%, 14.31%, 11.60%, and 10.41% for the G, NR, B, and RE bands, respectively.
The B and RE spectral bands were found to be more accurate than the G and NR combinations, with lower percentage errors. Among the proposed stereo systems, the G band showed the worst performance, suggesting that the reprojection error observed on the Y-axis may have significantly impacted the accuracy of this stereo configuration. Concerning the G band, the error was relatively low at 800 mm (18.36%) but increased at longer distances, peaking at 23.22% at 1000 mm, and then decreasing to more moderate values (18.88% and 21.32% at 1300 mm and 1370 mm, respectively). Although this behavior was replicable for all the other band configurations, the RE band showed the best stability in terms of error, with a maximum of 1000 mm error of 10.41%. Also in this case, the effect of the Y-axis reprojection error emerged, which for the RE band showed a more stable and linear behavior.

3.2. Image Registration Model

The image alignment results were evaluated by comparing the model performance parameters of the three selected methods (CB, FT, and RG). The coefficient of determination (R2) and root mean square error (RMSE) were chosen as the main indicators to assess the fitting of the model as they provided an overall view of the goodness of fit and an average accuracy of the interpolation. The accuracy of the spatial alignment between images was assessed by measuring the remaining residual displacement among the multispectral bands after fitting the model. This was expressed as the residual offset error along the x-axis (Xerr) and y-axis (Yerr) expressed in pixels.
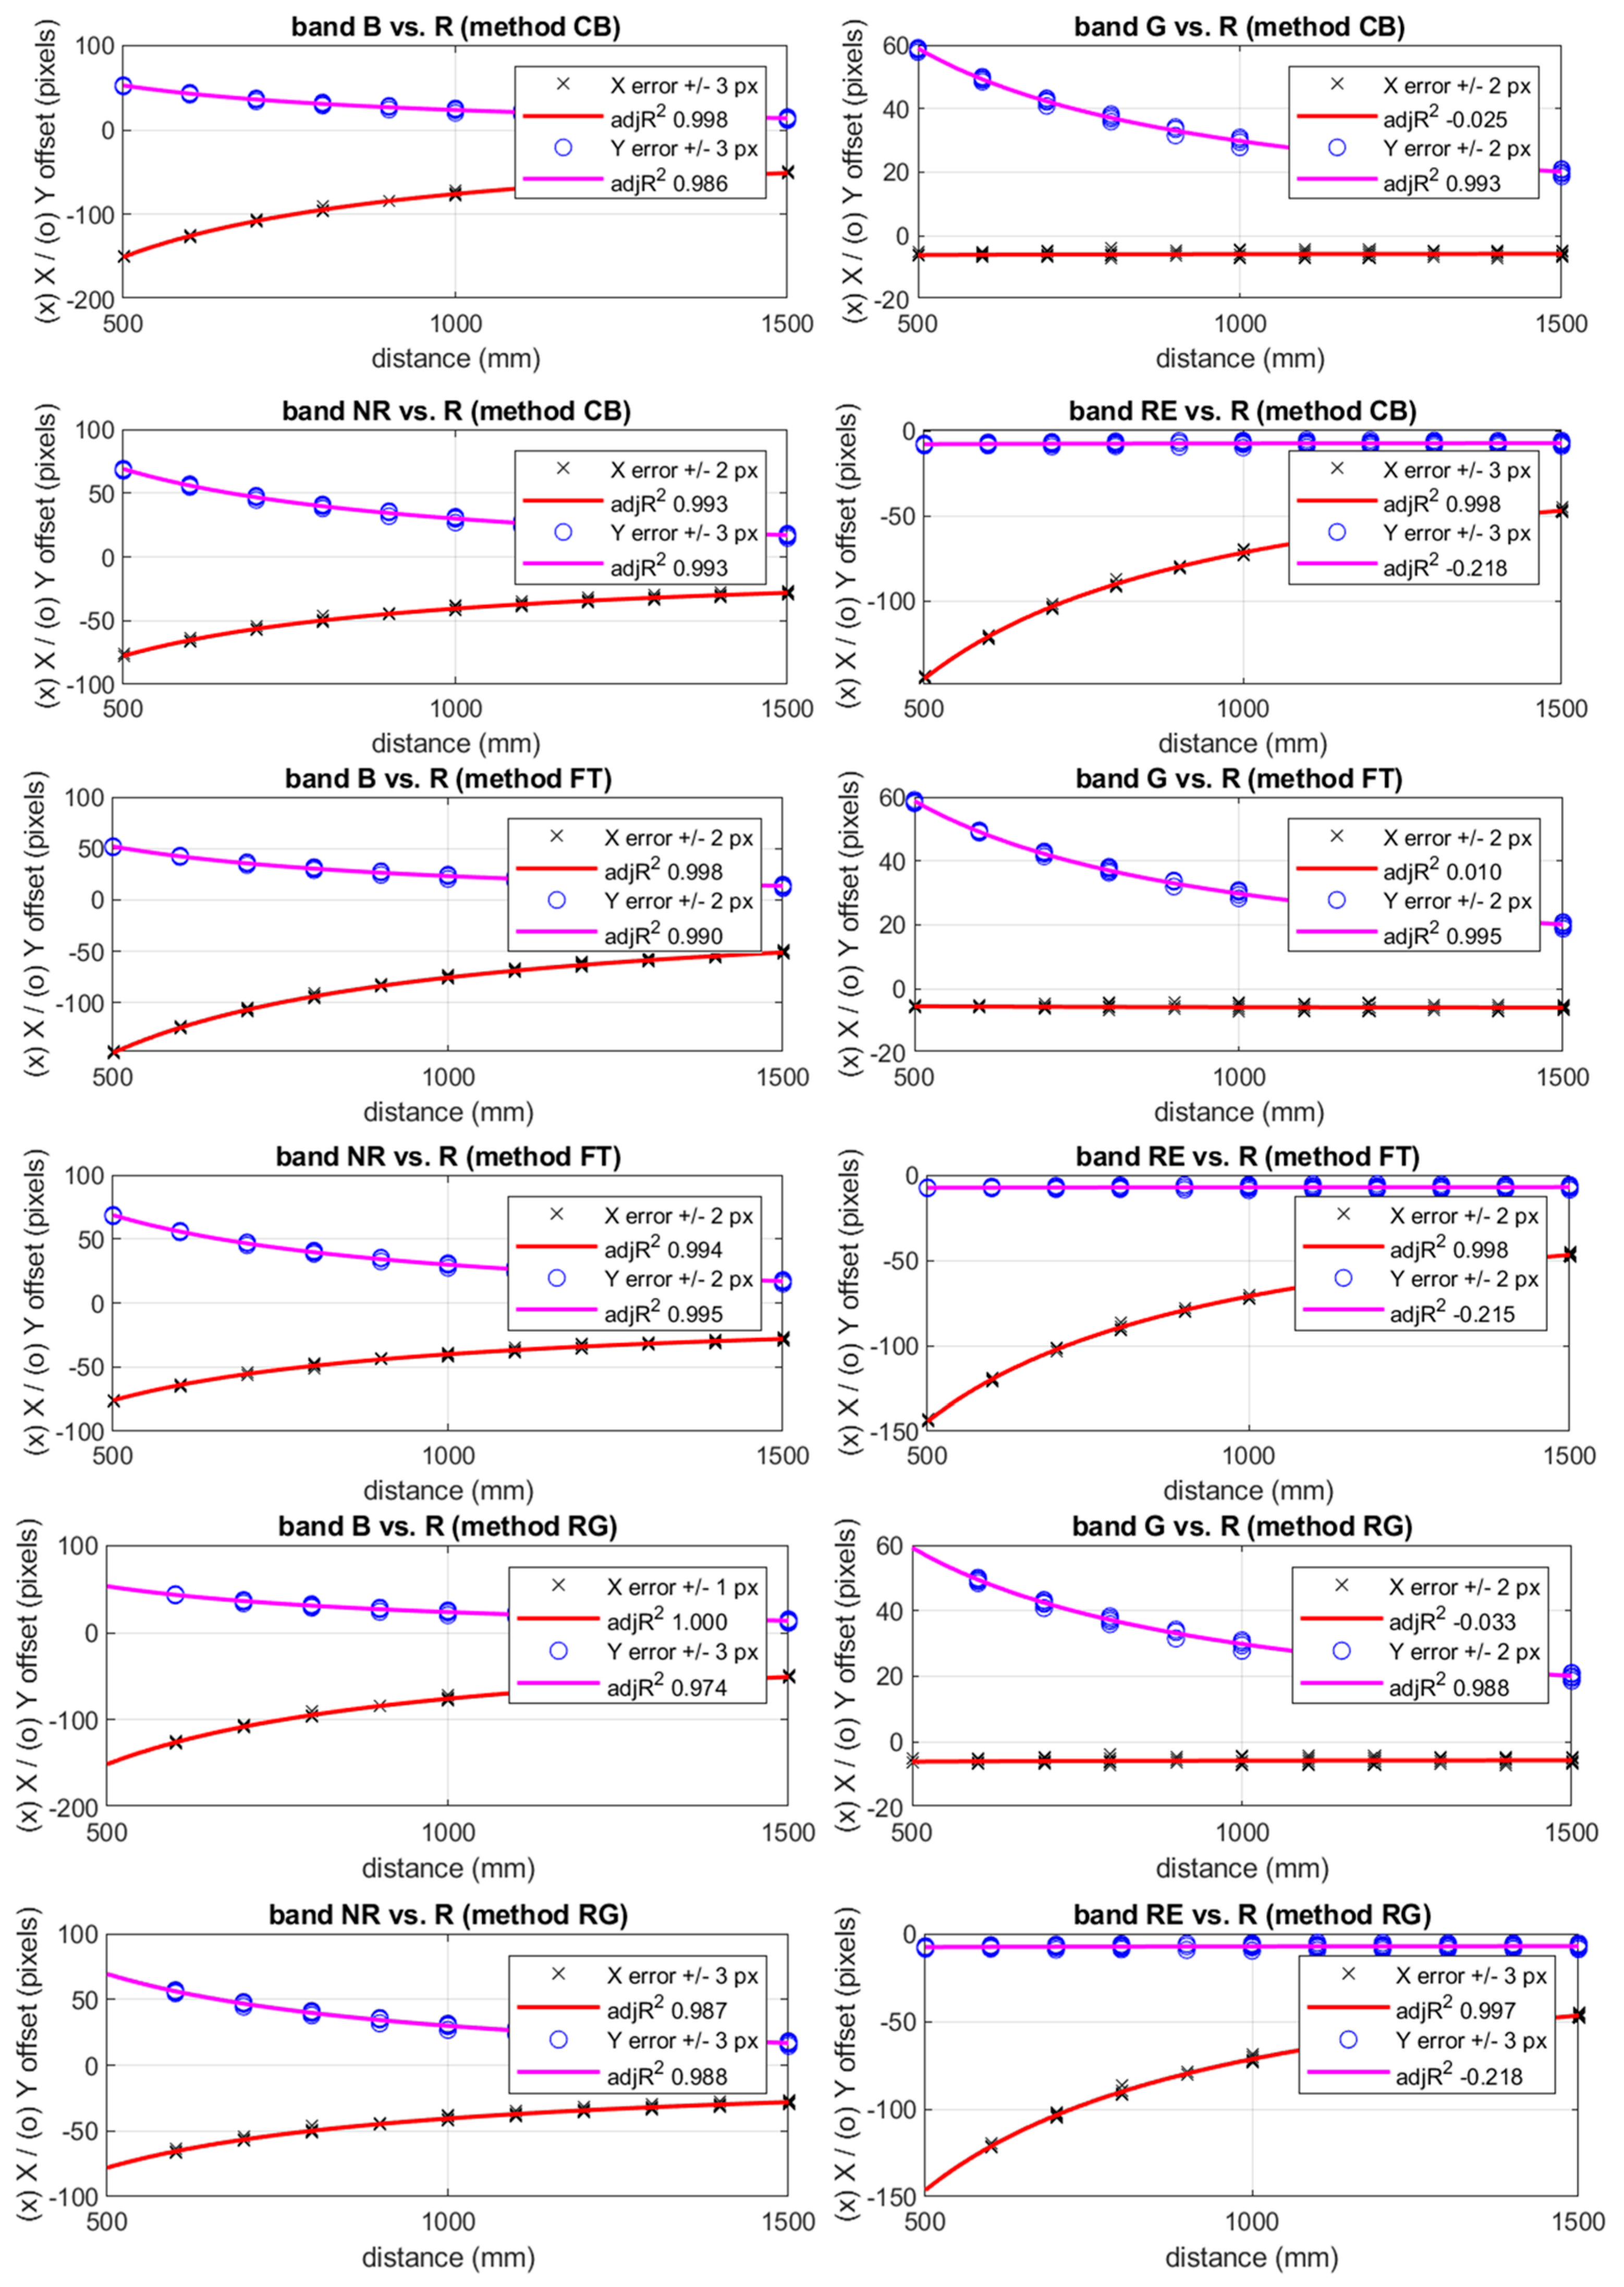
Figure 4 shows the results of the interpolation of the model applied to the experimental data, considering the offsets of the B, G, NR, and RE bands to the R band. The offsets were analyzed along both the X- and Y-axes and considering all five positions, using the CB, FT, and RG methods. The adjusted R2 indicated that all models achieved a very high degree of correlation with the experimental data. Similarly, the residual offset error along the x and y axes was, on average, between ±2 and ±3 pixels. Furthermore, the comparison highlighted that the experimental methods proposed in previous work [24] demonstrated good performance in offset calculation, showing no significant differences compared with the conventional RG method.
The B and NR bands exhibited the best overall results for both axes, indicating a good fit for the model. Specifically, Table 3, Table 4 and Table 5 show that the offsets of the B vs. R band demonstrated a high correlation (mean adjusted R2: 0.9986 and 0.9835 on the x and y axes, respectively) and low errors (mean RMSE: 1.0529 and 1.3834 on the x and y axes, respectively). This same trend was confirmed by the results of the NR band offsets, showing mean adjusted R2 of 0.9916 and mean RMSE of 1.2636 along the x-axis and mean adjusted R2 of 0.9923 and mean RMSE of 1.2803 along the y-axis. In contrast, the G band, compared with the R band, exhibited the worst correlation results along the x-axis, as evidenced by an R2 value of −0.0159. Similarly, the RE band showed fitting issues along the y-axis with mean adjusted R2 values of −0.2168.
The coefficients of the model, a and b, exhibited variability both across the bands and along the axes. In particular, the wide 95% confidence intervals for the b coefficient along the x and y axes for the G and RE bands confirmed the poor performance of the model for these two bands. Nevertheless, the obtained model reasonably explained the effect of the x distance on the y geometric offset, highlighting an inverse proportionality between x and y, compensated by the value of b. Example calculations are summarized in Table 6, which presents the reference values of the Y offset model for the B vs. R band of the CB method (a = −5.597, b = 28.970) found in Table 3.
From the example, it is evident that assuming a sensor distance of x = 30 m, the ratio b/x tended to 0.966 pixels, which resulted in an alignment offset y of −4.631 pixels. Considering the relative error with respect to a, calculated as the percentage of the ratio between the term b/x and |a|, it was observed that the term b/x contributed a relative error of 17.26%, which was not negligible and may be problematic for high-precision applications. Repeating the calculation at greater distances, such as 50 m and 100 m, the y offset remained constant (≈−5 pixels), while the relative error progressively decreased. These results highlighted that the b parameter had a significant effect at short distances (x → 0), but its influence diminished at higher distances, where y(x) approached the constant value defined by a. However, as the distance decreased, the relative error increased, suggesting that the model must necessarily be robust. Unlike the interpolating model presented in [24], which had no direct physical interpretation, the proposed inverse linear model provided a clearer comprehension of the dependence of geometric offset on sensor distance. This physical interpretation was particularly important for applications requiring high alignment accuracy, as confirmed by the error values reported in Table 6. The ability to describe the trend of offsets as a function of distance through an analytical relationship improved the applicability of the model, offering a more interpretable and generalizable solution than previous approaches.
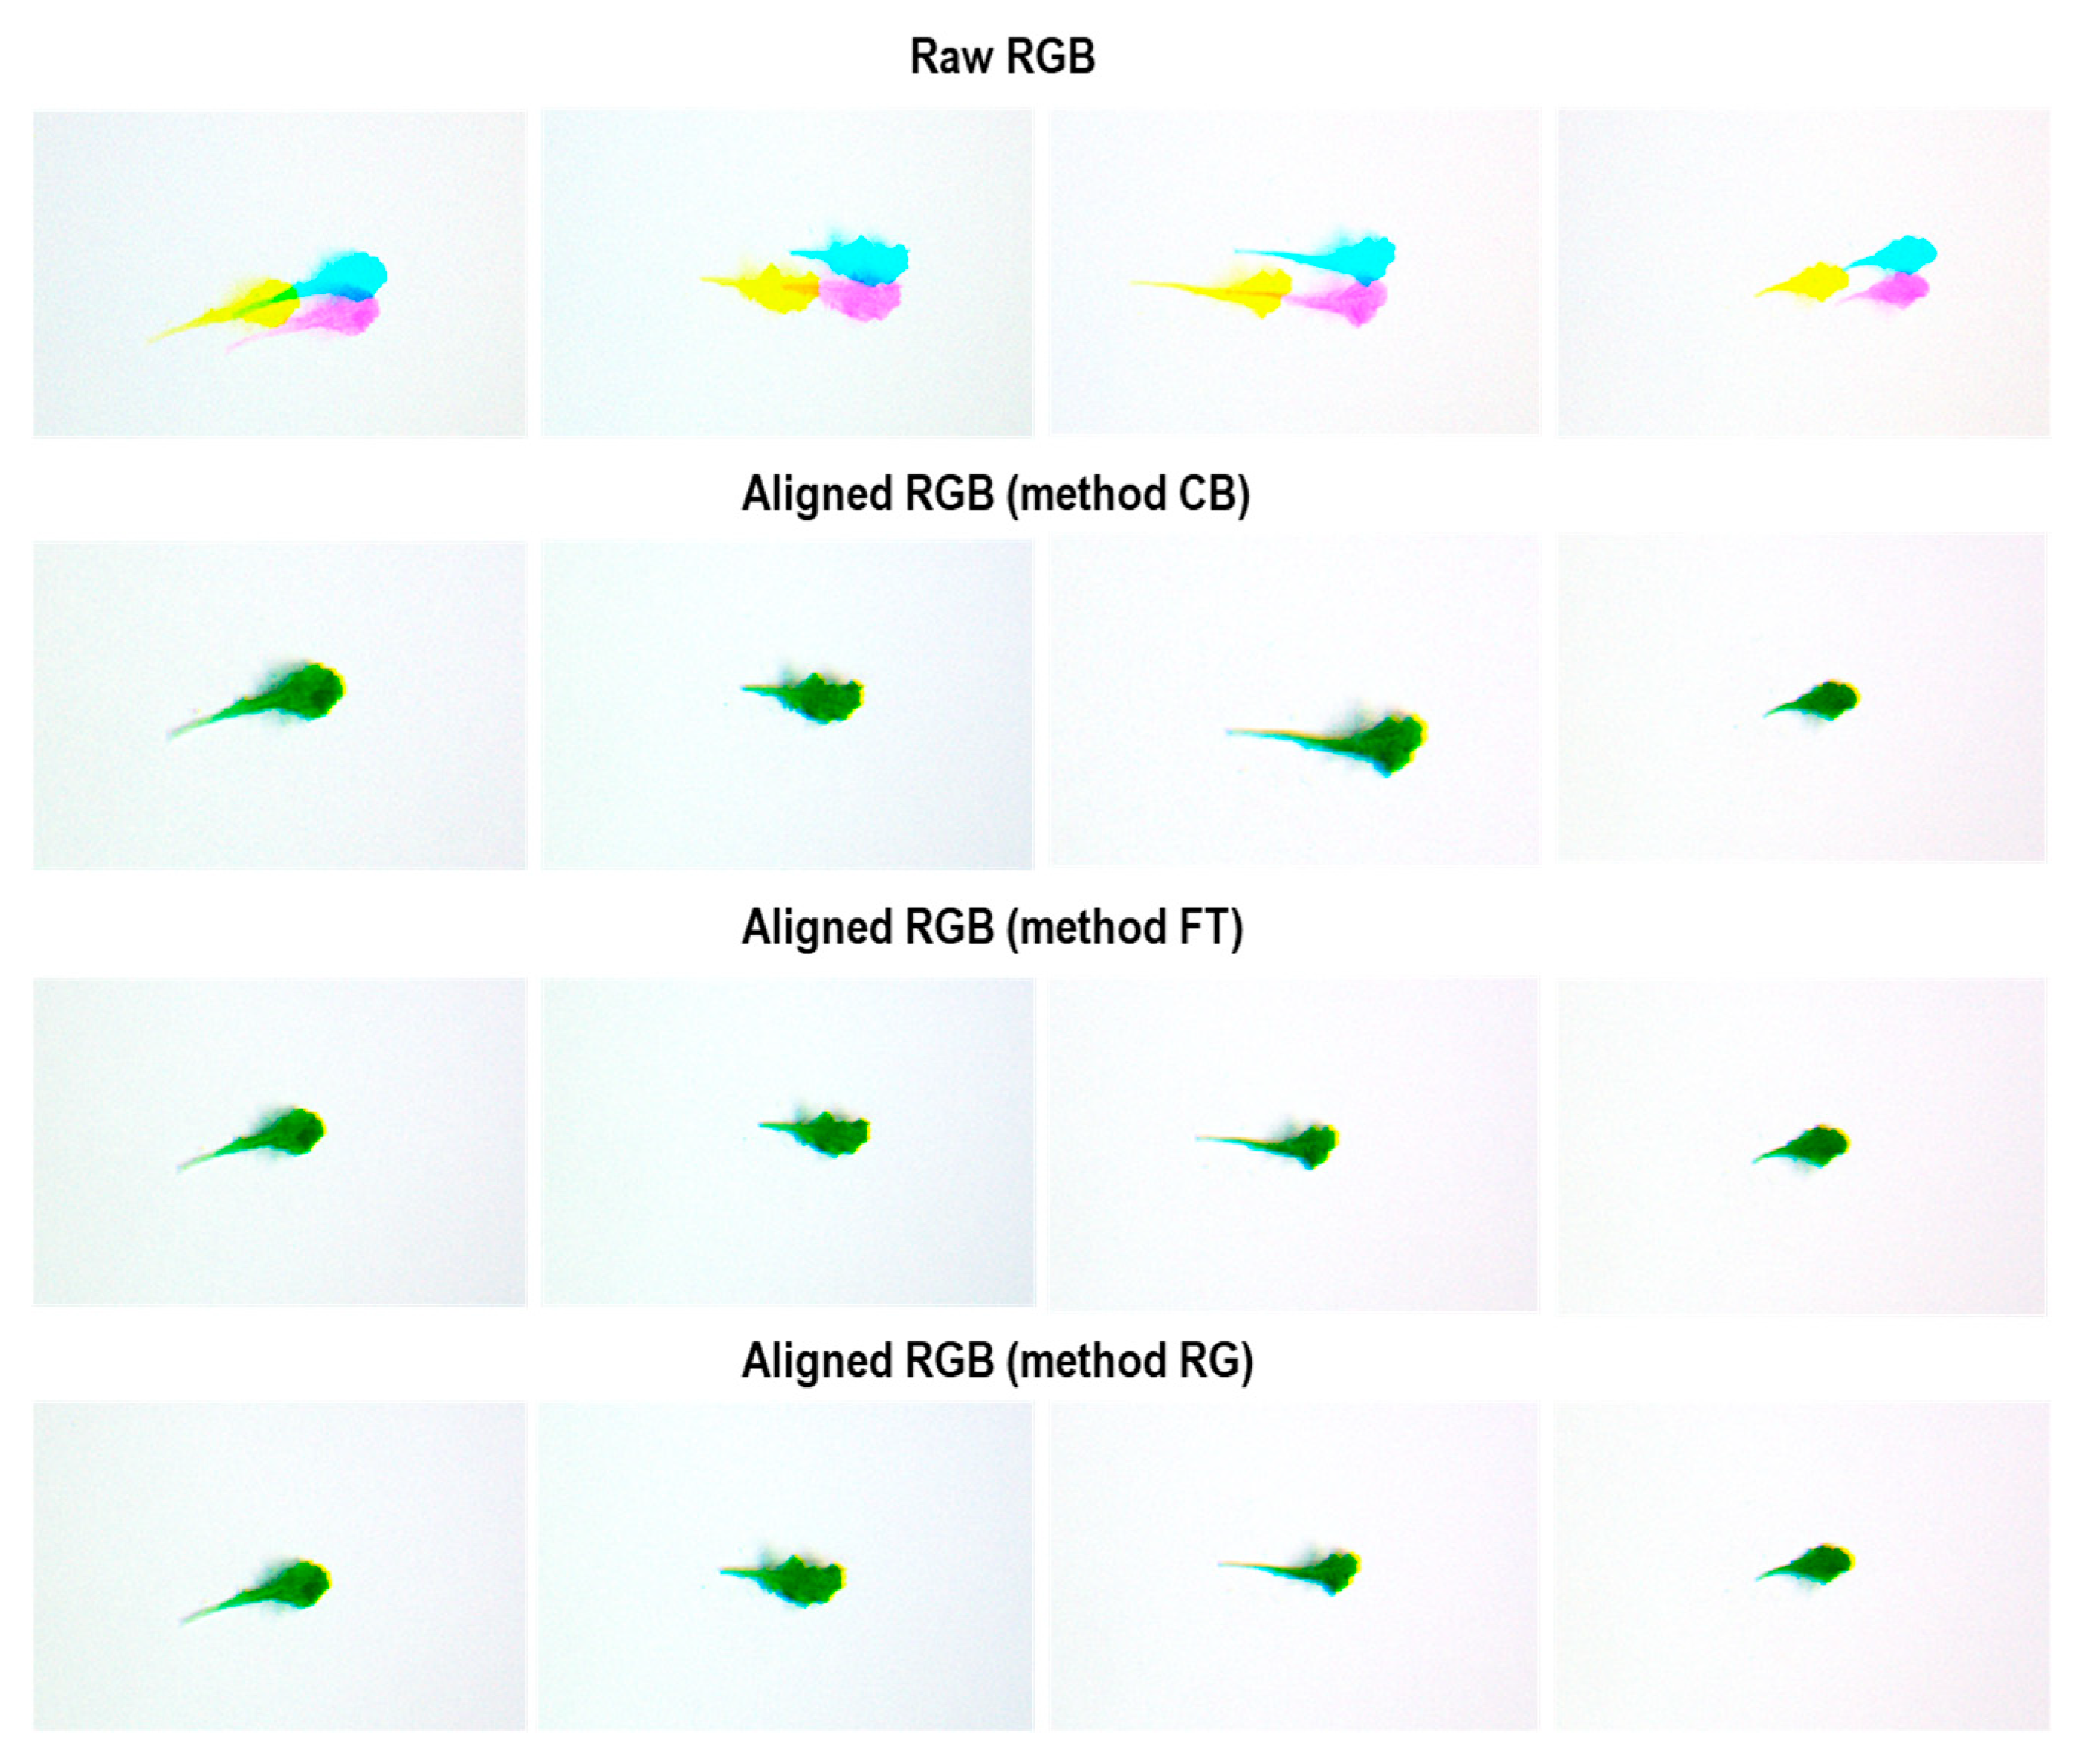
The alignment models were applied to a set of baby lettuce images acquired at a distance of 1000 mm from the ground using a multispectral (MS) sensor. The results of the alignment are presented in Figure 5, which shows the raw images of the R, G, and B channels of the MS sensor alongside the corresponding images aligned using the CB, FT, and RG methods. The aligned images demonstrated satisfactory results, with precise alignment of the bands, thus confirming the effectiveness of the proposed methods. The alignment of the multispectral bands played a crucial role in accurately assessing the physiological condition of the crops. This further supports their application in short-range image analysis contexts (Section 3.3).

3.3. Crop Health Assessment

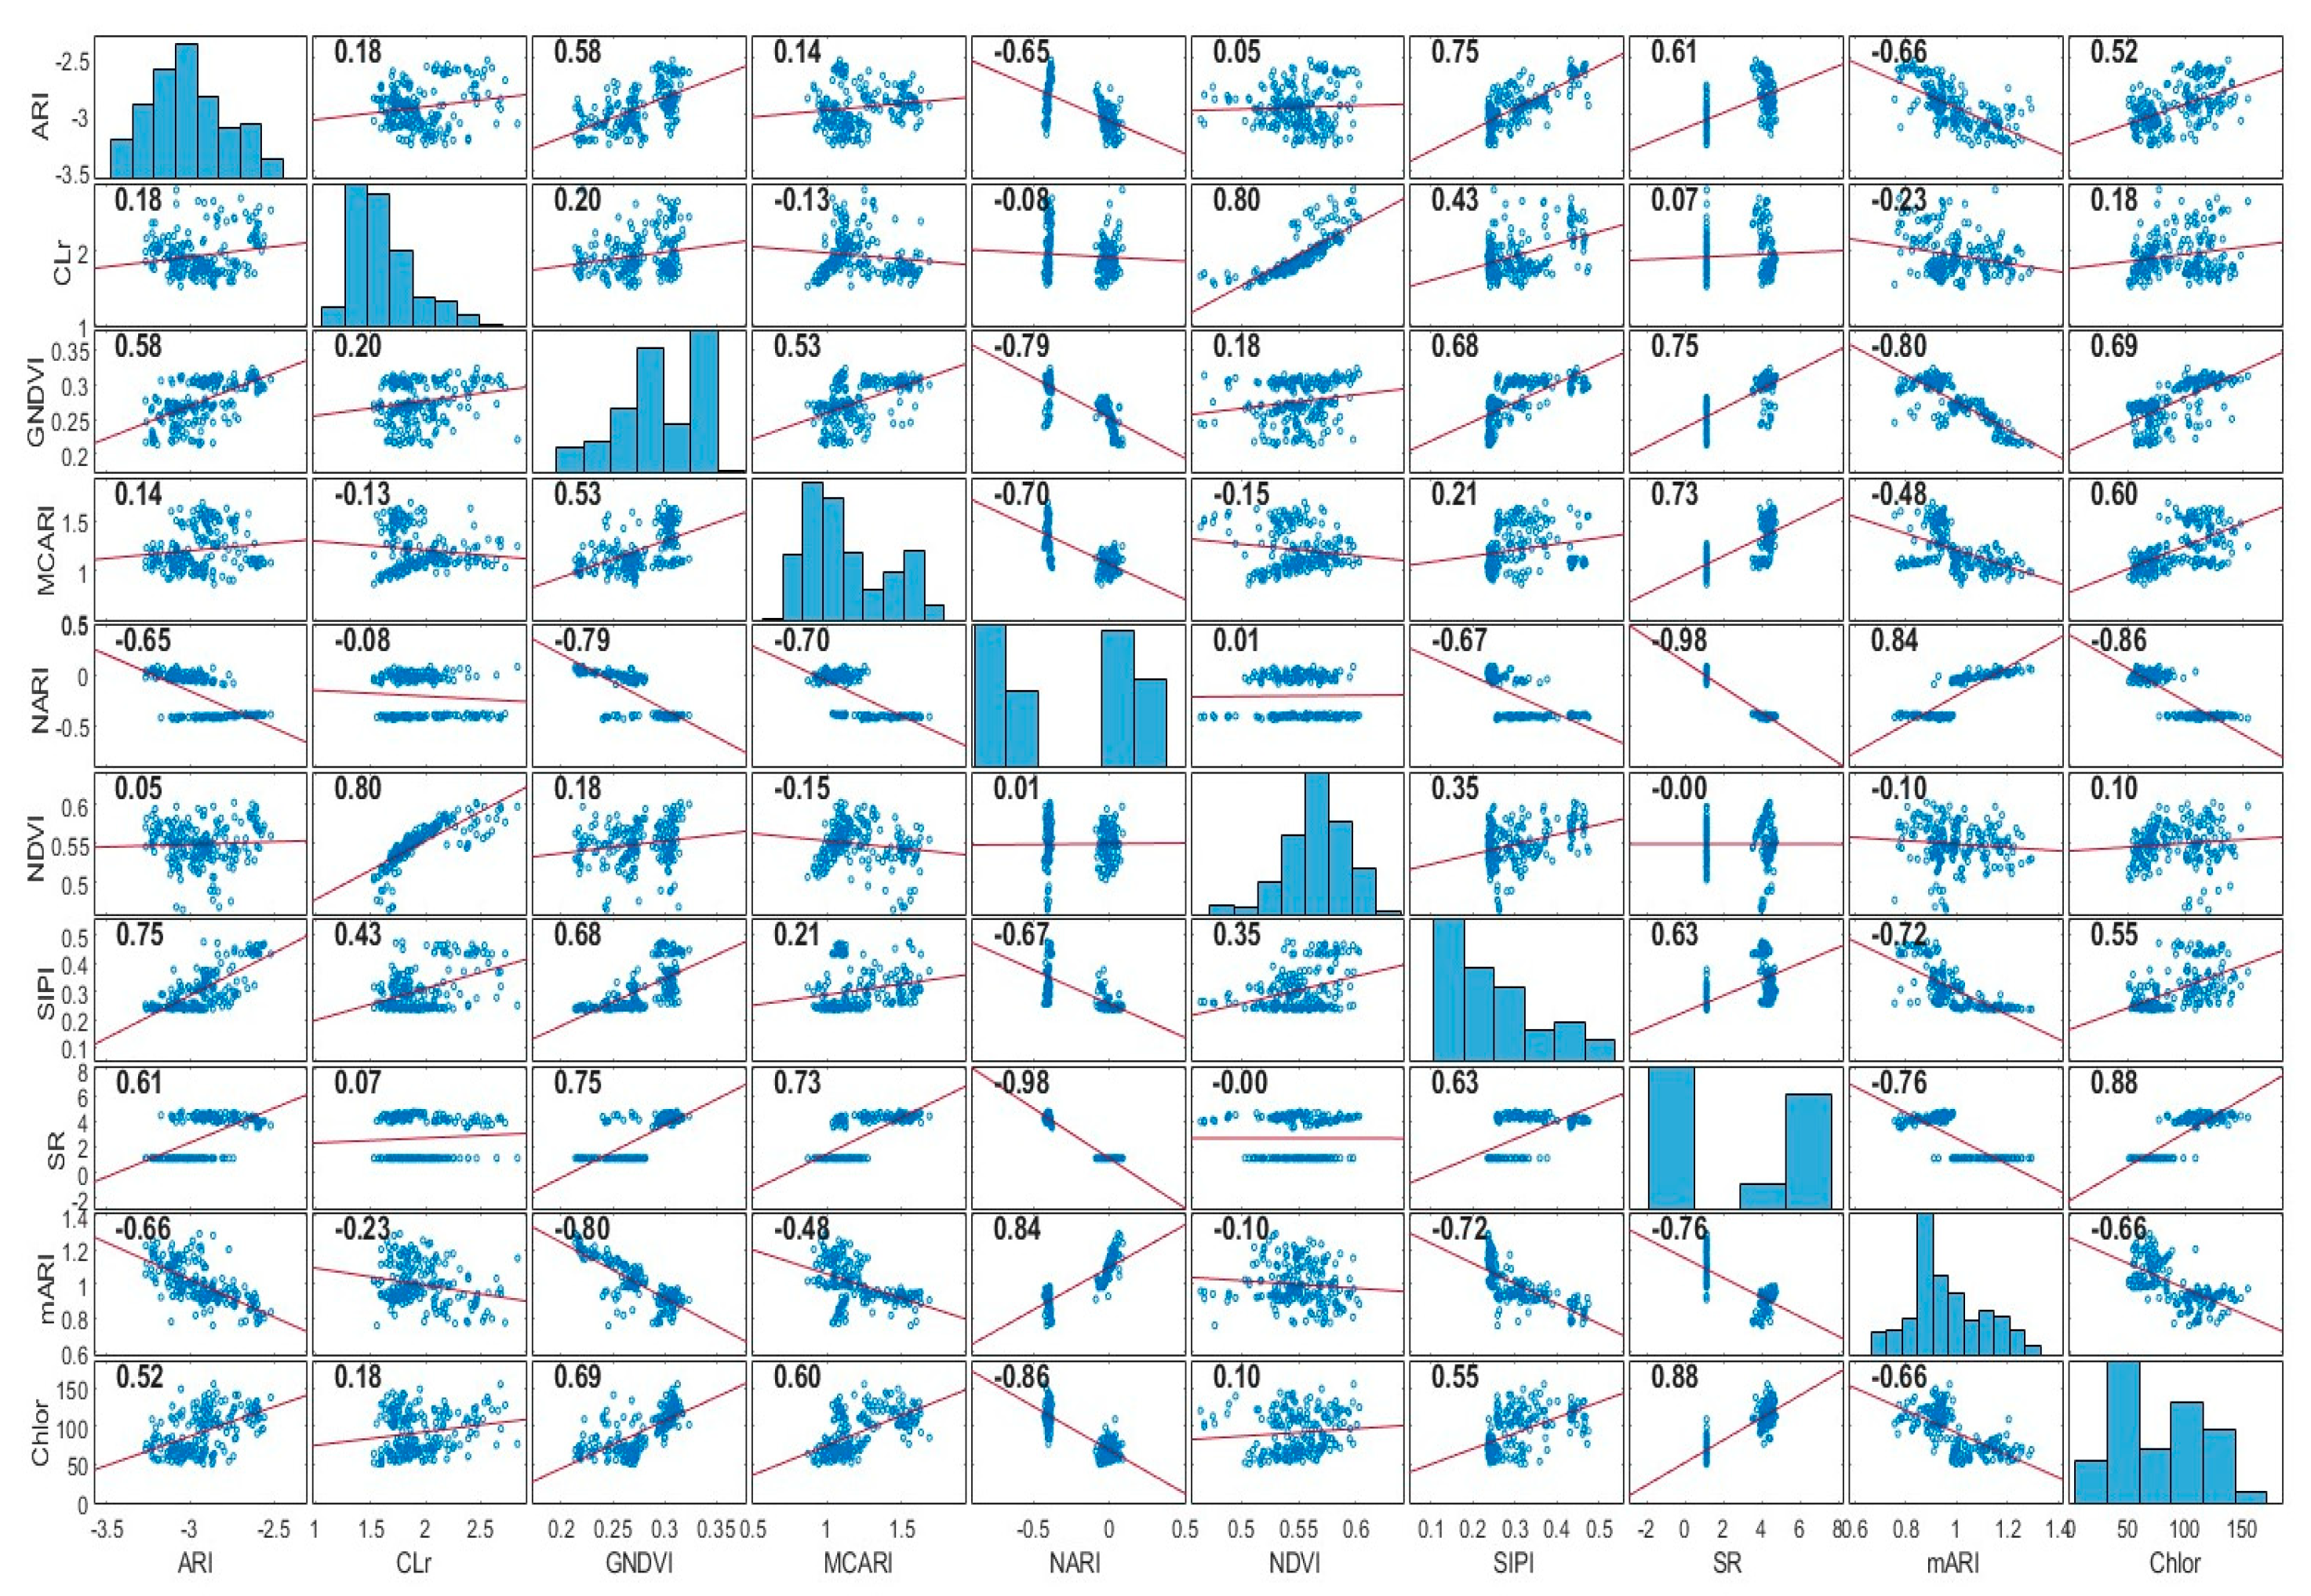
The correlation of the vegetation indices with chlorophyll content was calculated for all samples, including both healthy and unhealthy crops, with a significance threshold of p < 0.05, using Pearson’s correlation coefficient. Pearson’s correlation matrix helped to identify the most significant correlations (Figure 6).
The SR, GNDVI, and MCARI indices showed a positive correlation with chlorophyll content (r = 0.88, 0.69, and 0.60, respectively). ARI and SIPI also exhibited a stronger correlation (r = 0.52 and 0.55, respectively). A low correlation was observed for NDVI (r = 0.10) and CLr (r = 0.18). Furthermore, among the vegetation indices analyzed, only NDVI did not reach the significance threshold (p-value > 0.05).
Vegetation indices have been widely used to quantify plant photosynthetic absorption, particularly chlorophyll content and anthocyanins. The SR index serves as an indicator of canopy structure, light absorption, and photosynthetic capacity [19], while GNDVI and MCARI are more sensitive to foliar chlorophyll and have been used to estimate photosynthetic activity under water stress conditions [27].
On the other hand, NARI and mARI showed a strong negative correlation with chlorophyll content (r = −0.86 and −0.66, respectively). These VIs were highly correlated with anthocyanin content [46], which was not considered in this study. Although the correlation results were not optimal for a predictive model of plant photochemical content under water deficit conditions, baby lettuce exhibited reduced leaf area and higher chlorophyll values. The significance of the differences between leaf area and chlorophyll values for healthy and non-irrigated plants was analyzed using a post hoc Tukey test (α = 0.05). As shown in the statistics in Figure 7, this significant difference may reflect a plant strategy to optimize photosynthetic efficiency under water stress, which helps explain the observed correlations. As a reaction to water stress, crops typically show foliar adaptation mechanisms to reduce light absorption, such as decreased chlorophyll concentration and down-regulation of photosynthesis [47], as well as increased concentrations of antioxidant components [48]. In addition, wilting and reduced leaf area in water-stressed crops are well documented [49] and have a significant influence on biomass and yield [50]. However, the effect of water stress is strongly influenced by the time scale and phenological stage of the plant cycle [48]. In this study, differences were observed only at harvest time, which limits the possibility of conducting a more in-depth analysis of the physiological state of the plant at different stress conditions.
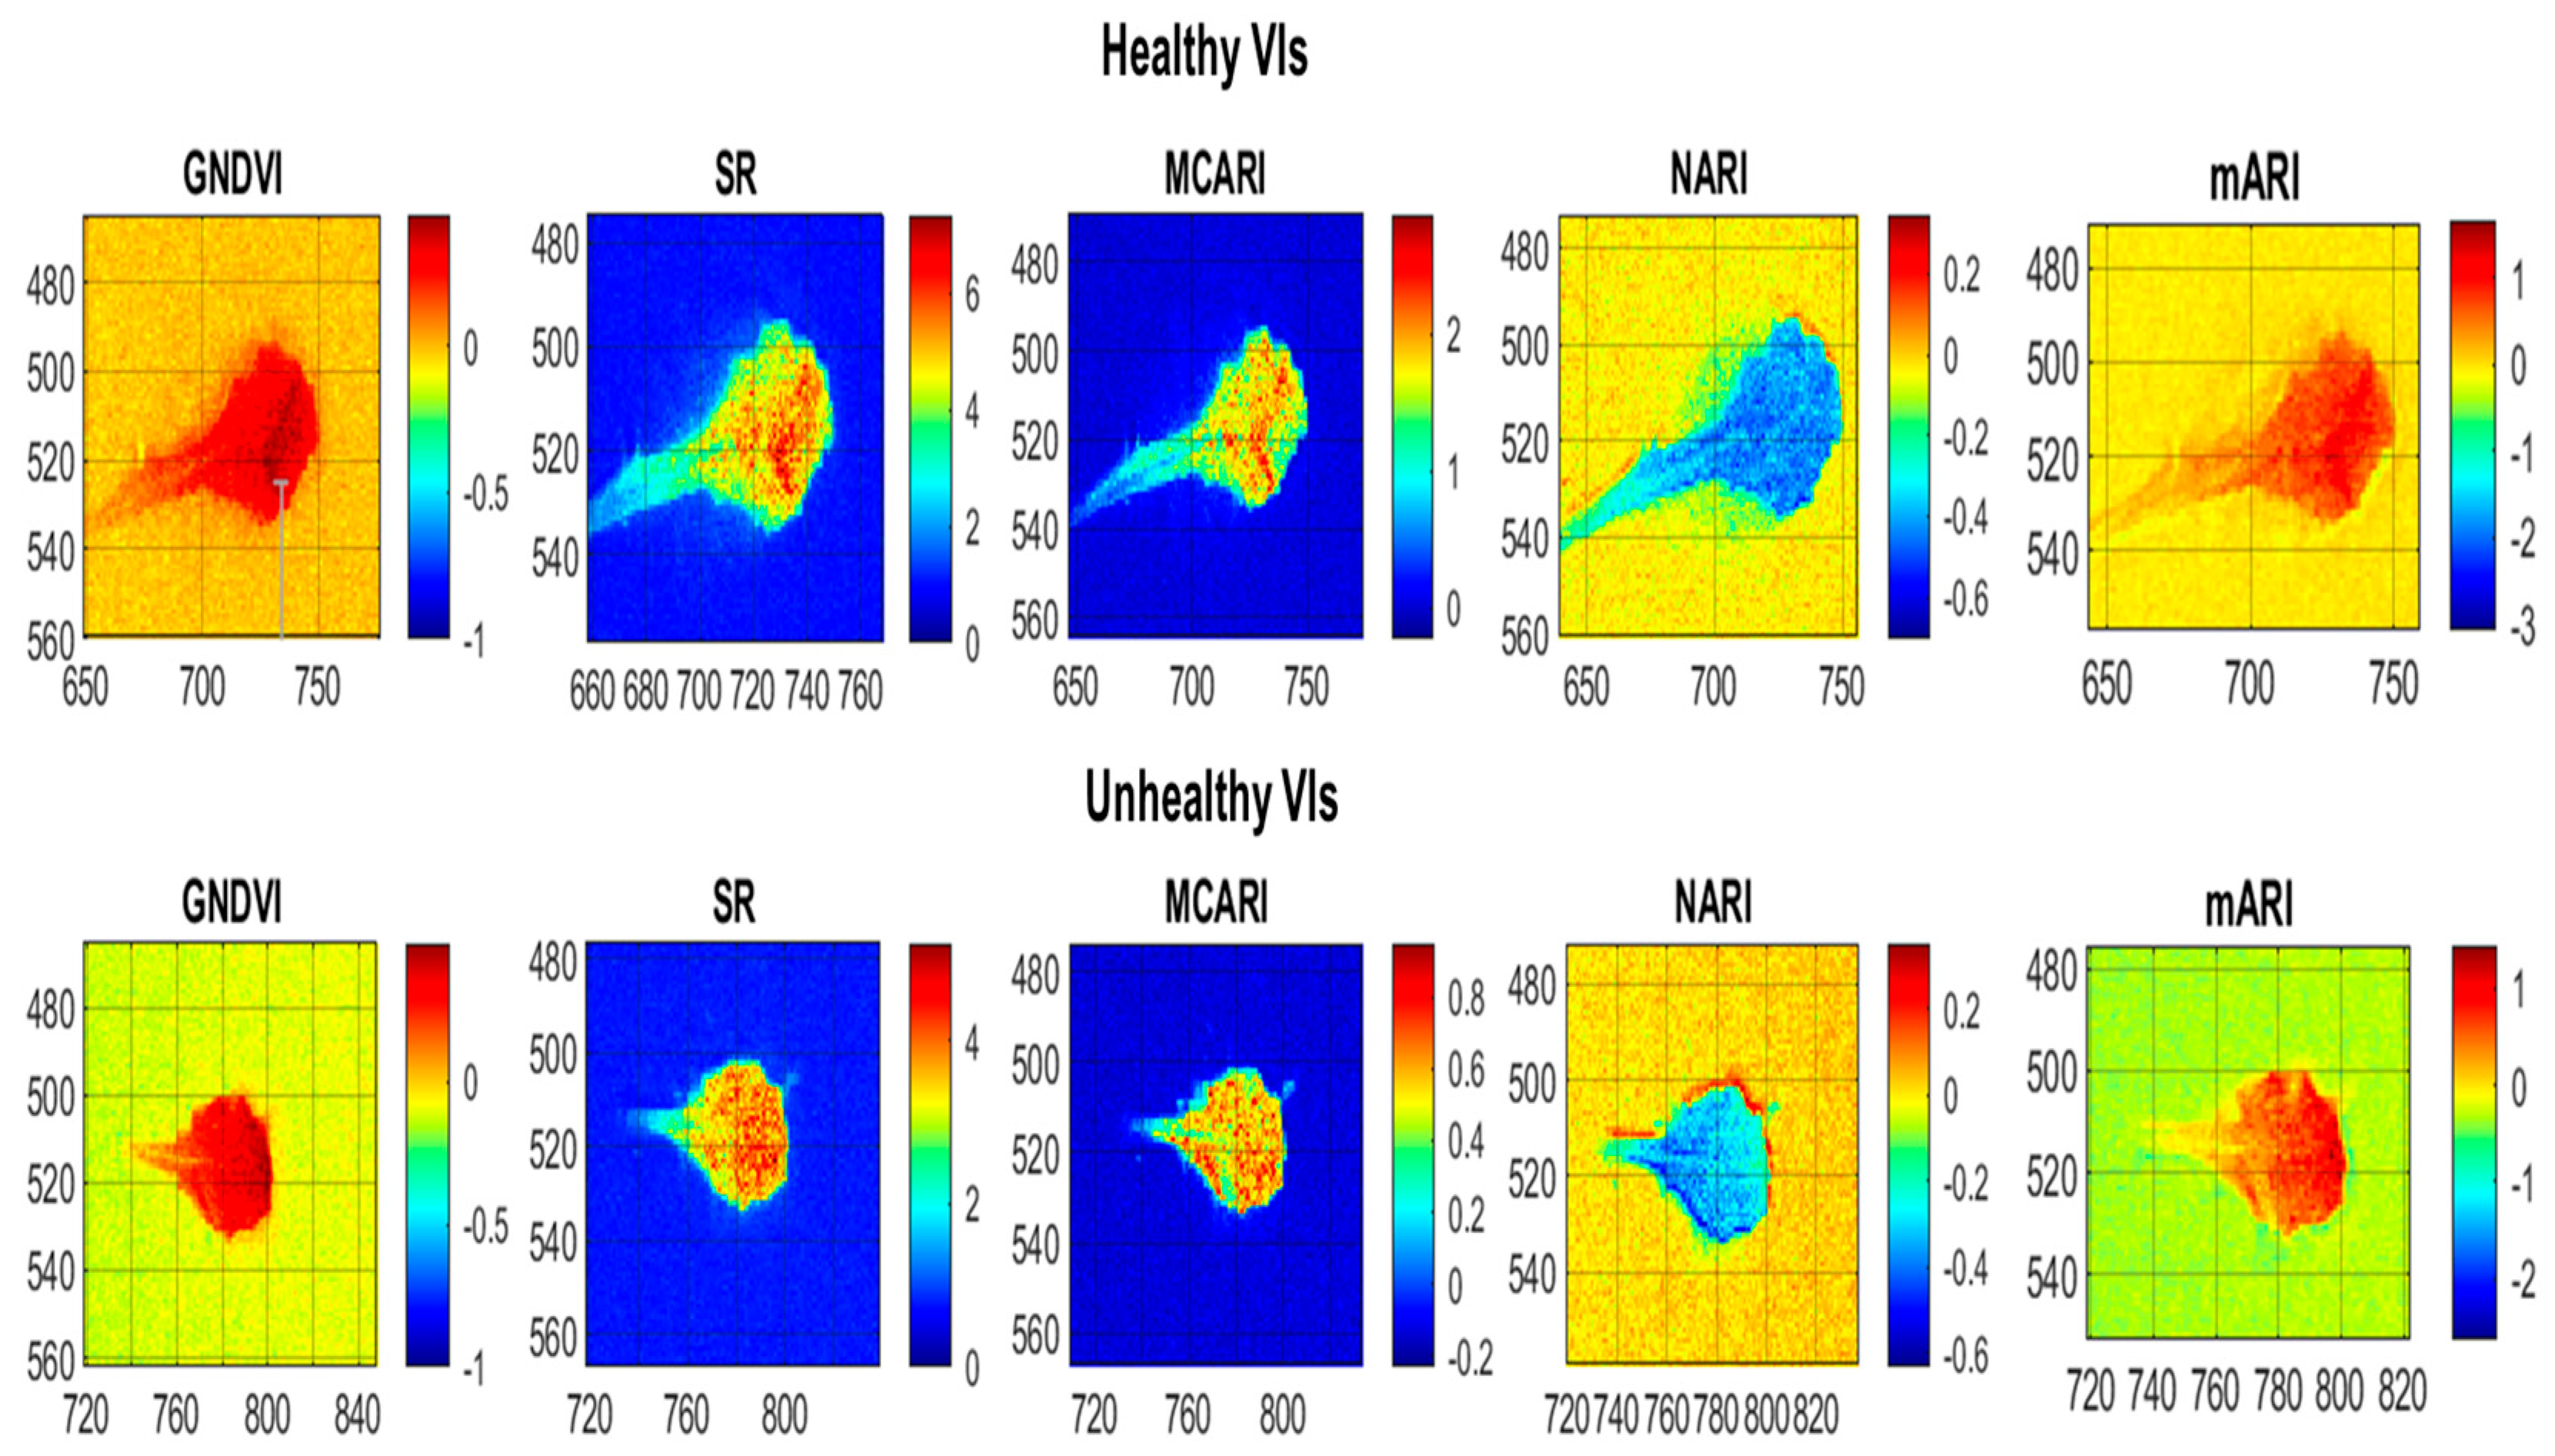
Moreover, the main goal of testing the application of the MS image alignment model was achieved with satisfactory results. Figure 8 demonstrates how the accurate alignment of the MS bands using the CB method effectively distinguished specific leaf areas through the vegetation indices. This provides a promising foundation for future sub-pixel analyses of leaf areas. Although the correlations were not strong enough to propose a predictive model for crop physiological status, the distribution of experimental data from several VIs, such as SR, NARI, GNDVI, and MCARI, clearly differentiated between healthy and unhealthy plants. This suggested that properly aligned band ratios could effectively distinguish between these two physiological conditions.

4. Discussion

Using multispectral (MS) bands (G, B, NIR, and RE) as binocular lens pairs (with the fixed red band) in the stereo vision systems, the image-alignment model showed significant differences in performance depending on the spectral band and the range of distances selected for calibration, ranging from 500 mm to 1500 mm. The stereo vision approach, evaluated by reprojection error (expressed in pixels), demonstrated promising accuracy in the calibration set, with total mean errors of approximately 0.013 pixels for all band pairs. The minimum deviation between recognized homologous points in the two scenes of the stereo system, for the calibration of two or more camera lenses, was less than 1 pixel, a value considered robust in these contexts.
The effect of distance on error was consistent across all pairwise systems used, with maximum values recorded at the extremes of the distance set. However, the behavior of the error along the X- and Y-axes of the image differed. In particular, the reprojection error along the Y-axis had a noticeable impact on our calibration set, especially for the G and RE band pairs. Compared with the B, RE, and NIR bands, the G band exhibited a higher average error along the Y-axis. In contrast, the RE band showed a more stable and less variable mean trend.
The accuracy of the depth (Z) estimation was directly influenced by the reprojection error, which was conceptually related to the calculated disparity in the 3D coordinates of the images in the set [51]. The higher errors observed at distances greater than 1000 mm were likely due to reduced accuracy in disparity estimation and the challenges of identifying similarities between stereo images at larger distances. Indeed, the larger the error, the lower the accuracy in aligning homologous points between the two scenes acquired from the same viewpoint.
As expected, the G and RE bands exhibited opposite behaviors in estimation accuracy, with minimum and maximum errors of 18% and 5% for the G band and 23% and 10% for the RE band, respectively. This highlighted the greater stability of the RE band compared with the G band in estimates.
The best results were obtained at smaller distances (800 mm) in the validation set, while a peak in error was observed at the intermediate distance of 1000 mm. These results suggested clear directions for optimizing stereo calibration, which could involve exploring more robust metrics to mitigate the impact of reprojection errors, particularly along the Y-axis, and improve overall system performance.
In the image alignment model, the tested methods (CB, FT, and RG) showed good results in terms of correlation with the experimental data, as highlighted by adjusted R2 values around 0.99, suggesting strong fitting capability. This indicated that the applied models were able to accurately capture the spatial relationships between the multispectral bands, enabling proper alignment of the images.
Analysis of the residual offset, expressed as the error along the X (Xerr) and Y (Yerr) axes, allowed the assessment of the effect of the different bands on the quality of the alignment. In this regard, errors along the X-axis had a greater impact on the overall quality of the models. The G and RE bands were found to be strongly uncorrelated with the experimental model (with R2 values of −0.0159 and −0.2168, respectively) along the X-axis, indicating that alignment along this direction was not optimal for these bands. These results suggested that the model had difficulty in representing accurately the spatial relationship for this pair of bands.
Despite this, the residual offset errors along the X- and Y-axes were found to be in the range of ±2 to ±3 pixels, suggesting that the spatial alignment predicted by the model was still satisfactory for all methods tested.
The alignment model tested for the health assessment of baby lettuces showed promising results, although it was not sufficiently robust to permit the construction of a comprehensive predictive model for plant photochemical content. While the correlations were not strong enough, the distribution of experimental data from indices such as SR, GNDVI, MCARI, and NARI clearly distinguished between healthy and unhealthy plants, suggesting that vegetation indices were effective in discriminating different physiological conditions.
In addition, the vegetation indices demonstrated high sub-pixel-level accuracy in multispectral images, confirming that successful band alignment could provide a reliable basis for future, more detailed sub-pixel-level analyses of leaf areas, particularly under close-range conditions.
The approach proposed in this work could, therefore, support future applications in a smart agriculture context, including a comprehensive study focusing on the temporal assessment of physiological conditions of plants subjected to biotic or abiotic stresses. In addition, integrating this methodology with advanced hardware systems for real-time monitoring on agricultural machinery could further enhance its practical applicability, enabling continuous real-time analysis in the field to drive precision farming practices and improve crop management.

5. Conclusions

This study illustrates the potential of multispectral imaging systems as versatile tools in agricultural settings at close distances. The feasibility of employing stereo vision to correct spectral band misalignment in multispectral imaging, a critical step for reliable vegetation index computation, is presented in a structured workflow.
A pair of images (red band as a reference and G, B, RE, and NR bands as moving) were processed through the stereo camera calibration algorithm to estimate the target distance from the sensor. The estimated distance was used to back-calculate the offsets required to correct misalignment in all spectral bands and was further applied to crop images, resulting in an aligned multispectral image composed of all bands. From the aligned image, spectral indices correlated with plant health were computed and analyzed.
This step-by-step approach ensured improved multispectral image processing. The stereo vision approach used for distance estimation showed high accuracy, with average reprojection errors of approximately 0.013 pixels and minimal relative errors (around 5%) for the RE band. The new proposed inverse linear model provided a clearer comprehension of the dependence of geometric offset on sensor distance. Despite some challenges in site-specific band alignment, particularly along the X-axis, the overall performance of the proposed experimental alignment model remained satisfactory, with offset errors between bands remaining below 3 pixels.
The proposed image alignment method enhances the accuracy of sub-pixel vegetation index calculation in greenhouse environments where short-range imaging is required. Although the results are not yet sufficiently robust for developing a comprehensive predictive model of plant chlorophyll content, the analysis of vegetation indices revealed a clear distinction between healthy and unhealthy plants. This approach holds significant promise for precision agriculture applications, particularly for the continuous monitoring of baby crop health in controlled environments, contributing to more effective and data-driven greenhouse management strategies.

Author Contributions

Conceptualization, S.L., G.A. and G.C.D.R.; methodology, F.G., A.M. and G.C.D.R.; software, G.A.; validation, S.L., F.G. and A.M.; formal analysis, S.L. and L.S.; investigation, S.L. and L.S.; resources, L.S.; data curation, S.L., A.M. and F.G.; writing—original draft preparation, S.L.; writing—review and editing, S.L. and G.A.; visualization, F.G. and A.M.; supervision, G.A.; project administration, G.A. and G.C.D.R.; funding acquisition, G.A. and G.C.D.R. All authors have read and agreed to the published version of the manuscript.

Funding

This study was carried out within the Agritech National Research Center and received funding from the European Union Next-GenerationEU (PIANO NAZIONALE DI RIPRESA E RESILIENZA (PNRR)—MISSIONE 4 COMPONENTE 2, INVESTIMENTO 1.4—D.D. 1032 17/06/2022, CN00000022). This manuscript reflects only the authors’ views and opinions; neither the European Union nor the European Commission can be considered responsible for them.

Institutional Review Board Statement

Not applicable.

Informed Consent Statement

Not applicable.

Data Availability Statement

The raw data supporting the conclusions of this article will be made available by the authors on request.

Conflicts of Interest

The authors declare no conflicts of interest.

References

  1. Mishra, P.; Polder, G.; Vilfan, N. Close Range Spectral Imaging for Disease Detection in Plants Using Autonomous Platforms: A Review on Recent Studies. Curr. Robot. Rep. 2020, 1, 43–48. [Google Scholar] [CrossRef]
  2. Deng, L.; Mao, Z.; Li, X.; Hu, Z.; Duan, F.; Yan, Y. UAV-Based Multispectral Remote Sensing for Precision Agriculture: A Comparison between Different Cameras. ISPRS J. Photogramm. Remote Sens. 2018, 146, 124–136. [Google Scholar] [CrossRef]
  3. Mishra, P.; Asaari, M.S.M.; Herrero-Langreo, A.; Lohumi, S.; Diezma, B.; Scheunders, P. Close Range Hyperspectral Imaging of Plants: A Review. Biosyst. Eng. 2017, 164, 49–67. [Google Scholar] [CrossRef]
  4. Laveglia, S.; Altieri, G.; Genovese, F.; Matera, A.; Di Renzo, G.C. Advances in Sustainable Crop Management: Integrating Precision Agriculture and Proximal Sensing. AgriEngineering 2024, 6, 3084–3120. [Google Scholar] [CrossRef]
  5. Gang, M.S.; Kim, H.J.; Kim, D.W. Estimation of Greenhouse Lettuce Growth Indices Based on a Two-Stage CNN Using RGB-D Images. Sensors 2022, 22, 5499. [Google Scholar] [CrossRef]
  6. Thrash, T.; Lee, H.; Baker, R.L. A Low-Cost High-Throughput Phenotyping System for Automatically Quantifying Foliar Area and Greenness. Appl. Plant Sci. 2022, 10, e11502. [Google Scholar] [CrossRef]
  7. Singh, G.; Slonecki, T.; Wadl, P.; Flessner, M.; Sosnoskie, L.; Hatterman-Valenti, H.; Gage, K.; Cutulle, M. Implementing Digital Multispectral 3D Scanning Technology for Rapid Assessment of Hemp (Cannabis sativa L.) Weed Competitive Traits. Remote Sens. 2024, 16, 2375. [Google Scholar] [CrossRef]
  8. Tripodi, P.; Vincenzo, C.; Venezia, A.; Cocozza, A.; Pane, C. Precision Phenotyping of Wild Rocket (Diplotaxis tenuifolia) to Determine Morpho-Physiological Responses under Increasing Drought Stress Levels Using the PlantEye Multispectral 3D System. Horticulturae 2024, 10, 496. [Google Scholar] [CrossRef]
  9. Feng, X.; Zhan, Y.; Wang, Q.; Yang, X.; Yu, C.; Wang, H.; Tang, Z.Y.; Jiang, D.; Peng, C.; He, Y. Hyperspectral Imaging Combined with Machine Learning as a Tool to Obtain High-Throughput Plant Salt-Stress Phenotyping. Plant J. 2020, 101, 1448–1461. [Google Scholar] [CrossRef]
  10. Genangeli, A.; Avola, G.; Bindi, M.; Cantini, C.; Cellini, F.; Grillo, S.; Petrozza, A.; Riggi, E.; Ruggiero, A.; Summerer, S.; et al. Low-Cost Hyperspectral Imaging to Detect Drought Stress in High-Throughput Phenotyping. Plants 2023, 12, 1730. [Google Scholar] [CrossRef]
  11. Fan, X.; Zhang, H.; Zhou, L.; Bian, L.; Jin, X.; Tang, L.; Ge, Y. Evaluating Drought Stress Response of Poplar Seedlings Using a Proximal Sensing Platform via Multi-Parameter Phenotyping and Two-Stage Machine Learning. Comput. Electron. Agric. 2024, 225, 109261. [Google Scholar] [CrossRef]
  12. Malounas, I.; Paliouras, G.; Nikolopoulos, D.; Liakopoulos, G.; Bresta, P.; Londra, P.; Katsileros, A.; Fountas, S. Early Detection of Broccoli Drought Acclimation/Stress in Agricultural Environments Utilizing Proximal Hyperspectral Imaging and AutoML. Smart Agric. Technol. 2024, 8, 100463. [Google Scholar] [CrossRef]
  13. Cho, W.J.; Yang, M. High-Throughput Plant Phenotyping System Using a Low-Cost Camera Network for Plant Factory. Agriculture 2023, 13, 1874. [Google Scholar] [CrossRef]
  14. Scutelnic, D.; Muradore, R.; Daffara, C. A Multispectral Camera in the VIS–NIR Equipped with Thermal Imaging and Environmental Sensors for Non Invasive Analysis in Precision Agriculture. HardwareX 2024, 20, e00596. [Google Scholar] [CrossRef]
  15. Amitrano, C.; Junker, A.; D’Agostino, N.; De Pascale, S.; De Micco, V. Integration of High-Throughput Phenotyping with Anatomical Traits of Leaves to Help Understanding Lettuce Acclimation to a Changing Environment. Planta 2022, 256, 1–19. [Google Scholar] [CrossRef]
  16. Kohzuma, K.; Tamaki, M.; Hikosaka, K. Corrected Photochemical Reflectance Index (PRI) Is an Effective Tool for Detecting Environmental Stresses in Agricultural Crops under Light Conditions. J. Plant Res. 2021, 134, 683–694. [Google Scholar] [CrossRef] [PubMed]
  17. Polder, G.; Dieleman, J.A.; Hageraats, S.; Meinen, E. Imaging Spectroscopy for Monitoring the Crop Status of Tomato Plants. Comput. Electron. Agric. 2024, 216, 108504. [Google Scholar] [CrossRef]
  18. Susič, N.; Žibrat, U.; Širca, S.; Strajnar, P.; Razinger, J.; Knapič, M.; Vončina, A.; Urek, G.; Gerič Stare, B. Discrimination between Abiotic and Biotic Drought Stress in Tomatoes Using Hyperspectral Imaging. Sens Actuators B Chem. 2018, 273, 842–852. [Google Scholar] [CrossRef]
  19. Gitelson, A.A.; Merzlyak, M.N.; Chivkunova, O.B. Optical Properties and Nondestructive Estimation of Anthocyanin Content in Plant Leaves. Photochem. Photobiol. 2001, 74, 38. [Google Scholar] [CrossRef]
  20. Parry, C.; Blonquist, J.M.; Bugbee, B. In Situ Measurement of Leaf Chlorophyll Concentration: Analysis of the Optical/Absolute Relationship. Plant Cell Environ. 2014, 37, 2508–2520. [Google Scholar] [CrossRef]
  21. Qiao, L.; Tang, W.; Gao, D.; Zhao, R.; An, L.; Li, M.; Sun, H.; Song, D. UAV-Based Chlorophyll Content Estimation by Evaluating Vegetation Index Responses under Different Crop Coverages. Comput. Electron. Agric. 2022, 196, 106775. [Google Scholar] [CrossRef]
  22. Zubler, A.V.; Yoon, J.Y. Proximal Methods for Plant Stress Detection Using Optical Sensors and Machine Learning. Biosensors 2020, 10, 193. [Google Scholar] [CrossRef] [PubMed]
  23. Qin, J.; Monje, O.; Nugent, M.R.; Finn, J.R.; O’Rourke, A.E.; Wilson, K.D.; Fritsche, R.F.; Baek, I.; Chan, D.E.; Kim, M.S. A Hyperspectral Plant Health Monitoring System for Space Crop Production. Front. Plant. Sci. 2023, 14, 1133505. [Google Scholar] [CrossRef] [PubMed]
  24. Laveglia, S.; Altieri, G. A Method for Multispectral Images Alignment at Different Heights on the Crop. Lect. Notes Civ. Eng. 2024, 458, 401–419. [Google Scholar]
  25. Fernández, C.I.; Leblon, B.; Wang, J.; Haddadi, A.; Wang, K. Detecting Infected Cucumber Plants with Close-Range Multispectral Imagery. Remote Sens. 2021, 13, 2948. [Google Scholar] [CrossRef]
  26. Rana, S.; Gerbino, S.; Crimaldi, M.; Cirillo, V.; Carillo, P.; Sarghini, F.; Maggio, A. Comprehensive Evaluation of Multispectral Image Registration Strategies in Heterogenous Agriculture Environment. J. Imaging 2024, 10, 61. [Google Scholar] [CrossRef]
  27. Wasonga, D.O.; Yaw, A.; Kleemola, J.; Alakukku, L.; Mäkelä, P.S.A. Red-Green-Blue and Multispectral Imaging as Potential Tools for Estimating Growth and Nutritional Performance of Cassava under Deficit Irrigation and Potassium Fertigation. Remote Sens. 2021, 13, 598. [Google Scholar] [CrossRef]
  28. Lee, H.; He, Y.; Isaac, M.E. Close-Range Imaging for Green Roofs: Feature Detection, Band Matching, and Image Registration for Mixed Plant Communities. Geomatica 2024, 76, 100011. [Google Scholar] [CrossRef]
  29. Lowe, D.G. Distinctive Image Features from Scale-Invariant Keypoints. Int. J. Comput. Vis. 2004, 60, 91–110. [Google Scholar] [CrossRef]
  30. Mistry, D.; Banerjee, A. Comparison of Feature Detection and Matching Approaches: SIFT and SURF. Glob. Res. Dev. J. Eng. 2017, 2, 7–13. [Google Scholar]
  31. Tareen, S.A.K.; Saleem, Z. A Comparative Analysis of SIFT, SURF, KAZE, AKAZE, ORB, and BRISK. In Proceedings of the 2018 International Conference on Computing, Mathematics and Engineering Technologies: Invent, Innovate and Integrate for Socioeconomic Development, iCoMET 2018—Proceedings 2018, Sukkur, Pakistan, 1–10 January 2018. [Google Scholar] [CrossRef]
  32. Fernández, C.I.; Haddadi, A.; Leblon, B.; Wang, J.; Wang, K. Comparison between Three Registration Methods in the Case of Non-Georeferenced Close Range of Multispectral Images. Remote Sens. 2021, 13, 396. [Google Scholar] [CrossRef]
  33. Sturm, P. Pinhole Camera Model. In Computer Vision: A Reference Guide; Springer International Publishing: Cham, Switzerland, 2021; pp. 983–986. [Google Scholar] [CrossRef]
  34. Longuet-higgins, H.C. A Computer Algorithm for Reconstructing a Scene from Two Projections. Nature 1981, 293, 133–135. [Google Scholar] [CrossRef]
  35. Memon, Q.; Khan, S. Camera Calibration and Three-Dimensional World Reconstruction of Stereo-Vision Using Neural Networks. Int. J. Syst. Sci. 2001, 32, 1155–1159. [Google Scholar] [CrossRef]
  36. Heikkila, J.; Silven, O. Four-Step Camera Calibration Procedure with Implicit Image Correction. In Proceedings of the IEEE Computer Society Conference on Computer Vision and Pattern Recognition, San Juan, PR, USA, 17–19 June 1997; pp. 1106–1112. [Google Scholar] [CrossRef]
  37. Camera Calibration Toolbox for Matlab. Available online: https://data.caltech.edu/records/jx9cx-fdh55 (accessed on 26 January 2025).
  38. Zitová, B.; Flusser, J. Image Registration Methods: A Survey. Image Vis. Comput. 2003, 21, 977–1000. [Google Scholar] [CrossRef]
  39. Rouse, J.W., Jr.; Haas, R.H.; Schell, J.A.; Deering, D.W. Monitoring Vegetation Systems in the Great Plains with ERTS. NASA. Goddard Space Flight Center 3d ERTS-1 Symp., Volume 1, Sect. A, Paper A20, 1974; pp. 309–317. Available online: https://ntrs.nasa.gov/citations/19740022614 (accessed on 29 January 2025).
  40. Birth, G.S.; McVey, G.R. Measuring the Color of Growing Turf with a Reflectance Spectrophotometer 1. Agron J. 1968, 60, 640–643. [Google Scholar] [CrossRef]
  41. Gitelson, A.; Merzlyak, M.N. Quantitative Estimation of Chlorophyll-a Using Reflectance Spectra: Experiments with Autumn Chestnut and Maple Leaves. J. Photochem. Photobiol. B Biol. 1994, 22, 247–252. [Google Scholar] [CrossRef]
  42. Bayle, A.; Carlson, B.Z.; Thierion, V.; Isenmann, M.; Choler, P. Improved Mapping of Mountain Shrublands Using the Sentinel-2 Red-Edge Band. Remote Sens. 2019, 11, 2807. [Google Scholar] [CrossRef]
  43. Gitelson, A.A.; Merzlyak, M.N. Signature Analysis of Leaf Reflectance Spectra: Algorithm Development for Remote Sensing of Chlorophyll. J. Plant Physiol. 1996, 148, 494–500. [Google Scholar] [CrossRef]
  44. Penuelas, J.; Baret, F.; Filella, I. Semi-Empirical Indices to Assess Carotenoids/Chlorophyll a Ratio from Leaf Spectral Reflectance. Photosynthetica 1995, 31, 221–230. [Google Scholar]
  45. Wang, C.; Liu, S.; Wang, X.; Lan, X. Time Synchronization and Space Registration of Roadside LiDAR and Camera. Electronics 2023, 12, 537. [Google Scholar] [CrossRef]
  46. Kim, C.; van Iersel, M.W. Image-Based Phenotyping to Estimate Anthocyanin Concentrations in Lettuce. Front. Plant Sci. 2023, 14, 1155722. [Google Scholar] [CrossRef] [PubMed]
  47. Kurunc, A. Effects of Water and Salinity Stresses on Growth, Yield, and Water Use of Iceberg Lettuce. J. Sci. Food Agric. 2021, 101, 5688–5696. [Google Scholar] [CrossRef]
  48. Ihuoma, S.O.; Madramootoo, C.A. Recent Advances in Crop Water Stress Detection. Comput. Electron. Agric. 2017, 141, 267–275. [Google Scholar] [CrossRef]
  49. Ncama, K.; Sithole, N.J. The Effect of Nitrogen Fertilizer and Water Supply Levels on the Growth, Antioxidant Compounds, and Organic Acids of Baby Lettuce. Agronomy 2022, 12, 614. [Google Scholar] [CrossRef]
  50. Paim, B.T.; Crizel, R.L.; Tatiane, S.J.; Rodrigues, V.R.; Rombaldi, C.V.; Galli, V. Mild Drought Stress Has Potential to Improve Lettuce Yield and Quality. Sci. Hortic. 2020, 272, 109578. [Google Scholar] [CrossRef]
  51. Zelinsky, A. Learning OpenCV—Computer Vision with the OpenCV Library. IEEE Robot. Autom. Mag. 2009, 16, 100. [Google Scholar] [CrossRef]
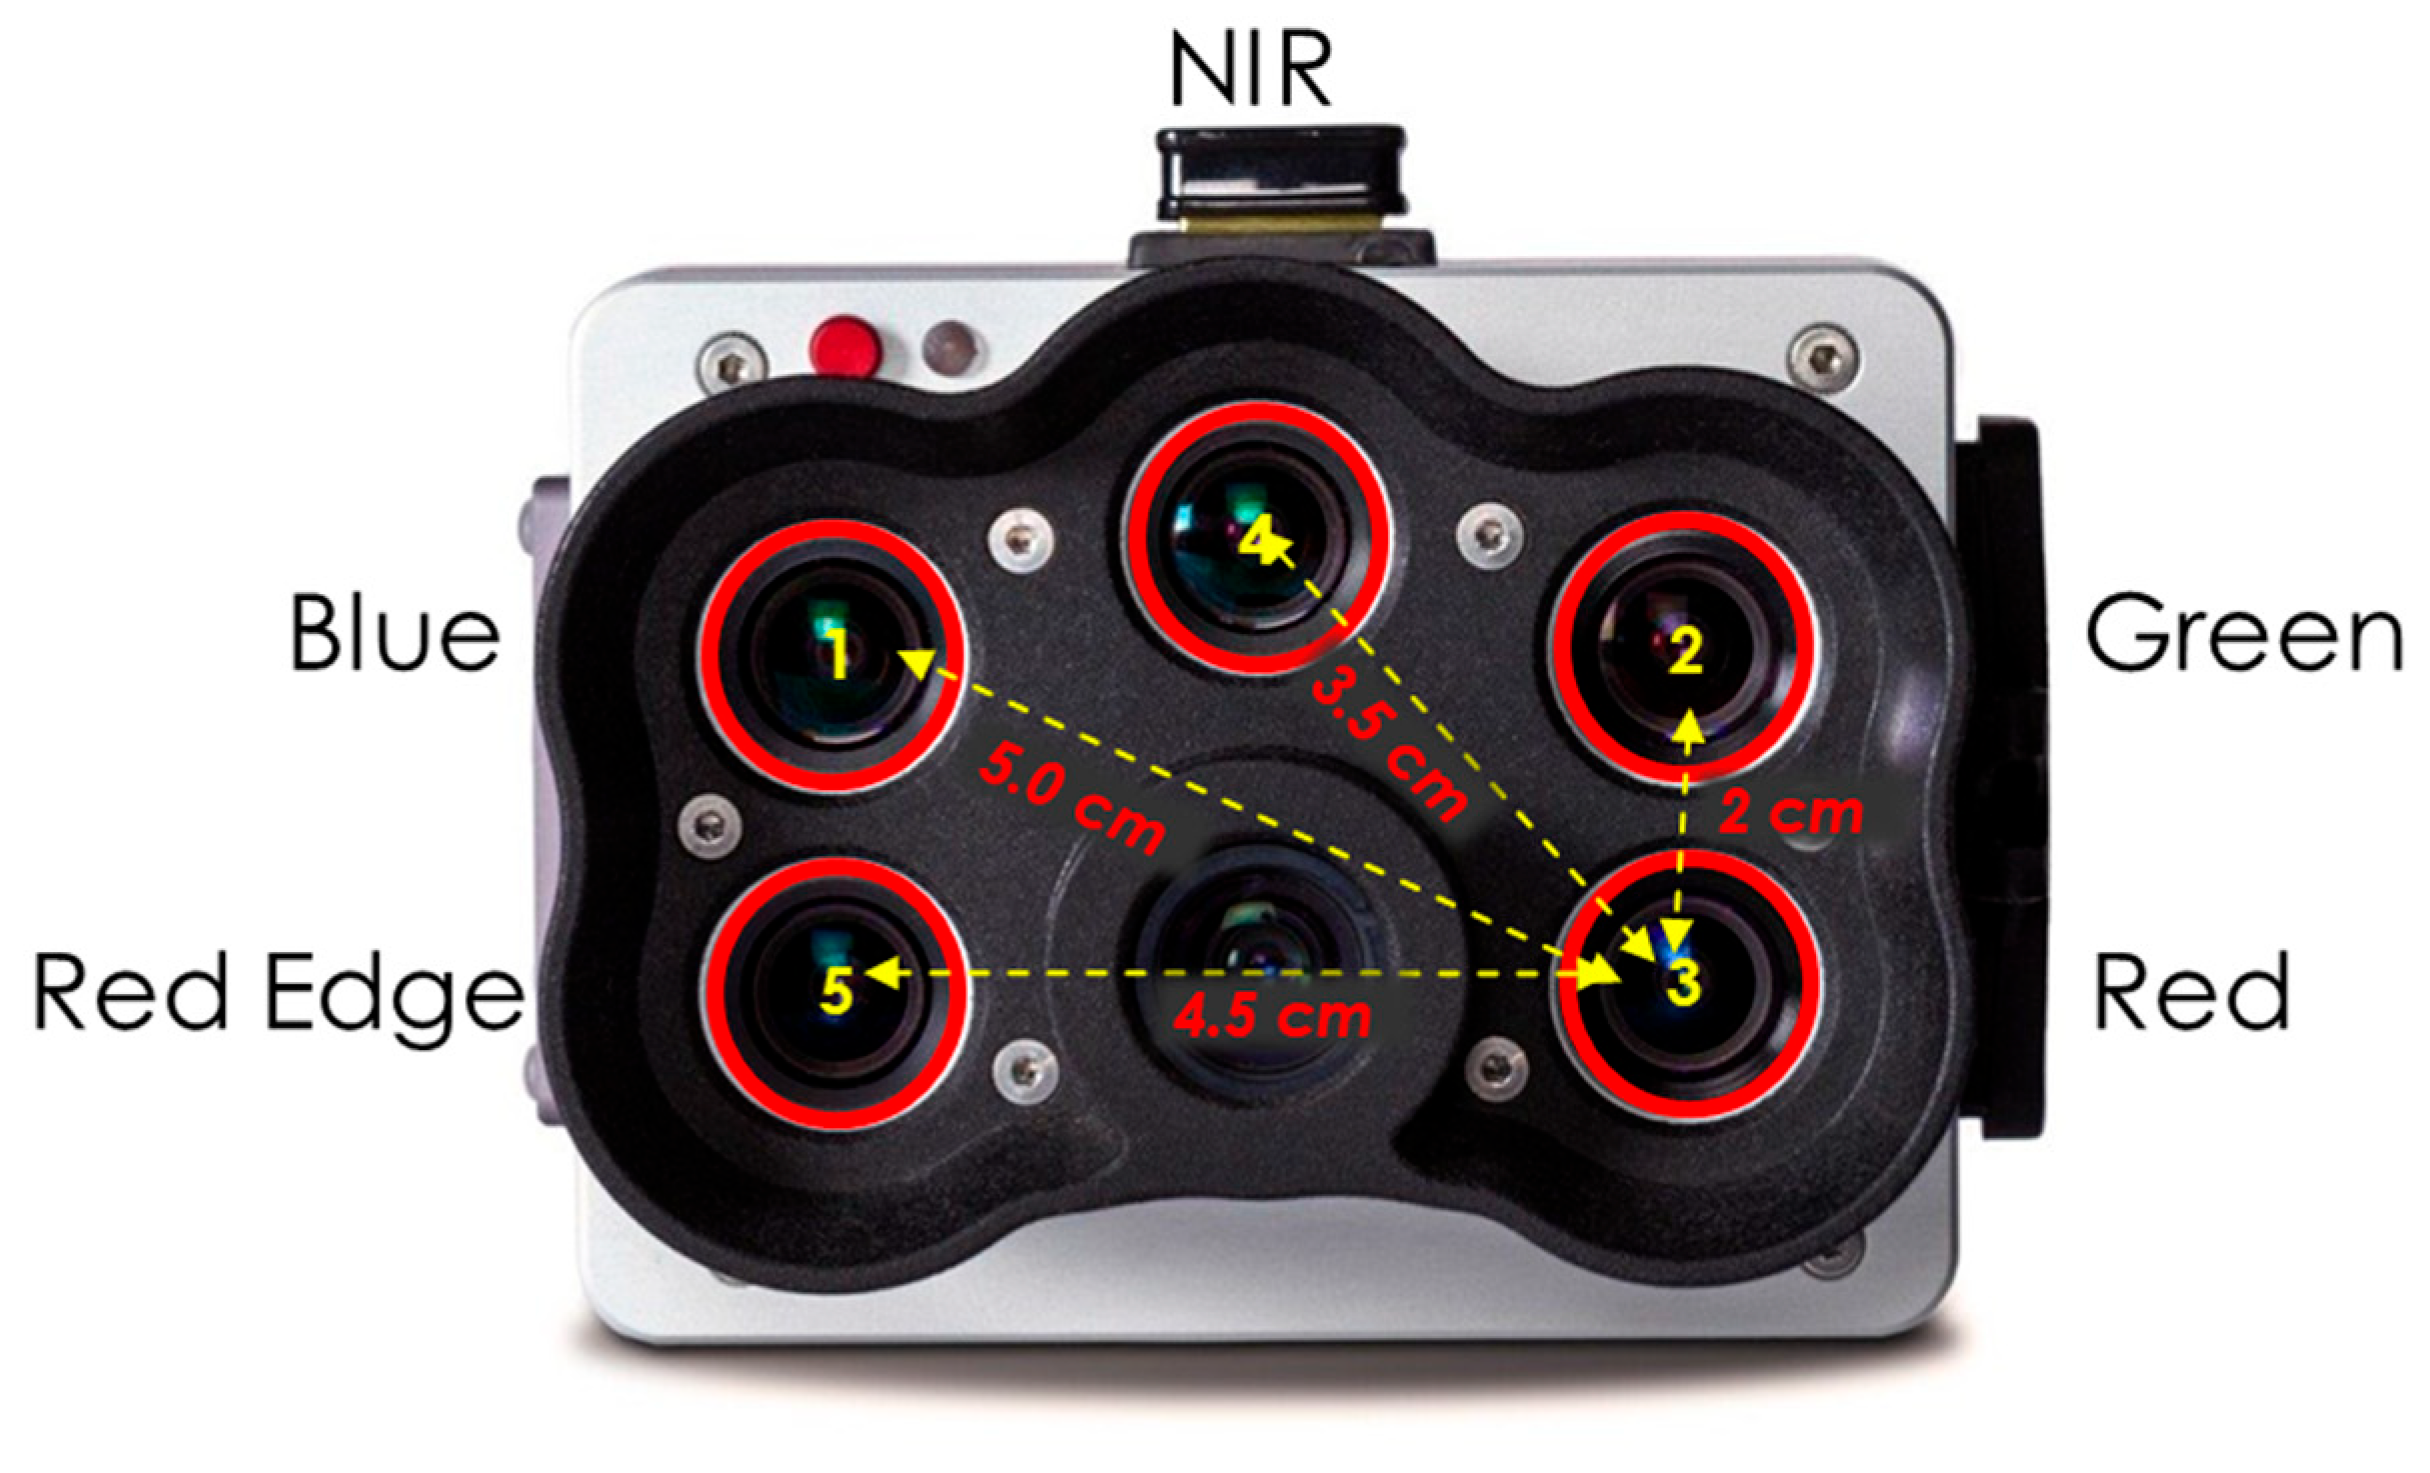
Figure 1. Location of the optical lens of the MicaSense RedEdge P sensor and relative pose of the spectral bands (B, G, NR, and RE) to the R band, with distance from the reference lens (cm).
Applsci 15 02893 g001
Figure 2. Averages of the x-axis and y-axis reprojection errors (pixels) for the stereo setups of the G, B, NR, and RE bands to the R band as a function of distance.
Applsci 15 02893 g002
Figure 3. Reprojection errors expressed as the average values along the X and Y components for a single distance, relative to the stereo pairs used in the calibration process.
Applsci 15 02893 g003
Figure 4. Results of the model interpolation on the experimental data, with the offsets of the B, G, NR, and RE bands relative to the R band, analyzed along the X-axis and Y-axis using the CB, FT, and RG methods.
Applsci 15 02893 g004
Figure 5. Raw images of R, G, and B bands of the multispectral sensor (MS) and corresponding aligned images using CB, FT, and RG methods on baby lettuce leaves.
Applsci 15 02893 g005
Figure 6. Correlation matrix plot of Pearson’s coefficient among chlorophyll content and different vegetation indices for the lettuce leaves.
Applsci 15 02893 g006
Figure 7. Box plot of chlorophyll content (μmol/cm2) and leaf area (cm2) of baby lettuce plants grown in good water conditions (healthy) and water deficit conditions (unhealthy) with significance (α = 0.05) with Tuckey’s letters.
Applsci 15 02893 g007
Figure 8. Selected vegetation indices (VIs) (GNDVI, SR, MCARI, NARI, and mARI) were applied to baby lettuce leaves as a result of image alignment on healthy and stressed plants.
Applsci 15 02893 g008
Table 1. Multispectral band ratios for the calculation of vegetation indices used in this study.
Vegetation IndicesFormulaReferences
NDVI (Normalized Difference Vegetation Index)(NIR − RED)/(NIR + RED)[39]
MCARI (Modified Chlorophyll Absorption in Reflectance Index)[(RE − RED) − 0.2 × (RE−G)] × (RED/RE)[39]
SR (Spectral Ratio)RED/NIR[40]
CLr (Chlorophyll Red Index)(RED/NIR) − 1[41]
NARI (Normalized Anthocyanin Reflectance Index)(1/G + 1/RED)/(1/G − 1/RED)[42]
ARI (Anthocyanin Reflectance Index)(1/G) − (1/RED)[19]
mARI (Modified Anthocyanin Reflectance Index)(1/G − 1/RE) × NIR[19]
GNDVI (Green Normalized Difference Vegetation Index)(NIR + G)/(NIR − G)[43]
SIPI (Structural Independent Pigment Index)(NIR + RED)/(NIR − B)[44]
Table 2. Performance of the depth estimation (Z) in mm for stereo pairs (G vs. R, B vs. R, NR vs. R, and RE vs. R) at fixed distances (800 mm, 1000 mm, 1300 mm, and 1370 mm). The number of points used (nPoints), excluding NaN values and outliers (a < 0.05), the mean value ± standard error, and relative error (%), are reported.
Depth Estimation (Z) Error, Band G vs. RDepth Estimation (Z) Error, Band B vs. R
dist_mmnPointsMean ± stdErr%dist_mmnPointsMean ± stdErr%
8001.49 × 105653.11 ± 2.86 × 10−518.368001.26 × 105750.43 ± 3.13 × 10−56.20
10001.05 × 105767.77 ± 2.58 × 10−523.22100091,071884.05 ± 3.19 × 10−511.60
130070,9611054.60 ± 5.35 × 10−518.88130055,8591207.90 ± 4.45 × 10−57.08
137055,0481077.90 ± 1.02 × 10−421.32137045,6251238.10 ± 8.46 × 10−59.63
Depth Estimation (Z) Error, Band NR vs. RDepth Estimation (Z) Error, Band RE vs. R
dist_mmnPointsMean ± stdErr%dist_mmnPointsMean ± stdErr%
8001.37 × 105729.23 ± 2.50 × 10−58.8580099,057762.22 ± 3.23 × 10−54.72
100099,340856.87 ± 2.85 × 10−514.31100082,246895.92 ± 3.38 × 10−510.41
130052,3891173.40 ± 4.53 × 10−59.74130048,2861222.70 ± 4.19 × 10−55.95
137049,9601195.80 ± 6.28 × 10−512.72137055,9651258.60 ± 8.57 × 10−58.13
Table 3. Performance of the CB method correlation models of offsets on the X-axis and Y-axis. The 95% confidence limits of the model parameters are given in round brackets.
X Offset Model, Band B vs. RY Offset Model, Band B vs. R
General model: y(x) = a + b/x
a = −1.266 (−2.457, −0.07416)
b = −7.432 × 10⁴ (−7.531× 10⁴, −7.332 × 10⁴)
adjrsquare: 0.9977
rmse: 1.4953
General model: y(x) = a + b/x
a = −5.597 (−6.756, −4.437)
b =2.897 × 10⁴ (2.8 × 10⁴, 2.994 × 10⁴)
adjrsquare: 0.9860
rmse: 1.4550
X Offset Model, Band G vs. RY Offset Model, Band G vs. R
General model: y(x) = a + b/x
a = −5.427 (−6.151, −4.703)
b = −293.5 (−898, 311)
adjrsquare: −0.0248
rmse: 0.9082
General model: y(x) = a + b/x
a = 0.7586 (−0.05633, 1.574)
b = 2.909 × 10⁴ (2.841 × 10⁴, 2.977 × 10⁴)
adjrsquare: 0.9930
rmse: 1.0229
X Offset Model, Band NR vs. RY Offset Model, Band NR vs. R
General model: y(x) = a + b/x
a = −3.452 (−4.464, −2.439)
b = −3.716 × 10⁴ (−3.801 × 10⁴, −3.632 × 10⁴)
adjrsquare: 0.9934
rmse: 1.2709
General model: y(x) = a + b/x
a = −8.98 (−10.04, −7.919)
b = 3.897 × 10⁴ (3.808 × 10⁴, 3.985 × 10⁴)
adjrsquare: 0.9934
rmse: 1.3311
X Offset Model, Band RE vs. RY Offset Model, Band RE vs. R
General model: y(x) = a + b/x
a = 2.719 (1.645, 3.794)
b = −7.421 × 10⁴ (−7.51 × 10⁴, −7.331× 10⁴)
adjrsquare: 0.9981
rmse: 1.3484
General model: y(x) = a + b/x
a = −6.818 (−7.848, −5.788)
b = −409.5 (−1270, 451.2)
adjrsquare: −0.2176
rmse: 1.2931
Table 4. Performance of the FT method correlation models of offsets on the X-axis and Y-axis. The 95% confidence limits of the model parameters are given in round brackets.
X Offset Model, Band B vs. RY Offset Model, Band B vs. R
General model: y(x) = a + b/x
a = −2.171 (−3.162, −1.18)
b = −7.311 × 10⁴ (−7.394 × 10⁴, −7.229 × 10⁴)
adjrsquare: 0.9984
rmse: 1.2438
General model: y(x) = a + b/x
a = −5.471 (−6.427, −4.516)
b = 2.873 × 10⁴ (2.794 × 10⁴, 2.953 × 10⁴)
adjrsquare: 0.9903
rmse: 1.1996
X Offset Model, Band G vs. RY Offset Model, Band G vs. R
General model: y(x) = a + b/x
a = −6.028 (−6.664, −5.392)
b = 319.5 (−211.6, 850.6)
adjrsquare: 0.0104
rmse: 0.7980
General model: y(x) = a + b/x
a = 0.83 (0.1613, 1.499)
b = 2.898 × 10⁴ (2.842 × 10⁴, 2.954 × 10⁴)
adjrsquare: 0.9952
rmse: 0.8393
X Offset Model, Band NR vs. RY Offset Model, Band NR vs. R
General model: y(x) = a + b/x
a = −4.199 (−5.128, −3.271)
b = −3.599 × 10⁴ (−3.677 × 10⁴, −3.521 × 10⁴)
adjrsquare: 0.9940
rmse: 1.1650
General model: y(x) = a + b/x
a = −8.899 (−9.784, −8.014)
b = 3.877 × 10⁴ (3.803 × 10⁴, 3.951 × 10⁴)
adjrsquare: 0.9954
rmse: 1.1107
X Offset Model, Band RE vs. RY Offset Model, Band RE vs. R
General model: y(x) = a + b/x
a = 1.81 (0.8442, 2.775)
b = −7.298 × 10⁴ (−7.379 × 10⁴, −7.218 × 10⁴)
adjrsquare: 0.9984
rmse: 1.2115
General model: y(x) = a + b/x
a = −6.91 (−7.78, −6.04)
b = −304.6 (−1031, 422.1)
adjrsquare: −0.2151
rmse: 1.0918
Table 5. Performance of the RG method correlation models of offsets on the X-axis and Y-axis. The 95% confidence limits of the model parameters are given in round brackets.
X Offset Model, Band B vs. RY Offset Model, Band B vs. R
General model: y(x) = a + b/x
a = −0.8794 (−1.293, −0.4655)
b = −7.479 × 10⁴ (−7.517 × 10⁴, −7.441 × 10⁴)
adjrsquare: 0.9997
rmse: 0.4196
General model: y(x) = a + b/x
a = −6.139 (−7.659, −4.618)
b = 2.956 × 10⁴ (2.813 × 10⁴, 3.099 × 10⁴)
adjrsquare: 0.9742
rmse: 1.4956
X Offset Model, Band G vs. RY Offset Model, Band G vs. R
General model: y(x) = a + b/x
a = −5.421 (−6.224, −4.619)
b = −301.1 (−1004, 401.8)
adjrsquare: −0.0333
rmse: 0.9353
General model: y(x) = a + b/x
a =0.4707 (−0.5691, 1.511)
b = 2.939 × 10⁴ (2.843 × 10⁴, 3.036 × 10⁴)
adjrsquare: 0.9877
rmse: 1.0540
X Offset Model, Band NR vs. RY Offset Model, Band NR vs. R
General model: y(x) = a + b/x
a = −3.174 (−4.51, −1.837)
b = −3.739 × 10⁴ (−3.863 × 10⁴, −3.615 × 10⁴)
adjrsquare: 0.9874
rmse: 1.3549
General model: y(x) = a + b/x
a = −9.352 (−10.73, −7.972)
b = 3.936 × 10⁴ (3.809 × 10⁴, 4.064 × 10⁴)
adjrsquare: 0.9880
rmse: 1.3990
X Offset Model, Band RE vs. RY Offset Model, Band RE vs. R
General model: y(x) = a + b/x
a = 3.196 (1.836, 4.556)
b = −7.472 × 10⁴ (−7.598 × 10⁴, −7.346 × 10⁴)
adjrsquare: 0.9967
rmse: 1.3787
General model: y(x) = a + b/x
a = −6.818 (−7.848, −5.788)
b = −409.5 (−1270, 451.2)
adjrsquare: −0.2176
rmse: 1.2931
Table 6. Examples of calculating the model y(x) = a + b/x and relative error (Err%), using reference coefficients values of a = −5597, b = 28,970, and distance (x) = 1, 10, 20, 30, 50, and 100 m.
Distance (m)b/x (Pixel)y(x) = a + b/x (Pixel)Relative Error (err%)
128.97023.373517.91%
102.897−2.70051.77%
201.449−4.14825.88%
300.966−4.63117.26%
500.579−5.01810.34%
1000.290−5.3075.18%
Disclaimer/Publisher’s Note: The statements, opinions and data contained in all publications are solely those of the individual author(s) and contributor(s) and not of MDPI and/or the editor(s). MDPI and/or the editor(s) disclaim responsibility for any injury to people or property resulting from any ideas, methods, instructions or products referred to in the content.