Article

Development of a Metabolic Syndrome Prediction Model Using HOMA-IR and Multivariate Factors

Department of Exercise Prescription, Dongshin University, Naju 58245, Republic of Korea
*
Author to whom correspondence should be addressed.
Appl. Sci. 2025, 15(6), 2985; https://doi.org/10.3390/app15062985
Submission received: 31 January 2025 / Revised: 7 March 2025 / Accepted: 7 March 2025 / Published: 10 March 2025

Abstract

:
We aimed to develop a multiple logistic regression model for predicting the occurrence of metabolic syndrome (MetS) using homeostasis model assessment of insulin resistance (HOMA-IR) levels, gender, age, and Diabetes Mellitus (DM) status, and to evaluate its predictive accuracy. Data from 6134 participants in the 2019 Korea National Health and Nutrition Examination Survey were analyzed. MetS was diagnosed using the Adult Treatment Panel III criteria. A logistic regression model was developed based on the regression coefficients of each variable. Model performance was evaluated through a receiver operating characteristic analysis, revealing an overall area under the curve (AUC) of 0.819, a sensitivity of 80%, and a specificity of 68.9%. Age-specific analysis showed that the model’s predictive power was highest among those aged 20–29 years (AUC: 0.864). Conversely, the AUC progressively decreased in individuals aged ≥50 years, indicating reduced predictive power in older adults. These findings suggest the importance of adopting a multidimensional approach that considers HOMA-IR, age, gender, and DM status for predicting MetS. The developed prediction model can be used as a valuable tool for the early diagnosis of MetS and the development of tailored MetS prevention programs. It also provides foundational data for shaping public health policies related to MetS.

1. Introduction

Metabolic syndrome (MetS) serves as a comprehensive framework for describing a cluster of clinical symptoms, including central obesity, dyslipidemia, impaired glycemic control, and elevated blood pressure. It is a critical tool for identifying individuals at increased risk for atherosclerotic cardiovascular disease (CVD) and type 2 Diabetes Mellitus (DM2) [1,2,3,4]. The global prevalence of these factors has rapidly increased in recent decades [5,6,7], establishing MetS as an important risk factor for various cardiovascular and metabolic diseases. Insulin resistance, a major physiological feature of MetS, is associated with obesity, hypertension, cancer, autoimmune diseases, and DM2 [8,9,10]. Insulin resistance arises from metabolic, hemodynamic, and inflammatory changes driven by interactions between genetic and environmental factors [8,9,10]. In this context, the homeostasis model assessment of insulin resistance (HOMA-IR) level has proven to be a robust alternative indicator for evaluating insulin resistance and is widely used in clinical practice [11,12]. Previous studies have demonstrated that the prevalence of cardiovascular metabolic diseases, such as Diabetes Mellitus and central obesity, increased with age and varied by gender [6,7]. Furthermore, the HOMA-IR levels increased in those aged ≥50 years [13]. These findings suggest that age, sex, and HOMA-IR levels may affect the accuracy of determining cardiometabolic risk.
In addition to widely recognized MetS risk algorithms, such as the Framingham Risk Score or waist circumference/BMI-based strategies [14,15], HOMA-IR offers a direct measure of insulin resistance a core pathophysiological factor in MetS. By incorporating a marker that reflects β-cell function and insulin sensitivity more closely, HOMA-IR-based models can potentially provide more targeted risk estimates. Nonetheless, other well-established risk factors for MetS, including physical activity, dietary habits, medication use (e.g., antihypertensive or lipid-lowering agents), and family history, also substantially influence MetS outcomes [16,17]. Owing to limitations in the 2019 KNHANES dataset, these additional variables were not consistently measured or reported and thus could not be included in the present model. This omission may affect the full spectrum of predictive accuracy; however, examining HOMA-IR in concert with basic demographic variables remains a valuable approach for better understanding MetS risk in large-scale population studies.
Early identification of individuals at risk for MetS through valid predictive models is of paramount importance, as it allows for timely intervention and more effective disease management. In particular, integrating key metabolic markers, such as HOMA-IR, with demographic factors (e.g., age, gender, and Diabetes Mellitus status) can substantially improve the precision and applicability of these models. Robust prediction tools not only facilitate clinicians’ decision-making process but also guide resource allocation and policy development in public health.
Therefore, this study developed and evaluated a multiple logistic regression model using HOMA-IR levels, gender, age, and DM status to predict the occurrence of MetS, with the goal of improving prevention and management strategies and verifying its clinical potential.

2. Materials and Methods

2.1. Study Participants

This cross-sectional study utilized secondary data from the 2019 Korea National Health and Nutrition Examination Survey (KNHANES), conducted annually by the Korea Disease Control and Prevention Agency. The survey targets a representative sample of the non-institutionalized South Korean population. Initially, 8110 participants were surveyed; however, those with incomplete data on fasting blood glucose or HOMA-IR levels were excluded. This resulted in a final dataset of 6134 participants for analysis.
The protocol for collecting the KNHANES data was reviewed and approved by the Institutional Review Board of the Korea Disease Control and Prevention Agency (approval code: 2018-01-03-C-A), ensuring compliance with ethical standards.
We classified participants as diabetic if they self-reported a physician’s diagnosis of Diabetes Mellitus in the KNHANES survey, while those who reported no history of Diabetes Mellitus were categorized as non-diabetic. Only individuals who had valid fasting insulin measurements, fasting glucose levels, and Diabetes Mellitus status data were included.
To assess whether excluding participants with missing data introduced any selection bias, we compared the excluded (n = 1976) and included (n = 6134) groups on key demographic and clinical variables (e.g., sex, age, waist circumference). This participant selection process is illustrated in Figure 1. As shown in Table 1, there were no statistically significant differences in these characteristics (all p > 0.05), suggesting that the final analytic sample remained representative despite the exclusions. This assessment confirms the integrity of the analyzed dataset and indicates that missing data did not introduce systematic bias.

2.2. Variables

2.2.1. Analysis of MetS-Related Factors

In this study, Diabetes Mellitus was defined as a fasting blood glucose level of >126 mg/dL. The diagnosis of MetS was based on the Adult Treatment Panel III (ATP III) criteria. According to these criteria, MetS is diagnosed when three or more of the following conditions are met:
  • Waist circumference: ≥102 cm in men and ≥88 cm in women;
  • Hypertriglyceridemia: a blood triglyceride level of ≥150 mg/dL;
  • Decreased high-density lipoprotein (HDL) cholesterol levels: HDL cholesterol levels of <40 mg/dL in men and <50 mg/dL in women;
  • Hypertension: Blood pressure of ≥130/85 mmHg or treatment for hypertension;
  • Hyperglycemia: a fasting blood glucose level of ≥100 mg/dL or treatment for Diabetes Mellitus.
We assessed the presence of MetS using these criteria for subsequent data analysis.

2.2.2. Homeostatic Model Assessment for Insulin Resistance

The HOMA-IR was calculated using the Matthews formula: HOMA-IR [FBG (mg/dL) × insulin (uU/mL)/405] [18].
In this study, we treated HOMA-IR as a continuous variable rather than applying a specific cutoff value, as our primary focus was to examine its association with MetS rather than to diagnose insulin resistance.

2.2.3. Building a Predictive Model Using a Logistic Regression Analysis

Multiple logistic regression analysis was used to predict the probability of MetS occurrence. HOMA-IR levels, gender, age, and DM status were used as independent variables. The regression coefficient of each variable was estimated using a logistic regression model, defined by the following logit function:
logit(p) = β0 + β1 × HOMA_IR + β2 × Sex + β3 × Age + β4 × Diabetes Mellitus
The coefficients were as follows:
β0 = −4.067(intercept), β1 = 0.448(HOMA-IR, β2 = 0.391(sex: men = 1, women = 0), β3 = 0.033(age),
β4 = 0.649(Diabetes Mellitus = 1, non-Diabetes Mellitus = 0)
The predicted probability p was calculated using the logistic function in the following form.
p = 1 1 + e log it ( p )

2.3. Statistical Analysis

Descriptive statistics were employed to summarize the demographic and clinical characteristics of the study population. Gender distribution and the presence or absence of metabolic syndrome (MetS) were presented as frequencies and standard deviations. Continuous variables such as age and HOMA-IR levels were described using means and standard deviations. This initial descriptive overview provided a foundation for further analyses.
We also conducted a stratified ROC analysis by dividing participants into approximately 10-year intervals (20–29, 30–39, 40–49, 50–59, and ≥60 years). This was to explore any age-dependent variations in model performance.
To assess the associations between Diabetes Mellitus status and other variables, chi-square tests were utilized for categorical variables and independent t-tests for continuous variables. These tests helped identify significant differences across groups, which were crucial for subsequent modeling.
Multiple logistic regression analysis was conducted to predict the occurrence of MetS. Variables included in the model—HOMA-IR levels, gender, age, and DM status—were selected based on their known associations with MetS from previous studies. This selection was aimed at understanding the unique contributions of these factors to MetS risk. The model estimated regression coefficients for each predictor to assess their individual impact and interaction within the model. This approach allowed for a detailed interpretation of how each variable influences the likelihood of MetS, aligning the analysis with the objectives of predicting and managing MetS effectively. Because KNHANES employs a complex, multi-stage sampling design, we applied the sampling weights provided by the survey to ensure national representativeness. All logistic regression analyses, including ROC evaluations, were performed using these weights. Prior to logistic regression, we evaluated the distribution of HOMA-IR using the Shapiro–Wilk test. The data exhibited a right-skewed (long-tailed) distribution, and log transformation did not substantially improve normality. However, because logistic regression does not require normality of the predictor variables, we proceeded without further transformations. We also conducted a multicollinearity check using variance inflation factors (VIF) for all independent variables (HOMA-IR, gender, age, and DM status), and each showed a VIF value of 1.000, indicating no significant multicollinearity.
The predictive accuracy of the logistic regression model was evaluated using a receiver operating characteristic (ROC) curve analysis. The model’s performance was detailed through the area under the curve (AUC), with sensitivity and specificity calculated to reflect its diagnostic ability. To address variations in MetS risk across different age groups, the ROC analysis was stratified by age. This stratification was based on the premise that risk factors for MetS, such as hormonal changes and lifestyle modifications, differ significantly among age groups, potentially affecting the model’s performance.
The results were discussed in terms of AUC values for each age group, highlighting the model’s strengths and limitations in different demographic segments. All statistical analyses were conducted using SPSS software (version 25.0), with a significance level set at p < 0.05, ensuring the robustness and reliability of the findings.

3. Results

3.1. Comparison of Anthropometric, Clinical, and Biochemical Characteristics Between Patients with and Without Diabetes Mellitus

Table 2 shows the anthropometric and biochemical characteristics stratified by Diabetes Mellitus status. Briefly, individuals with Diabetes Mellitus had significantly higher mean waist circumference, triglyceride levels, fasting blood glucose, and HOMA-IR values compared to those without Diabetes Mellitus, while HDL-cholesterol was significantly lower in the diabetic group. Moreover, the prevalence of MetS was markedly higher among participants with Diabetes Mellitus (all p < 0.001).

3.2. Multiple Logistic Regression Analysis of Variables Affecting the Occurrence of Metabolic Syndrome

Table 3 presents the results of the multiple logistic regression analysis examining HOMA-IR levels, gender, age, and DM status as predictors of MetS. Diabetes Mellitus status emerged as the strongest predictor (OR = 1.914), followed by HOMA-IR (OR = 1.566), gender (OR = 1.479), and age (OR = 1.033).
Clinically, an odds ratio (OR) of 1.566 for HOMA-IR suggests that each 1-unit increase in HOMA-IR elevates the odds of MetS by approximately 56.6% when controlling for the other variables. Similarly, an OR of 1.033 for age indicates that for every additional year, the odds of MetS rise by about 3.3%. These findings underscore the substantial impact of insulin resistance and age on MetS risk.

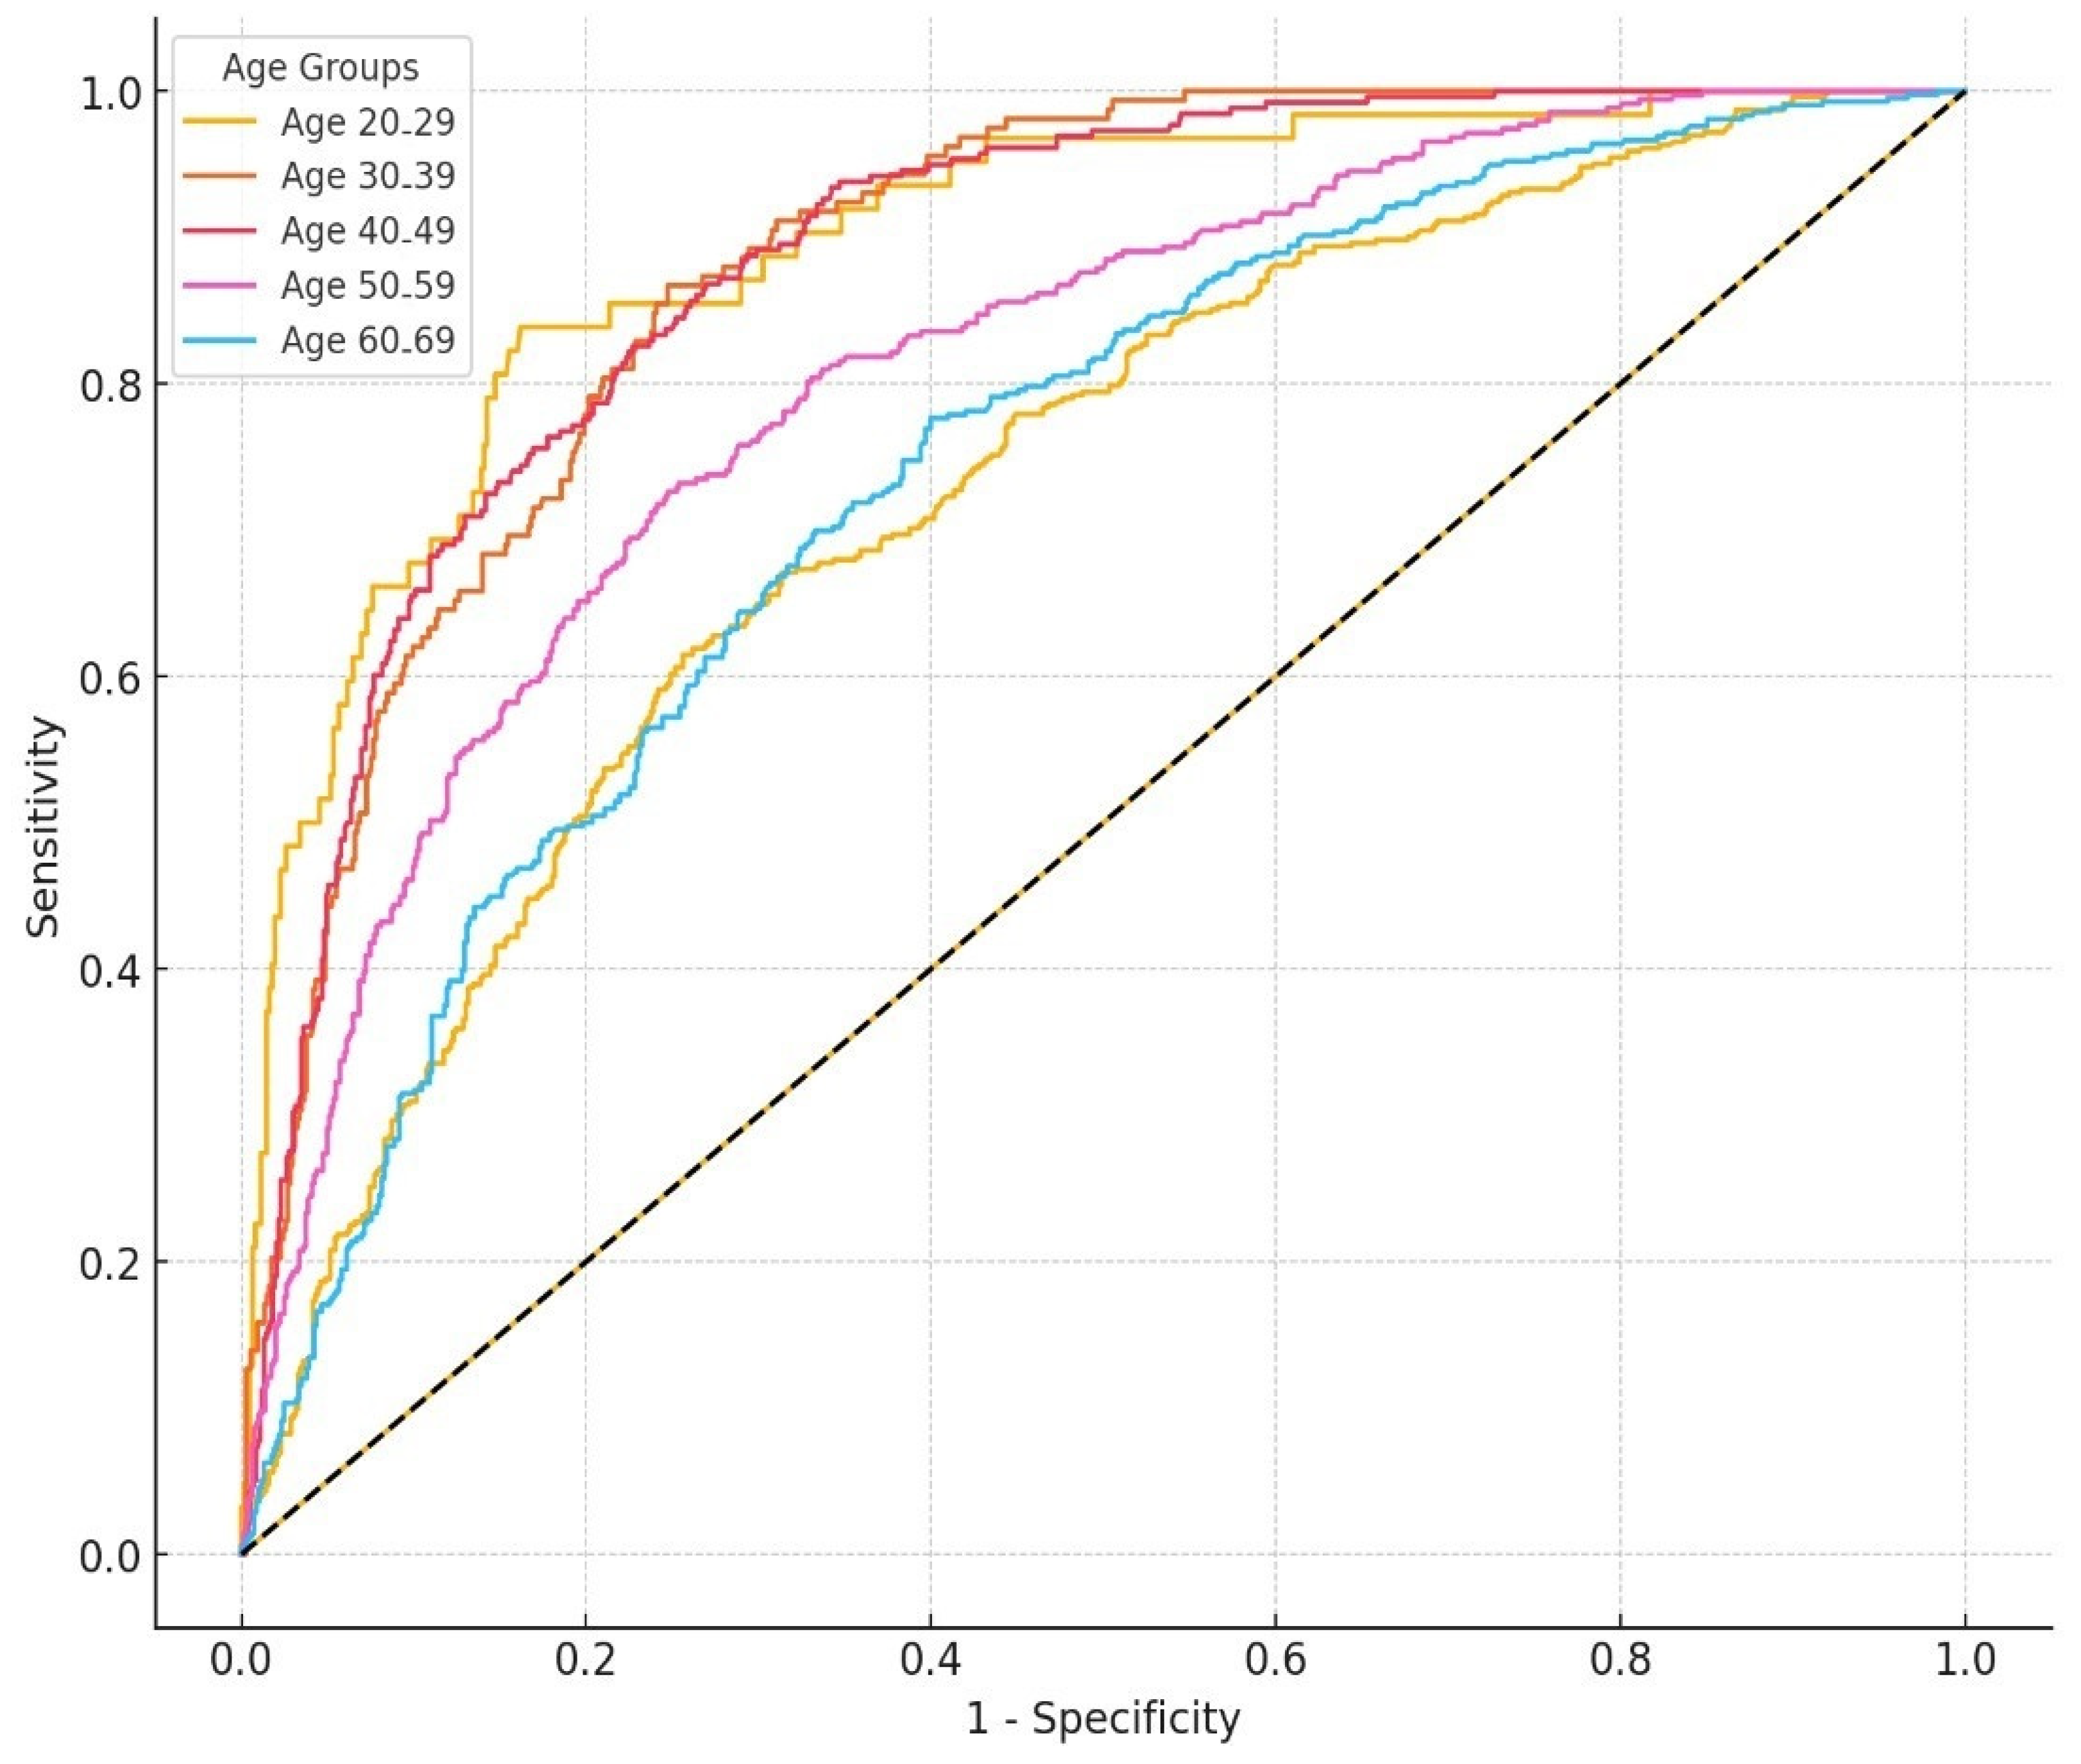
3.3. ROC Curve Based on a Logistic Regression Model and AUC Analysis

Table 4 compares the receiver operating characteristic (ROC) curve analyses of two logistic regression models—one incorporating HOMA-IR, gender, age, and Diabetes Mellitus status (combined model), and another using HOMA-IR alone (HOMA-only model). Overall, the combined model yielded higher predictive performance than the HOMA-only model. When stratified by age, the predictive accuracy was strongest among younger adults and gradually declined in older age groups. However, the combined model outperformed the HOMA-only approach in every age category, suggesting that gender, age, and Diabetes Mellitus status add significant value to HOMA-IR for predicting MetS. These findings are visually presented if Figure 2. Which illustrates the ROC curves for both models across different age groups.

4. Discussion

Using various variables such as HOMA-IR levels, gender, age, and DM status, we developed and evaluated a multiple logistic regression model for predicting the occurrence of MetS among 6134 participants in the KNHANES with available data on fasting blood glucose and HOMA-IR levels. The results showed that DM status was the strongest predictor of MetS occurrence, and HOMA-IR levels, gender, and age in order had a significant effect on the prediction model. These results align with those of previous studies, confirming the significant role of DM status and insulin resistance in predicting MetS [6,7,13]. When the optimal threshold was set to 0.2408, the model demonstrated a sensitivity of 80% and a specificity of 68.9%, with an AUC of 0.819, indicating high predictive accuracy for MetS.
The additional ROC comparison revealed that incorporating gender, age, and DM status alongside HOMA-IR significantly enhanced model performance compared with using HOMA-IR alone (AUC: 0.819 vs. 0.761).
Notably, the model’s sensitivity and specificity varied across age groups. It demonstrated the highest predictive accuracy in the 20–29 years group, while accuracy decreased among individuals aged 50 years or older. The AUC values in individuals aged 50–59 years and those aged ≥ 60 years were 0.805 and 0.737, respectively, indicating a gradual decline in predictive power. This decline may stem from the increasing physiological complexity and comorbidities associated with older age, suggesting that a single prediction model may not fully account for these factors. Consequently, caution is warranted when applying this model to adults ≥ 50 years, and additional or age-specific variables may be needed to improve accuracy in older populations. Age and gender significantly influence the predictive accuracy of HOMA-IR-based MetS models. Similar to the results of this study, other previous studies have reported that the optimal HOMA-IR cutoff value differed in women without Diabetes Mellitus by age group. In particular, the predictive power of HOMA-IR levels in women aged ≥ 50 years was affected by the decreased estrogen levels and increased visceral fat associated with menopause [19,20]. In addition, the results of this study are consistent with those of previous studies indicating that HOMA-IR might have limited utility in assessing the risk of MetS in women aged ≥70 years [21].
Such observations suggest that HOMA-IR values may vary with age and may be more useful for predicting cardiovascular and metabolic risks in certain age groups. Additionally, the optimal HOMA-IR cutoff values appear to vary across different populations, which may be due to the variations in metabolic characteristics by region and physiological factors between different populations. For example, the HOMA-IR cutoff value in the Spanish population was reduced to 2.05 when accounting for the MetS components. This differs from the cutoff values reported in studies conducted in the United States and Iran [20,22,23]. Such differences highlight the need to develop HOMA-IR-based MetS prediction models tailored to specific regions and population characteristics. Similar to the results of previous studies, our findings indicated that the MetS prediction criteria tailored to specific age groups and gender are needed. They further support the effectiveness of using differentiated HOMA-IR cutoff values based on population characteristics for the prediction of MetS [19,24]. These findings underscore the importance of a multivariate approach to improve the predictive accuracy of MetS by age and gender. These findings align with the results of a previous study [21], which suggested that the clinical utility of HOMA-IR levels can be improved by adopting the criteria linked to the individual components of MetS rather than setting population-based cutoff values. Although the HOMA-IR level is used as a valuable indicator for evaluating insulin resistance worldwide, the cutoff values should be adjusted based on race and metabolic factors. In addition, previous studies exploring effective methods for predicting MetS using simple indicators, such as HOMA-IR and BMI, have highlighted the importance of incorporating various indicators in predicting and managing the risk of MetS. These findings are consistent with the results of this study [25,26,27]. Such simple indicators can serve as essential tools for the early diagnosis and management of MetS. These findings support the utility of the prediction model used in this study, which demonstrates the cost-effective capabilities for predicting MetS. Notably, the use of low-cost indicators such as HOMA-IR enables efficient resource allocation in public health, providing essential basic data for developing tailored prevention programs and strategies for the early detection and management of MetS [28]. Previous studies have reported that incorporating additional variables, such as the neutrophil to high-density lipoprotein ratio (NHR), an inflammatory biomarker, in addition to HOMA-IR, could enhance the predictive accuracy of MetS. Integrating the NHR with conventional predictive variables, such as HOMA-IR levels, gender, age, and DM status used in this study, may significantly improve the predictive power. These findings align with the results of this study, underscoring the importance of adopting a multivariate approach for the early diagnosis of MetS [29,30,31]. In conclusion, a multidimensional approach that considers complex factors such as HOMA-IR levels, age, gender, and DM status is essential for predicting MetS. When predicting MetS in older adults, additional indicators or supplemental models that reflect age-related characteristics are required. This approach provides essential baseline data for improving predictive accuracy and developing tailored prevention and management strategies for MetS. The prediction model developed in this study showed potential as a cost-effective diagnostic tool that can contribute to the early diagnosis and management of MetS by incorporating various factors such as HOMA-IR levels, gender, age, and DM status. It provides baseline data necessary for establishing public health policies and developing customized prevention programs according to age and gender while also laying a foundation for personalized prevention and management strategies for MetS through the regular monitoring of biomarkers such as HOMA-IR levels.
However, this study has several limitations. Because it is cross-sectional in nature, we cannot draw definitive causal inferences about whether HOMA-IR directly contributes to MetS risk. Although our findings suggest that elevated HOMA-IR is associated with MetS, it may function primarily as an associated marker rather than a direct cause. Future cohort or longitudinal studies that track HOMA-IR changes over time are warranted to clarify whether insulin resistance drives MetS progression or merely correlates with it. Additionally, our dataset was limited to a Korean population, which may restrict the generalizability of these results to other ethnic or regional groups. Lastly, certain potential confounders (e.g., physical activity, dietary habits, medication use, and family history) were not consistently available in the 2019 KNHANES dataset and thus were not included in the regression model. Their omission could bias or partially confound the relationship between HOMA-IR and MetS risk; however, this does not invalidate our core approach, which focused on key metabolic and demographic predictors. Despite these limitations, the present study offers valuable baseline data and serves as a foundation for establishing more sophisticated MetS prediction models.

5. Conclusions

This study developed and validated a multiple logistic regression model using HOMA-IR, gender, age, and Diabetes Mellitus status to predict metabolic syndrome (MetS) in a Korean population. Our findings indicate that Diabetes Mellitus status exerts the strongest impact on MetS risk, followed by HOMA-IR, gender, and age. The model demonstrated good overall predictive accuracy (AUC = 0.819), although its performance declined among older adults (≥50 years), suggesting the need for age-specific refinements and caution when applying the model to this demographic. While the results suggest potential utility for earlier risk stratification and targeted interventions, further external validation in other cohorts is required before the model can be widely adopted, particularly given the cross-sectional design, which does not establish causality. Future research could also incorporate additional indicators (e.g., inflammatory markers, lifestyle factors) to enhance predictive power, especially in older populations, and longitudinal data would clarify whether insulin resistance actively drives MetS progression or simply correlates with it. Taken together, these findings provide valuable baseline data and lay a foundation for refining MetS prediction models in diverse populations.

Author Contributions

Conceptualization: A.-S.H.; methodology: A.-S.H.; data analysis and interpretation: A.-S.H.; writing—original draft preparation: A.-S.H.; writing—review and editing: J.-C.L.; supervision: J.-C.L.; project administration: A.-S.H. All authors have read and agreed to the published version of the manuscript.

Funding

This research received no external funding.

Institutional Review Board Statement

The KNHANES data were reviewed by the Institutional Review Board of the Korea Disease Control and Prevention Agency and approved by its Ethics Committee (2018-01-03-C-A).

Informed Consent Statement

Patient consent was not applicable for an observational study where we analyzed pre-existing data. Given the nature of the study, there was no direct interaction with patients, and informed consent was deemed not required.

Data Availability Statement

The data used in this study are not publicly available due to privacy and ethical restrictions.

Conflicts of Interest

The authors declare no conflict of interest.

References

  1. Kassi, E.; Pervanidou, P.; Kaltsas, G.; Chrousos, G. Metabolic syndrome: Definition and controversies. BMC Med. 2011, 9, 48. [Google Scholar] [CrossRef]
  2. Eckel, R.H.; Grundy, S.M.; Zimmet, P.Z. The metabolic syndrome. Lancet 2005, 365, 1415–1428. [Google Scholar] [CrossRef] [PubMed]
  3. Alberti, K.J.; Eckel, R.H.; Grundy, S.M.; Zimmet, P.Z.; Cleeman, L.J.; Donato, K.A.; Fruchart, J.C.; James, W.P.; Loria, C.M.; Smith, S.C., Jr. Harmonizing the metabolic syndrome: A joint interim statement of the International Diabetes Federation Task Force on Epidemiology and Prevention; National Heart, Lung and Blood Institute; American Heart Association; World Heart Federation; International Atherosclerosis Society; and International Association for the Study of Obesity. Circulation 2009, 120, 1640–1645. [Google Scholar] [PubMed]
  4. Grundy, S.M.; Cleeman, J.I.; Daniels, S.R.; Donato, K.A.; Eckel, R.H.; Franklin, B.A.; Gordon, D.J.; Krauss, R.M.; Savage, P.J.; Smith, S.C.; et al. Diagnosis and management of the metabolic syndrome: An American Heart Association/National Heart, Lung, and Blood Institute Scientific Statement. Circulation 2005, 112, 2735–2752. [Google Scholar] [CrossRef] [PubMed]
  5. Bray, G.A.; Bellanger, T. Epidemiology, trends and morbidities of obesity and the metabolic syndrome. Endocrine 2006, 29, 109–117. [Google Scholar] [CrossRef]
  6. Danaei, G.; Finucane, M.M.; Lu, Y.; Singh, G.M.; Cowan, M.J.; Paciorek, C.J.; Lin, J.K.; Farzadfar, F.; Khang, Y.-H.; Stevens, G.A.; et al. Global burden of metabolic risk factors of chronic diseases collaborating group (Blood Glucose). National, regional, and global trends in fasting plasma glucose and diabetes prevalence since 1980: Systematic analysis of health examination surveys and epidemiological studies with 370 country-years and 2.7 million participants. Lancet 2011, 378, 31–40. [Google Scholar]
  7. Finucane, M.M.; Stevens, G.A.; Cowan, M.J.; Danaei, G.; Lin, J.K.; Paciorek, C.J.; Singh, G.M.; Gutierrez, H.R.; Lu, Y.; Bahalin, A.N.; et al. Global burden of metabolic risk factors of chronic diseases collaborating group (body mass index). National, regional, and global trends in body-mass index since 1980: Systematic analysis of health examination surveys and epidemiological studies with 960 country-years and 9.1 million participants. Lancet 2011, 377, 557–567. [Google Scholar]
  8. Rader, D.J. Effect of insulin resistance, dyslipidemia, and intra-abdominal adiposity on the development of cardiovascular disease and diabetes mellitus. Am. J. Med. 2007, 120, S1–S8. [Google Scholar] [CrossRef]
  9. Goodwin, P.; Ennis, M.; Bahl, M. High insulin levels in newly diagnosed breast cancer patients reflect underlying insulin resistance and are associated with components of the insulin resistance syndrome. Breast Cancer Res. Treat. 2009, 114, 517–525. [Google Scholar] [CrossRef]
  10. Seriolo, B.; Ferrone, C.; Cutolo, M. Long-term anti-tumor necrosis factor α treatment in patients with refractory rheumatoid arthritis: Relationship between insulin resistance and disease activity. J. Rheumatol. 2008, 35, 355–357. [Google Scholar]
  11. Lann, D.; LeRoith, D. Insulin resistance as the underlying cause for the metabolic syndrome. Med. Clin. N. Am. 2007, 91, 1063–1077. [Google Scholar] [CrossRef] [PubMed]
  12. Antuna-Puente, B.; Disse, E.; Rabasa-Lhoret, R.; Laville, M.; Capeau, J.; Bastard, J.P. How can we measure insulin sensitivity/resistance? Diabetes Metab. 2011, 37, 179–188. [Google Scholar] [CrossRef]
  13. Pepe, M.S. The Statistical Evaluation of Medical Tests for Classification and Prediction; Oxford University Press: New York, NY, USA, 2003. [Google Scholar]
  14. Wilson, P.W.F.; D’Agostino, R.B.; Levy, D.; Belanger, A.M.; Silbershatz, H.; Kannel, W.B. Prediction of coronary heart disease using risk factor categories. Circulation 1998, 97, 1837–1847. [Google Scholar] [CrossRef] [PubMed]
  15. Lean, M.E.; Han, T.S.; Morrison, C.E. Waist circumference as a measure for indicating need for weight management. BMJ 1995, 311, 158–161. [Google Scholar] [CrossRef] [PubMed]
  16. Mirmiran, P.; Bahadoran, Z.; Vakili, A.Z.; Navab, M. The association of dietary patterns and the metabolic syndrome. Iran. J. Public Health 2009, 38, 1–2. [Google Scholar]
  17. Warburton, D.E.R.; Nicol, C.W.; Bredin, S.S.D. Health benefits of physical activity: The evidence. Can. Med. Assoc. J. 2006, 174, 801–809. [Google Scholar] [CrossRef]
  18. Matthews, D.R.; Hosker, J.P.; Rudenski, A.S.; Naylor, B.A.; Treacher, D.F.; Turner, R.C. Homeostasis model assessment: Insulin resistance and beta-cell function from fasting plasma glucose and insulin concentrations in man. Diabetologia 1985, 28, 412–419. [Google Scholar] [CrossRef]
  19. Gayoso-Diz, P.; Otero-González, A.; Rodriguez-Alvarez, M.X.; Gude, F.; Cadarso-Suarez, C.; García, F.; De Francisco, A. IR index (HOMA-IR) levels in a general adult population: Curves percentile by gender and age. The EPIRCE study. Diabetes Res. Clin. Pract. 2011, 94, 146–155. [Google Scholar] [CrossRef]
  20. Otero, A.; De Francisco, A.; Gayoso, P.; Garcia, F. Prevalence of chronic renal disease in Spain: Results of the EPIRCE Study. Nefrologia 2010, 30, 78–86. [Google Scholar]
  21. Gayoso-Diz, P.; Otero-González, A.; Rodriguez-Alvarez, M.X.; Gude, F.; García, F.; De Francisco, A.; González Quintela, A. Insulin resistance (HOMA-IR) cut-off values and the metabolic syndrome in a general adult population: Effect of gender and age: EPIRCE cross-sectional study. BMC Endocr. Disord. 2013, 13, 47. [Google Scholar] [CrossRef]
  22. Miccoli, R.; Biamchi, C.; Odoguardi, L. Prevalence of the metabolic syndrome among Italian adults according to ATPII definition. Nutr. Metab. Cardiovasc. Dis. 2005, 15, 250–254. [Google Scholar] [CrossRef] [PubMed]
  23. Ascaso, J.F.; Romero, P.; Real, J.T.; Priego, A.; Valdecabres, C.; Carmena, R. Insulin resistance quantification by fasting insulin plasma values and HOMA index in a non-diabetic population. Med. Clin. 2001, 117, 530–533. [Google Scholar] [CrossRef]
  24. Esteghamati, A.; Ashraf, H.; Khalilzadeh, O.; Zandieh, A.; Nakhjavani, M.; Rashidi, A.; Haghazali, M.; Asgari, F. Optimal cut-off of homeostasis model assessment of IR (HOMA-IR) for the diagnosis of metabolic syndrome: Third national surveillance of risk factors of non-communicable diseases in Iran (SuRFNCD-2007). Nutr. Metab. 2010, 7, 26. [Google Scholar] [CrossRef]
  25. Shiny, A.; Bibin, Y.S.; Shanthirani, C.S.; Regin, B.S.; Anjana, R.M.; Balasubramanyam, M.; Jebarani, S.; Mohan, V. Association of neutrophil-lymphocyte ratio with glucose intolerance: An indicator of systemic inflammation in patients with type 2 diabetes. Diabetes Technol. Ther. 2014, 16, 524–530. [Google Scholar] [CrossRef]
  26. Feng, Y.-M.; Zhao, D.; Zhang, N.; Yu, C.-G.; Zhang, Q.; Thijs, L.; Staessen, J.A. Insulin resistance in relation to lipids and inflammation in type-2 diabetic patients and non-diabetic people. PLoS ONE 2016, 11, e0153171. [Google Scholar] [CrossRef] [PubMed]
  27. Zhou, Y.; Wang, X.; Guo, S.; Li, R.; Li, Y.; Yu, Y.; Liu, T. Correlation between chronic low-grade inflammation and glucose and lipid metabolism indicators in polycystic ovary syndrome. Gynecol. Endocrinol. 2024, 40, 2302402. [Google Scholar] [CrossRef]
  28. Panagiotakos, D.; Chrysohoou, C.; Pitsavos, C.; Tsioufis, K. Prediction of 10-year cardiovascular disease risk, by diabetes status and lipoprotein-a levels; the HellenicSCORE II+. Hell. J. Cardiol. 2023, 79, 3–14. [Google Scholar] [CrossRef] [PubMed]
  29. Tune, J.D.; Goodwill, A.G.; Sassoon, D.J.; Mather, K.J. Cardiovascular consequences of metabolic syndrome. Transl. Res. 2017, 183, 57–70. [Google Scholar] [CrossRef]
  30. Welty, F.K.; Alfaddagh, A.; Elajami, T.K. Targeting inflammation in metabolic syndrome. Transl. Res. 2016, 167, 257–280. [Google Scholar] [CrossRef]
  31. Wilson, P.W.; Kannel, W.B.; Silbershatz, H.; D’Agostino, R.B. Clustering of metabolic factors and coronary heart disease. Arch. Intern. Med. 1999, 159, 1104–1109. [Google Scholar] [CrossRef]
Figure 1. Study population.
Applsci 15 02985 g001
Figure 2. Receiver operating characteristic curve of the regression model with covariates.
Applsci 15 02985 g002
Table 1. Comparison of selected variables between excluded and included participants.
VariableExcluded (n = 1976)Included (n = 6134)p
Men990 (50.1)3120 (50.8)0.45
Women986 (49.9)3014 (49.2)
Age (years)52.31 ± 16.7251.7 ± 16.930.45
Waist circumference (cm)83.52 ± 13.3484.08 ± 10.440.35
Table 2. Comparative anthropometric, clinical, and biochemical characteristics of patients with and without Diabetes Mellitus.
VariableDiabetes Mellitus (n = 624)Non-Diabetes Mellitus (n = 5672)p
Sex
Men316 (50.6)2479 (43.7)<0.001
Women308 (49.4)3193 (56.3)
Age (years)65.69 ± 10.9450.44 ± 16.83<0.001
Waist circumference (cm)90.63 ± 9.7583.35 ± 10.28<0.001
Triglycerides (mg/dL)154.48 ± 127.39129.28 ± 96.87<0.001
HDL-cholesterol (md/dL)48.05 ± 12.0053.27 ± 12.84<0.001
Systolic blood pressure (mmHg)127.68 ± 17.04119.06 ± 16.37<0.001
Diastolic blood pressure (mmHg)73.37 ± 9.7675.87 ± 9.79<0.001
Fasting blood glucose (md/dL)137.91 ± 41.5297.65 ± 16.46<0.001
HOMA-IR (units)3.85 ± 4.962.30 ± 3.41<0.001
Metabolic syndrome (ATP III)
Yes339 (57.4)1364 (24.8)<0.001
No252 (42.6)4139 (75.2)
Data are expressed as the mean ± standard deviation or n (%); HDL-cholesterol, high-density lipoprotein cholesterol; HOMA-IR, homeostasis model assessment of insulin resistance; ATP III, Adult Treatment Panel III.
Table 3. Multivariate logistic regression analysis of the factors associated with metabolic syndrome.
VariableBOdds Ratio (95%)
HOMA-IR0.4481.566 (1.504–1.630)
Sex0.3911.479 (1.303–1.678)
Age0.0331.033 (1.029–1.037)
Diabetes Mellitus0.6491.914 (1.572–2.330)
Intercept−4.067
Table 4. ROC regression model coefficients.
AgeModel *Cut-Off Value *SensitivitySpecificityAUC (95%CI)p
Overall
(n = 6134)
Combined0.2410.8000.6890.819 (0.807–0.829)<0.001
HOMA-IR only1.9350.7570.6450.761 (0.748–0.773)<0.001
20–29 years
(n = 742)
Combined0.1420.8390.8380.864 (0.853–0.935)<0.001
HOMA-IR only2.7450.8060.8030.860 (0.820–0.920)<0.001
30–39 years
(n = 912)
Combined0.1500.8670.7530.882 (0.857–0.906)<0.001
HOMA-IR only2.1900.7780.7310.827 (0.806–0.868)<0.001
40–49 years
(n = 1103)
Combined0.1910.8260.7730.882 (0.861–0.903)<0.001
HOMA-IR only2.2100.8060.7540.840 (0.814–0.866)<0.001
50–59 years
(n = 1160)
Combined0.2430.7260.7520.805 (0.778–0.831)<0.001
HOMA-IR only1.4350.8260.5360.786 (0.771–0.821)<0.001
≥60 years
(n = 2217)
Combined0.2820.7760.6000.737 (0.708–0.767)<0.001
HOMA-IR only2.0250.7030.6530.727 (0.705–0.748)<0.001
* Combined model incorporated HOMA-IR, sex, age, and Diabetes Mellitus (DM) status as covariates, while the “HOMA-IR only” model used HOMA-IR alone. ROC refers to the receiver operating characteristic, HOMA-IR denotes the homeostasis model assessment of insulin resistance, DM stands for Diabetes Mellitus, and AUC represents the area under the curve. The presented cut-off values represent the optimal predictive probability thresholds for MetS classification.
Disclaimer/Publisher’s Note: The statements, opinions and data contained in all publications are solely those of the individual author(s) and contributor(s) and not of MDPI and/or the editor(s). MDPI and/or the editor(s) disclaim responsibility for any injury to people or property resulting from any ideas, methods, instructions or products referred to in the content.

