Abstract
Proper management of vehicle structural factors related to public transportation safety is vital to formulate maintenance strategies and to enhance transportation safety. Therefore, this work aims to comprehensively identify potential structural factors, assess their impacts as regards causing public transportation vehicle malfunctions, and understand their cause–effect interrelationships. Maintenance management can be improved based on the analysis outcomes. Multi-Criteria Decision-Making (MCDM) techniques are widely applied to decision-making problems. However, due to the advanced and complex structures of modern vehicles, conventional single-used MCDM techniques encounter limitations in their ability to thoroughly account for all potential failure factors and to systematically manage the causal interrelationships, which makes the analysis results less practically applicable. To overcome these challenges, this article proposes an innovative MCDM framework. Specifically, Failure Tree Analysis (FTA) and the Interval-Valued Pythagorean Fuzzy Analytic Hierarchy Process (IVPF-AHP) are integrated to construct the logical relationships between the failure structural factors from real-world maintenance records. The factors are ranked and selected based on their severity influence and occurrence likelihood influence. Subsequently, the Interval-Valued Pythagorean Fuzzy Decision-Making Trial and Evaluation Laboratory (IVPF-DEMATEL) takes causal diagrams to identify interdependencies between the factors based on the mitigated ambiguity of human assessments. A case study in the public transportation bus domain is conducted to demonstrate the effectiveness of the proposed MCDM framework. The results offer insightful maintenance suggestions for public transportation operators and engineers to save human labor and material resources.
1. Introduction
Currently, many countries worldwide have proposed the long-term goal of reducing the number of serious injuries that occur on the road [1,2]. Reliable and efficient public transportation plays an irreplaceable role in the modern transportation system. According to a report published in 2023 by the Transport Department of Hong Kong, the extensive public transportation system handled an average daily volume of approximately 11,480,000 passenger trips, and this high volume of traffic was accompanied by 17,189 road traffic accidents [3]. From this perspective, it is of paramount importance for governments, transit operators, and citizens to ensure the safety of public transportation and to mitigate the negative consequences of road incidents. Human factors, vehicle factors, and environmental factors have been identified as three significant factors that contribute to public traffic safety [4,5]. Under such circumstances, regular safety inspections are essential for public transportation vehicles, such as transportation buses, transportation trains, and transportation metros, to maintain roadworthiness [6,7]. Modern vehicles have evolved into integrated complex systems. Any safety risk occurring in any system may cause the entire device to malfunction. In practice, regular inspection and maintenance in depots still rely heavily on the experience of engineers. Components within potentially faulty systems are inspected and replaced individually, resulting in unnecessary human labor and expenses. Therefore, enhancing the efficiency of maintenance management for public transportation vehicles has become a focus in both academic research and industrial applications.
Prognostic and health management (PHM) issues related to public transportation vehicles have been solved using model-based, data-driven, and hybrid approaches [8,9,10,11,12,13,14,15]. Some investigations assessed the health status by identifying failure factors using physical models or by extracting factors directly from sensor data using data-driven methods [8,9,10,11,12,13]. Several studies proposed maintenance planning methods to optimize human and material resources [14,15,16]. However, there are three primary limitations in the existing research. Firstly, the research above predominantly relied on experimental and simulation data, which may not accurately reflect real-world vehicle conditions and incidents. Secondly, the research was based on specific fault scenario datasets that may not encompass all types of faults. Third, the research either took the vehicle as a whole unit or focused on specific structure areas. Therefore, this work aims to exhaustively evaluate failure factors throughout the entire structure of transportation vehicles, accounting for all potential failure types encountered in real-world conditions.
Identifying and evaluating factors is a typical decision-making problem. Multi-Criteria Decision-Making (MCDM) technology is a commonly used decision-making method, which is suitable for this work. MCDM techniques have been widely applied across multiple disciplines. Particularly in the field of safety management within engineering fields, MCDM methods have been extensively adopted [17,18,19,20,21,22,23]. MCDM methods exhibit unique advantages as they can comprehensively evaluate and balance multiple criteria, including technical, economic, and social aspects. Additionally, MCDM methods integrate both quantitative and qualitative data to ensure the thoroughness of analyzation. Through the transparent and explainable decision-making process, MCDM methods enable decision-makers to manage critical risks more effectively and ultimately enhance the safety and robustness of systems. Nevertheless, only a handful of studies have utilized MCDM techniques to assess factors related to public transportation safety, and even fewer have focused on vehicle structure factors. Some studies have utilized MCDM techniques to analyze critical factors contributing to road crashes [24,25,26,27,28,29,30]. Porcu et al. [29] evaluated the crash risks associated with each route by combining safety factors, predictive models, and risk assessment techniques. Yuan et al. [30] investigated the traffic collision data to analyze factors about the occupant, vehicle, road, and environment. Chi-square tests assessed the potential influence of the factors. The binary logit regression model showed the relationships between the factors. Some studies have proposed safety performance indexes for intercity vehicles [9,15,16,17,18,19,24,27]. Du et al. [27] took the Analytic Hierarchy Process (AHP) method to weigh each operational index of monorail vehicles. The analysis results found the structure part with the greatest impact on the straddle-type monorail vehicle operation. Renu et al. [31] performed Failure Modes and Effects Analysis (FMEA) on flexible vehicle components. Vujanović et al. [14] integrated DEMATEL and Analytic Network Process (ANP) to evaluate fleet maintenance management influences. Dong et al. [28] conducted safety assessments for the transit rails. The proposed method combined AHP and a genetic algorithm to assess the indicator weights. Ganji et al. [26] utilized a hybrid approach combining DEMATEL and ANP to calculate the influential weights of vehicle-related criteria impacting motor vehicle accidents. However, the application of MCDM techniques to analyze vehicle structural factors for public transportation safety has not been extensively explored. The existing studies above failed to account for all potential structural factors that could impact normal operations. Moreover, existing research has not clearly explained a clear path for transforming research outcomes into actionable maintenance strategies. To improve the evaluation performance, this study will systematically investigate the structural factor analysis problem of public transport safety.
The major contribution of this article is to design a novel MCDM framework to assess vehicle structural factors for ensuring public transportation safety. The analyzed results help to enhance maintenance management. The more specific points are listed as follows:
- This study is the first to comprehensively identify and evaluate the structural factors contributing to vehicle malfunctions. A customized MCDM framework has been designed to explore all possible factors and rigorously analyze their interrelationships.
- Fault Tree Analysis (FTA) and the Interval-Valued Pythagorean Fuzzy Analytic Hierarchy Process (IVPF-AHP) evaluate the relative importance of structural factors as regards occurrence probability and severity. Additionally, the Interval-Valued Pythagorean Fuzzy Decision-Making Trial and Evaluation Laboratory (IVPF-DEMATEL) examines the cause–effect interrelationships between the crucial factors.
- This work conducts the practical case study for public transportation buses. The maintenance records reported at bus depots and expert judgements collected from professional staff are used as data sources. Based on the assessment results, this work provides actionable recommendations for maintenance management.
- The outputs of this work can further ensure roadworthiness, thereby ensuring more reliable public transportation services. The optimized maintenance strategies help to prevent minor issues from escalating into major failures and to avoid the spread of failures to other structure parts.
- The maintenance recommendations generated from this work can help to enhance operational efficiency and financial performance. Engineers can allocate manpower and material resources more effectively, concentrating efforts on addressing the most critical failure factors, thereby optimizing maintenance scheduling. Public transportation operators can reduce maintenance costs, achieve better inventory control, and minimize service disruptions.
This paper is organized as follows: Section 2 outlines the proposed framework for factor selection and relationship analysis. Section 3 details the case study by applying the proposed framework to the public transportation bus domain. Finally, Section 4 summarizes the implications and suggests potential research directions.
2. Methodology
2.1. Framework of Methodology
This section presents the framework for evaluating failure-causing factors of public transportation. The proposed research framework comprises two major stages. Stage I utilizes FTA and the IVPF-AHP method for ranking and selecting more crucial factors. Stage II utilizes the IVPF-DEMATEL method for evaluating and visualizing the cause–effect relationships between the selected factors. A scheme of this framework is shown in Figure 1.
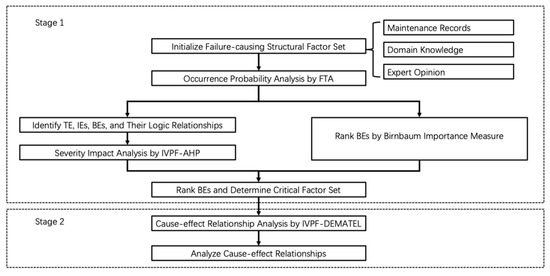
Figure 1.
The proposed framework.
The following subsections give detailed descriptions about IVPFS, FTA, IVPF-AHP, and IVPF-DEMATEL.
2.2. Uncertainty Reduction by Interval-Valued Pythagorean Fuzzy Set
Fuzzy system theory (FST) has undergone significant developments and diversification, becoming a cornerstone in computational intelligence and decision sciences [32]. The Fuzzy Set (FS) extends the classical set theory by allowing elements to have degrees of membership rather than binary inclusion or exclusion. Building on this foundational concept, Fuzzy Logic (FL) employs the principles of FST to develop a system of approximate reasoning. Unlike classical binary logic, which restricts truth values to zero or one, FL enables the handling of intermediate truth values, thus allowing for more flexible and human-like reasoning processes [33,34,35]. This capability is particularly advantageous in fields where precise mathematical models are infeasible or human reasoning needs to be simulated. Fuzzy Inference Systems (FISs), as implementations of fuzzy logic, provide a framework for decision-making through approximate reasoning and linguistic terms [36]. FISs can process both crisp and fuzzy inputs, generating fuzzy outputs through rule-based inference. A successful implementation of FISs heavily relies on well-designed fuzzy rules. FISs have demonstrated effectiveness in various applications, particularly where human judgment plays a crucial role [37]. In the field of enhancing traffic safety, FISs were proposed to assess collision risks and guide avoidance maneuvers for maritime autonomous surface ships (MASS) [38]. The near-collision decision-making mechanism using FISs could further improve local path planning [39]. However, FISs encounter significant limitations when dealing with massive and hierarchically structured variables. Specifically, the rule-based design of FISs becomes exponentially complex, leading to potential rule conflicts and inconsistencies. Moreover, while a FIS can evaluate factors based on individual characteristics, it struggles to effectively capture the relative importance relationships between the factors. Therefore, our work combines FST variants with the MCDM method to structure and solve complex decision-making problems involving extensive and hierarchically organized criteria. FST variants are widely used to overcome the inaccuracies that arise from the reliance on expert scoring in MCDM methods.
Over the past decades, FST variances have enhanced the capability to tackle various complex systems. The Intuitionistic Fuzzy Set (IFS) represents a significant extension [40]. IFS incorporates the membership degree and non-membership degree of elements, which can provide a more thorough description of uncertainty [40]. The Interval-Valued Fuzzy Set (IVFS) is another important extension [41]. The IVFS uses intervals instead of single values to represent the membership degree of elements [42]. Though IVFS improves uncertainty modeling by capturing data variability, computational complexity is introduced due to interval arithmetic. The Pythagorean Fuzzy Set (PFS) offers a more recent and innovative extension [43]. Unlike the IFS, where the sum of the membership and non-membership degrees must be lower than or equal to one, the PFS relaxes this constraint to the sum of the squares of these degrees. Moreover, the mathematical structure of the PFS allows for using Pythagorean theorem-based calculations, simplifying the aggregation and comparison of fuzzy values [43]. This structure is particularly beneficial in MCDM contexts. Building on the strengths of both the IVFS and PFS, the Interval-Valued Pythagorean Fuzzy Set (IVPFS) represents a further evolution by combining interval representation with the Pythagorean structure [44]. IVPFS further enhances the PFS framework by representing membership and non-membership degrees as intervals. The interval representation captures the range of and variability in uncertainty more explicitly, providing a more robust modeling approach [44]. The hybrid approach offers a more robust mechanism for modeling uncertainty than either IVFS or PFS alone. The relevant concepts of IVPFS are briefly introduced as follows:
Definition 1.
is defined as PFS as follows:
where function is a constant set and and represent the membership and non-membership degree of belonging to . and should satisfy the relationship as follows:
The indeterminacy degree of PFS relative to can be calculated as follows:
Definition 2.
is defined as an IVPFS in as follows:
where is called an Interval-Valued Pythagorean Fuzzy number, . and should satisfy the relationship as
The indeterminacy value of PFS relative to can be calculated as follows:
Definition 3.
Set up , , , and , with parameter ; then, the following operation holds:
Definition 4.
Set up , , , and . Set up two IVPFS and ; then, the following operation holds:
,
Definition 5.
Set up ; and are the hesitancy degree of the lower and upper points as follows:
Definition 6.
Set up ; the defuzzification of this number is calculated as follows
2.3. Occurrence Probability Analysis by Fault Tree Analysis
A Fault Tree (FT) displays the probable event sequence. FTA is widely used to identify the possible root causes, known as Basic Events (BEs), and the occurrence probability of an unexpected event, referred to as a Top Event (TE) [45]. A TE is at the top position of an FT and tailed by BEs. The BEs of an FT are statistically independent and connected by Boolean logic gates. FTA for failure analysis involves both qualitative and quantitative evaluation [46]. In qualitative assessment, FTA establishes and clarifies the theoretical relationships between the TE and BEs based on “AND” and “OR” logic. In quantitative assessment, BEs and their logical relationships are identified to find the logical expression of TE. The occurrence probability of TE can be quantitatively estimated based on the occurrence probability of each risk factor.
This work uses FTA to analyze the causal relationships of the identified factors and ranks these factors based on their likelihood of occurrence. The probability analysis in FTA offers distinct advantages as it calculates the occurrence probability of basic events based on real maintenance data, thereby accurately reflecting the actual frequency of different failure factors in operational conditions. The structured approach of FTA in establishing causal relationships and quantifying probabilities based on empirical data provides a level of analytical rigor and practical relevance that is another advantage. To calculate the contribution of each factor to the likelihood of public transportation defects, FTA enables the establishment of the logical relationships between the public transportation safety problem (TE), the critical systems (Immediate Events), and the failure-causing factors (BEs). In this work, the failure probability of BEs can be extracted from the collected maintenance records. The probability of a TE is estimated using Equations (14)–(16), which are derived based on the principles of Boolean algebra.
where is the probability of , and is a group of .
To assess the importance of each BE, their contributions to the likelihood of the TE occurring are determined. This information holds significant value for decision-makers (DMs) as it allows them to identify the vulnerable points within a system. By identifying these vulnerable points, DMs can effectively pinpoint the easily fault-prone factors that require more attention. To identify and prioritize the most critical BEs that lead to the TE, the Birnbaum Importance Measure (BIM) is employed. BIM is a crucial metric based on a FT used to evaluate the criticality of individual components or events within a system [47]. It quantifies the contribution of each BE to the TE occurrence. Formally, the BIM value of the specific BE is defined as follows:
where the BIM value of the basic event .
Once the BIM values of all BEs are evaluated, they can be ranked. A higher BIM value indicates a higher level of importance for the corresponding BE in relation to the occurrence of TE.
2.4. Severity Impact Analysis by Interval-Valued Pythagorean Fuzzy Analytic Hierarchy Process
AHP ascertains the weights of criteria and the priorities of alternatives via pairwise comparisons [48,49]. AHP integrates both rational and intuitive values. By decomposing complex decisions into a manageable hierarchy, AHP allows decision-makers to consider both quantitative data and qualitative insights. This hierarchical structure is particularly valuable when dealing with numerous structural factors distributed across multiple systems and subsystems, where coupling effects exist between factors. Nonetheless, the pairwise comparison process can introduce imprecision as it relies on expert judgments. In real-world scenarios, experts may struggle to score crisp values due to constraints in useful information or cognitive capacity [50]. To address this imprecision, this work uses IVPF-AHP to rank the identified failure-causing factors based on their fault severity impact. Integrating AHP and FST allows for more robust reflections of DMs’ judgments. The procedures of the IVPF-AHP method are shown below:
- Establishment of the hierarchical structure.
A typical structure of AHP hierarchy has the objective at the top position, followed by factors and alternatives at the bottom position. If it is necessary to divide too many factors into multistep, a sub-criterion can be made. The structure of AHP analysis for our work to study transportation safety is consistent with the FT structure. A BE is treated as a factor.
- 2.
- Construction of the Interval-Valued Pythagorean pairwise comparison matrix .
The DMs are invited to finish the questionnaire-form survey to set the relative importance weight of factors. The pairwise comparison matrix is constructed using the linguistic terms given in Table 1.

Table 1.
Linguistic scale for the evaluations [51].
- 3.
- The calculation of the difference matrix is as follows:
- 4.
- The calculation of the multiplicative matrix is as follows:
- 5.
- The calculation of the indeterminacy matrix matrix is as follows:
- 6.
- The calculation of the unnormalized weights is as follows:
- 7.
- The determination of the criterion weight for each factor is as follows:
2.5. Factor Ranking Using Results from Fault Tree Analysis and Interval-Valued Pythagorean Fuzzy Analytic Hierarchy Process
Applying FTA and IVPF-AHP generates two types of relative importance weights and weight rankings. An adjustment weight is introduced to ensure a balanced evaluation that considers both fault severity impact and occurrence probability impact. This adjustment weight serves to modify the relative importance of these two aspects, generating a revised ranking of factors. Based on the new ranking, the more important factors at the top of the ranking are selected for further analysis. The modified ranking is calculated as follows:
where represents the combination ranking value of factor , denotes the ranking of factor based on FTA, and denotes the ranking of factor based on IVPF-AHP. is defined as the adjustment weight. Subsequently, the failure-causing factors can be ranked again based on the calculated combination ranking values.
2.6. Cause–Effect Relationship Analysis by Interval-Valued Pythagorean Fuzzy Decision-Making Trial and Evaluation Laboratory
DEMATEL aims to analyze and resolve complex, interrelated problem groups [52,53]. Compared to traditional MCDM methods, DEMATEL provides two notable advantages. Unlike conventional techniques that assume independence among elements, DEMATEL identifies interdependencies within a system by using structural modeling and causal diagrams. Furthermore, while traditional methods may struggle with decision quality and complexity when confronted with numerous criteria, DEMATEL is particularly well suited to handle such situations, ensuring both decision quality and manageability. However, this people-oriented process is often unclear and uncertain. To mitigate the ambiguity of human assessments, this work adopts the IVPF-DEMATEL method to analyze the cause–effect relationships among the selected failure-causing factors. The following steps can represent the procedures involved in IVPF-DEMATEL:
- Build of the Interval-Valued Pythagorean initial direct relation matrix .
Experts compare the factors to generate an Interval-Valued Pythagorean initial direct relation matrix , where indicates the factor on factor impact. The transformation of Interval-Valued Pythagorean Fuzzy semantics is shown in Table 2.
Table 2.
Linguistic term and the corresponding Interval-Valued Pythagorean Fuzzy numbers [54].
- 2.
- Defuzzification of the Interval-Valued Pythagorean initial direct relation matrix for a crisp direct relation matrix is carried out according to Definition 6.
- 3.
- The normalization of the crisp direct relation matrix is as follows:where .
- 4.
- Computation of the total relation matrix is as follows:where is an identity matrix.
- 5.
- The influence degree, influenced degree, centrality degree, and cause degree are calculated.
According to the total relation matrix , the influence degree and influenced degree , which are the sum of rows and the sum of columns, are computed by applying Equations (28) and (29). The centrality degree is calculated as . The cause degree is calculated as .
named “centrality degree”, represents the degree of relative importance of each factor. The factor with a higher value is more important that with a lower value. named “cause degree”, represents the net effect that the factor contributes to the system in relation to other factors. In general, a factor belongs to the cause group if its value is positive. Conversely, the factor belongs to the effect group.
- 6.
- Generation of the influential diagram.
Based on the calculation results from the last step, the influential diagram categorizes all identified factors into four quadrants according to their centrality degree and cause degree, which can provide a clear visualization of their roles within the studied complex system.
3. Case Study: Structural Factor Analysis for Public Transportation Bus
This section presents the case study of analyzing the structural factors that cause the failure in the public transportation bus domain. A public transportation bus is an integrated complex structure that includes five major systems, i.e., powertrain system, chassis system, power system, electrical system, and body system [55]. Each major system contains numerous sub-systems and components. Any safety risk occurring in any system may cause the entire bus unit to malfunction. To ensure the analysis results are realistic and practical, this study utilizes maintenance records collected from depots and seeks consultation from professional staffs at the bus enterprise. These maintenance records and expert insights serves as valuable information sources, contributing to the credibility and relevance of the analysis.
Based on the combination of data exploration, domain knowledge, and expert confirmation, this study successfully extracts valuable information from the maintenance records and defines an initial set of failure-causing factors. Due to the initial factor set being relatively large and unsuitable for further calculation, FTA and IVPF-AHP are utilized to assess and rank the factors. The top thirty factors are considered the more critical ones. IVPF-DEMATEL constructs the causal diagram to represent the cause–effect relationships between the critical factors. The results of the analysis can contribute to a better understanding of the relationships between safety factors and provide suggestions for optimizing maintenance managements.
To ensure the efficiency of data processing and analysis, this study utilizes a MacBook equipped with a 2 GHz quad-core Intel Core i5 processor, 32 GB of unified memory, and a 1 TB SSD (Apple, Cupertino, CA, USA). All data-processing and analysis scripts are implemented in a Python 3.10.4 environment.
3.1. Data Description
This study utilizes maintenance records collected from bus depots and seeks consultation from professional staffs of the public transportation operator.
In practice, the public transportation operator has regular inspections and corrective maintenance to ensure the good conditions of vehicle operations. The maintenance database comprises aggregated repair information, with each maintenance activity documented in a structured format. The original record for each entry includes information columns. The most essential columns are occurrence date, replaced parts, and performed operations. Although the maintenance database is initially designed for other purposes, such as warranty analysis and tracking warehouse finances, it is also useful for data mining to find the most likely root failure causes. This study utilizes the maintenance data generated from January 2022 to March 2023. This study focuses specifically on the vehicle type with the most considerable quantity in operation. The raw data used for analysis consist of 1971 maintenance records. However, it is worth noting that the quality of the collected records limits their usability. One significant limitation is the absence of standardized documenting codes. Additionally, since much information is entered manually, there is a higher risk of human errors, such as typographical mistakes and missing values. These factors introduce potential inconsistencies and inaccuracies in the data. Therefore, the maintenance data source underwent several preprocessing steps to enhance its quality and usability.
In addition to utilizing maintenance data as a data source, DMs are invited for interview and consultation. The invited DM group consists of five domain experts with extensive experience in fleet operation and maintenance, including one head of the depot, two senior engineers, and two technical engineers. The detail information of the DMs is presented in Table 3. Due to their extensive working experience, these experts are considered to have sufficient expertise to contribute meaningfully to this research. To gather insights from the DMs, this study employs questionnaire-based surveys to gather their perceptions and conducts three brainstorming meetings to achieve consensus for factor selection, evaluation, and result reasonability. The survey was conducted during the period from January 2023 to May 2023.
Table 3.
Profiles of the invited DMs.
3.2. Preprocessing Work for Maintenance Records
To enhance the quality and usability of the maintenance data, a systematic preprocessing work was implemented. The preprocessing steps addressed key challenges associated with data inconsistencies, missing values, and non-standardized terminology. The preprocessing workflow ensured data integrity, consistency, and relevance.
The initial phase of preprocessing focused on text standardization and terminology normalization to address inconsistencies arising from manual data entry and colloquial language use. All text entries were converted to lowercase to eliminate case sensitivity issues, thereby ensuring uniformity across the dataset. Special characters and extraneous spaces were removed to further clean the text data. Additionally, common abbreviations and workshop jargon were standardized using a predefined glossary of vehicle-specific terminology. This step also involved correcting obvious spelling mistakes in component names and repair actions to enhance data accuracy.
The second phase addressed missing data, which is a common issue in manually documented maintenance records. Records were first screened to identify instances with missing critical information. Entries with excessive missing values were removed to maintain data integrity. For the remaining records, domain knowledge was leveraged to fill in missing values where possible. This approach ensured that incomplete records were supplemented with realistic and contextually appropriate data.
The third phase of preprocessing involved data categorization to enhance the structure and usability of the dataset. A standardized coding system was developed to classify maintenance activities, ensuring consistency across the dataset. Similar repair actions were grouped into standardized categories, simplifying analysis and comparison. Components were classified into hierarchical systems, reflecting their functional relationships within the vehicle structure. Unified failure mode descriptions were created to standardize the representation of faults.
The fourth phase of preprocessing focused on data integration to consolidate and enrich the dataset. Related maintenance records were merged to create comprehensive entries for each maintenance event, ensuring that all relevant information was captured in a single record. The integrated dataset was then cross-referenced with vehicle operational data to provide contextual information and enhance the dataset’s relevance for predictive analysis. Duplicate entries were identified and consolidated to eliminate redundancy, ensuring that each maintenance event was represented uniquely.
The final phase of preprocessing involved organizing the preprocessed data into a structured format suitable for analysis. Standardized fields were created to ensure consistency across the dataset, and proper data relationships were established to maintain integrity.
Through this comprehensive preprocessing framework, the maintenance dataset was transformed into a high-quality, structured resource suitable for advanced analysis. The establishment of a standardized terminology and structured relationships enables precise tracking of component failure histories and identification of failure correlations. The enhanced data quality and structured organization facilitate more accurate insights into maintenance patterns and component reliability, contributing to improved maintenance planning and decision-making processes.
3.3. Identification of Structural Factors for Public Transportation Bus
This study initially forms an indicator set by conducting data mining on the maintenance data collected. The repair descriptions recorded at the maintenance depots are comprehensively preprocessed and analyzed. The valuable information related to the maintenance activities is successfully extracted based on through data exploration and domain knowledge. Such information includes the vehicle systems involved, components, corresponding failure modes, and associated fault severity. This study categorizes the failure severity into four levels, as shown in Table S26.
Based on the analysis above, a total of 119 potential fault-causing indicators from five major vehicle systems were proposed. Subsequently, the questionnaire form regarding fault-causing indicators was prepared and presented to the DMs for confirmation. Upon several rounds of discussion sessions among experts, the less important indicators were eliminated and some of them were integrated. Ultimately, a set of 62 critical indicators were confirmed, as shown in Table S27.
3.4. Selection of Critical Structural Factors
While the size of the confirmed indicator set poses challenges for further analysis, it is crucial to acknowledge that the reliability of vehicle operations is influenced not only by the probability of failure occurrence but also by the severity of failure consequences. This study further employs the FTA method and the IVPF-AHP method to select more crucial indicators that encompass both the likelihood of faults occurring and fault severity impact.
3.4.1. Factor Selection Considering Occurrence Probability by Fault Tree Analysis
In order to assess the occurrence probability of each factor contributing to vehicle malfunctions, FTA enables the establishment of a theoretical relationship between vehicle safety problems (TE), critical systems (Immediate Events), and the failure-causing factors (BEs). The descriptions of Immediate Events (IEs) and BEs are provided in Table S27. Figure S1 shows the constructed fault tree diagram for analyzing failure-causing factors. The occurrence proportion of BEs is extracted from the maintenance data collected. Due to confidentiality constraints, the specific details of the maintenance records cannot be fully disclosed. Utilizing the BIM method presented in Section 2.3, the impact of each BE on the occurrence of the TE is assessed. Table S28 illustrates the identification and ranking of the BEs based on their criticality concerning TE occurrence.
3.4.2. Factor Selection Considering Severity Impact by Interval-Valued Pythagorean Fuzzy Analytic Hierarchy Process
Considering the impact of the fault severity, the factors identified in Section 3.2. are ranked by IVPF-AHP, as introduced in Section 2.4. The structure of the IVPF-AHP analysis for vehicle operation safety is consistent with the FTA structure. A BE is treated as the factor used for IVPF-AHP analysis. This study consults the DMs using a questionnaire-form survey to obtain the pairwise evaluation for factors. The DMs use the 10-point linguistic rating scale, as shown in Table 1, to compare and score the relative influence between the factor pairs. The linguistic data are obtained from each expert’s assessment. The maximum linguistic rating value of the corresponding criterion is selected to generate the final initial direct relation matrix. Finally, the initial direct relation matrix achieves consensus at the brainstorming meeting. The initial pairwise comparative matrices received from the expert team are given in the Supplementary Materials. The pairwise comparative matrices can be established as shown in Tables S1–S20 to assess each factor’s relative severity impact degree. The consistency examinations for pairwise comparison matrices received from experts are conducted. Since all the CR values are smaller than 0.1, it is evident that pairwise comparison matrices are logically consistent and trustworthy. The calculation results are summarized in Table S21.
3.4.3. Factor Selection Considering Both Occurrence Probability and Severity Impact
To adjust the ranking of factors taking both fault severity and fault occurrence probability into consideration simultaneously, the combination ranking values of factors are calculated as in Equation (25). After consulting the expert team, the adjustment weight is set as 0.3. The modified ranking results are presented in Table S29. This paper selects the more critical ones to reduce the dimension of the factor set and simply uses the DEMATEL analysis complexity. The top 30 out of 62 factors are selected for further evaluation in DEMATEL, and the list of these critical factors is presented in Table 4. The critical factors selected are confirmed by experts in meetings, and the selection results are consistent with the domain knowledge.
Table 4.
Selected critical factors.
3.4.4. Cause–Effect Relationship Analysis by Interval-Valued Pythagorean Fuzzy Decision-Making Trial and Evaluation Laboratory
The expert team is invited to score the relative importance of 30 critical factors using a questionnaire-form survey. Experts use the five-point linguistic rating scale, as shown in Table 2, to pair-wisely compare and score the relative importance between the factors. The maximum linguistic rating value of the corresponding factor is selected, and the linguistic term matrix is then obtained, as shown in Table S22. The linguistic term matrix achieves consensus on meetings. Based on the linguistic term matrix, the Interval-Valued Pythagorean initial direct relation matrix is obtained by transforming into Interval Pythagorean Fuzzy Sets based on semantics. After defuzzification based on Equation (13), the crisp direct relation matrix is obtained as shown in Table S23. The normalized direct relation matrix is performed by using Equation (26). The normalized direct relation matrix is shown in Table S24. From the normalized direct relation matrix , the total relation matrix is then obtained according to Equation (27), as shown in Table S25. Based on the total relation matrix , the influenced degrees and influence degrees are calculated according to Equations (28) and (29), the cause degrees and centrality degrees are also calculated. The calculation results of influence degrees, influenced degrees, cause degrees, and centrality degrees for the critical factors are summarized in Table 5. Based on the data in Table 5, an influential diagram can be drawn, as shown in Figure 2, which allows for a more intuitive view of the distribution of the factors.
Table 5.
DEMATEL calculation results for selected critical factors.
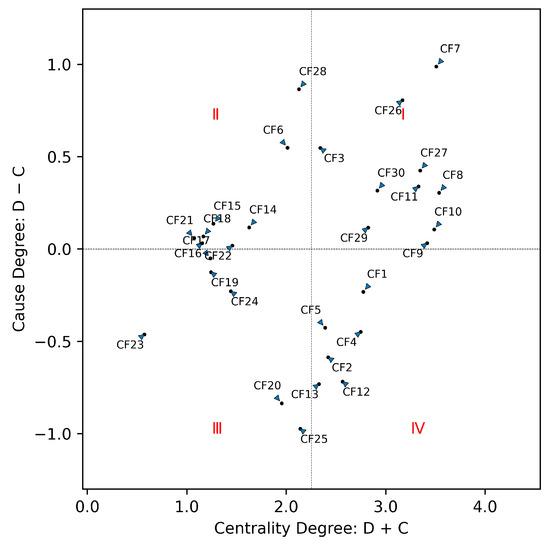
Figure 2.
Influence diagram generated after IVPF-DEMATEL calculation.
3.5. Result Analysis
From Table 5 and Figure 2, the failure-causing factors are classified into two groups according to the positive and negative values of (D − R). If (D − R) is positive, then the factors belong to cause group, and if the value of (D − R) is negative, then the factors belong to effective group. Here, the cause group includes the factors {CF3, CF6, CF7, CF8, CF9, CF10, CF11, CF14, CF15, CF16, CF18, CF21, CF22, CF26, CF27, CF28, CF29, CF30} and the effective group includes the factors {CF1, CF2, CF4, CF5, CF12, CF13, CF17, CF19, CF20, CF23, CF24, CF25}. The following two sub-sections provide an analysis on the cause group and the effect group in detail.
3.5.1. Cause Group Analysis
The factors of the cause group have net impacts on the overall vehicle in a possible accident event. Therefore, such factors should be paid more attention by engineers in maintenance management. In our numerical study, out of the 20 critical factors, 18 factors are identified as belonging to the cause group. The components involved in those factors are the transmission cable (CF3), lubricating oil (CF6), ignition switch sensor (CF7), engine speed sensor (CF8), diesel injector (CF9), engine cylinder (CF10), turbocharger (CF11), EBS sensor wire (CF14), EBS valve (CF15), brake system air hose (CF16), air brake dryer (CF18), balance lever (CF21), shock absorber (CF22), battery (CF26), alternator (CF27), alternator belt components (CF28), electrical appliance central control system (CF29), and starter motor (CF30).
In the cause group, the ignition switch sensor (CF7) of the vehicle has the highest value of (D − R), which means that the ignition switch sensor (CF7) has more of an impact on the whole system failure. In addition, Table 5 indicates that the ignition switch sensor (CF7) holds the second rank position based on the (D + R) value, which suggests that the ignition switch sensor (CF7) is a significant factor in vehicle failures. An ignition switch sensor is a vital component, responsible for detecting the position of the ignition switch and communicating this information to the electronic control units. This sensor plays an important role in ignition by ensuring that the engine starts only when the correct key or signal is detected. It ensures that the engine starts reliably and all necessary systems are powered up in the correct sequence, which is critical for maintenance activity schedules and operation safety. Common failure types of ignition switch sensors include intermittent starting issues, failure to start, and erratic engine behavior. Such malfunctions can lead to significant operational issues, such as service delays, increased maintenance costs, and compromised passenger safety. Additionally, a faulty ignition switch sensor can trigger unforeseen expansion events, such as engine problems or power distribution problems. This propagation mechanism typically begins with deteriorating sensor performance, which leads to inconsistent signal transmission to the Engine Control Unit (ECU). Compromised ECU functionality subsequently affects various engine management parameters, including fuel injection timing, ignition timing, and air–fuel mixture ratios. These disruptions can manifest in multiple ways, such as irregular engine performance, increased fuel consumption, and potential damage to catalytic converters. Furthermore, the interdependencies between electrical and mechanical systems amplify the impact of maintenance-related failures. when the ignition switch sensor exhibits intermittent failures due to delayed maintenance, which can generate voltage fluctuations throughout the vehicle’s electrical network. These electrical disturbances can affect multiple electronic control modules, potentially compromising the functionality of safety-critical systems such as anti-lock braking systems (ABS), electronic stability control (ESC), and transmission control units. The cumulative effect of these cascading failures not only increases the complexity of diagnostic procedures but also significantly elevates repair costs and vehicle downtime. For similar reasons, the battery (CF26), alternator (CF27), turbocharger (CF11), and starter motor (CF30) can be regarded as vital factors, resulting in public transportation failure events, and should be prioritized in maintenance management. The dual-ranking underscores the need for targeted maintenance strategies and resource allocation to these high-risk and high-impact factors. In maintenance management decision-making, priority should be given to conducting frequent inspections and preventive maintenance for components involved in such critical factors, as well as allocating human and material resources accordingly.
The alternator belt components (CF28) rank the second cause degree and the eighteenth centrality degree. The high cause degree indicates that the alternator belt components substantially influence other factors within the vehicle system. The alternator belt connects the alternator to the engine, enabling the alternator to generate electrical power while the engine runs. This power is crucial for charging the battery and powering essential electrical systems. If the alternator belt fails, it can cause rapid battery depletion, malfunctions of essential systems, and potential engine overheating. The lower centrality degree indicates that though alternator belt components frequently fail, they do not play a central role within the overall interaction network. The impact of CF28 is primarily localized and does not lead to widespread vehicle system disruptions. CF28 primarily serves as a critical trigger factor and its impact is significant but relatively isolated. For similar reasons, lubricating oil (CF6), transmission cable (CF3), EBS valve (CF15), and EBS sensor wire (CF14) are ranked high in cause degree but low in centrality degree and deserve more attention during maintenance management. Although these factors do not cause widespread system disruptions, their potential risks should not be overlooked. In maintenance decision-making, the high-cause and low-centrality factors require regular inspections and preventive maintenance to address their propensity for failure.
The engine speed sensor (CF8) has a positive but relatively low cause degree compared to the factors mentioned above in the cause group. Despite this, its importance degree is the highest among all the factors. This indicates that while the engine speed sensor (CF8) is not a primary driver of faults, it plays a critical role in the system’s overall structure. The high (D + R) value reflects its extensive interactions with other components. Such factors may not directly cause failures but their occurrence can have widespread impacts on the systems. The engine speed sensor is a crucial component that monitors the rotational speed of the crankshaft. This sensor provides information to the engine control unit (ECU), which uses the data to manage fuel injection, ignition timing, and other engine functions. In addition, for similar reasons, the electrical appliance central control system (CF29), engine cylinder (CF10), and diesel injector (CF9) are ranked low in cause degree but high in centrality degree. The impact of such factors primarily lies in its potential to propagate failures through the system due to its high dependency on other components. Although these factors are not the primary causes of failures, they occupy a central position in the vehicle system and still require attention in maintenance management. Therefore, low-cause and high-centrality factors still require attention in maintenance management.
The shock absorber (CF22) is a critical component of the suspension system. The shock absorber is designed to absorb and dampen the vibrations caused by uneven road surfaces. As Table 5 shows, the shock absorber (CF22) has the lowest value of (D − R) among the cause group factors, which indicates that it is a net receiver. Additionally, the value of (D + R) for the shock absorber (CF22) is also relatively low, which suggests that it has a limited overall impact. The combination of low (D − R) and low (D + R) values implies that the shock absorber (CF22) neither significantly influences other components nor holds a central position in the system’s interactions. In addition, for similar reasons, air brake dryers (CF18), balance levers (CF21), and brake system air hoses (CF16) are ranked low in cause degree but high in centrality degree. Therefore, from the maintenance perspective, such components may not require the same monitoring level as components with higher (D + R) or (D − R) values. However, it is still important to conduct proper maintenance activities to avoid localized issues, which can affect the service quality.
3.5.2. Effect Group Analysis
In general, the failure-causing factors within the effect group are primarily receivers of influence, meaning their states are significantly affected by changes or failures in other components. By identifying these effect group factors, this study can comprehensively understand the fault propagation network. Out of the 30 failure-causing factors, 12 factors belong to the effect group. The components involved are the transmission computer (CF1), transmission (CF2), transmission speed sensor (CF4), water tank fan pump motor (CF5), high-pressure fuel pump (CF12), ABS/ASR sensor circuit (CF13), air brake cylinder (CF17), handbrake/rear transmission safety cable (CF19), parking handbrake pump (CF20), suspension airbags (CF23), power steering fluid inlet hard hose (CF24), and power steering pump (CF25).
The transmission computer (CF1) is central within the effect group because of the relatively highest centrality degree. The transmission computer (CF1) also plays a dual role that is both influenced by and influences other components. The negative cause degree of −0.2315 that underscores the transmission computer (CF1) is predominantly an effect rather than a cause, suggesting that transmission computer failures are often the result of upstream issues within the vehicle system. Meanwhile, the high influenced degree of 1.5033 further supports that the transmission computer (CF1) is notably susceptible to upstream failures. These characteristics of vulnerability, centrality, and dual influence necessitate the prioritization of CF1 in maintenance management. For the same reason, the transmission speed sensor (CF4), high-pressure fuel pump (CF12), transmission (CF2), and water tank fan pump motor (CF5) are ranked higher in centrality degree within the effect group, which require prioritization maintenance management decision-making.
The ABS/ASR sensor circuit (CF13), parking handbrake pump (CF20), and power steering pump (CF25) typically exhibit relatively a higher centrality degree and a relatively lower cause degree within the effect group. This suggests that these three factors have a low impact on the overall vehicle system but are susceptible to influences from other factors. Therefore, the ABS/ASR sensor circuit (CF13), parking handbrake pump (CF20), and power steering pump (CF25) are unlikely to be significant failure-causing factors for the public transportation, indicating that maintenance resources should not be focused on them. Similarly, the air brake cylinder (CF17), handbrake/rear transmission safety cable (CF19), power steering fluid inlet hard hose (CF24), and suspension airbags (CF23) exhibit relatively lower (D − R) values and the lowest centrality degree values. This indicates that the air brake cylinder (CF17), handbrake/rear transmission safety cable (CF19), power steering fluid inlet hard hose (CF24), and suspension airbags (CF23) do not have a significant impact on the entire system. Consequently, maintenance resources should not be concentrated on these components either.
3.6. Discussion
3.6.1. Summary of Analysis Findings
Identifying and evaluating the structural factors contributing to the failures of public transportation will lead to successful maintenance management. This study reveals that out of 30 critical factors, the transmission cable (CF3), lubricating oil (CF6), engine speed sensor (CF8), diesel injector (CF9), engine cylinder (CF10), EBS sensor wire (CF14), EBS valve (CF15), alternator belt components (CF28), electrical appliance central control system (CF29), transmission computer (CF1), transmission (CF2), transmission speed sensor (CF4), water tank fan pump motor (CF5), and high-pressure fuel pump (CF12) are more important than others. Among the 14 important factors above, the ones belonging to the cause group {CF3, CF6, CF8, CF9, CF10, CF14, CF15, CF28, CF29} are key factors for intervention as improving these factors can lead to significant overall benefits. Meanwhile, the ones belonging to the effect group {CF1, CF2, CF4, CF5, CF12} also require attention as they significantly impact the whole system, and ensuring their reliability is crucial for maintaining overall system performance.
Factors with a high cause degree and high centrality degree, i.e., ignition switch sensor (CF7), turbocharger (CF11), battery (CF26), alternator (CF27), and starter motor (CF30), are crucial as they significantly influence other factors and occupy a central position within the fault network. The high cause degree suggests that this factor is prone to faults, while the high centrality degree means its malfunction can lead to potentially severe operational disruptions. Such factors should be prioritized for both maintenance schedule and maintenance resources. To optimize current maintenance processes for high-cause and high-centrality factors, engineers should increase inspection frequency and implement strict test procedures to ensure these critical components are always in optimal condition. The current regular inspections conducted at bus depots involve engineers checking each bus component one by one, which consumes a lot of time, money, and manpower. Therefore, optimized regular inspections can start by focusing on factors with high cause and high centrality. Preventive maintenance must be a key focus, with proactive measures such as scheduled replacements, upgrades, and the use of high-quality materials to enhance durability and performance. Maintenance resources should also be prioritized for these high-cause and high-centrality factors. For human resources, experienced technicians should be assigned to inspections and maintenance, and they should receive regular training to stay updated on the latest maintenance techniques. For material resources, it is essential to ensure an adequate inventory of spare parts to minimize downtime and avoid cascading failures. Additionally, real-time monitoring systems can be developed and integrated into practical maintenance procedures to continuously track the condition of these critical components. By integrating these comprehensive maintenance strategies, organizations can significantly reduce the transport bus risks associated with high-cause and high-centrality factors, thereby ensuring the safety of the bus system and optimizing maintenance efficiency.
Factors with a high cause degree but low centrality degree, i.e., transmission cable (CF3), lubricating oil (CF6), EBS sensor wire (CF14), EBS valve (CF15), and alternator belt components (CF28), act as critical triggers for failure events but have a more isolated impact. In maintenance decision-making, the high-cause and low-centrality factors require regular inspections and preventive maintenance to address their propensity for failure. Additionally, maintenance resources should be efficiently allocated to minimize the downtime and repair costs. However, given their limited impact on the whole bus system, the related components may not necessitate the extensive redundancy monitoring compared with the more central components.
Factors with a low cause degree but a high centrality degree, i.e., engine speed sensor (CF8), diesel injector (CF9), engine cylinder (CF10), and electrical appliance central control system (CF29), while not primary drivers of failures are essential due to their crucial position within the system. In maintenance management decision-making, it is essential to prioritize these high-centrality, low-cause degree factors. Although the components involved do not often fail, their critical position within the system means that any failure can result in widespread disruptions. Therefore, it is essential to conduct regular and thorough inspections of these factors to ensure their proper functioning. Regular inspections can be conducted at a moderate frequency. Additionally, implementing preventive maintenance strategies can detect any early signs of potential failure and address issues before they cause widespread system disruptions. Regarding maintenance resource allocation, experienced technicians should be prioritized for the maintenance activities of components involved in these critical factors. An adequate inventory of spare parts is crucial to ensure swift replacements.
Lastly, factors with both a low cause degree and a low centrality degree, i.e., brake system air hose (CF16), air brake dryer (CF18), balance lever (CF21), and shock absorber (CF22), have a minimal impact on the overall system. Such factors may not require as rigorous or frequent maintenance as those with higher cause or centrality degrees. However, such factors should not be entirely neglected as their failure can still lead to localized issues affecting specific functions of the bus. In maintenance management decision-making, basic-level maintenance activities can be implemented for such involved components to ensure their proper functioning. Regular inspections can be conducted at a lower frequency. Corrective maintenance in which repairs are performed after a failure occurs can be adopted. For resource allocation, fewer technicians can be assigned to perform inspections and maintenance. Additionally, an adequate but not excessive inventory of spare parts is sufficient to handle potential failures.
For factors requiring attention within an effect group, their influence can be explained by their high effect degree, i.e., transmission computer (CF1), transmission (CF2), transmission speed sensor (CF4), water tank fan pump motor (CF5), and high-pressure fuel pump (CF12). While they may not be primary drivers of failures, their malfunction can lead to significant system-wide disruptions. In maintenance management decision-making, such factors should be closely monitored to detect early signs of issues. Rapid-response protocols should be established to swiftly address emerging problems, minimizing downtime and service interruptions. Conversely, factors within the effect group that do not generally require significant attention, i.e., ABS/ASR sensor circuit (CF13), air brake cylinder (CF17), handbrake/rear transmission safety cable (CF19), parking handbrake pump (CF20), suspension airbags (CF23), power steering fluid inlet hard hose (CF24), and power steering pump (CF25), have a lower impact on the overall system. The influence of these factors is limited to less critical areas. These factors can be handled with corrective maintenance and basic maintenance schedules. Resources do not need to be heavily allocated to these factors.
By analyzing the importance and interrelationships of critical structural factors, practical maintenance management can achieve significant improvements in both the public transportation safety and maintenance efficiency. By prioritizing maintenance tasks about the factors with the higher impacts on vehicle failures, the escalation of minor issues into significant problems can be effectively mitigated, which can enhance overall public transportation safety and ensure citizens’ well-being and travel experience. Simultaneously, this analysis supports resource allocation decision-making, which allows engineers to optimize the utilization of manpower and budget and minimize unnecessary maintenance activities. Therefore, a public transportation operator can improve operational efficiency and financial performance.
Very limited publications using MCDM methods to comprehensively evaluate the interrelationships between failure-causing factors specific to bus safety have been conducted. Though these studies did not systematically analyze the structural failure-causing factors across the entire bus structure, their conclusions could assist to verify the feasibility of the proposed evaluation framework. Ganji et al. [26] utilized a hybrid approach combining DEMATEL and ANP to determine the influential weights of vehicle-related criteria. The criteria dimension involved is only six. Their findings indicated that the brake system is the most critical factor impacting motor vehicle accidents, followed by the fuel supply system. These conclusions align with our findings, which highlight that several factors related to the brake system and fuel supply system should be prioritized in maintenance management. Additionally, there is no work that provides feasible recommendations for practical maintenance management. The analysis results and actionable insights of our work have been validated through consensus among decision-makers (DMs).
3.6.2. Managerial Insights
Analyzing failure-causing factors has multifaceted practical contributions which benefit various stakeholders, including bus company owners, engineers, and citizens.
From the perspective of bus company owners, the insights gained from this analysis can significantly improve operational efficiency and financial performance. The insights derived from the analysis and the recommendations of this work can be seamlessly integrated and optimize the real-world maintenance processes in the bus depots. By prioritizing maintenance efforts on the most significant failure-causing factors, companies can reduce the frequency of breakdowns and extend the lifespan of their fleets. Such a maintenance approach can lower overall maintenance costs and minimize service disruptions. Moreover, the ability to better manage resources and inventory based on empirical evidence helps bus companies optimize their budgets and improve cost effectiveness. One of the significant advantages of the proposed maintenance optimization is that it does not incur extra costs or require additional resources. This work does not require the installation of sensors, data collectors, or other IoT devices which make better use of collected maintenance records and expert judgments.
Engineers, who are responsible for the implementation of maintenance at bus depots, can allocate maintenance resources more effectively. Focusing on the most significant factors allows maintenance efforts to be prioritized efficiently. Understanding the interrelationships between failure-causing factors enables the development of optimized maintenance plans to prevent minor issues from escalating into major problems. Therefore, the insights from this analysis support resource allocation, maintenance schedule optimization, and inventory management. Additionally, the strategic approach proposed can lead to continuous improvements in maintenance practices with the updated empirical evidence, which results in a more resilient public transport system capable of maintaining high service quality even under challenging conditions. Furthermore, the outcomes of this work can also facilitate the training of new employees as clear guidelines.
The practical benefits are substantial for citizens, who are the ultimate users of public transport. A more reliable and safe bus service means fewer delays and a more pleasant commuting experience. A well-maintained bus fleet ensures that passengers can travel safely and comfortably. Additionally, improved public transport reliability encourages more people to use buses, reducing traffic congestion and environmental pollution. Enhanced public transport bus services contribute to social equity by providing all citizens with dependable and affordable mobility options.
4. Conclusions
This study proposed a novel MCDM framework to investigate the structural failure-causing factors of public transportation vehicles. The comprehensive structural factors and possible fault scenarios were identified from practical maintenance records. Based on the logical relationships constructed by FTA, the structural factors were evaluated and ranked by FTA and the IVPF-AHP, which considered both severity influence and occurrence likelihood influence. Furthermore, the causal diagram outputs of IVPF-DEMATEL illustrated the cause–effect interdependencies. Incorporating IVPF into AHP and DEMATEL effectively mitigated ambiguities inherent in human assessments, enhancing the reliability of the analysis. The practical applicability and efficiency of the proposed framework were validated through a case study involving a public transportation bus operator. The findings provided actionable strategies for maintenance management by categorizing failure-causing factors into scenarios based on causality and centrality. The high-causality and high-centrality factors require the most rigorous inspection and preventive maintenance with dedicated technical staff. The high-causality but low-centrality factors need regular maintenance with reduced monitoring intensity. The low-causality but high-centrality factors demand moderate maintenance. The low-causality and low-centrality factors require basic maintenance and minimal resources. The high-impact effect factors require close monitoring and rapid response systems. These insights provide valuable guidance for public transportation operators, enabling the optimization of maintenance strategies, efficient resource allocation, and enhanced operational safety and reliability.
This work provides practical benefits by increasing cost efficiency for public transportation operators, empowering maintenance procedures for engineers, and enhancing the public transportation experience for citizens. Future research can build upon this work by incorporating updated maintenance records to refine the identification of structural failure factors. Moreover, the proposed methodology can be extended to consider the impact of maintenance expenses associated with each failure-causing factor, further enhancing its applicability and precision in decision-making.
Supplementary Materials
The following supporting information can be downloaded at: https://www.mdpi.com/article/10.3390/app15063045/s1. Supplementary material includes the tables and the figure used in the manuscript. These tables and figure, providing detailed calculation processes, have already been cited in the manuscript. These tables and figure are essential for the completeness of the manuscript. Tables S1–S21 display the IVPF-AHP calculation. Tables S22–S25 display the IVPF-DEMATEL calculation. Tables S26–S29 display the factor selection processes. Figure S1 displays the fault tree diagram constructed to analyze the failure-causing factors.
Author Contributions
Z.-F.H.: Writing—Original Draft, Writing—Review and Editing, Conceptualization, Methodology, Formal Analysis, Software, Visualization. K.-M.L.: Supervision, Writing—Review and Editing, Conceptualization, Methodology. K.-L.K.: Writing—Review and Editing, Conceptualization, Methodology. J.-Y.H.: Writing—Review and Editing. All authors have read and agreed to the published version of the manuscript.
Funding
This work is supported by the Department of Industrial and Systems Engineering, The Hong Kong Polytechnic University, Hong Kong (RHW0). This article is supported by the Centre for Advances in Reliability and Safety Limited (CAiRS) and Innovation and Technology Commission, The Government of the Hong Kong SAR, under an AIR@InnoHK Project by Innovation and Technology Commission (ITC) Project (Project No. P3.2).
Institutional Review Board Statement
Ethical review and approval are not applicable to this article. This study does not involve humans or animals.
Informed Consent Statement
Informed consent is not applicable to this article. This study does not involve humans.
Data Availability Statement
Restrictions apply to the availability of these data. The raw data was obtained from a third party company. Due to confidentiality limitations, the data cannot be shared. The authors do not have permission to share data.
Acknowledgments
We also extend our gratitude to the Research Committee and the Department of Industrial and Systems Engineering, The Hong Kong Polytechnic University, Hong Kong, and Centre for Advances in Reliability and Safety (CAiRS), Hong Kong SAR, China admitted under the AIR@InnoHK Research Cluster.
Conflicts of Interest
Authors Zhe-Fan Hou, Ka-Man Lee and Jing-Yuan Huang were employed by the company Centre for Advances in Reliability and Safety Limited (CAiRS). The remaining authors declare that the research was conducted in the absence of any commercial or financial relationships that could be construed as a potential conflict of interest.
Abbreviations
The following abbreviations are used in this manuscript:
| AHP | Analytic Hierarchy Process |
| ANP | Analytic Network Process |
| BEs | Basic Events |
| BIM | Birnbaum Importance Measure |
| DEMATEL | Decision-Making Trial and Evaluation Laboratory |
| DMs | Decision-Makers |
| FMEA | Failure Modes and Effects Analysis |
| FST | Fuzzy Set Theory |
| FT | Fault Tree |
| FTA | Failure Tree Analysis |
| IFS | Intuitionistic Fuzzy Set |
| IVFS | Interval-Valued Fuzzy Set |
| IVPF-AHP | Interval-Valued Pythagorean Fuzzy Analytic Hierarchy Process |
| IVPF-DEMATEL | Interval-Valued Pythagorean Fuzzy Decision-Making Trial and Evaluation Laboratory |
| IVPFS | Interval-Valued Pythagorean Fuzzy Set |
| MCDM | Multi-Criteria Decision-Making |
| PFS | Pythagorean Fuzzy Set |
| PHM | Prognostic and Health Management |
| TE | Top Event |
References
- Hyder, A.A.; Hoe, C.; Hijar, M.; Peden, M. The political and social contexts of global road safety: Challenges for the next decade. Lancet 2022, 400, 127–136. [Google Scholar] [CrossRef] [PubMed]
- Lie, A.; Tingvall, C.; Michael, J.P.; Fell, J.C.; Dinh-Zarr, T.B. Vision Zero and impaired driving: Near and longer-term opportunities for preventing death and injuries. Accid. Anal. Prev. 2024, 194, 107344. [Google Scholar] [CrossRef] [PubMed]
- Monthly Traffic and Transport Digest. 2024. Available online: https://www.td.gov.hk/en/transport_in_hong_kong/transport_figures/monthly_traffic_and_transport_digest/2023/index.html (accessed on 7 April 2024).
- Se, C.; Champahom, T.; Jomnonkwao, S.; Chonsalasin, D.; Ratanavaraha, V. Modeling of single-vehicle and multi-vehicle truck-involved crashes injury severities: A comparative and temporal analysis in a developing country. Accid. Anal. Prev. 2024, 197, 107452. [Google Scholar] [CrossRef]
- Elvik, R. Risk factors as causes of accidents: Criterion of causality, logical structure of relationship to accidents and completeness of explanations. Accid. Anal. Prev. 2024, 197, 107469. [Google Scholar] [CrossRef]
- Assemi, B.; Hickman, M. Relationship between heavy vehicle periodic inspections, crash contributing factors and crash severity. Transp. Res. Part A Policy Pract. 2018, 113, 441–459. [Google Scholar] [CrossRef]
- White, P.; Dennis, N.; Tyler, N. Analysis of recent trends in bus and coach safety in Britain. Saf. Sci. 1995, 19, 99–107. [Google Scholar] [CrossRef]
- Li, Z.; Liao, H.; Tang, R.; Li, G.; Li, Y.; Xu, C. Mitigating the impact of outliers in traffic crash analysis: A robust Bayesian regression approach with application to tunnel crash data. Accid. Anal. Prev. 2023, 185, 107019. [Google Scholar] [CrossRef]
- Riccardi, M.R.; Augeri, M.G.; Galante, F.; Mauriello, F.; Nicolosi, V.; Montella, A. Safety Index for evaluation of urban roundabouts. Accid. Anal. Prev. 2022, 178, 106858. [Google Scholar] [CrossRef]
- Ali, Y.; Sharma, A.; Haque, M.M.; Zheng, Z.; Saifuzzaman, M. The impact of the connected environment on driving behavior and safety: A driving simulator study. Accid. Anal. Prev. 2020, 144, 105643. [Google Scholar] [CrossRef]
- Yau, K.K.; Lo, H.-P.; Fung, S.H. Multiple-vehicle traffic accidents in Hong Kong. Accid. Anal. Prev. 2006, 38, 1157–1161. [Google Scholar] [CrossRef]
- Shin, J.; Lee, I. Reliability-based vehicle safety assessment and design optimization of roadway radius and speed limit in windy environments. J. Mech. Des. 2014, 136, 081006. [Google Scholar] [CrossRef]
- Loo, B.P.; Fan, Z.; Lian, T.; Zhang, F. Using computer vision and machine learning to identify bus safety risk factors. Accid. Anal. Prev. 2023, 185, 107017. [Google Scholar] [CrossRef] [PubMed]
- Vujanović, D.; Momčilović, V.; Bojović, N.; Papić, V. Evaluation of vehicle fleet maintenance management indicators by application of DEMATEL and ANP. Expert Syst. Appl. 2012, 39, 10552–10563. [Google Scholar] [CrossRef]
- De Villiers, P.-R.H.; Jooste, J.L.; Lucke, D. Smart maintenance system for inner city public bus services. Procedia CIRP 2023, 120, 285–290. [Google Scholar] [CrossRef]
- James, A.T. Maintenance performance evaluation of bus fleet garages using a hybrid approach. Int. J. Ind. Syst. Eng. 2022, 41, 472–501. [Google Scholar] [CrossRef]
- Daimi, S.; Rebai, S. Sustainability performance assessment of Tunisian public transport companies: AHP and ANP approaches. Socio-Econ. Plan. Sci. 2023, 89, 101680. [Google Scholar] [CrossRef]
- Khosravi, F.; Izbirak, G. A framework of index system for gauging the sustainability of iranian provinces by fusing analytical hierarchy process (AHP) and rough set theory (RST). Socio-Econ. Plan. Sci. 2024, 95, 101975. [Google Scholar] [CrossRef]
- Gürler, H.E.; Özçalıcı, M.; Pamucar, D. Determining criteria weights with genetic algorithms for multi-criteria decision making methods: The case of logistics performance index rankings of European Union countries. Socio-Econ. Plan. Sci. 2024, 91, 101758. [Google Scholar] [CrossRef]
- Li, W.; Li, B.; Fang, R.; You, P.; Zou, Y.; Xu, Z.; Guo, S. Risk evaluation of electric power grid enterprise related to electricity transmission and distribution tariff regulation employing a hybrid MCDM model. Mathematics 2021, 9, 989. [Google Scholar] [CrossRef]
- Djenadic, S.; Tanasijevic, M.; Jovancic, P.; Ignjatovic, D.; Petrovic, D.; Bugaric, U. Risk evaluation: Brief review and innovation model based on fuzzy logic and MCDM. Mathematics 2022, 10, 811. [Google Scholar] [CrossRef]
- Andjelković, D.; Stojić, G.; Nikolić, N.; Das, D.K.; Subotić, M.; Stević, Ž. A Novel Data-Envelopment Analysis Interval-Valued Fuzzy-Rough-Number Multi-Criteria Decision-Making (DEA-IFRN MCDM) Model for Determining the Efficiency of Road Sections Based on Headway Analysis. Mathematics 2024, 12, 976. [Google Scholar] [CrossRef]
- Hagag, A.M.; Yousef, L.S.; Abdelmaguid, T.F. Multi-criteria decision-making for machine selection in manufacturing and construction: Recent trends. Mathematics 2023, 11, 631. [Google Scholar] [CrossRef]
- Xiong, Z.; Chen, S. A multi-fidelity approach for reliability-based risk assessment of single-vehicle crashes. Accid. Anal. Prev. 2024, 195, 107391. [Google Scholar] [CrossRef] [PubMed]
- Li, Q.; Wang, Z.; Li, M.; Yang, R.; Lin, P.-S.; Li, X. Development of crash modification factors for roadway illuminance: A matched case-control study. Accid. Anal. Prev. 2021, 159, 106279. [Google Scholar] [CrossRef]
- Ganji, S.S.; Rassafi, A.A.; Kordani, A.A. Vehicle safety analysis based on a hybrid approach integrating DEMATEL, ANP and ER. KSCE J. Civ. Eng. 2018, 22, 4580–4592. [Google Scholar] [CrossRef]
- Du, Z.; Zhou, J.; Yang, Z.; Bo, J. The research on operational reliability evaluation of straddle-type monorail vehicle. Syst. Sci. Control Eng. 2018, 6, 537–546. [Google Scholar] [CrossRef]
- Dong, S.; Yu, F.; Wang, K. Safety evaluation of rail transit vehicle system based on improved AHP-GA. PLoS ONE 2022, 17, e0273418. [Google Scholar] [CrossRef]
- Porcu, F.; Olivo, A.; Giulio, M.; Coni, M.; Michela, B.; Barabino, B. Assessing the risk of bus crashes in transit systems. Eur. Transp./Trasp. Eur. 2021, 81, 1–14. [Google Scholar] [CrossRef]
- Yuan, Q.; Dai, X.; Wang, W. Contributing factors and severity of serious single-passenger vehicle collisions in Beijing. Int. J. Crashworthiness 2016, 21, 32–40. [Google Scholar] [CrossRef]
- Renu, R.; Visotsky, D.; Knackstedt, S.; Mocko, G.; Summers, J.D.; Schulte, J. A knowledge based FMEA to support identification and management of vehicle flexible component issues. Procedia Cirp 2016, 44, 157–162. [Google Scholar] [CrossRef]
- Zadeh, L.A. Fuzzy sets. Inf. Control 1965, 8, 338–353. [Google Scholar] [CrossRef]
- Zadeh, L.A. The concept of a linguistic variable and its application to approximate reasoning—III. Inf. Sci. 1975, 9, 43–80. [Google Scholar] [CrossRef]
- Zadeh, L.A. The concept of a linguistic variable and its application to approximate reasoning—II. Inf. Sci. 1975, 8, 301–357. [Google Scholar] [CrossRef]
- Zadeh, L.A. The concept of a linguistic variable and its application to approximate reasoning—I. Inf. Sci. 1975, 8, 199–249. [Google Scholar] [CrossRef]
- Guillaume, S. Designing fuzzy inference systems from data: An interpretability-oriented review. IEEE Trans. Fuzzy Syst. 2001, 9, 426–443. [Google Scholar] [CrossRef]
- Ojha, V.; Abraham, A.; Snášel, V. Heuristic design of fuzzy inference systems: A review of three decades of research. Eng. Appl. Artif. Intell. 2019, 85, 845–864. [Google Scholar] [CrossRef]
- Namgung, H.; Kim, J.-S. Collision risk inference system for maritime autonomous surface ships using COLREGs rules compliant collision avoidance. IEEE Access 2021, 9, 7823–7835. [Google Scholar] [CrossRef]
- Namgung, H. Local route planning for collision avoidance of maritime autonomous surface ships in compliance with COLREGs rules. Sustainability 2021, 14, 198. [Google Scholar] [CrossRef]
- Atanassov, K.T. Intuitionistic fuzzy sets. Fuzzy Sets Syst. 1986, 20, 87–96. [Google Scholar] [CrossRef]
- Castillo, O.; Melin, P. Towards interval type-3 intuitionistic fuzzy sets and systems. Mathematics 2022, 10, 4091. [Google Scholar] [CrossRef]
- Gorzalczany, M.B. A method of inference in approximate reasoning based on interval-valued fuzzy sets. Fuzzy Sets Syst. 1987, 21, 1–17. [Google Scholar] [CrossRef]
- Yager, R.R. Pythagorean Membership Grades in Multicriteria Decision Making. IEEE Trans. Fuzzy Syst. 2014, 22, 958–965. [Google Scholar] [CrossRef]
- Garg, H. Linguistic Interval-Valued Pythagorean Fuzzy Sets and Their Application to Multiple Attribute Group Decision-making Process. Cogn. Comput. 2020, 12, 1313–1337. [Google Scholar] [CrossRef]
- Wang, J. Chapter 11—Safety Analysis Methods for Train Control Systems. In Safety Theory and Control Technology of High-Speed Train Operation; Wang, J., Ed.; Academic Press: Cambridge, MA, USA, 2018; pp. 309–354. [Google Scholar]
- He, L.; Pan, R.; Wang, Y.; Gao, J.; Xu, T.; Zhang, N.; Wu, Y.; Zhang, X. A Case Study of Accident Analysis and Prevention for Coal Mining Transportation System Based on FTA-BN-PHA in the Context of Smart Mining Process. Mathematics 2024, 12, 1109. [Google Scholar] [CrossRef]
- Yazdi, M.; Nedjati, A.; Zarei, E.; Abbassi, R. A novel extension of DEMATEL approach for probabilistic safety analysis in process systems. Saf. Sci. 2020, 121, 119–136. [Google Scholar] [CrossRef]
- Saaty, T.L. The analytic hierarchy process (AHP). J. Oper. Res. Soc. 1980, 41, 1073–1076. [Google Scholar]
- Pant, S.; Kumar, A.; Ram, M.; Klochkov, Y.; Sharma, H.K. Consistency indices in analytic hierarchy process: A review. Mathematics 2022, 10, 1206. [Google Scholar] [CrossRef]
- Chan, H.K.; Sun, X.; Chung, S.-H. When should fuzzy analytic hierarchy process be used instead of analytic hierarchy process? Decis. Support Syst. 2019, 125, 113114. [Google Scholar] [CrossRef]
- Ayyildiz, E.; Yildiz, A.; Taskin, A.; Ozkan, C. An interval valued Pythagorean fuzzy AHP integrated quality function deployment methodology for hazelnut production in Turkey. Expert Syst. Appl. 2023, 231, 120708. [Google Scholar] [CrossRef]
- Gabus, A.; Fontela, E. World Problems, an Invitation to Further Thought Within the Framework of DEMATEL; Battelle Geneva Research Center: Geneva, Switzerland, 1972; Volume 1, pp. 12–14. [Google Scholar]
- Boutkhoum, O.; Hanine, M.; Nabil, M.; El Barakaz, F.; Lee, E.; Rustam, F.; Ashraf, I. Analysis and evaluation of barriers influencing blockchain implementation in Moroccan sustainable supply chain management: An integrated IFAHP-DEMATEL framework. Mathematics 2021, 9, 1601. [Google Scholar] [CrossRef]
- Yu, S.; Geng, X.; He, J.; Sun, Y. Evolution analysis of product service ecosystem based on interval Pythagorean fuzzy DEMATEL-ISM-SD combination model. J. Clean. Prod. 2023, 421, 138501. [Google Scholar] [CrossRef]
- Vuchic, V.R. Urban Transit Systems and Technology; John Wiley & Sons: Hoboken, NJ, USA, 2007. [Google Scholar]

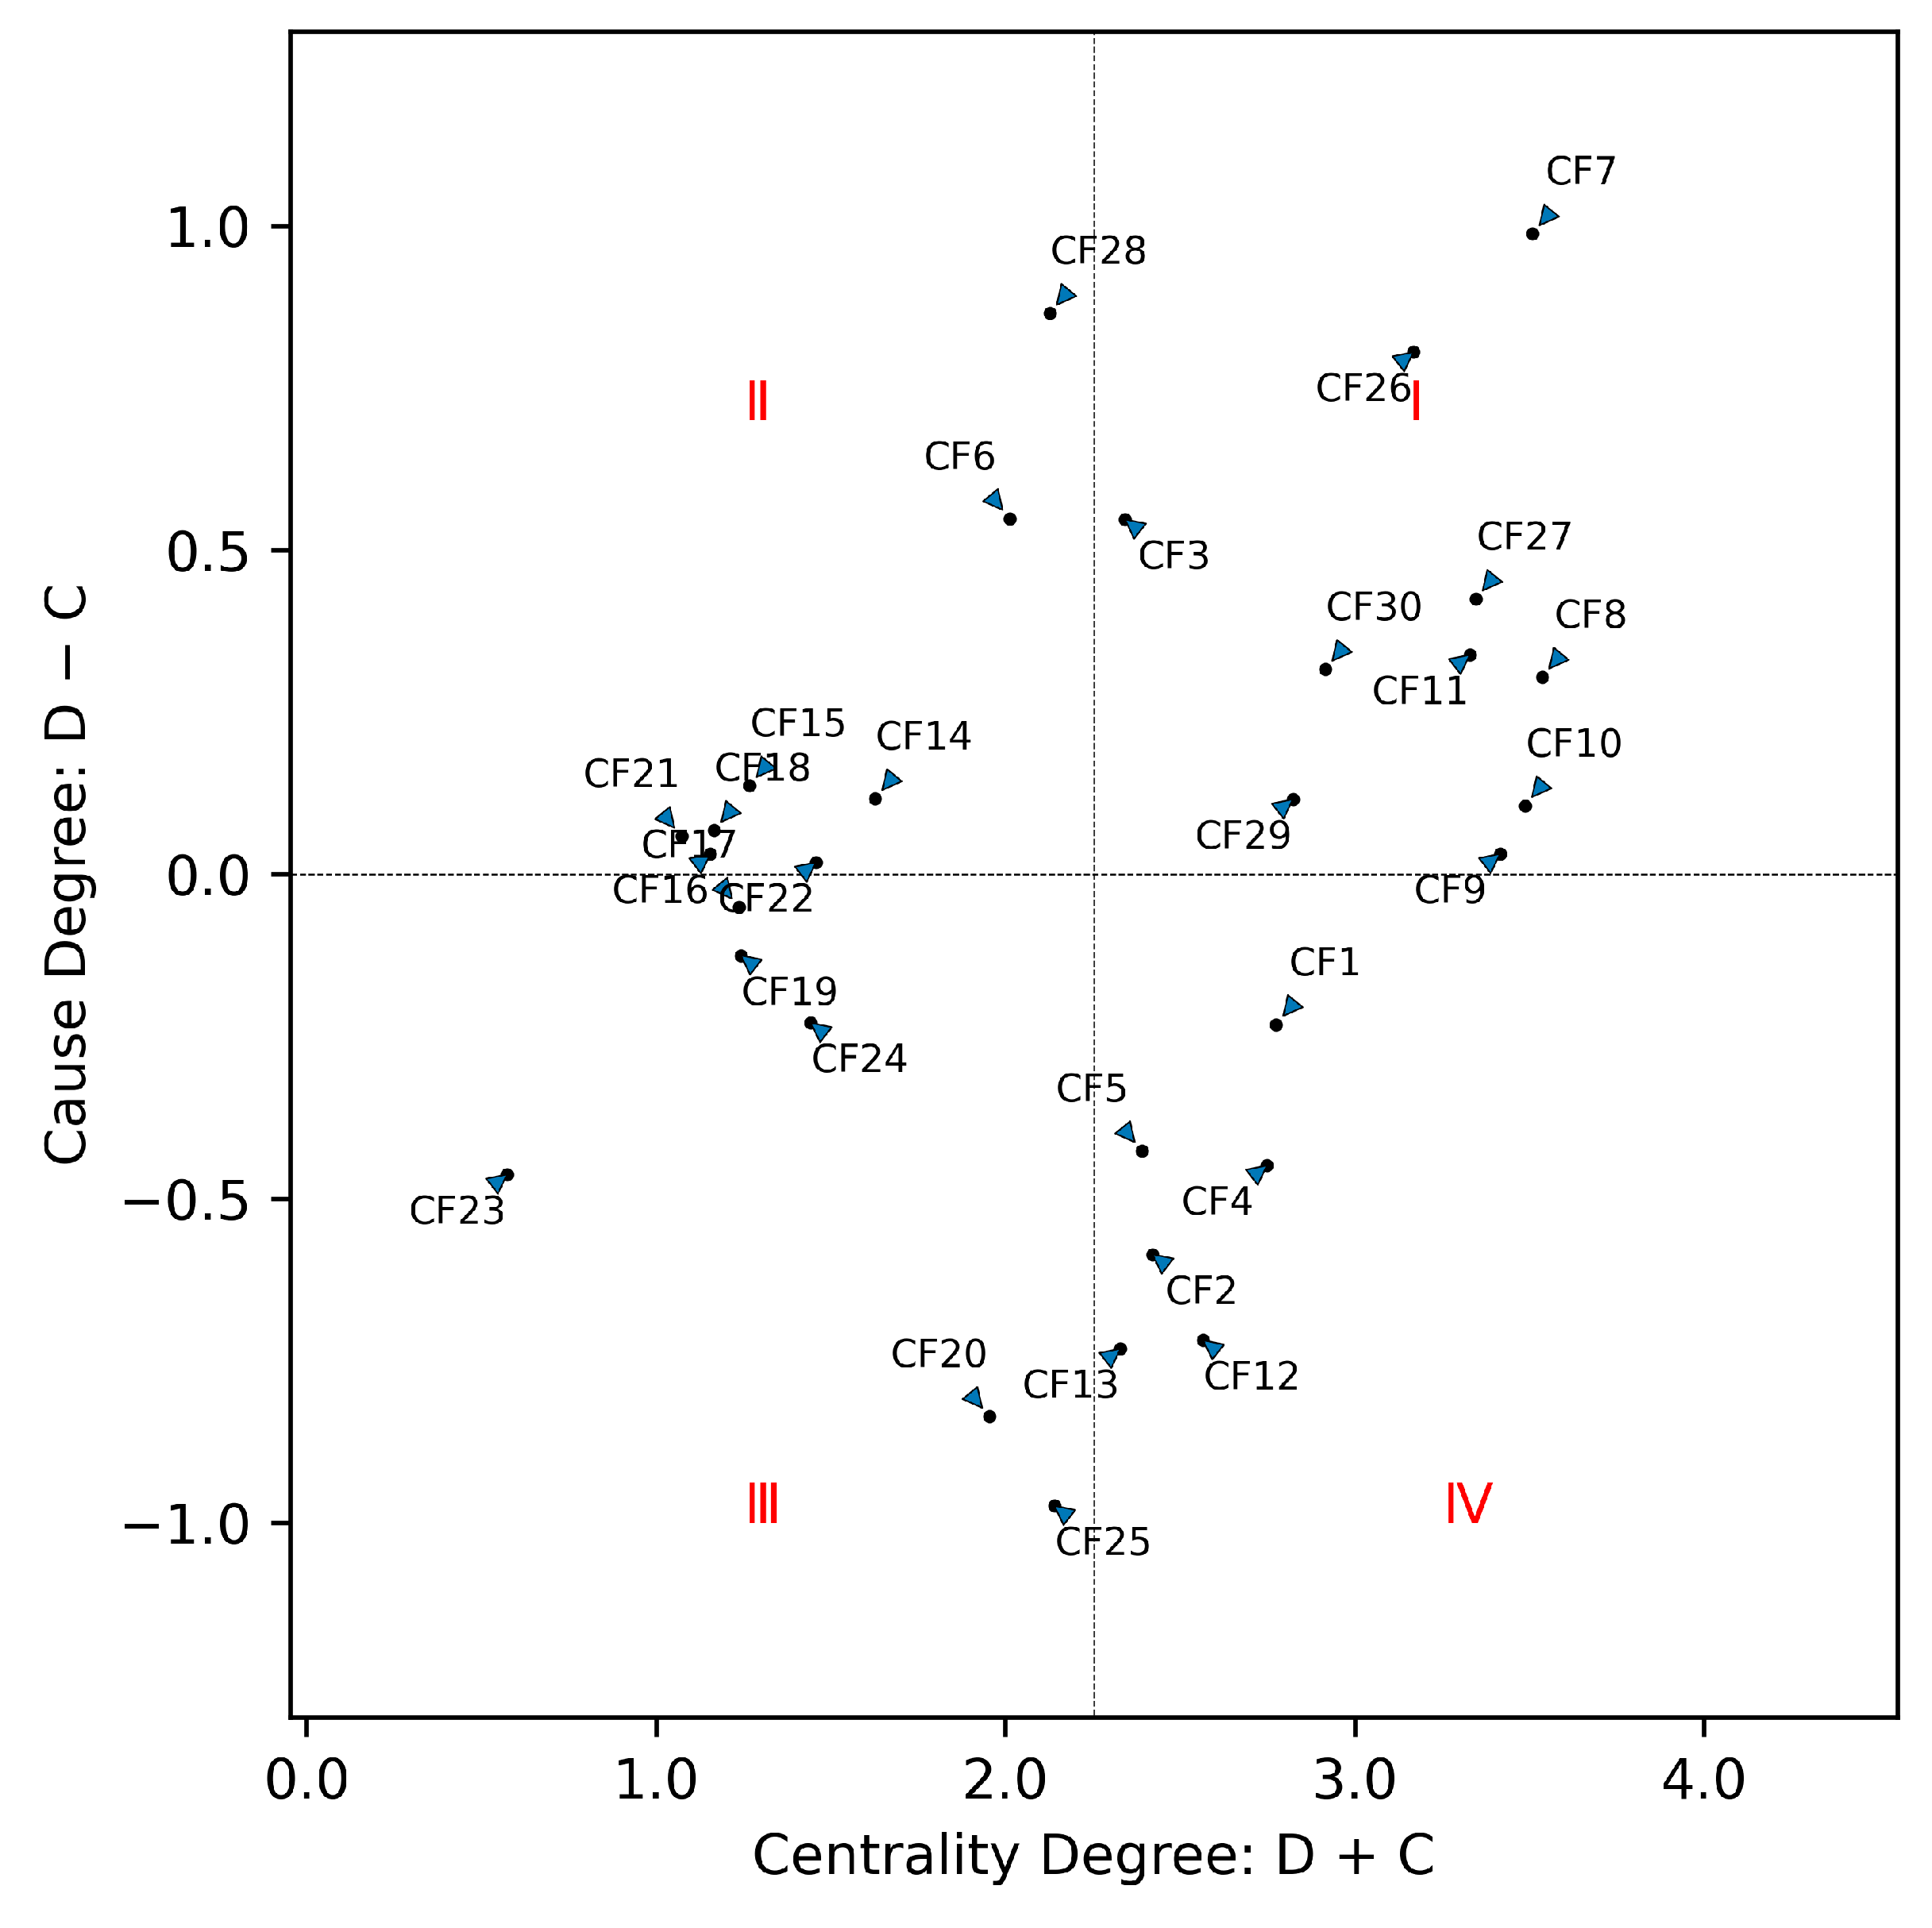
Disclaimer/Publisher’s Note: The statements, opinions and data contained in all publications are solely those of the individual author(s) and contributor(s) and not of MDPI and/or the editor(s). MDPI and/or the editor(s) disclaim responsibility for any injury to people or property resulting from any ideas, methods, instructions or products referred to in the content. |
© 2025 by the authors. Licensee MDPI, Basel, Switzerland. This article is an open access article distributed under the terms and conditions of the Creative Commons Attribution (CC BY) license (https://creativecommons.org/licenses/by/4.0/).