
Simulative and Experimental Investigation of Vibration Transfer Path at Gearboxes


Abstract
1. Introduction
- In this paper, the vibration execution from the gear mesh and bearings in the simulation are investigated at the same time, based on a particular self-modeled software based on published sources.
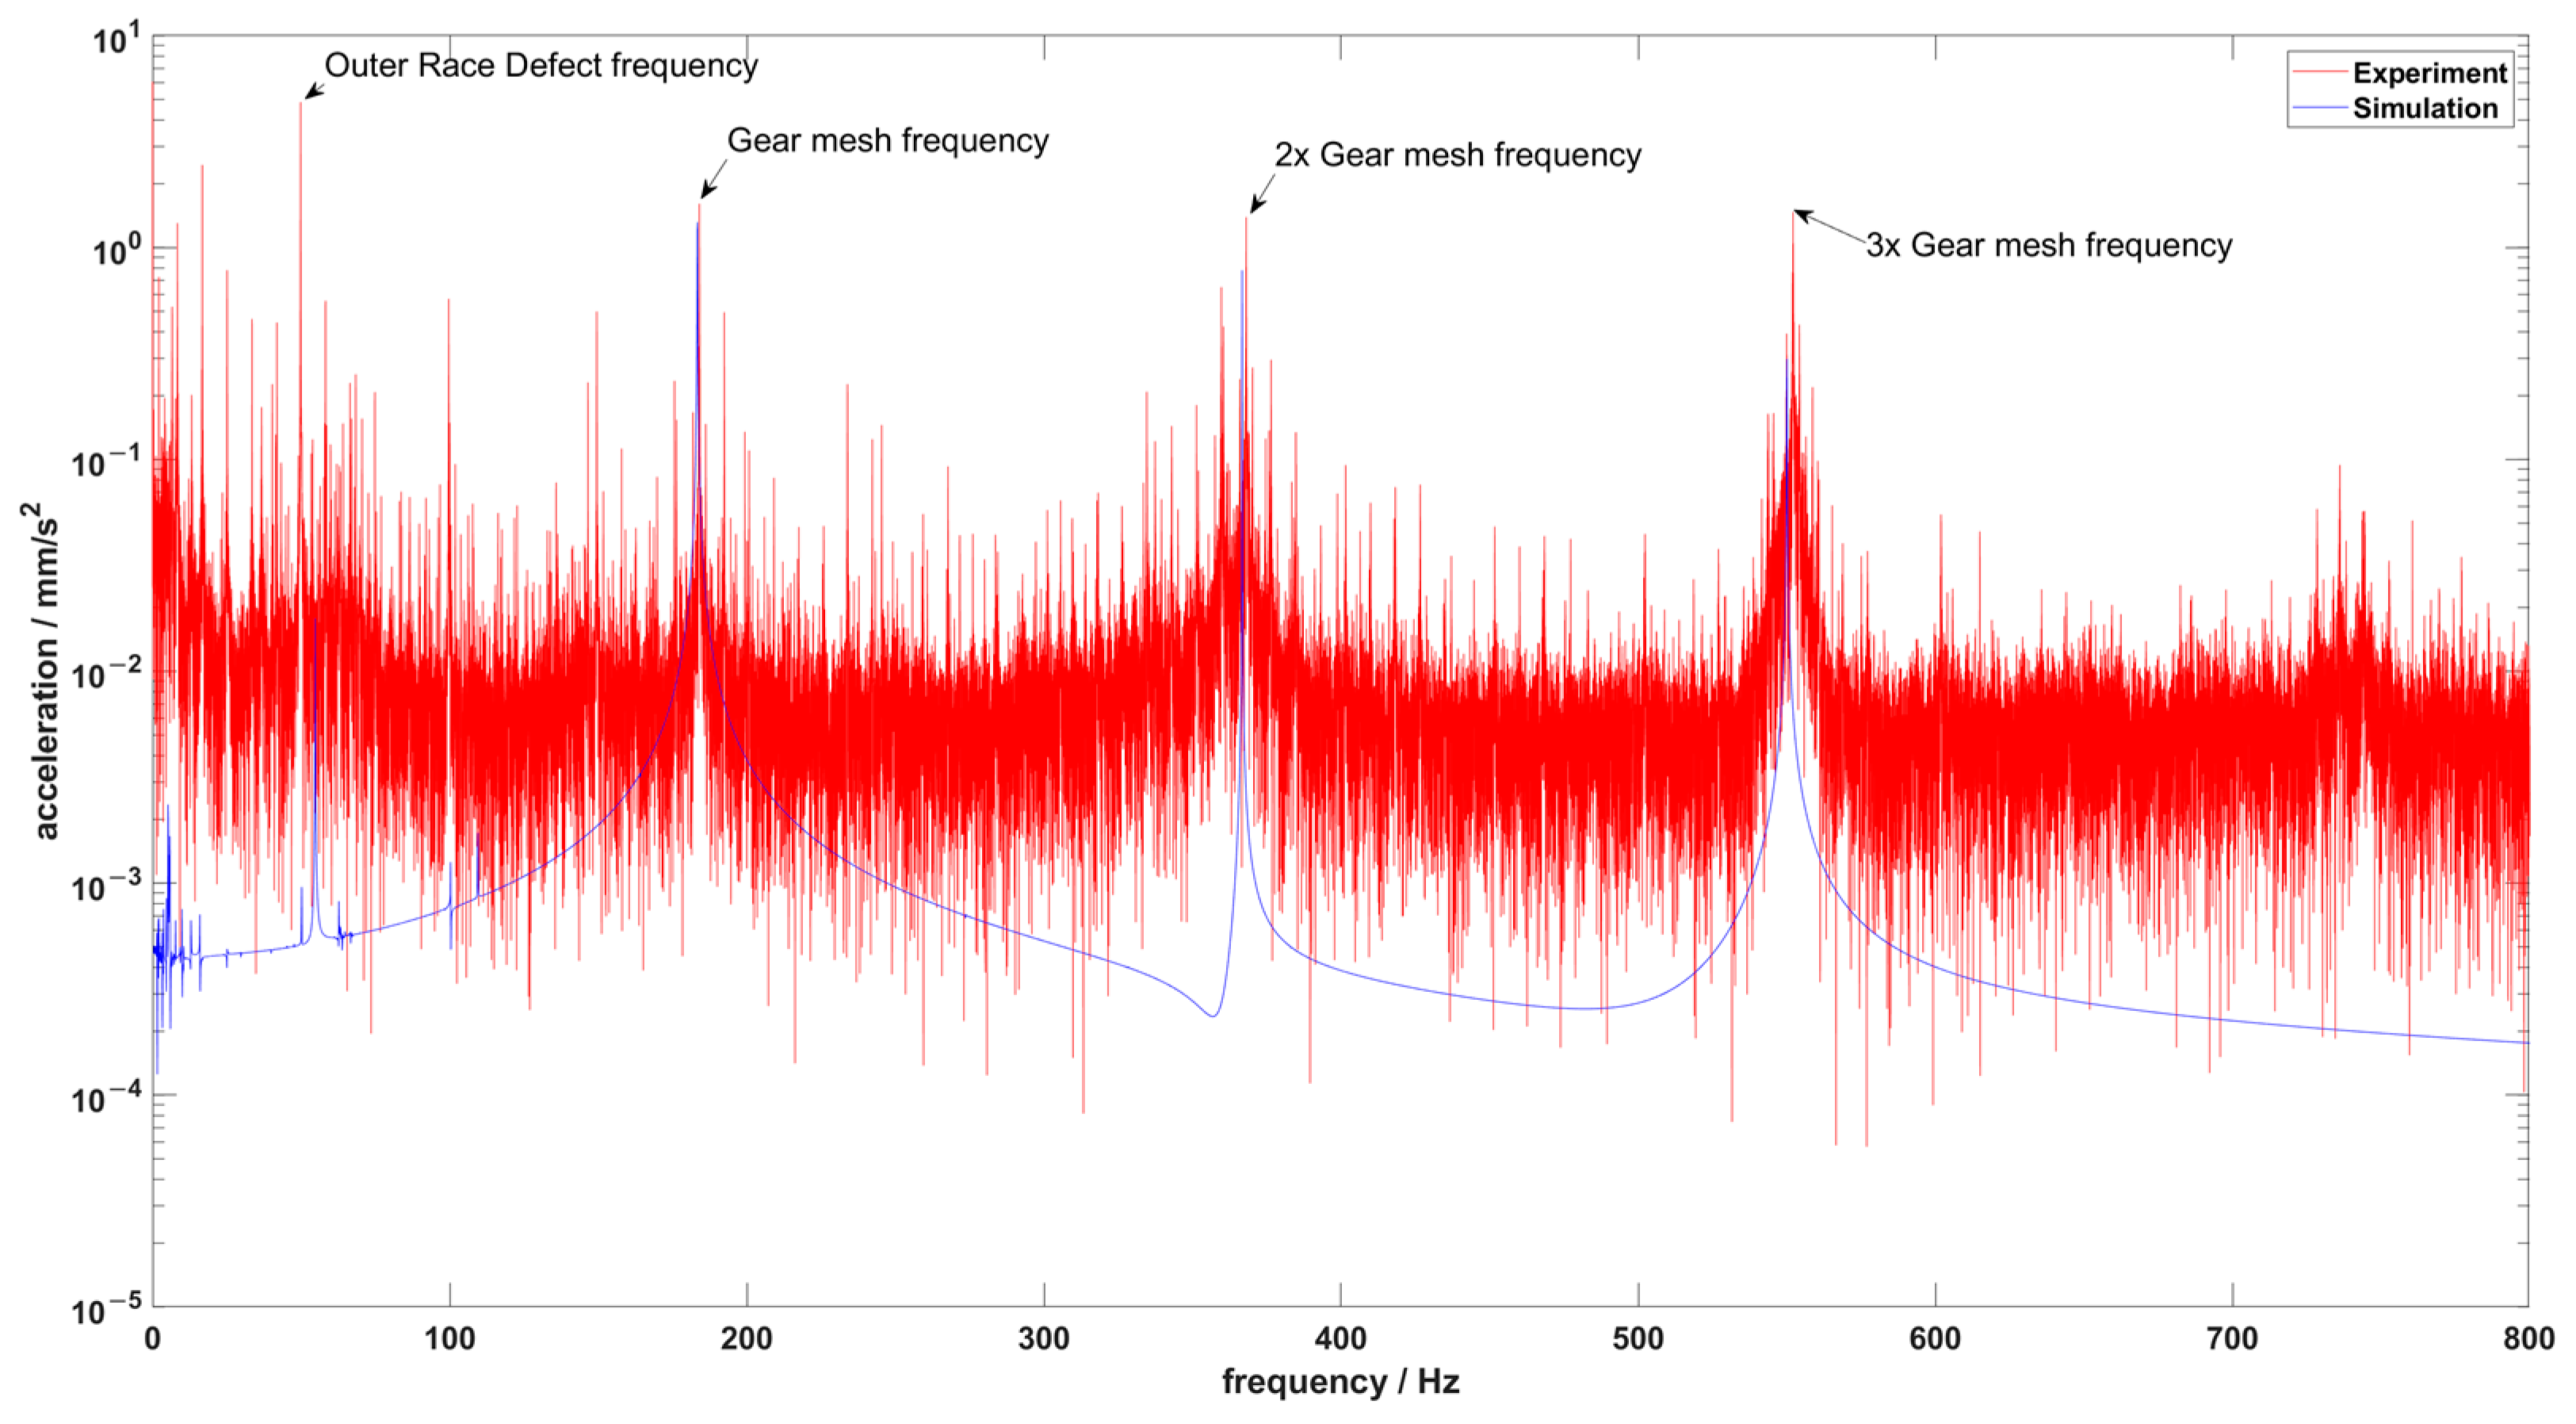
- In this paper, the vibration executions in the frequency domain from the experiment and simulation are discussed and compared.
- Helical gears and tapered roller bearings are used, which lead to a complex dynamic vibration transfer because of static preloads and dynamic axial loads at the bearings.
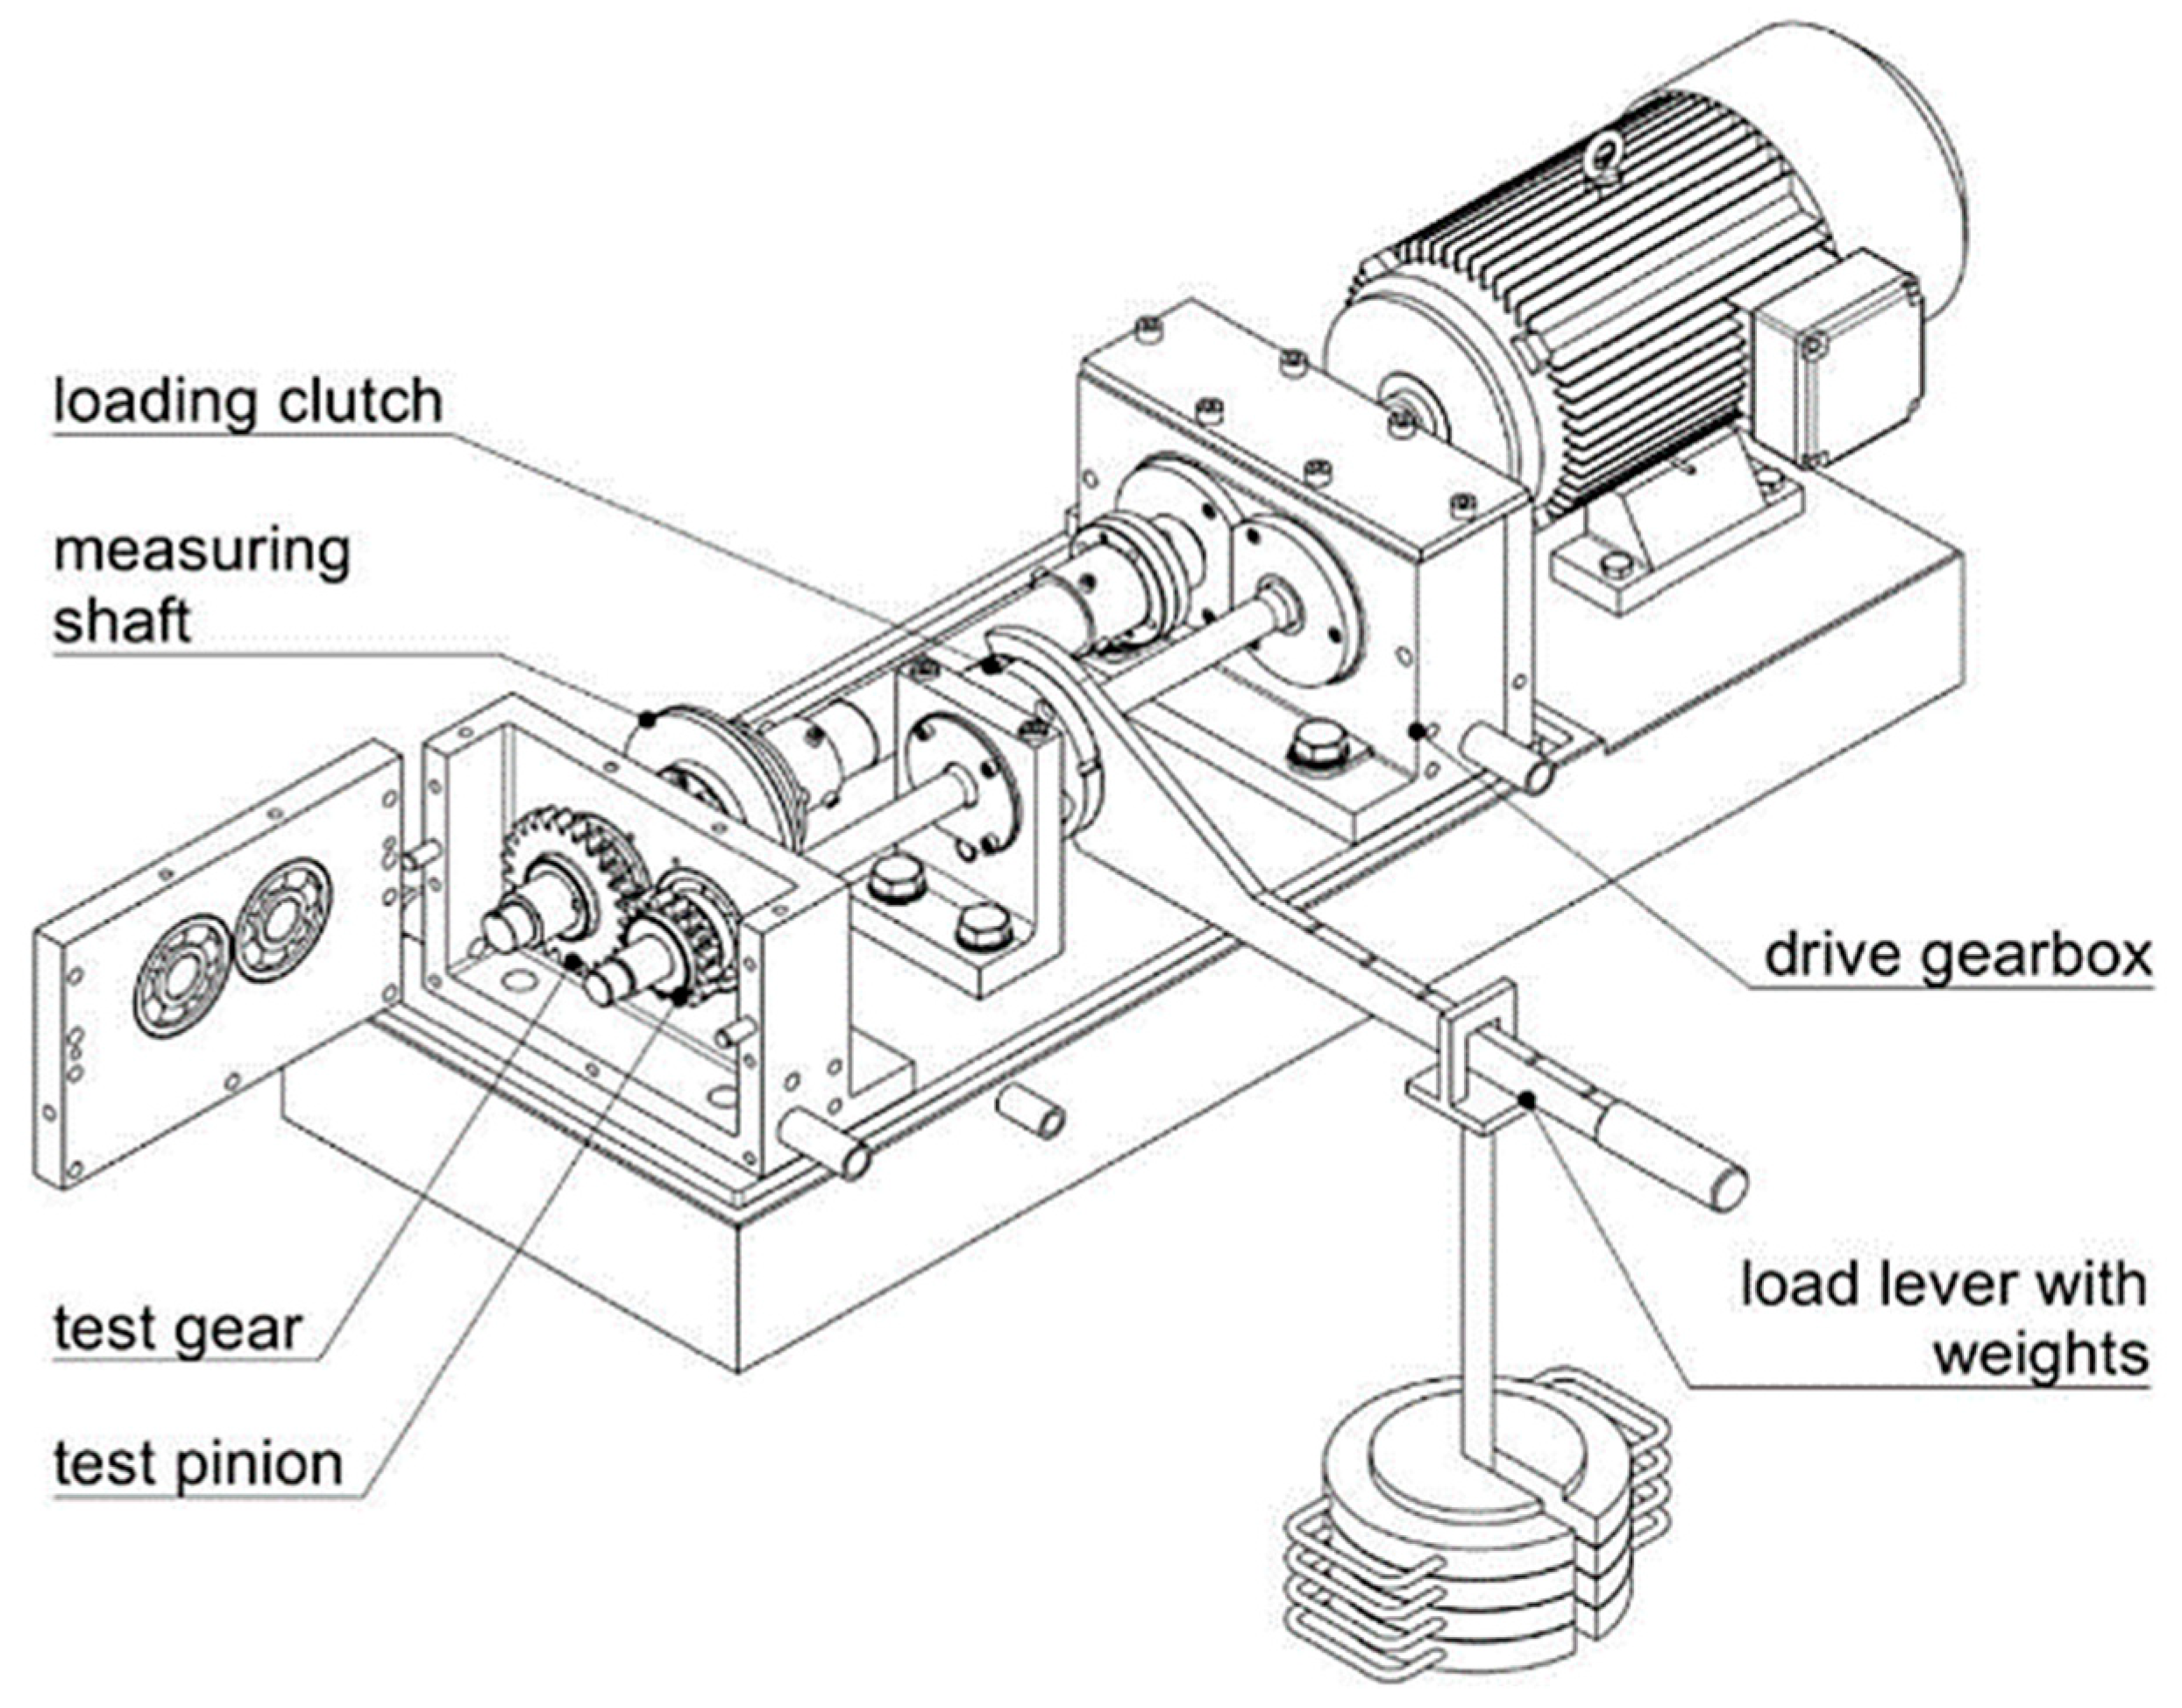
2. Test Case
3. Simulation Model
3.1. Shafts
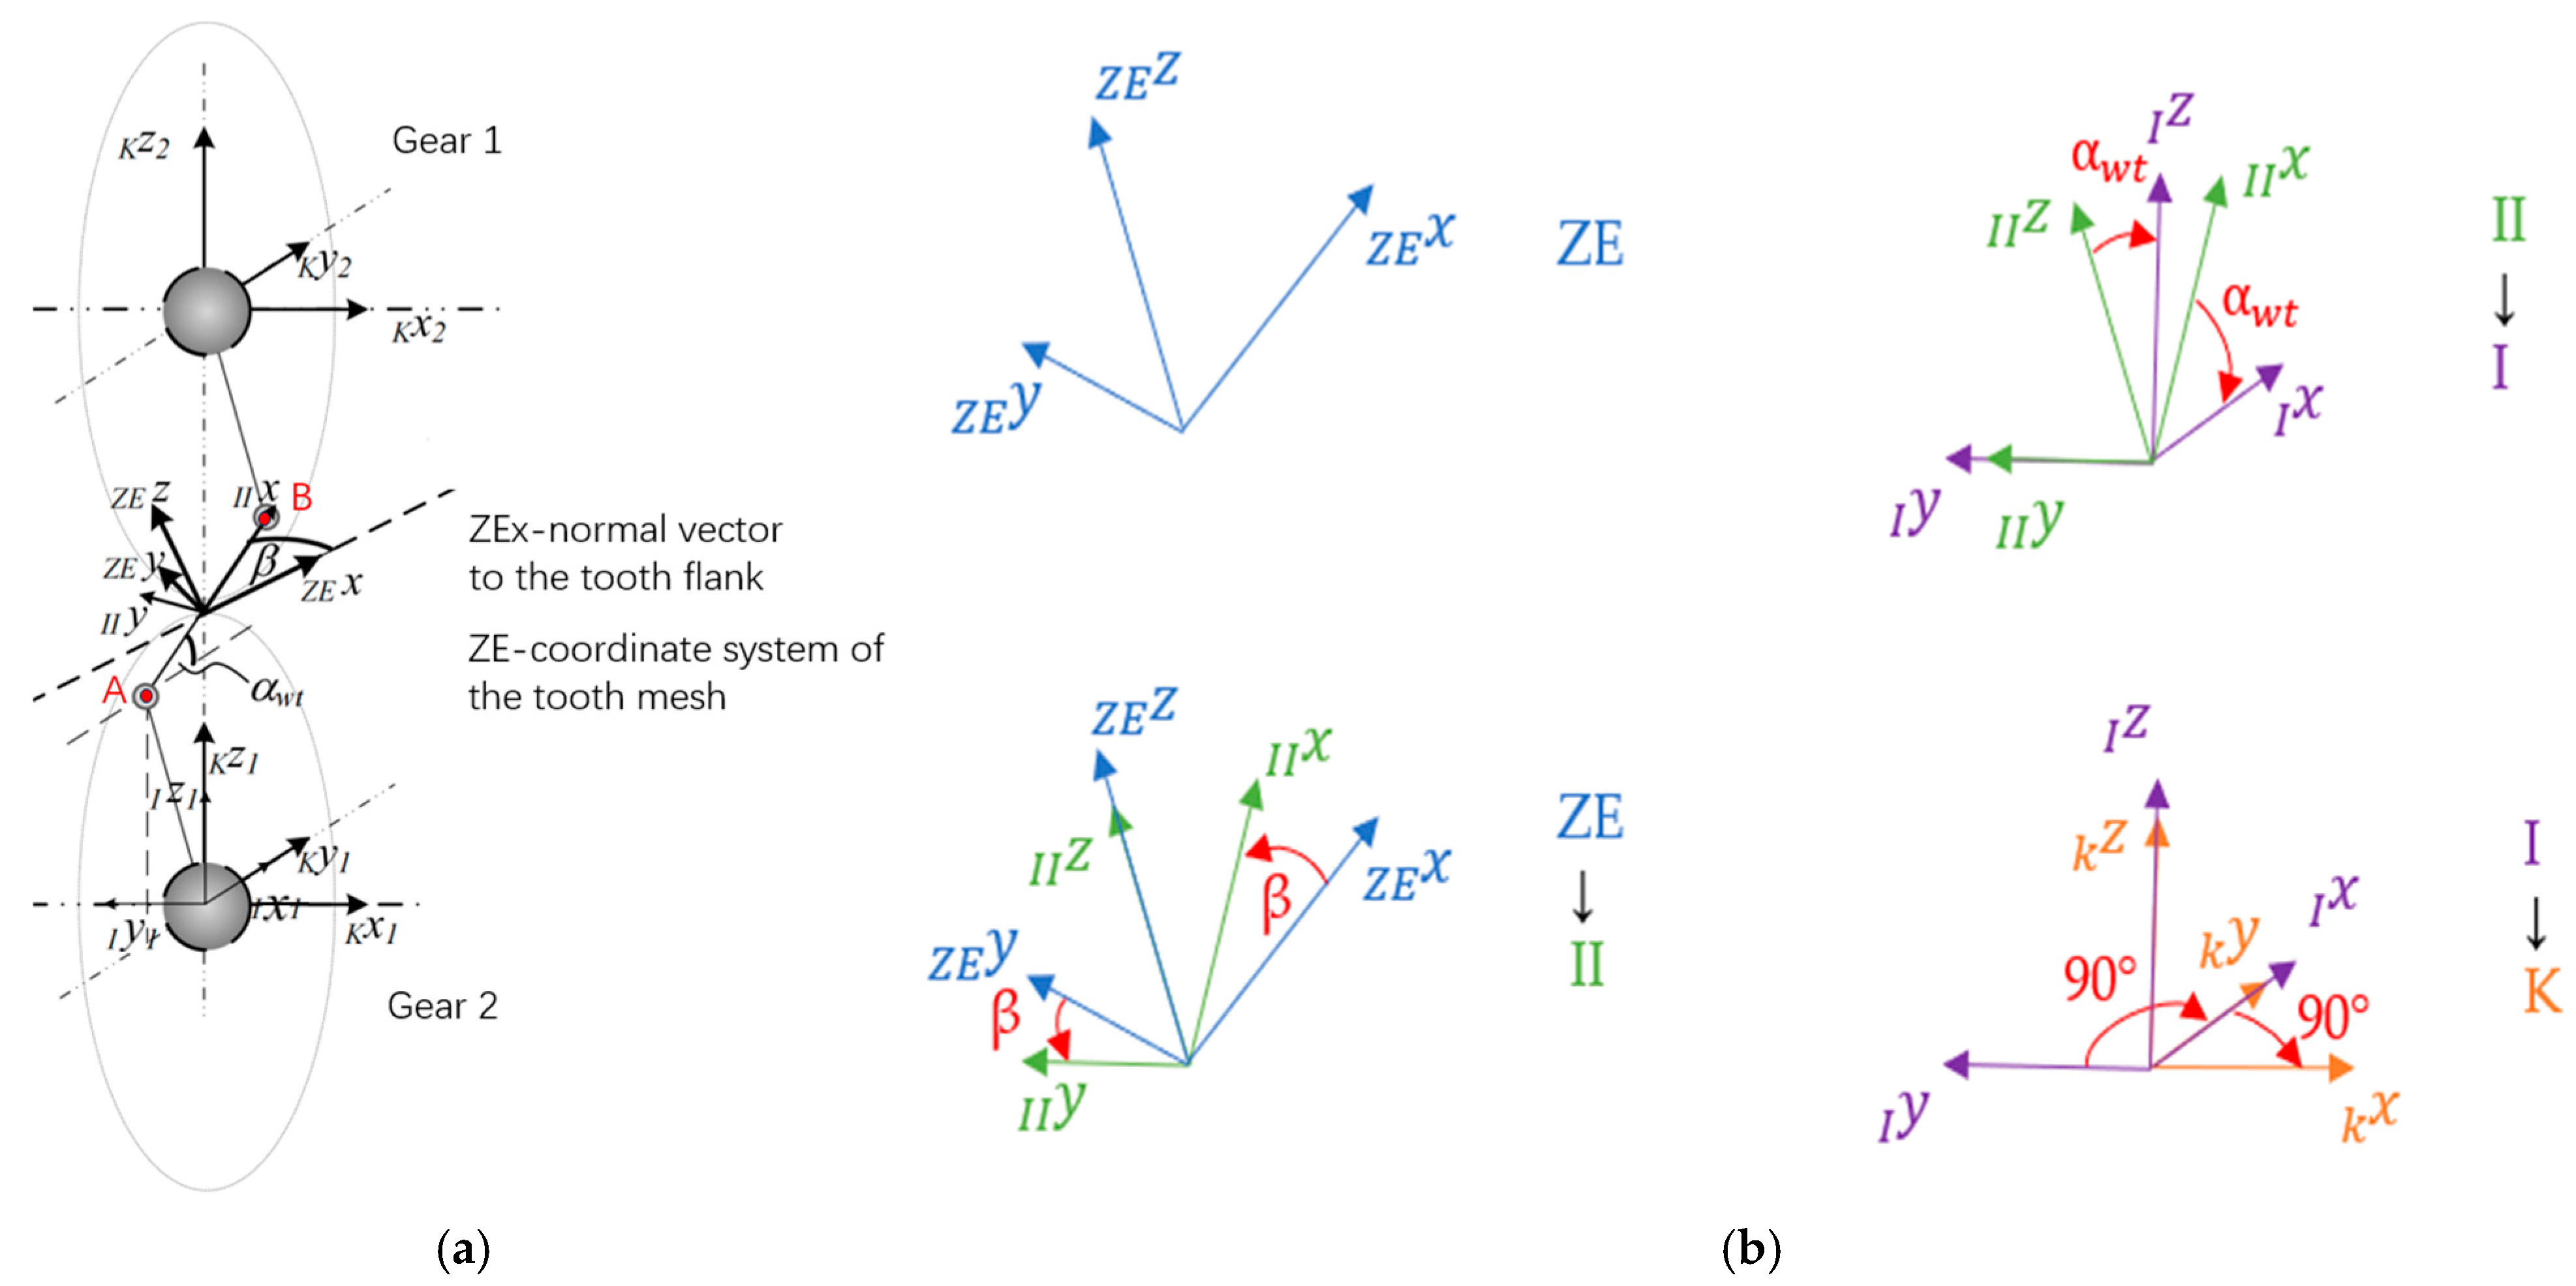
3.2. Gear Pair
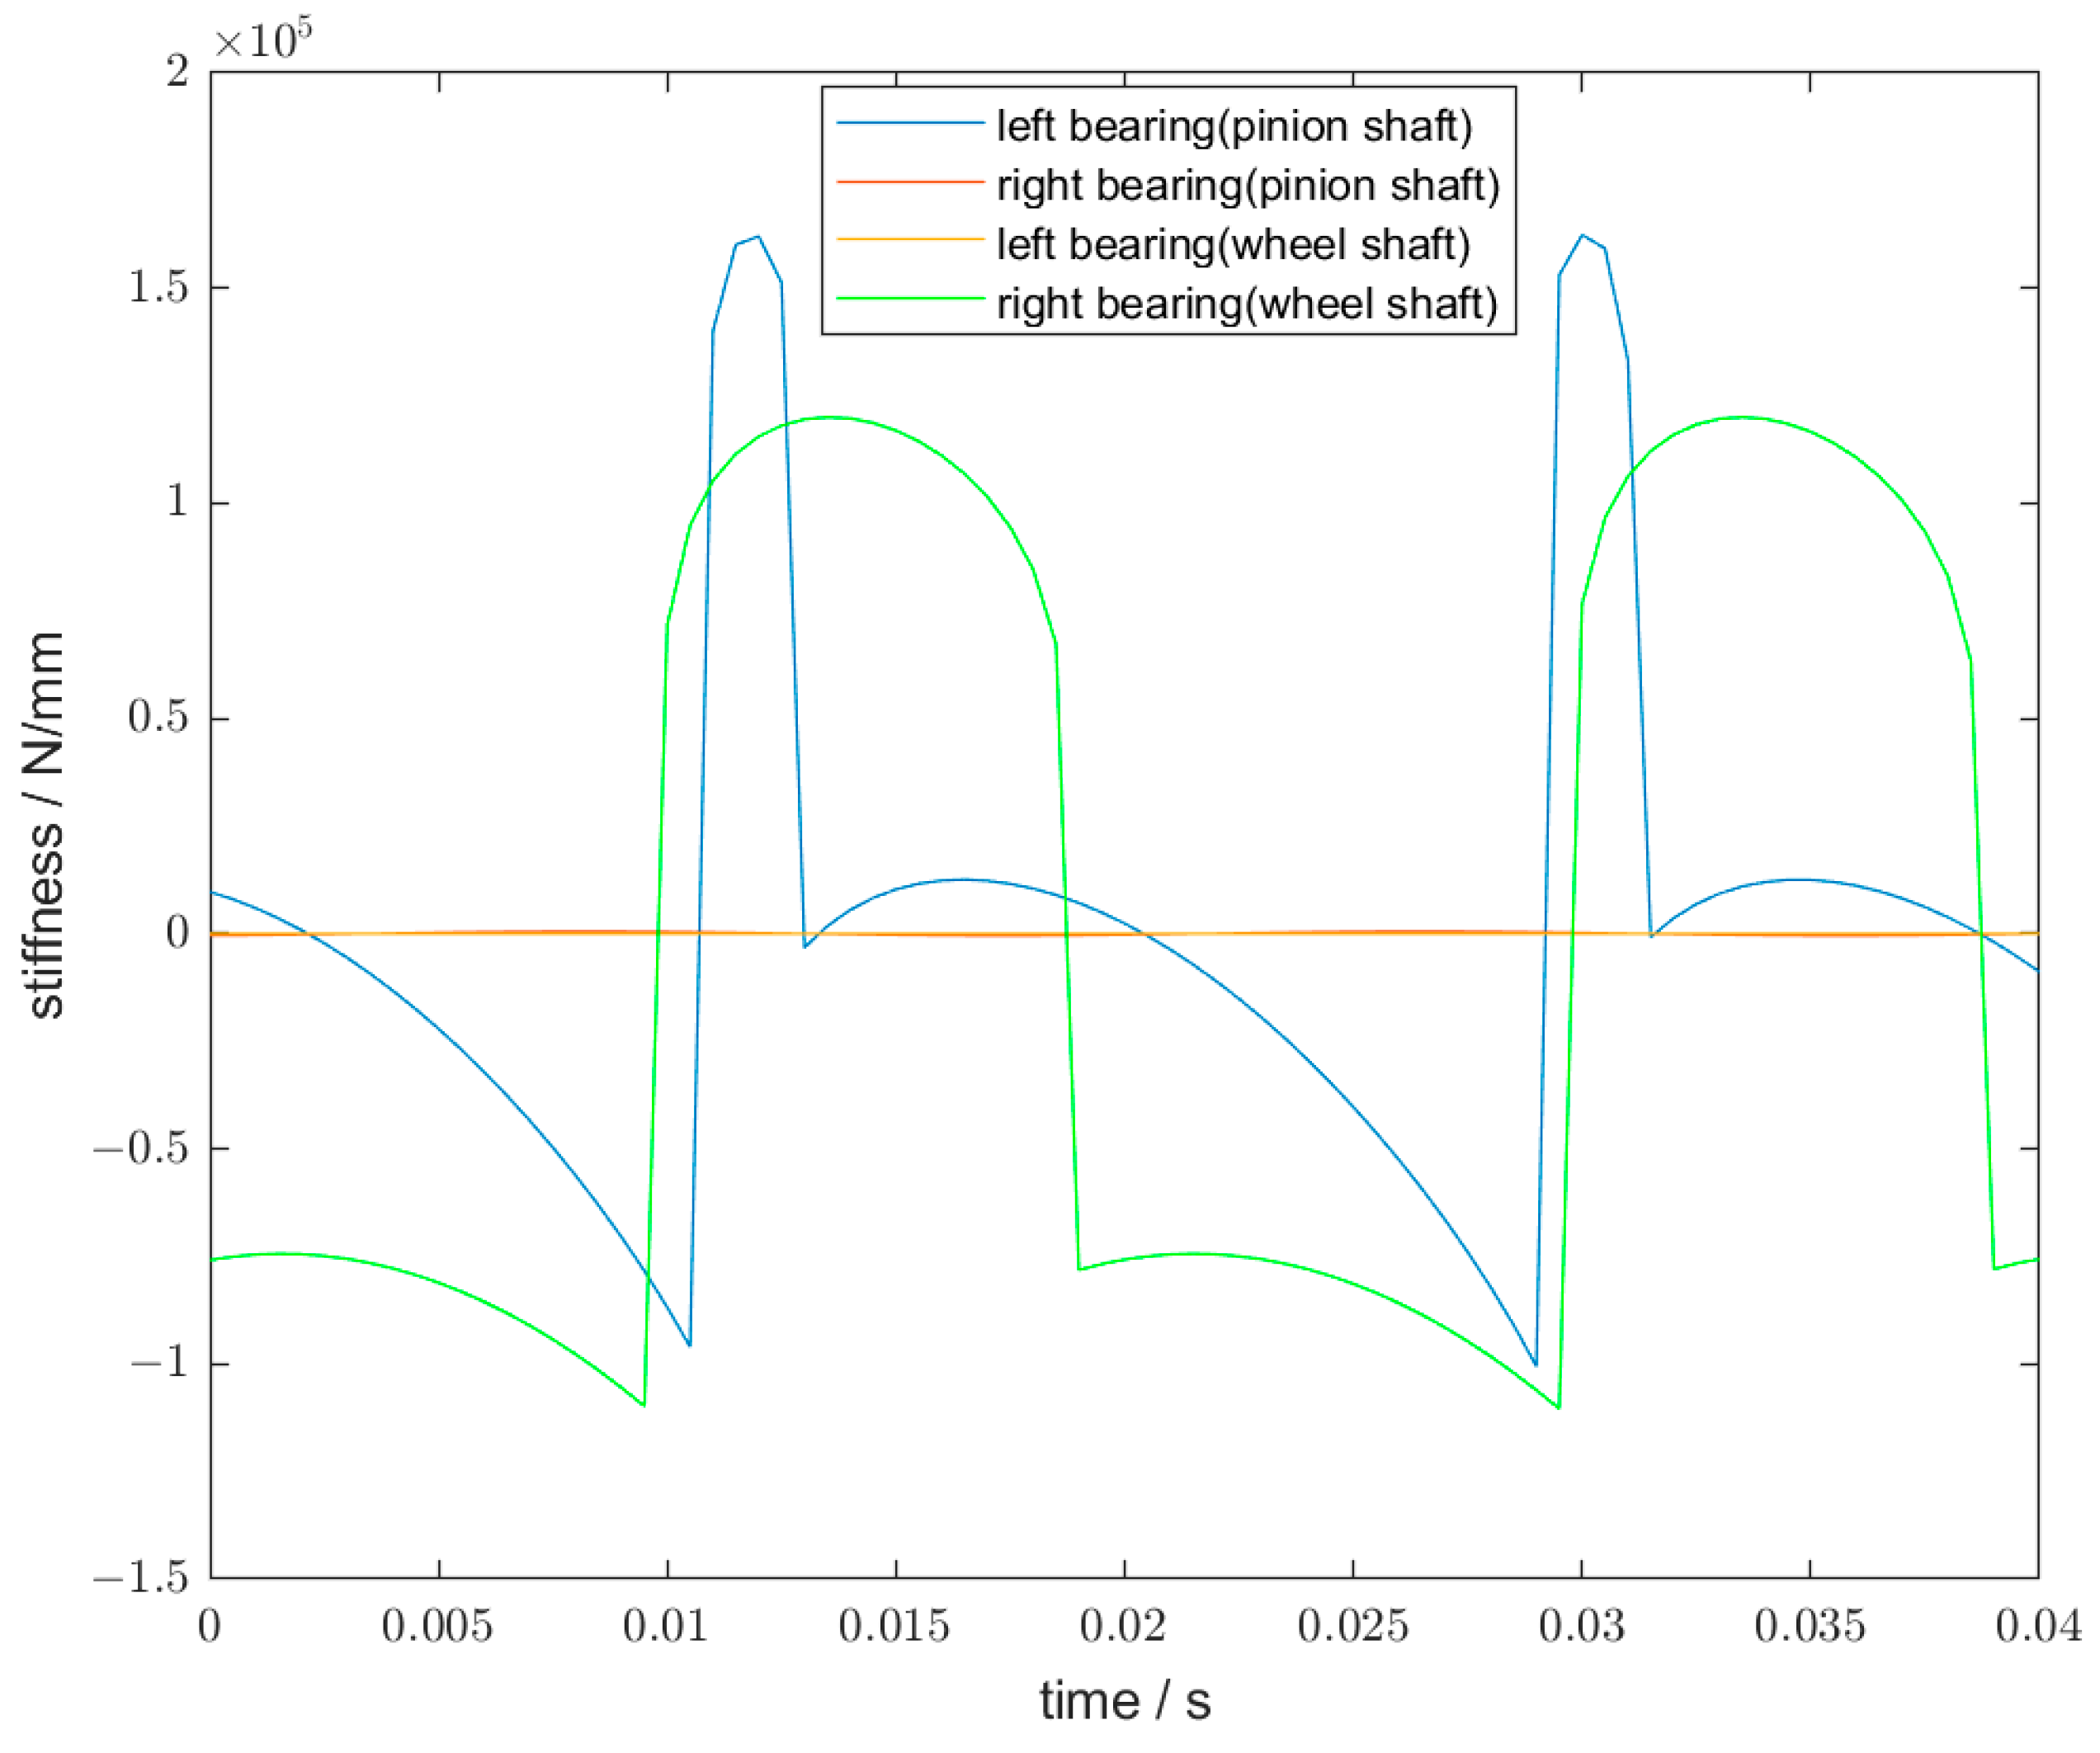
3.3. Bearings
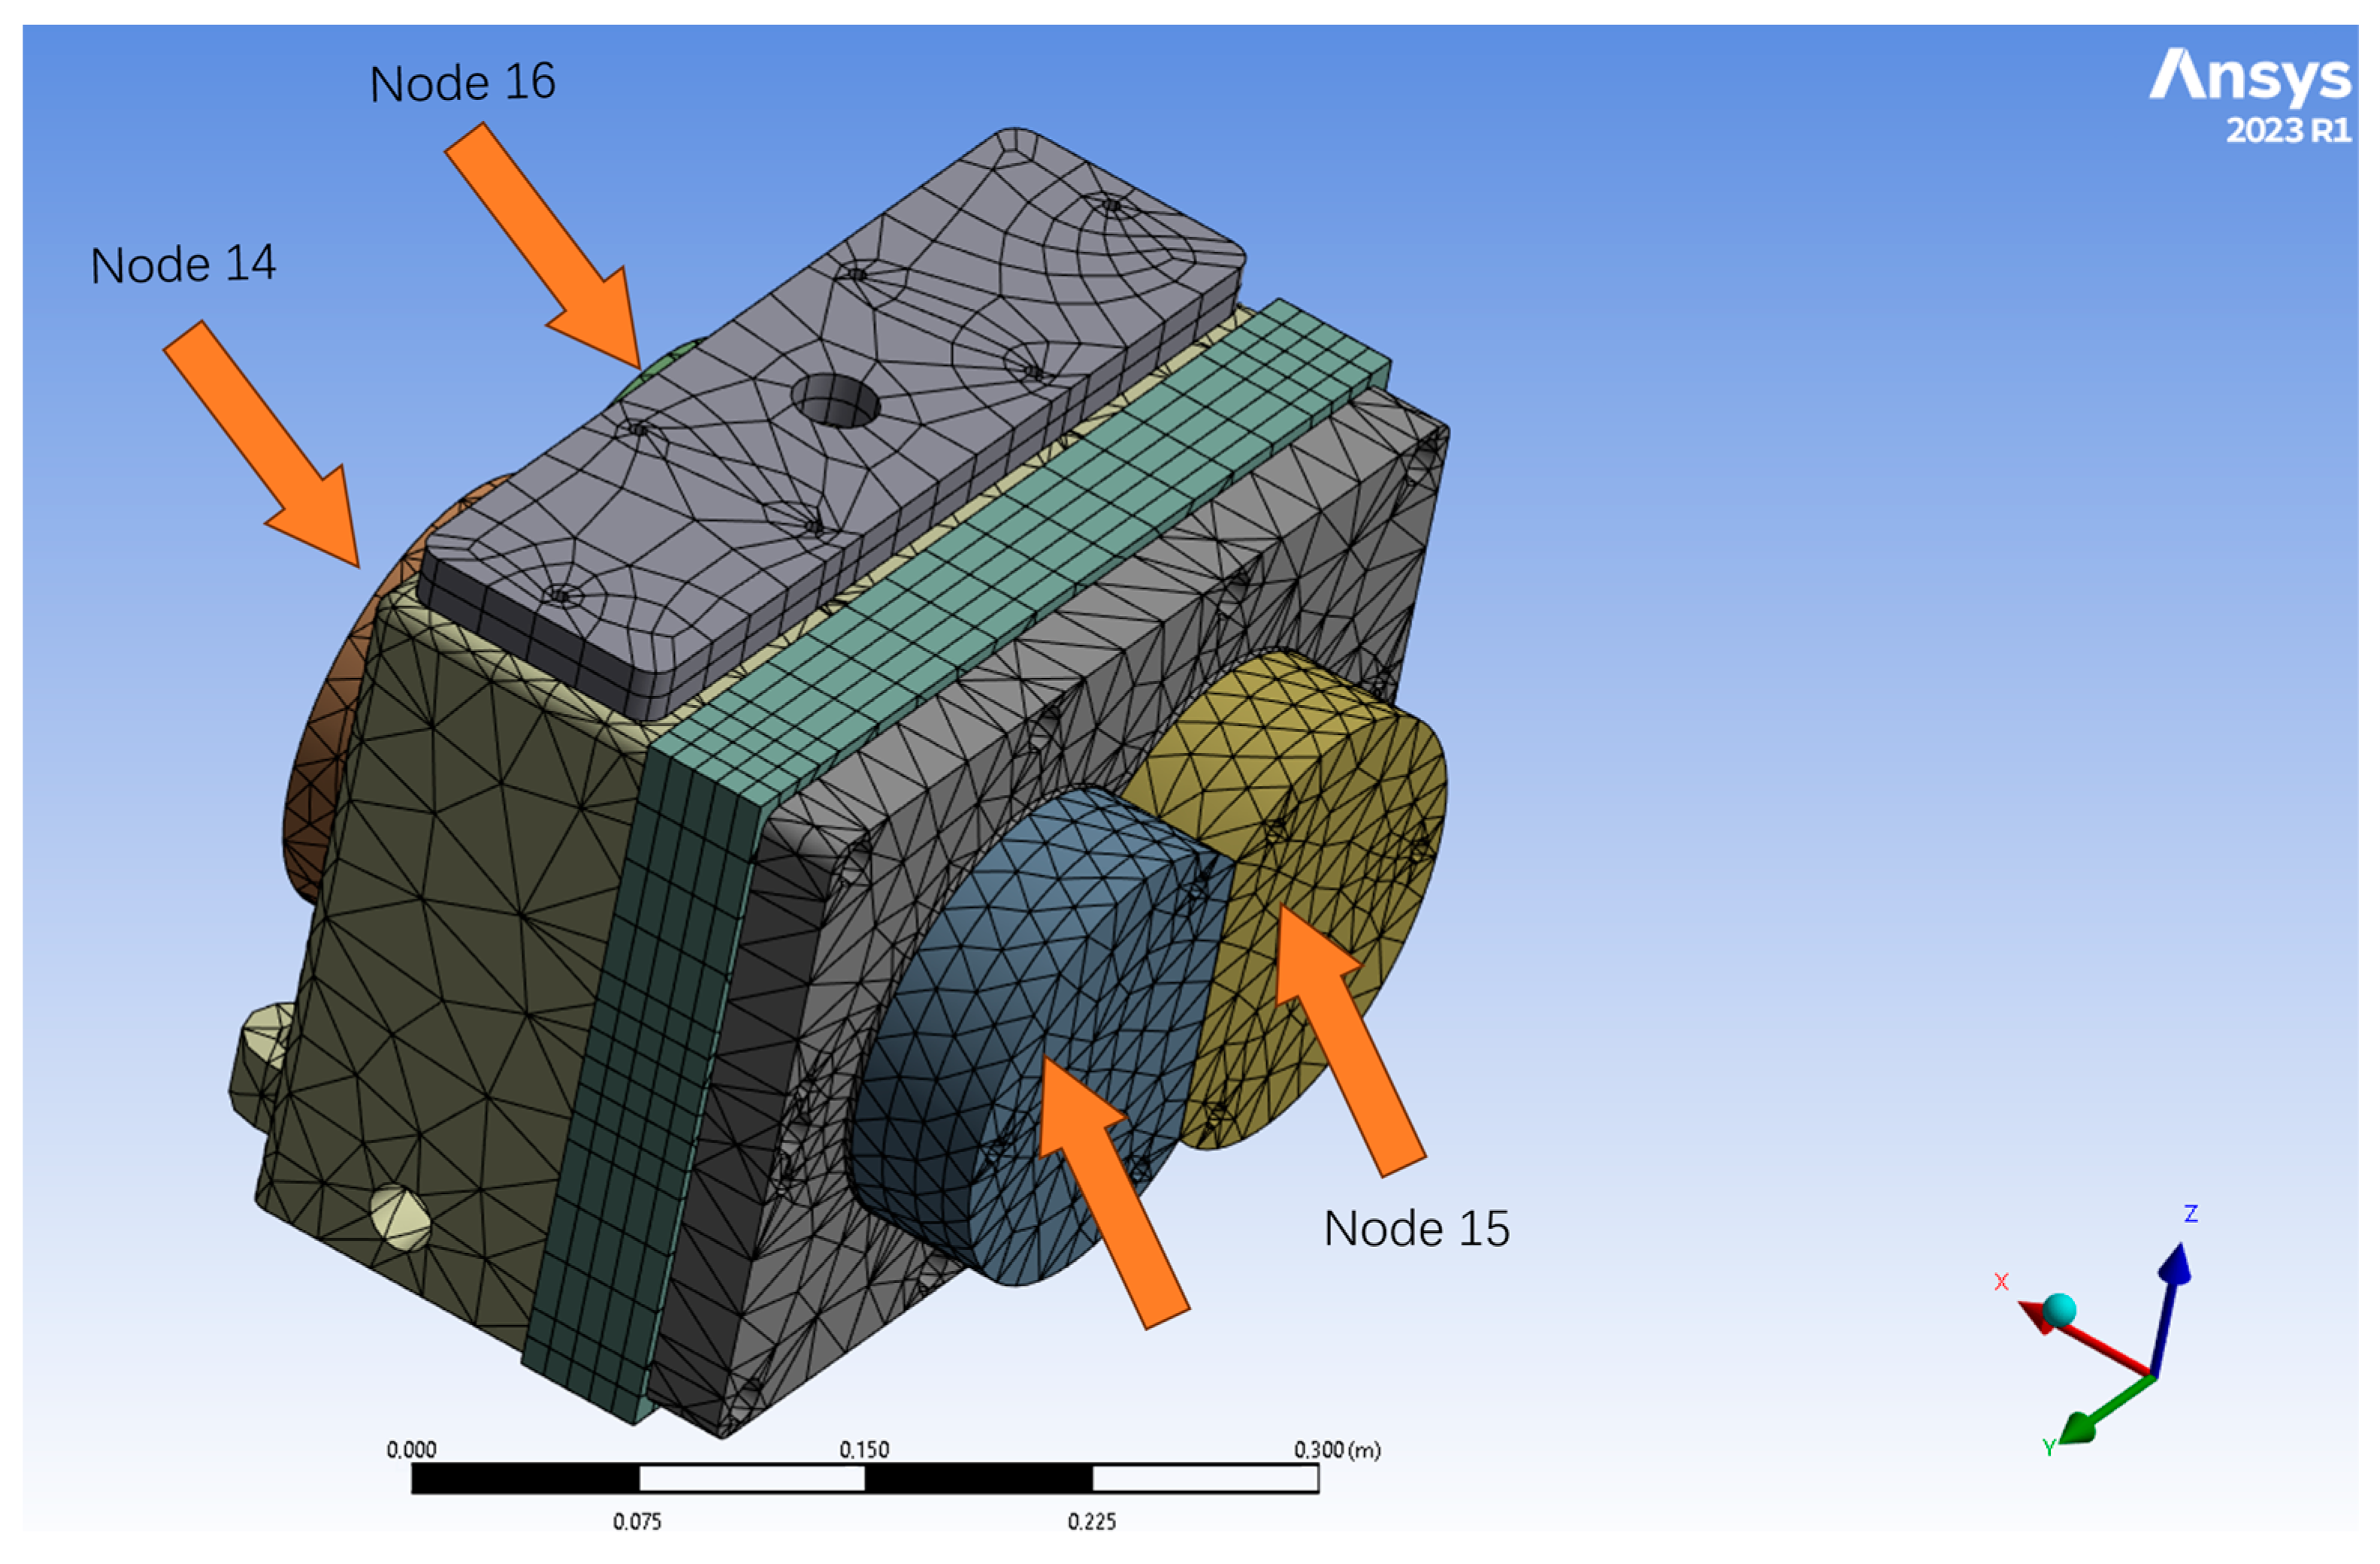
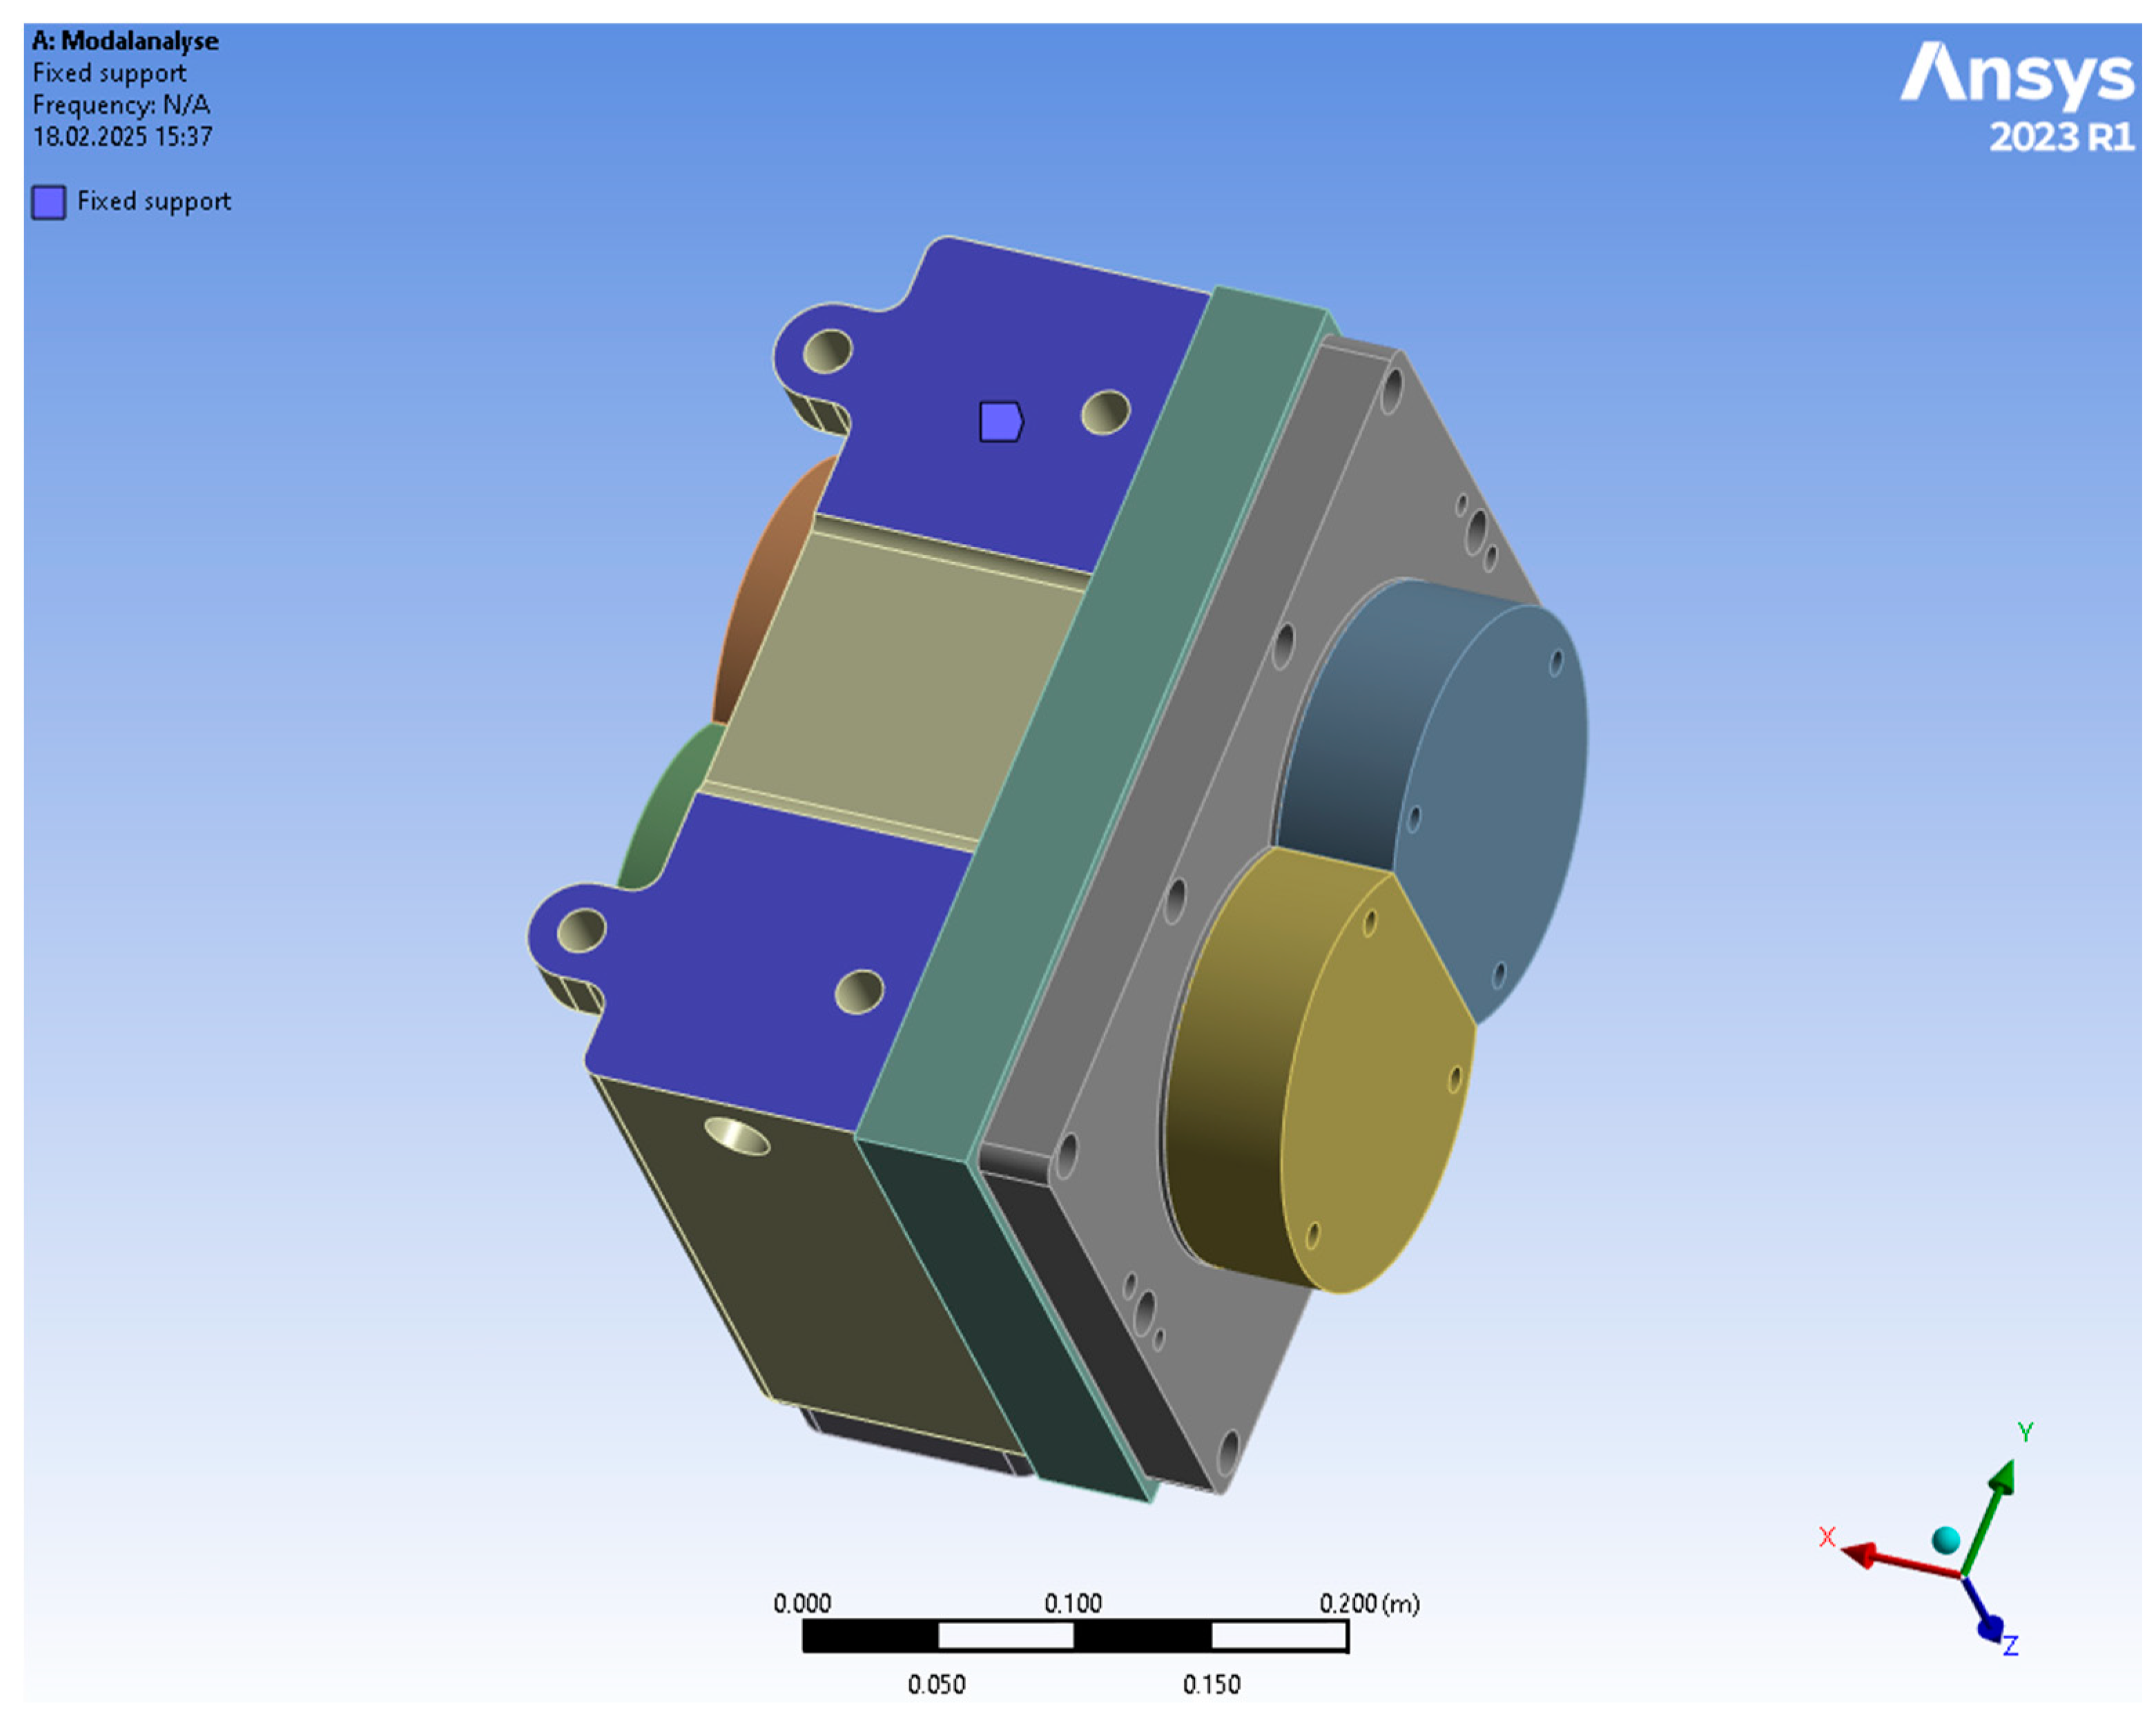
3.4. Housing
3.5. Structure of System Matrices
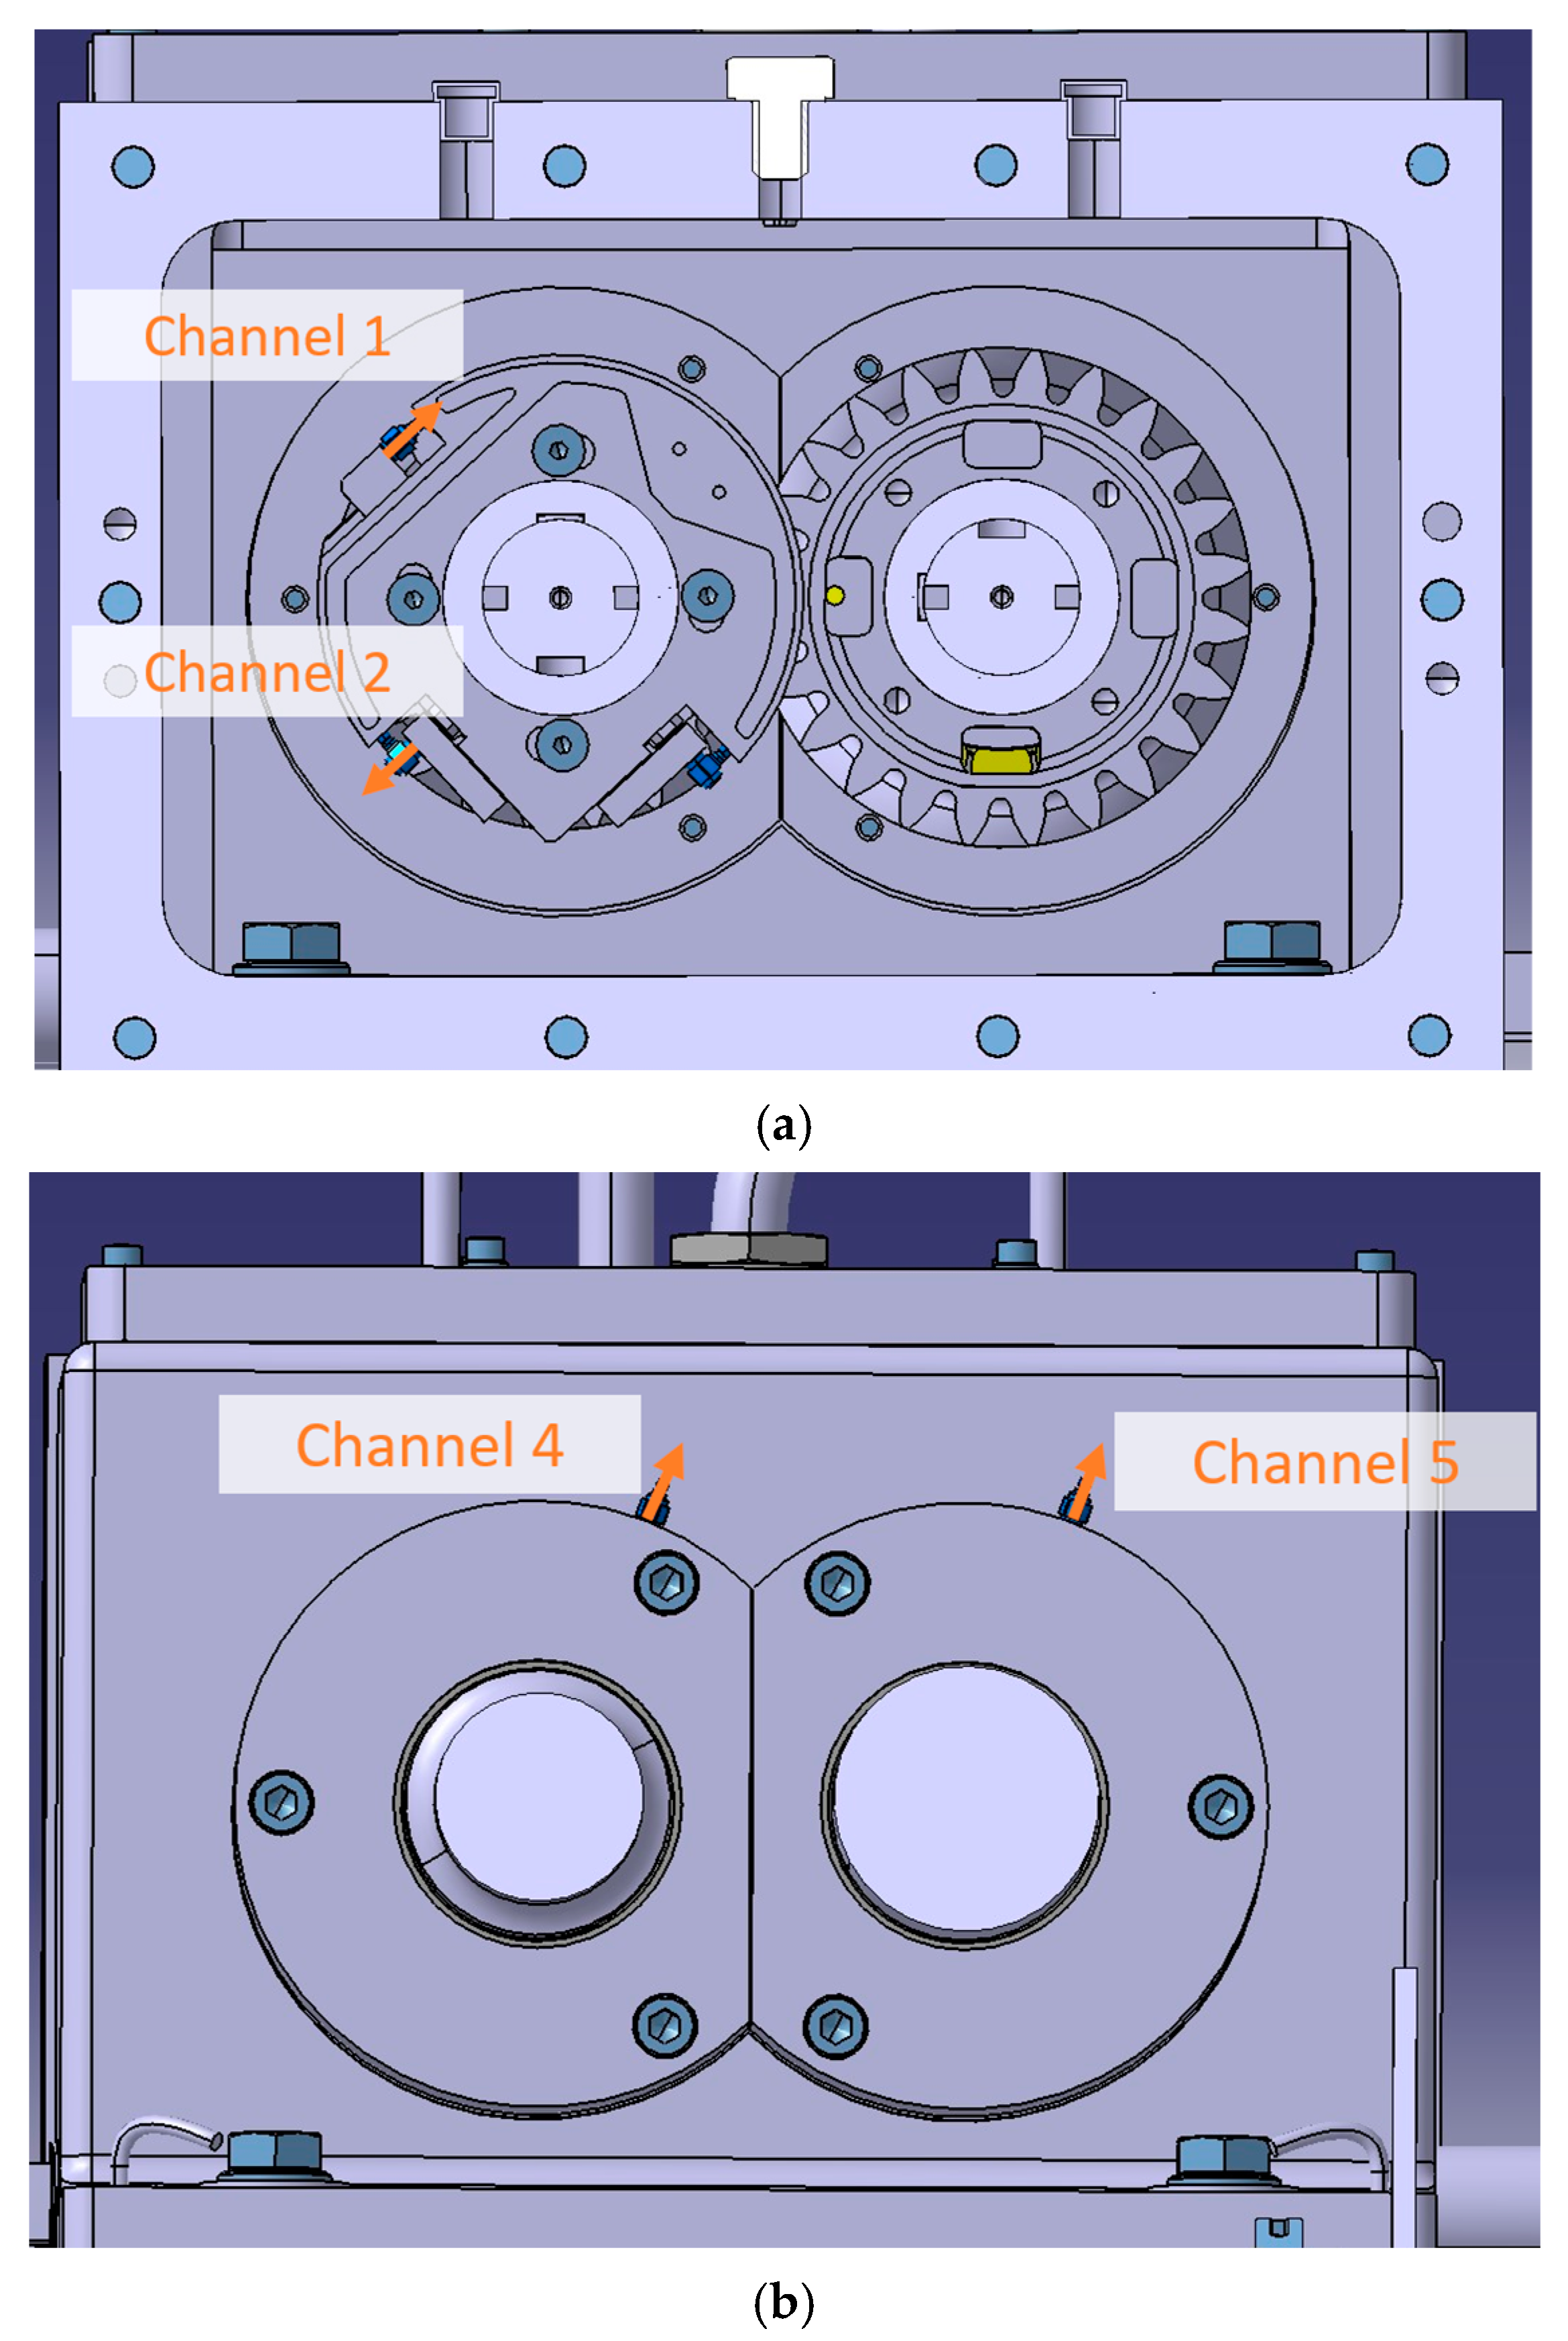
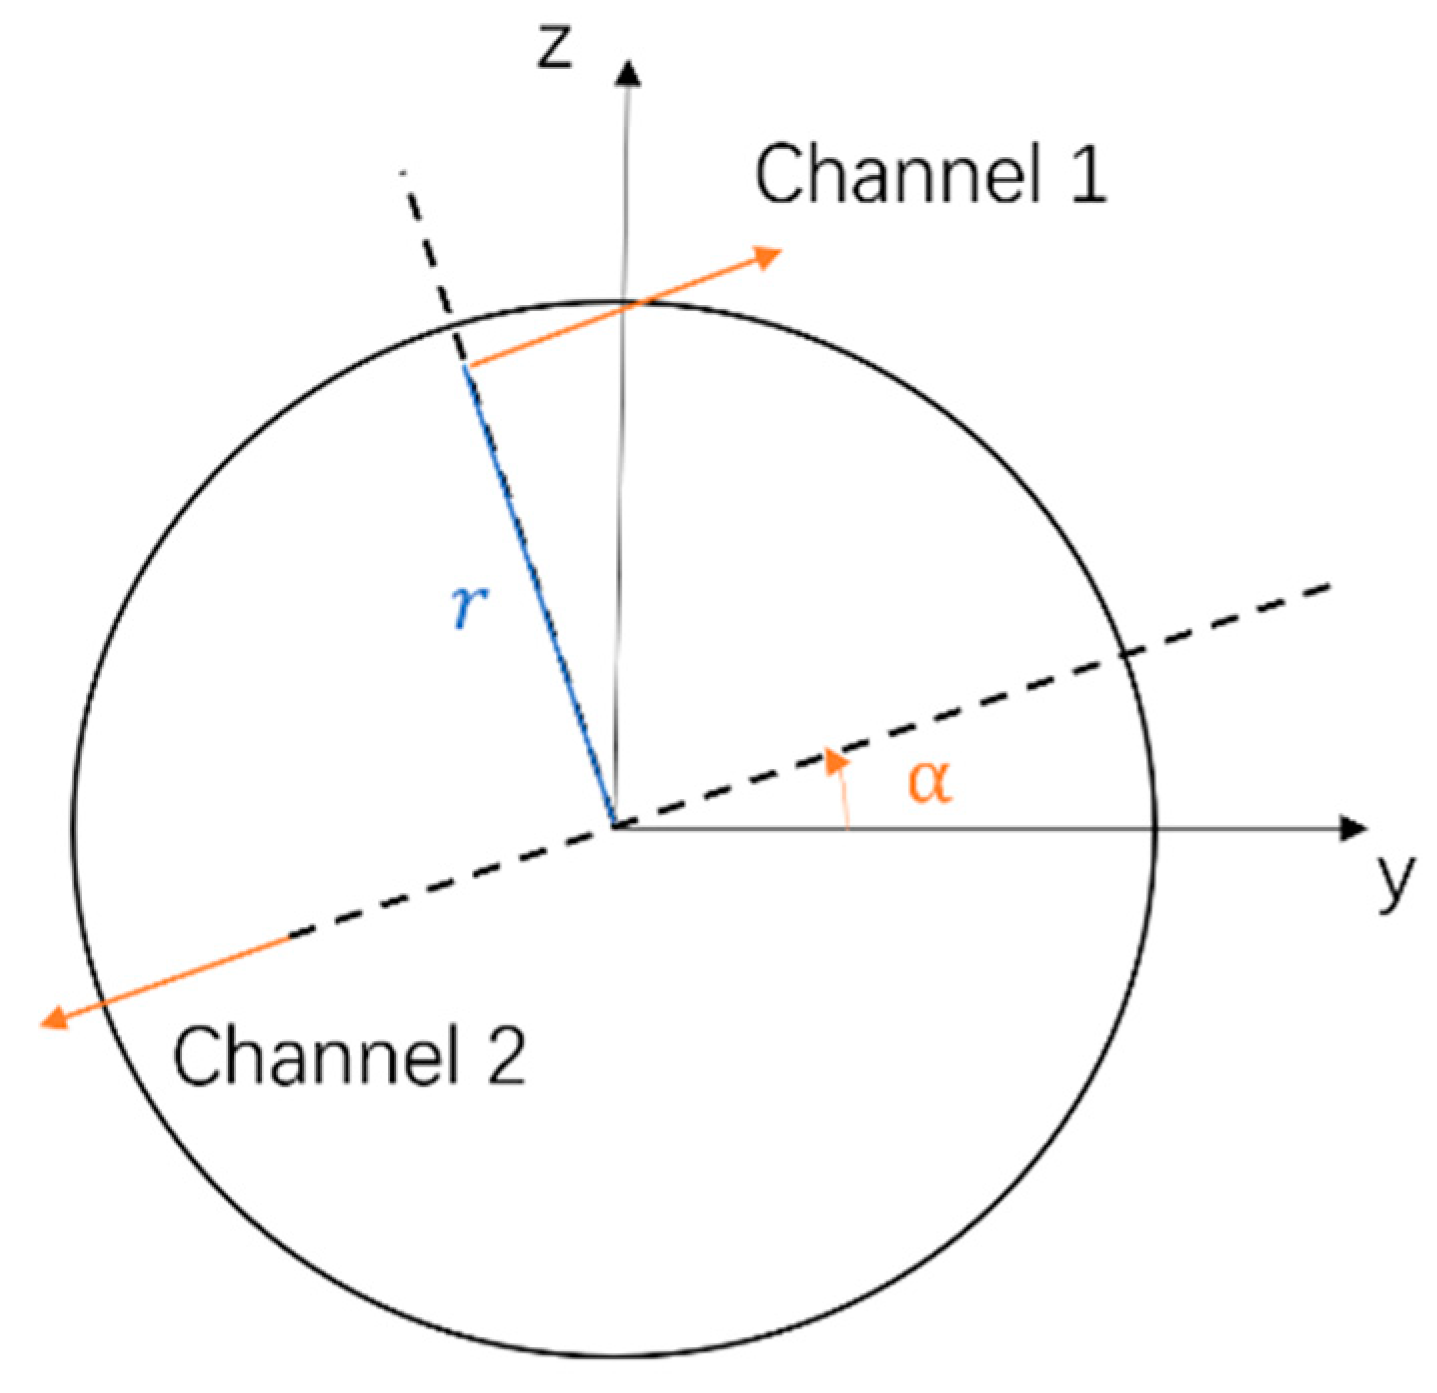
4. Measurement Setup
5. Results and Discussion
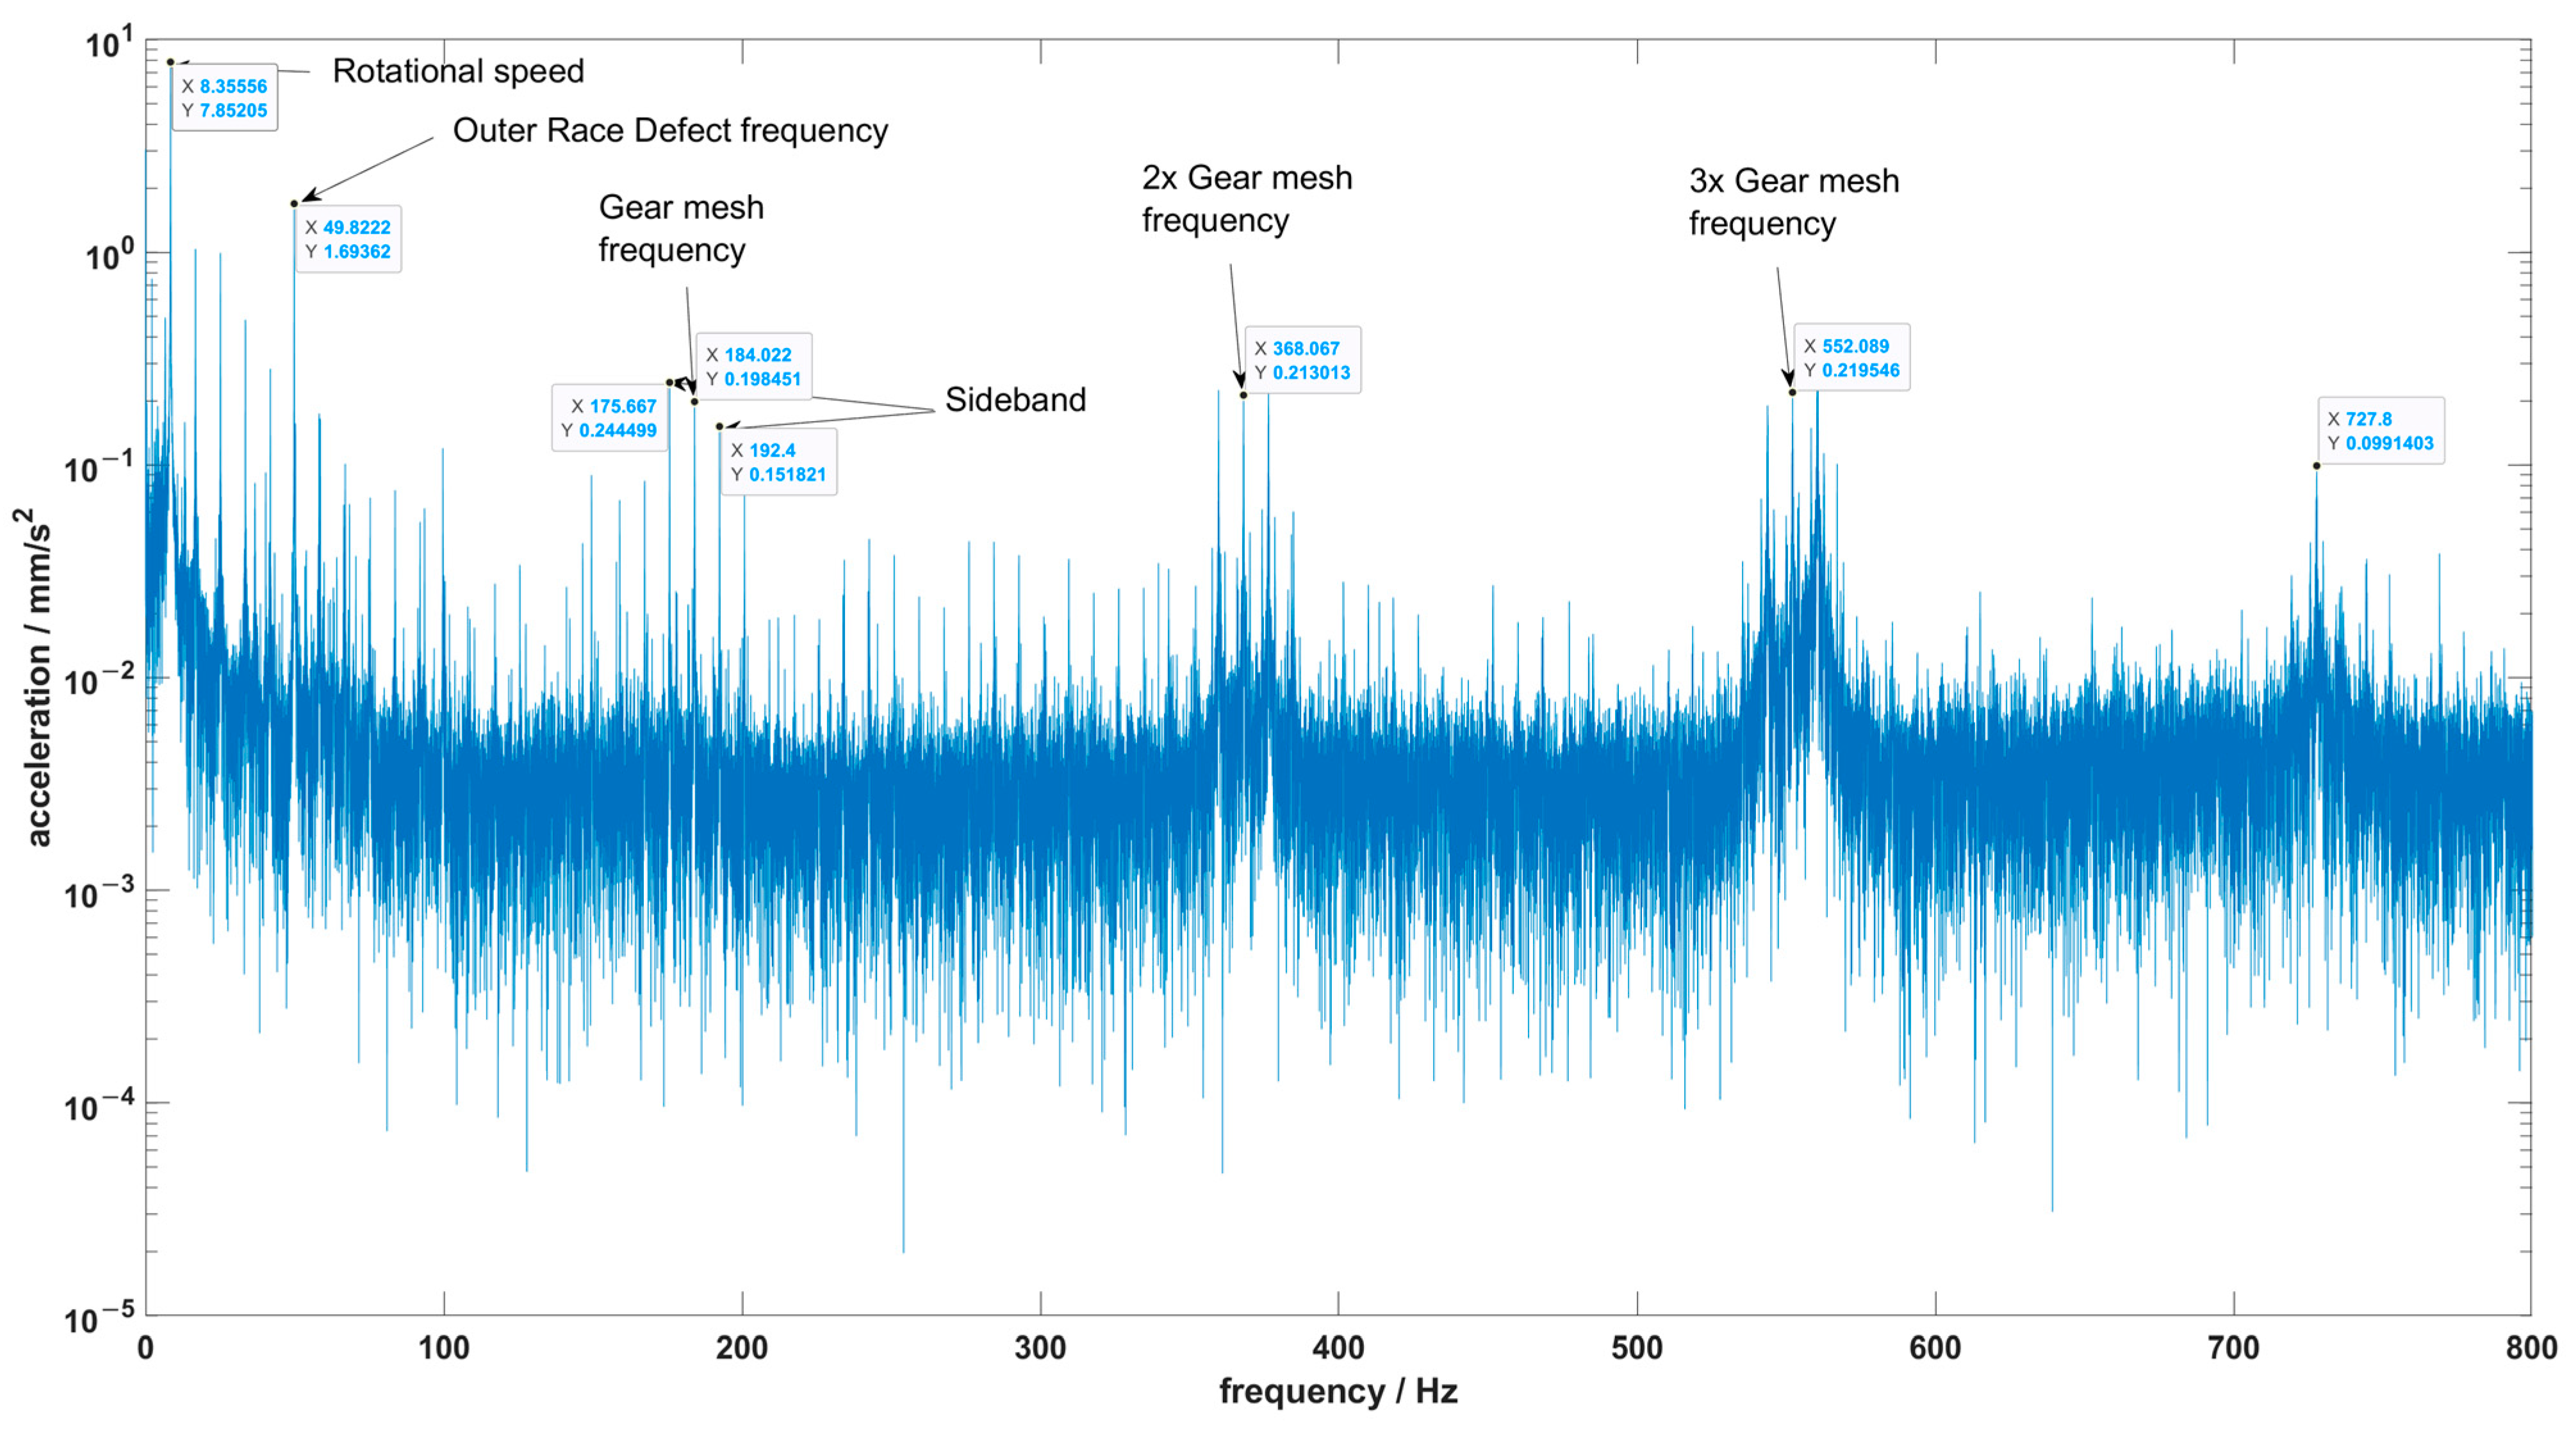
5.1. Experimental Results
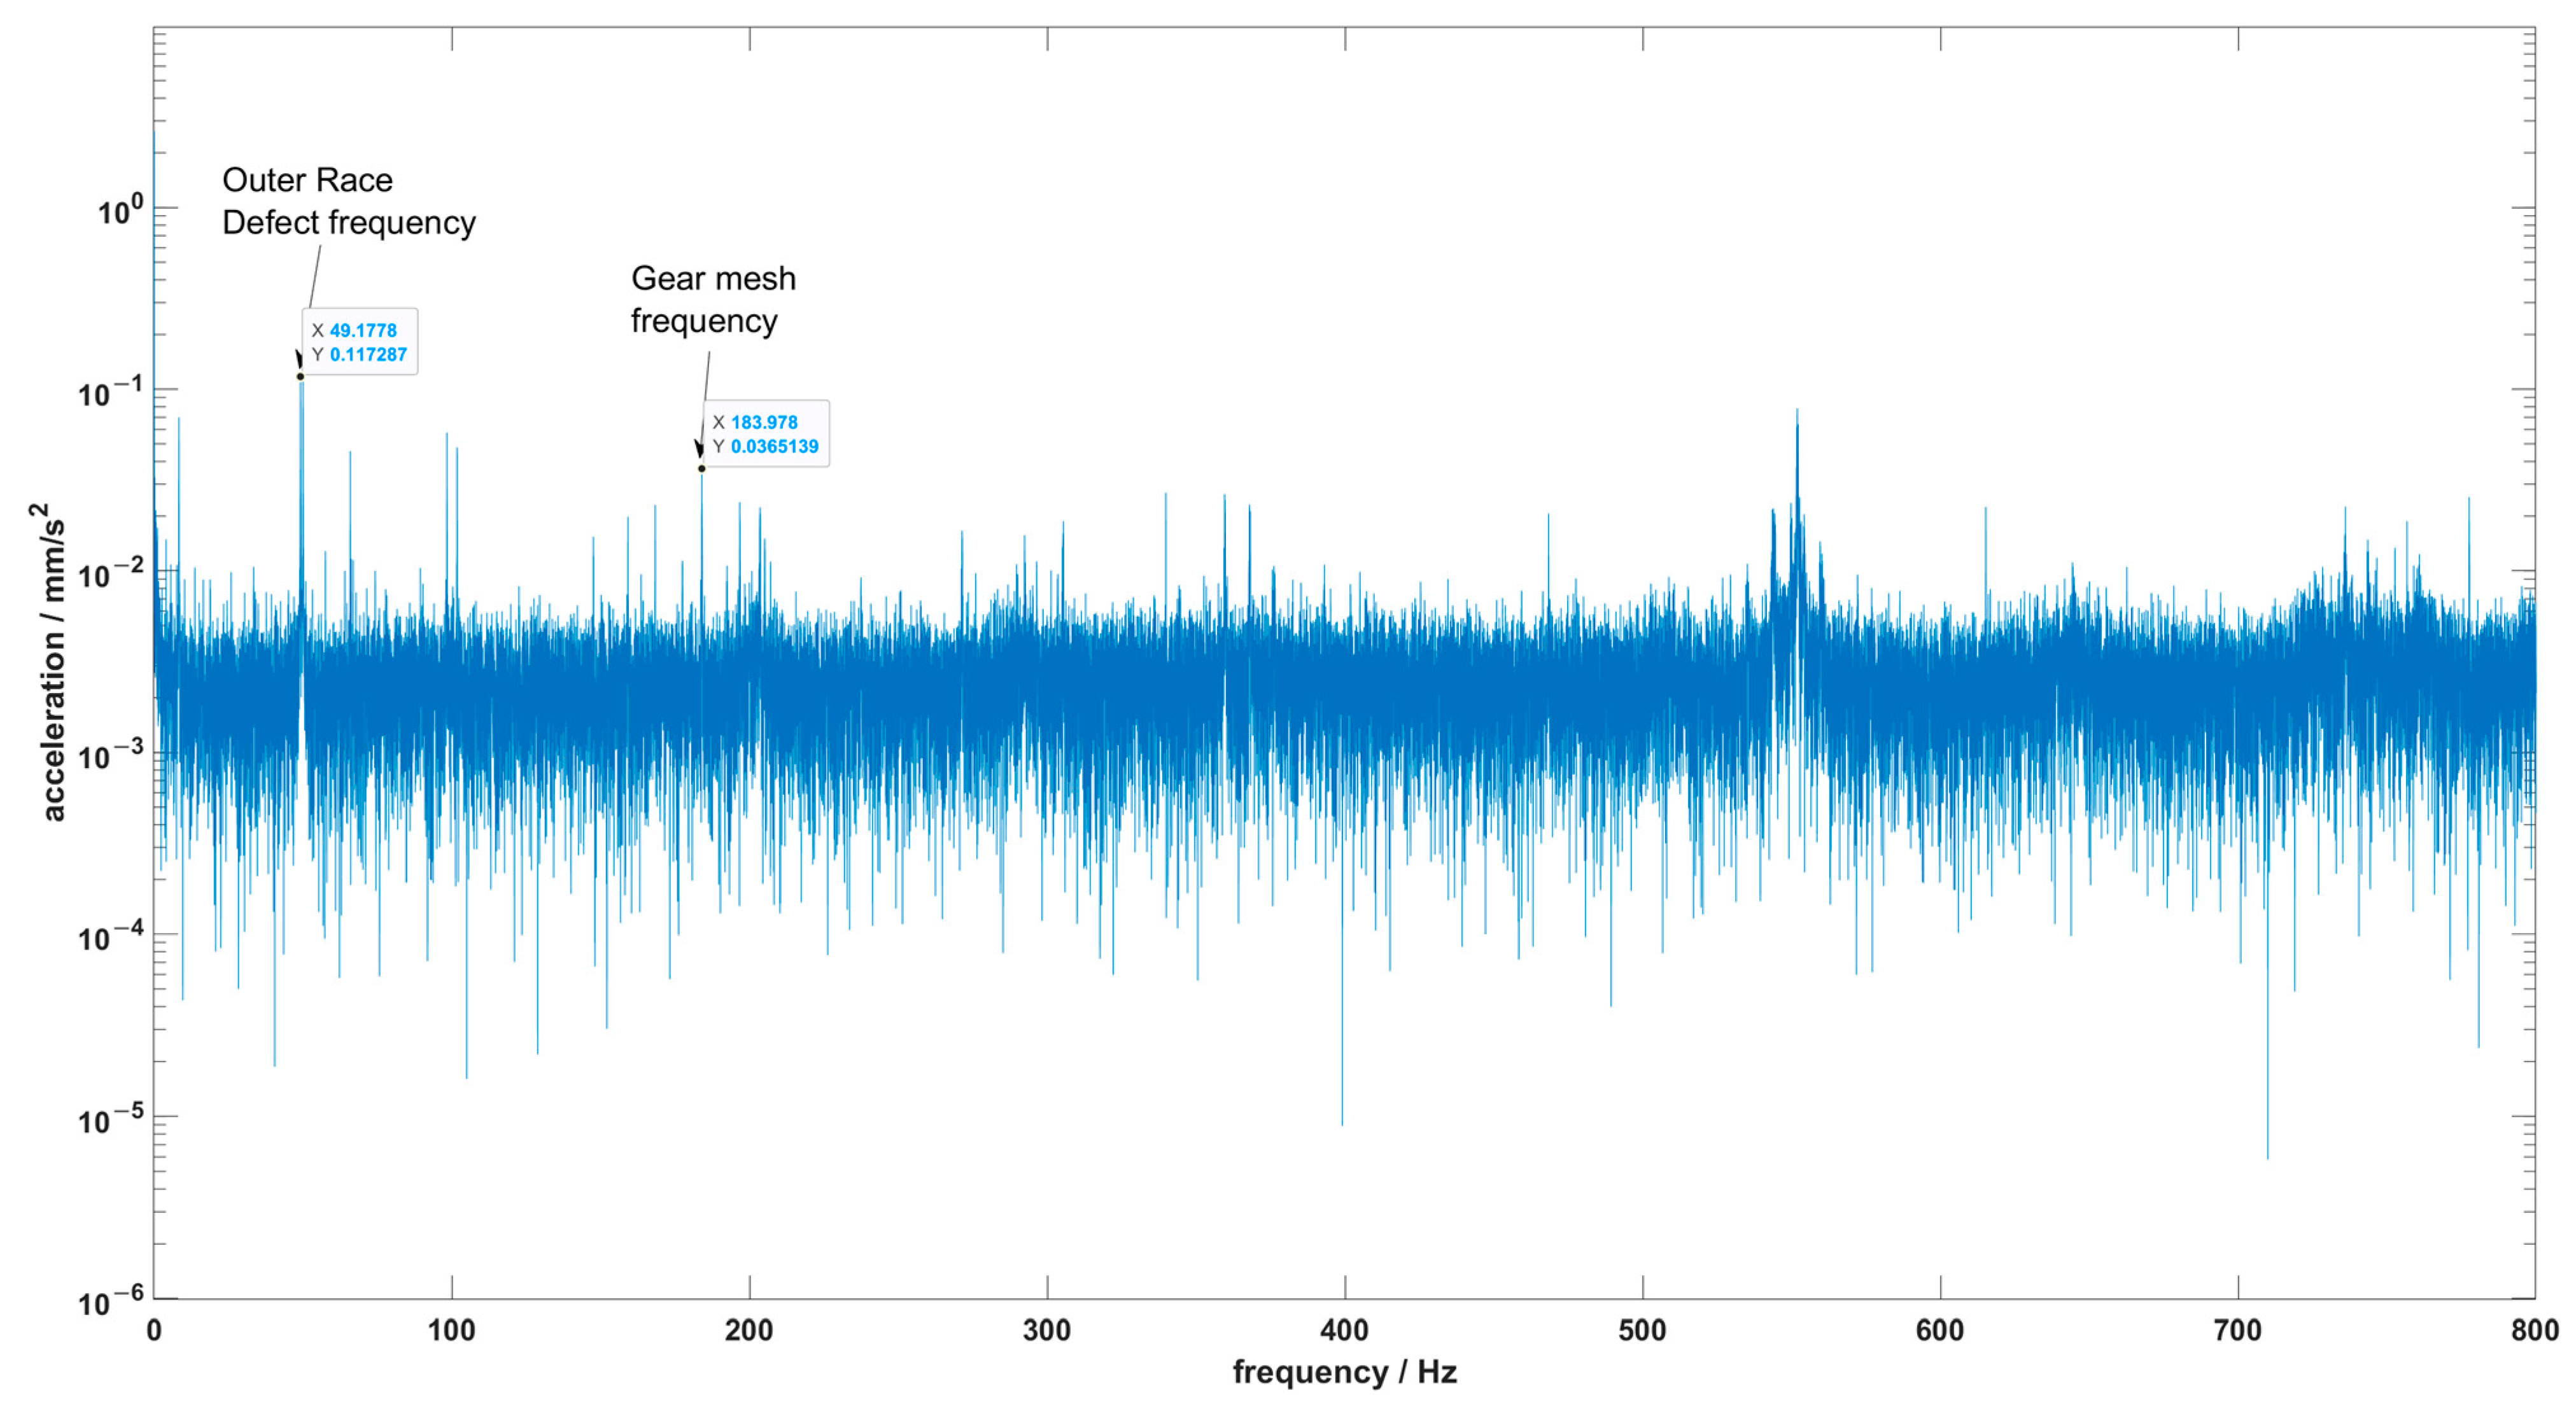
5.2. Simulation Results
6. Conclusions
Author Contributions
Funding
Data Availability Statement
Conflicts of Interest
References
- Ren, Y.; Chang, S.; Liu, G.; Wu, L.; Wang, H. Vibratory Power Flow Analysis of a Gear-Housing-Foundation Coupled System. Shock. Vib. 2018, 2018, 5974759. [Google Scholar] [CrossRef]
- Xiao, H.; Zhou, X.; Liu, J.; Shao, Y. Vibration transmission and energy dissipation through the gear-shaft-bearing-housing system subjected to impulse force on gear. Measurement 2017, 102, 64–79. [Google Scholar] [CrossRef]
- Parker, R.G.; Guo, Y.; Eritenel, T.; Ericson, T.M. Vibration Propagation of Gear Dynamics in a Gear-Bearing-Housing System Using Mathematical Modeling and Finite Element Analysis; National Aeronautics and Space Administration, Glenn Research Center: Cleveland, OH, USA, 2012. [Google Scholar]
- Richards, D.; Pines, D. Passive reduction of gear mesh vibration using a periodic drive shaft. J. Sound Vib. 2003, 264, 317–342. [Google Scholar] [CrossRef]
- Engel, K. Analyse der Köperschalleitung Mit Sensorischen, Optischen und Numerischen Verfahren am Beispiel von Zahnradköpern. Ph.D. Thesis, Technische Universität Clausthal, Clausthal, Germany, 1996. [Google Scholar]
- Lim, T.C.; Singh, R. Vibration transmission through rolling element bearings, part II: System studies. J. Sound Vib. 1990, 139, 201–225. [Google Scholar] [CrossRef]
- Richter, H.P. Theoretische und Experimentelle Untersuchungen zur Körperschallleitung von Wälzlagern in Maschinen. Ph.D. Thesis, Lehrstuhl für Maschinen und Getriebe, Technische Hochschule Darmstadt, Darmstadt, Germany, 1989. [Google Scholar]
- Smith, J.D. Transmission of Smith shocks through rolling bearings. J. Sound Vib. 1995, 181, 1–6. [Google Scholar] [CrossRef]
- Knoll, E.; Rothemund, M.; Otto, M.; Rupprecht, B.; Ochs, M.; Vogel-Heuser, B.; Brederlow, R.; Stahl, K. Evaluation of vibration behavior at different sensing positions on gearboxes. Forsch Ingenieurwes 2024, 88, 29. [Google Scholar] [CrossRef]
- Yu, X.; Huangfu, Y.; Yang, Y.; Du, M.; He, Q.; Peng, Z. Gear fault diagnosis using gear meshing stiffness identified by gearbox housing vibration signals. Front. Mech. Eng. 2022, 17, 57. [Google Scholar] [CrossRef]
- Han, J.; Liu, Y.; Yu, S.; Zhao, S.; Ma, H. Acoustic-vibration analysis of the gear-bearing-housing coupled system. Appl. Acoust. 2021, 178, 108024. [Google Scholar] [CrossRef]
- Tu, W.; Yang, J.; Luo, Y.; Jiang, L.; Xu, J.; Yu, W. Vibration Transmission Characteristics and Measuring Points Analysis of Bearing Housing System. Shock. Vib. 2022, 2022, 4334398. [Google Scholar] [CrossRef]
- Verheij, J. Multi-Path Sound Transfer from Resiliently Mounted Shipboard Machinery: Experimental Methods for Analyzing and Improving Noise Control. Ph.D. Thesis, TU Delft, Delft, The Netherlands, 1982. [Google Scholar]
- El Mahmoudi, A.; Trainotti, F.; Park, K.; Rixen, D.J. In-Situ Source Characterization for NVH Analysis of the Engine-Transmission Unit. In Dynamic Substructures, Volume 4, Proceedings of the 38th IMAC, A Conference and Exposition on Structural Dynamics 2020; Springer: Berlin, Germany, 2020; Volume 4, pp. 79–91. [Google Scholar]
- van der Seijs, M.V.; de Klerk, D.; Rixen, D.J. General framework for transfer path analysis: History, theory and classification of techniques. Mech. Syst. Signal Process. 2016, 68–69, 217–244. [Google Scholar] [CrossRef]
- Kreutz, M.; Trainotti, F.; Gimpl, V.; Rixen, D.J. On the robust experimental multi-degree-of-freedom identification of bolted joints using frequency-based substructuring. Mech. Syst. Signal Process. 2023, 203, 110626. [Google Scholar] [CrossRef]
- Kreutz, M.; Trainotti, F.; Rixen, D.J. On the experimental linear identification of a multiple-joint bolted connection using frequency-based substructuring. In Proceedings of the 31st International Conference on Noise and Vibration Engineering, ISMA 2024 and 10th International Conference on Uncertainty in Structural Dynamics, USD 2024, Leuven, Belgium, 9–11 September 2024; pp. 1096–1109. [Google Scholar]
- Allen, M.S.; Mayes, R.L.; Bergman, E.J. Experimental modal substructuring to couple and uncouple substructures with flexible fixtures and multi-point connections. J. Sound Vib. 2010, 329, 4891–4906. [Google Scholar] [CrossRef]
- Knoll, E.; Rupprecht, B.; Groppo, E.; Otto, M.; Vogel-Heuser, B.; Brederlow, R.; Stahl, K. Modular extension of FZG-gear test rig for in-situ measurement possibilities. In Proceedings of the 29th International Congress on Sound and Vibration, Prague, Czech Republic, 9–13 July 2023. [Google Scholar]
- ISO 14635-1; Gears—FZG Test Procedures: Part 1: FZG Test Method A/8,3/90 for Relative Scuffing Load-Carrying Capacity of Oils. International Organization for Standardization: Berlin, Germany, 2006.
- Hoja, S.; Geitner, M.; Zornek, B.; Hoffmann, F.; Tobie, T.; Stahl, K.; Fechte-Heinen, R. Influence of the Nitrided Layer Structure on the Micro-Pitting and Wear Behavior of Slow-Running Nitrided External Gears. Lubricants 2022, 10, 88. [Google Scholar] [CrossRef]
- Kadach, D. Stillstandsmarkierungen an Zahnrädern und Deren Auswirkungen auf die Flankentragfähigkeit. Ph.D. Thesis, Lehrstuhl für Maschinenelemente, Technische Universität München, München, Germany, 2016. [Google Scholar]
- Knoll, E. Vergleich der Experimentellen Messung und Theoretischen Berechnung des Drehwegfehlers von Stirnradgetrieben: Comparison of Experimental Measurement and Theoretical Calculation of the Transmission Error of Spur Gears. Master‘s Thesis, Lehrstuhl für Maschinenelemente, Technische Universität München, München, Germany, 2021. [Google Scholar]
- Schaeffler Technologies AG & Co. KG, 32310-A: Kegelrollenlager. Available online: https://medias.schaeffler.de/de/p/pdf/383682?timezone=Europe/Berlin&unit=Metric (accessed on 17 November 2023).
- Utakapan, T.; Götz, J. FVA-Nr. 338/VII Erweiterung Dynamisches Zahnkräfte Programm (DZP); Lehrstuhl für Maschinenelemente, Technische Universität München: München, Germany, 2019. [Google Scholar]
- Kohn, B. Entwicklung Einer Systematik zur Dynamischen Gesamtsystemanalyse von Getrieben. Master’s Thesis, Lehrstuhl für Maschinenelemente, Technische Universität München, München, Germany, 2012. [Google Scholar]
- Neubauer, B. Lastverteilung und Anregungsverhalten in Planetengetriebesystemen. Ph.D. Thesis, Lehrstuhl für Maschinenelemente, Technische Universität München, München, Germany, 2016. [Google Scholar]
- Lim, T.C.; Singh, R. Vibration transmission through rolling element bearings, part I: Bearing stiffness formulation. J. Sound Vib. 1990, 139, 179–199. [Google Scholar] [CrossRef]
- Liew, H.; Lim, T.C. Analysis of time-varying rolling element bearing characteristics. J. Sound Vib. 2005, 283, 1163–1179. [Google Scholar] [CrossRef]
- Howard, L. A Review of Rolling Element Bearing Vibration “Detection, Diagnosis and Prognosis”; Defence Science and Technology Organization: Canberra, Australia, 1994. [Google Scholar]
- Schweigert, D.; Weinberger, U.; Otto, M.; Stahl, K. Advanced method of including housing stiffness into calculation of gear systems. Forsch. Im Ingenieurwesen 2022, 86, 241–248. [Google Scholar] [CrossRef]
- Bihr, J.H. Untersuchung des Schwingungsverhaltens von Mehrstufigen Stirnradgetrieben unter Besonderer Berücksichtigung des Welle-Lager-Systems. Ph.D. Thesis, Technische Universität München, Munich, Germany, 2016. [Google Scholar]
- Geiser, H. Grundlagen zur Beurteilung des Schwingungsverhaltens von Stirnrädern. Ph.D. Thesis, Technische Universität München, Munich, Germany, 2002. [Google Scholar]
- Magtrol VIBRO-METER SA. Instruction Manual: Mercury Slip-Ringless Transmitter 4-MTA/T. Available online: https://www.magtrol.com/wp-content/uploads/mt4manual.pdf&ved=2ahUKEwi0w5CN1-OJAxUhxAIHHdOYE9AQFnoECA8QAQ&usg=AOvVaw11zsBXOg6Sc1cqUIQnVrGe (accessed on 20 January 2025).
- Hottinger Brüel & Kjær A/S. NEXUS CCLD Signal Conditioner: TYPE 2693-A. Available online: https://www.bksv.com/en/transducers/signal-conditioning/ccld/2693-a-0f4 (accessed on 19 February 2024).
- National Instruments Corporation, BNC-2090A: Anschlussblock. Available online: https://www.ni.com/de-de/support/model.bnc-2090a.html (accessed on 19 February 2024).
- National Instruments Corporation. PXI-8110: PXI-Controller. Available online: https://www.ni.com/de-de/support/model.pxi-8110.html (accessed on 19 February 2024).
- Hottinger Brüel & Kjær A/S. Product Data: Piezoelectric Accelerometer Miniature DeltaTron® Accelerometers—Types 4518, 4518-001, 4518-002 and 4518-003. Available online: https://www.bksv.com/-/media/literature/Product-Data/bp2070.ashx (accessed on 17 November 2023).
- Hottinger Brüel & Kjær A/S. Product Data: Piezoelectric Accelerometer Miniature DeltaTron® Accelerometers—Types 4519, 4519-001, 4519-002 and 4519-003. Available online: https://www.bksv.com/-/media/literature/Product-Data/bp2071.ashx (accessed on 17 November 2023).
- Götz, J.; Weinberger, U.; Siglmüller, F.; Otto, M.; Stahl, K. Experimental and theoretical assessment methods of mesh excitation in mechanical drive trains. In Proceedings of the 27th International Congress on Sound and Vibration, Online, 11–16 July 2021. [Google Scholar]
- Roder, H. Amplitude, Phase, and Frequency Modulation. Proc. Inst. Radio Eng. 1931, 19, 2145–2176. [Google Scholar] [CrossRef]


| Gear Parameter | Symbol | Unit | 112.5 Helical Gear Set |
|---|---|---|---|
| Center distance | a | mm | 112.5 |
| Number of teeth (pinion/wheel) | z1/z2 | - | 22/24 |
| Normal module | mn | mm | 4.25 |
| Transverse module | mt | mm | 4.86 |
| Normal pressure angle | αn | In ° | 20 |
| Helix angle | β | In ° | 29 |
| Profile shift coefficient (pinion/wheel) | x1/x2 | - | 0.100/0.077 |
| Pitch diameter (pinion/wheel) | d1/d2 | mm | 106.90/116.62 |
| Tip diameter (pinion/wheel) | da1/da2 | mm | 117.70/127.30 |
| Transverse contact ratio | εα | - | 1.5 |
| Overlap ratio | εβ | - | 1.0 |
| Face width | b | mm | 27.6 |
| Bearing Element | Frequency Equations |
|---|---|
| Inner Race Defect Frequency | |
| Outer Race Defect Frequency | |
| Cage Rotational Frequency | |
| Ball or Roller Spin Frequency |
| 500 rpm | 1000 rpm | 1500 rpm | 2000 rpm | 2500 rpm | 3000 rpm | |
|---|---|---|---|---|---|---|
| Channel 1 | 132 | 707 | 176 | 159 | 53 | 93 |
| Channel 2 | 7 | 87 | 42 | 47 | 24 | 52 |
| Signal after post-processing | 89 | 583 | 147 | 134 | 32 | 31 |
| Channel 4 | 7 | 156 | 128 | 190 | 43 | 170 |
| Channel 5 | 16 | 183 | 158 | 236 | 154 | 369 |
| Amplitude at Gear Mesh Frequency at Node 3 | Amplitude at Gear Mesh Frequency at Node 6 | Amplitude at Gear Mesh Frequency at Node 14 | |
|---|---|---|---|
| 500 rpm | |||
| 1000 rpm | |||
| 1500 rpm | |||
| 2000 rpm |
Disclaimer/Publisher’s Note: The statements, opinions and data contained in all publications are solely those of the individual author(s) and contributor(s) and not of MDPI and/or the editor(s). MDPI and/or the editor(s) disclaim responsibility for any injury to people or property resulting from any ideas, methods, instructions or products referred to in the content. |
© 2025 by the authors. Licensee MDPI, Basel, Switzerland. This article is an open access article distributed under the terms and conditions of the Creative Commons Attribution (CC BY) license (https://creativecommons.org/licenses/by/4.0/).
Share and Cite
Knoll, E.; Chen, C.; Otto, M.; Stahl, K. Simulative and Experimental Investigation of Vibration Transfer Path at Gearboxes. Appl. Sci. 2025, 15, 3109. https://doi.org/10.3390/app15063109
Knoll E, Chen C, Otto M, Stahl K. Simulative and Experimental Investigation of Vibration Transfer Path at Gearboxes. Applied Sciences. 2025; 15(6):3109. https://doi.org/10.3390/app15063109
Chicago/Turabian StyleKnoll, Erich, Chaokai Chen, Michael Otto, and Karsten Stahl. 2025. "Simulative and Experimental Investigation of Vibration Transfer Path at Gearboxes" Applied Sciences 15, no. 6: 3109. https://doi.org/10.3390/app15063109
APA StyleKnoll, E., Chen, C., Otto, M., & Stahl, K. (2025). Simulative and Experimental Investigation of Vibration Transfer Path at Gearboxes. Applied Sciences, 15(6), 3109. https://doi.org/10.3390/app15063109